Article

An Experimental Study on Mechanical Modeling of Ceramics Based on Microstructure

Laboratory of Advanced Ceramics and Machining Technique, Ministry of Education Tianjin University, Building 10, NO. 92, Weijin Road, Nankai District, Tianjin 300072, China
*
Author to whom correspondence should be addressed.
Appl. Sci. 2015, 5(4), 1337-1349; https://doi.org/10.3390/app5041337
Submission received: 22 September 2015 / Revised: 6 November 2015 / Accepted: 11 November 2015 / Published: 23 November 2015

Abstract

:
The actual grinding result of ceramics has not been well predicted by the present mechanical models. No allowance is made for direct effects of materials microstructure and almost all the mechanical models were obtained based on crystalline ceramics. In order to improve the mechanical models of ceramics, surface grinding experiments on crystalline ceramics and non-crystalline ceramics were conducted in this research. The normal and tangential grinding forces were measured to calculate single grit force and specific grinding energy. Grinding surfaces were observed. For crystalline alumina ceramics, the predictive modeling of normal force per grit fits well with the experimental result, when the maximum undeformed chip thickness is less than a critical depth, which turns out to be close to the grain size of alumina. Meanwhile, there is a negative correlation between the specific grinding energy and the maximum undeformed chip thickness. With the decreasing maximum undeformed chip thickness, the proportions of ductile removal and transgranular fracture increase. However, the grinding force models are not applicable for non-crystalline ceramic fused silica and the specific grinding energy fluctuates irregularly as a function of maximum undeformed chip thickness seen from the experiment.

1. Introduction

Because of their the superior mechanical and thermal properties, advanced ceramics have found increasing applications in aerospace industry, military industry, vehicle engineering and so on. However, there is no effective grinding modeling to predict evaluating parameters, which adds difficulties for machining.
Previous studies have created many predictive models. Werner [1] built a mathematical model of grinding force per unit grinding width, based on geometric distribution of wheel grit and kinematics of grinding process. Malkin [2] held the view that grinding force can be divided into cutting force and friction force. He set up a relation between grinding forces and wear flat of abrasive grain. Several scratching experiments were conducted by Xu et al. [3,4,5]. The results showed that Removal rate was proportional to grain size l1/2 and load p2. Grinding force and surface roughness models were created. Li et al. [6] optimized the mathematical model of grinding force per unit width. Li et al. [7] established a calculated formula for grinding force per grit and pointed out that grinding force showed an exponential relationship with wear debris area. Hecker et al. derived a predictive grinding force per grit equation based on the relation between the abrasive indentation model and hardness [8]. Wang et al. [9] built the grinding force modeling per grit based on undeformed chip thickness. Agarwal et al. [10,11] improved the grinding force and power model by a new analytical undeformed chip thickness, considering the wheel-workpiece contact zone, microscopic contact at the grain level and geometry of depth of cut. Xie et al. [12] proposed that the grinding force was greatly influenced by mechanism removal. As for it, different grinding force models were established under ductile removal and brittle removal conditions. Seen from the previous models, geometric models and material properties such as hardness, fracture toughness, strength and so on are considered in order to derive predictive force models. However, the result of predictive modeling is far from the experimental result. No allowance is made for direct effects of materials microstructure such as grain, porosity, binding energy, etc. Almost all the mechanical models were obtained based on crystalline ceramics. The applicability of mechanical models to non-crystalline ceramics has not been identified.
Grain size as an important factor of microstructure in affecting the materials has been studied in many aspects. Many indentations and scratch experiments of alumina were conducted on removal mechanism, material removal volume, damage, and so on as a function of grain size [5,13,14]. Large studies indicate that the fracture strength of crystalline grains is bigger than grain boundary. They found that the mechanism of material removal in alumina is identified as intergranular fracture and grain dislodgement resulting from grain boundary microcracking irrespective of the grain size. Material removal volume and extent of lateral cracking were proved to be increasing with the grain size [5,14]. But the conclusions were obtained under large cutting depth conditions and the influences of grain size and depth of cut on grinding force were not investigated.
This work dedicates to talk about influences of the relation between grain size and maximum undeformed chip-thickness on grinding force modeling and removal mechanisms of crystalline ceramics and non-crystalline ceramics. In this study, a grinding experiment on alumina ceramics and fused silica as representatives of the two kind ceramics was conducted. Therefore, the grinding force modeling can be improved by considering both the grinding parameters and materials microstructure.

2. Experiment Details

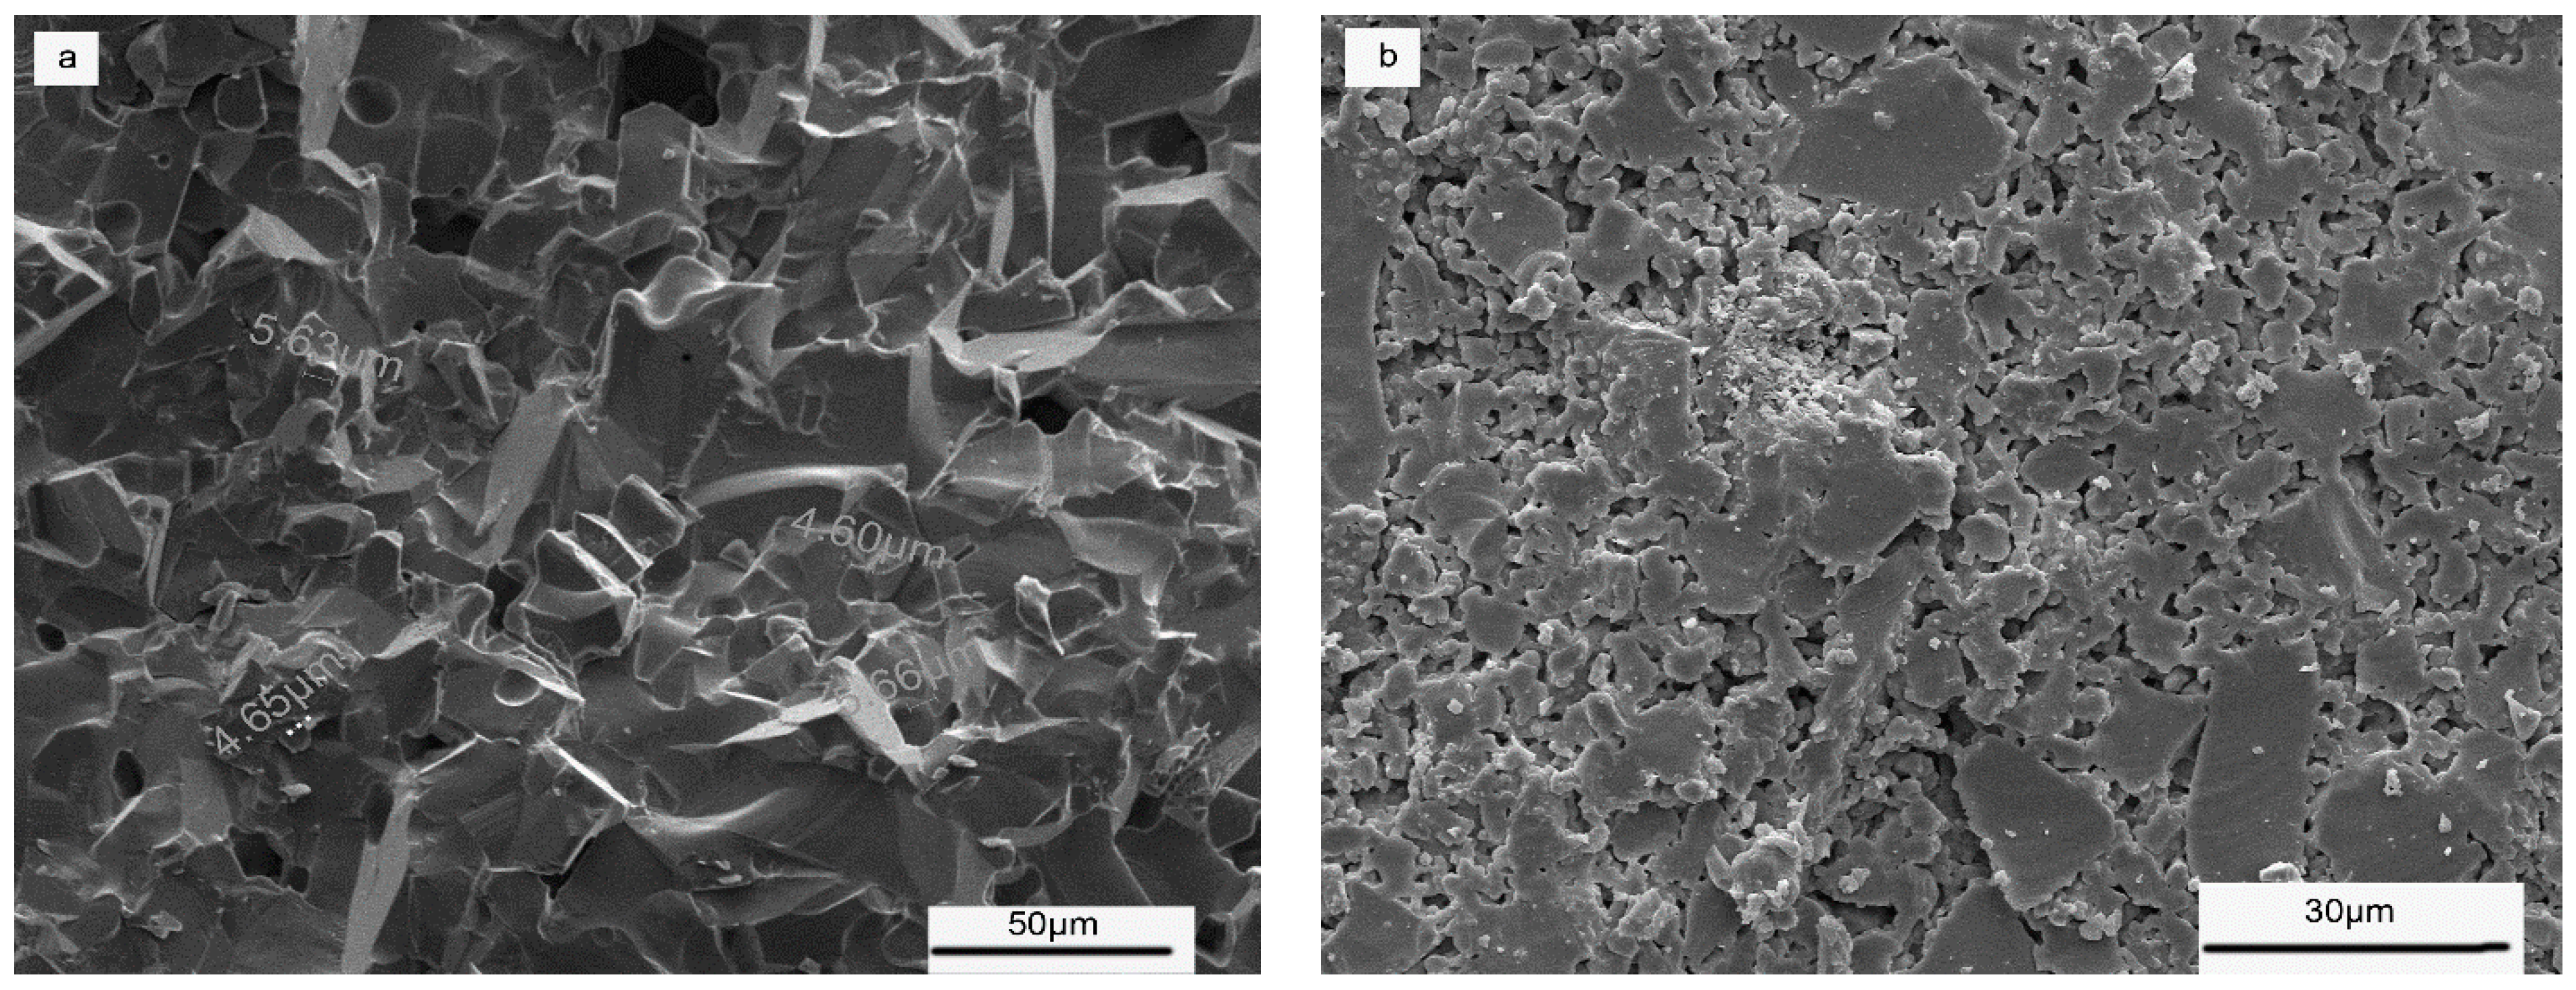
2.1. Properties of Workpieces

As examples of crystalline ceramics and non-crystalline ceramics, alumina ceramics and fused silica ceramics were used in this investigation. In order to get the microstructures and grain size of the materials, the fracture surfaces were examined by scanning-electron microscopy, as shown in Figure 1. The specimens were processed into the shape of cuboid with a size of 20 × 20 × 10 mm3 by grinding. Nine workpieces of each material were used.
Figure 1. Micrographs of the two ceramics: (a) Microstructure of alumina and (b) microstructure of fused silica.
Applsci 05 01337 g001
As seen in Figure 1a, the grain size is approximately 4 to 6 μm and the material has compact structure and less pores. Figure 1b shows that there are many pores and no crystals in fused silica. The density and porosity were obtained by Archimedes method. The hardness and fracture toughness were tested by indentation method. HXD-1000 Vickers hardness tester was conducted to estimate the hardness and toughness. The specimen surface was progressively polished by abrasive paper before tested. Five indentations were made on the polished surfaces to obtain average value. Macro-Vickers hardness was determined with an applied load of 1000 gf. Palmqvist cracks were observed to obtain fracture toughness [15]. Properties of specimen materials are shown in Table 1.
Table 1. Properties of Al2O3 ceramics and fused silica ceramics.
WorkpieceDensity/g·cm−3PorosityHardness/GPaToughness/MPa·m0.5Flexural Strength/MPa
Alumina3.609.8%19.383.5500 [16]
Fused Silica 2.1117.58%7.310.4850 [17]

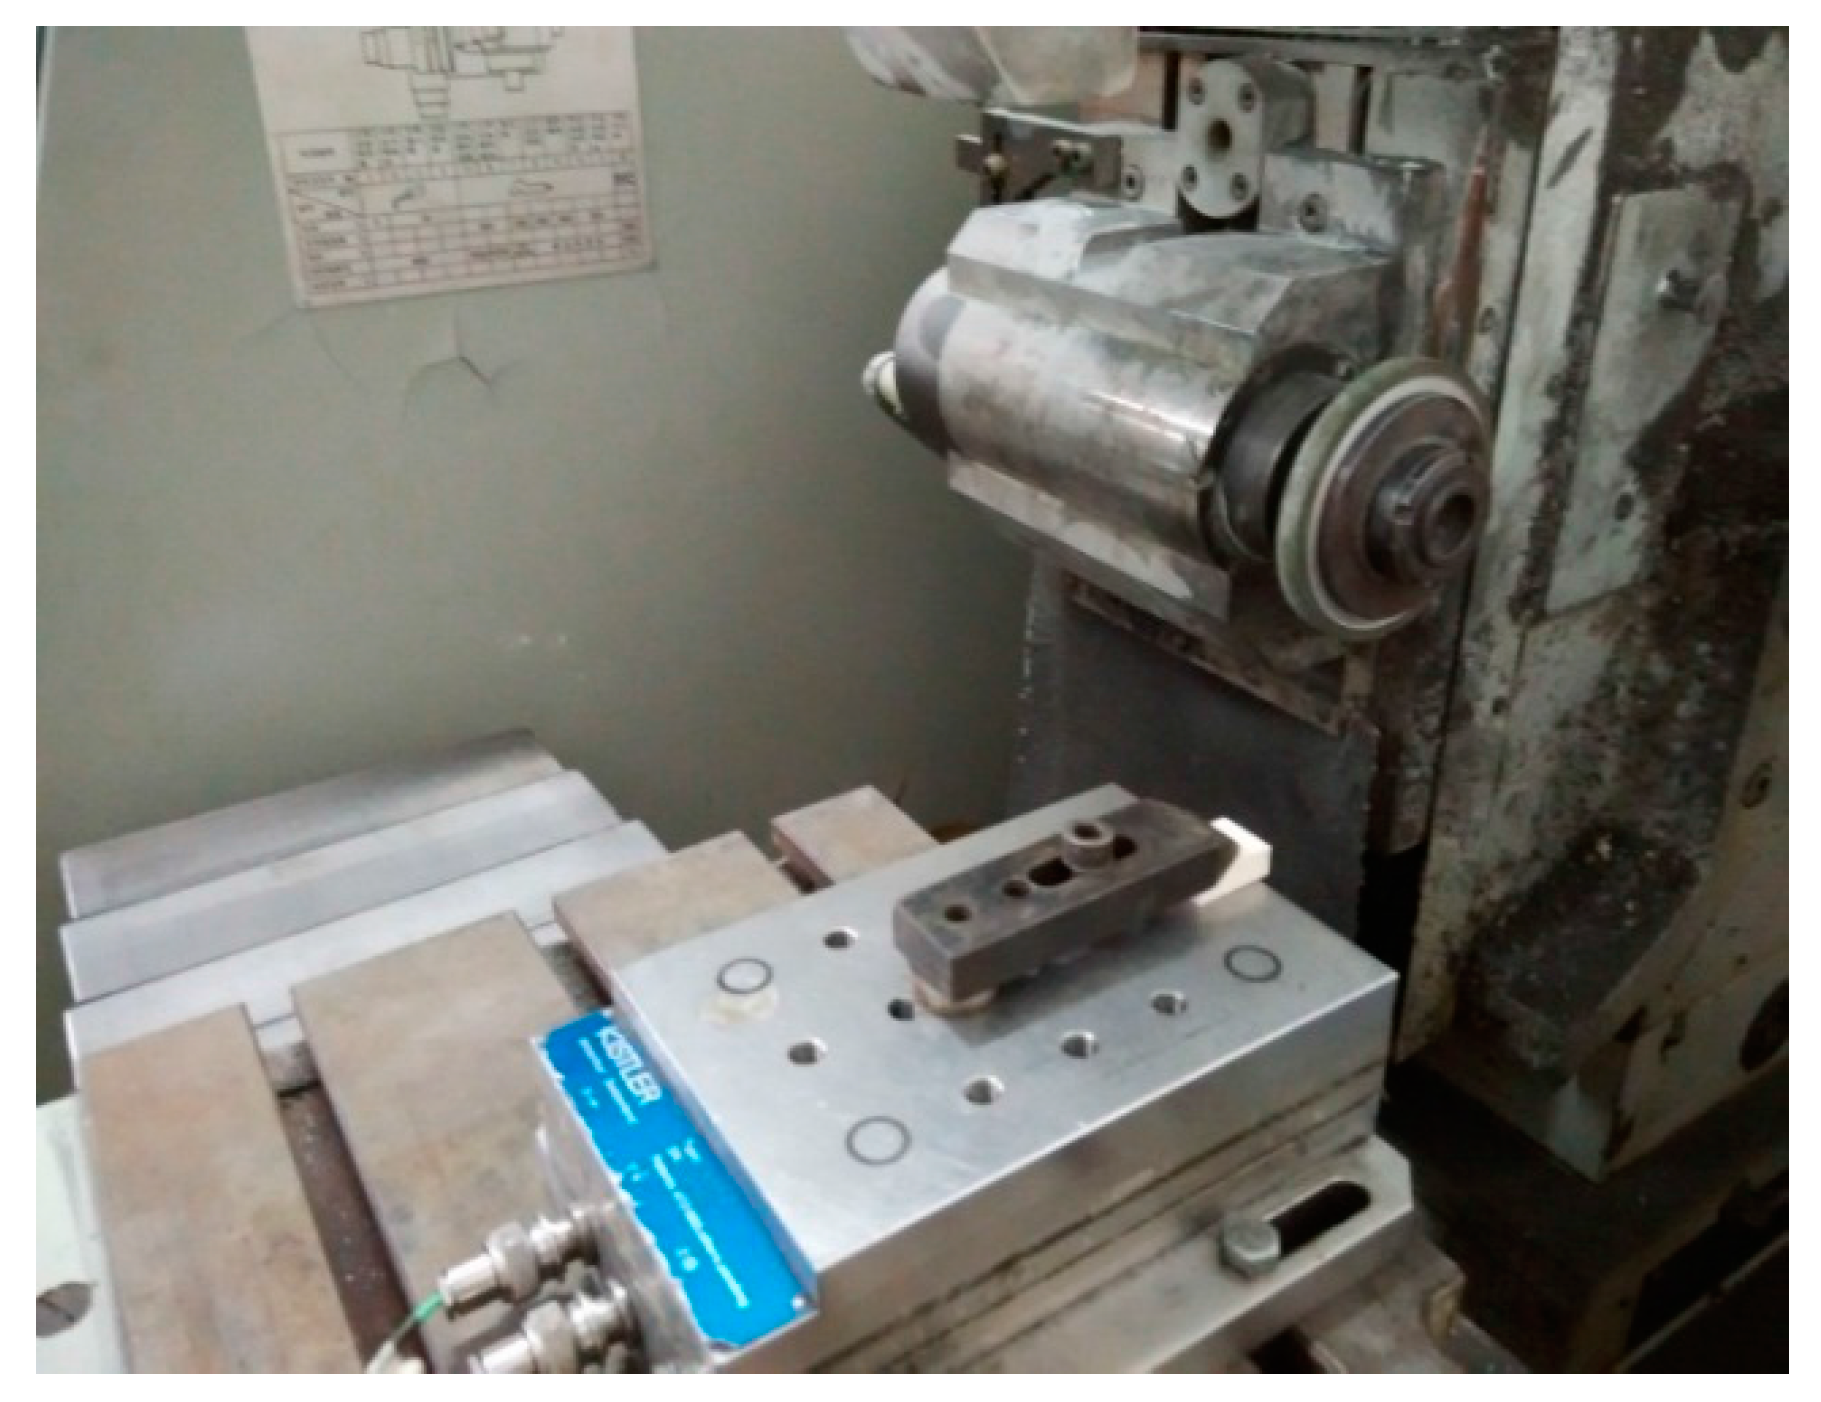
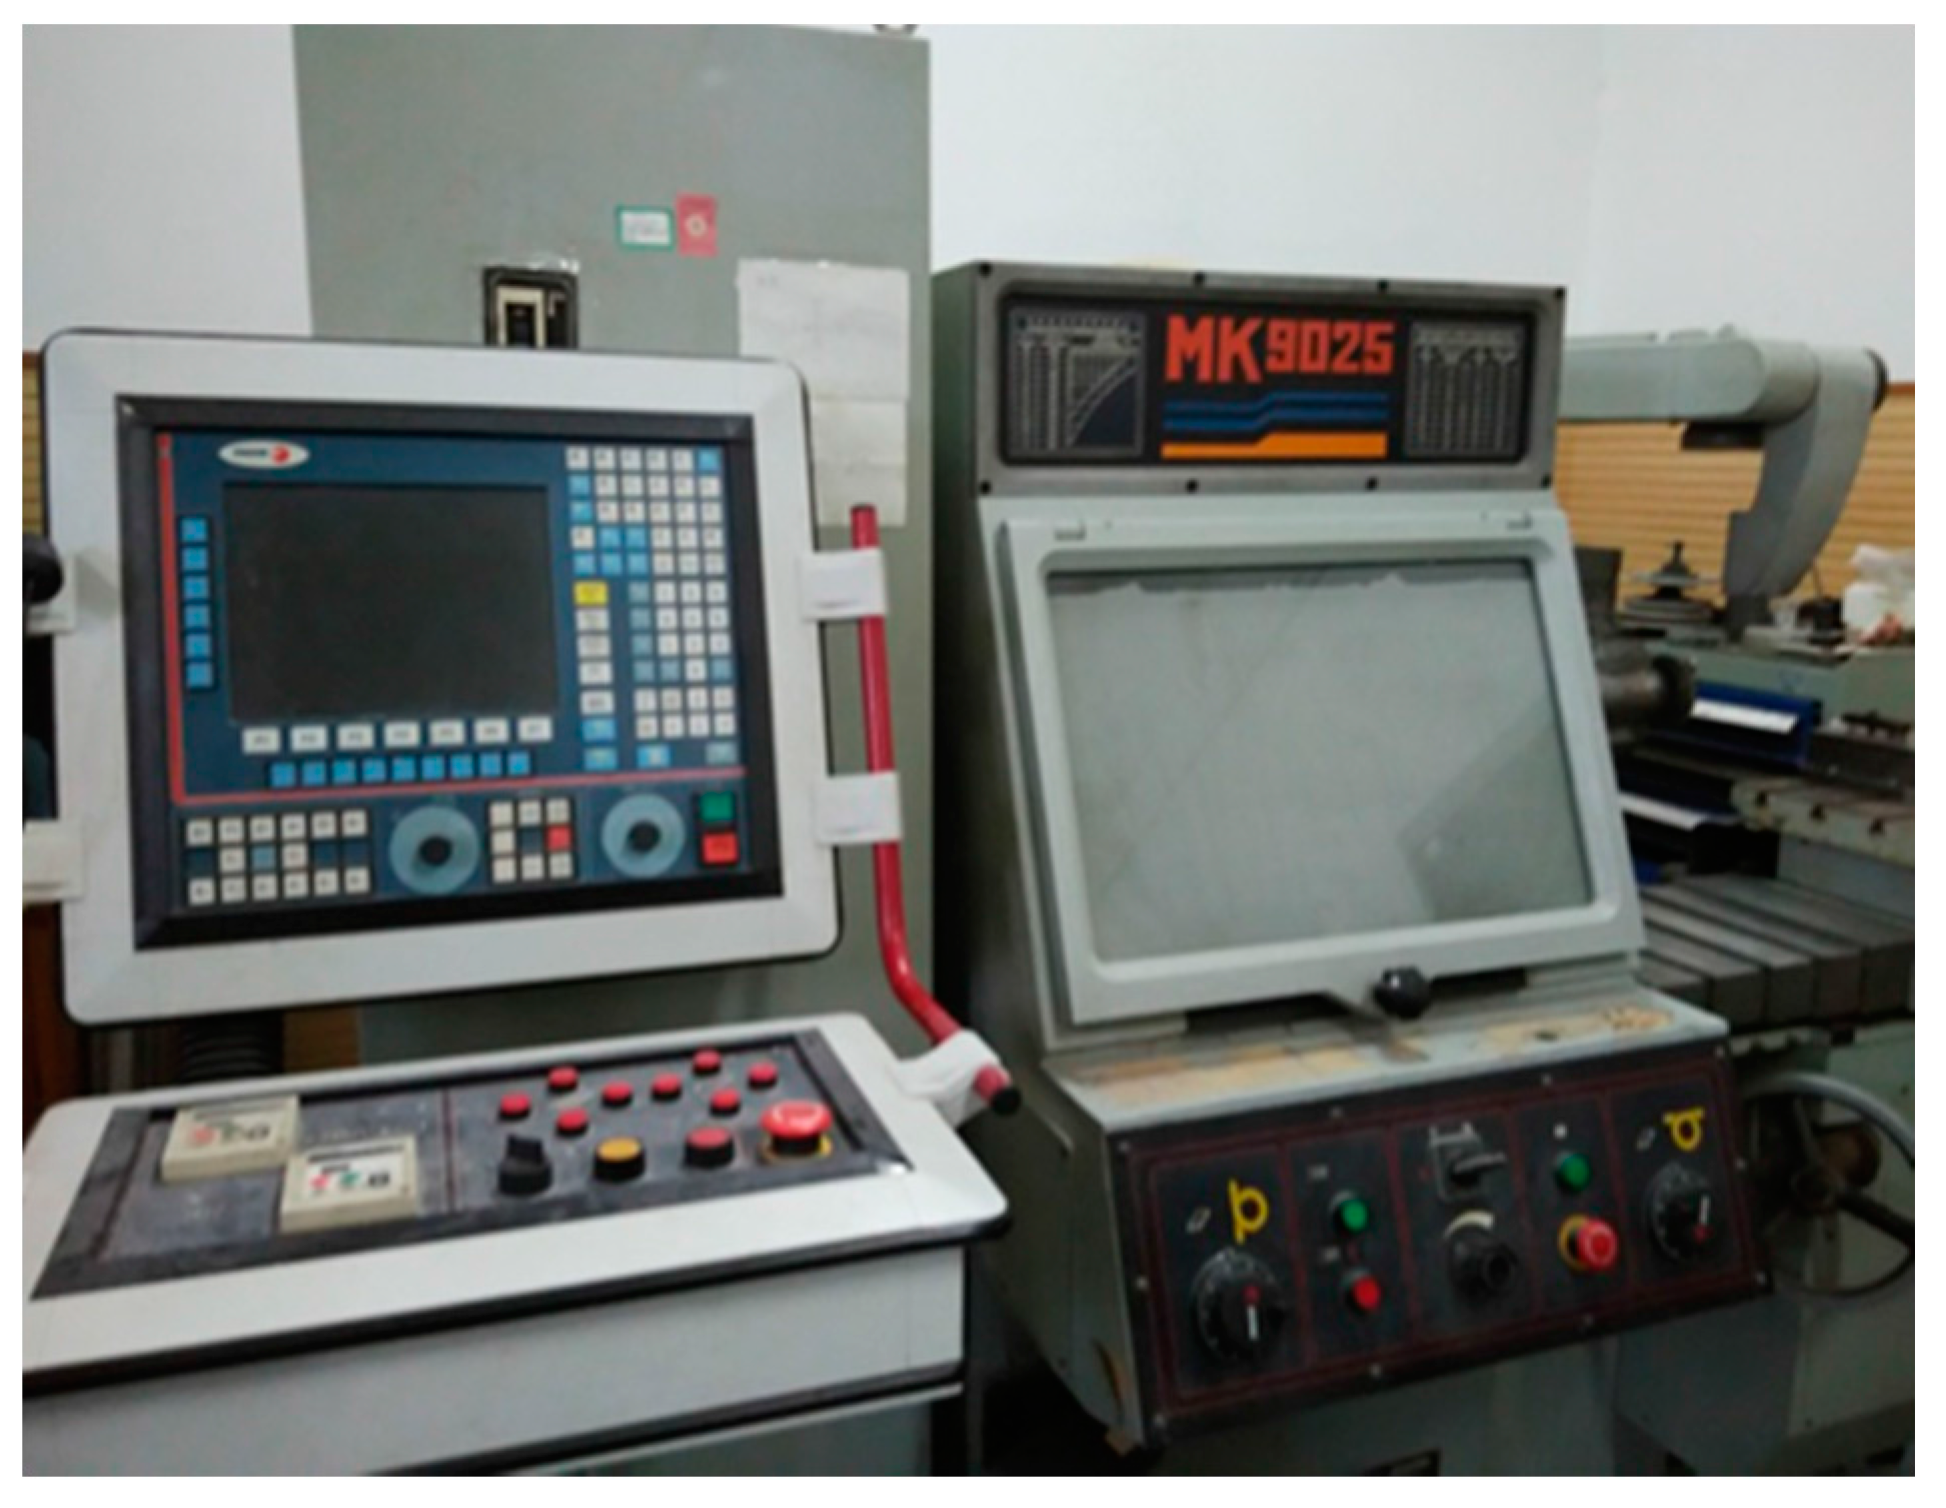
2.2. Grinding Experiment

The grinding experiment was conducted on a MK9025 numerical controlled machine shown in Figure 2. The spindle is capable of running from 3000 to 6600 r/min. Resin bond diamond wheels with different sizes were used in this experiment. The wheels have an outer diameter of 100 mm, a width of 10 mm and a thickness of 5 mm. The grit surface density was obtained by a theory equation (Equation (1)) [10]. Properties of the wheels are introduced in Table 2.
Figure 2. MK9025 numerical controlled machine.
Applsci 05 01337 g002
Table 2. Properties of grinding wheels.
No.Mesh Size M/# Mean Grit Size/μmGrit Surface Density C/#·mm−2
1602533.82
212012715.15
31808434.6
C = 4 f d g 2 · ( 4 π 3 v ) 2 / 3
The grain dimension dg is quoted in a simple way as equal to the aperture opening of the sieve according to the following relationship: dg = 15.2/M [10]. M is the mesh size of the wheel. ν is the volume fraction of diamond in the grinding wheel. In this experiment, all wheels have the same density of 100, in other words, v = 0.25. f is the fraction of diamond particles that actively cut in grinding. It is assumed that only one-half of the diamond particles on the wheel surface are actively engaged in cutting, so f = 0.5 [10]. Considering the difference between the theoretical value of Equation (1) and actual value, the grit surface density used in this study is a proximate value.
Surface-grinding was performed on the specimen of 20 × 10 mm2 face and was employed in a down grinding mode. A geometry model for grinding was simplified as a single grit-workpiece interaction model and shown in Figure 3.
Figure 3. Single grit-workpiece interaction.
Applsci 05 01337 g003
Seen from Figure 3, rs is the semi-diameter of wheels. Hmax is the maximum undeformed chip thickness when depth of cut is ap. O is the initial position of grain track center and Oʹ is the real center of the grain track. The wheel whirled to get Vs and at the same time had a vertical reciprocating motion to get Vw. The wheel rotated clockwise and the workpiece was relatively moving in upper direction. Grinding width was held a constant at b = 10 mm and the maximum undeformed chip thickness Hmax was obtained by Equation (2) [16], where Vw is the speed of workpiece and Vs is the speed of wheels, ap is depth of cut, de is the equivalent diameter of wheels (in this experiment it is surface-grinding, so de equals wheel’s diameter), C is the surface density of wheel, and r is the ratio of chip width to average undeformed chip thickness. The value of r is reported to be in the range of 10–20 [16]; r = 4 × tan θ (θ is the angle of wheel’s grain tip) by the geometric model and r was assumed to be equal to 10 in this experiment. No grinding fluid was used in the experiment. The grinding parameters employed are shown in Table 3.
H max = ( 4 V w V s · C · r a p d e ) 0.5
Table 3. Experiment conditions.
No.Mesh Size/#Depth of Cut/μmWheel Speed /m·s−1Work Speed/m·s−1Max Undeformed Chip Thickness Hmax/μm
16010010.50.27.94
2100150.26.64
3100150.14.70
4100200.14.07
5100300.13.32
650300.12.79
730300.12.46
8120100300.11.67
950300.11.40
1030300.11.23
1110300.10.94
1210300.070.78
1310300.050.66
1418050300.070.78
1530300.070.68
1610300.070.52
17100300.070.44

2.3. Grinding Force and Specific Grinding Energy Measurements and Surface Morphology Observations

Under each set of conditions the grinding process was conducted three times to obtain force value and the surface morphologies of workpieces. Grinding forces were measured using a piezoelectric dynamometer (Kistler 9257B) and were recorded into a personal computer via a data acquisition system. Installation of workpiece, Kistler 9257B and grinding machine is shown in Figure 4. The specific grinding energy was calculated by Equation (3) [18] as below, where Ft is the tangential force. Surface morphologies were observed through scanning-electron microscopy (nanosem-430 and SU1510) to identify the micro-fracture mode of the workpiece materials.
E s = V s · F t V w · a p · b
Figure 4. Installation of workpiece, Kistler 9257B and grinding machine.
Applsci 05 01337 g004

3. Results and Discussion

Single-grit force is an important parameter in calculating grinding force and evaluating machinability. So the predictive modeling will be discussed in this study. The experimental value of single-grit force is calculated by Equation (4) [10,11] as below, where Ft and Fn are experimental grinding forces.
{ F g t = F t C · b a p · d s F g n = F n C · b a p · d s

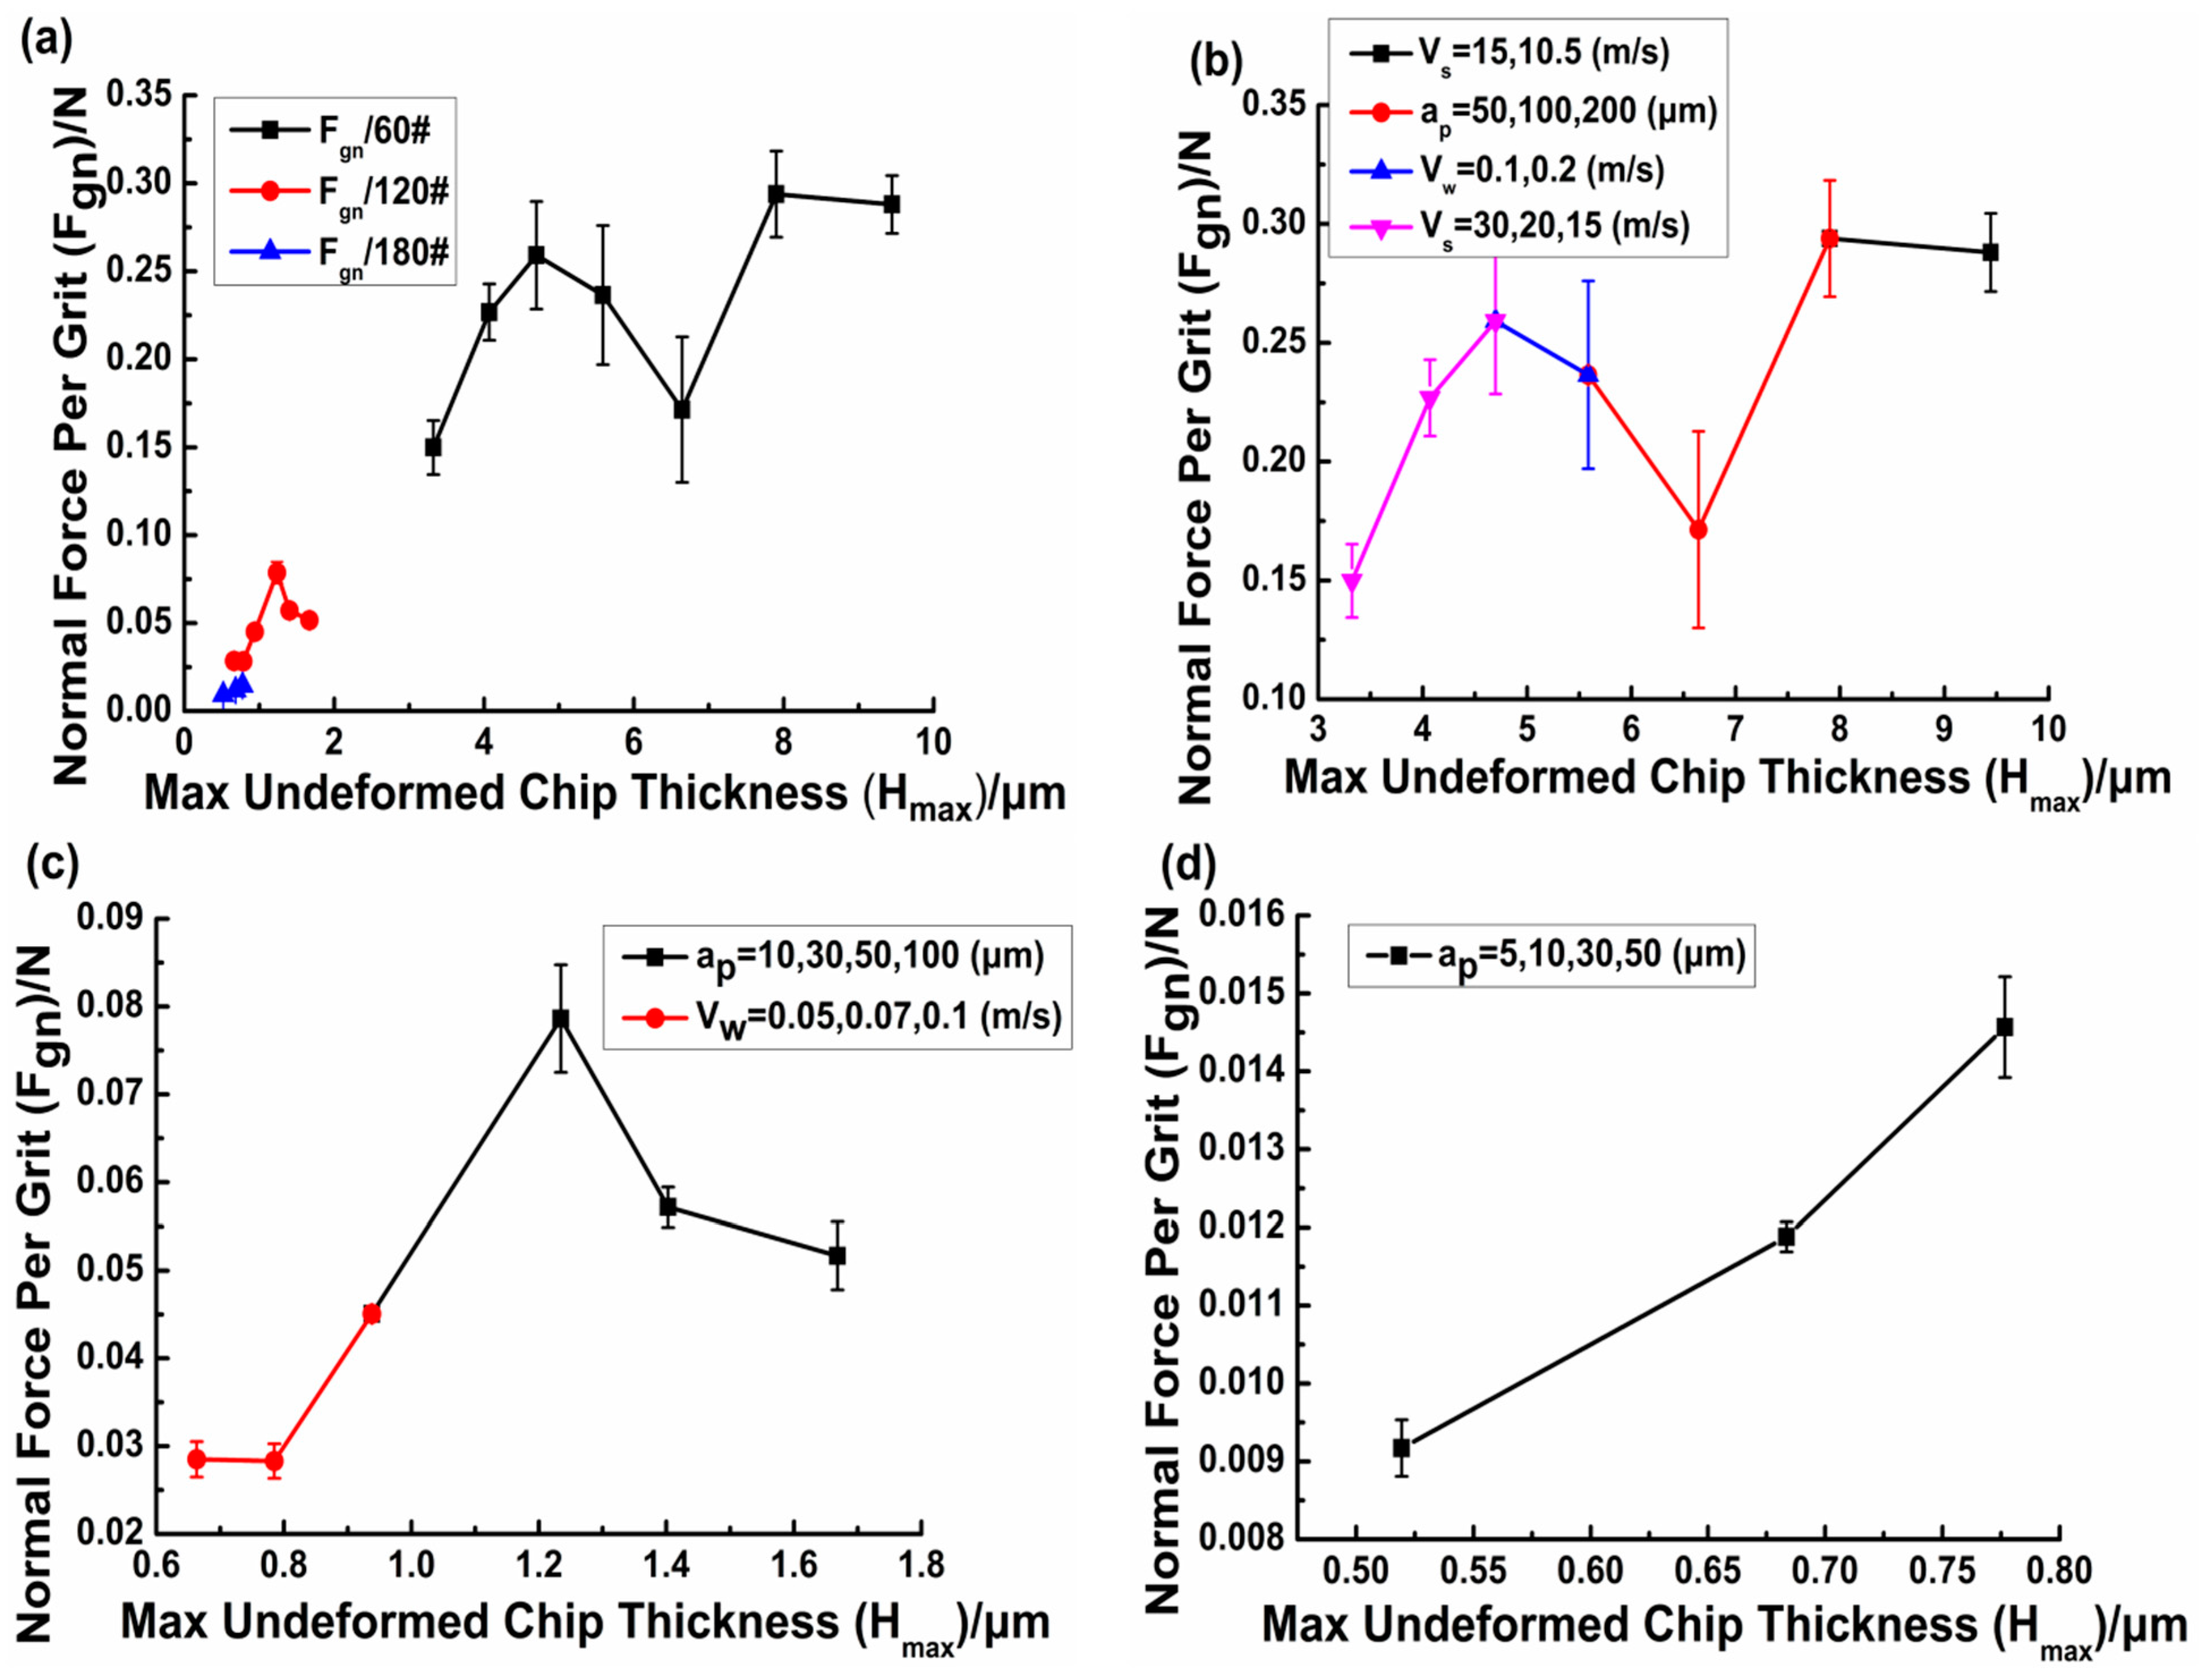
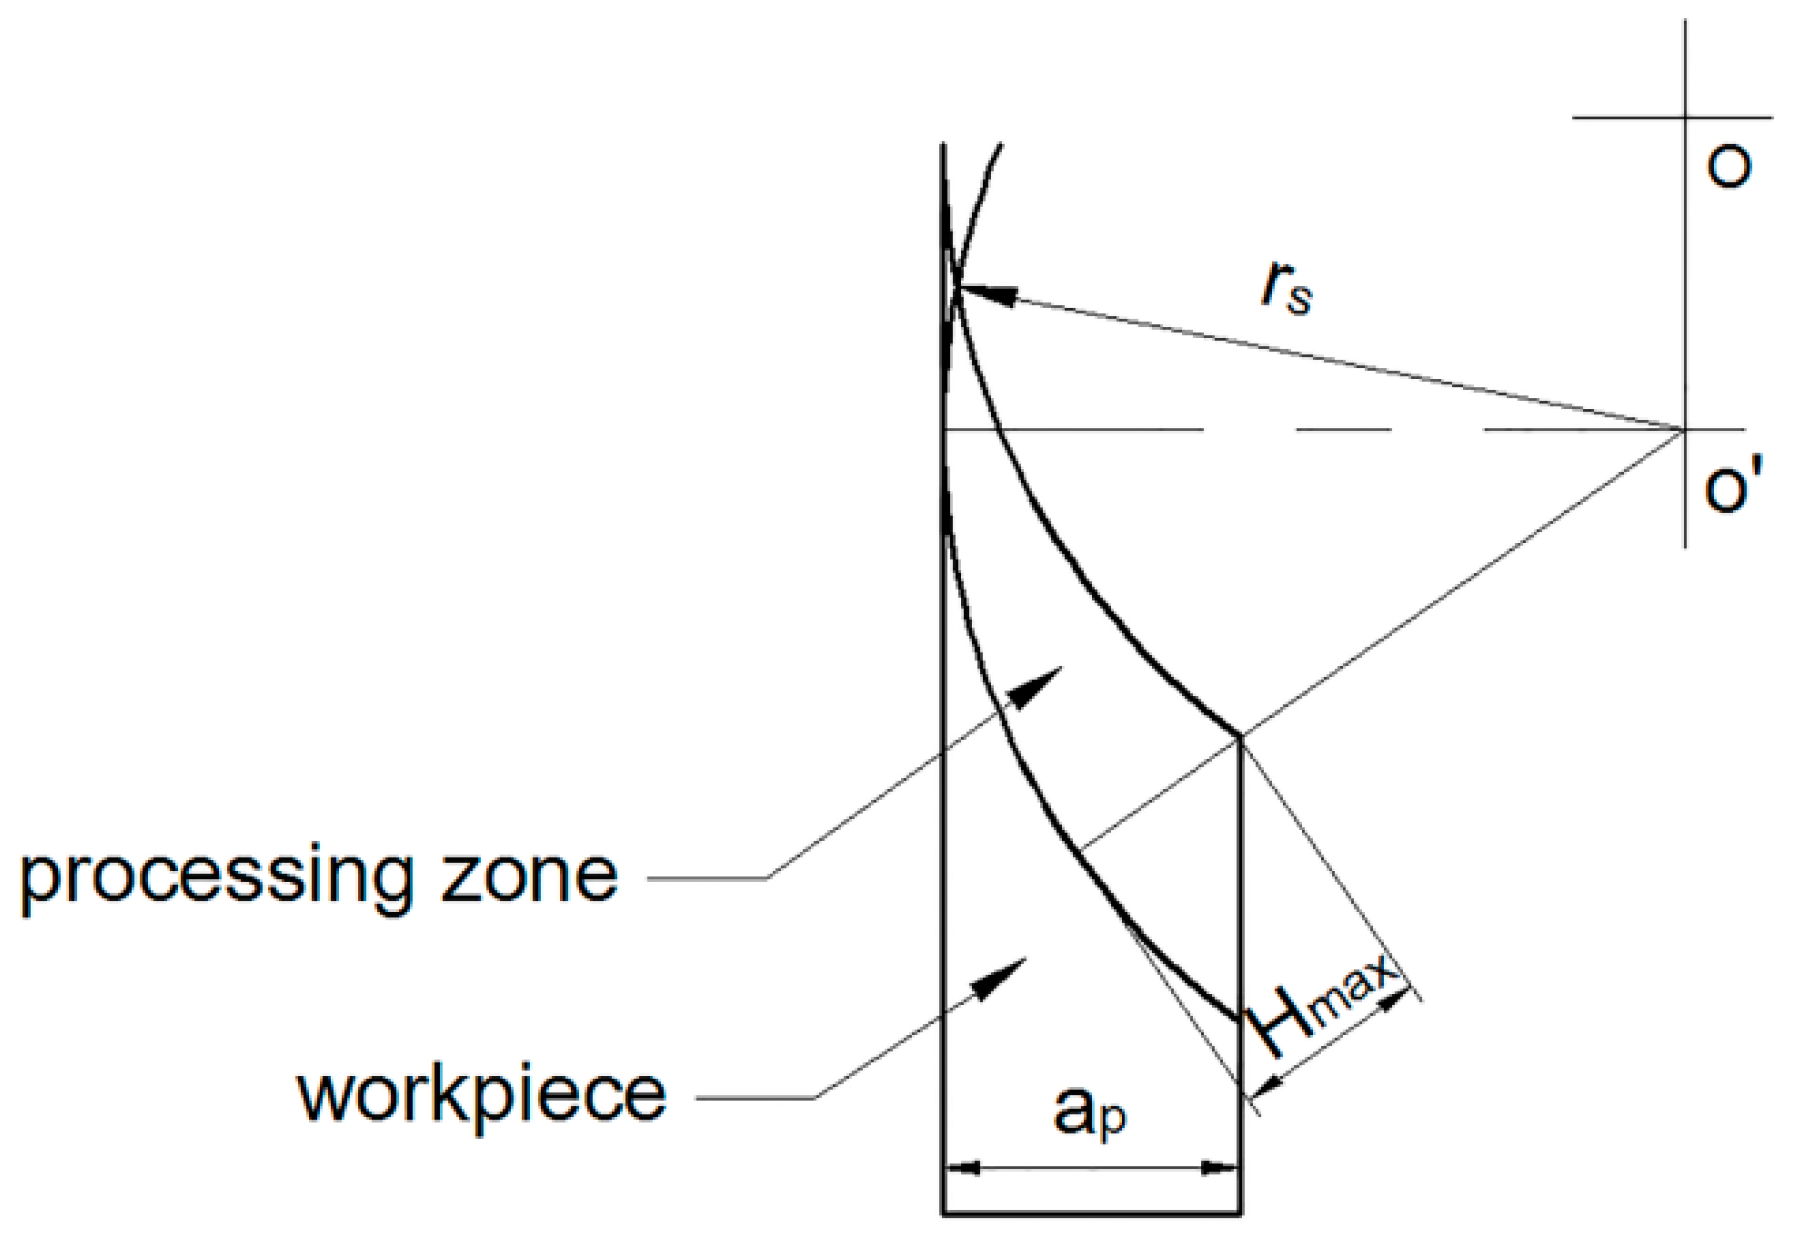
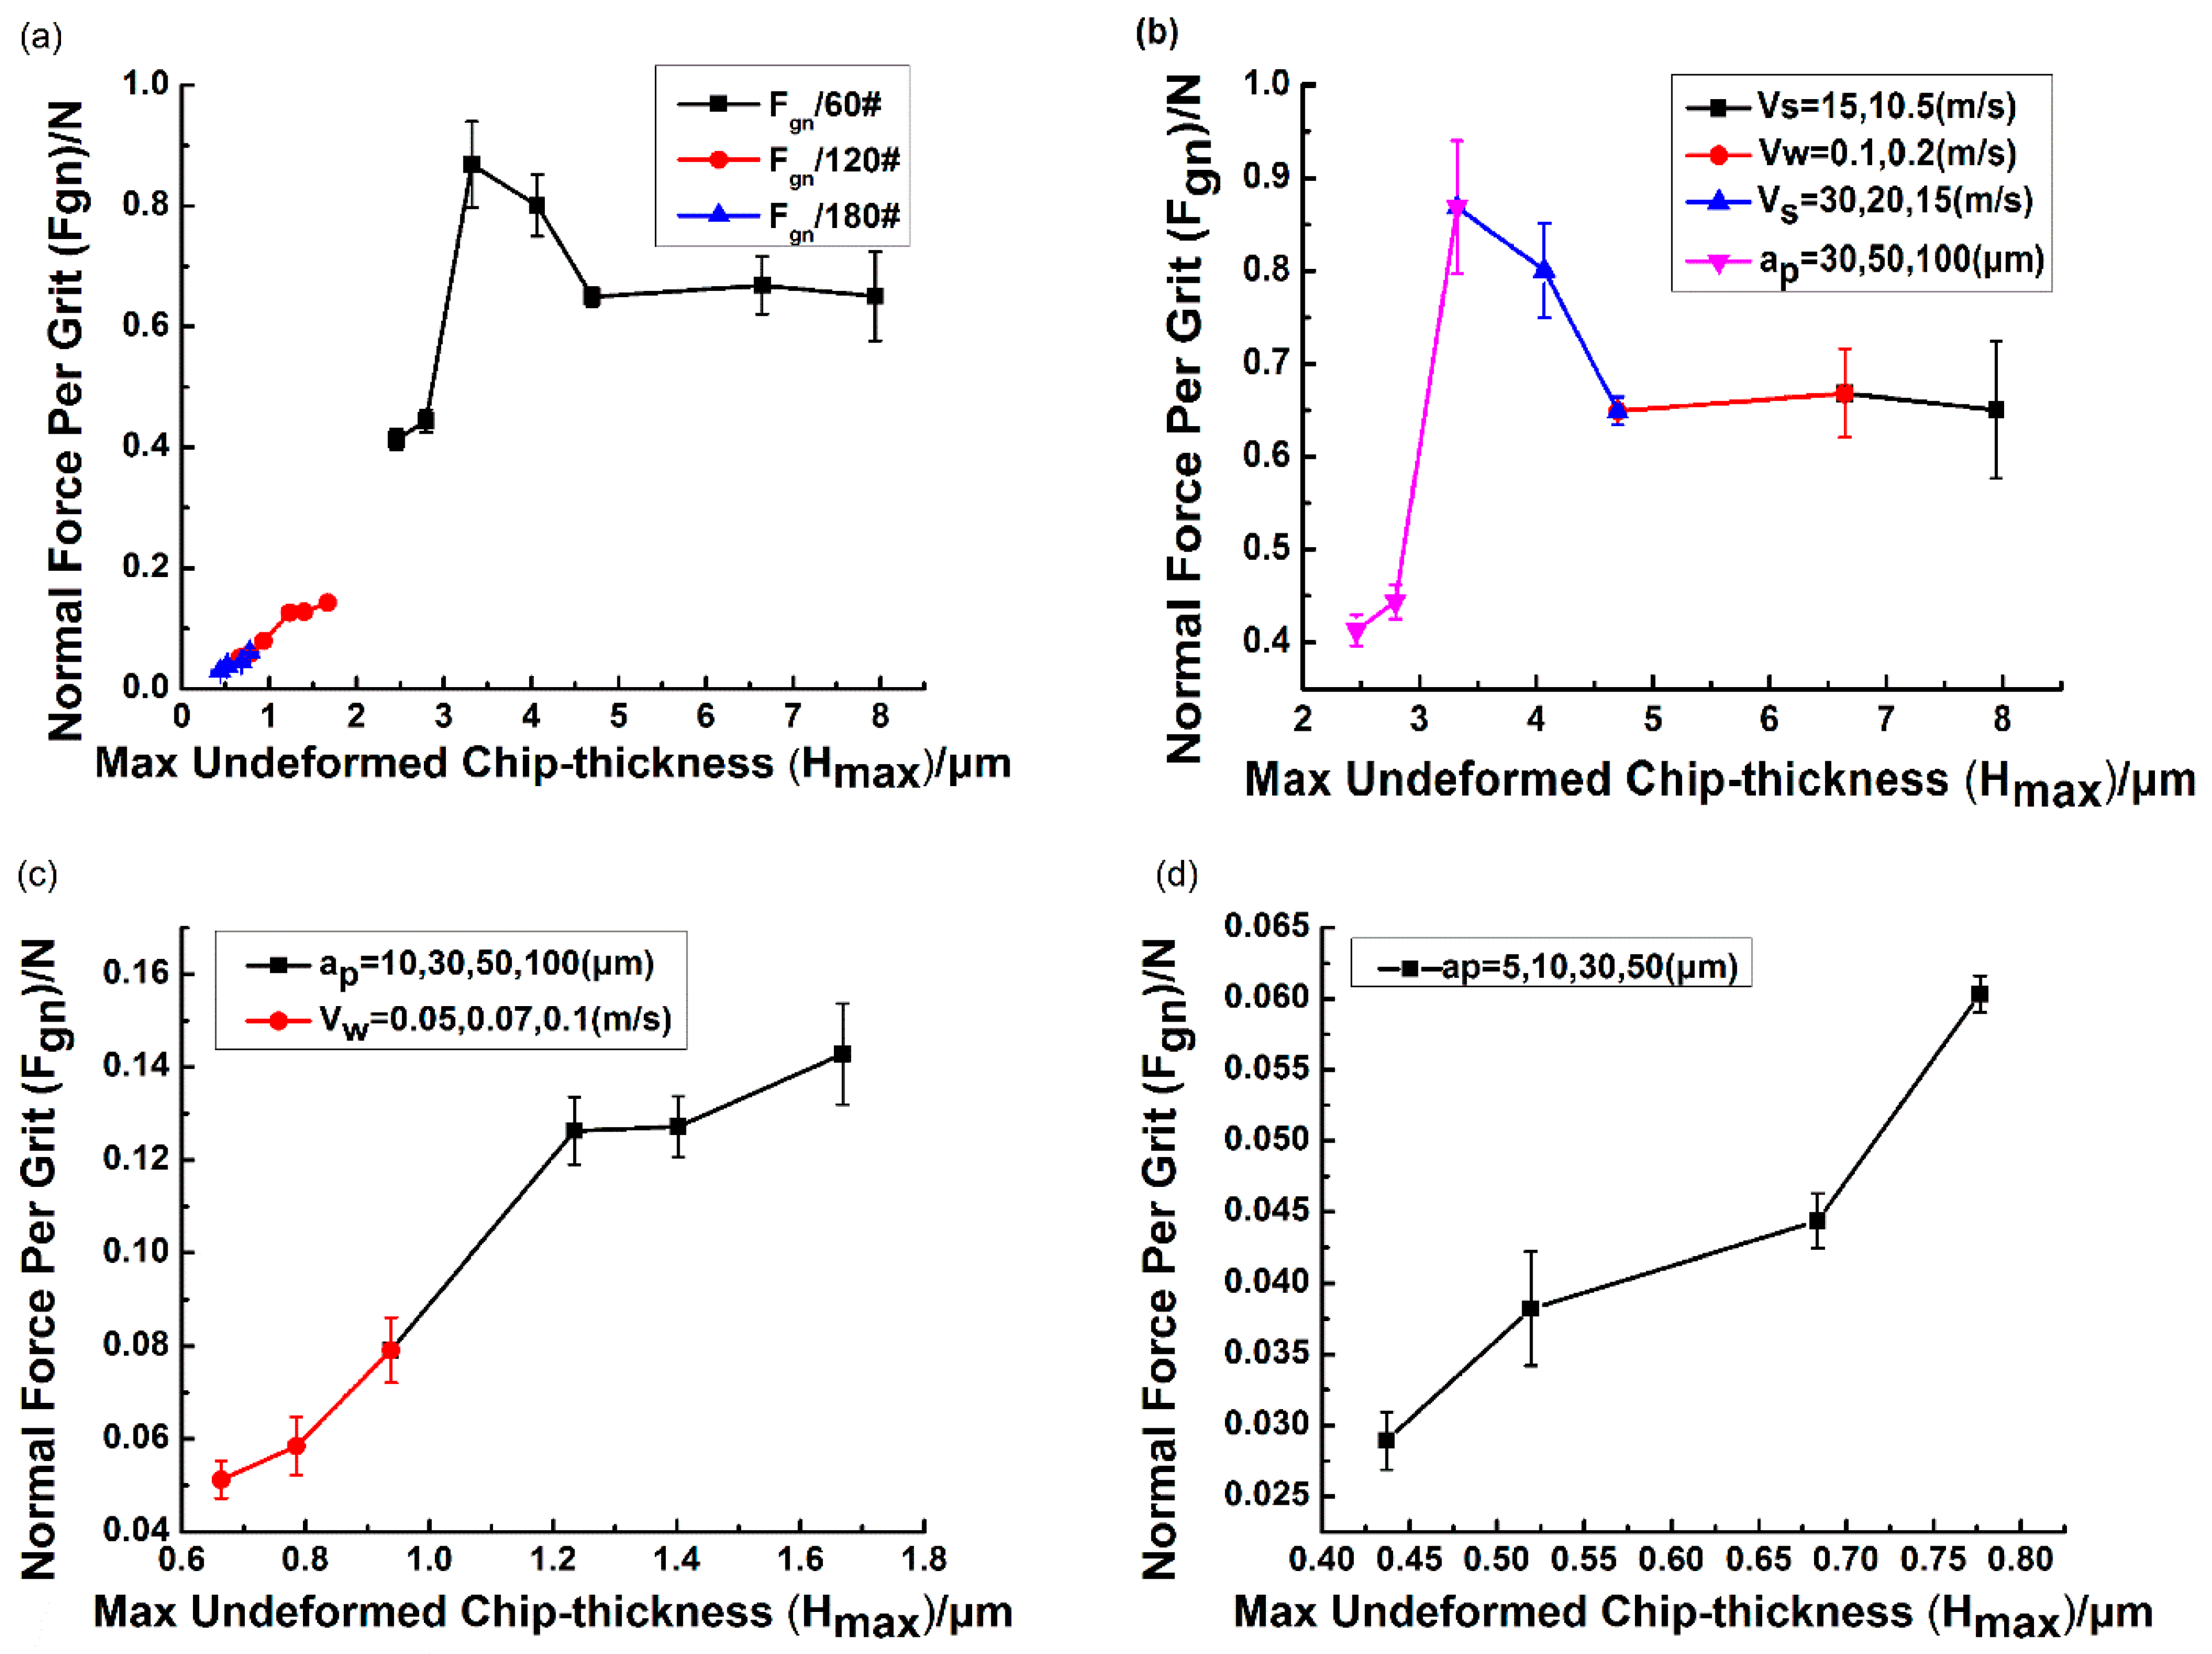
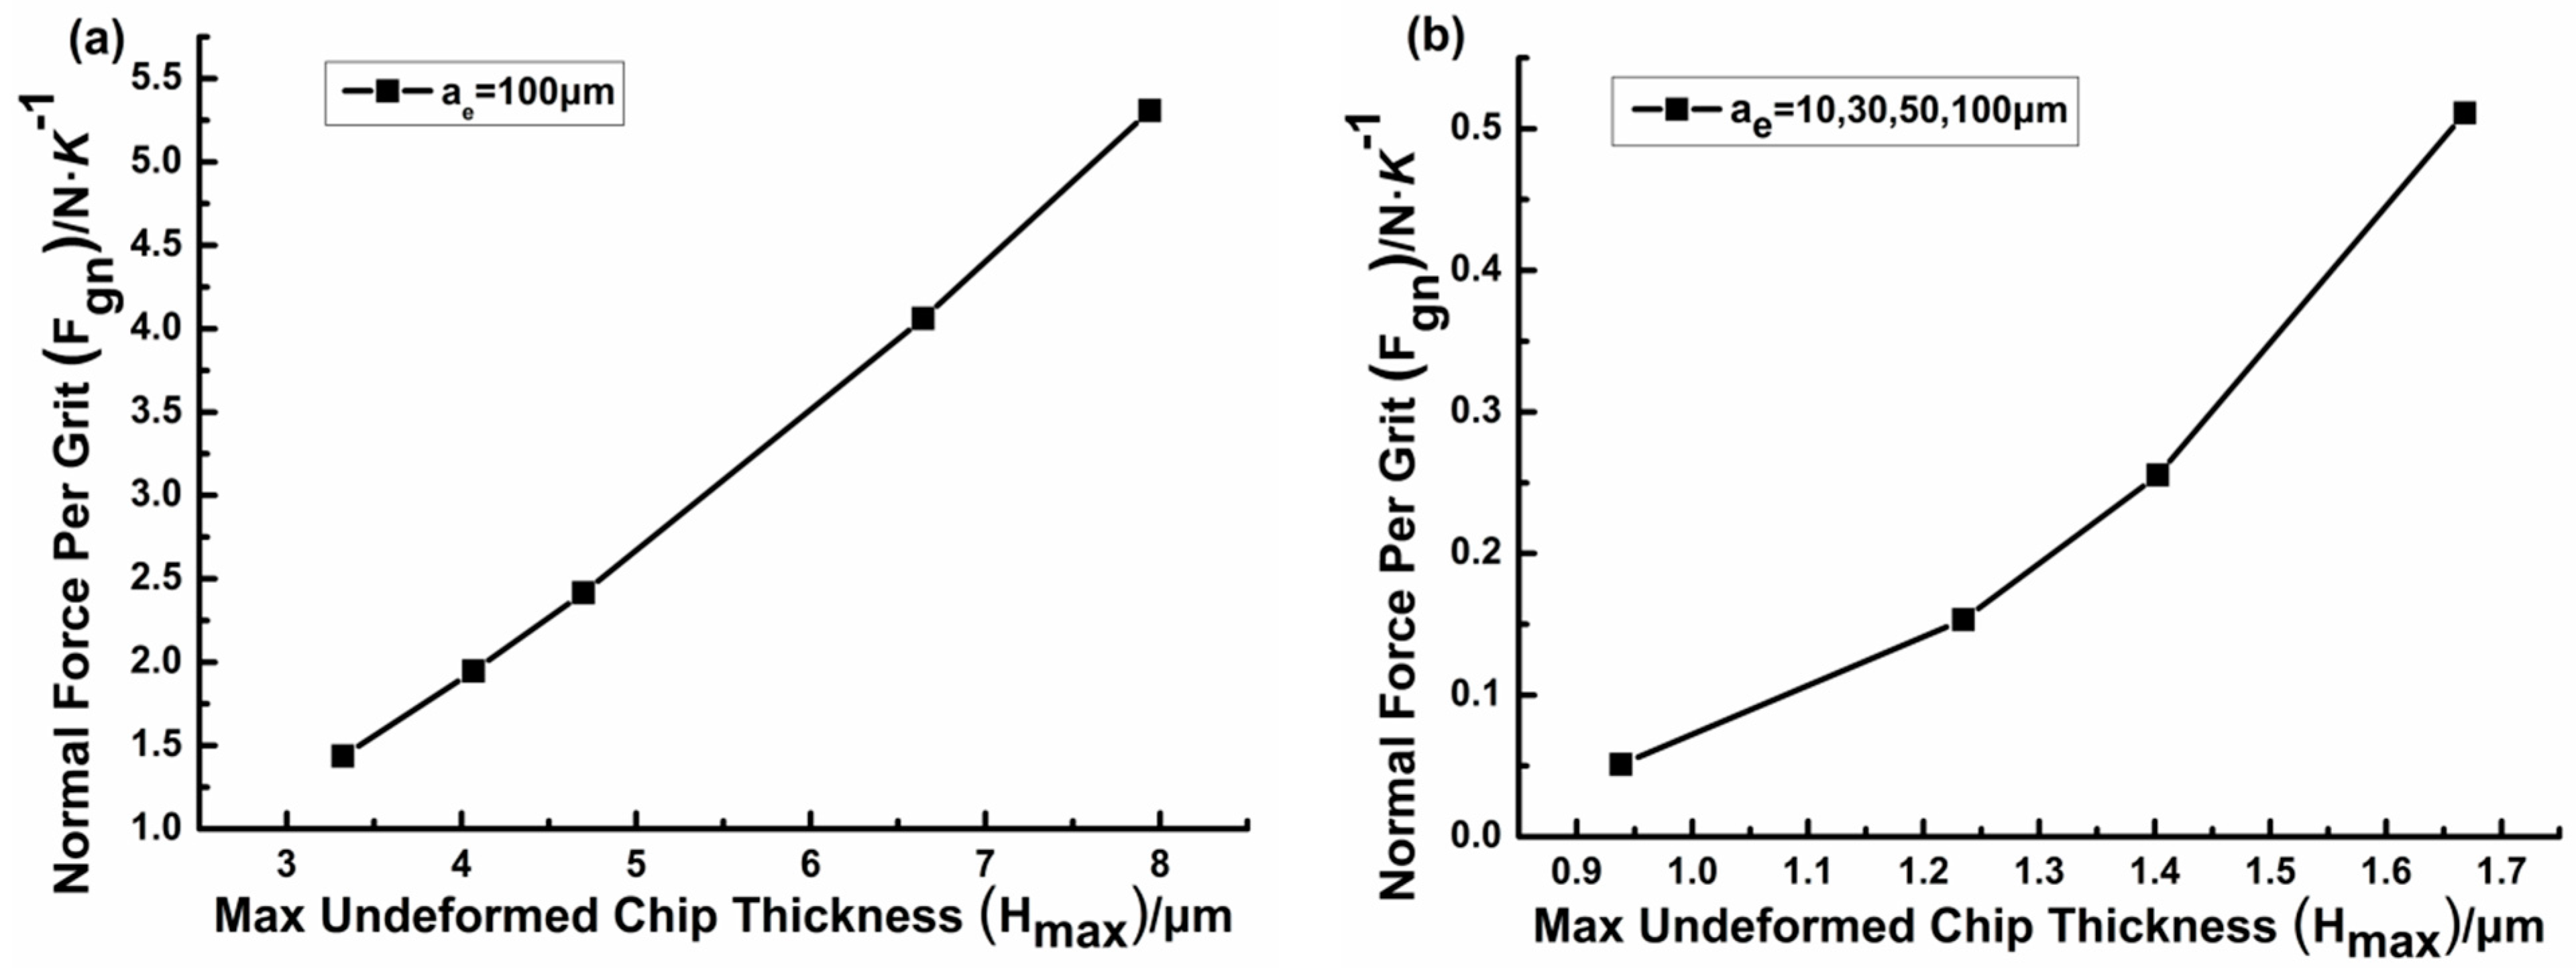
3.1. The Normal Force per Grit vs. Maximum Undeformed Chip Thickness

Figure 5. (a) is the normal grinding force per grit of alumina as a function of the maximum undeformed chip thickness with different wheels. In picture (b), the mesh size of wheel is 60#. In picture (c), it is 120#. In picture (d), it is 180#.
Applsci 05 01337 g005
Figure 5 shows the trend of normal force per grit with the increase of maximum undeformed chip thickness (Hmax). Single grit normal force increases until reaches a maximum value at the point of Hmax = 3.32 μm, then starts to decrease sharply, and at last fluctuates in a small range with the increasing Hmax. When Hmax equals 0.78 μm, the force of grit on 120# wheel is bigger than the force of 180# wheel (see Figure 5a). Figure 5b–d are separate views of Figure 5a under different wheel conditions. In Figure 5b, using 60# wheel shows that when Hmax is smaller than 3.32 μm, a larger Hmax resulted from increasing ap leads to an increase of single grit normal force. When Hmax is bigger than 3.32 μm, no obvious pattern about the specific normal force is obtained as a function of Hmax. At the range of 3.32 to 4.7 μm, the normal force per grit declines due to the decreasing Vs (wheel speed). The specific normal force is proved to be growing with Vw when Hmax ranges from 4.7 to 6.64 μm and is reduced as a result of declining Vs between 6.64 and 7.94 μm of Hmax. In other words, the normal force per grit is affected by grinding parameters. Figure 5c shows that an increase in maximum undeformed chip thickness, whether it is resulted from ap or Vw, leads to a larger normal force per grit. A similar trend is seen in Figure 5d: that an increase of maximum undeformed chip thickness results in a larger normal force per grit. The change of ap leads to the increasing Hmax.
From [6,8,10], we learn that there is a positive correlation between Hmax and Fgn. Take the predictive grinding force modeling [10] for example which is shown as below.
{ F g n = β ( K I C 0.5 · H E 0.4 ) ( H max 2 l c C r ) 0.75 a e 0.25 F g t = q · F g n
where KIC is fracture toughness, H is hardness, E is elastic modulus and β is a constant that includes information related to the wheel topography. q is a ratio of Fgt and Fgn. lc = (ae × ds)0.5 and ds is diameter of the wheel. This equation, while providing important insights into the relation between Fgn and material properties, geometry values of grinding and wheels, does not directly indicate the effects of microstructure. It shows that Fgn and Hmax1.5 are in a positive proportion relation, and it appears to be a positive correlation between Fgn and ae0.625. So the equation can be simplified as Fgn = K × Hmax1.5 × ae0.625. K is a constant relative to the wheel and the material. The relation can be clearly observed in Figure 6.
Figure 6. The relationship between Fgn and Hmax reflected by Equation (5): (a) When ae is a constant and (b) is under changing ae conditions.
Applsci 05 01337 g006
But the experimental result indicates that when Hmax is less than a critical depth (3.32 μm), the equation fits well with the experiment. In this condition, Hmax and ae are important factors seen from Figure 5b–d. When Hmax is bigger than 3.32 μm, grinding parameters such as wheel speed, work speed significantly affect Fgn compared with Hmax seen from Figure 5b. Tbusm a revised parameter k can be added to the grinding force. In this research, it is 3.32 μm. As the calculated surface density of wheels is an approximate value, which is proven to be larger than actual value obtained by observations, the actual value corresponding to 3.32 μm is bigger. That is to say, the critical depth is bigger than 3.32 μm. Through observations in Figure 1, it turns out that the alumina grain size is 4 to 5 μm, which is near to the critical depth k.
Figure 7. (a) The normal grinding force per grit of fused silica as a function of the maximum undeformed chip thickness with different wheels. In picture (b), the mesh size of wheel is 60#. In picture (c), it is 120#. In picture (d), it is 180#.
Applsci 05 01337 g007
In Figure 7a, the normal force per grit is fluctuating with increasing maximum undeformed chip thickness when using the 60# wheel and 120# wheel, while, it is rising under the 180# wheel condition. Figure 7b shows that when Hmax is less than 4.7 μm, Fgn is increasing with the increasing Vs, while when Hmax is bigger than 6.64, Fgn is decreasing with the increasing Vs. A similar regular pattern, that Fgn is reduced when Hmax is smaller than 4.07 μm and rising when Hmax is larger than 4.07 μm, was obtained as a function of ap. Figure 7c reflects the influences of Vw and ap on Fgn. The normal force per grit is decreasing at first, and then going up with increasing Hmax resulted from Vw. At last, the opposite trend is coming up with increasing Hmax resulted from increasing ap. Not until Hmax is less than 0.78 μm, which is smaller than brittle-ductile cutting depth (1.03 μm) of this fused silica, Fgn increases as a function of Hmax. In Figure 7d, the changing Hmax is resulted from ap. In summary, the predictive grinding force model does not correspond with Figure 7b,c conditions. As we all know, most predictive grinding force models were derived based on crystal ceramics, while Fused silica is a non-crystalline ceramic, which is significantly different from crystals. From this experiment, we can see that microstructure plays an important role in determining grinding force models.

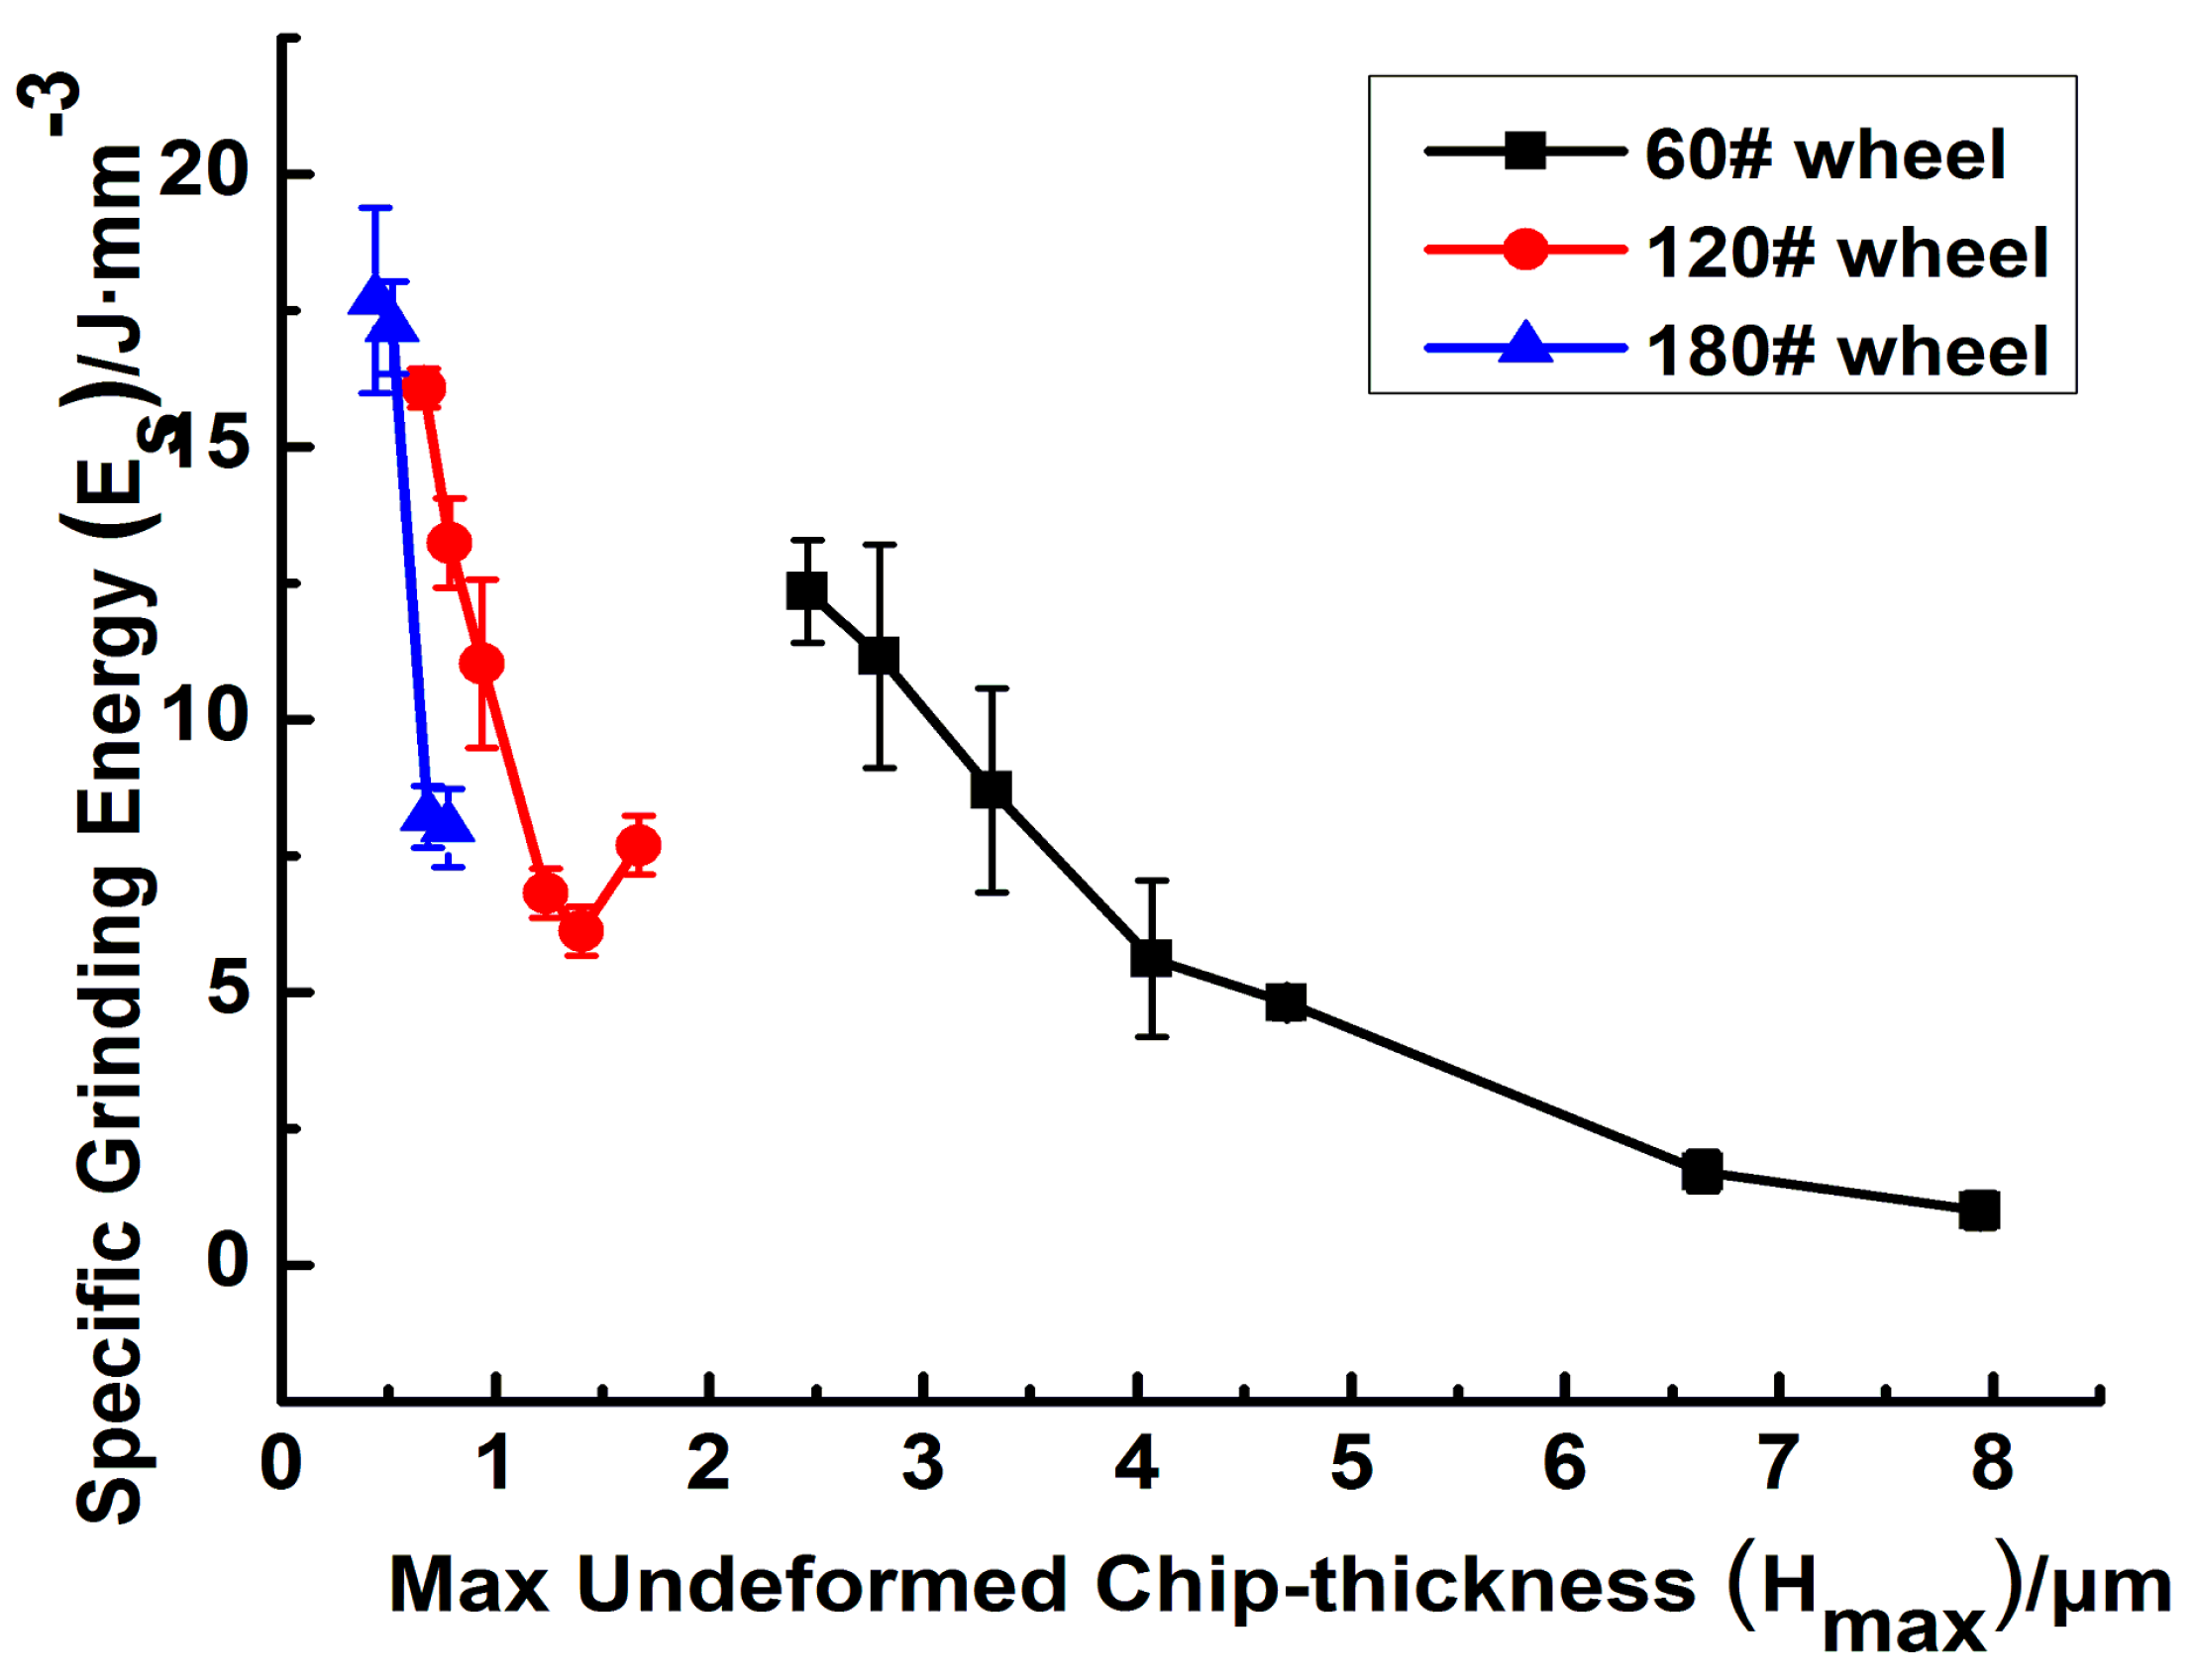
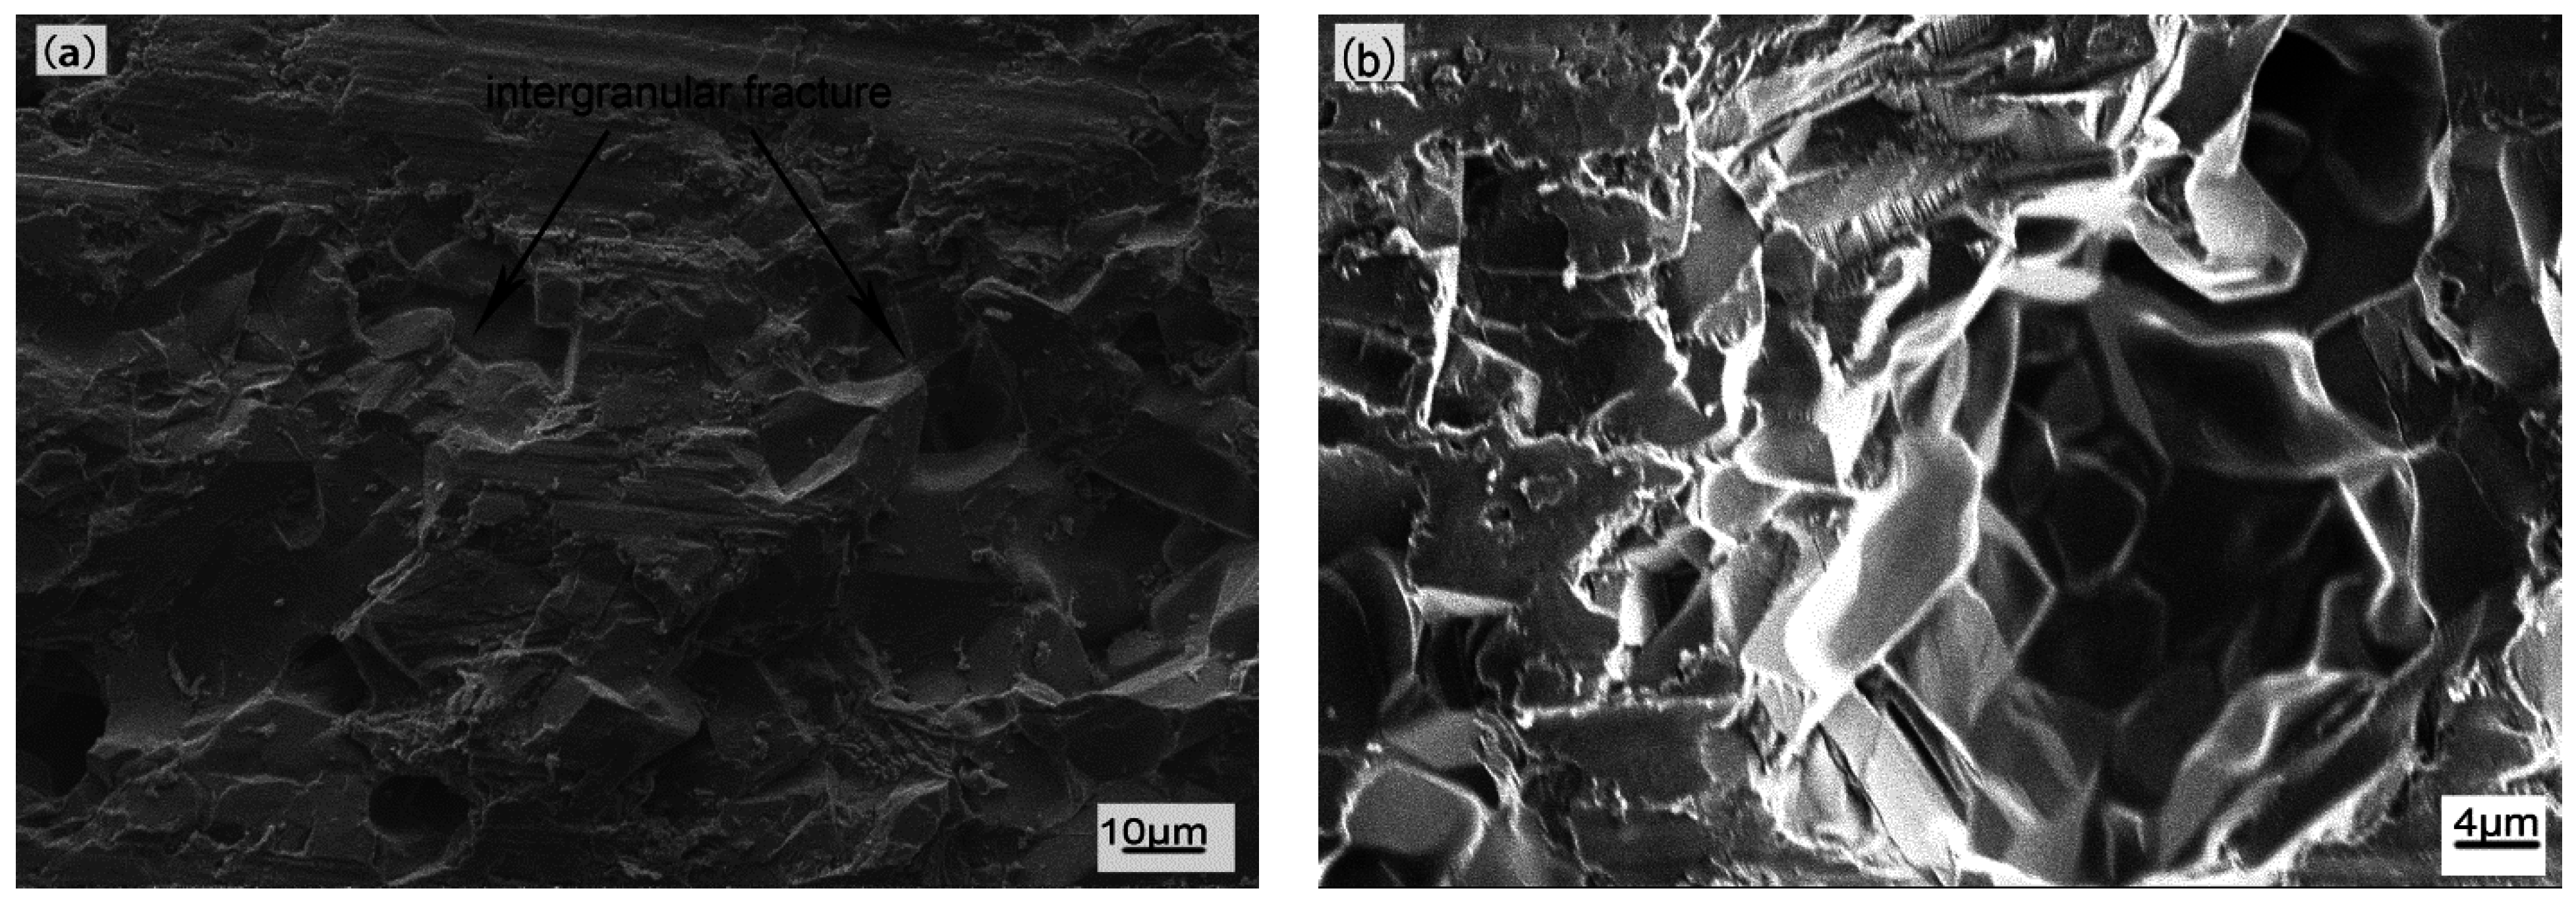
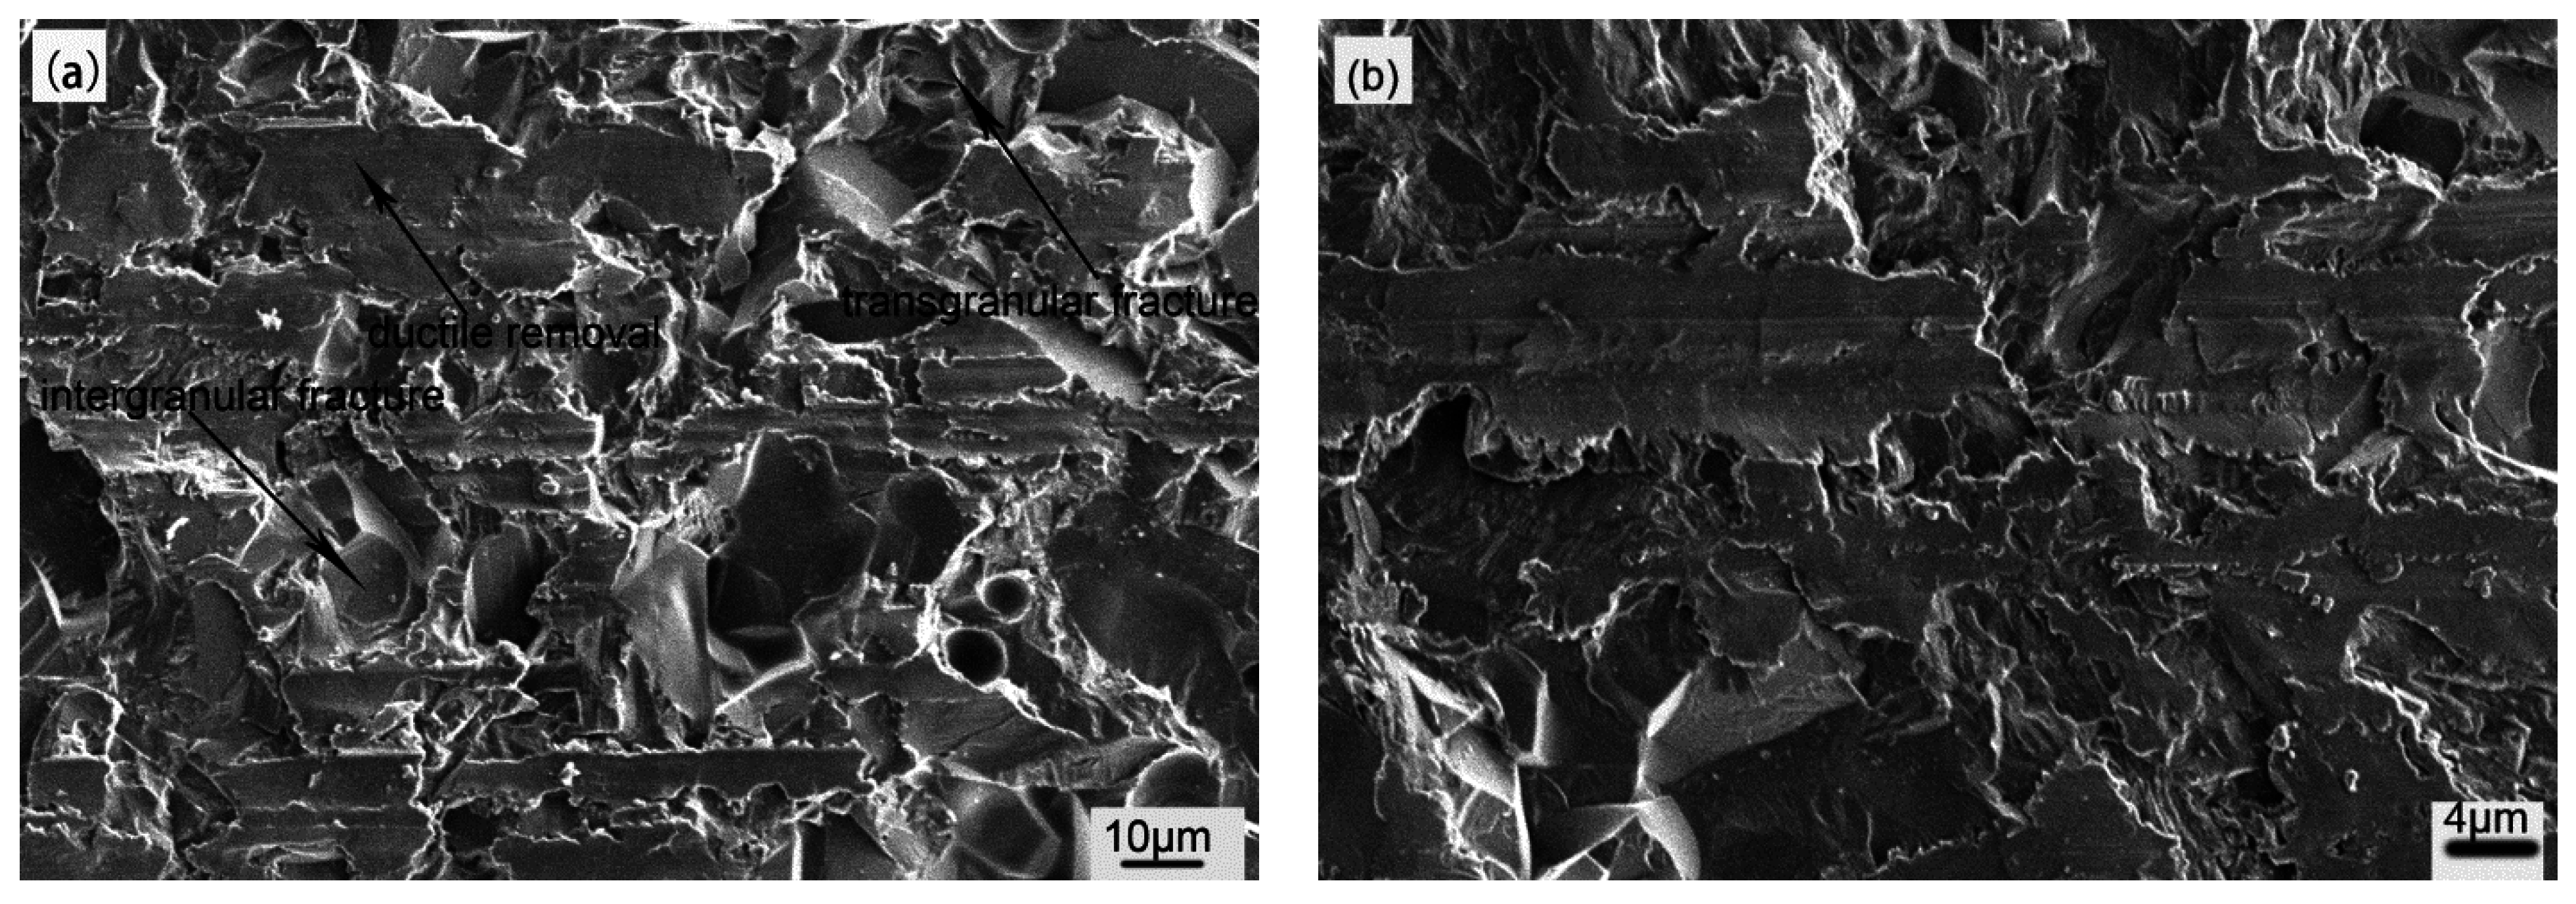
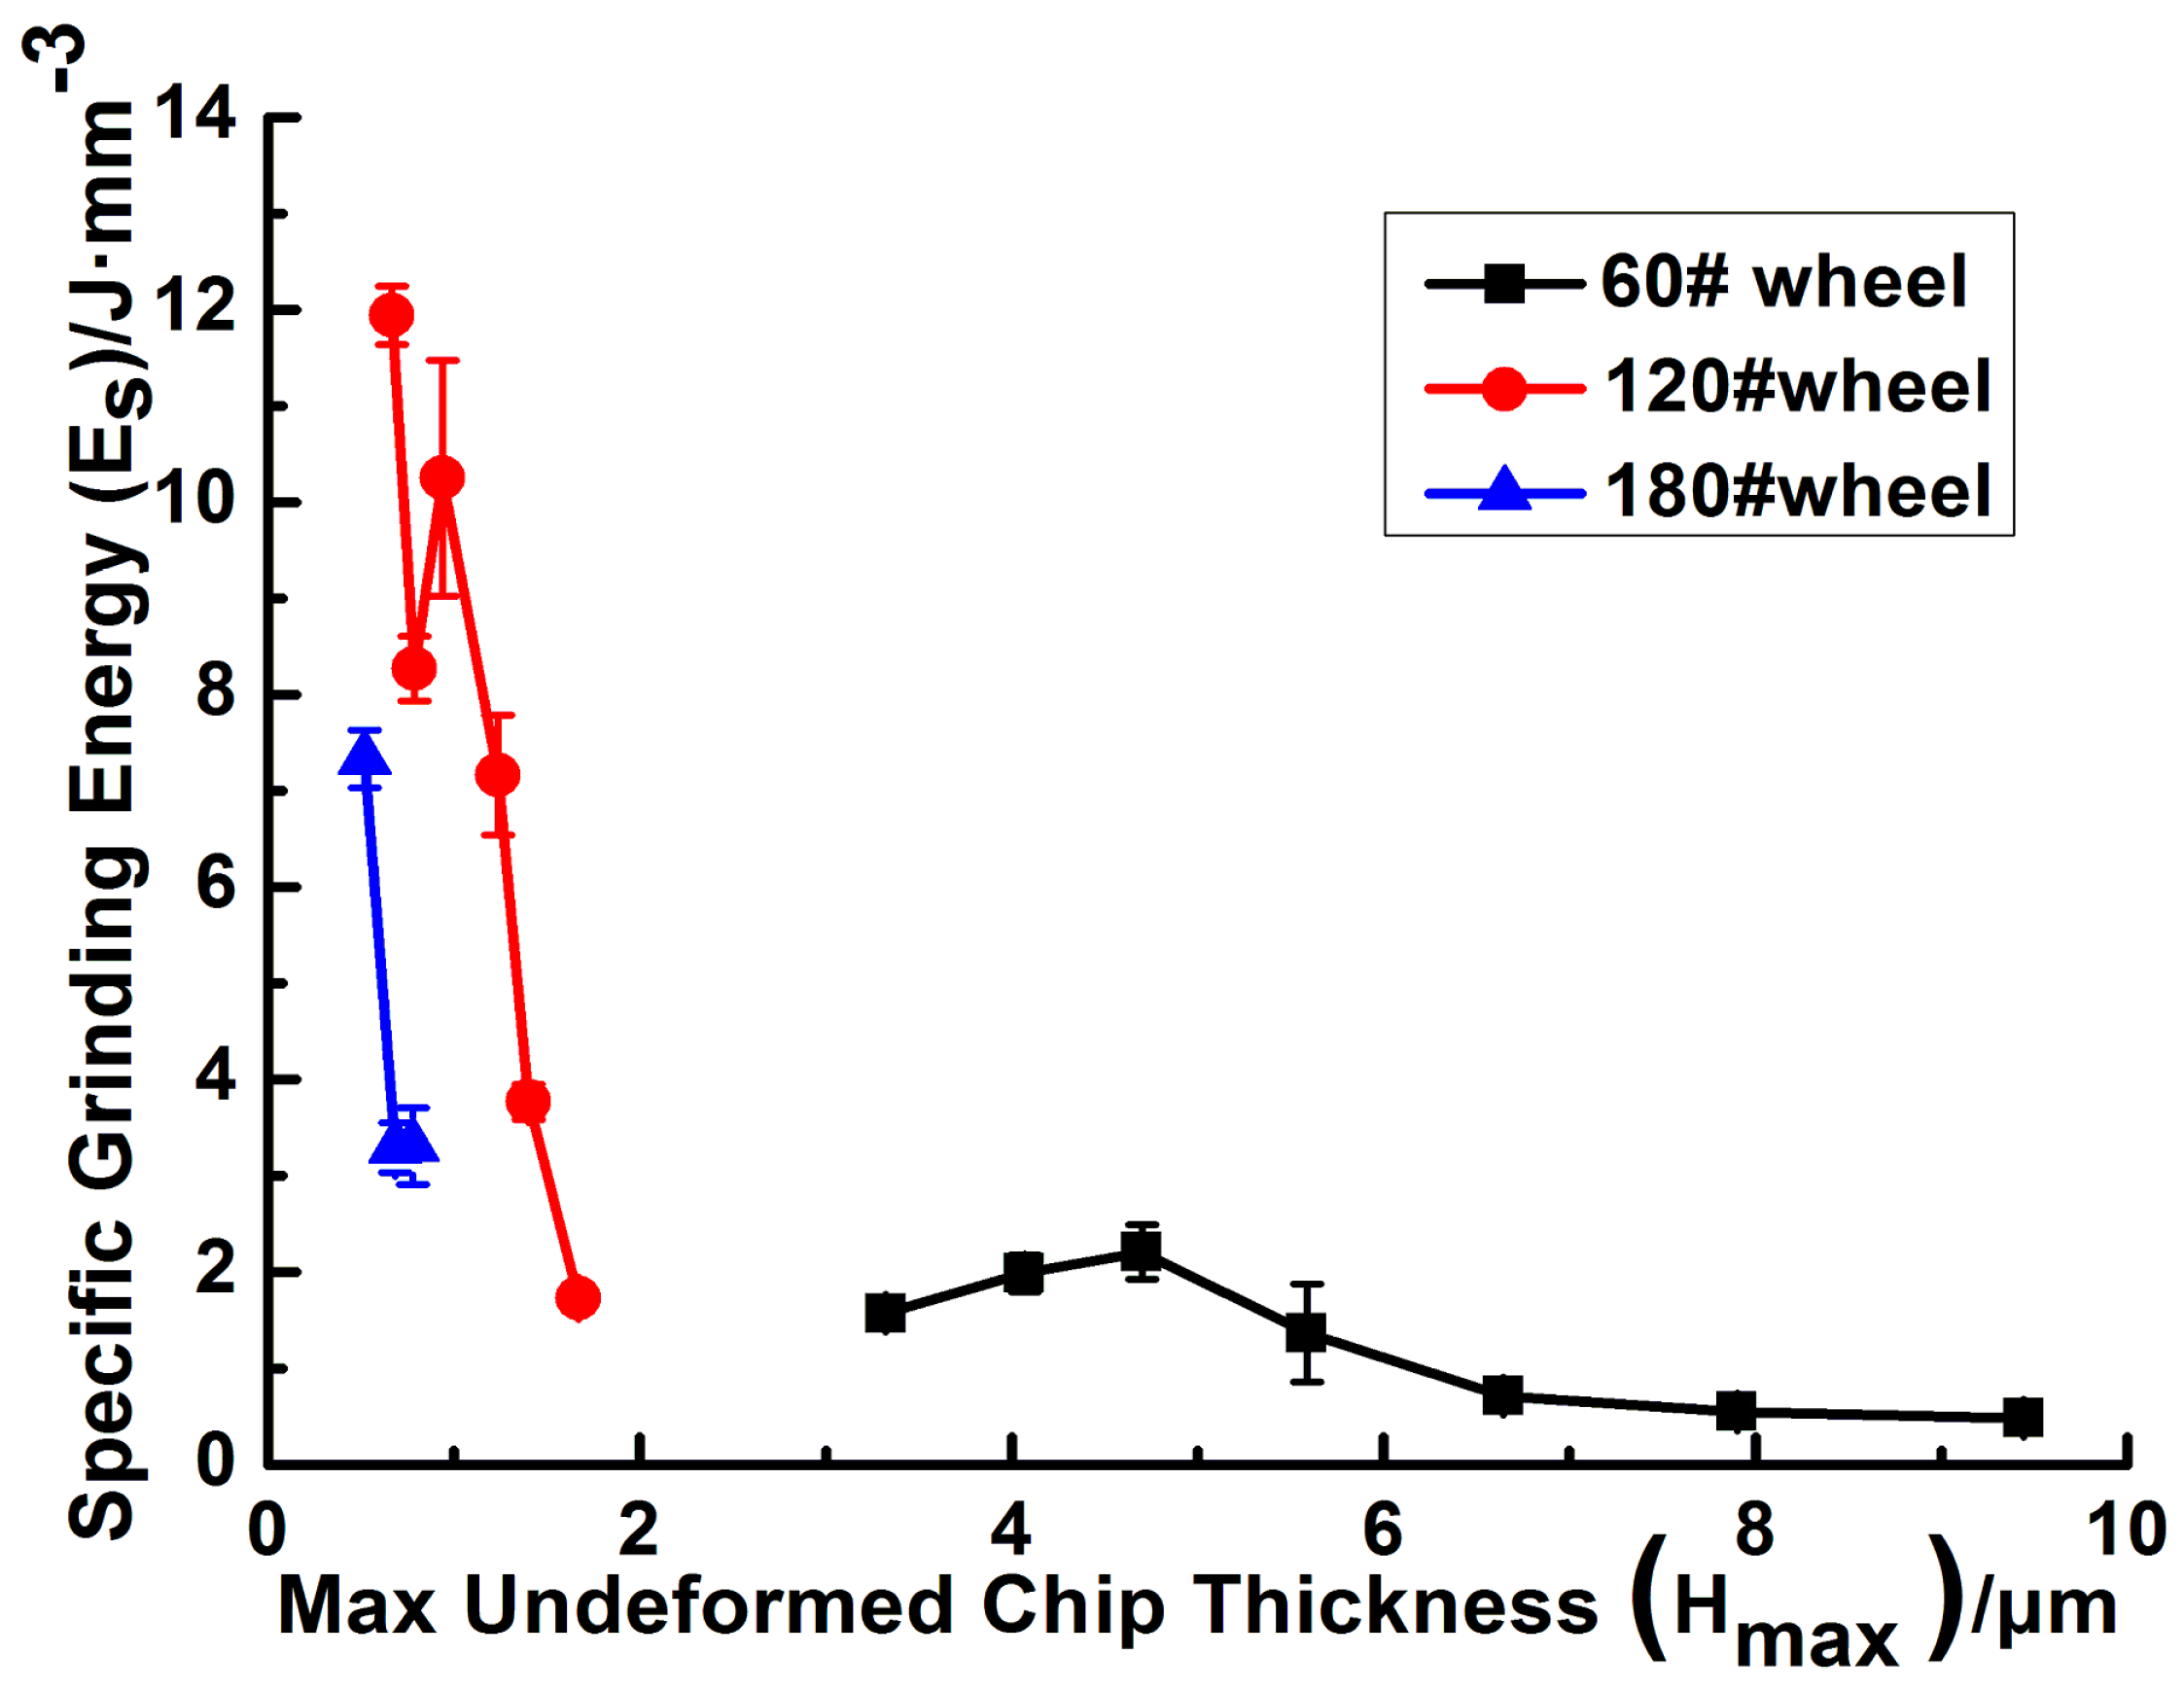
3.2. The Specific Grinding Energy vs. Maximum Undeformed Chip Thickness and SEM Observations

Figure 8. The specific grinding energy of alumina as a function of the maximum undeformed chip thickness with 60#, 120#, and 180# wheels.
Applsci 05 01337 g008
Figure 9. (a) Morphology of alumina in NO.2 experiment (Hmax = 6.64 μm) and (b) an enlarged view of (a).
Applsci 05 01337 g009
Figure 10. (a) Morphology of alumina in NO.17 experiment (Hmax = 0.44 μm) and (b) is an enlarged view of (a).
Applsci 05 01337 g010
The relations between the specific grinding energy and the maximum undeformed chip thickness under three different kinds of wheels are shown in Figure 8. They indicate that grinding energy increases when Hmax decreases. Figure 9a,b shows SEM micrographs of NO.2 experiment and Figure 10a,b shows SEM micrographs of NO.17 experiment.
As we all know, the specific grinding energy includes grinding energy and friction energy [19]. Friction energy is direct proportion to the normal grinding force. Due to the decreasing of single grit normal force with dropping Hmax while it is less than the critical depth, friction energy would decline in theory. Thus, we can get the conclusion that the increasing specific grinding energy is mainly resulted from the increasing grinding energy. From previous studies we know the removal mechanism tends to be ductile removal with the decreasing Hmax. Compared with Figure 8, Figure 10 shows that the proportion of ductile removal is great bigger. In Figure 9a, the intergranular fracture represents a significant share of removal modes. In Figure 9b, intergranular fracture mode is easy to see. In Figure 10, ductile removal and transgranular fracture play an important role. Considering that fracture of alumina grain needs more energy than crystal boundary, transgranular fracture required larger grinding energy compared with intergranular fracture, which resulted in the growing specific energy. As seen in Figure 5, the specific grinding energy tends to be flat when Hmax is larger than approximately 4 μm, which is near to the alumina grain size. That is to say, the critical depth of brittle fracture is relative to grain size. So the larger specific energy with the decreasing maximum undeformed chip thickness indicates the rising proportion of ductile removal and transgranular fraction.
Figure 11. The specific grinding energy per grit of fused silica ceramics as a function of the maximum undeformed chip thickness with 60#, 120#, 180# wheels.
Applsci 05 01337 g011
In Figure 11, several observations should be noted. At the same maximum undeformed chip thickness, a larger mesh size of wheels leads to a smaller specific grinding energy. The specific grinding energy fluctuates frequently as a function of Hmax, which ranges from 0.66 μm to 6 μm. This result is mainly owing to the maldistribution of particles and pores. Sharp changing specific grinding energy can be seen in smaller Hmax, while it tends to be gentle in larger Hmax. Thus we guess, when Hmax is larger than 6 μm, brittle fracture takes precedence.
Compared with Figure 11, non-crystalline ceramics show more irregular changes in specific grinding energy. From the microstructure, many pores can be seen in fused silica and scatter randomly, which results in the irregular grinding energy.

4. Conclusions

In order to talk about the mechanical modeling between crystalline and non-crystalline ceramics, an experiment was conducted to alumina ceramics and fused silica ceramics. Through this experiment and analysis, some conclusions have been derived as below.
(1) The relation between the maximum undeformed chip thickness and grain size of alumina significantly affects the single normal grinding force. If Hmax is less than 3.32 μm, a larger Hmax leads to a larger normal grinding force per grit. In this condition, the result is well reflected by the predictive grinding force model. When Hmax passes 3.32 μm, the normal grinding force as a function of Hmax will not follow the predictive grinding model. A parameter k = 3.32 as a critical depth is proposed to improve the grinding force model which is close to the grain size. We can also get the conclusion that for a given maximum undeformed chip thickness, the smaller the grain of a wheel, the bigger the single-grit force.
(2) For un-crystalline ceramics fused silica, the normal grinding force cannot be predicted by previous mechanical models under brittle removal conditions. The grinding force appears to follow the trend of grinding force modeling in ductile conditions.
(3) The specific energy of alumina increases with decreasing Hmax, which is a result of all grinding parameters. The removal mechanism of polycrystalline ceramics is changing from brittle fracture and interganular fracture to ductile removal and transgranular fracture with decreasing max undeformed chip thickness. It is well reflected by the specific energy. The specific grinding energy tends to be flat when Hmax is larger than approximately 4 μm.
(4) Compared with alumina ceramics, the specific grinding energy of fused silica fluctuates with increasing Hmax when Hmax ranges from 0.66 μm to 6 μm, owing to the porous and non-crystalline microstructure. When Hmax is larger than 6 μm, brittle fracture becomes the mainly removal method.

Acknowledgments

This work is financially supported by the National Science and Technology Major Project of the Ministry of Science and Technology of China (No. 2013ZX04001000-207).

Author Contributions

B.L. conceived the underlying idea of the paper. B.L. and Y.-N.Z. designed the experiment. Y.-N.Z. and J.Y. performed the experiment. J.-J.L. contributed the materials and tools. Y.-N.Z. analyzed the data and wrote the paper. B.L. and X.-F. S. revised the paper.

Conflicts of Interest

The authors declare no conflict of interest.

References

  1. Werner, G. Influence of work material on grinding forces. Ann. CIRP 1978, 27, 243–248. [Google Scholar]
  2. Malkin, S.; Cook, N.H. The wear of grinding wheels: Part 1—Attritious wear. J. Eng. Ind. 1971, 93, 1120–1128. [Google Scholar] [CrossRef]
  3. Xu, H.H.K.; Jahanmir, S.; Ives, L.K. Mechanisms of material removal in abrasive machining of ceramics. Interceram 1998, 47, 380–385. [Google Scholar]
  4. Xu, H.H.K.; Jahanmir, S. Transitions in the mechanism of material removal in abrasive wear of alumina. Wear 1996, 192, 228–232. [Google Scholar] [CrossRef]
  5. Xu, H.H.K.; Jahanmir, S. Microfracture and material removal in scratching of alumina. J. Mater. Sci. 1995, 30, 2235–2247. [Google Scholar] [CrossRef]
  6. Li, L.J.; Fu, J.C. Study on grinding force model. J. Hunan Univ. 1979, 3, 44–55. [Google Scholar]
  7. Li, K.; Liao, W. Modelling of ceramic grinding processes part I. Number of cutting points and grinding forces per grit. J. Mater. Process. Technol. 1997, 65, 1–10. [Google Scholar] [CrossRef]
  8. Hecker, R.L.; Liang, S.Y.; Wu, X.J.; Xia, P.; Jin, D.G.W. Grinding force and power modeling based on chip thickness analysis. Int. J. Adv. Manuf. Technol. 2007, 33, 449–459. [Google Scholar] [CrossRef]
  9. Wang, J.M.; Ye, R.Z.; Tang, Y.P.; Bing, H.Z. Research on the grinding force model of steel 55 during surface grinding with CBN wheel. Diam. Abras. Eng. 2010, 30, 67–70. [Google Scholar]
  10. Agarwal, S.; Rao, P.V. Predictive modeling of force and power based on a new analytical undeformed chip thickness model in ceramic grinding. Int. J. Mach. Tools Manuf. 2013, 65, 68–78. [Google Scholar] [CrossRef]
  11. Agarwal, S.; Rao, P.V. Predictive modeling of undeformed chip thickness in ceramic grinding. Int. J. Mach. Tools Manuf. 2012, 56, 59–68. [Google Scholar] [CrossRef]
  12. Xie, G.Z.; Shang, Z.T.; Sheng, X.M.; Wu, Y.; Yu, J.W. Grinding force modeling for high-speed deep grinding of engineering ceramics. J. Mech. Eng. 2011, 47, 169–176. [Google Scholar] [CrossRef]
  13. Xu, H.H.K.; Jahanmir, S. Effect of grain size on scratch damage and hardness of alumina. J. Mater. Sci. Lett. 1995, 14, 736–739. [Google Scholar] [CrossRef]
  14. Klecka, M.; Subhash, G. Grain size dependence of scratch-induced damage in alumina ceramics. Wear 2008, 265, 612–619. [Google Scholar] [CrossRef]
  15. Jin, Z.H. Engineering Ceramics; Xi′an Jiao Tong University Press: Xi′an, China, 2000; p. 385. [Google Scholar]
  16. Mayer, J.E.; Fang, G.P. Effect of grinding parameters on surface finish of ground ceramics. CIRP Ann. Manuf. Technol. 1995, 44, 279–282. [Google Scholar] [CrossRef]
  17. Zhu, A.J. Research on Surface Grinding of SCFS with Diamond Wheel. Master Thesis, Tianjin University, China, 2005. [Google Scholar]
  18. Li, W.; Wang, Y.; Fan, S.H.; Xu, J.F. Wear of diamond grinding wheels and material removal rate of silicon nitrides under different machining conditions. Mater. Lett. 2007, 61, 54–58. [Google Scholar] [CrossRef]
  19. Kannappan, S.; Malkin, S. Effects of grain size and operating parameters on the mechanics of grinding. J. Eng. Ind. 1972, 94, 833–842. [Google Scholar] [CrossRef]

