Article

Dispersion of Functionalized Silica Micro- and Nanoparticles into Poly(nonamethylene Azelate) by Ultrasonic Micro-Molding

Chemical Engineering Department, Polytechnic University of Catalonia, Av. Diagonal 647, Barcelona E-08028, Spain
*
Author to whom correspondence should be addressed.
Appl. Sci. 2015, 5(4), 1252-1271; https://doi.org/10.3390/app5041252
Submission received: 23 September 2015 / Revised: 9 November 2015 / Accepted: 10 November 2015 / Published: 17 November 2015
(This article belongs to the Special Issue Acoustic and Elastic Waves: Recent Trends in Science and Engineering)

Abstract

:
Ultrasound micro-molding technology has proved useful in processing biodegradable polymers with minimum material loss. This makes this technology particularly suitable for the production of biomedical microdevices. The use of silica (SiO2) nanoparticles is also interesting because of advantages like low cost and enhancement of final properties. Evaluation of the capacity to create a homogeneous dispersion of particles is crucial. Specifically, this feature was explored taking into account micro- and nano-sized silica particles and a biodegradable polyester derived from 1,9-nonanodiol and azelaic acid as a matrix. Results demonstrated that composites could be obtained with up to 6 wt. % of silica and that no degradation occurred even if particles were functionalized with a compatibilizer like (3-aminopropyl) triethoxysilane. Incorporation of nanoparticles should have a great influence on properties. Specifically, the effect on crystallization was evaluated by calorimetric and optical microscopy analyses. The overall crystallization rate was enhanced upon addition of functionalized silica nanospheres, even at the low percentage of 3 wt. %. This increase was mainly due to the ability of nanoparticles to act as heterogeneous nuclei during crystallization. However, the enhancement of the secondary nucleation process also played a significant role, as demonstrated by Lauritzen and Hoffmann analysis.

Graphical Abstract

1. Introduction

Ultrasonic waves are an energy source that has been employed as a plastic welding procedure for over 40 years because it is clean, efficient, and fast. In fact, absorption of vibration energy leads to polymer friction, which may result in local melting of the sample. The first descriptions of the potential use of ultrasonic waves in plastic powder molding were given by Fairbanks [1] and Crawford et al. [2]. Since then different efforts have been made to develop the great potential of this technology. Thus, ultrasonic hot embossing appears as a new, interesting process for fast and low-cost production of microsystems from polymeric materials [3,4,5]. A wide variety of microdevices (e.g., micro mixers, flow sensors or micro whistles) have been prepared by this technology demonstrating its feasibility.
The use of an ultrasonic source has also been proposed to achieve both the plasticization of the material and the direct injection of the molten material [6,7,8]. This provides a new micro-molding technology that can be a serious alternative to conventional micro-injection techniques. Micro-molding equipment (Figure 1) is mainly composed of a plasticizing chamber, a controller, a mold, an ultrasonic generator that produces high frequency (30 kHz) from line voltage, and a resonance stack or acoustic unit connected to the generator. This unit consists of: (a) a converter (piezoelectric transducer), where high frequency signals from the generator are transmitted through piezoelectric crystals that expand and contract at the same rate as electrical oscillation; (b) a booster, which amplifies or reduces mechanical oscillation (from 0 to 137.5 μm); and (c) a sonotrode, which transfers this oscillation to the polymer sample in the plasticizing chamber by applying a force (from 100 to 500 N).
Figure 1. Scheme of the main parts of the ultrasound micro-molding machine.
Applsci 05 01252 g001
The heat build-up caused by the resulting friction heat melts the polymer, which flows into the mold cavities through their feeding channels under the sonotrode pressure. A controller regulates the main processing parameters: oscillation time (e.g., from 0.5 to 10 s), molding force, and amplitude of the ultrasonic wave.
Despite the potential advantages of using high-intensity ultrasonic waves as an energy source, it should be pointed out that these waves have not only physical effects on the melt rheology of the polymer but also chemical effects on the polymer chain as a result of cavitation and the high temperature that can be achieved inside the plasticizing chamber [9,10,11,12]. Therefore, optimization of processing parameters to obtain minimally degraded samples is an essential step in applying the new micro-molding technology. In this sense, we have recently found that it is possible to establish appropriate conditions for biodegradable polymers that could be interesting for the production of biomedical devices such as polylactide (PLA) [13], poly(butylene succinate) (PBS) [14], and poly(nonamethylene azelate) (PE99) [15]. Degradation logically increases with irradiation time and amplitude, but a minimum period is necessary to ensure complete injection into the mold, as well as a minimum amount of vibration energy. Severe degradation can also occur at low ultrasonic amplitude upon application of a high molding force because of chain scissions caused by mechanical shear stress. Nevertheless, a minimum force must be applied to make melt polymer flow and mold cavity filling feasible.
The ability to provide good dispersion is another important reason to evaluate the potential of micro-molding technology. One possible application could involve the incorporation of compounds with added value (e.g., drugs with pharmacological activity) or even of nanoparticles that lead to a large surface area to volume ratio. It is well known that this feature may considerably improve the properties of the material (e.g., physical, chemical, and mechanical) with respect to the properties attained with conventionally filled composites [16,17,18].
Ultrasound micro-molding was recently found to be effective in obtaining nanocomposites with the final form required for a selected application, a homogeneous clay distribution up to a load of 6 wt. % and, more interestingly, an exfoliated structure without the need for a compatibilizer between the organic polymer and the inorganic silicate clay [17,18]. Furthermore, polymer degradation was minimized by adding pristine clay. These promising results were achieved using PLA, PBS, and PE99 as biodegradable matrices and montmorillonites like neat N757 and C20A, C25A, and N848 organo-modified clays. Incorporation of nanoparticles also had a remarkable influence on the crystallization kinetics of the polymer matrix. Interestingly, significant differences were found depending on the polymer type (e.g., PLA or PE99) despite obtaining similar exfoliated structures [18].
The use of silica (SiO2) nanoparticles to enhance material properties is also of high interest due to their intrinsic advantages (low cost, nontoxicity, high modulus, and ability to modify chemical surface characteristics) [19,20]. Thus, properties can be considerably improved when particles with appropriate surface functionalization to enhance interfacial interactions are well dispersed in the polymer matrix [21,22,23].
Silica particles with sizes suitable for biomedical applications can be easily prepared from base-catalyzed sol-gel processes [24]. They use organosilane precursors (e.g., tetraethoxysilane), which lead to the formation of a new phase (sol) by hydrolysis and condensation reactions. Subsequently, the condensation of colloidal particles leads to the gel phase. Silica particles can be easily functionalized, giving rise to a high versatility. In fact, functional groups can be attached through covalent bonds during condensation or even after a later grafting process [25].
The present work evaluates the applicability of ultrasound micro-molding technology to prepare dispersion of silica micro- and nanoparticles in a biodegradable polymer matrix that was recently considered for preparation of clay nanocomposites (i.e., PE99). The effect of silica nanoparticle addition on crystallization kinetics is also studied since they should affect nucleation and crystal growth, as recently determined for nanocomposites based on poly(ethylene oxide) [26].

2. Experimental Section

2.1. Materials

Poly(nonamethylene azelate) (PE99) was synthesized by thermal polycondensation of azelaic acid with an excess of 1,9-nonanediol (2.2:1 molar ratio), as shown in Figure 2a. Titanium tetrabutoxyde was used as a catalyst and the reaction was first performed in a nitrogen atmosphere at 150 °C for 6 h and then in a vacuum at 180 °C for 18 h. The polymer was purified by precipitation with ethanol of a chloroform solution (10 wt. %). The average molecular weight and polydispersity index determined by GPC and using poly(methyl methacrylate) standards were 13,200 g/mol and 3.1, respectively.
Figure 2. Synthesis schemes for PE99 (a); silica spheres (b); and functionalization process (c).
Applsci 05 01252 g002
Preparation of silica micro/nanoparticles (Figure 2b): Deionized water (0.6 mL) and 1.2 mL of a 28% aqueous ammonium hydroxide (1.2 mL) (Aldrich, Madrid, Spain) were added to a flask of 100 mL containing absolute ethanol (50 mL). The mixture was stirred vigorously for 20 min at room temperature using a magnetic agitator. Next 1.2 mL of tetraethoxysilane (Aldrich, Madrid, Spain) were quickly added and the resultant solution was purged with dry nitrogen and stirred for another 16 h. Spheres with a homogeneous diameter close to 600 nm were obtained after filtration. The same protocol except for increasing the stirring speed to 250–1000 rpm was employed to prepare nanoparticles with diameters close to 25 nm.
Functionalization of silica micro/nanoparticles (Figure 2c): 1 g of micro/nanospheres previously dried under a vacuum was introduced into a vessel together with 66 μL of pure ethanol. The mixture was sonicated for 15 min to enhance dispersion using a VWR Ultrasonic cleaner bath (UWR International, New York, NY, USA) at 100 watts, and subsequently 66 μL of ammonium hydroxide was added under stirring for 15 min. Finally, 297 μL of (3-aminopropyl) triethoxysilane (AMPS) was quickly added and the reaction was allowed to progress under stirring for 24 h at room temperature. The resulting solid was centrifuged, repeatedly washed with ethanol, and vacuum dried.
Nanocomposites will be denoted by polymer abbreviation, size (micro or nano), and wt. % of added silica (e.g., PE99-M 6 and PE99-N 6 indicate composites having 6 wt. % of micro- and nanospheres, respectively).

2.2. Micro-Molding Equipment

A prototype Ultrasound Molding Machine (Sonorus®, Ultrasion S.L., Barcelona, Spain) was employed. The apparatus was equipped with a digital ultrasound generator from Mecasonic (1000 W–30 kHz, Barcelona, Spain) a controller (3010 DG digital system, Mecasonic, Barcelona, Spain), a converter, an acoustic unit, and an electric servomotor control (Berneker and Rainer, Barcelona, Spain) dotted with software from Ultrasion S.L. Mold was thermally controlled and designed to prepare eight test specimens. Dimensions of these specimens were 1.5 × 0.1 × 0.1 cm3 and followed IRAM-IAS-U500-102/3 standards.

2.3. Measurements

Molecular weight was estimated by gel permeation chromatography (GPC) using a liquid chromatograph (Shimadzu, model LC-8A, Tokyo, Japan) equipped with an Empower computer program (Waters, Massachusetts, MA, USA). A PL HFIP gel column (Polymer Lab, Agilent Technologies Deutschland GmbH, Böblingen, Germany) and a refractive index detector (Shimadzu RID-10A) were employed. The polymer was dissolved and eluted in 1,1,1,3,3,3-hexafluoroisopropanol containing CF3COONa (0.05 M) was employed as solvent and elution medium. Flow rate was 0.5 mL/min, the injected volume 100 μL, and the sample concentration 2 mg/mL. Polymethyl methacrylate standards were employed to determine the number and weight average molecular weights and molar-mass dispersities.
A Focused Ion Beam Zeiss Neon40 microscope (Oberkochen, Germany) operating at 5 kV was employed to get SEM micrographs of micro-molded specimens. Carbon coating was accomplished with a Mitec K950 Sputter Coater (Oberkochem, Germany) was used to coat all samples, which were then viewed at an accelerating voltage of 5 kV.
A FTIR 4100 Jasco spectrophotometer dotted with an attenuated total reflectance accessory (Specac MKII Golden Gate Heated Single Reflection Diamond ATR, Jasco International Co. Ltd., Tokyo, Japan) and a thermal controller was employed to get the FTIR spectra. Samples were placed in an attenuated total reflectance accessory with thermal control and a diamond crystal.
X-ray photoelectron spectroscopy (XPS) was performed with a SPECS system (Berlin, Germany) dotted with an XR50 source of Mg/Al (1253 eV/1487 eV) operating at 150 W. Analyses were performed in a SPECS system equipped with a high intensity twin-anode X-ray source XR50 of Mg/Al (1253 eV/1487 eV) operating at 150 W. A Phoibos 150 MCD-9 XP detector (Berlin, Germany) was employed. The overview spectra were taken with an X-ray spot size of 650 and pass energy of 25 eV in 0.1 eV steps at a pressure below 6 × 10⁻⁹ mbar. Surface composition was determined through the N 1s and Si 2p peaks at binding energies of 399.2 and 103.2 eV, respectively.
Distribution of micro/nanoparticles in the composites was evaluated by means of a Philips TECNAI 10 electron microscope (Philips Electron Optics, Eindhoven, Holland) at an accelerating voltage of 80 kV. Samples were prepared by embedding the nanocomposite specimens. A low-viscosity, modified Spurr epoxy resin was employed to embed the specimens before curing and cutting in small sections. A Sorvall Porter-Blum microtome (New York, NY, USA) equipped with a diamond knife was employed in this case. The thin sections were collected in a trough filled with water and lifted onto carbon-coated copper grids.
Thermal degradation was performed in a Q50 thermogravimetric analyzer of TA Instruments (TA Instruments, New Castle, DE, USA). Experiments were carried out at a heating rate of 10 °C/min with 5 mg samples and under a flow of dry nitrogen.
Growth rates of spherulites were measured by optical microscopy using a Zeiss Axioscop 40 Pol light polarizing microscope (Oberkochen, Germany). This was equipped with a Linkam temperature control system configured by a THMS 600 heating and freezing stage connected to an LNP 94 liquid nitrogen system. Spherulites were isothermally crystallized at the selected temperature from homogeneous melt thin films. These were prepared by melting 1 mg of the polymer between microscope slides. Subsequently, small sections of the obtained thin films were pressed between two cover slides for microscopy observations. Samples were kept at the hot stage at 90 °C for 5 min to eliminate sample history effects, and then rapidly cooled to the selected temperatures. A Zeiss AxiosCam MRC5 digital camera (Munich, Germany) was employed to follow the diameter evolution of spherulites by taking micrographs at different times. Nucleation was evaluated by counting the number of active nuclei that appeared in the micrographs. The sign of spherulite birefringence was determined by means of a first-order red tint plate placed under crossed polarizers.
Differential scanning calorimetry was performed with a TA instrument Q100 series (TA Instruments, New Castle, DE, USA) with Tzero technology and equipped with a refrigerated cooling system (RCS). Crystallization kinetics experiments were conducted under a flow of dry nitrogen with a sample weight around 5 mg. Calibration was performed with indium. Studies were carried out according the following protocol: Samples were firstly heated (20 °C/min) up to 25 °C above their melting temperature, subsequently held at this temperature for 5 min to eliminate the thermal history, and finally cooled to the selected temperature at a rate of 50 °C/min. Samples were kept at the isothermal temperature until baseline was reached. Finally, a new heating run (20 °C) was performed in order to determine the equilibrium melting temperature of samples.

3. Results and Discussion

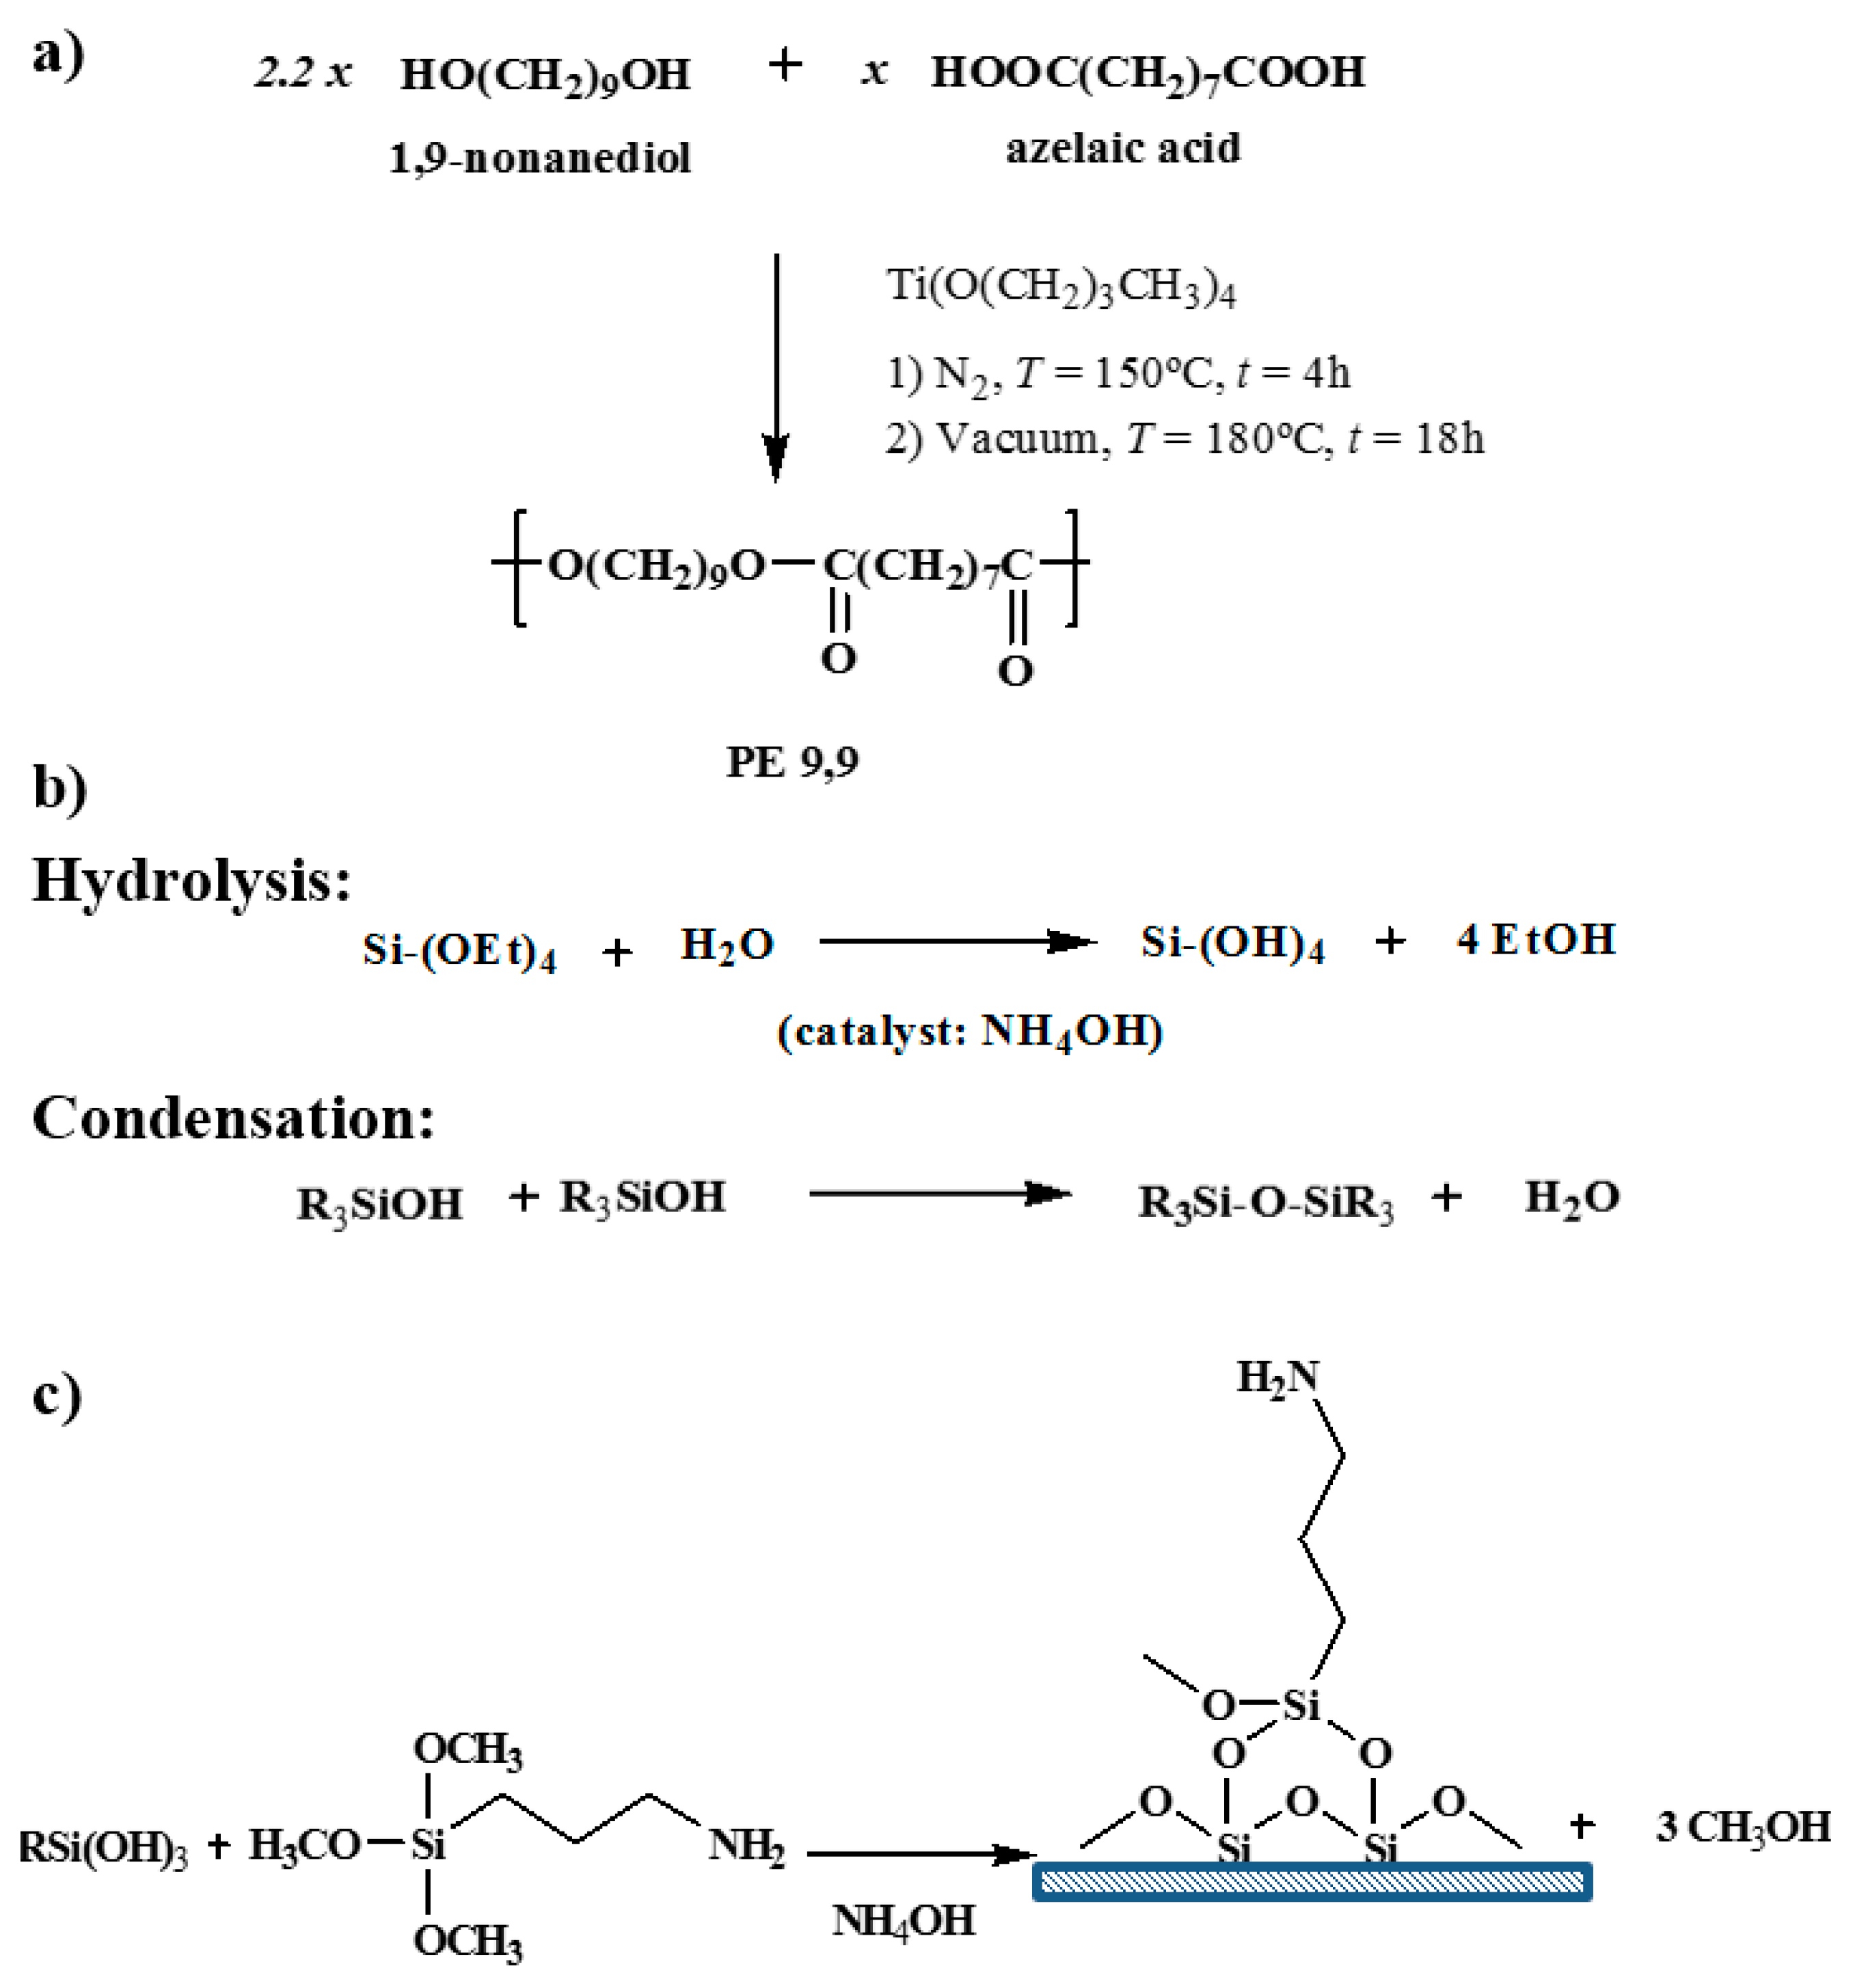
3.1. Characterization of Functionalized Silica Particles

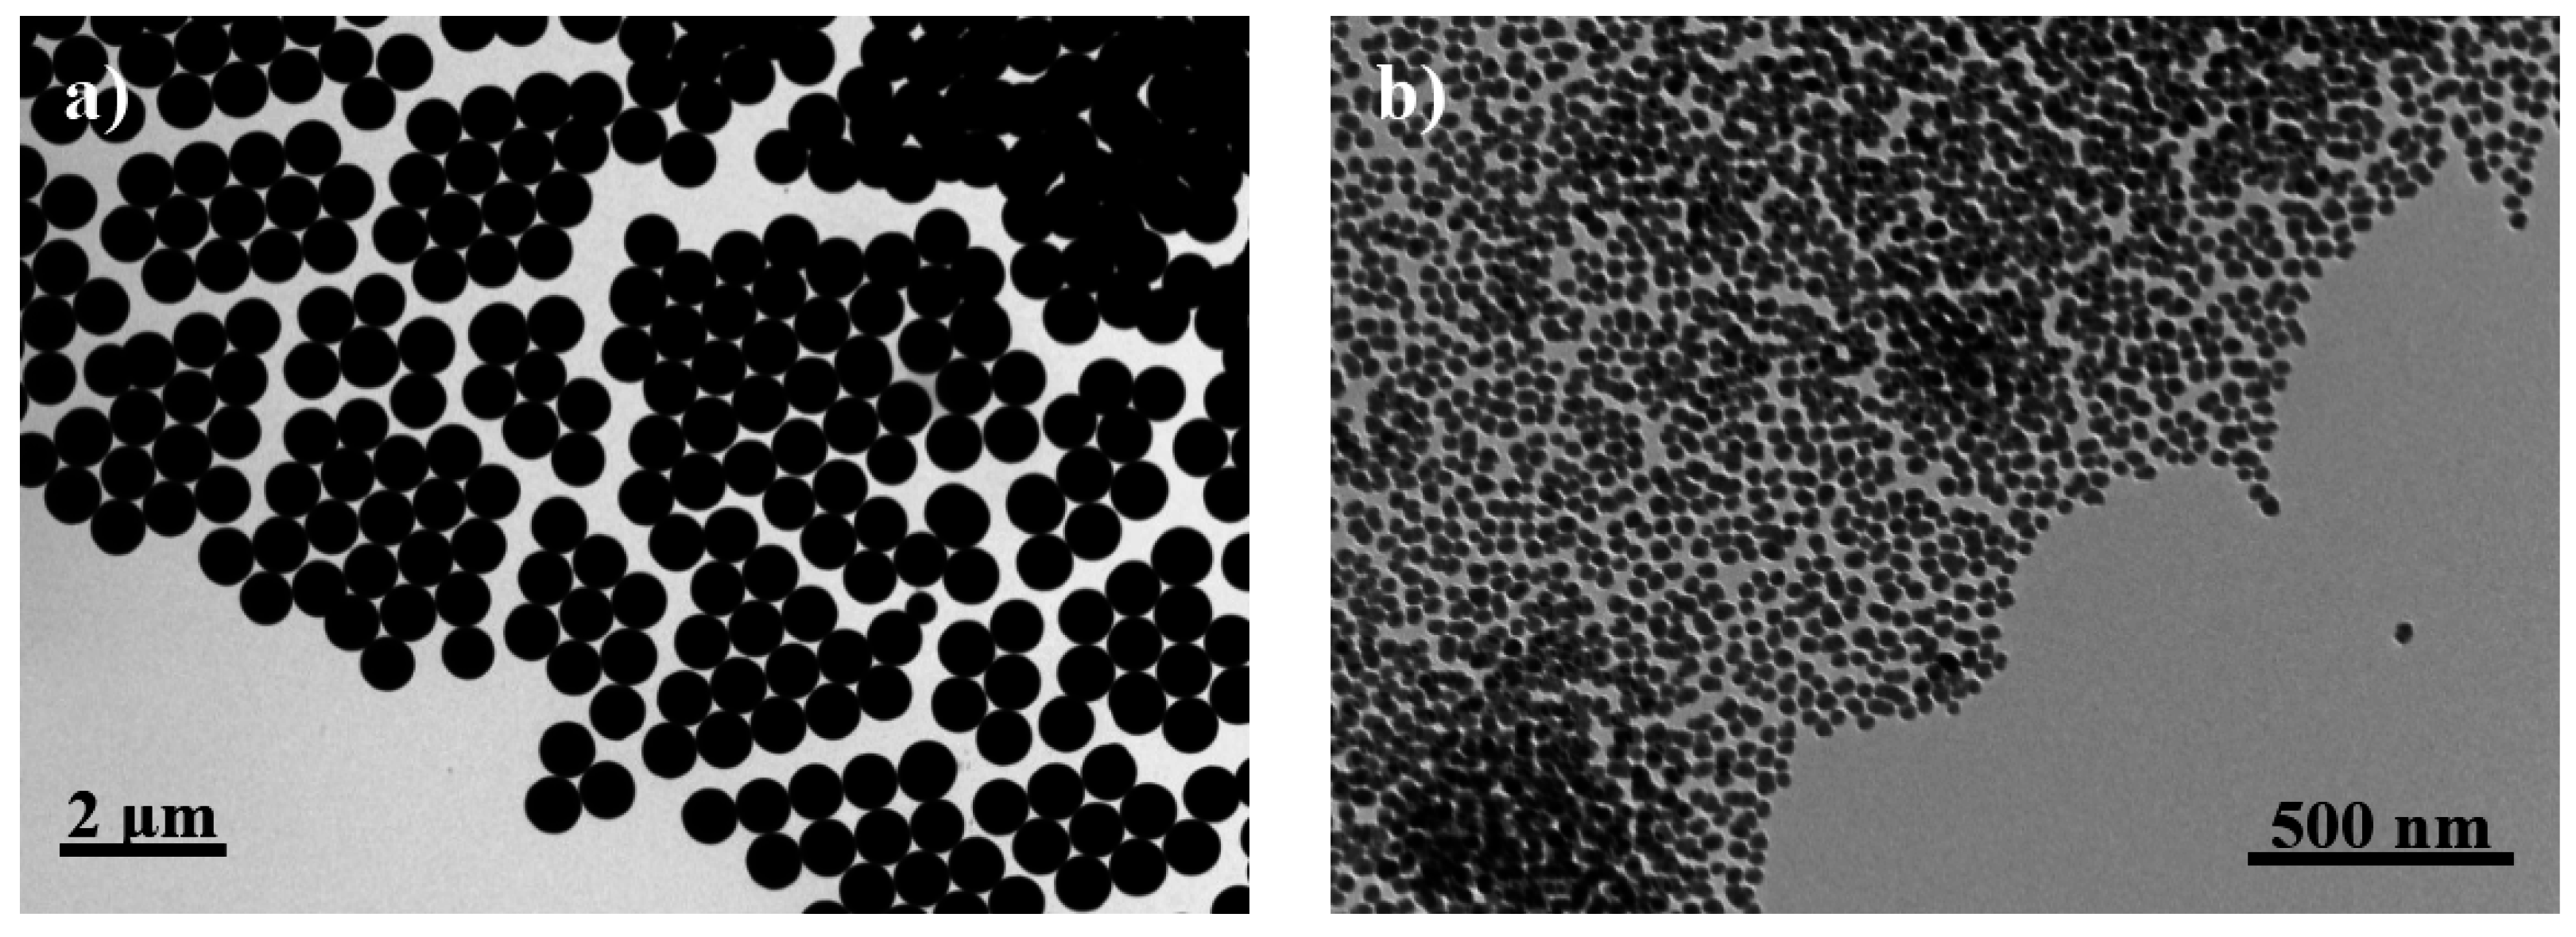
Silica particles were effectively prepared using tetraethoxysilane as a precursor. TEM micrographs clearly revealed a highly regular spherical form (Figure 3a) for silica particles obtained at a low stirring speed. These particles showed a highly homogeneous diameter that varied in a narrow range (i.e., between 570 and 650 nm). Particles were slightly more irregular in form (Figure 3b) when prepared at a higher stirring speed. Diameter size was considerably reduced but a homogeneous distribution could still be observed (i.e., values were always within the 20–30 nm interval). The two kinds of silica preparations will be designated as micro (M) and nano (N) particles.
Figure 3. TEM micrographs of functionalized microspheres (a); and nanospheres (b).
Applsci 05 01252 g003
Figure 4. 
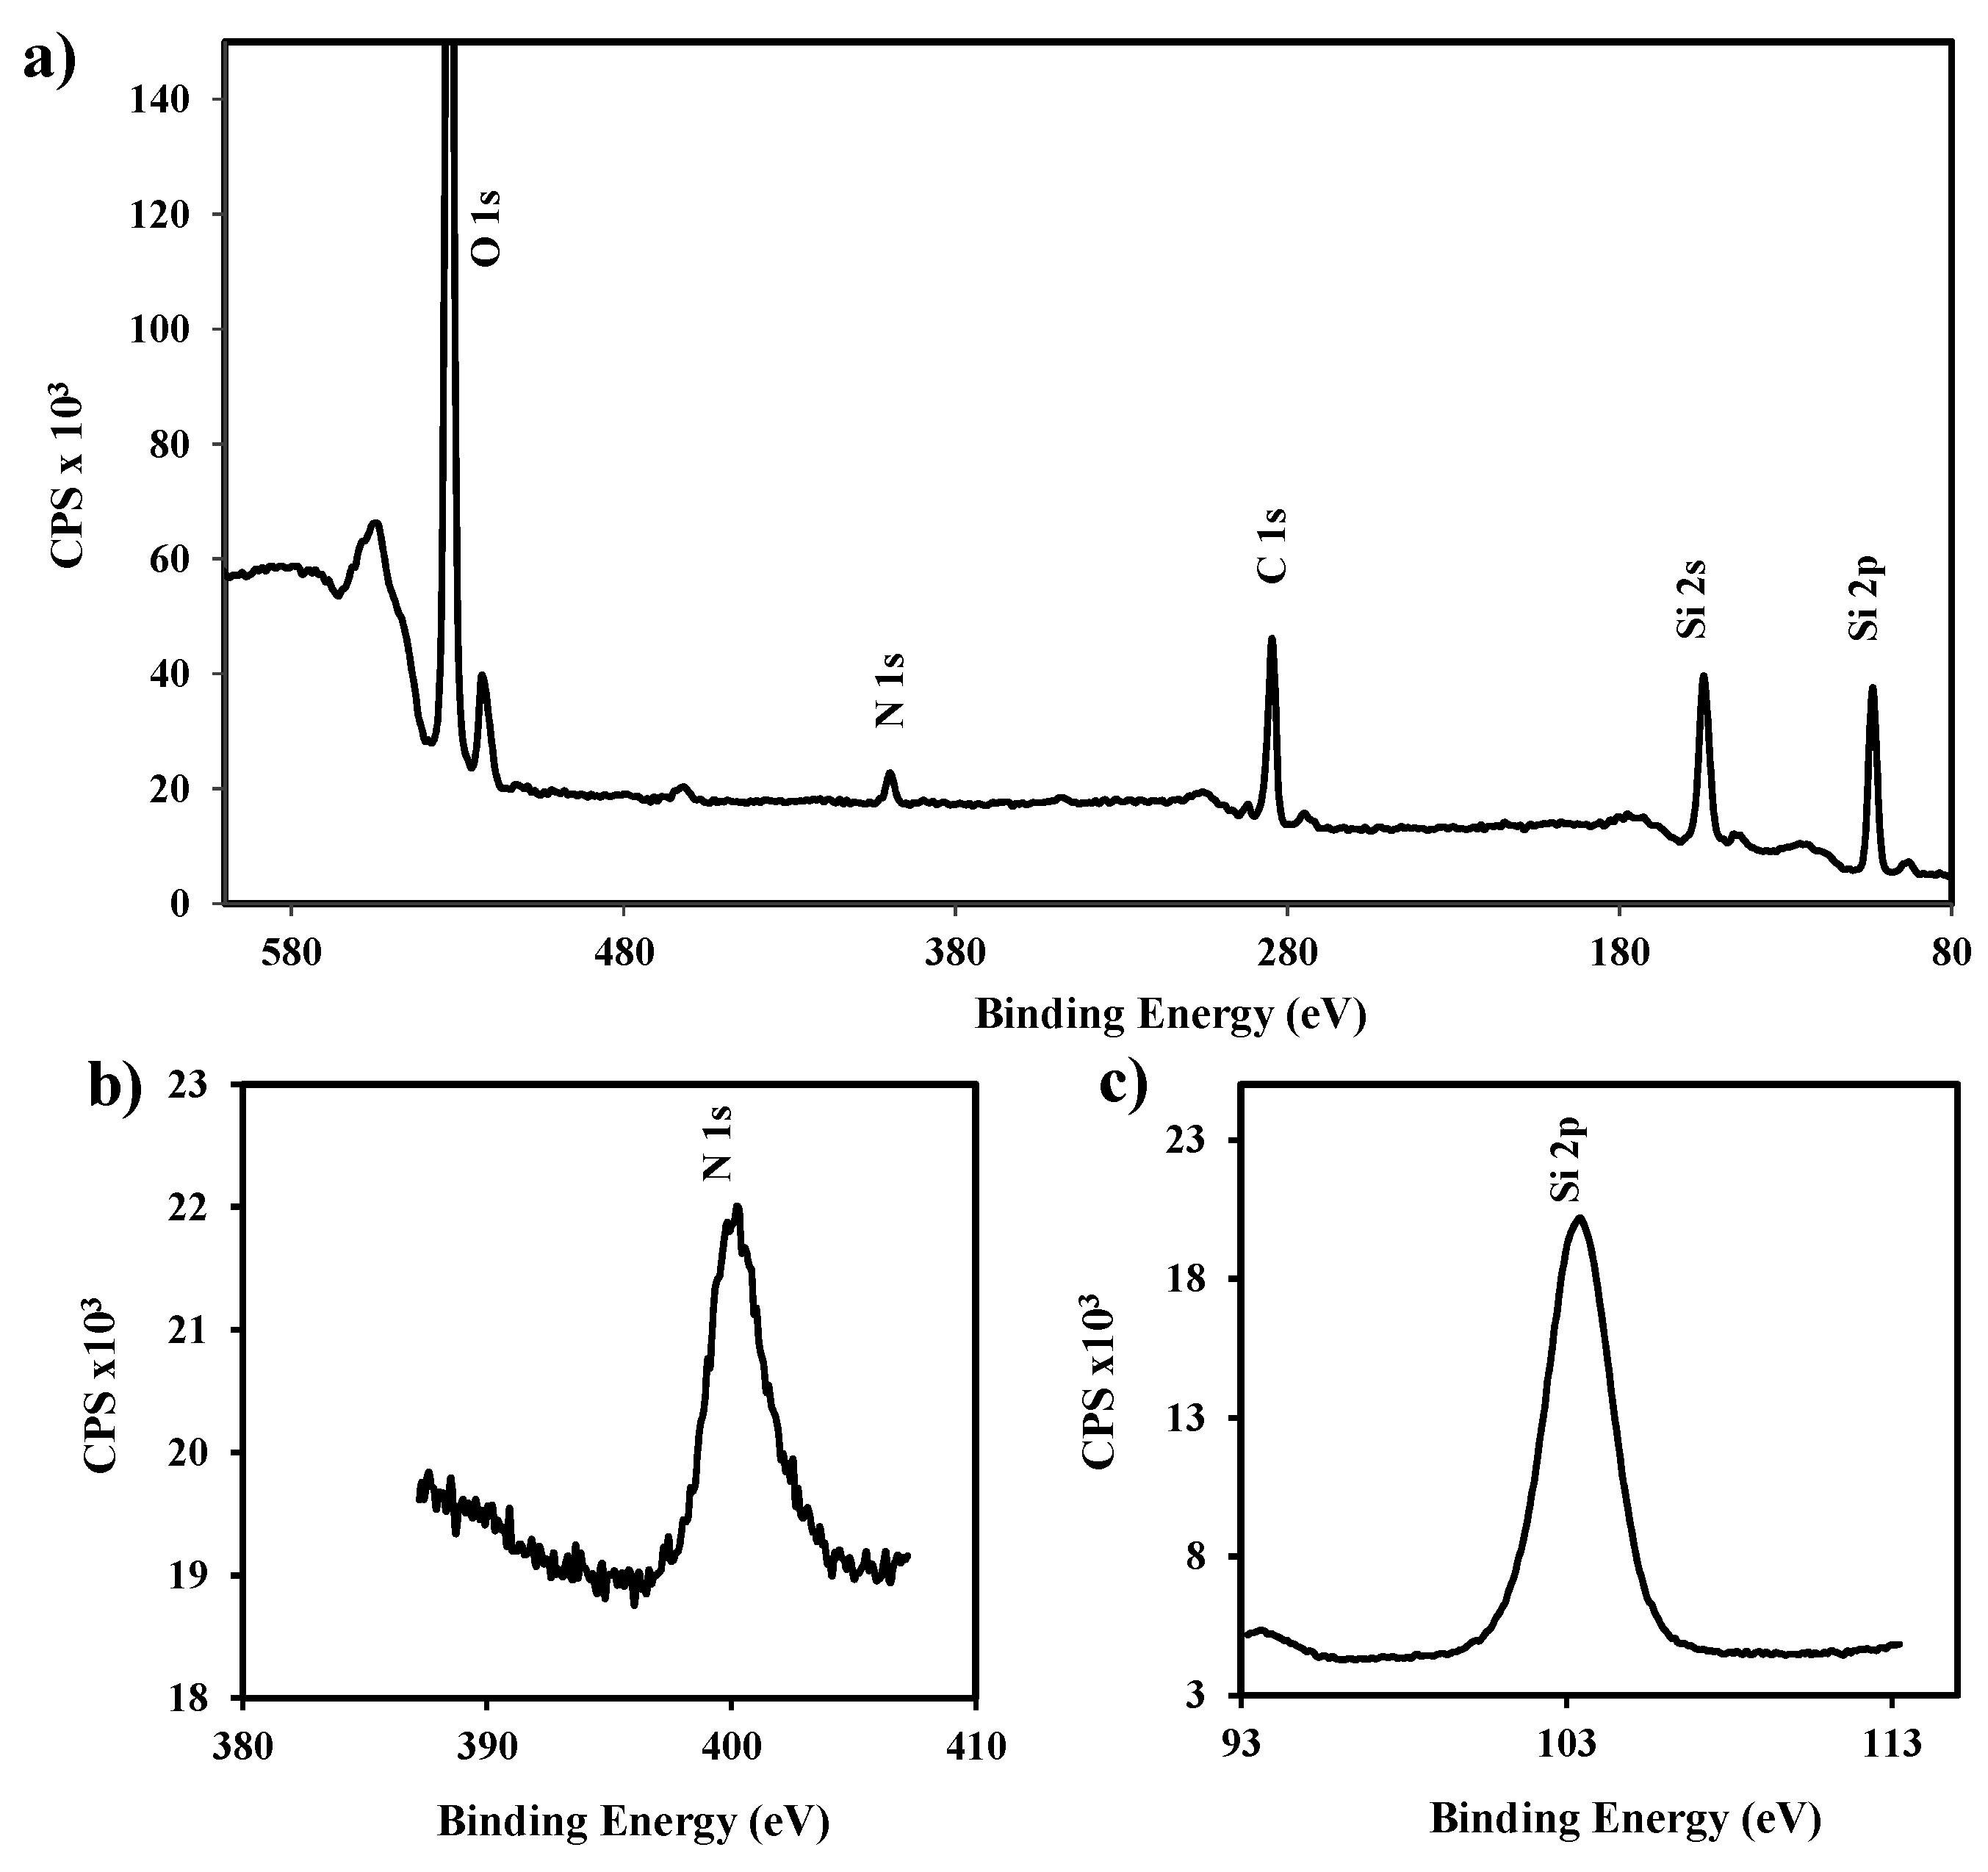
Full scale XPS spectra (a) and details corresponding to silicon (b) and nitrogen (c) XPS signals detected in the functionalized silica nanoparticles.
Applsci 05 01252 g004
Surface functionalization by reaction with (3-aminopropyl) triethoxysilane was verified by analysis of XPS spectra (Figure 4), which allowed for determining a ratio between N and Si atoms of close to 8% (i.e., 8.8% and 7.3% for micro- and nanoparticles, respectively).
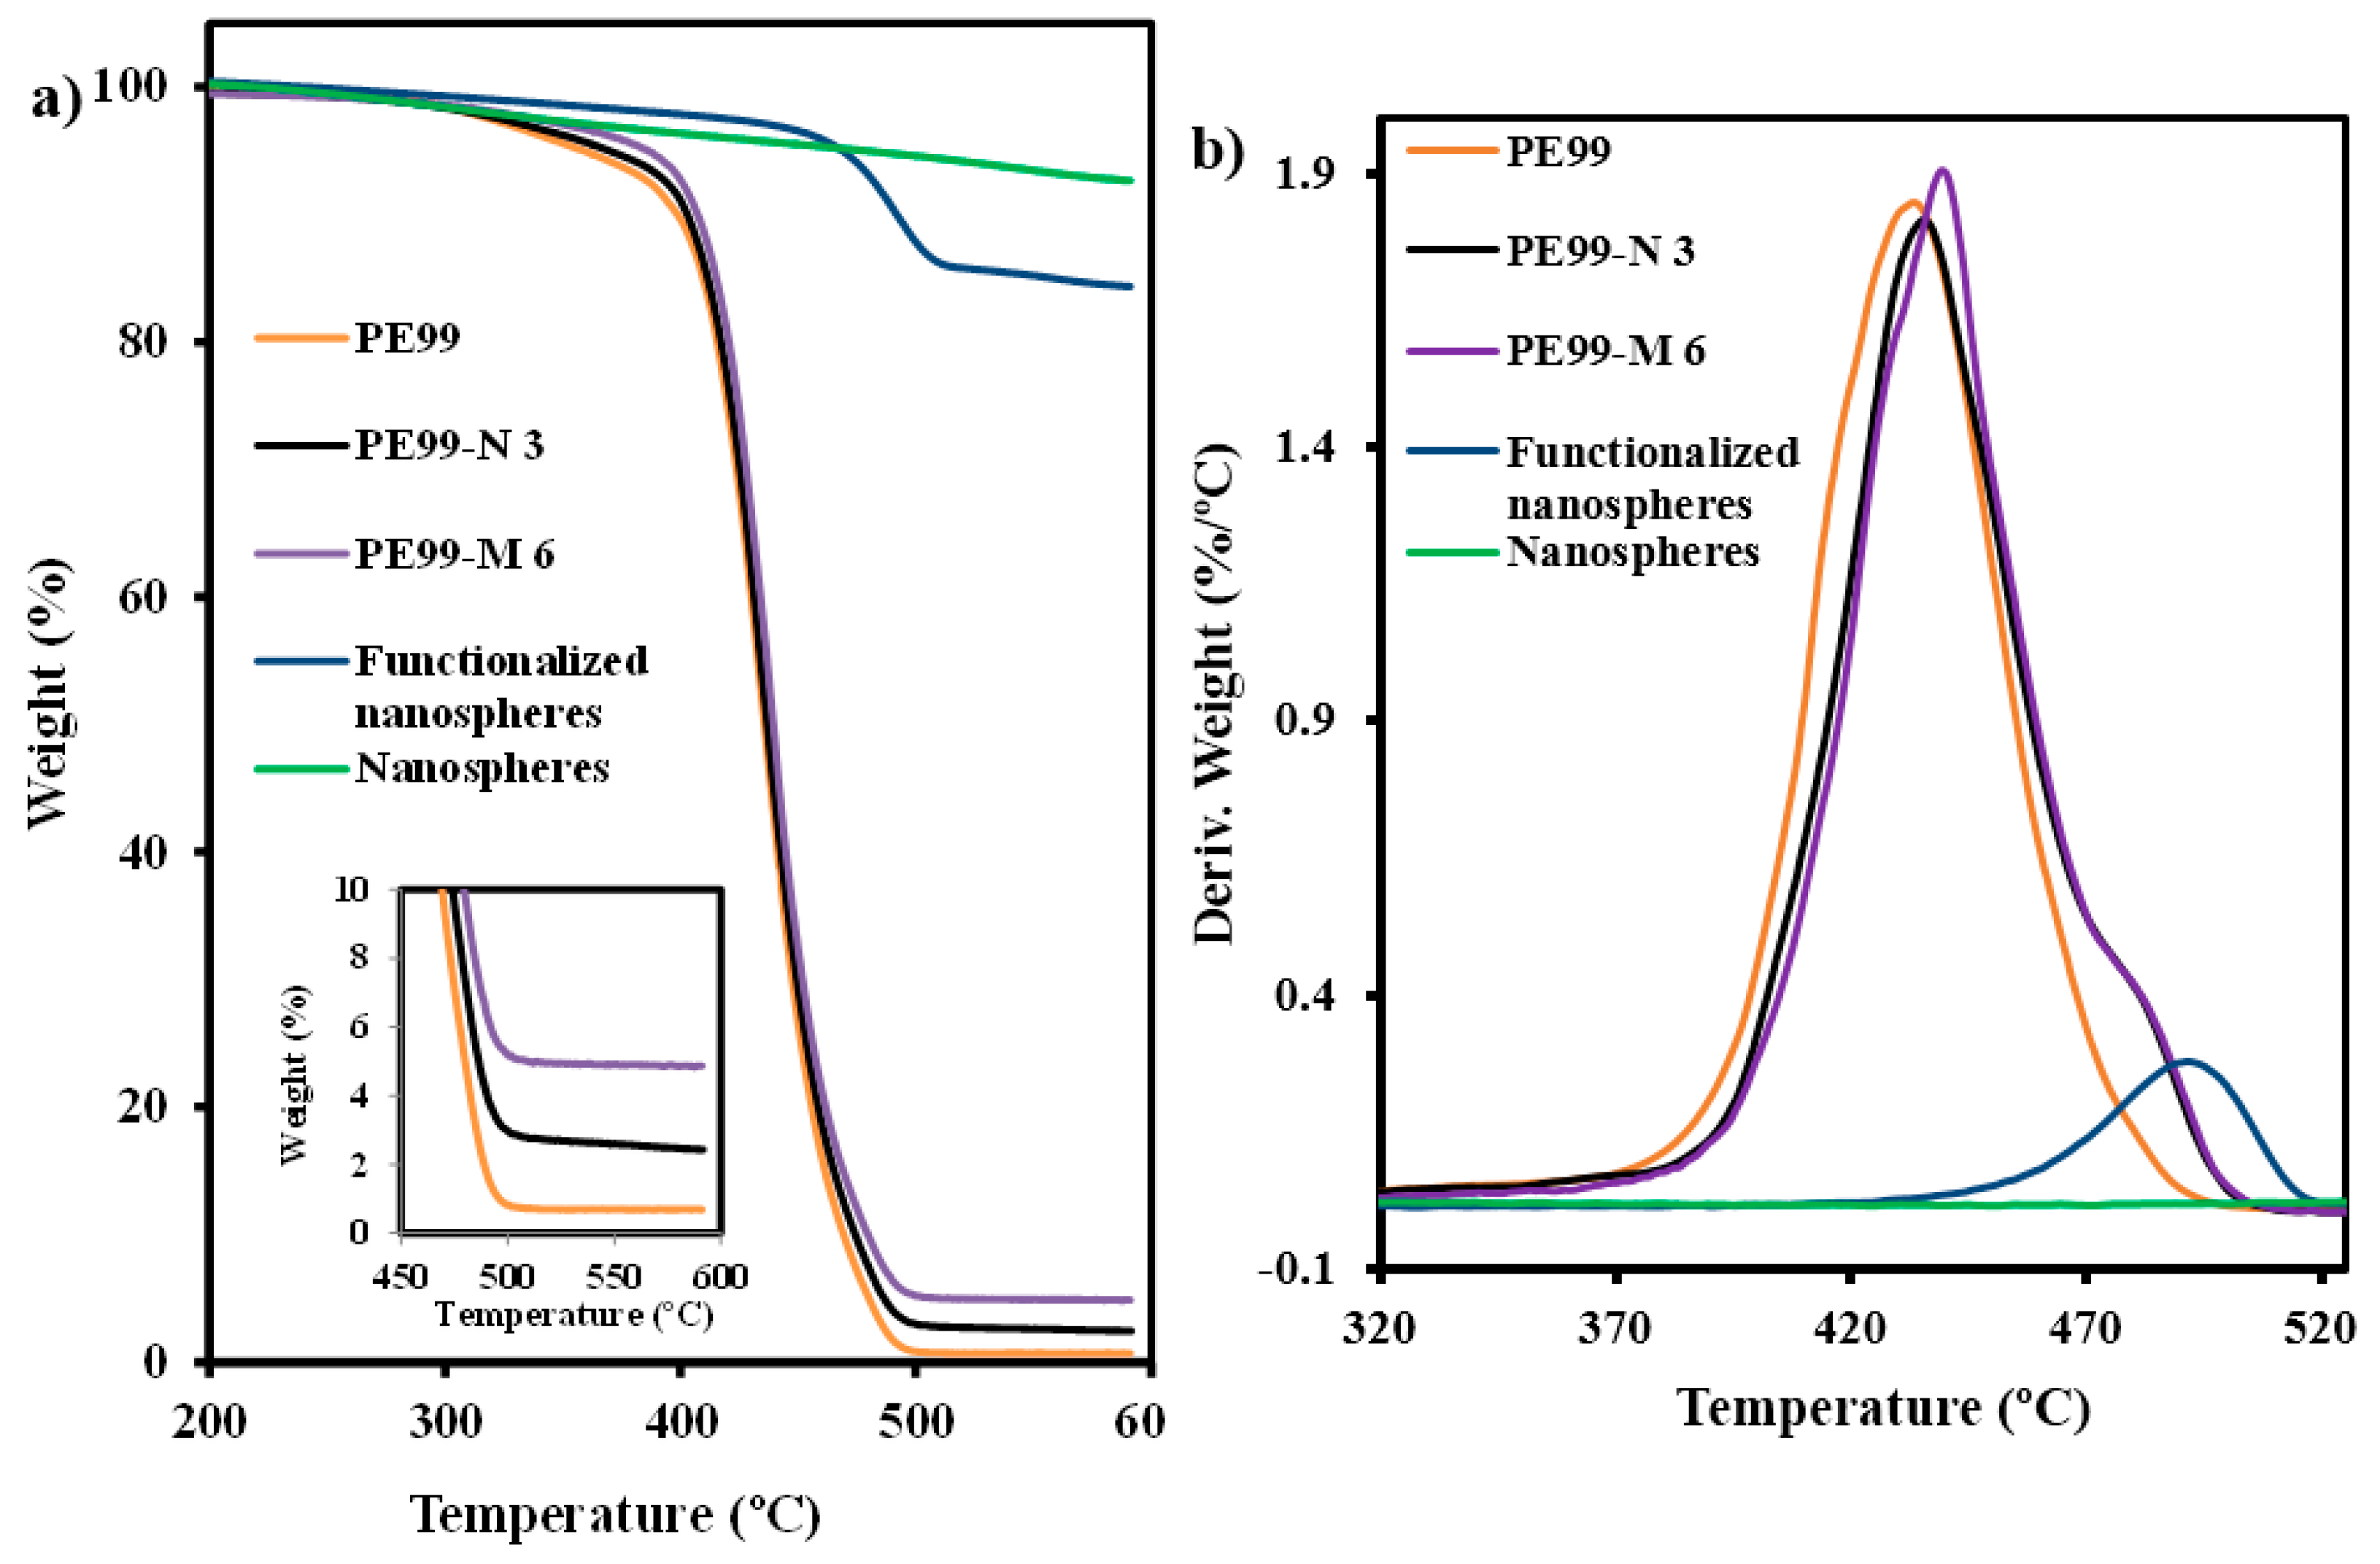
Thermogravimetric analyses (Figure 5) also showed a significant weight loss of functionalized silica particles because of decomposition of grafted AMPS groups, which took place at around 500 °C. This decomposition step corresponded to an approximate weight loss of 9% and, logically, was not detected in non-functionalized particles. Gradual weight loss leading to a value of only 8%–9% at 590 °C was observed for all particles. Thus, at this temperature the total loss was 17% and 8% for functionalized and non-functionalized particles, respectively. Practically no differences were found in the TGA (Figure 5a) and DTGA (Figure 5b) curves of micro- and nanoparticles.
Figure 5. TGA (a) and DTGA (b) curves of silica nanospheres, functionalized silica nanospheres, and micro-molded PE99, PE99-N 3, and PE99-M 6 specimens.
Applsci 05 01252 g005

3.2. Dispersion of Functionalized Silica Micro- and Nanoparticles by Ultrasound Micro-Molding Technology

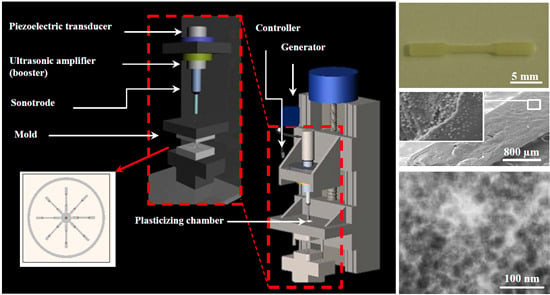
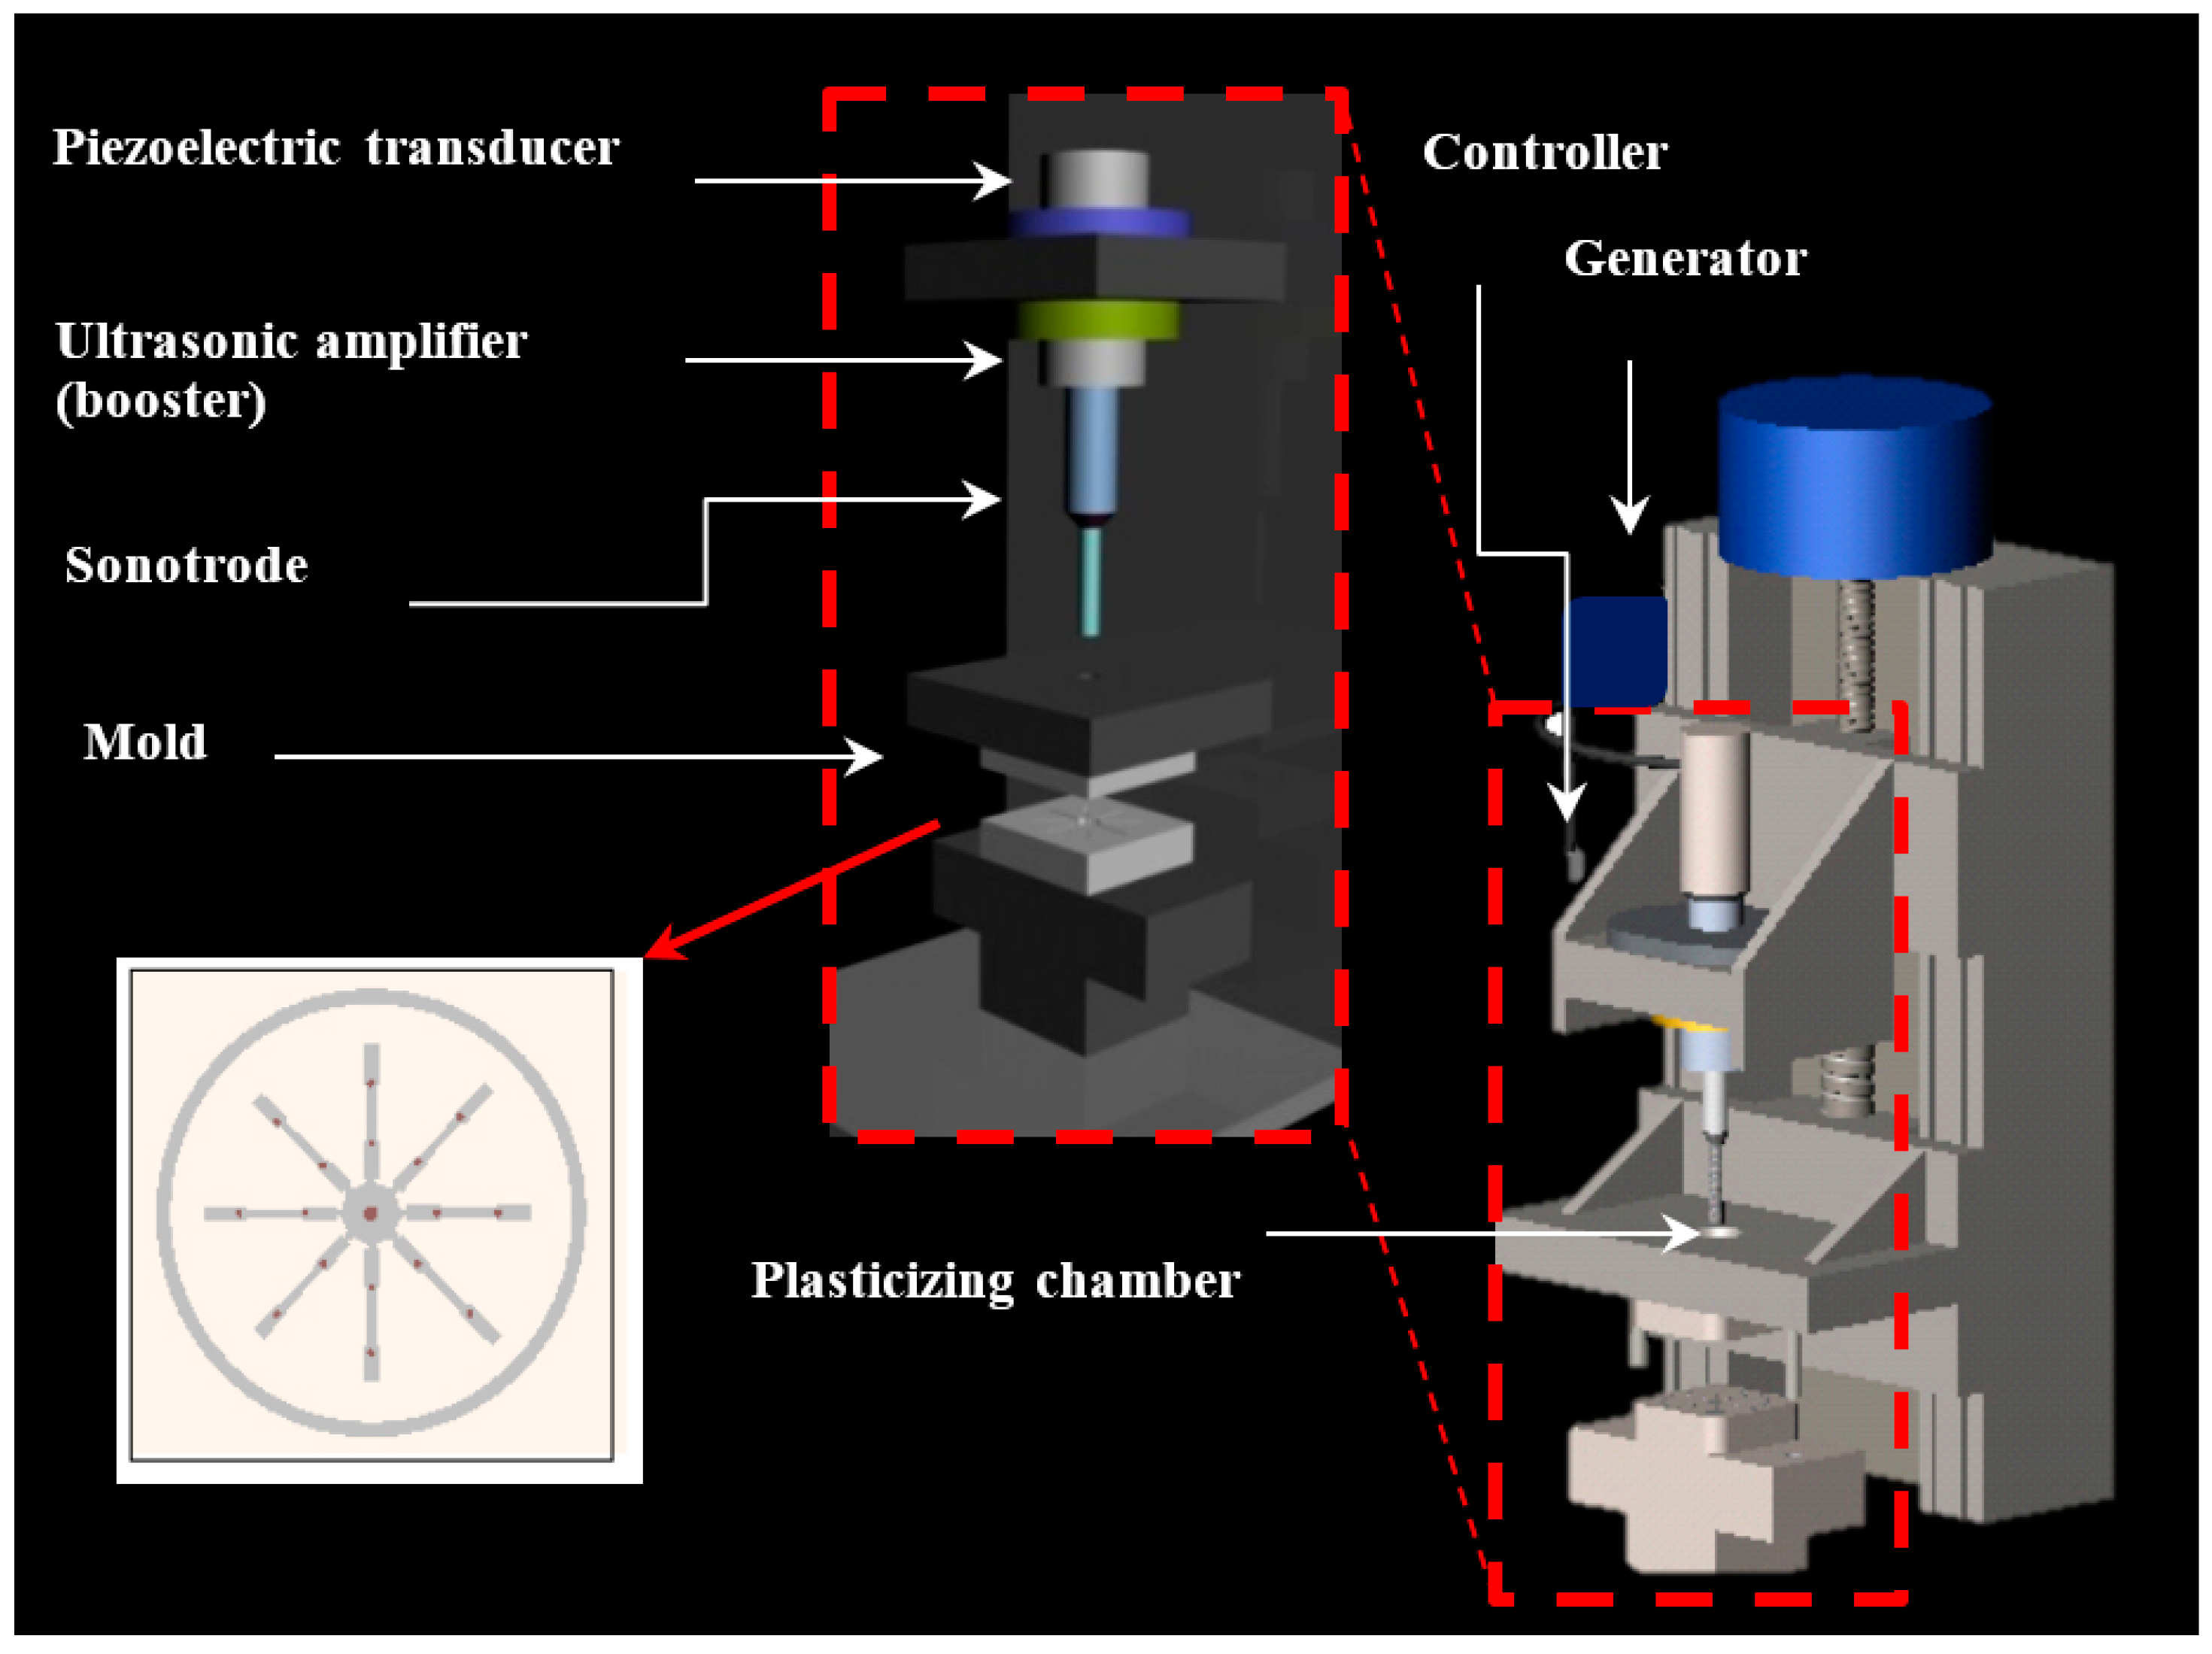
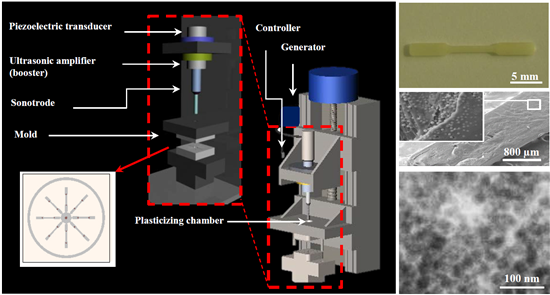
PE99 samples could be processed under relatively mild conditions, as previously established [15]. Thus, a minimum irradiation time of 1.2 s, low amplitude of 24 μm, and a moderate molding force of 300 N were sufficient to guarantee a 100% molding efficiency. Experimental conditions could be maintained for processing mixtures with functionalized micro- and nanospheres up to the maximum test load of 6 wt. %.
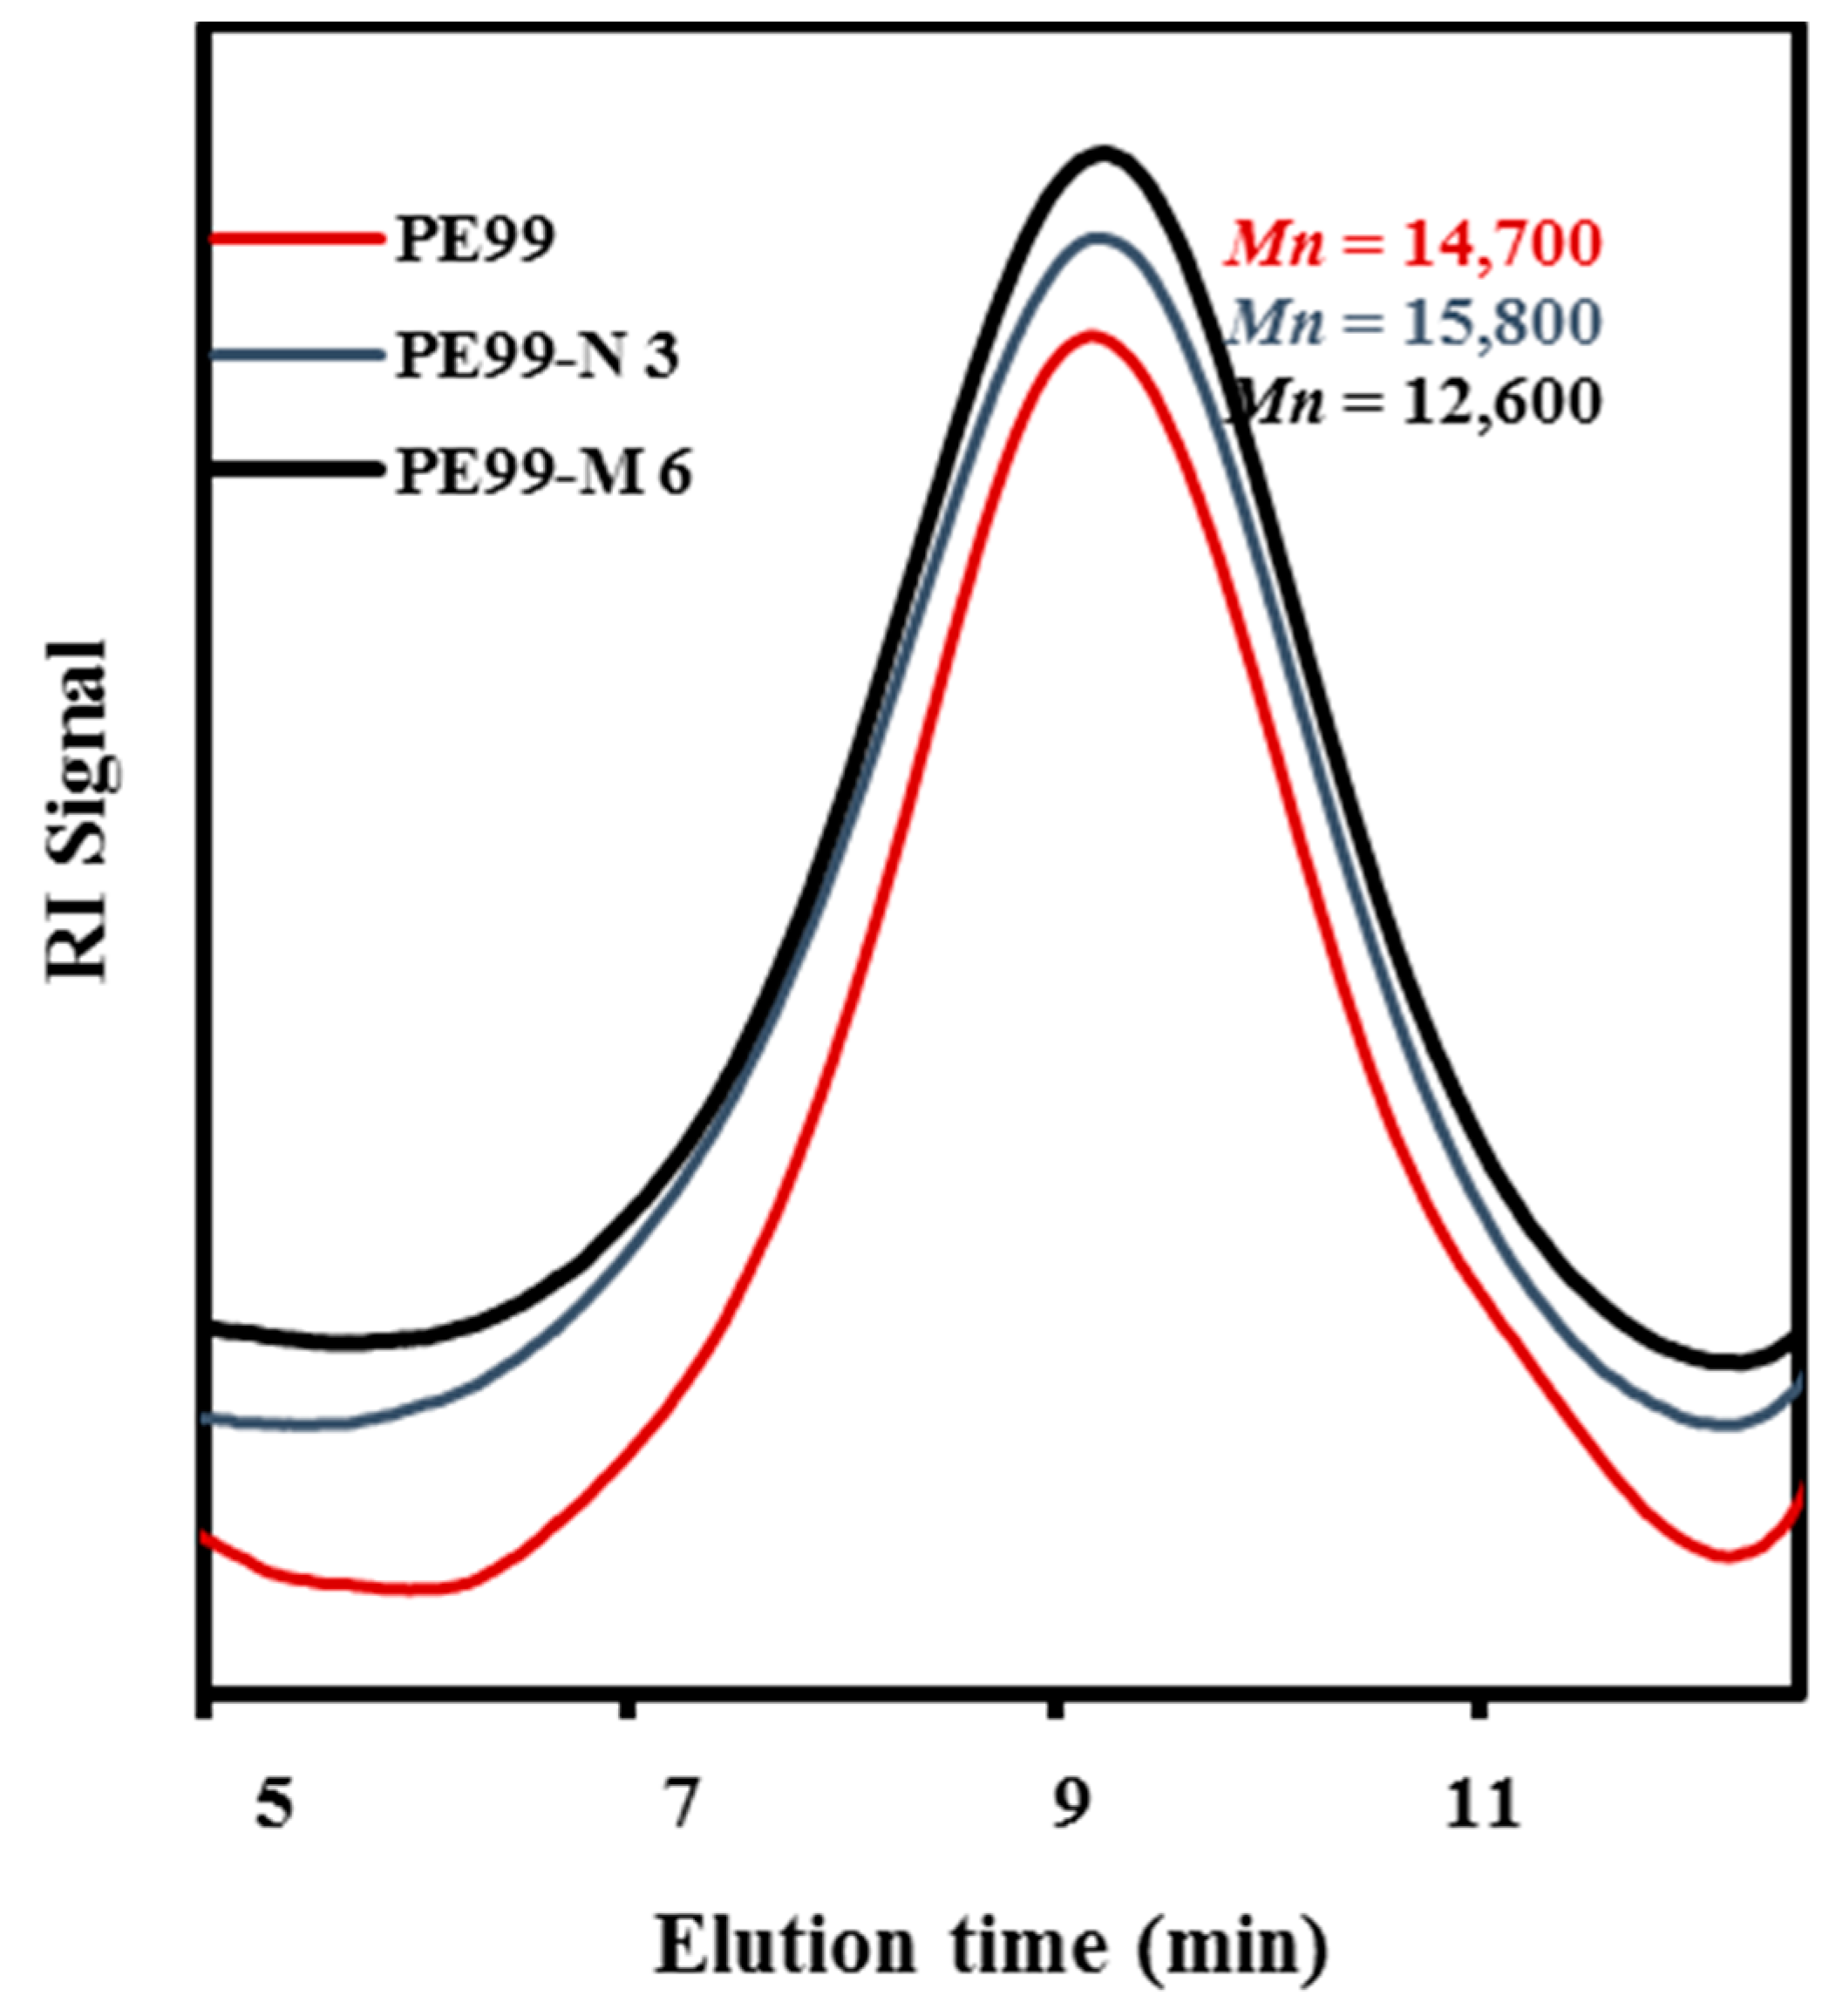
Molecular weights of raw PE99 and specimens processed under the above optimized conditions are summarized in Table 1, whereas Figure 6 compares the GPC traces of PE99, PE99-N 3, and PE99-M 6 specimens.
Table 1. Molecular weights of processed PE 99 and their mixtures with functionalized micro- and nanoparticles a.
SampleMn (g/mol)Mw (g/mol)Mw/Mn
PE99 (raw)13,30035,9002.7
PE9914,70037,2002.5
PE99-M 314,80036,8002.5
PE99-M 612,60033,8002.7
PE99-N 315,80039,2002.5
PE99-N 614,20037,9002.7
a Micro-molding conditions: Time (s), amplitude (μm) and force (N): 1.2, 10 and 300.
Figure 6. GPC molecular weight distribution curves determined for micro-molded PE99, PE-N 3, and PE99-M 6 specimens.
Applsci 05 01252 g006
No statistically significant differences were found between samples before and after processing or upon addition of functionalized nanospheres. Only a not highly significant decrease was detected for samples loaded with the maximum percentage (6 wt. %) of microspheres. The new technology appears fully adequate to obtain micropieces with negligible degradation of composites constituted by PE99 and functionalized silica micro/nanoparticles.
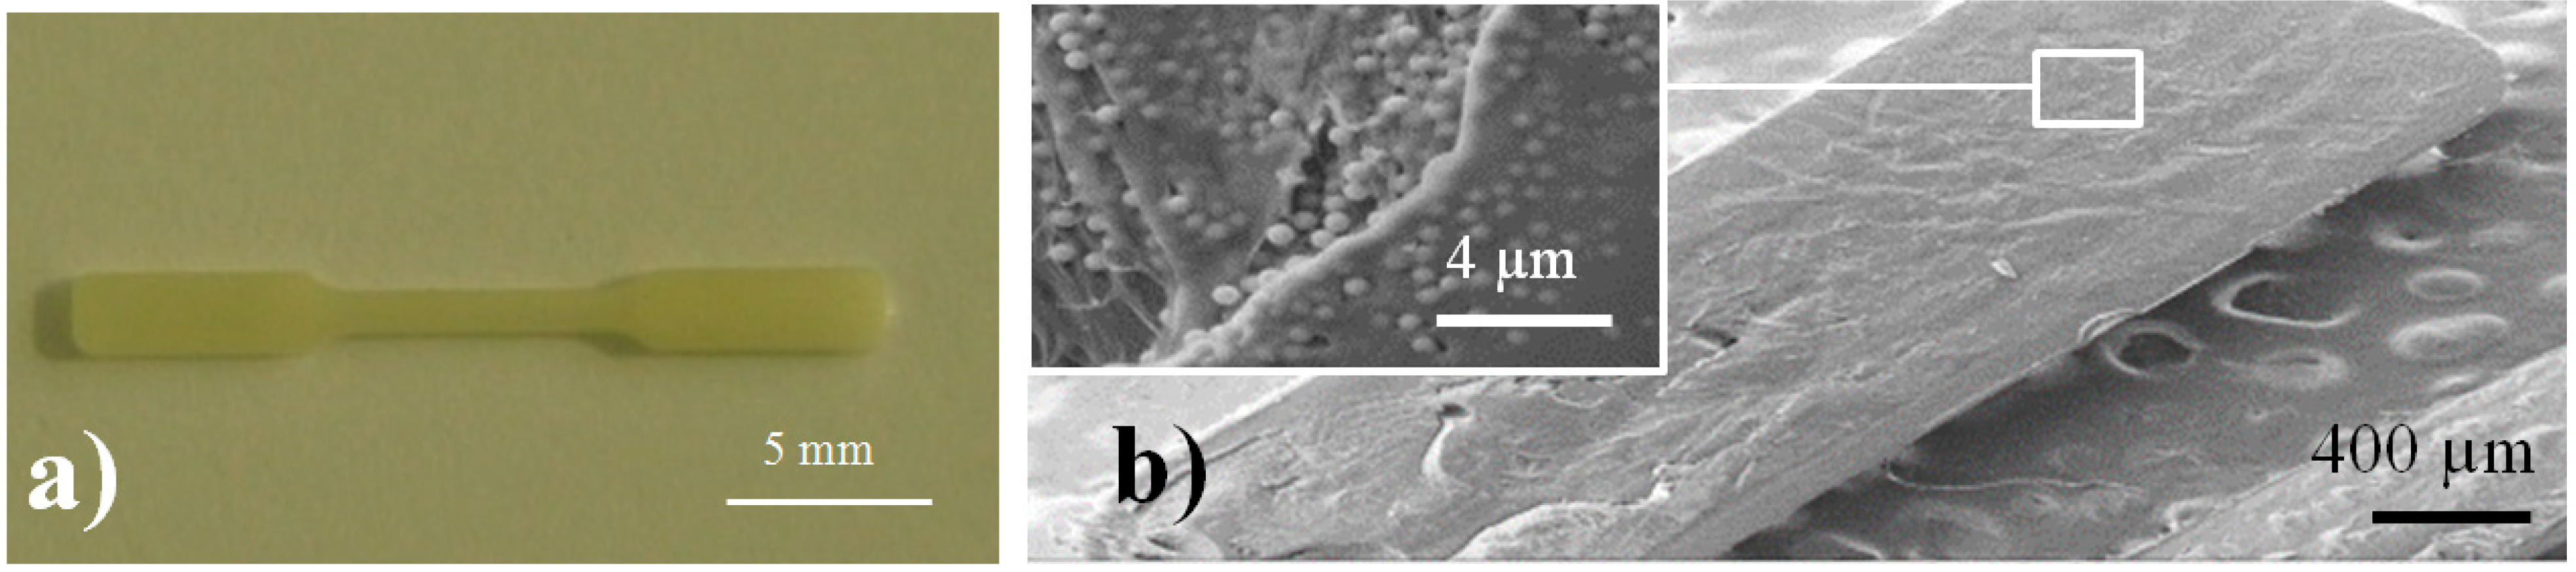
Figure 7a,b show optical and SEM images of a representative silica loaded specimen for which a regular texture is detected in the longitudinal section micrographs. All specimens were highly homogeneous, without the presence of cavities that could affect the final properties of the material.
Figure 7. Image of a processed PE99 specimen (a); SEM micrograph of details of a micro-molded PE99-M 3 specimen (b). Microparticles can be observed in the inset.
Applsci 05 01252 g007
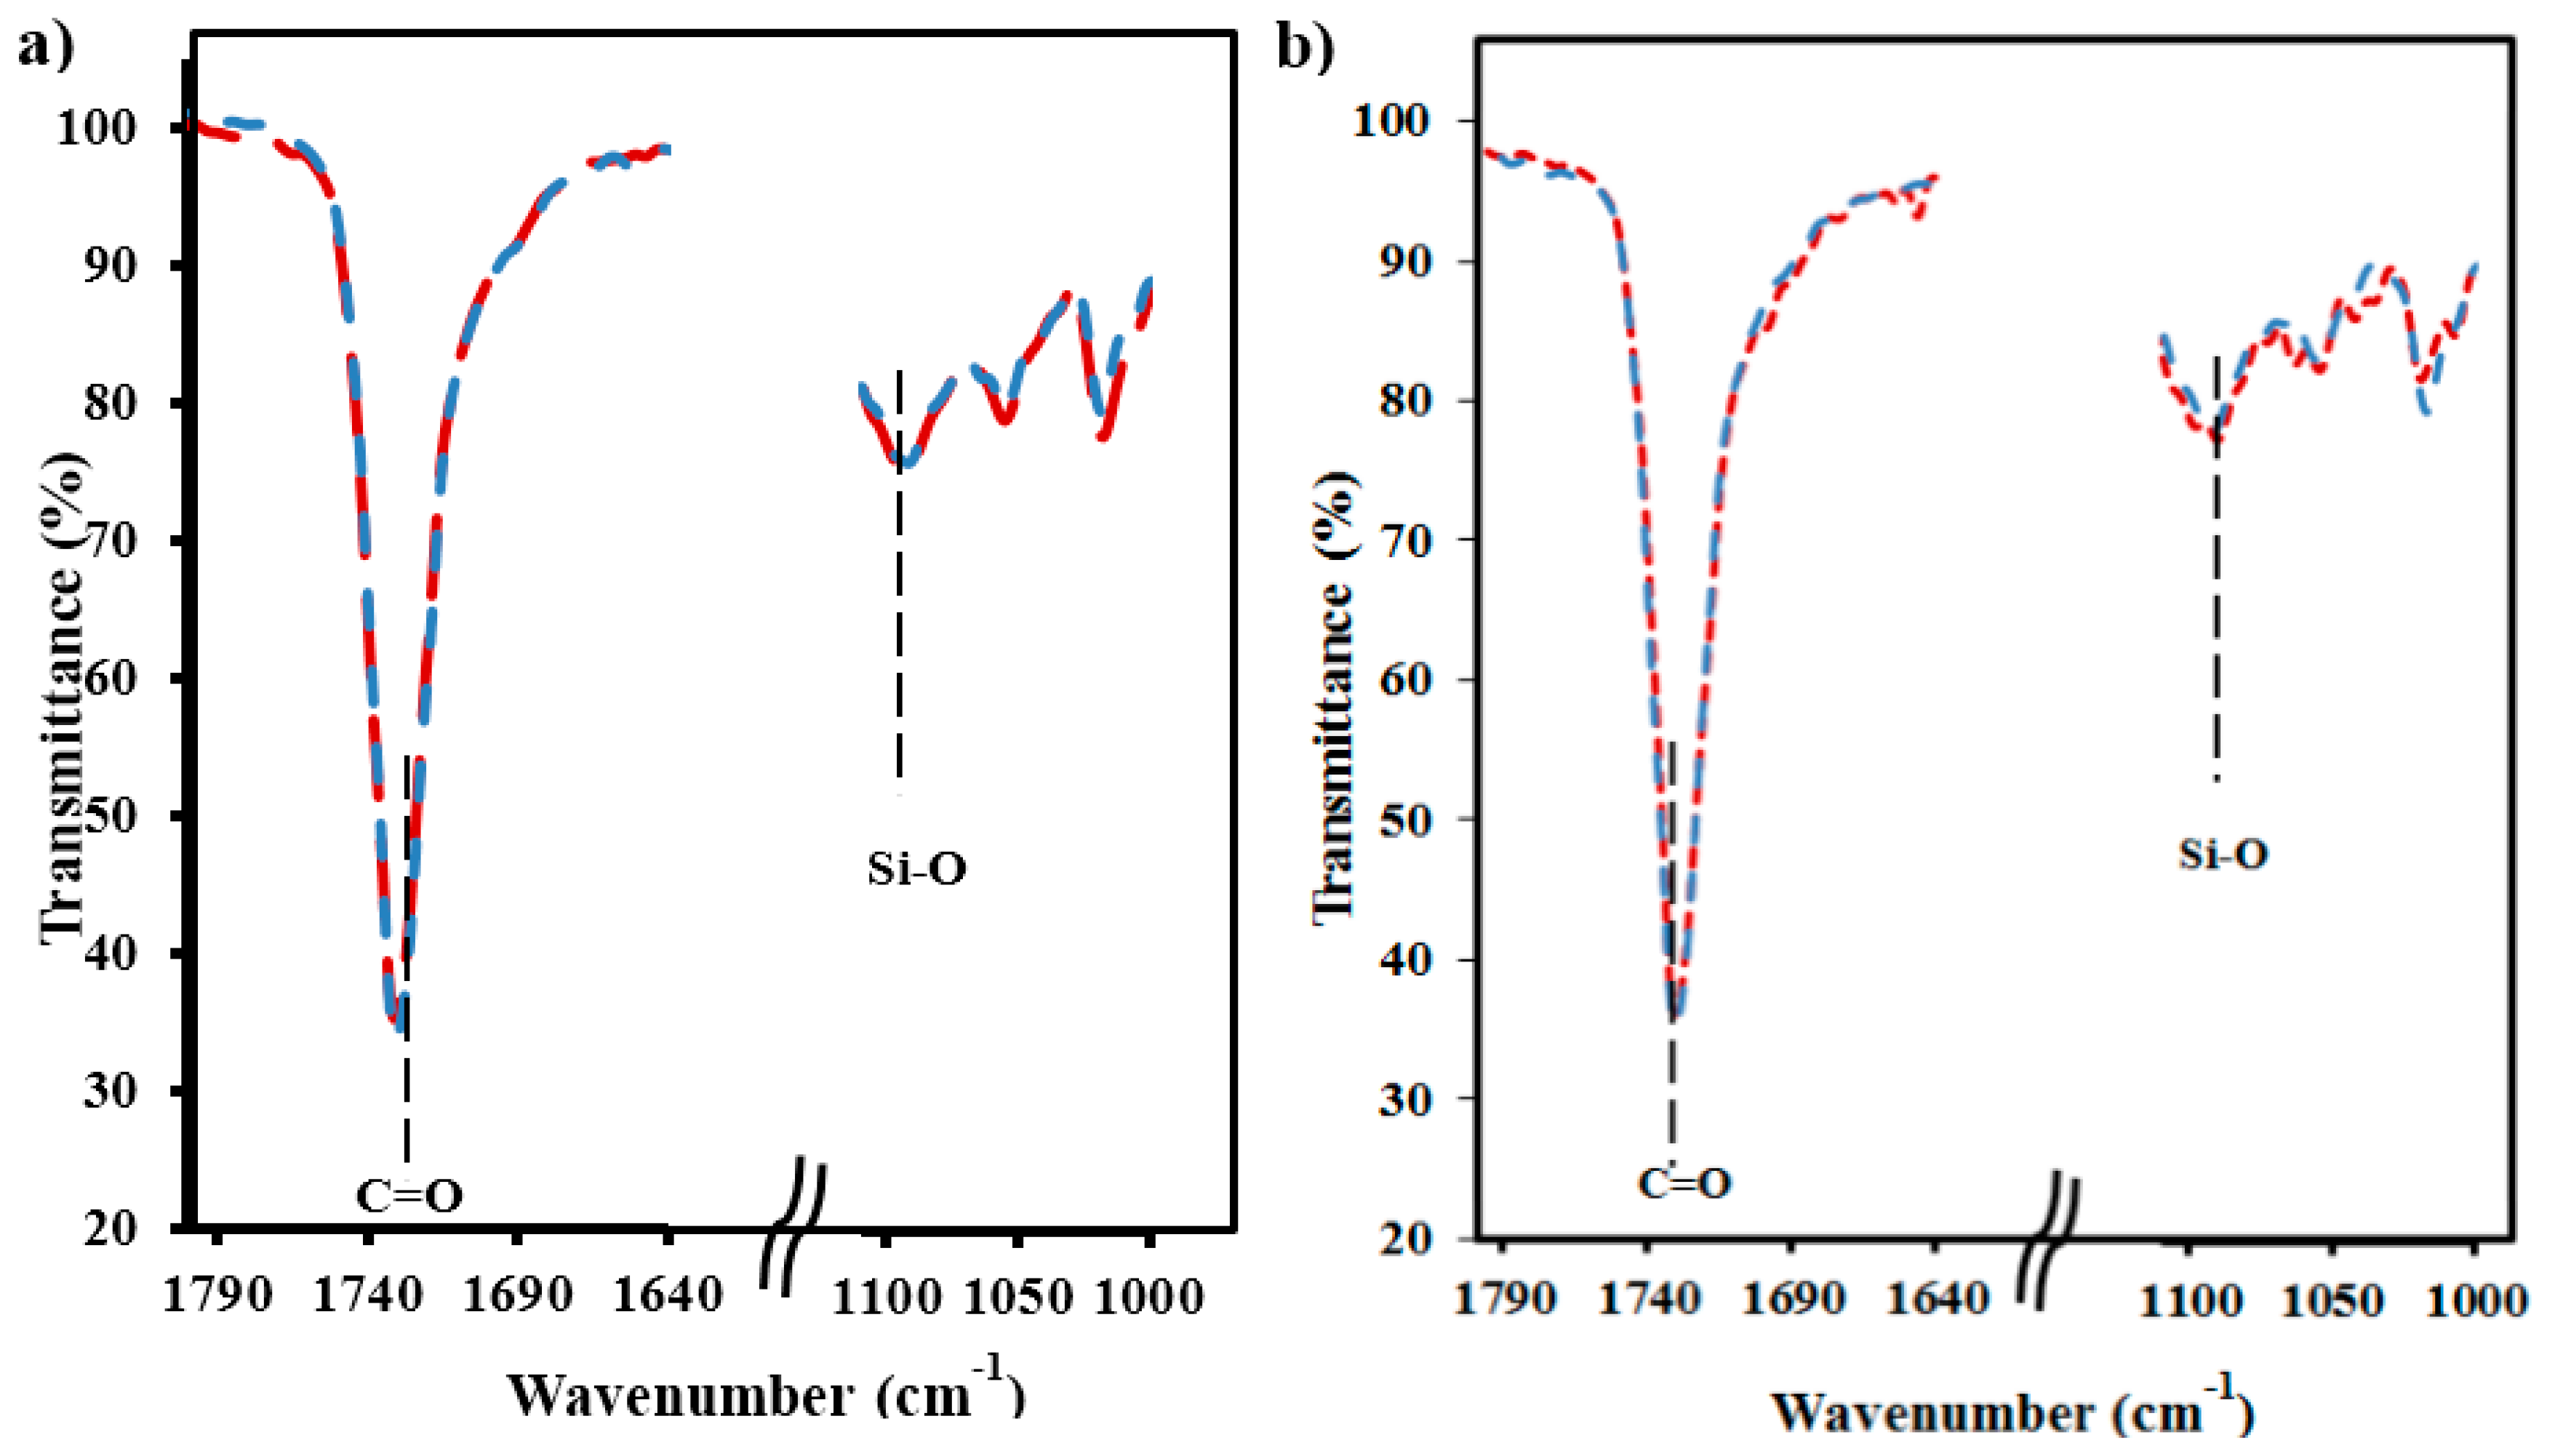
FTIR spectra were also useful to verify the uniform incorporation of silica particles into micro-molded specimens and to discard concentration in the sprue. Thus, the typical Si–O stretching band at 1075 cm−1 was observed in every part of all loaded specimens. Hence, the spectra of specimen zones close to (proximal part) and distant from (distal part) the feeding channel showed a similar ratio between the intensity of the band associated with the C=O stretching band of the polyester and the band associated with the silica particles (see Figure 8 for representative samples containing micro- and nanoparticles).
Figure 8. FTIR spectra of the characteristic C=O and Si–O stretching bands of micro-molded PE-N 3 (a) and PE-M 3 (b) specimens. Blue and red lines correspond to the proximal and distal parts of the specimens, respectively.
Applsci 05 01252 g008
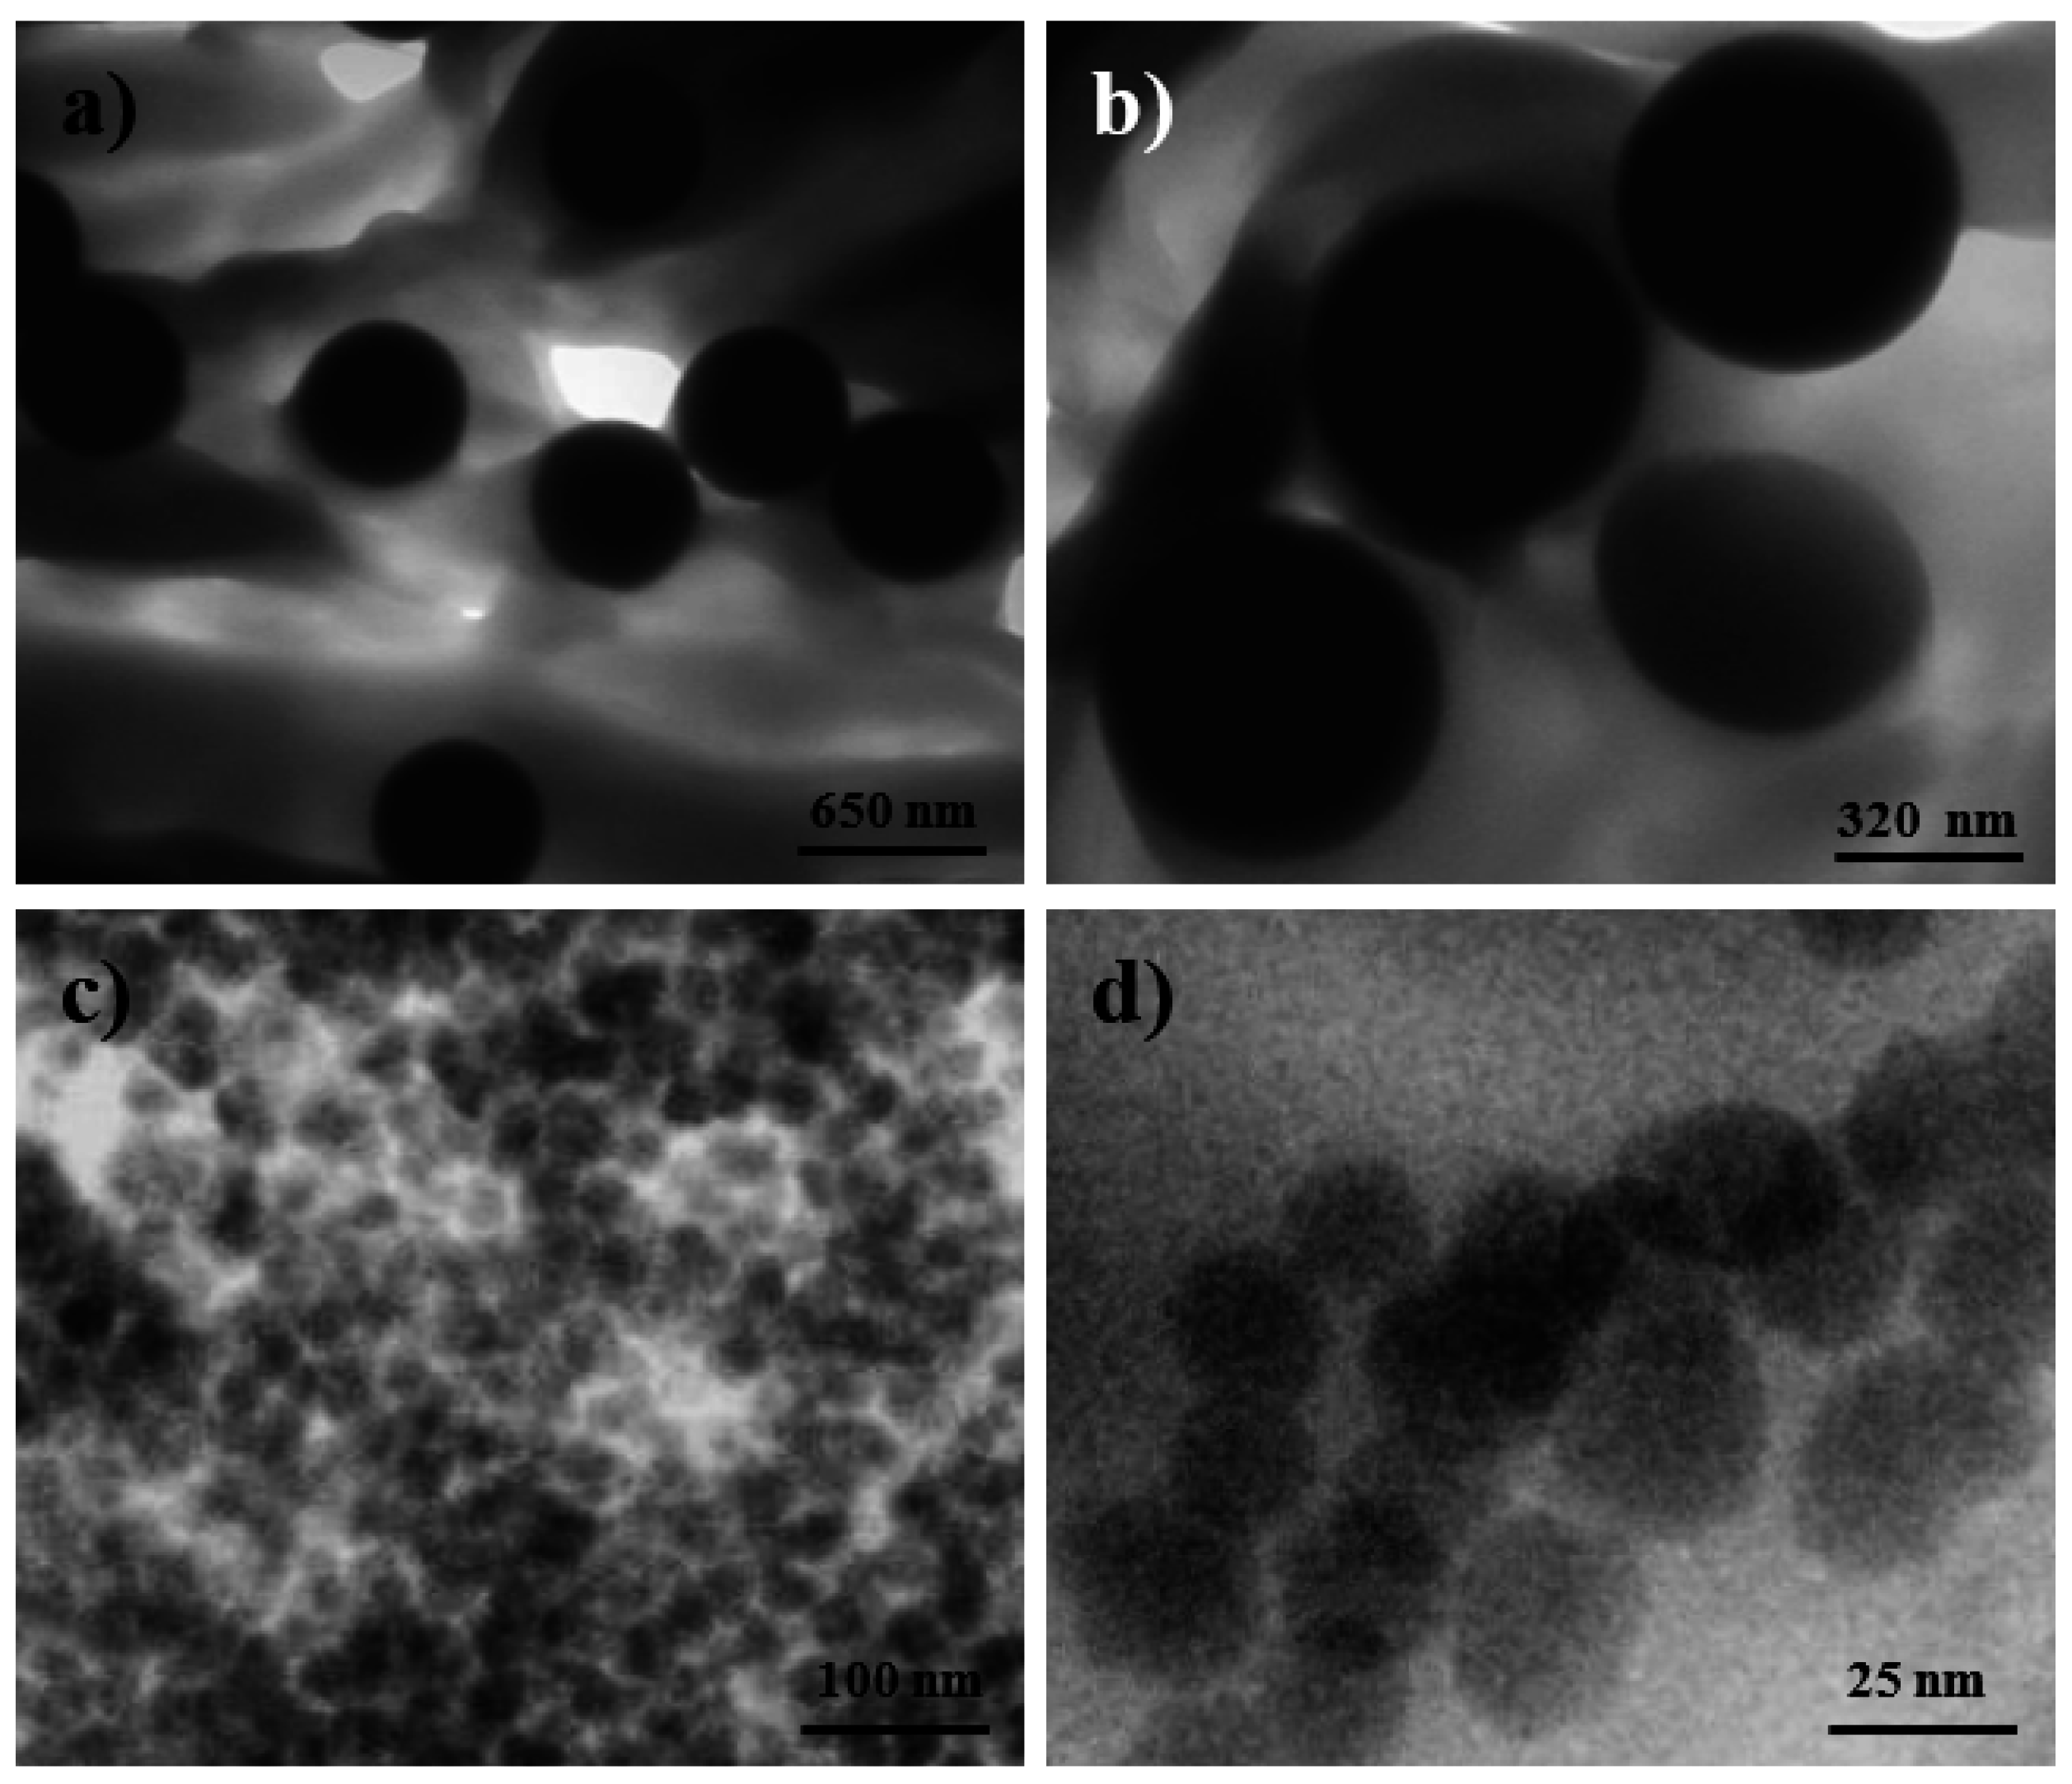
Analysis of particle dispersion in the processed composites was also carried out by transmission electron microscopy observation of ultrathin sections of micro-molded specimens. Flawless ultrasections could be obtained, as can be seen in the images for representative samples in Figure 9. These micrographs show the distribution of micro- and nanoparticles in the specimen, which is not completely homogeneous since density appears to be locally variable when observed at this scale.
Figure 9. TEM micrographs of the dispersion of functionalized silica microspheres (a,b) and nanospheres (c,d) in the micro-molded PE99-M 3 and PE99-N 3 specimens.
Applsci 05 01252 g009
Thermogravimetric analysis also gave information about the percentage of silica particles incorporated into the polymer matrix and their effect on thermal stability. In all cases, a constant char yield was attained at high temperatures, as shown by representative PE99-N 3 and PE99-M 6 specimens in Figure 5a. Furthermore, the remaining weight percentage was always in full agreement with the expected silica content (i.e., close to 3 and 6 wt. %). The result is meaningful since it has demonstrated again that particles were not generally retained in the sprue. Silica was effectively led through the feeding channels by the molten polymer, giving rise to well-dispersed specimens. A close resemblance between the TGA and DTGA traces of the micro-molded PE99 sample and the silica-loaded composites was also found during the first stages of degradation (probably also as a consequence of the low content of added particles). The added particles even seem to slightly stabilize the sample (Table 2 and Figure 5). In any case, functionalization of silica particles did not have a negative impact on the ultrasound micro-molding process, as was also observed by GPC measurement. Differences were noticeable only at the end of the degradation process; the presence of shoulders around 483 °C in the DTGA plots (Figure 5b) seems to be due to decomposition of grafted AMPS groups.
Table 2. Characteristic TGA temperatures and remaining weight percentages for the decomposition of the studied micro-molded specimens.
PolymerTonset (°C)T10% (°C)T20% (°C)T40% (°C)Tmax (°C)Remaining Weight (%)
PE 993673974114264330
PE 99-N 33774054154314362.7
PE 99-N 63774054154324385.7
PE 99-M 33774054174314372.9
PE 99-M 63774044194324395.8

3.3. Calorimetric Studies on the Influence of Functionalized Silica Nanoparticles on the Isothermal Crystallization of Poly(nonamethylene Azelate)

Kinetic analysis was only performed for melt crystallization processes because of the impossibility of obtaining amorphous samples by cooling the melted nanocomposite at the maximum rate allowed by the equipment.
Crystallization experiments were therefore carried out in a narrow temperature interval (i.e., between 56 and 59 °C) due to experimental limitations. 
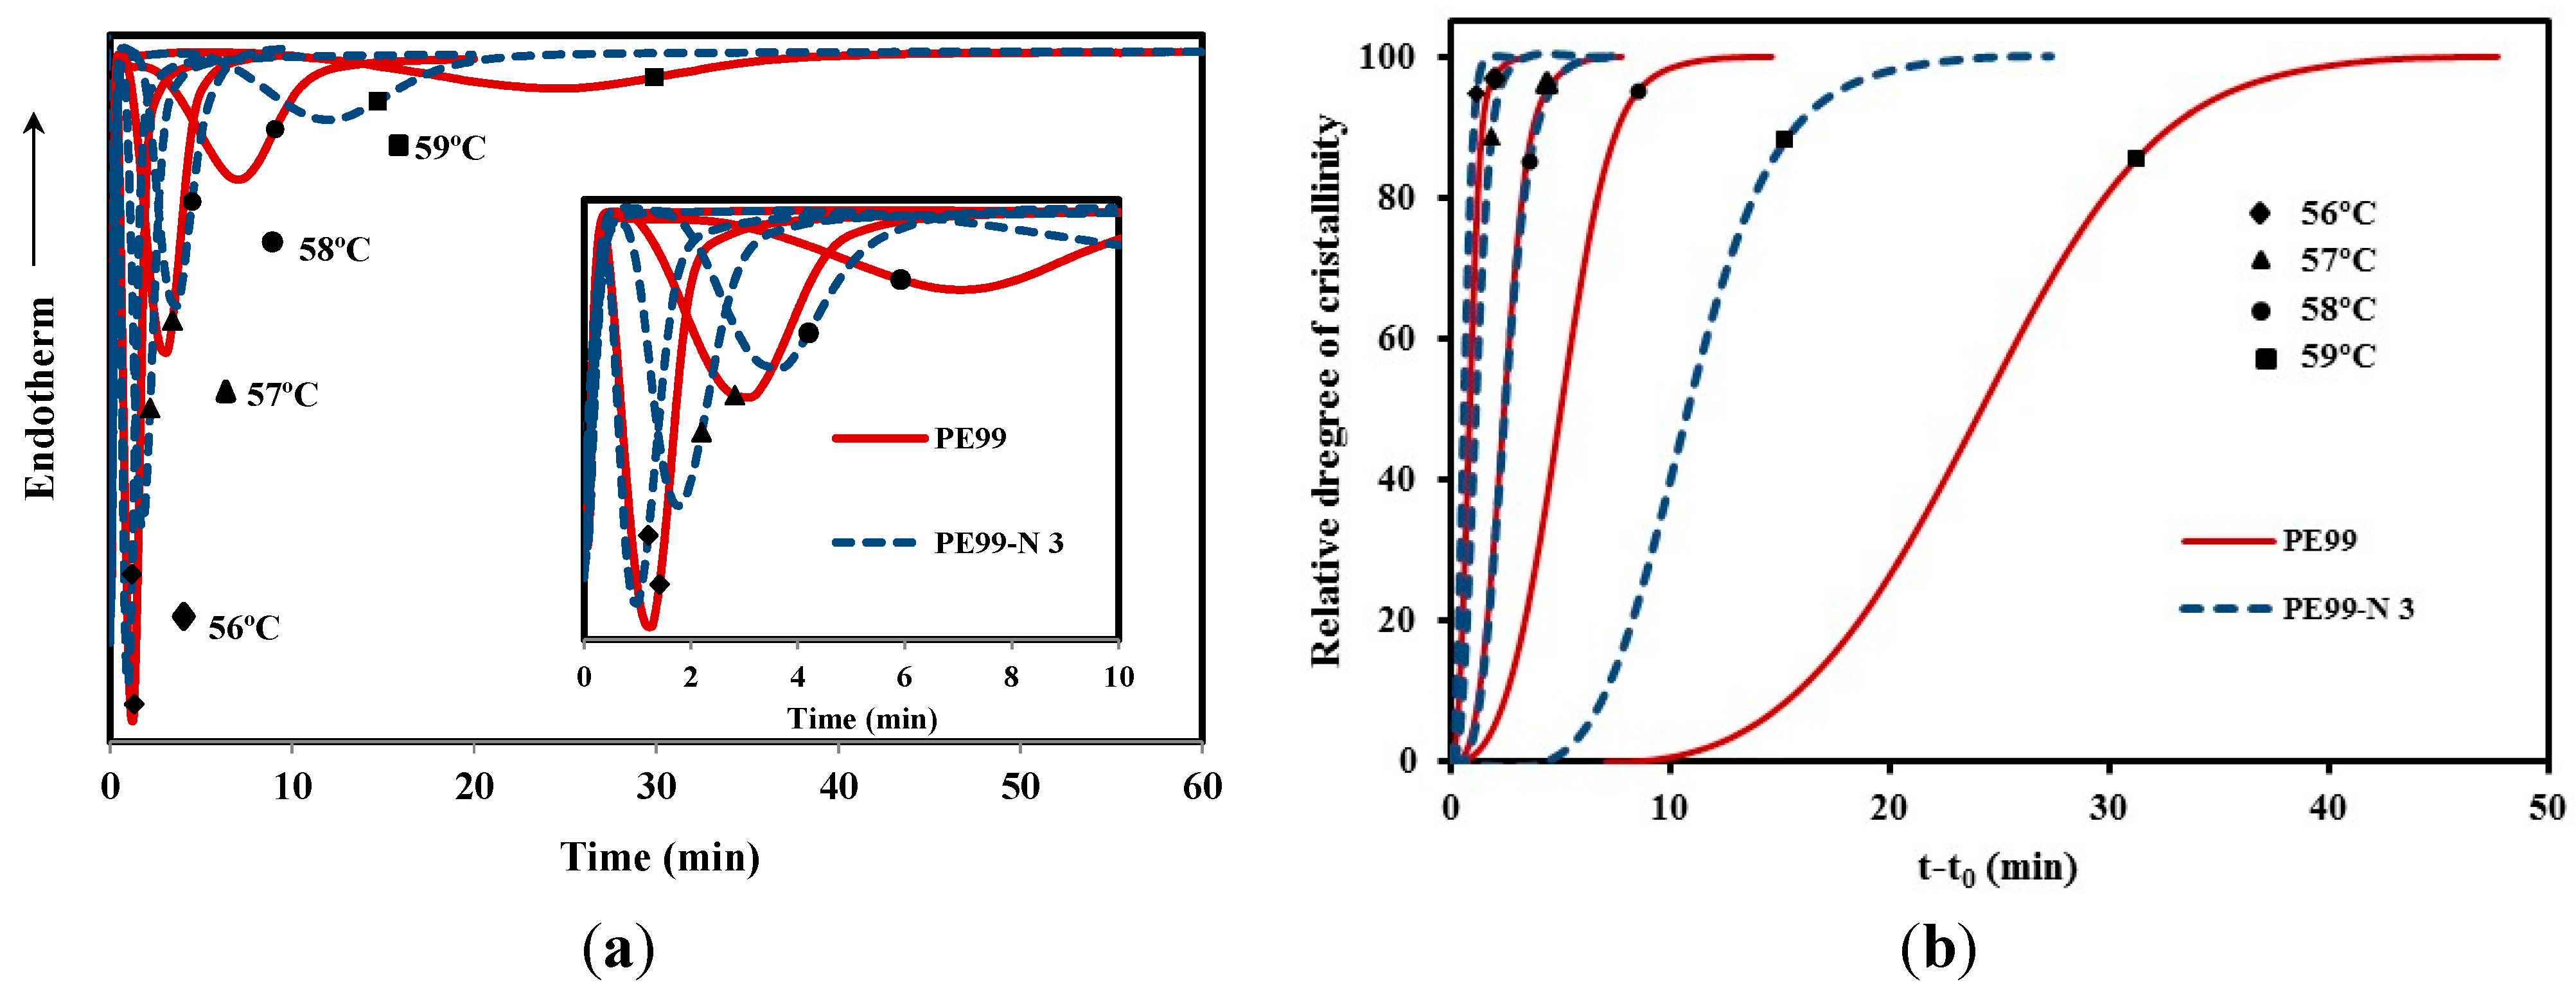
Figure 10a shows the crystallization exotherms of the neat polyester and the PE99-N 3 nanocomposite, which allowed for determining the time evolution of the relative degree of crystallinity, χ(t). The last was calculated according to Equation (1):
χ ( t ) = t 0 t ( d H / d t ) d t / t 0 ( d H / d t ) d t
where t0 is the induction time and dH/dt corresponds to the heat flow rate. The evolution of crystallinity always showed a sigmoidal dependence on time for the five melt crystallization experiments performed for the different samples (Figure 10b). Experimental data were analyzed considering the typical Avrami equation [27,28]:
1 − χ (tt0) = exp(−Z·(tt0)n)
where Z is a temperature-dependent rate constant and n the Avrami exponent whose value depends on the mechanism and geometry of the crystallization process. A normalized rate constant, k = Z1/n, can also be calculated for comparison purposes since corresponding units (time−1) are independent of the specific value of the Avrami exponent.
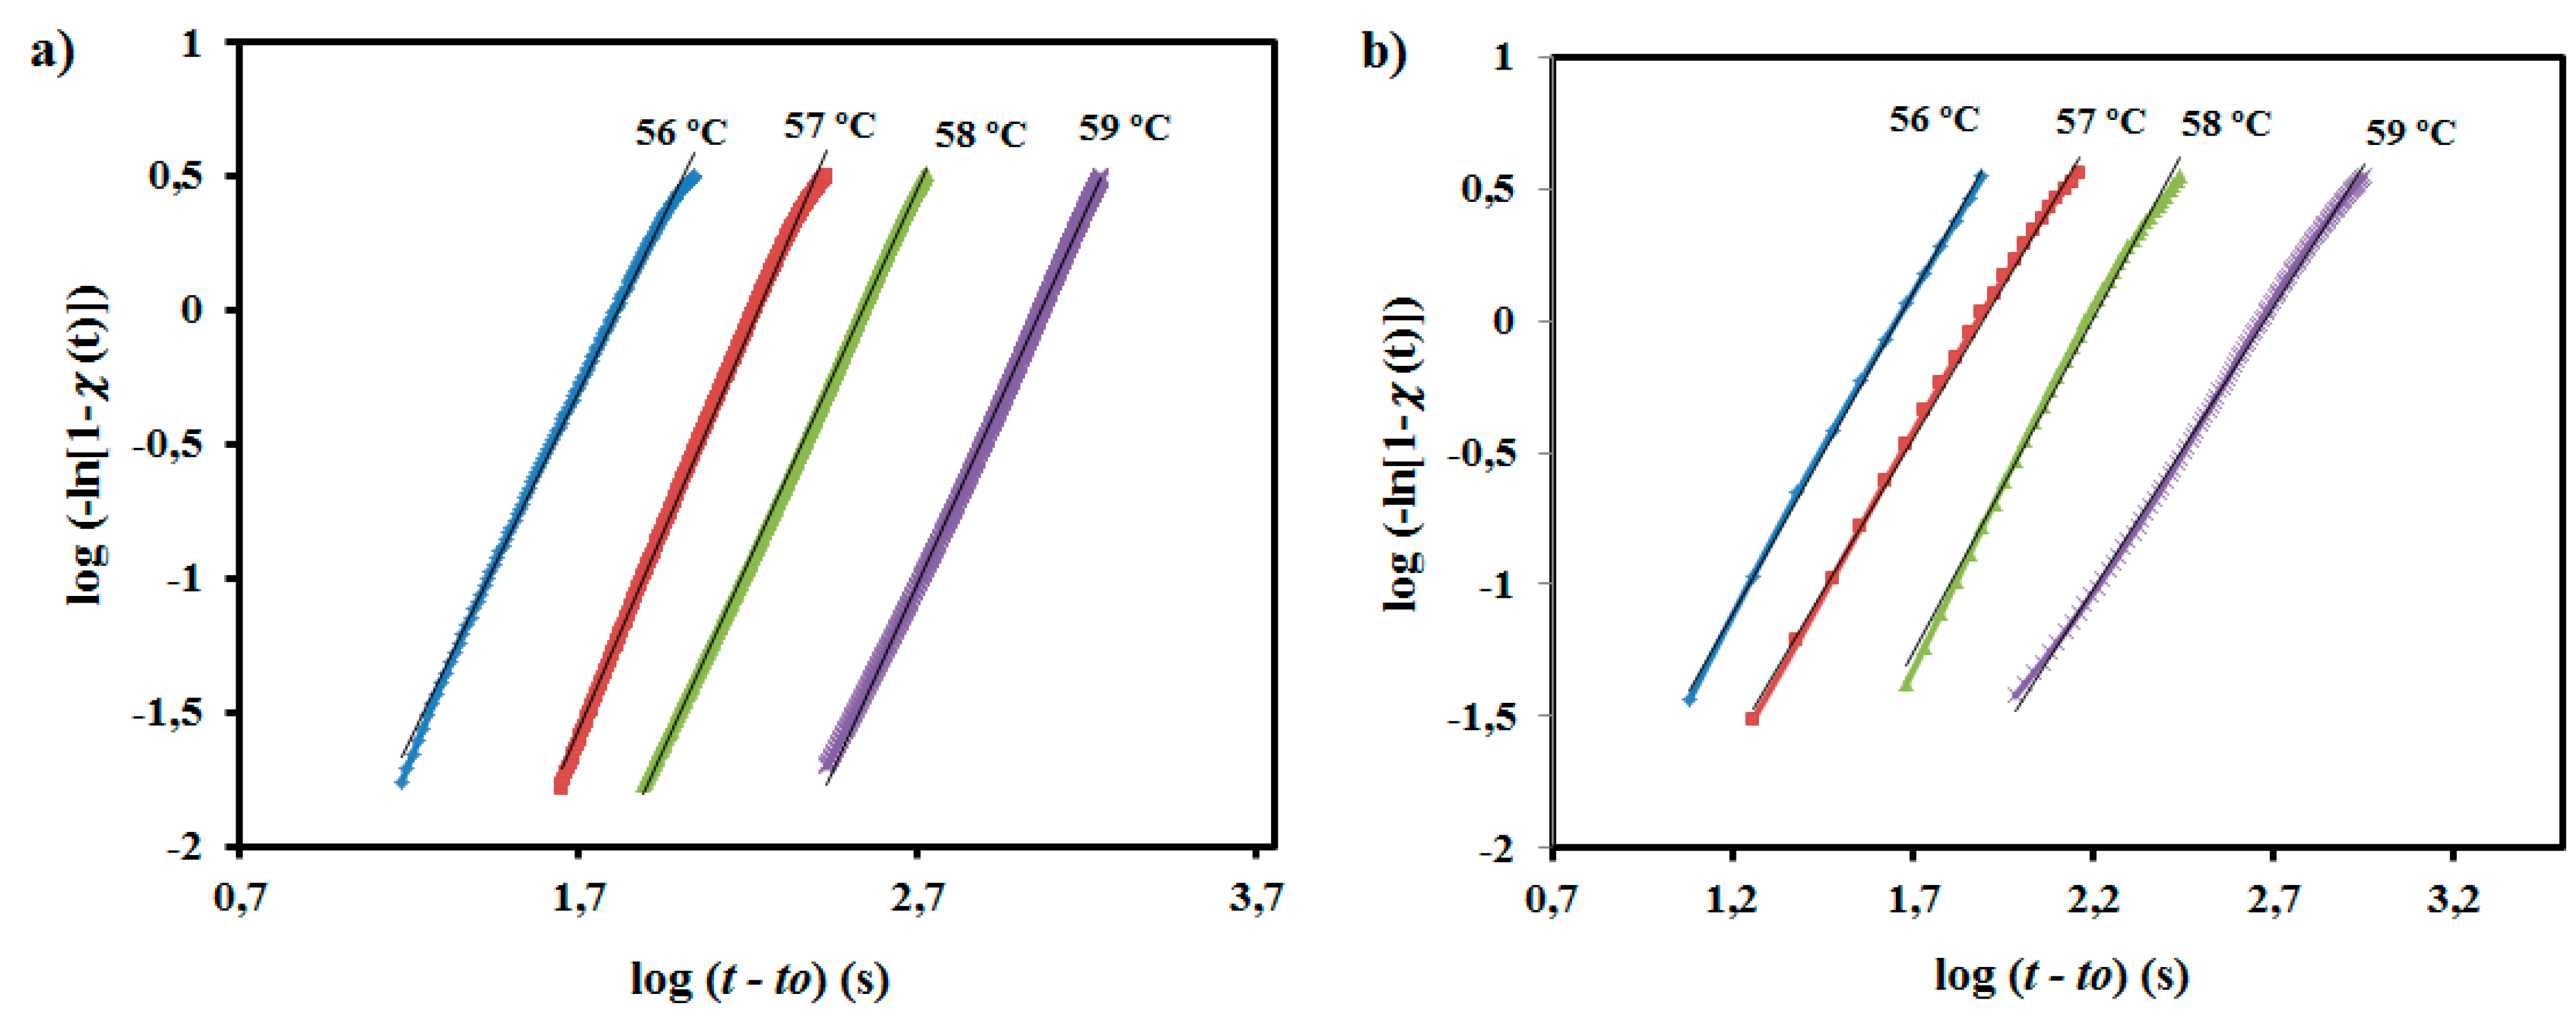
Plots of log(−ln(1 − χ(tt0))) against log(tt0) (Figure 11) allowed for determining the indicated crystallization parameters, which are summarized in Table 3. Avrami exponents for the neat polyester remain in a narrow range (i.e., 2.60–2.94) and have an average value of 2.78. The determined Avrami exponent indicates a predetermined (heterogeneous) nucleation and a spherical growth under geometric constraints. Note that a slight deviation is observed with respect to the theoretical value of 3 and that a value close to 4 should be expected for a sporadic (heterogeneous) and homogeneous nucleations. It should also be pointed out than homogeneous nucleation usually requires high undercooling, which does not correspond with the performed experiments. The exponent slightly decreased for the nanocomposite (i.e., 2.54–2.14, with 2.33 being the average value), suggesting an increase in geometric constraints upon incorporation of the well-dispersed nanospheres. Exponents determined for both samples were found to vary without a well-defined trend within the selected narrow temperature interval.
Reciprocal crystallization half-times (1/τ1/2) are also summarized in Table 3. This parameter is directly determined from DSC isotherms (i.e., it corresponds to the inverse of the difference between thr crystallization start time and half-crystallization time) and can be useful to test the accuracy of the Avrami parameters since an estimated value can be obtained from them (i.e., 1/τ1/2 = (Z/ln2)1/n)).
Figure 10. (a) Exothermic DSC peaks of isothermal crystallizations of PE99 (garnet) and PE99-N 3 (blue) samples at temperatures between 56 and 59 °C; (b) development of the relative degree of crystallinity of PE99 (garnet) and PE99-N 3 (blue) samples at different crystallization temperatures.
Applsci 05 01252 g010
Figure 11. Avrami plots of isothermal crystallization of PE99 (a) and PE99-N 3 (b) at the indicated temperatures.
Applsci 05 01252 g011
Table 3. Main crystallization kinetic parameters determined by DSC for the neat polyester and its nanocomposite with 3 wt. % of functionalized silica nanospheres.
SampleT (°C)Z × 106 (sn)nk × 103 (s−1)1/τ1/2 × 103 (s−1)(Z/ln2)1/n × 103 (s−1)
PE995618.482.6015.2317.9317.5
570.282.945.896.826.67
580.0772.812.923.313.32
590.00282.790.860.970.99
PE99-N 35698.562.4221.9825.9725.58
5742.032.3112.8415.1215.05
582.692.546.377.627.36
591.892.142.122.542.52
Variation of the overall rate constant with temperature for the neat polymer and its nanocomposites was also evaluated (Table 3). The rate for the nanocomposite increased (i.e., from 2.12 × 10⁻³ s−1 to 21.98 × 10⁻³ s−1) when crystallization temperature decreased (i.e., from 59 °C to 56 °C), a trend that was also logically observed for PE99. More interestingly, the nanocomposite showed a remarkably higher crystallization rate than the neat polyester at all test crystallization temperatures (e.g., 21.98 × 10⁻³ s−1 and 15.23 × 10⁻³ s−1 were determined at 56 °C for PE99-N 3 and PE99, respectively). Therefore, incorporation of functionalized silica nanoparticles had a significant influence on the crystallization process and, logically, on the final material properties. It should be pointed out that the ratio between the two kinetic constants decreased (i.e., between 2.5 and 1.4) as crystallization temperature decreased, which justifies further studies on nucleation and crystal growth processes.

3.4. Optical Microscopy Studies on the Influence of Functionalized Silica Nanoparticles on the Isothermal Crystallization of Poly(nonamethylene Azelate)

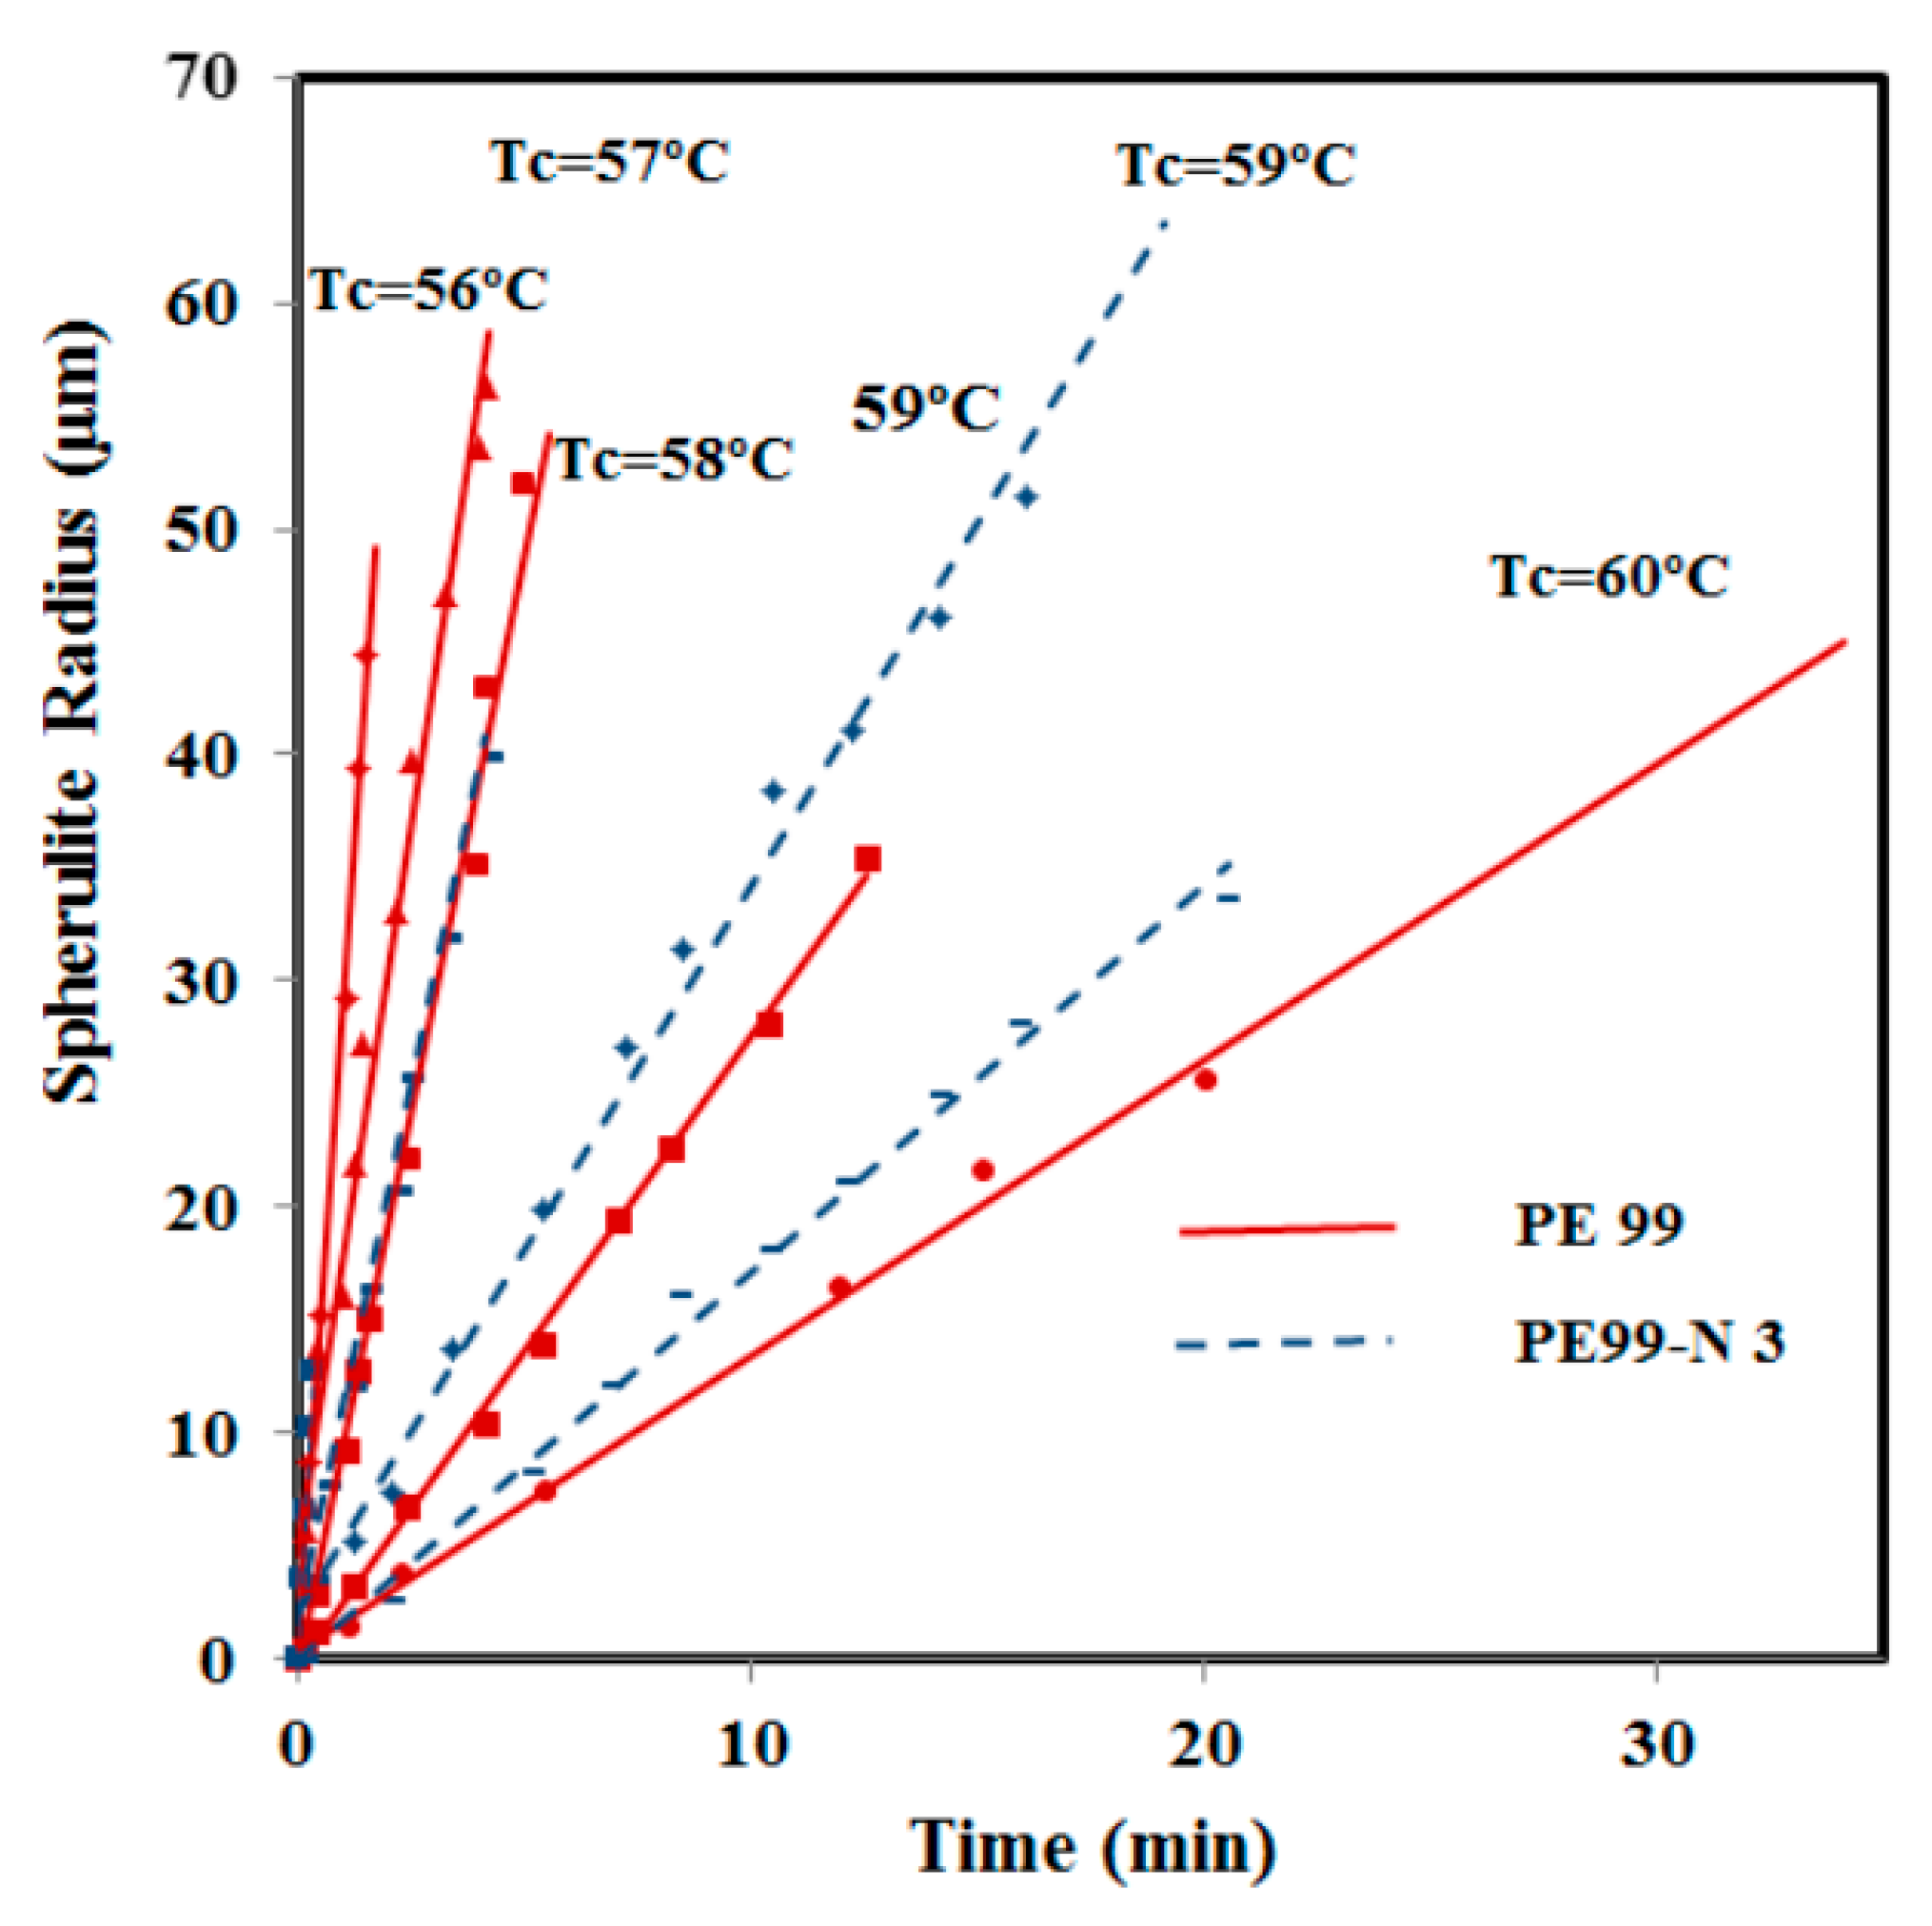
Crystallization kinetics from the melt state was also studied for micro-molded samples with and without functionalized silica nanospheres by optical microscopy. Spherulite radii grew linearly with time until impingement in both cases, as shown in Figure 12. Crystal growth rates were clearly higher for the nanocomposite at high crystallization temperatures, whereas differences were minimal when this temperature decreased. The relatively high growth rate allowed for collecting experimental data only over a narrow temperature range where crystallization was mainly governed by secondary nucleation (i.e., the typical bell curve of crystal growth rate versus temperature could not be obtained). The increase in the crystal growth rate for the nanocomposite is peculiar and suggests favored deposition of molecules onto existing crystal surfaces, as will be discussed. At lower temperatures, this effect seems to be counterbalanced by reduced chain mobility in the presence of silica nanoparticles and spatial constraints imposed by confinement [29,30].
Figure 12. Variation of PE99 (garnet) and PE99-N 3 (blue) spherulite radii with time for isothermal crystallizations performed at the indicated temperatures.
Applsci 05 01252 g012
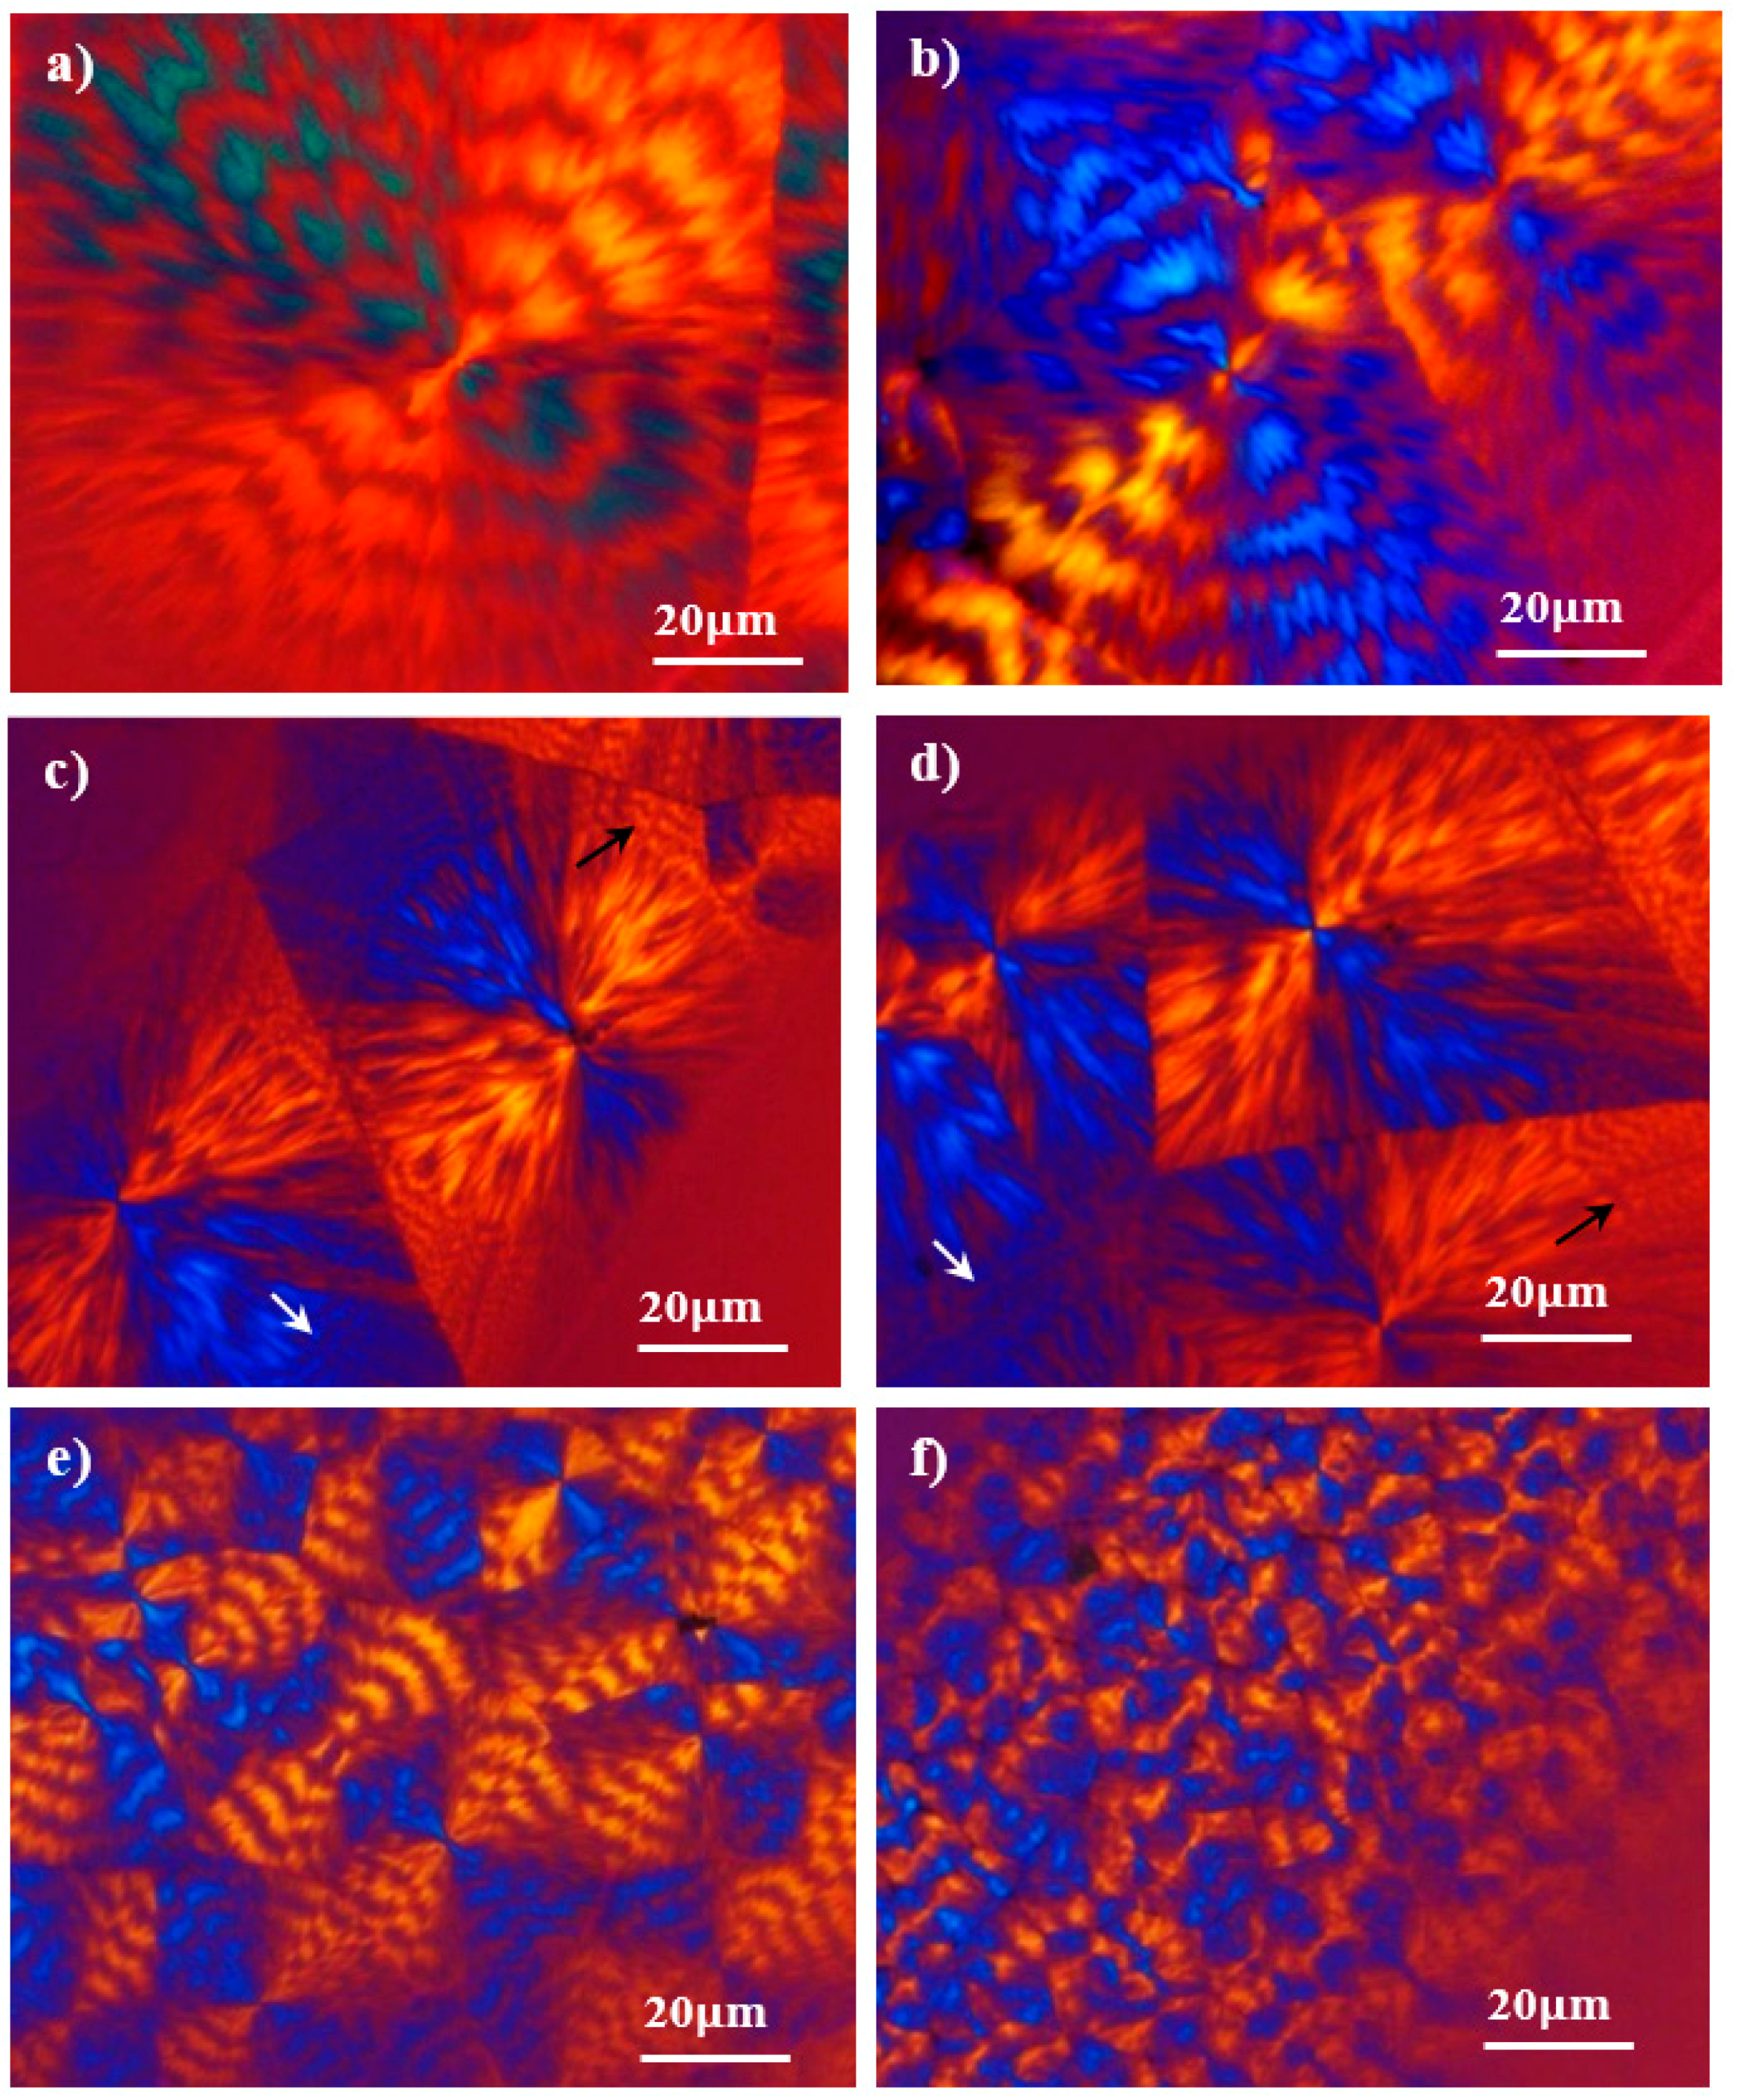
Pristine polyester and nanocomposite spherulites with similar morphological features were formed (Figure 13). Thus, both samples crystallized from the melt into ringed spherulites with negative birefringence. The spacing between rings decreased significantly with decreasing crystallization temperatures (i.e., 13 μm at 60 °C and 5 μm at 56 °C) and decreased slightly upon incorporation of nanospheres (i.e., 5 μm as opposed to 4 μm for crystallizations at 56 °C). A more confusing texture of less defined rings was detected at an intermediate temperature (i.e., 59 °C) for both samples. Note that pristine polyester and nanocomposite spherulites fill the field of view and have a relatively uniform size, suggesting athermal nucleation (i.e., the number of nuclei remains constant during crystallization). More interestingly, this result indicates good dispersion of silica nanoparticles in the polyester matrix. In fact, adsorption of PE99 molecules onto the functionalized surface of silica nanoparticles may hinder particle-particle agglomeration and enhance colloidal stability.
Figure 13. Optical micrographs of PE99 (a,c,e) and PE99-N 3 (b,d,f) spherulites isothermally grown at 60 °C (a,b); first step at 59 °C and second step at 54 °C (c,d); and 56 °C (e,f). Well-defined rings with interspacing between 3 and 2 μm were detected (see arrows) in the outer part of spherulites grown at 54 °C.
Applsci 05 01252 g013
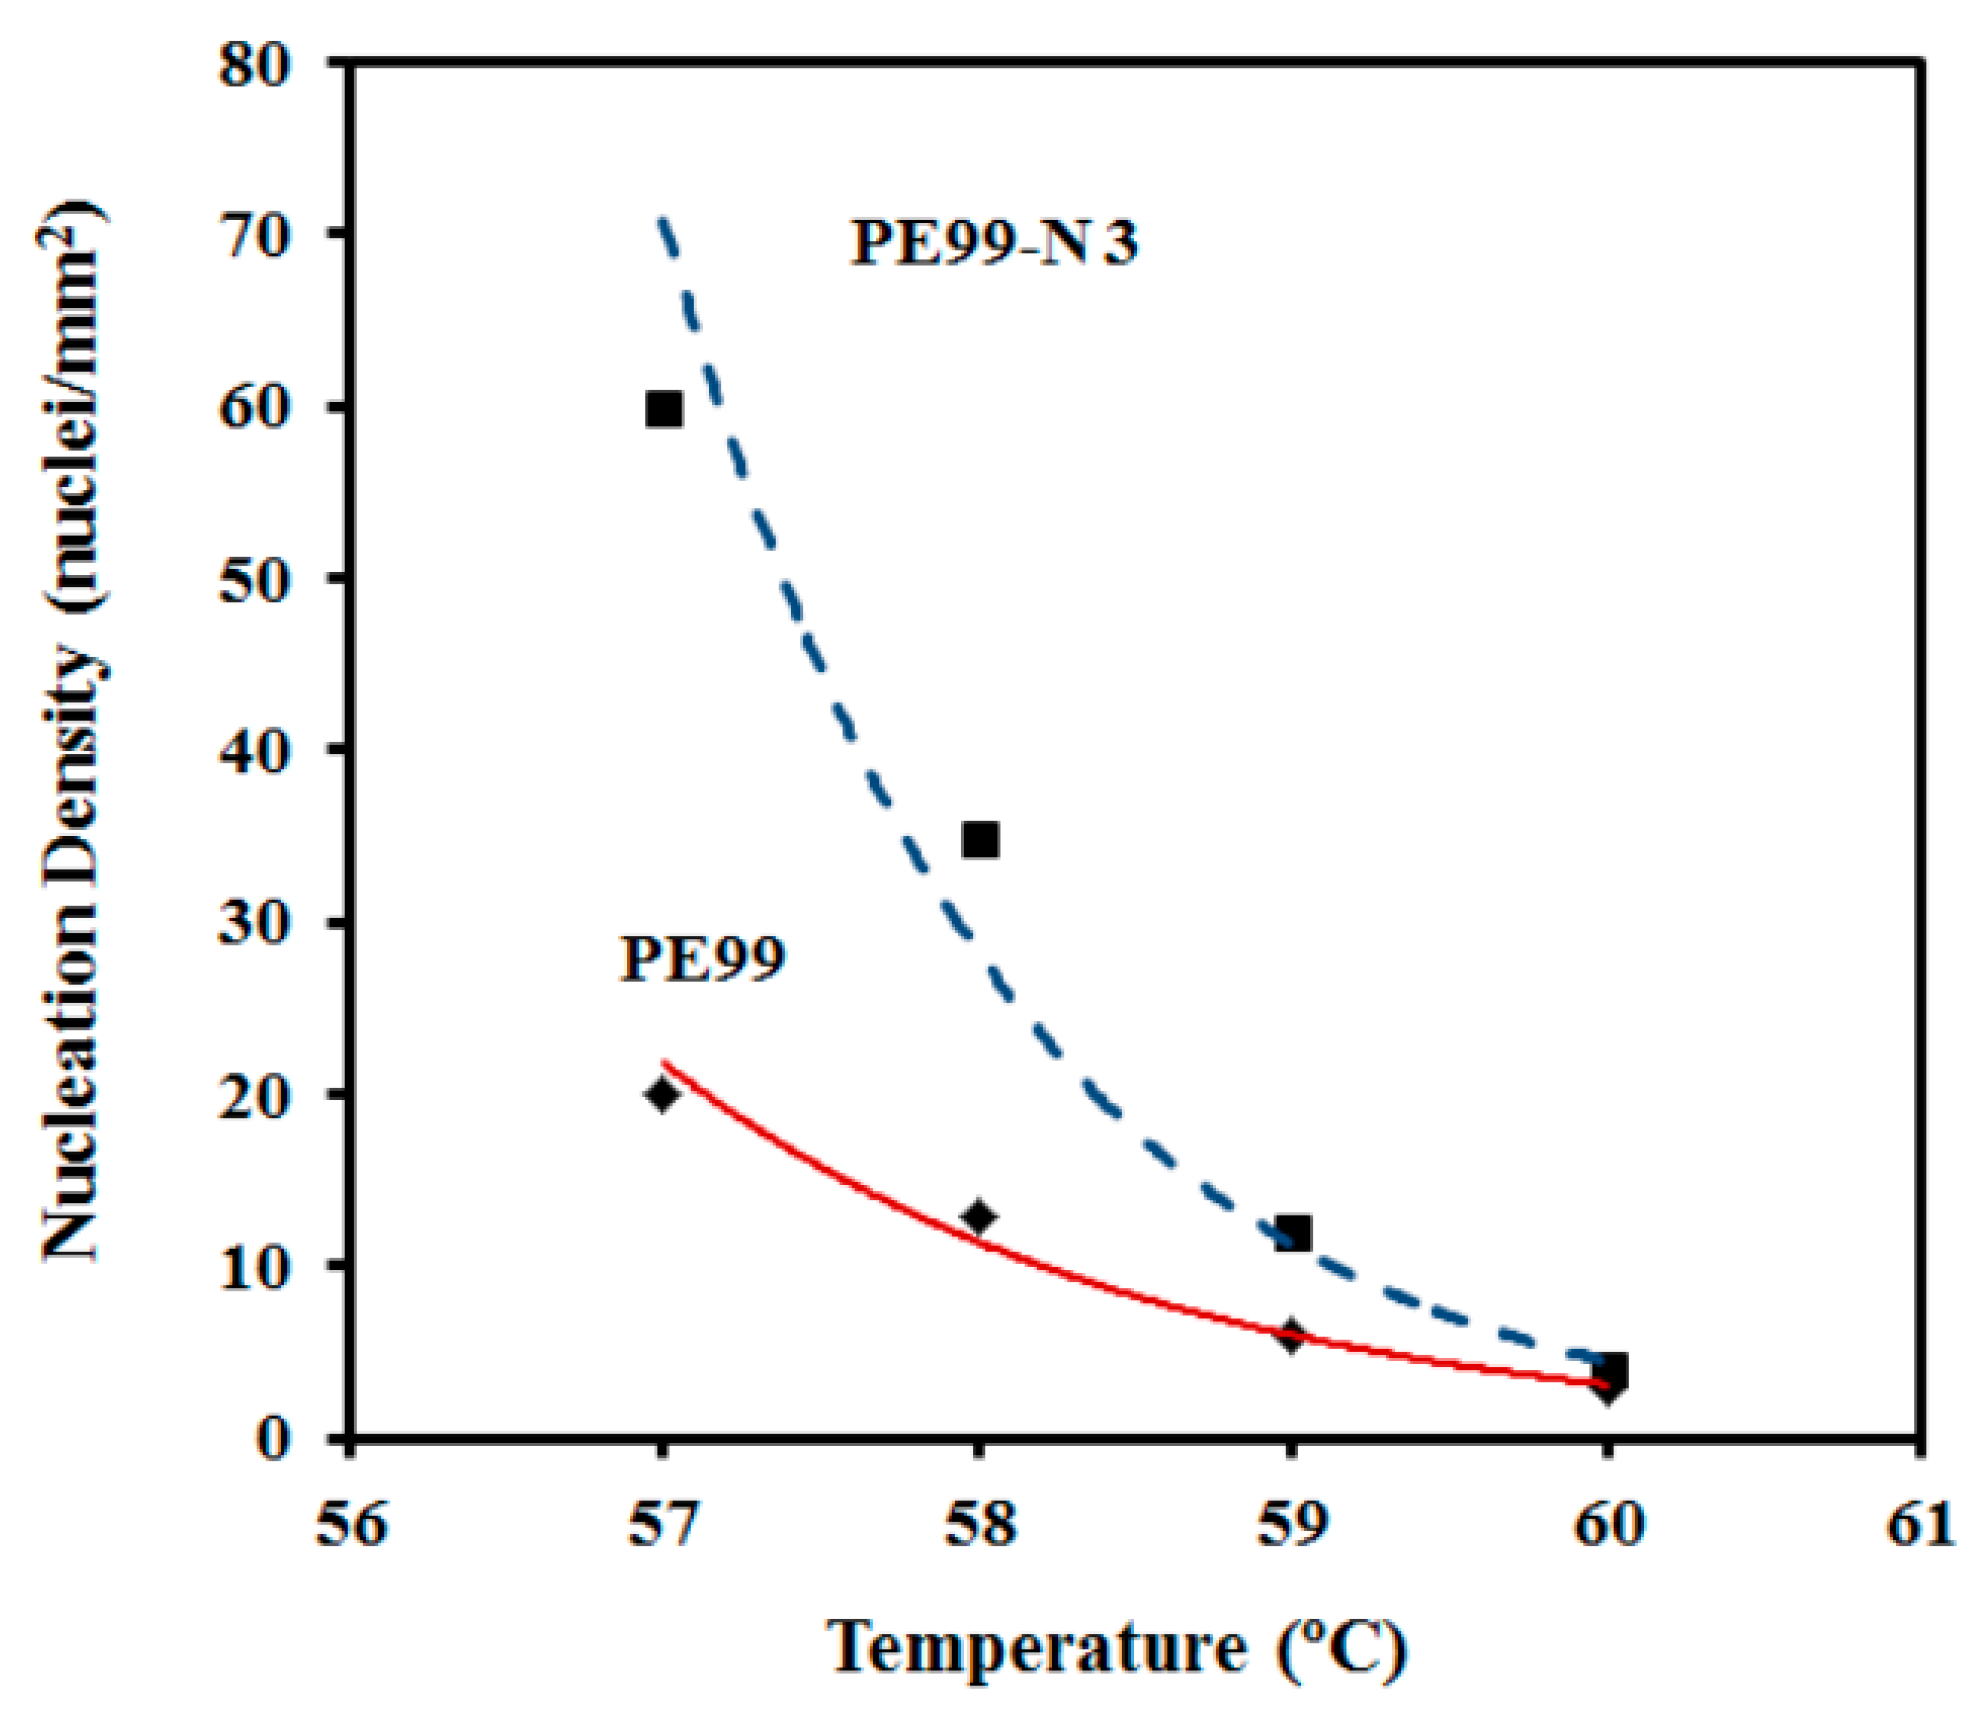
Despite the morphological similarities, great differences were detected in the primary nucleation (Figure 14). They were more remarkable at low crystallization temperatures; for example, nucleation densities of 60 and 20 nucleus/mm2 were determined from the optical micrographs taken at 57 °C. Note that crystal growth rates were similar at this temperature; consequently, the differences determined for the overall crystallization rate (e.g., 0.01284 and 0.00589 s−1 for PE99 and PE99-N 3 at 57 °C, respectively) were mainly attributed to a nucleation effect. On the contrary, nucleation densities were similar at high temperatures, while crystal growth rates were clearly different. Therefore, the incorporation of nanoparticles had a strong impact on the overall crystallization rate due to differences in crystal growth rate and primary nucleation densities, which became more significant at high and low crystallization temperatures, respectively. Figure 14 also shows that the nucleation density increased exponentially for the two samples at lower crystallization temperatures. These changes in nucleation logically affected the final spherulite size. Thus, a diameter decrease from 120 μm to 35 μm and from 80 μm to 15 μm was observed for PE99 and PE99-N 3 samples, respectively, when the temperature decreased from 60 °C to 56 °C.
Figure 14. Change in the nucleation density with isothermal crystallization temperature for PE99 (garnet) and PE99-N 3 (blue) samples.
Applsci 05 01252 g014
The logarithmic form of the Lauritzen and Hoffman equation [31] was employed to estimate the secondary nucleation constant (Kg):
lnG + U*/R(TcT) = lnG0Kg/(TcT)f)
where G is the radial growth rate, Tc is the crystallization temperature, T is the temperature below molecular motion ceases, ΔT is the degree of supercooling, f is a correction factor calculated as 2Tc/(Tm + Tc), U* is the activation energy, G0 is a constant preexponential factor, R is the gas constant, and Kg is the secondary nucleation constant.
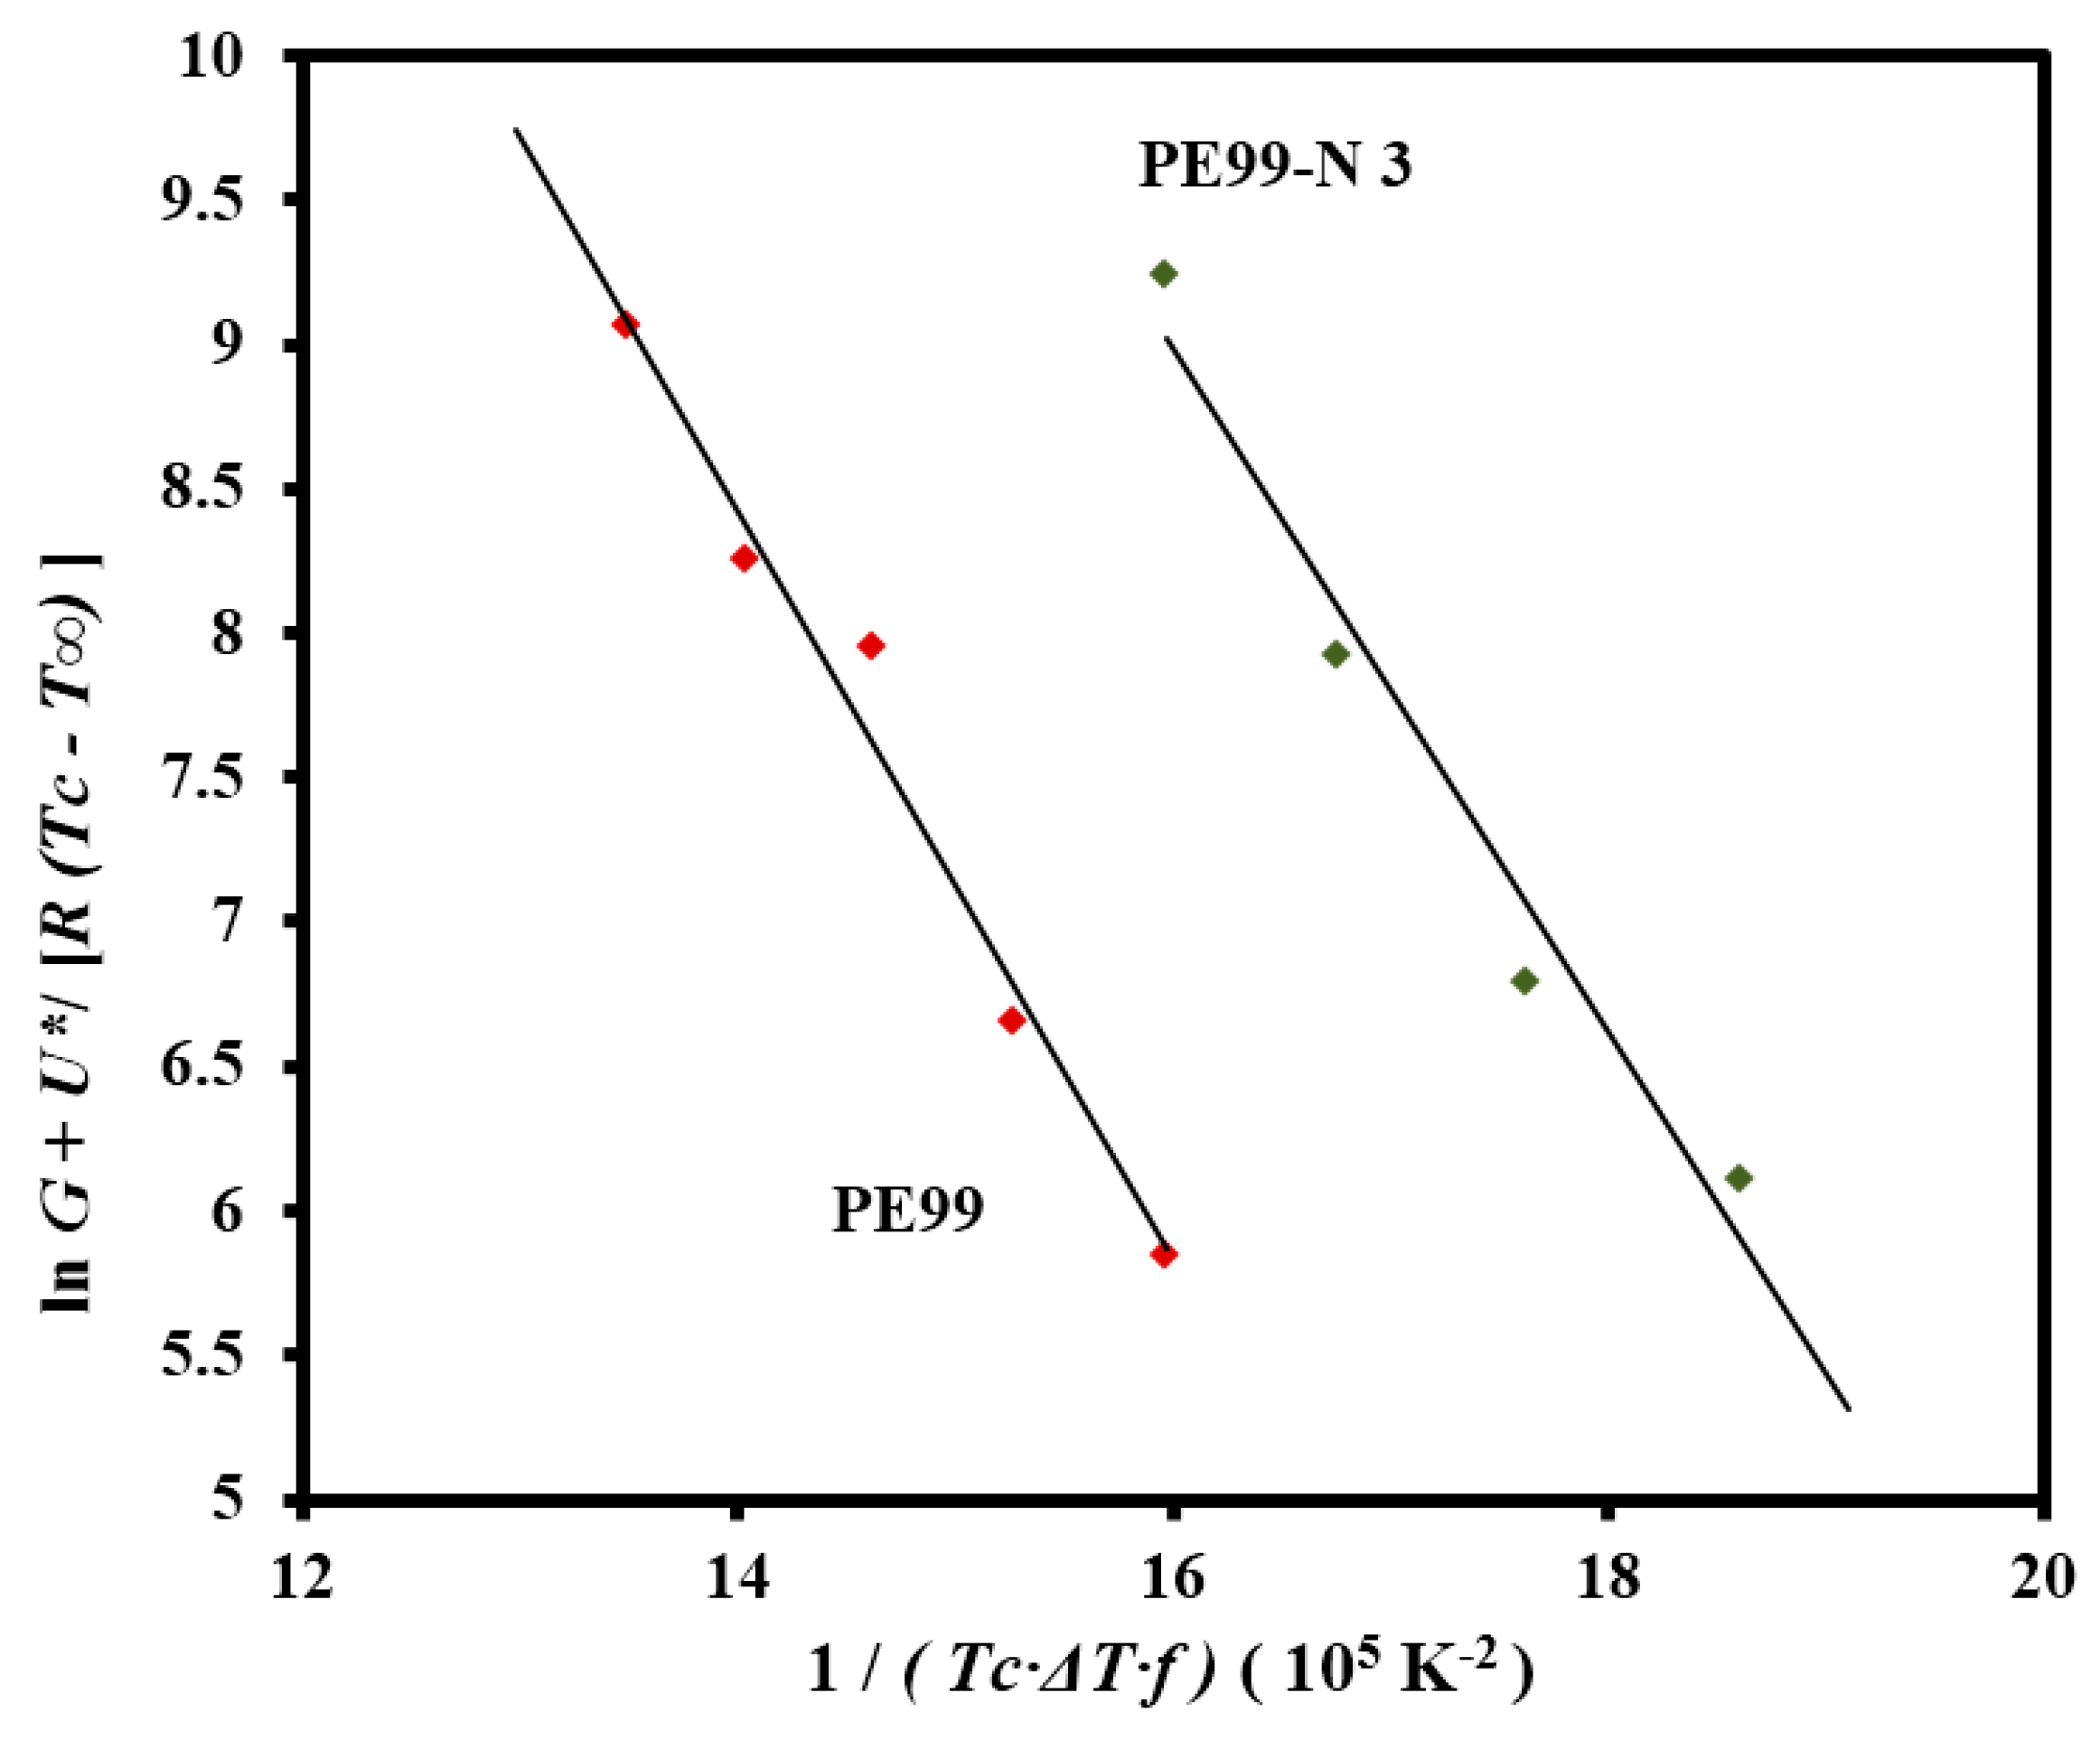
The Lauritzen-Hoffman plot was fitted with straight lines (r2 > 0.97) for micro-molded PE99 and PE99-N 3 samples when the “universal” values reported by Suzuki and Kovacs [32] (i.e., U* = 1500 cal/mol and T = Tg − 30 K) and the experimental Tg of PE99 (i.e., −45 °C) were used in the calculation (Figure 15).
The nucleation term (deduced from the slope of the plot) mainly influenced the kinetic features at low supercoolings in such a way that crystallization rates could become relatively insensitive to the U* and T parameters. Therefore, the equilibrium melting temperature was determined since it influenced the degree of supercooling, and consequently the nucleation term. Typical Hoffman-Weeks plots [33] were made with samples crystallized at different temperatures (not shown), leading to equilibrium temperatures of 79.2 °C and 76.4 °C for PE99 and PE99-N 3 samples, respectively. The slight change suggests less perfect lamellae upon addition of functionalized silica nanoparticles. The Lauritzen-Hoffman plot allowed for estimating secondary nucleation constants of 1.30 × 10⁵ and 1.18 × 10⁵ K2 for PE99 and PE99-N 3 samples, respectively. These values indicate that the presence of functionalized nanoparticles favored the crystallization process. Thus, enhanced PE99/SiO2 interfacial interaction may decrease the energy involved in the folding of polyester chains and promote their deposition on existing crystal surfaces during the secondary nucleation process [26,34].
Figure 15. Plot of lnG + U*/R(TcT) versus 1/Tc(∆T)f to determine the Kg secondary nucleation parameter of PE99 (garnet) and PE99-N 3 (blue) samples.
Applsci 05 01252 g015

4. Conclusions

Poly(nonamethylene azelate) and its mixtures with functionalized silica micro/nanoparticles could be micro-molded by means of ultrasonic energy and using similar time, amplitude, and force processing parameters. Minimal polymer degradation was detected in the molded specimens, as well as a dispersion of added particles. Furthermore, thermal stability was slightly improved by the addition of silica particles. Decomposition of grafted functional groups was only detected at the end of the thermal degradation process.
Silica nanoparticles had a significant influence on the crystallization process even at a low content of 3 wt. %. This point is important because crystallinity of samples needs to be controlled and specifically gives information about the mold temperature of the ultrasonic equipment that should be established to achieve a determined degree of crystallinity. Avrami exponents slightly decreased compared to the neat polymer as evidence of geometric constraints caused by incorporation of nanospheres. The overall crystallization rate of nanocomposites was always greater than that determined for the neat polymer, with the ratio of the respective constants ranging between 1.4 and 2.5.
Negative and ringed spherulites were obtained at all test temperatures, according to an athermal nucleation process. Primary nucleation was significantly enhanced by the addition of silica nanoparticles, whose functionalized surface was expected to favor the adsorption of polyester molecules. In addition, enhanced PE99/SiO2 interfacial interaction favored molecular deposition on existing crystal surfaces, causing a decrease in the secondary nucleation constant and an increase in the crystal growth rate.

Acknowledgments

This research was performed in the framework of an INNPACTO project “IPT-2011-0876-420000” and was also supported by grants from MINECO/FEDER and AGAUR (MAT2012-36205, 2014SGR188). We are grateful to Xavier Planta and Jordi Romero from Ultrasion S.L. and the Fundació ASCAMM, respectively, for their technical support. Gonzalo López has also contributed to experimental work concerning the preparation and functionalization of silica particles.

Author Contributions

Angélica Diáz performed the experiments; María Teresa Casas and Jordi Puiggalí directedthe research; Jordi Puiggalí wrote the manuscript. The manuscript was finalized through contributions from all authors, and all authors also approved the final manuscript.

Conflicts of Interest

The authors declare no conflict of interest.

References

  1. Fairbanks, H.V. Applying ultrasonics to the moulding of plastic powders. Ultrasonics 1974, 12, 22–24. [Google Scholar] [CrossRef]
  2. Paul, D.W.; Crawford, R.J. Ultrasonic moulding of plastic powders. Ultrasonics 1981, 19, 23–27. [Google Scholar] [CrossRef]
  3. Werner, K.S.; Burlage, K.; Gerhardy, C. Ultrasonic Hot Embossing. Micromachines 2011, 2, 157–166. [Google Scholar] [Green Version]
  4. Khuntontong, P.; Blaser, T.; Maas, D.; Schomburg, W.K. Fabrication of a polymer micro mixer by ultrasonic hot embossing. In Proceedings of the 19th Micro-Mechanics Europe Workshop, MME 2008, Aachen, Germany, 28–30 September 2008.
  5. Khuntontong, P.; Blaser, T.; Schomburg, W.K. Fabrication of molded interconnection devices by ultrasonic hot embossing of thin films. IEEE Trans. Electron. Packag. Manuf. 2009, 32, 152–156. [Google Scholar] [CrossRef]
  6. Michaeli, W.; Spennemann, A.; Gartner, R. New plastification concepts for micro injection moulding. Microsyst. Technol. 2002, 8, 55–57. [Google Scholar] [CrossRef]
  7. Michaeli, W.; Starke, C. Ultrasonic investigations of the thermoplastics injection moulding process. Polym. Test. 2005, 24, 205–209. [Google Scholar] [CrossRef]
  8. Michaeli, W.; Kamps, T.; Hopmann, C. Manufacturing of polymer micro parts by ultrasonic plasticization and direct injection. Microsyst. Technol. 2011, 17, 243–249. [Google Scholar] [CrossRef]
  9. Chen, J.; Chen, Y.; Li, H.; Lai, S.Y.; Jow, J. Physical and chemical effects of ultrasound vibration on polymer melt in extrusion. Ultrason. Sonochem. 2010, 17, 66–71. [Google Scholar] [CrossRef] [PubMed]
  10. Chen, G.; Guo, S.; Li, H. Ultrasonic improvement of rheological behavior of polystyrene. J. Appl. Polym. Sci. 2002, 84, 2451–2460. [Google Scholar] [CrossRef]
  11. Kang, J.; Chen, J.; Cao, Y.; Li, H. Effects of ultrasound on the conformation and crystallization behavior of isotactic polypropylene and β-isotactic polypropylene. Polymer 2010, 51, 249–256. [Google Scholar] [CrossRef]
  12. Cao, Y.; Li, H. Influence of ultrasound on the processing and structure of polypropylene during extrusion. Polym. Eng. Sci. 2002, 42, 1534–1540. [Google Scholar] [CrossRef]
  13. Sacristán, M.; Plantá, X.; Morell, M.; Puiggalí, J. Effects of ultrasonic vibration on the micro-molding processing of polylactide. Ultrason. Sonochem. 2014, 21, 376–386. [Google Scholar] [CrossRef] [PubMed]
  14. Planellas, M.; Sacristán, M.; Rey, L.; Olmo, C.; Aymamí, J.; Casas, M.T.; del Valle, L.J.; Franco, L.; Puiggalí, J. Micro-molding with ultrasonic vibration energy: New method to disperse nanoclays in polymer matrices. Ultrason. Sonochem. 2014, 21, 1557–1569. [Google Scholar] [CrossRef] [PubMed]
  15. Díaz, A.; Casas, M.T.; del Valle, L.J.; Aymamí, J.; Olmo, C.; Puiggalí, J. Preparation of micro-molded exfoliated clay nanocomposites by means of ultrasonic technology. J. Polym. Res. 2014, 21, 584–596. [Google Scholar] [CrossRef]
  16. Usuki, A.; Kojima, Y.; Kawasumi, M.; Okada, A.; Fukushima, Y.; Kurauchi, T.; Kamigaito, O. Mechanical properties of nylon 6-clay hybrid. J. Mater. Res. 1993, 8, 1185–1189. [Google Scholar] [CrossRef]
  17. Kojima, Y.; Usuki, A.; Kawasumi, M.; Okada, A.; Kurauchi, T.; Kamigaito, O. Synthesis of nylon 6-clay hybrid by montmorillonite intercalated with ε-caprolactam. J. Polym. Sci. Part A 1993, 31, 983–986. [Google Scholar] [CrossRef]
  18. Kojima, Y.; Usuki, A.; Kawasumi, M.; Okada, A.; Kurauchi, T.; Kamigaito, O. One-pot synthesis of nylon 6-clay hybrid. J. Polym. Sci. Part A 1993, 31, 1755–1758. [Google Scholar] [CrossRef]
  19. Burgaz, E. Poly(ethylene-oxide)/clay/silica nanocomposites: Morphology and thermomechanical properties. Polymer 2011, 52, 5118–5126. [Google Scholar] [CrossRef]
  20. Choi, M.; Kim, C.; Jeon, S.O.; Yook, K.S.; Lee, J.Y.; Jang, J. Synthesis of titania embedded silica hollow nanospheres via sonication mediated etching and re-deposition. Chem. Commun. 2011, 47, 7092–7094. [Google Scholar] [CrossRef] [PubMed]
  21. Yang, F.; Ou, Y.; Yu, Z. Polyamide 6/silica nanocomposites prepared by in situ polymerization. J. Appl. Polym. Sci. 1998, 69, 355–361. [Google Scholar] [CrossRef]
  22. Xu, X.; Li, B.; Lu, H.; Zhang, Z.; Wang, H. The effect of the interface structure of different surface-modified nano-SiO2 on the mechanical properties of nylon 66 composites. J. Appl. Polym. Sci. 2008, 107, 2007–2014. [Google Scholar] [CrossRef]
  23. Vassiliou, A.A.; Papageorgiou, G.Z.; Achilias, D.S.; Bikiaris, D.N. Non-isothermal crystallisation kinetics of in situ prepared poly(ε-caprolactone)/surface-treated SiO2 nanocomposites. Macromol. Chem. Phys. 2007, 208, 364–376. [Google Scholar] [CrossRef]
  24. Busbee, J.D.; Juhl, A.T.; Natarajan, L.V.; Tongdilia, V.P.; Bunning, T.J.; Vaia, R.A.; Braun, P.V. SiO2 Nanoparticle Sequestration via Reactive Functionalization in Holographic Polymer-Dispersed Liquid Crystals. Adv. Mater. 2009, 21, 3659–3662. [Google Scholar] [CrossRef]
  25. Li, Z.; Barnes, J.C.; Bosoy, A.; Stoddart, J.F.; Zink, J.I. Mesoporous silica nanoparticles in biomedical applications. Chem. Soc. Rev. 2012, 41, 2590–2605. [Google Scholar] [CrossRef] [PubMed]
  26. Lee, E.; Hong, J.Y.; Ungar, G.; Jang, J. Crystallization of poly(ethylene oxide) embedded with surface-modified SiO2 nanoparticles. Polym. Int. 2013, 62, 1112–1122. [Google Scholar] [CrossRef]
  27. Avrami, M. Kinetics of phase change. I General Theory. J. Chem. Phys. 1939, 7, 1103–1112. [Google Scholar] [CrossRef]
  28. Avrami, M. Kinetics if phase change. II Transformation time relations for random distribution of nuclei. J. Chem. Phys. 1940, 8, 212–224. [Google Scholar] [CrossRef]
  29. Kennedy, M.; Turturro, G.; Brown, G.R.; St-Pierre, L.E. Silica retards radial growth of spherulites in isotactic polystyrene. Nature 1980, 287, 316–317. [Google Scholar] [CrossRef]
  30. Nitta, K.H.; Asuka, K.; Liu, B.; Terano, M. The effect of the addition of silica particles on linear spherulite growth rate of isotactic polypropylene and its explanation by lamellar cluster model. Polymer 2006, 47, 6457–6463. [Google Scholar] [CrossRef]
  31. Lauritzen, J.I.; Hoffman, J.D. Extension of theory of growth of chain folded polymer crystals to large undercoolings. J. Appl. Phys. 1973, 44, 4340–4352. [Google Scholar] [CrossRef]
  32. Suzuki, T.; Kovacs, A.J. Temperature dependence of spherulitic growth rate of isotactic polystyrene. A critical comparison with the kinetic theory of surface nucleation. Polym. J. 1970, 1, 82–100. [Google Scholar] [CrossRef]
  33. Hoffman, J.D.; Weeks, J.J. Melting process and the equilibrium melting temperature of polychlorotrifluoroethylene. J. Res. Natl. Bur. Stand. 1962, 66, 13–28. [Google Scholar] [CrossRef]
  34. Wang, K.; Wu, J.; Zeng, H. Radial growth rate of spherulites in polypropylene/barium sulfate composites. Eur. Polym. J. 2003, 39, 1647–1652. [Google Scholar] [CrossRef]

