1. Introduction
In the past decade, terawatt, table top laser systems based upon chirped pulse amplification (CPA) [
1] have been successfully used in many laboratories worldwide to explore the laser-matter interaction regime in the ultra-short, ultraintense domain. The wealth of new results thus obtained have generated entirely new fields of research including novel X-ray and
γ-ray sources and laser-driven acceleration of particles. Intense CPA pulses are also considered for the fast-ignition [
2] in inertial fusion energy and for the investigation of warm dense matter physics, also through the interaction with solid targets [
3,
4]. These results are now providing a strong motivation for the development of new laser infrastructures like HiPER [
5] and ELI [
6].
Laser-plasma acceleration [
7] is certainly the area in which the most exciting results have been obtained. In particular, laser wakefield accelerator (LWFA) [
8] has been explored as the most promising technique for the acceleration of electron bunches and takes advantage of the high longitudinal electric fields supported by longitudinal electron waves in a plasma. In the LWFA, electrons are trapped in the plasma wave that has a phase velocity very close to the speed of light and gain energy as long as they are in phase with the accelerating region of the field. Recent experiments [
9,
10,
11] show that quasi-monoenergetic electron bunches can be accelerated from the background electron plasma population up to high (
>100 MeV) energies. Numerical simulations [
12,
13,
14] show that for sufficiently short and intense laser pulses, the so-called bubble regime of LWFA is activated in which a single accelerating cavity is produced and effective trapping of background electrons occurs. A similar scheme has been used in the demonstration of GeV acceleration of electrons [
15]. Most of these experiments require very high laser intensity and demanding installations, but compact laser systems can also be successfully used to drive efficient laser-plasma electron sources with properties ideal for a wide range of applications.
Recent theoretical works [
16] indicate that with a proper choice of laser, plasma, and injection parameters, the acceleration of electron bunches with small energy spread and short bunch length can occur starting from initially large bunch length and energy spread. By considering that the energy of an accelerated electron bunch can be increased by multiple collinear or non-collinear [
17] injections in plasma channels, the stability of the injection and the reduction of the laser energy required for the production of the initial electrons become the key issues of this process. Recently, laser-driven electron acceleration at moderate laser intensities (power
< 10 TW) [
18,
19,
20] and application of accelerated bunches to nuclear physics relevant conditions [
21] have been demonstrated.
In this paper we illustrate laser-plasma acceleration studies based upon self-injection, in progress at two intense laser laboratories currently operating in Italy in both interaction regimes outlined above. The Intense Laser Irradiation Laboratory (ILIL), located at the CNR research campus in Pisa, has been operating for more than a decade in the field of intense lasers and also has an ongoing investigation focused on biomedical applications of table-top laser-plasma electron sources. We describe the experimental conditions on which plasma acceleration at ILIL is achieved using a moderate power laser system, to achieve acceleration of electron bunches with high charge and acceptable energy spread suitable for biomedical applications. The FLAME (Frascati Laser for Acceleration and Multidisciplinary Experiments) installation, located at the INFN Frascati National Laboratories and now part of the SPARCLAB initiative, has been established recently in a wider experimental area dedicated to explore all flavors of plasma acceleration, including self-injection, external injection, particle driven acceleration, etc. Here we will focus on the part of the programme that concerns laser-plasma acceleration with self-injection, with attention to the identification of the laser-plasma acceleration regime obtained in different conditions through dedicated experimental measurements and via comparison with detailed numerical simulations. We will also briefly discuss the experimental configuration in view of future all-optical radiation sources and related studies and applications.
2. ILIL: A Compact Laser Plasma Accelerator
The Ti:Sa system operating at ILIL currently generates pulses as short as 40 fs with a peak power exceeding 2 TW at the repetition rate of 10 Hz. Here we focus on some key results obtained earlier with a 67 fs duration FWHM and a second, low energy probe pulse. The temporal and spatial properties of the femtosecond pulses were characterised in detail using custom developed second-order autocorrelator [
22]. The contrast of the laser pulse,
i.e., the ratio between the peak power and the low intensity pedestal originating from pre-pulses and amplified spontaneous emission (ASE), was measured with a third-order cross-correlator (SEQUOIA). In this system, the full power pulse, attenuated by reflections off high quality uncoated glass flats (
∼ 10
2 attenuation), is split in two equally intense pulses using a beam splitter. One of the pulses is sent through an optical delay line and is frequency doubled in a BBO crystal. The frequency doubled pulse is combined with the remaining fundamental pulse in a non-linear crystal to generate third harmonic radiation. The signal is detected in the forward direction by a photomultiplier.
The autocorrelation curve obtained from the second-order autocorrelator yielded a laser pulse duration (FWHM) of 67 fs. The cross-correlation curve over a range of 200 ps gave a contrast of 109 over the entire explored range. Moreover, the intensity of the short pre-pulses before the main pulse is below 10−5 times the intensity of the main pulse. According to these measurements, our laser system can be considered basically free from pre-pulse. This was further verified by interferometry measurements taken at different time-steps around the main pulse, showing no detectable plasma formation up to a few tens of femtoseconds before the main pulse. The spatial quality of the laser pulse was studied by means of an equivalent plane monitor (EPM) using a 100 cm nominal focal length optics and a 12 bits CCD camera (a Photometrics Sensys) with a pixel size of 8 µm size. These EPM measurements show that with the 20 cm focal length off axis parabolic mirror used in our experiment, a FWHM focal spot of approximately 10 µm is found. Transmission measurements through pin-holes of known diameters were carried out at low laser intensity (below plasma formation on the pin-hole substrate) to estimate the Strehl ratio, which was found to be as high as 0.9. Considering the pulse length of 67 fs and an energy of 120 mJ, we find that the maximum intensity on the target can exceed 1018 W/cm2.
3. The Experiment at ILIL
A detailed description of the experiment and all the diagnostics is described elsewhere [
23]. Here we give a summary of those results relevant for the foreseen applications. In the experiment, the main pulse was focused onto a gas-jet target using an F/6 off-axis parabola. The gas-jet target was irradiated at full laser energy varying the gas backing pressure,
i.e., the pressure in the pipe before the fast valve controlling the nozzle to change the value of the maximum density of the neutral gas.
Two gases, namely He and N2, were used explore the role of different physical properties mainly related to the atomic number, and, in particular, to the ionisation properties under irradiation of ultrashort, intense laser pulses. The gas-jet nozzle was characterised by a 4 mm long, 1.2 mm wide slit and was mounted on a micrometric motorised support in order to move the interaction point along the three Cartesian axes (position scan). During the pulsed operation, the gas flows out of the slit at supersonic speed in order to produce steep interfaces between gas and vacuum. The vacuum in the chamber before the shot is maintained at a pressure below ∼ 10−4 Torr by a turbo-molecular pump (Varian Turbo-V 550) connected to the chamber by a gate-valve.
Thomson scattering imaging and plasma interferometry were set up perpendicularly to the main laser pulse propagation axis to measure plasma density distribution. A second group of diagnostics, including scintillators coupled to photomultipliers, a phosphor screen (LANEX), an electron spectrometer based upon permanent magnets and dose sensitive, radiochromic film stacks SHEEBA [
24], enabled indirect and direct detection and characterisation of the electron bunches accelerated during the laser-gas interaction.
We use Thomson imaging to derive information on the laser intensity as discussed in detail in [
25]. Indeed, a careful analysis of the Thomson scattering images obtained in our experiment suggests that in our ILIL configuration, laser pulse channelling takes place that significantly extends the length of the interaction region. This observation is confirmed by the interferometry measurements obtained by using a Nomarski-type interferometer (see [
26] and references therein) arranged with the line of sight set to be perpendicular to the main laser pulse propagation axis. It is well known that optical probing techniques are based upon the dependence of the plasma refractive index on the electron density according to the following expression:
In the interferometer, a probe beam is set to propagate through the region of interest. A lens is used to image the region of interest with the required magnification and resolution. A Wollaston prism is then used to split the probe beam into two partially overlapping beams. In the overlapping region an interference pattern is produced with a fringe separation set to be perpendicular to the laser propagation direction.
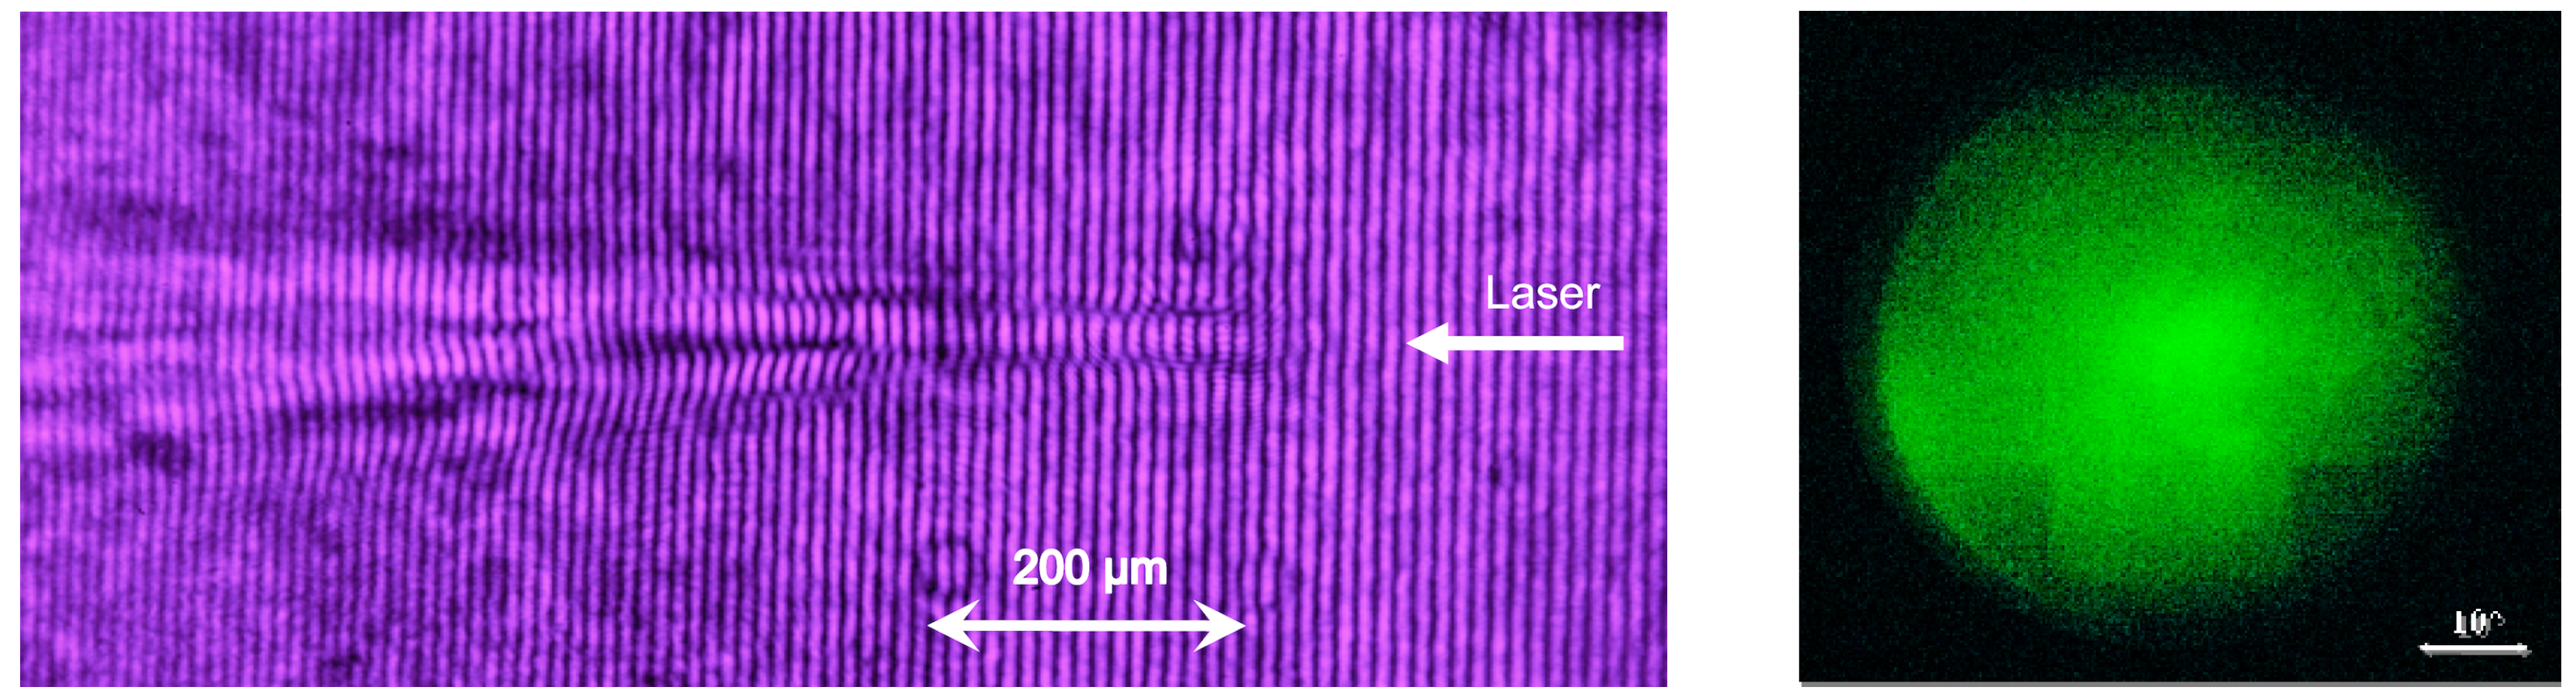
Figure 1(left) shows a typical interferogram taken after propagation throughout the gas-jet. This image clearly shows a collimated propagation of the laser pulse over a distance of approximately 200
µm. Beyond this point, the beam rapidly expands with a clear evidence of beam break-up and filamentation. The extraction of the electron density from the interferogram was performed using the code IACRE [
27,
28]. The density map thus obtained shows a maximum electron density of 7
× 10
19 cm
−3 in the 200
µm long plasma channel.
Figure 1.
Left: Interferogram of the gas-jet interaction region taken 2 ps after propagation of the laser pulse. The shot was taken in N2 at a backing pressure of 35 bar, with the laser focal plane located 50 µm into the gas-jet and 400 µm from the nozzle output plane. Right: typical outputs of LANEX showing moderately collimated laser-accelerated electrons in case of N2 gas @ 50 bar.
4. Electron Beam Characterisation
Characterisation of the laser accelerated electrons was carried out using four different diagnostics. A set of 3 scintillators were arranged to detect the
γ-rays produced by the electrons via Bremsstrahlung on the target chamber. A phosphor screen (Kodak LANEX Regular Screen) was placed on the laser axis to image out the accelerated electron beam. In a preliminary stage, a dosimetric film stack SHEEBA [
24] based upon radiochromic films was used to obtain simultaneous spectro-angular distribution of electrons. This detector provides information on the entire electron bunch since angular selection (collimation) is not needed prior to detection as in the case of magnetic spectrometers. This makes SHEEBA very useful when the properties of the accelerated bunch are not known or when significant angular/energy spread is expected. After this preliminary stage, highly collimated electron bunches were analyzed using magnetic spectrometers as discussed in [
29].
In the case of scintillators, the scattering of energetic electrons within the walls of the chamber generates
γ-ray that can be detected and measured by an oscilloscope to show basic evidence of high energy electrons. The LANEX phosphor screen was filtered with a 25
µm Al foil and was coupled with an optical system imaging its rear surface. When an electron hits the sensitive material, as shown in
Figure 2, the phosphors emit optical (green) radiation from the rear surface of the screen. This radiation was then imaged out of the vacuum chamber using a photographic objective, on to a commercial digital SLR camera (Pentax Digital Camera K 100D Super). The camera was equipped with a custom built trigger unit to enable synchronised shooting with the shortest possible shutter operation of 250 ms. This set up enabled direct observation of the electron bunch divergence and allowed us to obtain information on the shot by shot fluctuations of the bunch charge.
Figure 1(right) shows a raw image of the entire exposed LANEX area, with the electron beam pattern obtained in two shots taken in two different experimental conditions.
Figure 1(right) presents the typical electron signal from N2 gas (@50 bar backing pressure) that shows a large bunch divergence of approximately 20 deg. A much narrower angular distribution was found in the case of He gas (@ 50 bar), which is of the order of 2 degrees (FWHM). While the narrow beam condition was not highly reproducible, the beam pattern of
Figure 1(right) was very stable and reproducible, in a range of pressures from 30 to 40 bars. These experimental conditions are indeed interesting for applications of high-charge electron beams [
21].
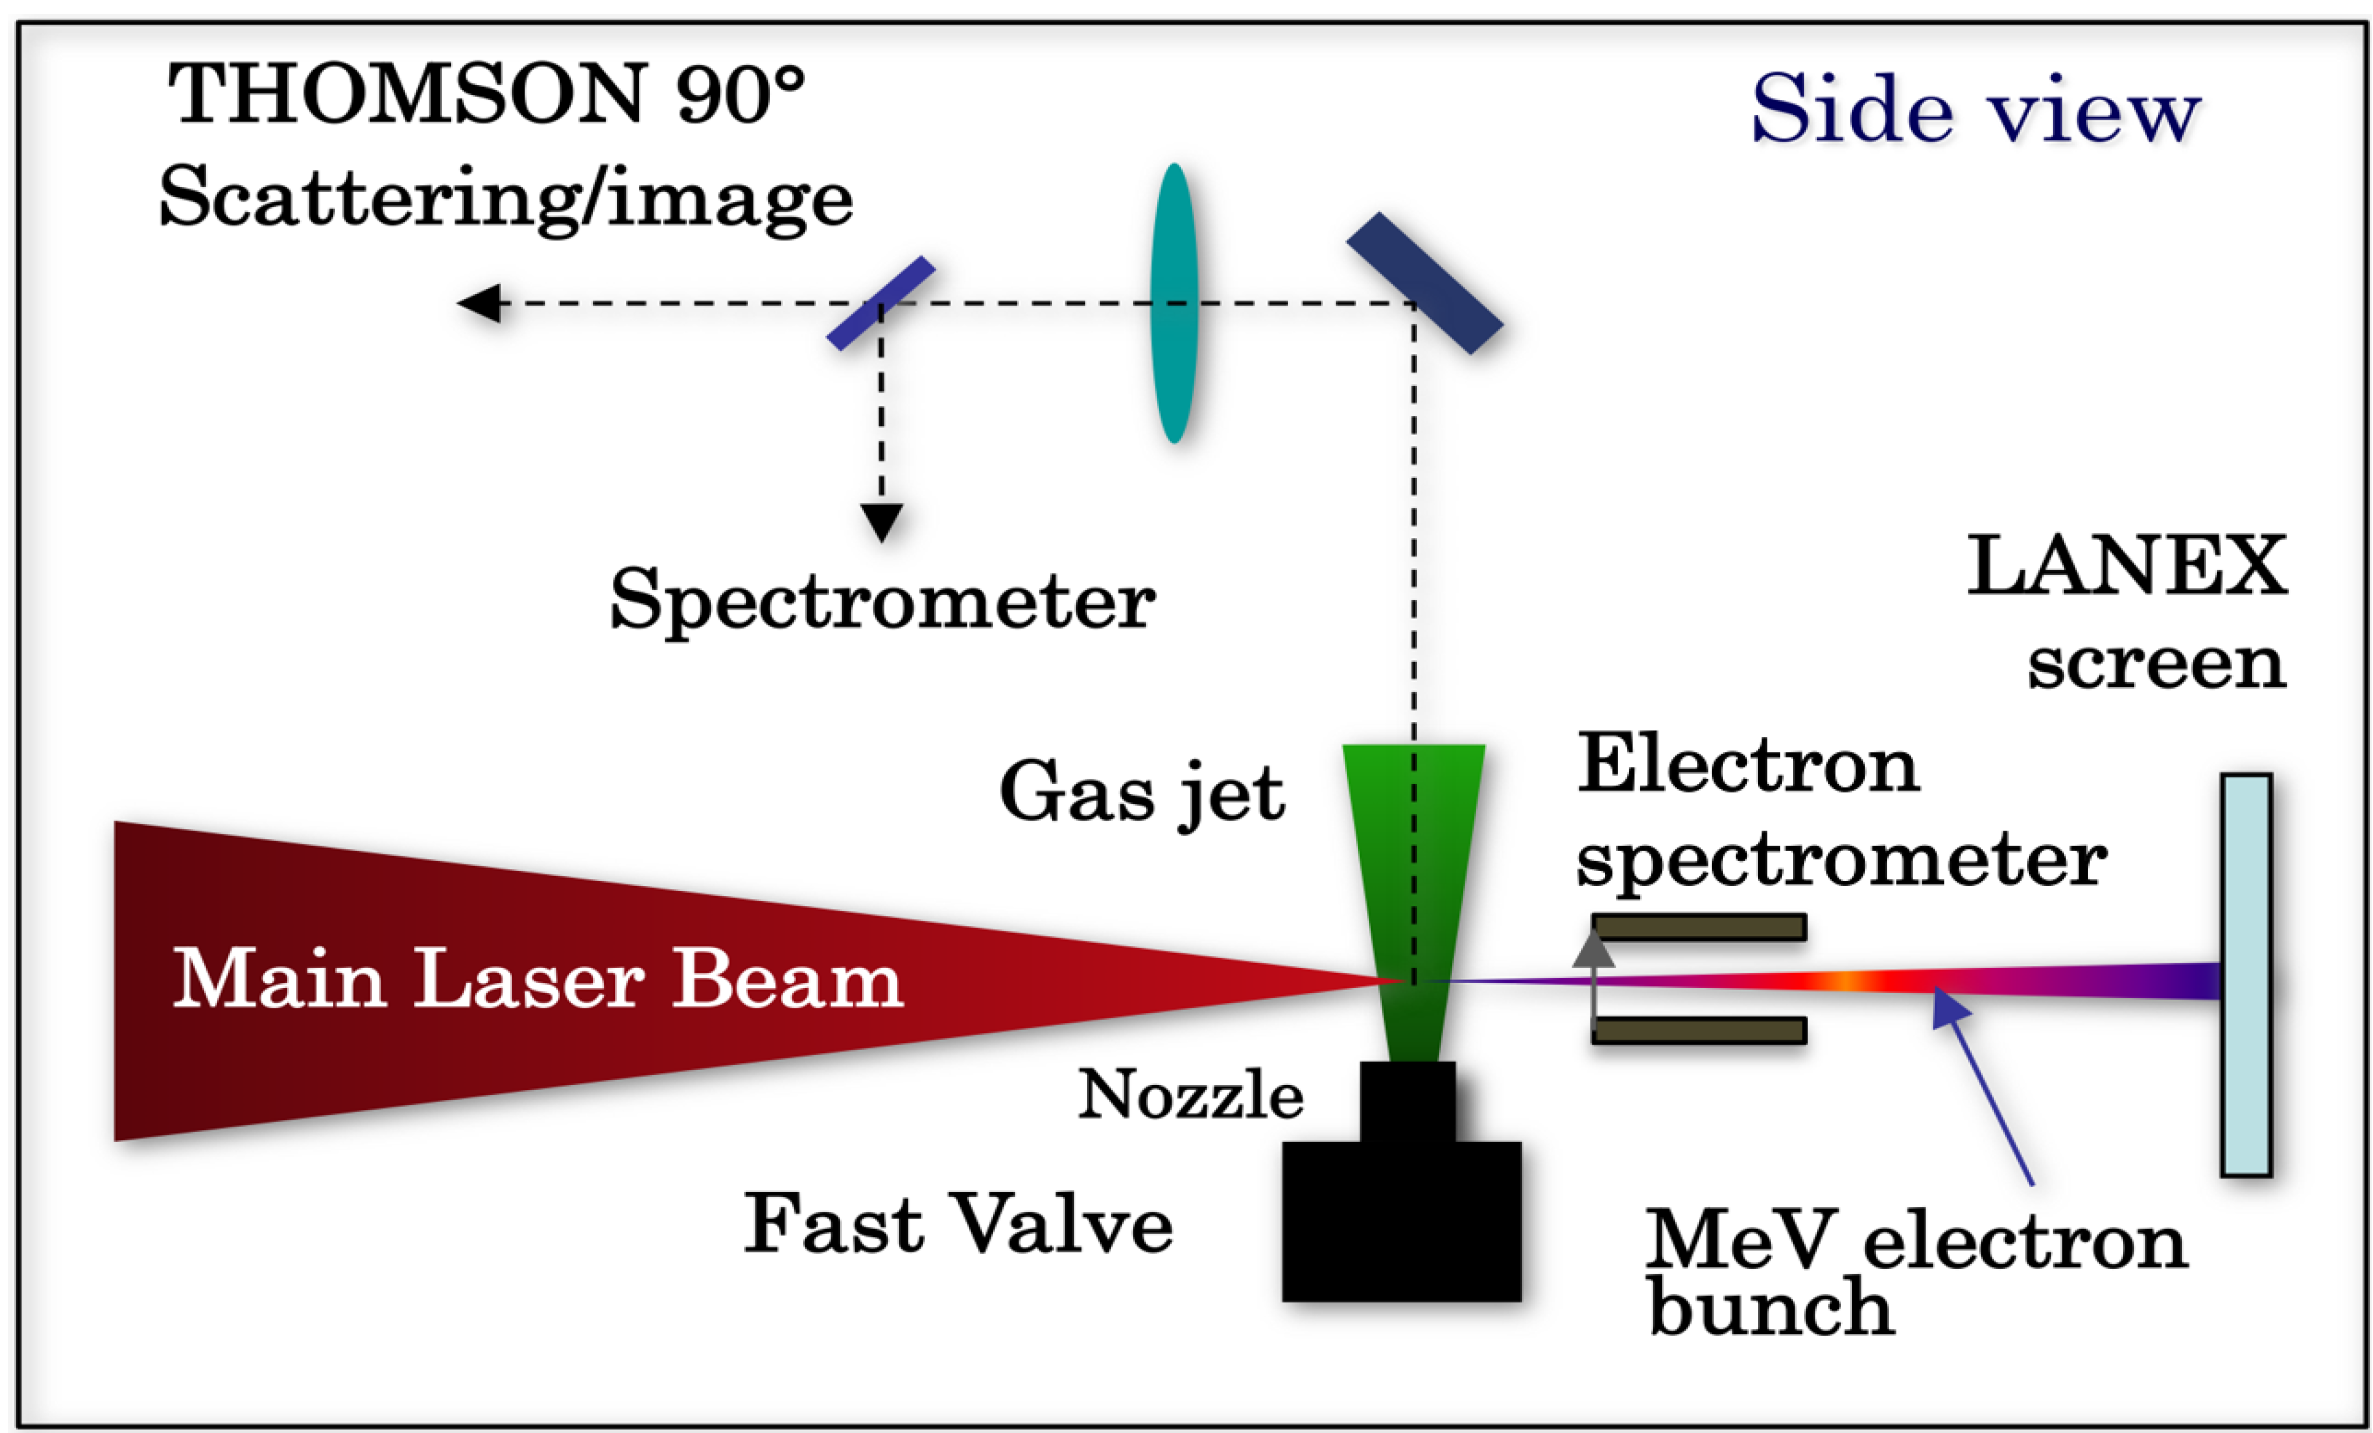
Figure 2.
Schematic layout of the experimental setup: side view showing the main interaction geometry of the laser beam relative to the gas-jet, the magnetic electron spectrometer and the LANEX screen for detection of electrons.
Figure 2.
Schematic layout of the experimental setup: side view showing the main interaction geometry of the laser beam relative to the gas-jet, the magnetic electron spectrometer and the LANEX screen for detection of electrons.
A spectral analysis of the accelerated electrons was carried out using a magnetic spectrometer coupled with the LANEX screen. The spectrometer, based upon permanent NeFeB magnets generating a quasi-uniform magnetic field (BMax ∼ 0.45 T), was placed at a distance of 44 mm in front of the LANEX screen. The magnetic field amplitude was mapped in the region of interest using a millimetre-sized Hall magnetic probe. A 2 mm thick Pb foil with a ∼ 0.5 mm slit width was placed in front of the magnet, with the slit direction parallel to the magnetic field, in order to limit the transverse momentum of electrons accepted by the electron spectrometer and consequently to increase the resolution of the spectrometer.
Numerical modelling [
30] based upon particle tracing in the mapped magnetic field was implemented to describe the performance of the spectrometer to obtain the dispersion curve and the intrinsic resolution of both the imaging acquisition system and the LANEX screen. The code also accounts for errors introduced by beam pointing instability and space-charge effects along propagation. The results obtained by the magnetic spectrometer were confirmed by independent measurements carried out using an energy spectrometer consisting of sandwiched Radiochromic films [
31] (RCF). A sample spectrum obtained with the magnetic spectrometer with N
2 gas-jet is displayed in
Figure 3.
According to this spectrum, electrons up to 10 MeV were detected, with an overall spectral distribution characterised by a broad peak with a maximum between 5 and 6 MeV. In some shots, narrower spectral components were found, though with a poor reproducibility. A summary of the results obtained in our experimental condition and for both He and N
2 gas-jet is reported in
Table 1. Also included in the table is a list of the main parameters characterising our experimental setup, including laser and gas-jet parameters. These results confirm that, in spite of the very low laser intensity compared with most of the experiments available in literature, the electrons accelerated in our experimental conditions are well in the multi-MeV region, with evidence of mono-energetic components emerging clearly from the broad energy spectrum. Remarkably, a stable production of electron bunches was obtained when using the N
2 gas-jet, while the use of He resulted in a less reproducible operation, with narrower beam divergence.
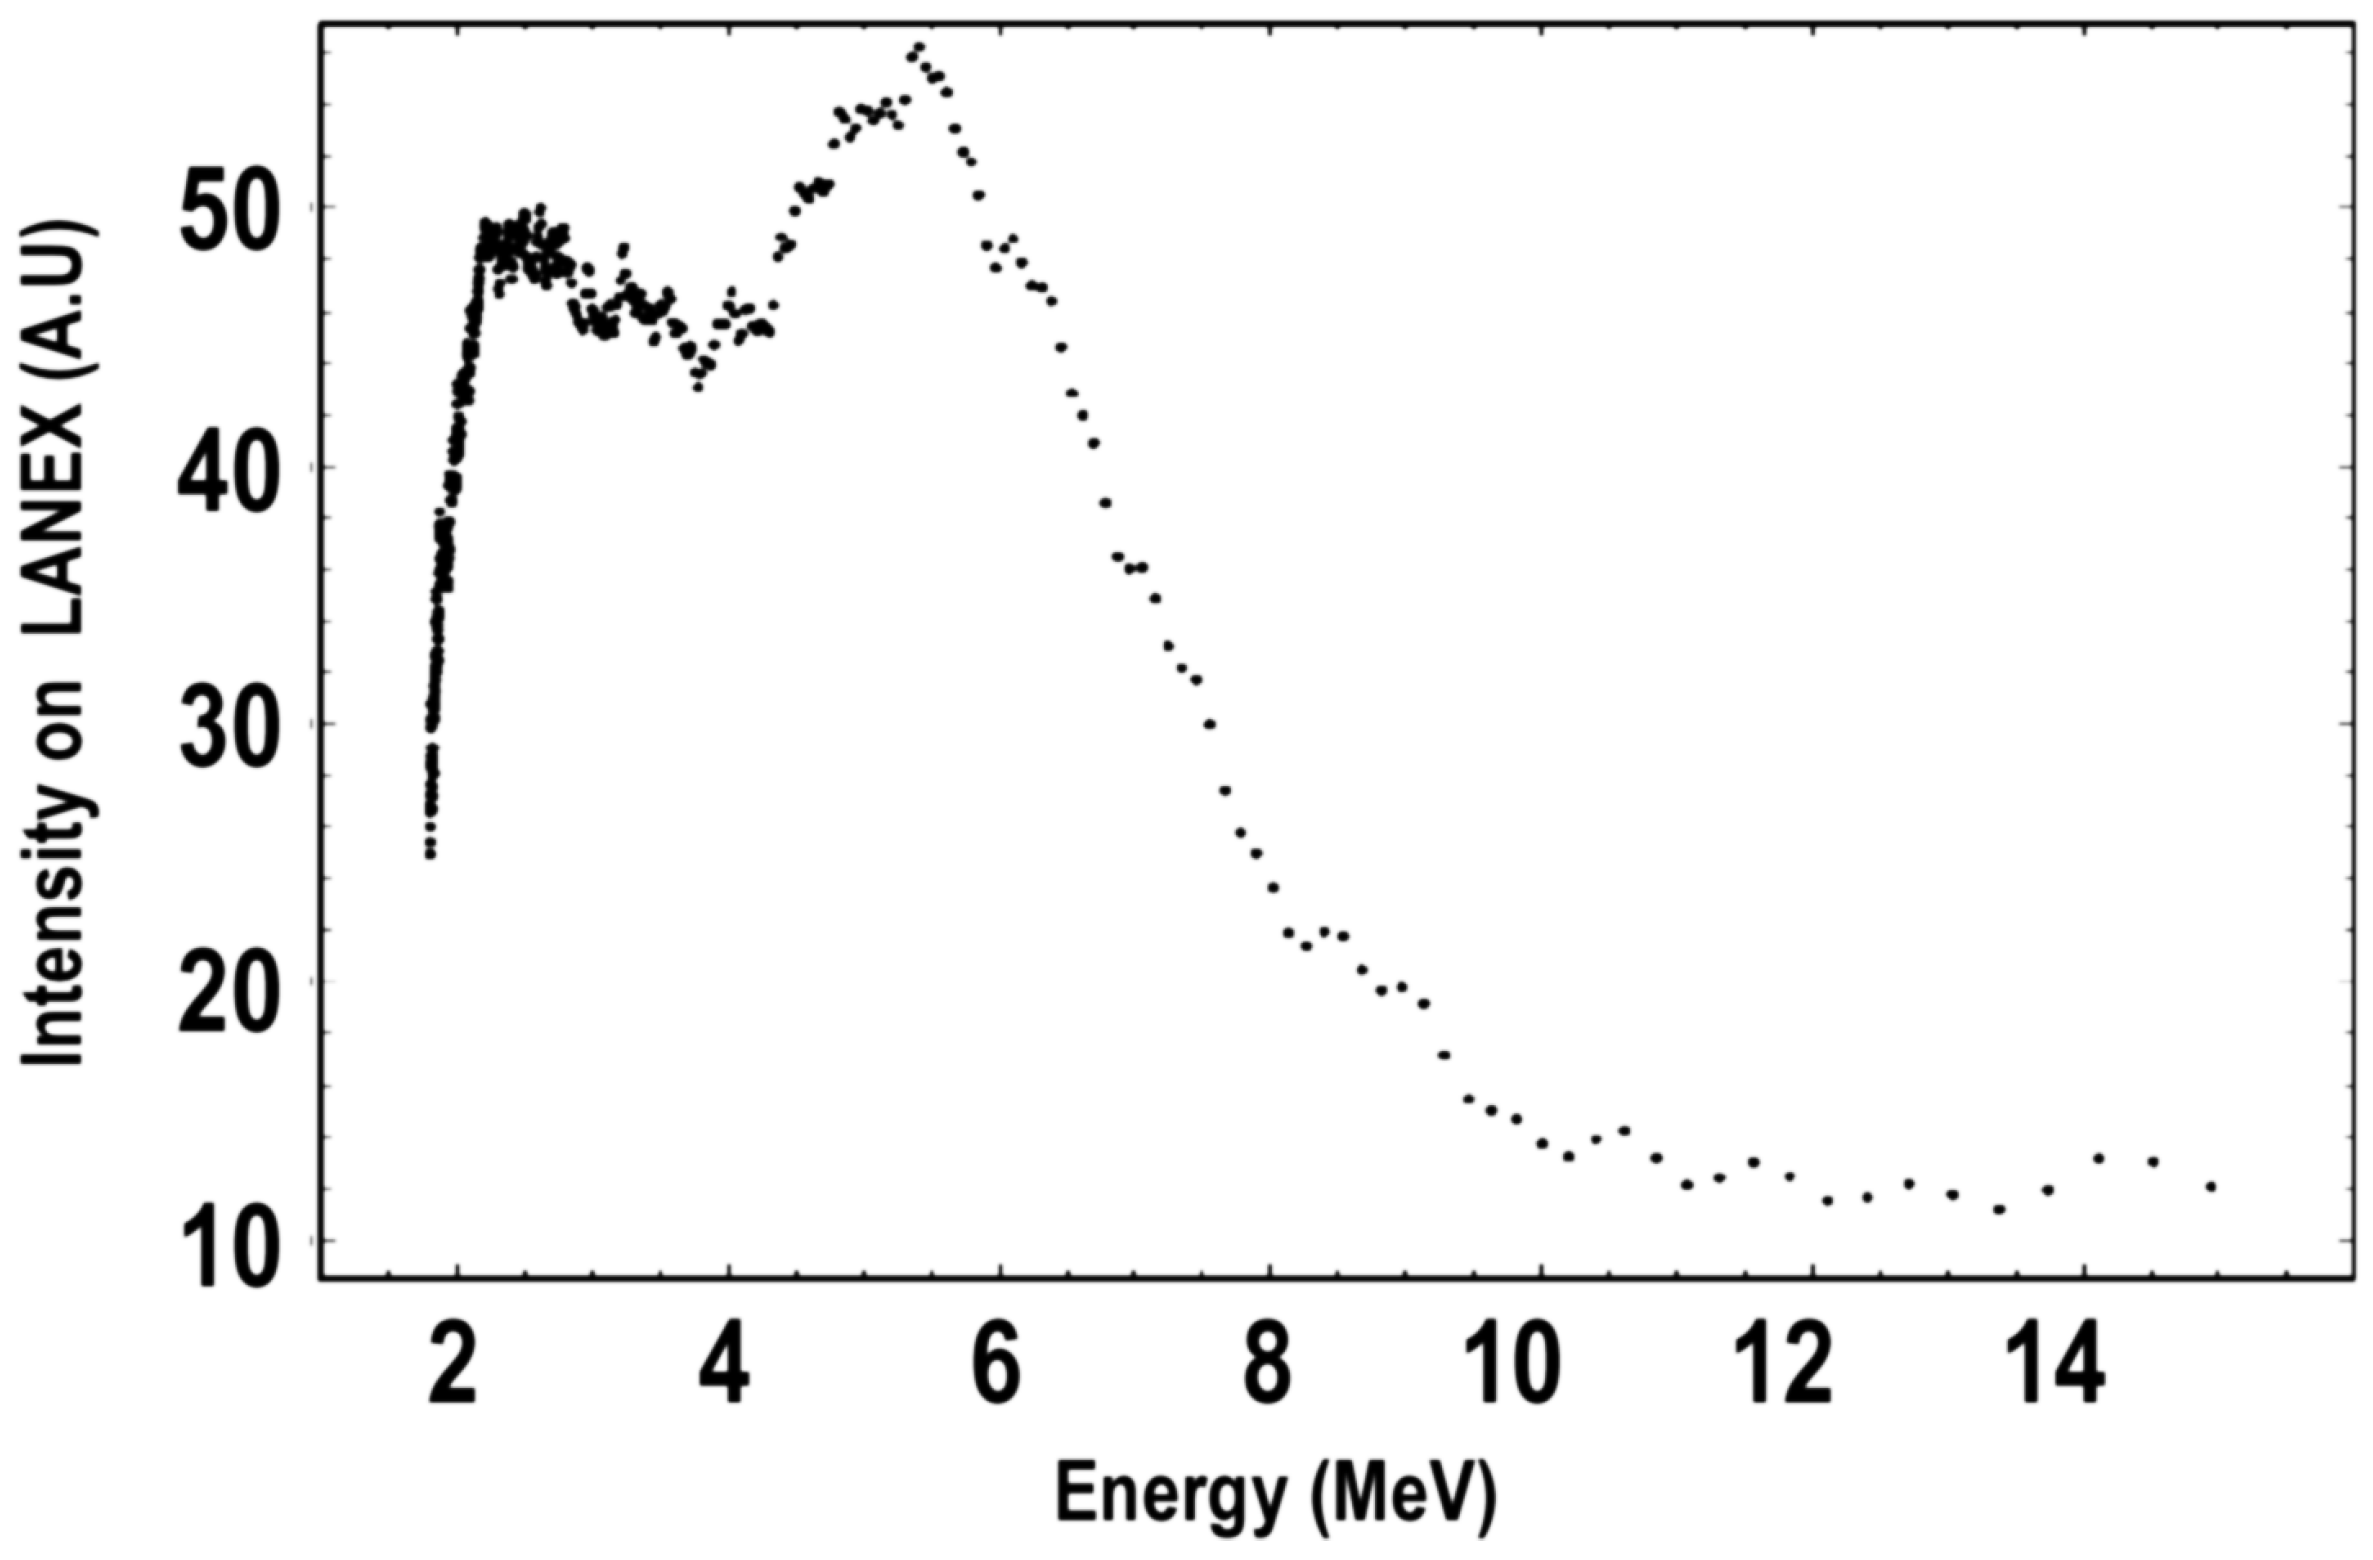
Figure 3.
Electron spectrum obtained with the magnetic spectrometer showing quasi monoenergetic peak between 5 and 6 MeV. The spectrum was obtained from irradiation of a N2 gas-jet with a backing pressure of 45 bar.
Figure 3.
Electron spectrum obtained with the magnetic spectrometer showing quasi monoenergetic peak between 5 and 6 MeV. The spectrum was obtained from irradiation of a N2 gas-jet with a backing pressure of 45 bar.
Table 1.
List of input and output parameters of the laser-plasma accelerator at ILIL.
Table 1.
List of input and output parameters of the laser-plasma accelerator at ILIL.
| Input paramenters | Output parameters |
|---|
| Laser wavelength = 800 nm | ne= 7 × 1019cm−3 |
| Laser pulse duration
≥ 65 fs | Plasma channel length
≈ 200 µm |
| Laser energy
< 120 mJ | Plasma channel diameter
≤ 30 µm |
| Optics numerical aperture = F/6 | Max energy (cut-off)
≈ 10 MeV |
| Calc. focal spot radius = 3
µm | Electron energy peak @ 5-6 MeV |
| Calc. depth of focus = 24
µm | e-beam divergence (He)
< 3 deg |
| Meas. focal spot diam. = 10
µm | e-beam divergence (N2)
≈ 10 deg |
| gas-jet thickness = 1.2 mm | e-beam reproducibility (N2): high |
| Pulse contrast ratio (ns) = 10−9 | Bunch charge (N2)
> 0.1 nC |
5. Model of Acceleration Scheme at ILIL
The control of electron bunch features for applications is a very complex task that requires an accurate knowledge of the key parameters of our experimental configuration and the identification of the main acceleration mechanism occurring in our experiment. This is indeed not a simple task in our particular experimental conditions, which are quite different from the ideal self-injection conditions as, for exam- ple, in the bubble regime [
32]. In a previous experiment [
33], MeV electrons were obtained with a 200 fs laser pulse focused at a similar intensity as the one considered here. Those measurements were modelled invoking direct laser acceleration at the channel betatron resonance as described in [
34]. However, in our experiment a significantly shorter laser pulse duration was used along with a lower electron density. These differences are likely to make laser wakefield acceleration more effective than in [
33], also due to the marginal overlap between the laser pulse and the trailing channel. Starting from these assumptions, we explored the possible scenario using the Particle-in-Cell (PIC) numerical code AlaDyn [
35] capable of modelling a 3-dimensional laser-plasma interaction configuration. AlaDyn is a fully self-consistent, 1/2/3-dimensional, relativistic Electro-Magnetic PIC code capable of handling laser pulse(s), injected bunch(es) and a user defined plasma, featuring high order schemes in space/time, with computational moving window, stretched computational grid and Boosted Lorentz frame. This code enabled us to take into account details of our experimental configuration, including laser parameters, focusing geometry and some of the gas-jet features. According to the theory, a significant self-focusing of the laser beam may occur under such experimental conditions. Using the well known expression for relativistic self-focusing,
Pcr ≈ 17(
ω/ωp)
2 GW and taking into account the measured electron density of 7
×10
19 cm
−3, we find that the critical power in our experimental conditions is 0
.4 TW, which is below the nominal power of our laser system. This result suggests that in our experiment, conditions are satisfied for laser beam self-focusing to occur. A confirmation of this result was obtained from 3-dimensional AlaDyn calculations as summarised in the plot of
Figure 4, which shows the evolution of the laser beam intensity along the propagation distance. Two different density profiles have been considered in order to take into account shot-to-shot variability and to study the sensitivity of the dynamics to the physical parameters.
Figure 4.
Evolution of the beam intensity (in red) as obtained by Aladyn PIC simulations (see text), showing that in our experimental conditions a strong self-focusing occurs on a longitudinal scale length of less than 100 µm, leading to a more than 10-fold increase of the local intensity. The solid and dashed lines refer respectively to the density profiles #1 and #2.
In both cases, according to the simulations, the self-focusing brings the peak laser beam intensity up to a value larger than 2
.7
× 10
19 W/cm
2. The ponderomotive force associated with the leading front of this very high intensity pulse leads to a strong charge separation with the consequent growth of electron plasma waves. We observe the formation of a main wake with a “bubble”-like [
32] structure (see
Figure 5). Even if the normalised vector potential of the laser (
a=
eA/mc2) reaches the peak value
a ≃ 4, which would be compatible with particle injection in the bubble regime [
36,
37], we do not observe injection from the rear side of the bubble. This is due to the fact that the decreasing plasma ramp (see
Figure 4) is unable to sustain the self-focusing over a long distance and the laser intensity suddenly drops (on a scale of
∼ 50
µm) to values that are unfavourable for the injection. However, trapping of the background particle inside the wake still occurs. These particles are accelerated up to energies of 15
÷20 MeV and exhibit an overall thermal-like spectrum since they interact with the transverse field of the laser pulse whose length (
∼20
µm) is larger if compared with the “bubble” size, which is of the order of the plasma wavelength (
∼5–10
µm). According to the PIC simulations, the accelerated charge is approximately
∼ 0
.1 nC (in agreement with experimental data) and the angular divergence of the beam is in the range 10°–16°(FWHM).
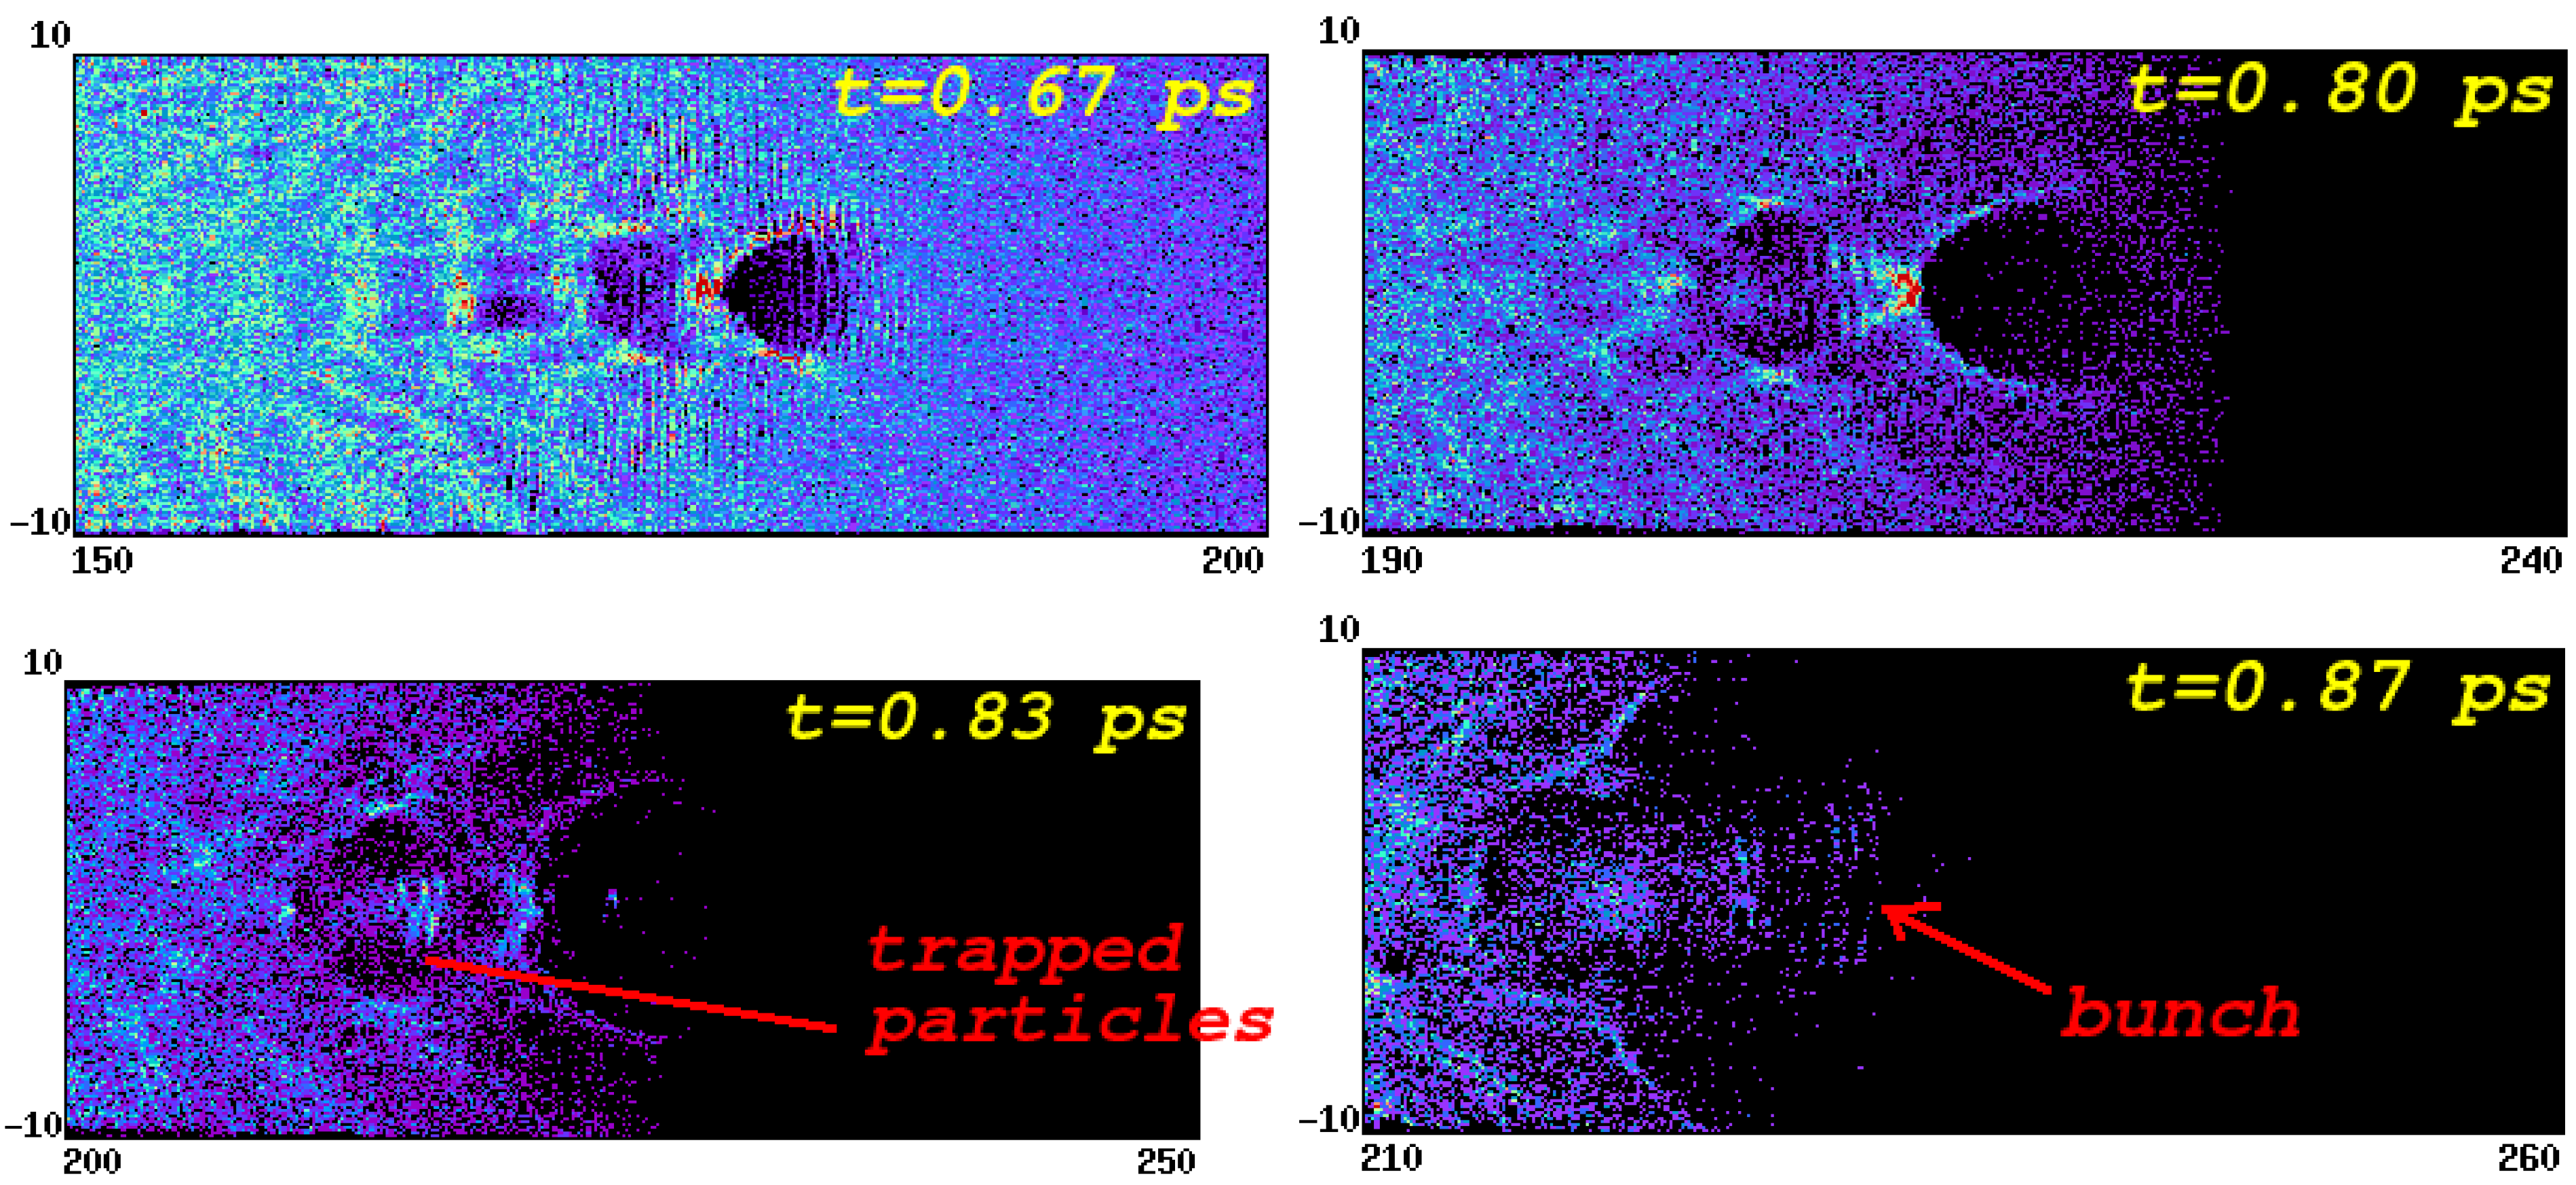
Figure 5.
Electron density cut at different times, as obtained from PIC simulation, showing the growth of the wake-field structure. The observation window of the code moves at the speed of light following the laser propagation. Electron density increases from blue to red.
Figure 5.
Electron density cut at different times, as obtained from PIC simulation, showing the growth of the wake-field structure. The observation window of the code moves at the speed of light following the laser propagation. Electron density increases from blue to red.
6. Towards all Optical γ-Ray Sources
Based on the experimental results summarised above, a new experimental campaign was established aimed at demonstrating both high energy and control of electron acceleration using the FLAME laser system. In this case, the establishment of a reliable working point for acceleration with self-injection was motivated by the perspective of developing a novel, all optical
γ-ray source based upon inverse Compton scattering of laser accelerated electrons. In fact, all-optical, Bremsstrahlung
γ-ray sources have already been successfully tested [
21] showing high efficiency and potential for laboratory applications. However, in order to access applications requiring high spectral density
γ-ray sources like Nuclear Resonance Fluorescence (NRF), new concepts are being developed based upon the use of high energy LINACS and high power lasers to generate
γ-rays via Thomson/Inverse Compton scattering. In fact, for applications based upon NRF, the excitation of a nuclear transition requires high spectral brightness.
The ideal requirements for NRF applications on the γ-ray beam are bandwidths as small as 0.1% to be compared with the present best values of 2%, and spectral density as high as 104 photons/sec/eV. These requirements are very challenging and new large installations based on accelerator technology are being proposed worldwide to fulfil them with estimated costs of 50–100 million Euro.
However,
γ-rays can also be generated using entirely optical techniques and based upon small scale equipment. A pioneering experiment [
38] in this scenario was carried out at the Jena laser Facility in 2006. In that experiment, in spite of the low quality of laser-accelerated electron bunches, still affected by 100% energy spread, all-optical Thomson scattering in the 1 keV X-ray region was demonstrated using a compact configuration with relatively low degrees of freedom for optimisation. Since then, laser-plasma acceleration has undergone dramatic progress and laser accelerated electrons now can reach and exceed 1 GeV with energy spread well below 10%, with record values close to 1%. Moreover, new schemes are being proposed nowadays to control injection and optimise acceleration, which are now being implemented to further improve the quality of laser accelerated electrons. The demonstrated performance of laser-plasma acceleration at FLAME is already well beyond that already explored in [
38] both in terms of energy and energy spread of the accelerated bunches. Even more important, considering that the energy per pulse of the FLAME laser is significantly higher, we can plan for a much higher flux of
γ-rays in a single shot configuration. As shown in
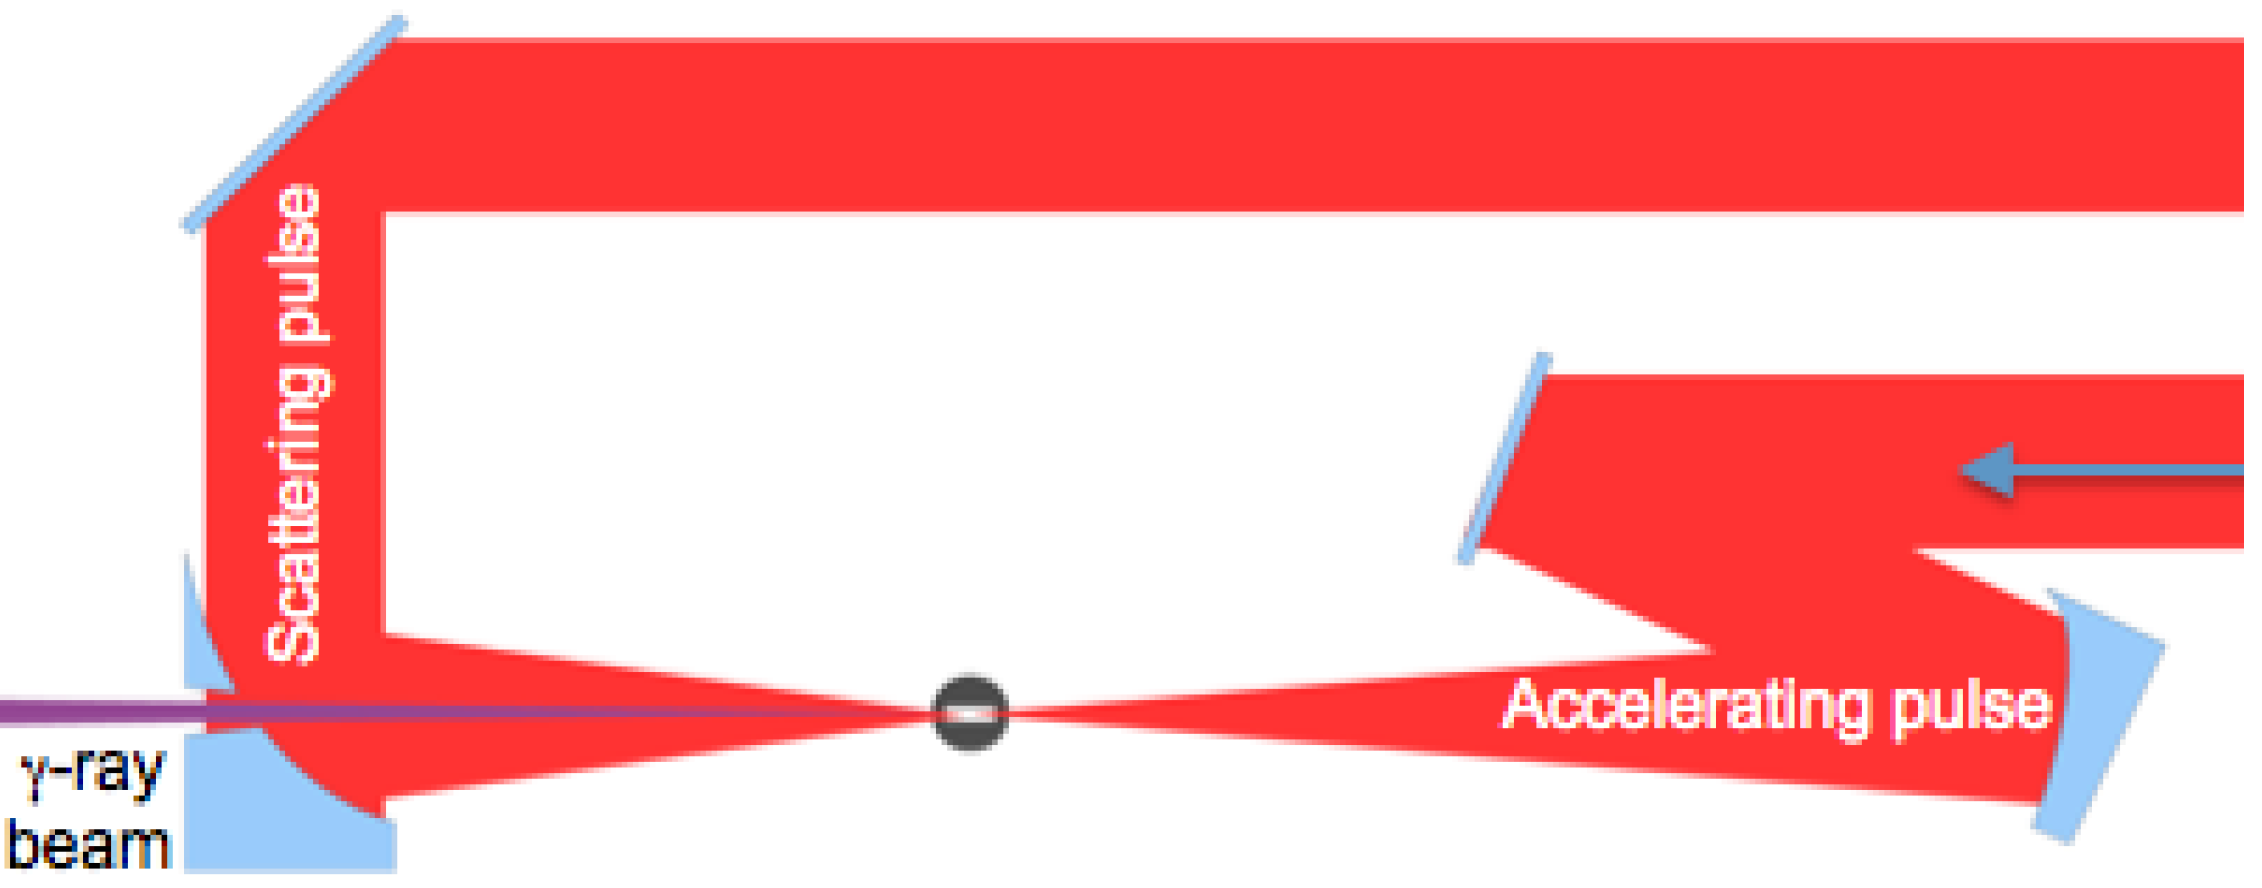
Figure 6, the proposed source is based upon a counter-propagating configuration of two ultraintense laser pulses focused in a gaseous target. In the experiment, the counter-propagating configuration is obtained by splitting the FLAME main pulse into two pulses with controlled energy and independent focusing configuration. In this configuration, one of the FLAME laser pulses generates a bunch of energetic electrons under conditions similar to those already explored in the SITE campaign.
Figure 6.
Schematic view of the counter-propagating configuration for all-optical γ-ray generation. The main FLAME laser pulse is split in two pulses that are focused in the proximity of a gas target. One of the two pulses (right) accelerates electrons using the SITE15 configuration. The other pulse is focused on the accelerated electron bunch to scatter off γ-rays that are emitted along the electron bunch propagation direction.
A detailed design of an experiment dedicated to all optical Thomson/Inverse Compton scattering at FLAME is available elsewhere [
39]. In the following we give an overview of the FLAME laboratory, followed by a summary of the design the experiment on acceleration with self-injection (SITE). Here we only report preliminary calculations based upon conservative, demonstrated specifications of self-injection electron bunches, namely 800 pC, transverse size of 8
µm, bandwidth of 1%–10% and scattering laser energy of 2 J in the linear regime (
ao < 1) at 10 Hz repetition rate. With these parameters, calculations yield a total
γ-ray photon flux of 3.5
× 10
10 photons/sec, leading to a spectral bandwidth of 10
2 photons/sec/eV. This value is already two orders of magnitude higher than existing LINAC-based Bremsstrahlung sources and can be achieved using a compact laser installation. In the following sections we describe the FLAME installation and focus on the experimental setup used for the SITE experiment, with a focus on optical diagnostics for the characterisation of the laser-plasma interaction region.
7. The sub-PW FLAME Installation
Establishment of the FLAME installation started in March 2007 with the excavation of the underground area and the placement of the 1 m thick concrete basement of the laser room. Construction works were completed in May 2008 followed by installation of the clean room. Laser installation was completed in June 2009 and first laser shots on gas target took place early during 2010. An overview of the FLAME installation is shown in
Figure 7. The key components of the FLAME installation are the laser system, which is hosted in the clean room and a radiation shielded, underground target area. The custom made FLAME Amplitude laser is based upon Ti:Sa, chirped pulse amplification (CPA) system that will deliver 20 fs, 800 nm, up to 220 TW, laser pulses with a 10 Hz repetition rate at a fundamental wavelength of 800 nm. The system features a high, sub-ns contrast ratio (
> 10
10) and has a fully remotely controlled operation mode. The system includes a front-end with pulse contrast enhancement (booster), bandwidth control and regenerative amplifier and yields pulses with 0.7 mJ in 80 nm bandwidth. These pulses are then further amplified by the first amplifier to the 25 mJ level while the second amplifier brings the energy to the 600 mJ level. The third cryogenic amplifier is based upon a 50 mm Ti:Sa crystal pumped by ten frequency doubled Nd:YAG laser pulses for a total energy of up to 20 J of energy at 532 nm. The extraction energy is as high as 35%, leading to a final energy in the stretched pulses in excess of 7 J. Pulses are then transported in air to the vacuum compressor placed in the underground target area. Once compressed, the pulse is transported under vacuum to the target chamber via remotely controlled beam steering mirrors. The plot of
Figure 8 shows the cross-correlation curve of the FLAME laser system showing the level of ASE just above 10
−9 of the peak intensity.
This high laser pulse contrast ensures that in our experimental conditions, no premature plasma formation occurs and the CPA pulse can be focused directly in the gas. In fact, at a maximum focused intensity of 10
20 W/cm
2, with our ASE contrast, we can expect a precursor laser intensity on target below 10
11 W/cm
2, which is below the plasma formation threshold in gases for laser pulses of sub-nanosecond duration [
40], the typical duration of ASE. Therefore we can reasonably assume that, in our experimental conditions. However, according to the cross-correlation curve of
Figure 8 (right) some precursor radiation may be present on the ps time scale before the pulse reaches the peak intensity. This radiation may give rise to premature ionisation of the gas. This is a key aspect to be evaluated to ensure a control of the interaction regime.
In the experiment, the main laser pulse is focused onto a gas-jet target using an F/10 off-axis parabola at a maximum intensity above 10
19 W/cm
2. The main diagnostics used in the experiment are similar to those discussed above for the ILIL experimental campaigns and for previous experiments carried out elsewhere [
21,
41,
42,
43].
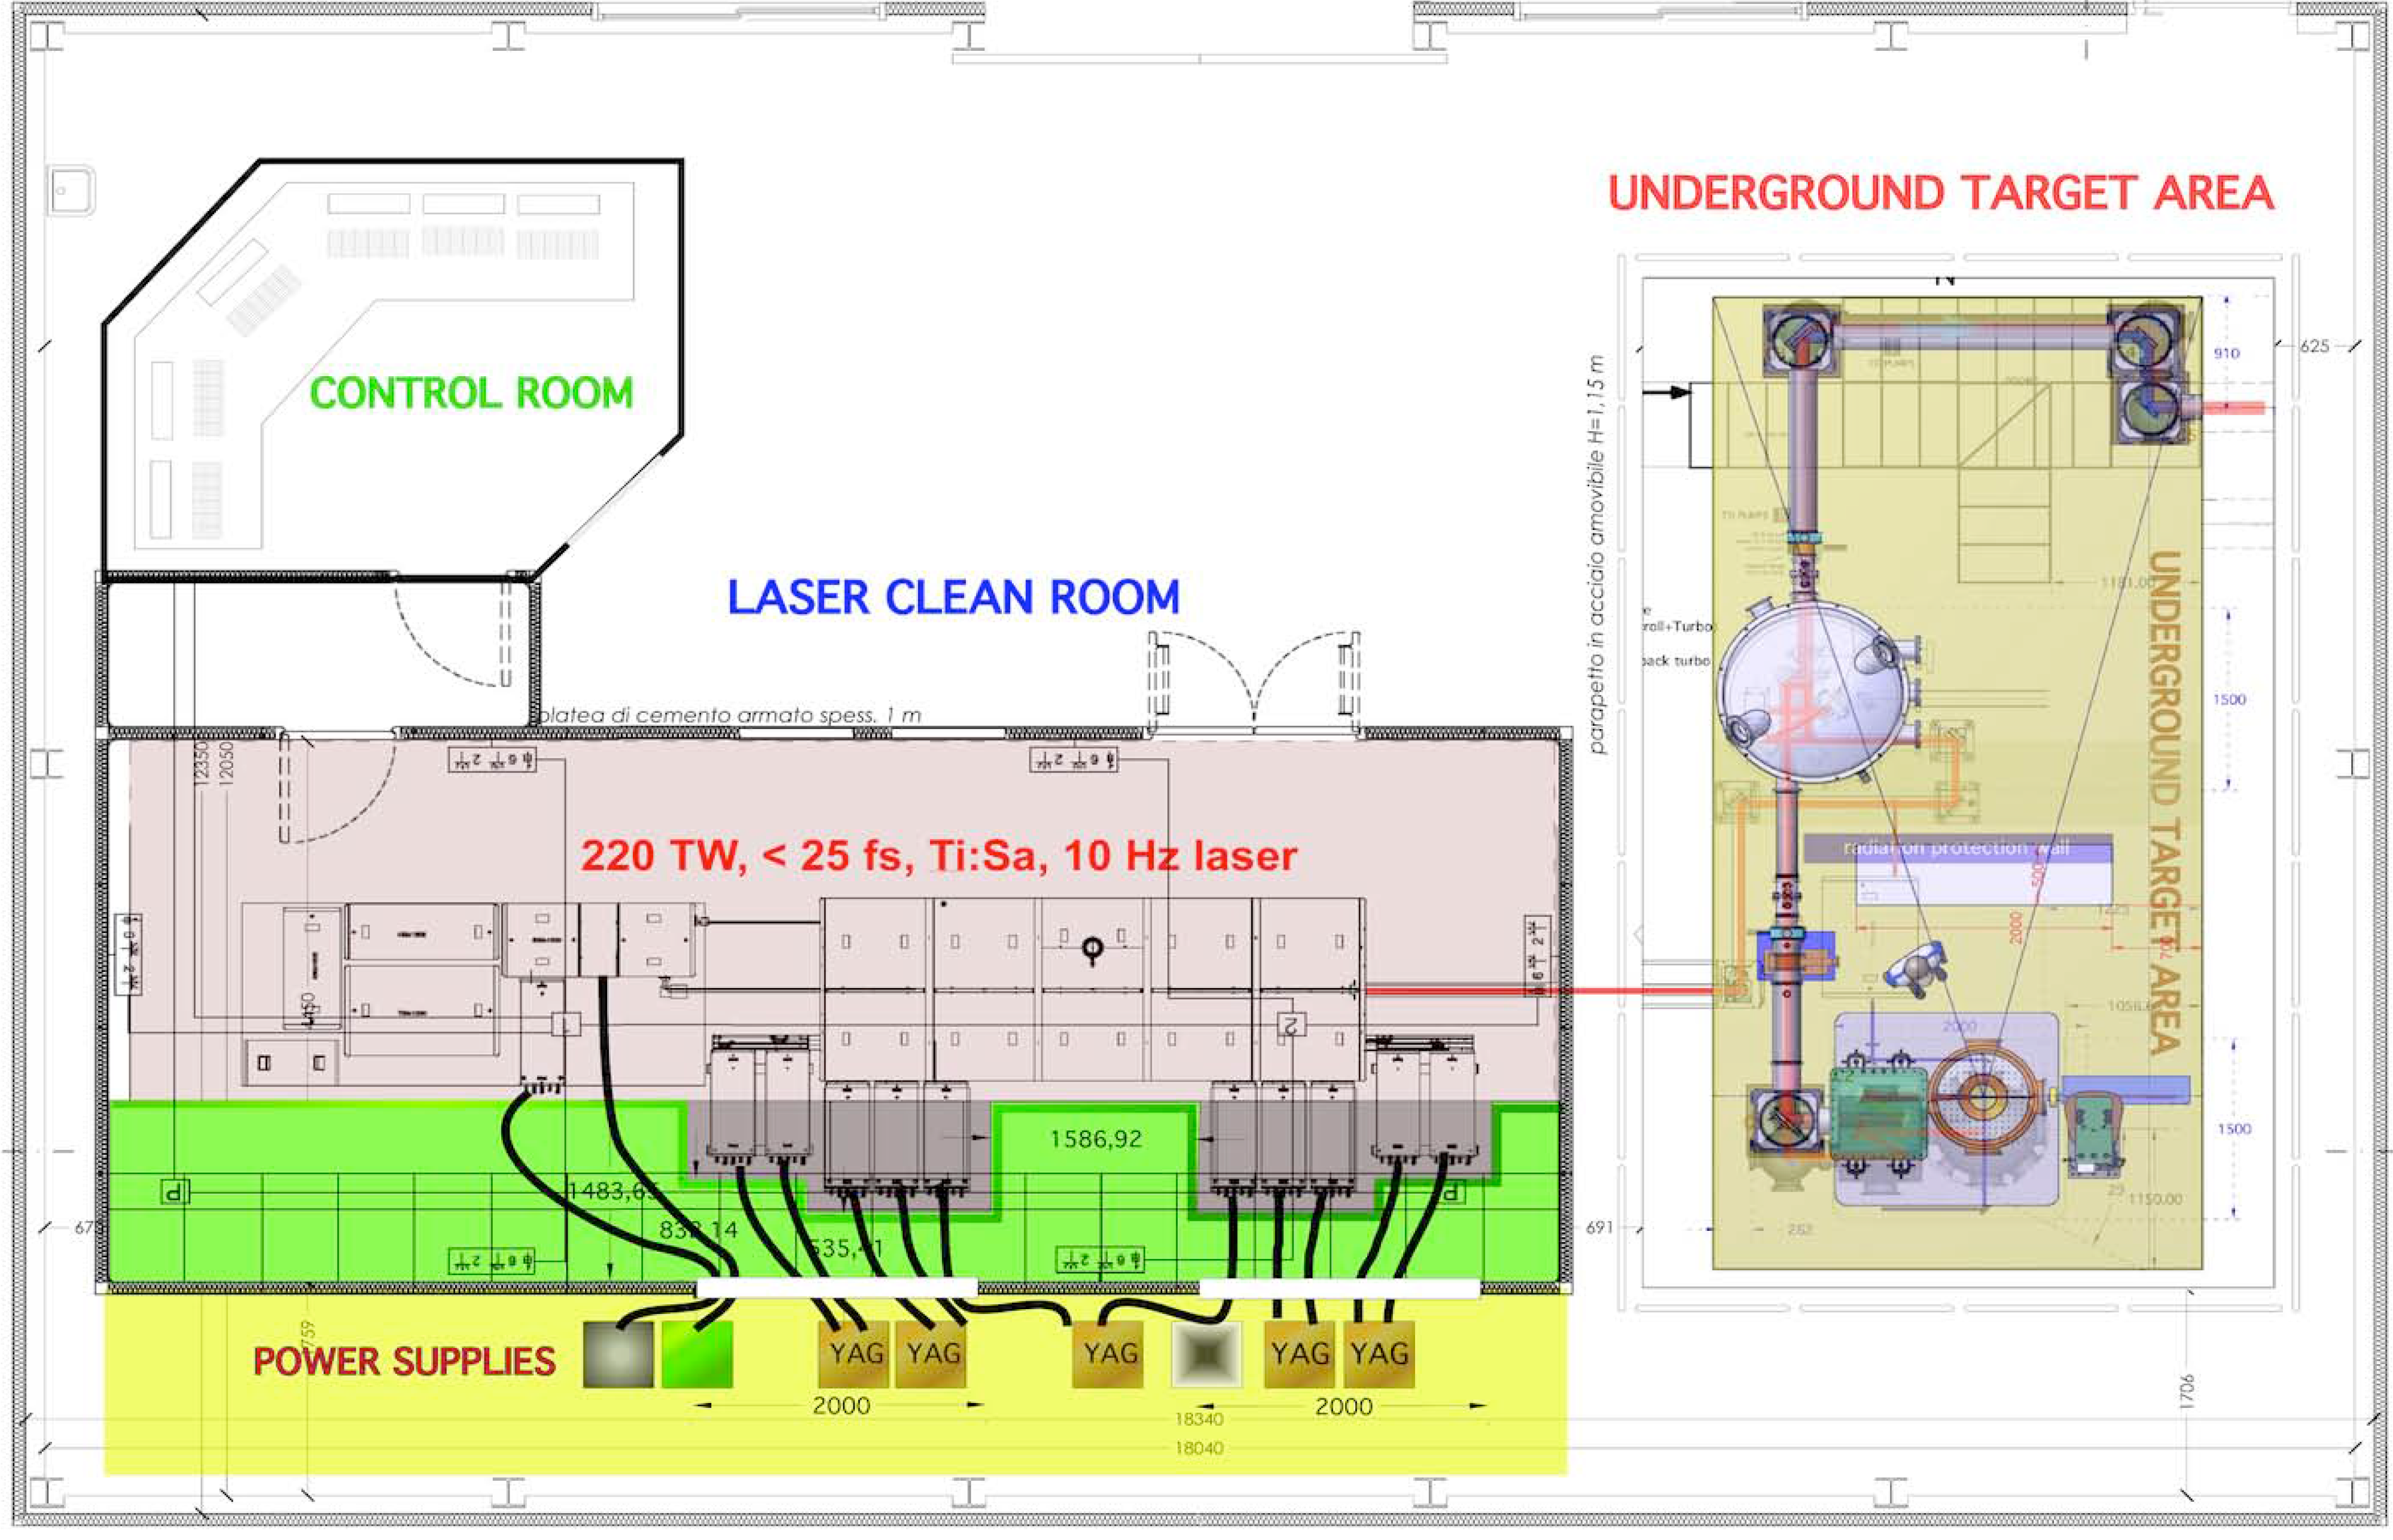
Figure 7.
General layout of the FLAME installation showing the entire laser chain inside the clean room, the underground target area and the control room. The laser includes the front-end on the left up to the cryogenic amplifier on the right, with its 10 Nd:YAG pump lasers. The underground target area shows the set-up for the self-injection test experiment at FLAME with the main hardware components including the 90 deg turning mirror, the off-axis parabola assembly and the interaction chamber. Also visible on the r.h.s. is the off-axis parabola assembly and the interaction chamber. Also visible on the r.h.s. is the electron spectrometer consisting of a dipole magnet and the detector.
propagation axis to study and characterise ionisation and basic laser-plasma interaction issues. A second group of diagnostics, including scintillators coupled to photomultipliers, a LANEX screen and custom [
31] dose sensitive, radiochromic film stacks, enables indirect and direct detection and characterisation of the accelerated electron bunches. Our objective is to produce acceleration in a 4–10 mm long plasma. Since this distance has to be matched with the dephasing length, namely the distance that the relativistic electrons have to travel before they overtake the accelerating region of the plasma wake, the required electron density is less than 3
× 10
18 cm
–3. These properties are achieved with a pulsed, supersonic gas-jet that can provide a well-confined slab of gas with sharp boundaries that ensure no perturbation of the laser pulse occurs due to ionisation and consequent defocusing and self phase modulation effects. This is a crucial requirement that ensures control of laser intensity parameters in the region of interest.
Figure 8.
Cross-correlation curve (left) showing the detailed temporal structure of the laser pulse in the 500 ps window before the main pulse. The plot on the left shows that intensity of the amplified spontaneous emission is just above 10−9 of the peak intensity. The plot on the right shows the detail of the curve in the ps domain, just before the peak intensity.
8. Interaction with cm Long Gas-Jet Target
The gas-jet nozzle (
Figure 9) is characterised by a 10 mm long, 4 mm wide slit and is mounted on a micrometric motorised support that allows the interaction point to be moved along the three Cartesian axes (position scan). During the pulsed operation, the gas flows out of the slit at supersonic speed to produce steep interfaces between gas and vacuum. The vacuum in the chamber before the shot is maintained at a pressure below
∼ 10
−5 Torr by a turbo-molecular pump connected to the chamber by a gate-valve.
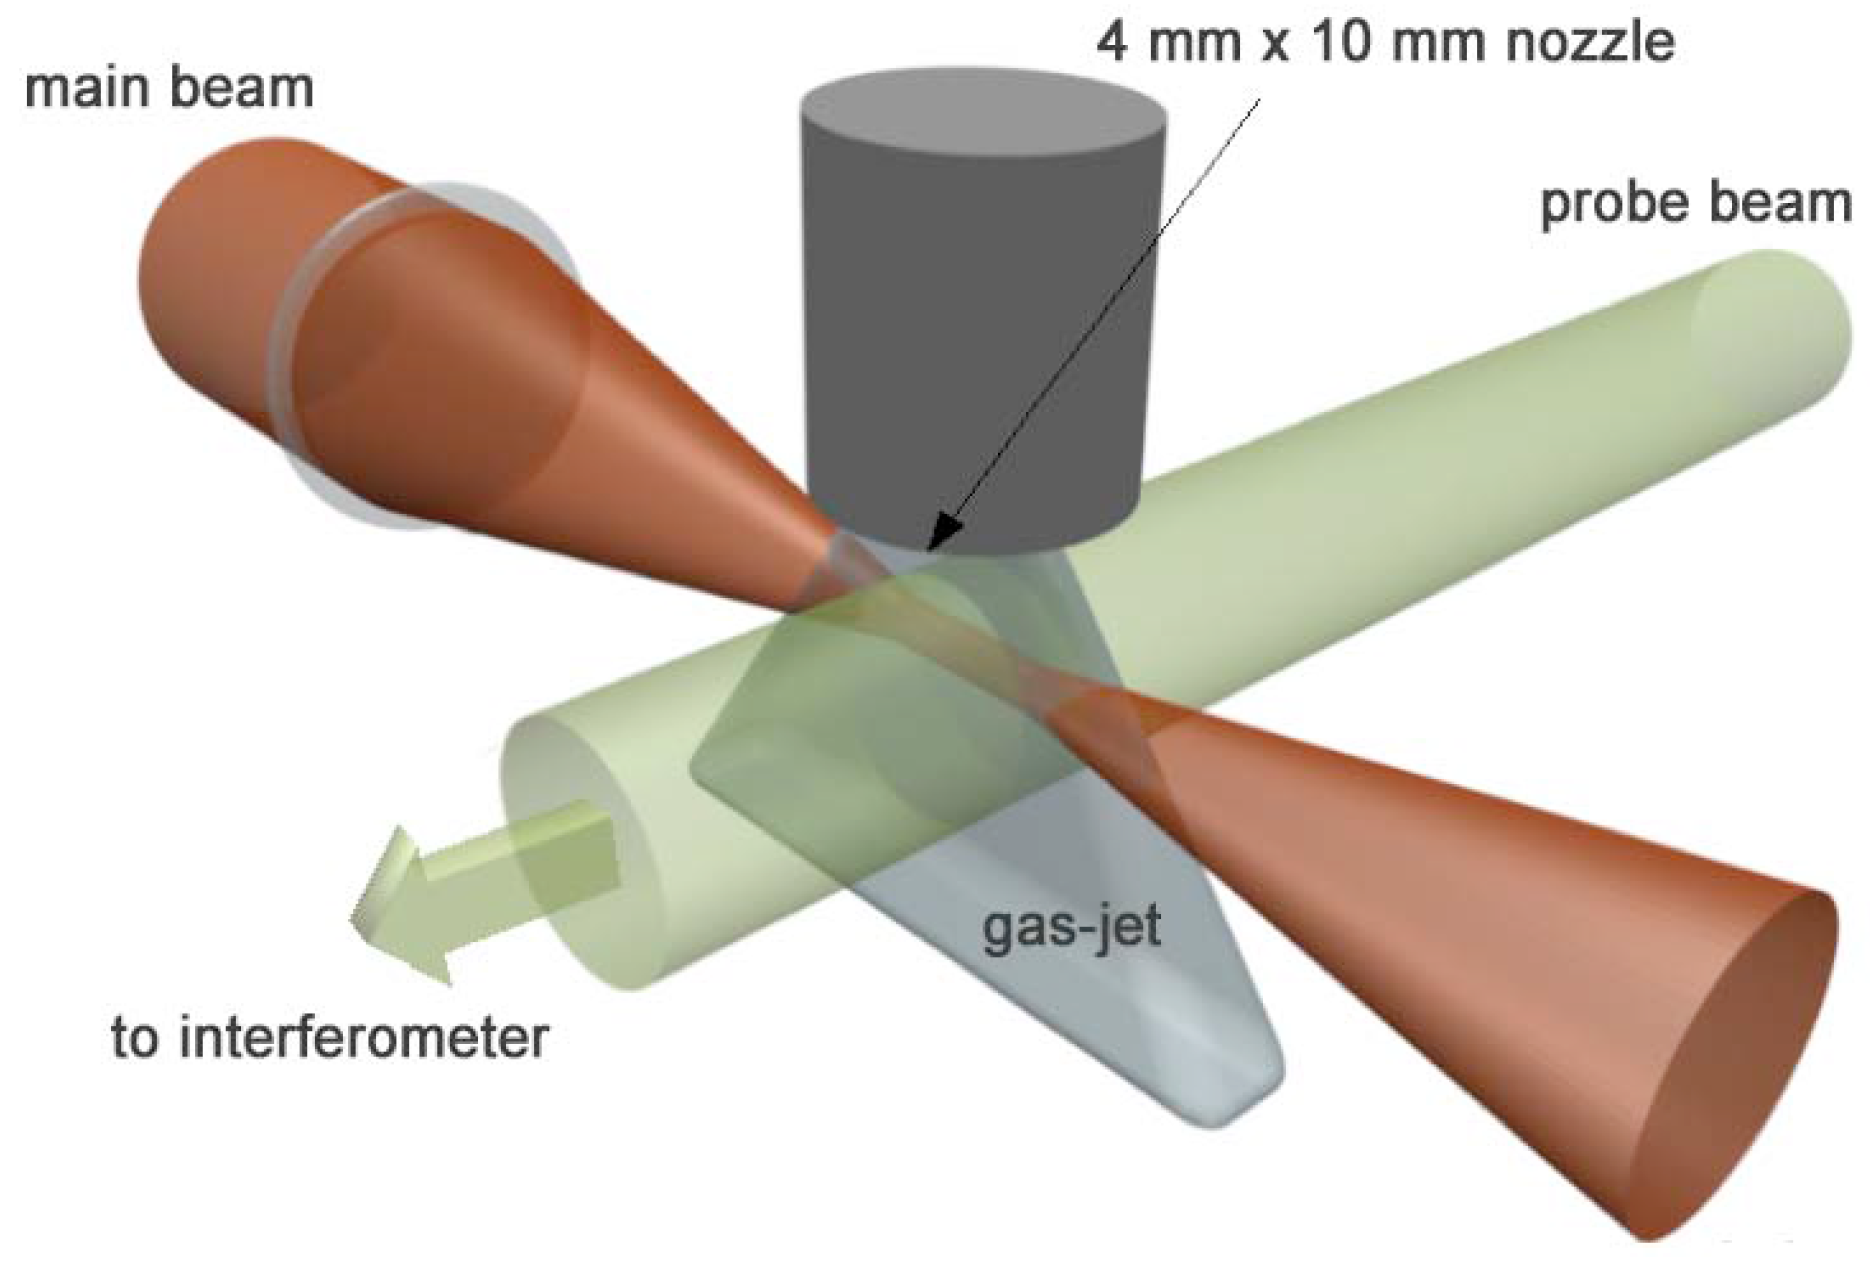
Figure 9.
Schematic view of the target and interaction geometry, showing the gas-jet nozzle, the slab of gas, the main laser pulse and the probe pulse for plasma interferometry.
Figure 9.
Schematic view of the target and interaction geometry, showing the gas-jet nozzle, the slab of gas, the main laser pulse and the probe pulse for plasma interferometry.
We perform numerical simulation to have quantitative information about electron density during propagation of the laser pulse in the gas-jet. The simulation is based on the tunnel ionisation model [
44] and calculates the rate of tunnel ionisation in a non-adiabatic regime,
i.e., as a function of the instantaneous laser phase, and assumes purely geometrical propagation of the beam in the plasma defined according to the real input laser parameters. According to this model, the rate of ionisation is given by
where
E is the laser amplitude,
f (
t) is the pulse envelope and
ωL is the laser angular frequency. In the above equation the term
ϕ(
γ,θ) includes the dependence upon the Keldysh parameter
γ, the ionisation potential
Ip, the average energy of electron oscillations in the laser field
Up and the phase of the laser field
θ. The ionisation rate has a non-linear dependence on the instantaneous electric field. The exponential factor gives the strongest dependence on the electric field, while the pre-exponential factor includes dependence on the initial state that are defined by its quantum numbers.
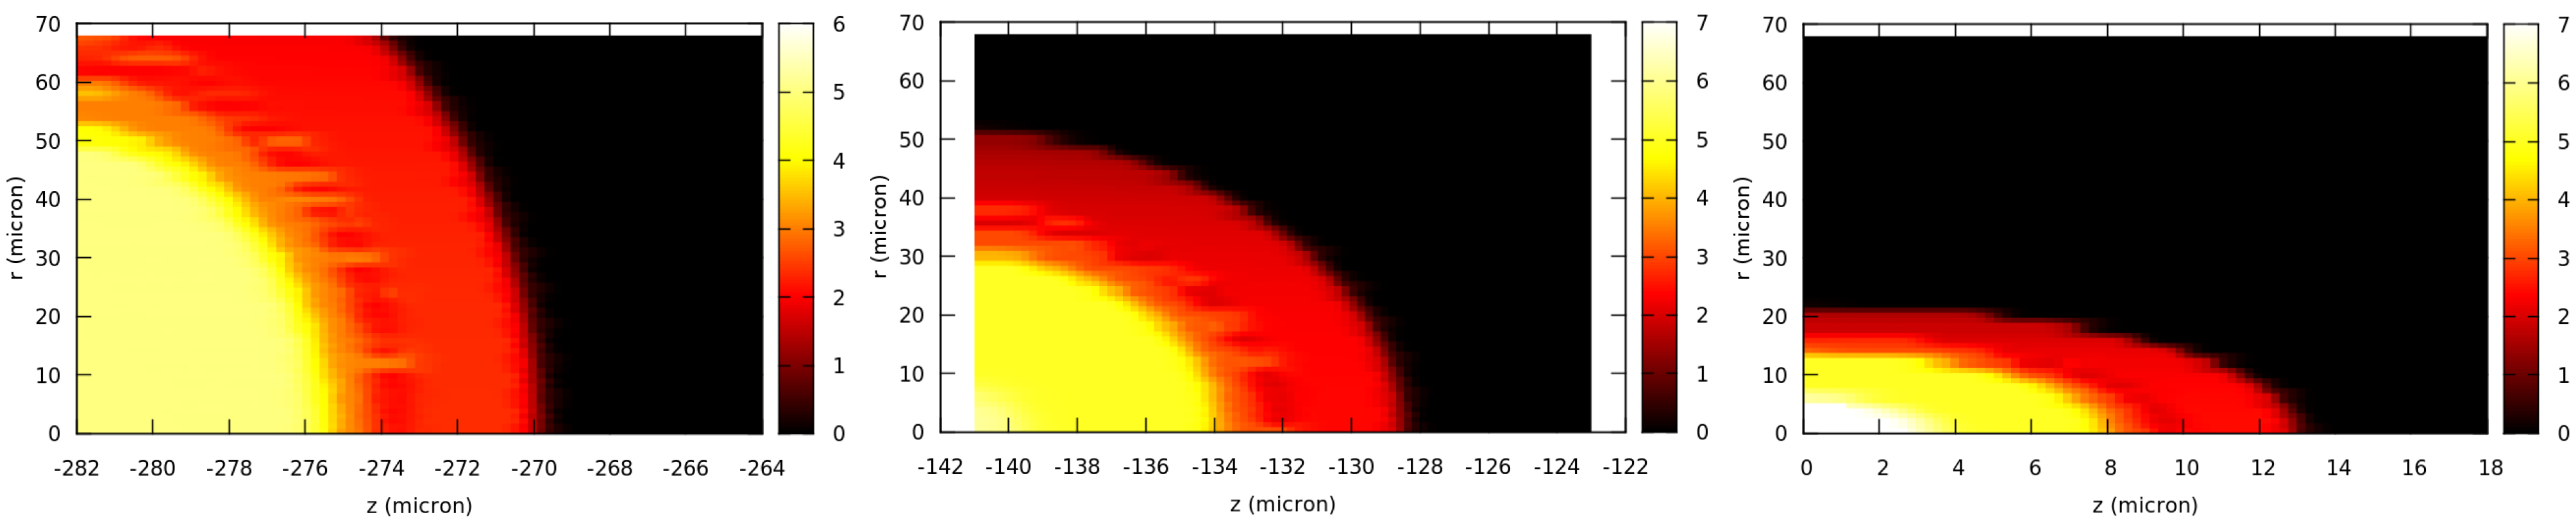
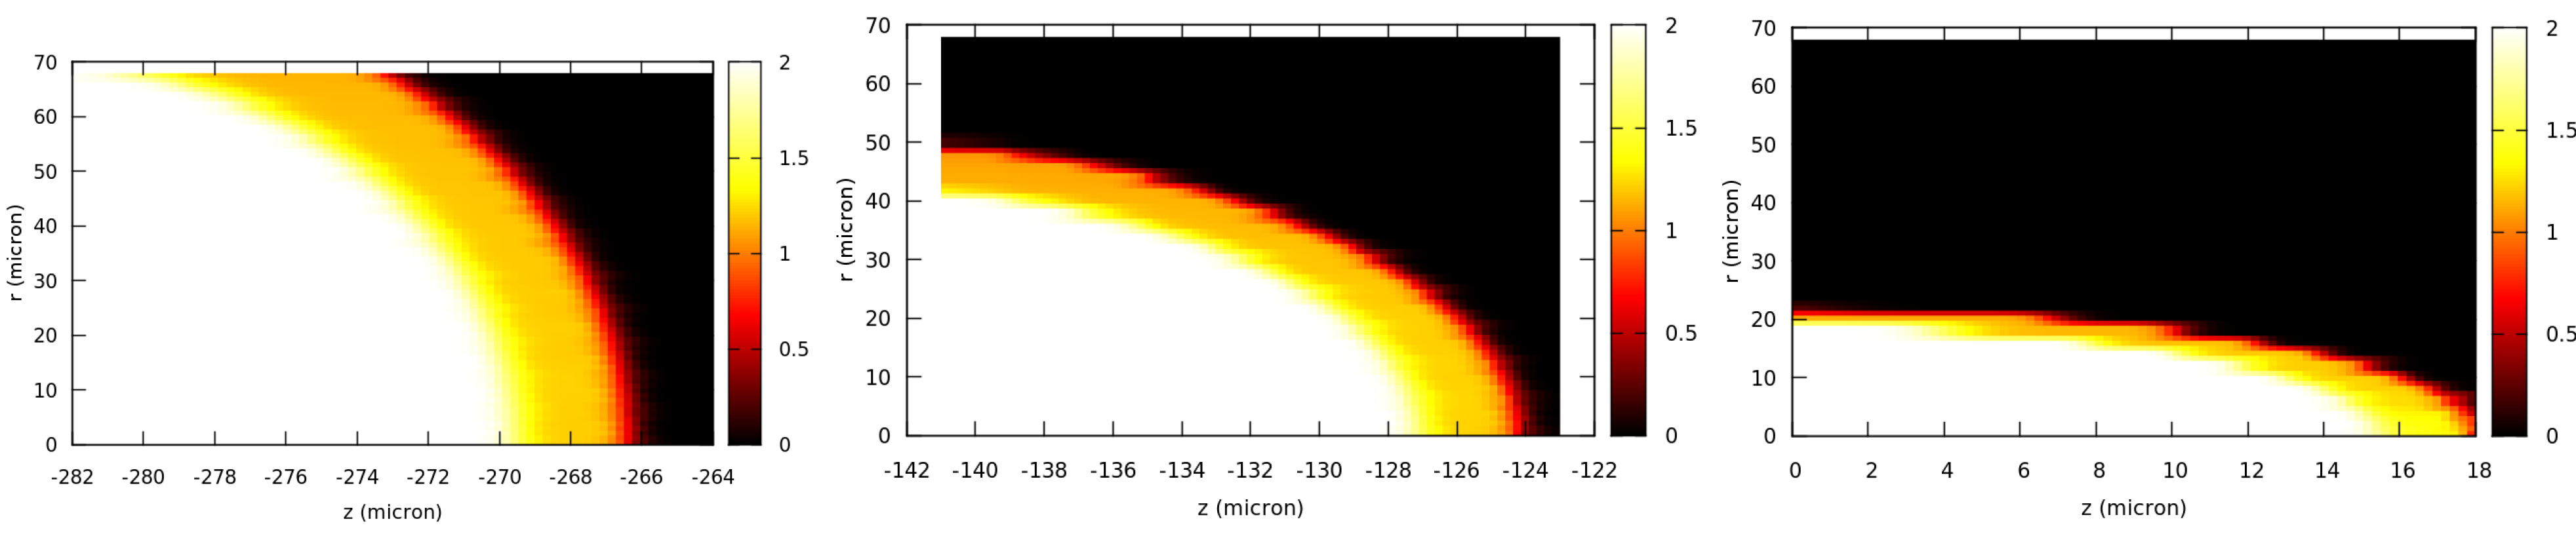
Figure 10 shows the ionisation profile in case of He gas, for three different positions of the laser pulse relative to the waist position.
Figure 10 (left) shows the ionisation profile when the pulse is located at two Rayleigh ranges before the best focus.
Figure 10 (centre) shows the ionisation profile when the pulse is located at one Rayleigh range before the best focus.
Figure 10 (right) shows the ionisation profile when the pulse is located at the best focus.
Figure 10.
Ionisation map of He with the laser pulse at two Rayleigh ranges before the best focus (left), at one Rayleigh range (centre) and at the best focus position. The graph shows that full ionisation in He occurs well before the pulse enters the focal region.
Figure 10.
Ionisation map of He with the laser pulse at two Rayleigh ranges before the best focus (left), at one Rayleigh range (centre) and at the best focus position. The graph shows that full ionisation in He occurs well before the pulse enters the focal region.
Ionisation maps have also been calculated for nitrogen.
Figure 11 (left) shows the ionisation profiles when the pulse enters two Rayleigh ranges before the best focus.
Figure 11 (left) shows the ionisation profiles for the case when the pulse enters one Rayleigh range before the best focus, and finally,
Figure 11 (left) shows the ionisation profiles for the case when the pulse enters the best focus position.
Figure 11.
Ionisation map of N with the laser pulse at two Rayleigh ranges before the best focus (left), at one Rayleigh range (centre) and at the best focus position. The graph shows that full ionisation in N occurs well before the pulse enters the focal region.
Figure 11.
Ionisation map of N with the laser pulse at two Rayleigh ranges before the best focus (left), at one Rayleigh range (centre) and at the best focus position. The graph shows that full ionisation in N occurs well before the pulse enters the focal region.
These calculations show that ionisation of nitrogen is very much different from that occurring in helium, where full ionisation is easily achieved even before the best focus position. In the case of nitrogen, ionisation up to He-like (two electrons left in the K-shell) is relatively easy to achieve before the pulse enters the best focus position. In fact, according to
Figure 11 (left and centre), the ionization degree in the most intense part of the pulse is 5, while full ionisation only occurs at the best focus position (
Figure 11 (right)).
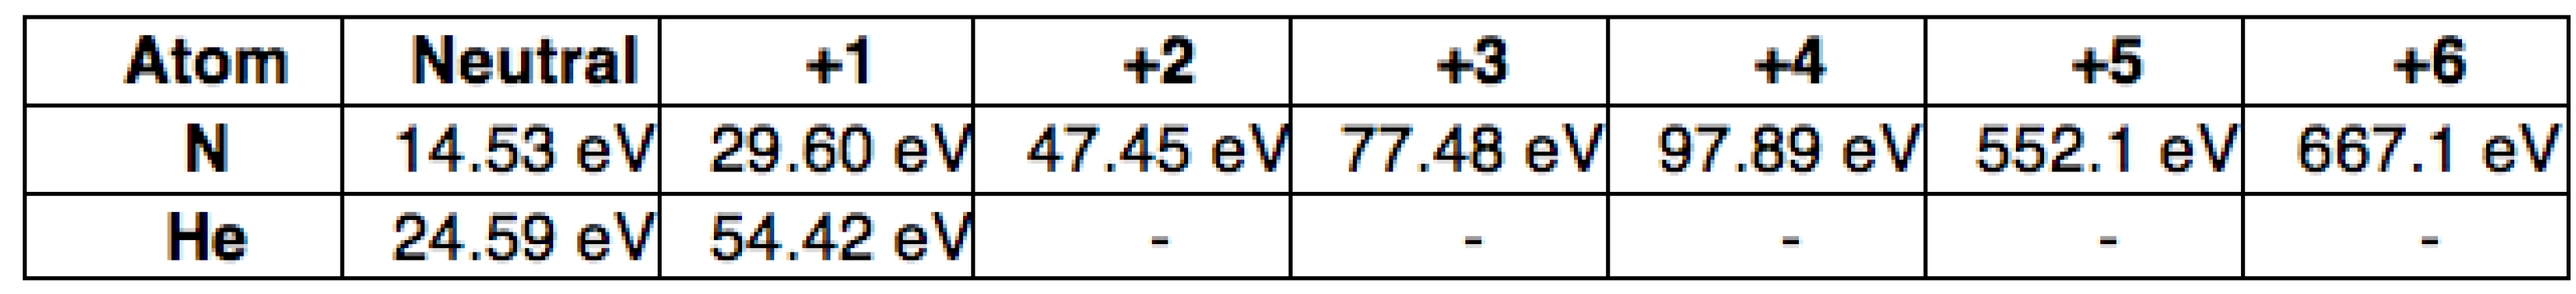
This behaviour can be explained if we consider the properties of ionisation of He and N starting from their basic atomic properties and the associated ionisation potentials, which, for both elements, are summarised in the table of
Figure 12. According to the table, the first ionisation energy of N is significantly less than the corresponding energy of He. Also, in the case of N, there are five successive ionisation stages with a gradually increasing energy up to about 40 times the first ionisation threshold. This is in contrast with the behaviour of He, whose two ionisation energies only differ by a factor of roughly two. The table also shows that the ionisation potential for +5 and +6 are more than one order of magnitude higher that for the case of the last electron of He. These circumstances make full ionisation in nitrogen possible only at very high field intensity.
Figure 12.
Ionisation potentials of N and He. The second row gives the ionisation energy of N from neutral N to hydrogen-like N. The third row reports the corresponding ionisation energies for neutral He and hydrogen-like He.
Figure 12.
Ionisation potentials of N and He. The second row gives the ionisation energy of N from neutral N to hydrogen-like N. The third row reports the corresponding ionisation energies for neutral He and hydrogen-like He.
9. Self-Injection Parameters at FLAME
As anticipated above, the ultimate goal of the SITE experiment is the production of sub-GeV-class electron bunches from laser-plasma interaction using a gas-jet of a few millimetres, without external guiding for the laser entering directly into the so-called bubble regime [
32,
45]. In the bubble regime a short (
cτ < λ
p/2) and intense (
a0 > 2) laser pulse expels the plasma electrons outward creating a bare ion column. The blown-out electrons form a narrow sheath outside the ion channel and the space charge generated by the charge separation pulls the electrons back creating a bubble-like wake. For sufficiently high laser intensities (
a0 > 3
.5
÷ 4) electrons at the back of the bubble can be injected in the cavity, where the longitudinal accelerating field is of the order of
∼ .
The FLAME laser meets both conditions of short pulse length and high intensity. As a consequence when the laser pulse impinges onto the gas-jet, it promptly excites (without significant pulse evolution) a bubble wake where electrons are readily injected and so the entire gas-jet length can be utilised for the acceleration process. In order to have a “controlled” acceleration mechanism, which ensures a better bunch quality, the plasma and laser parameters must be chosen according to the phenomenological theory [
46].
The working point we have considered for the SITE is the one described in
Table 2 where
Lgas jet is the length of the gas along the laser propagation,
ne is the electron density of the ionised gas,
I0 is the laser intensity inside the FWHM diameter spot, and
w0 is the waist of the laser beam in the focus,
i.e., the distance from the laser axis where intensity is 1
/e2 of the intensity on axis. In this case, following the phenomenological description given in [
46], we expect to obtain a quasi-monochromatic (few % momentum spread) bunch with a charge of
∼ 0
.6 nC and an energy of approximately 1.0 GeV after 4 mm (dephasing length). The acceleration process has also been investigated through 3D PIC simulations performed with the fully self-consistent, relativistic, electromagnetic PIC code AlaDyn [
47,
48]. The results are summarised in
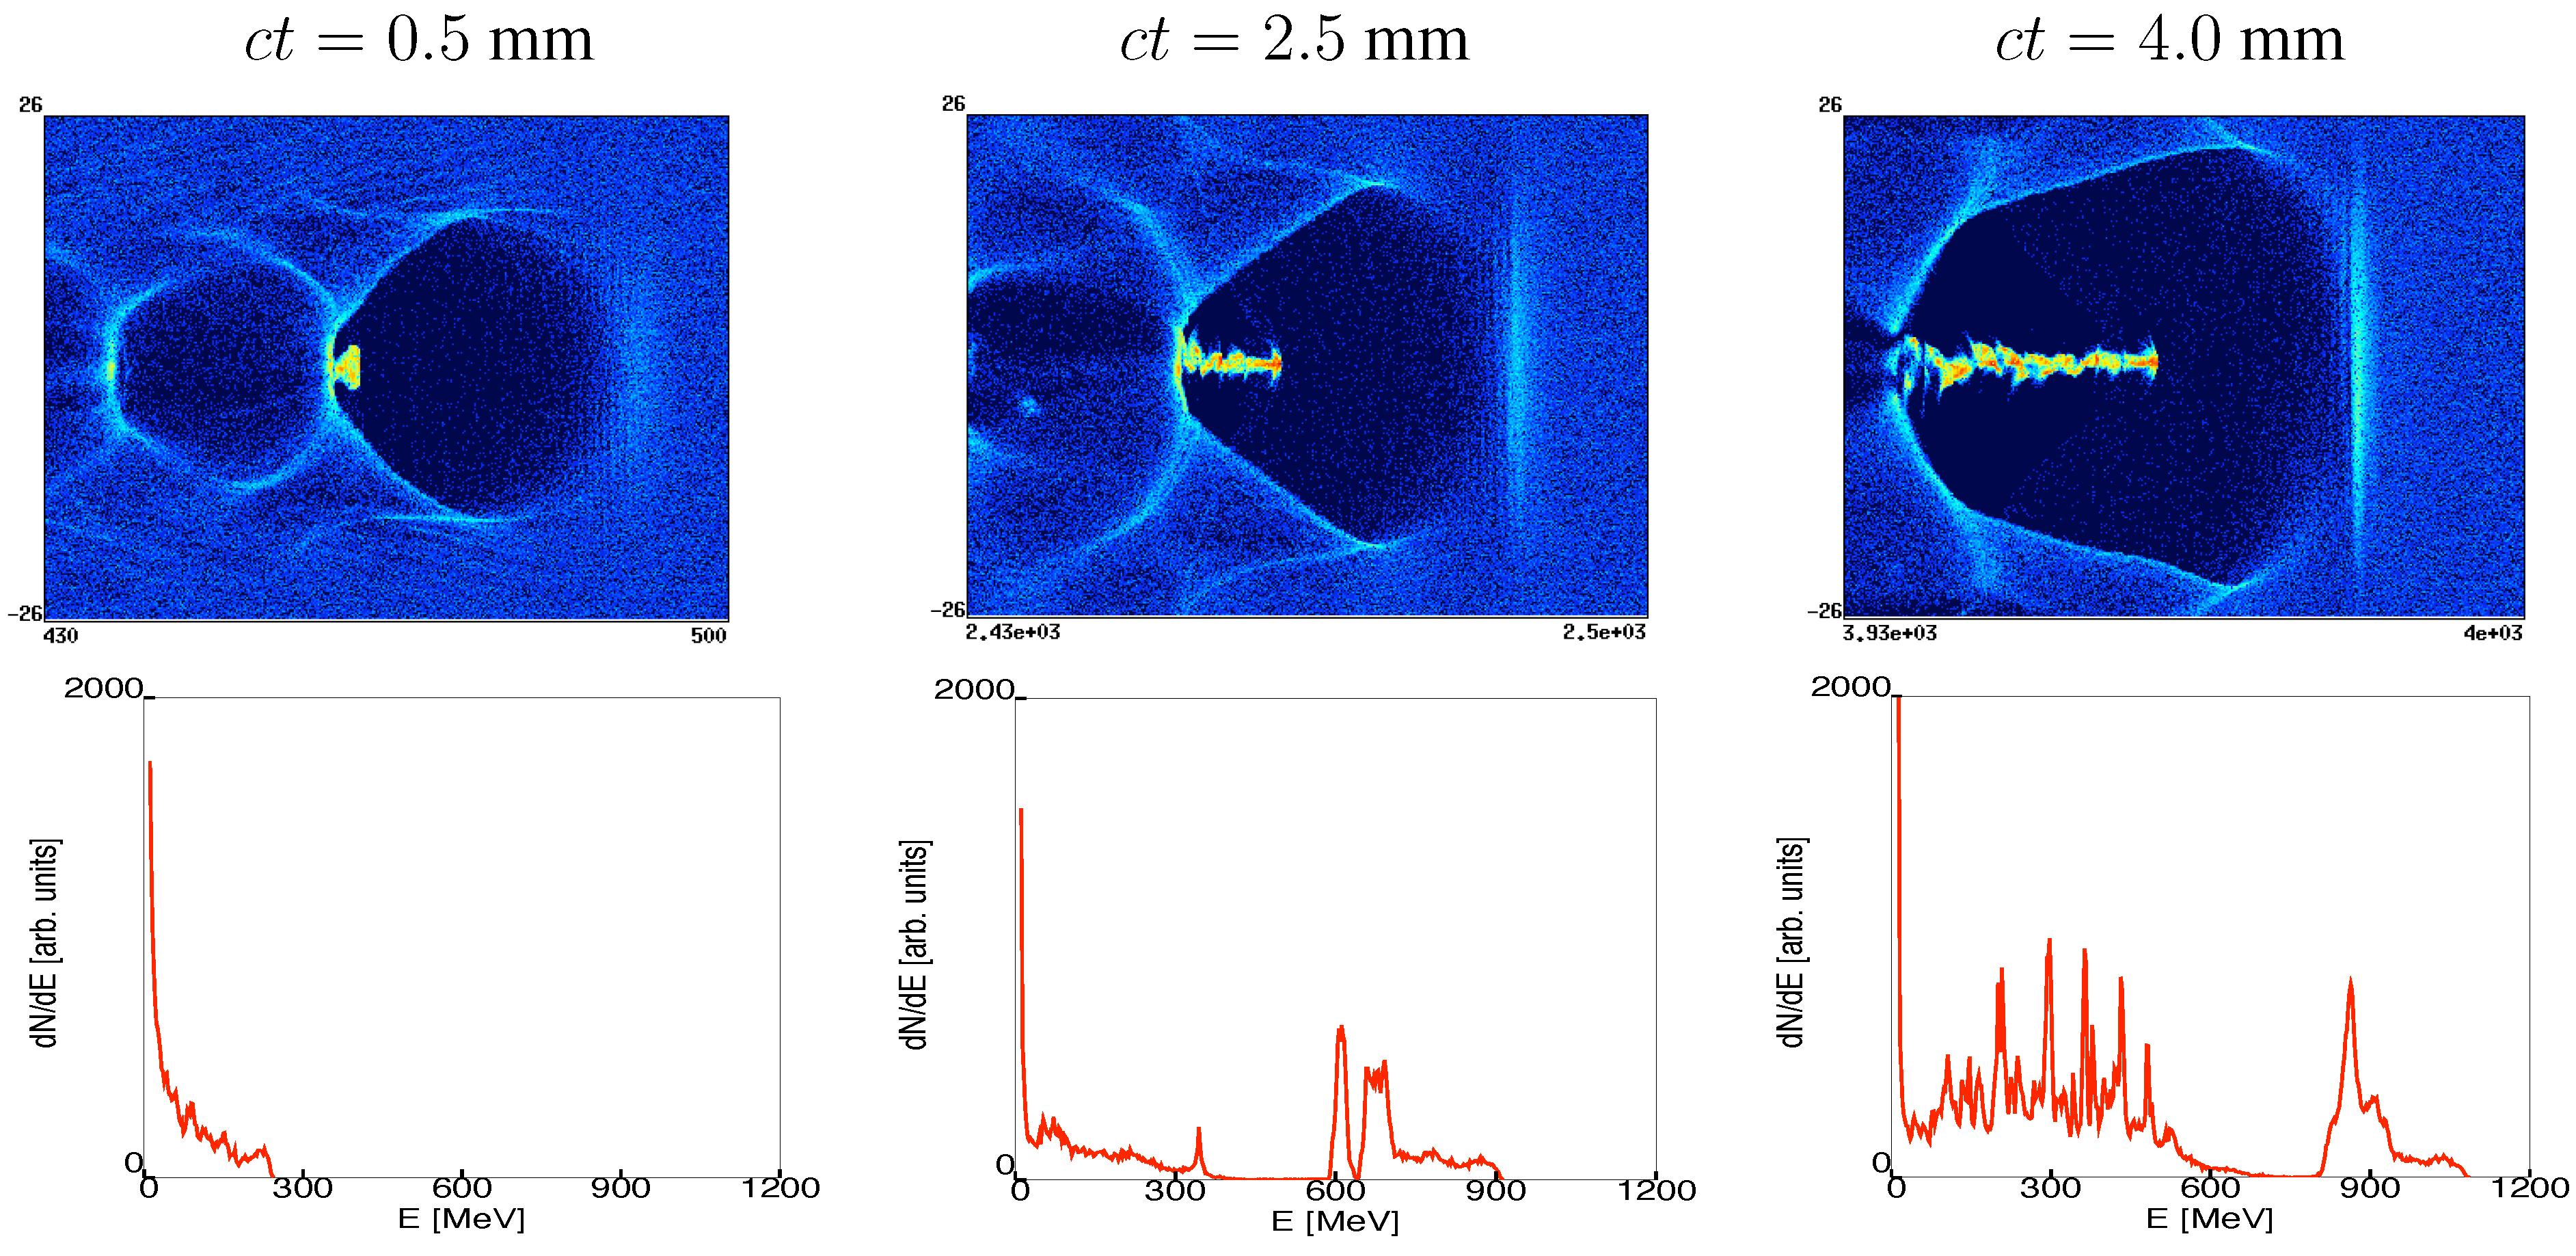
Figure 13 where we show the evolution of the electron density and energy spectrum.
Table 2.
A possible working point of the self-injection test experiment at FLAME for laser-acceleration in the GeV scale.
Table 2.
A possible working point of the self-injection test experiment at FLAME for laser-acceleration in the GeV scale.
| Lgas jet [mm] | ne [cm−3] | τ [fs] | I0 [W/cm2] | w0 [µm] |
| 4 | 3 × 10¹⁸ | 30 | 5.2 × 10¹⁹ | 16 |
Figure 13.
Energy spectrum of the accelerated electrons as obtained from the 3D PIC simulation for the SITE at three different propagation length inside the gas-jet.
Figure 13.
Energy spectrum of the accelerated electrons as obtained from the 3D PIC simulation for the SITE at three different propagation length inside the gas-jet.
At the end of the simulation we obtained a bunch with an energy of 0.9 GeV and a momentum spread (rms) of 3.3%, the charge is 0.6 nC, the bunch length is 1.8
µm (the average current is
∼ 50 kA) and the beam divergence (rms) is 2.8 mrad. The results are in good agreement with [
46].
10. First Results of the Self-Injection Test Experiment (SITE)
In the first phase of SITE, accelerated electron bunches were obtained from the interaction of the femtosecond laser pulse with a nitrogen supersonic-gas-jet working with a backing pressure of about 17 bar and a laser-intensity of 2
×10
18 W/cm
2. These preliminary data were obtained using an F/15 focusing optics, at fixed pulse duration of about 30 fs and over an energy per pulse ranging from a minimum of about 300 mJ up to 1 J. A preliminary analysis of the laser-accelerated bunches in test laser shots was carried out using the SHEEBA [
24] detector [
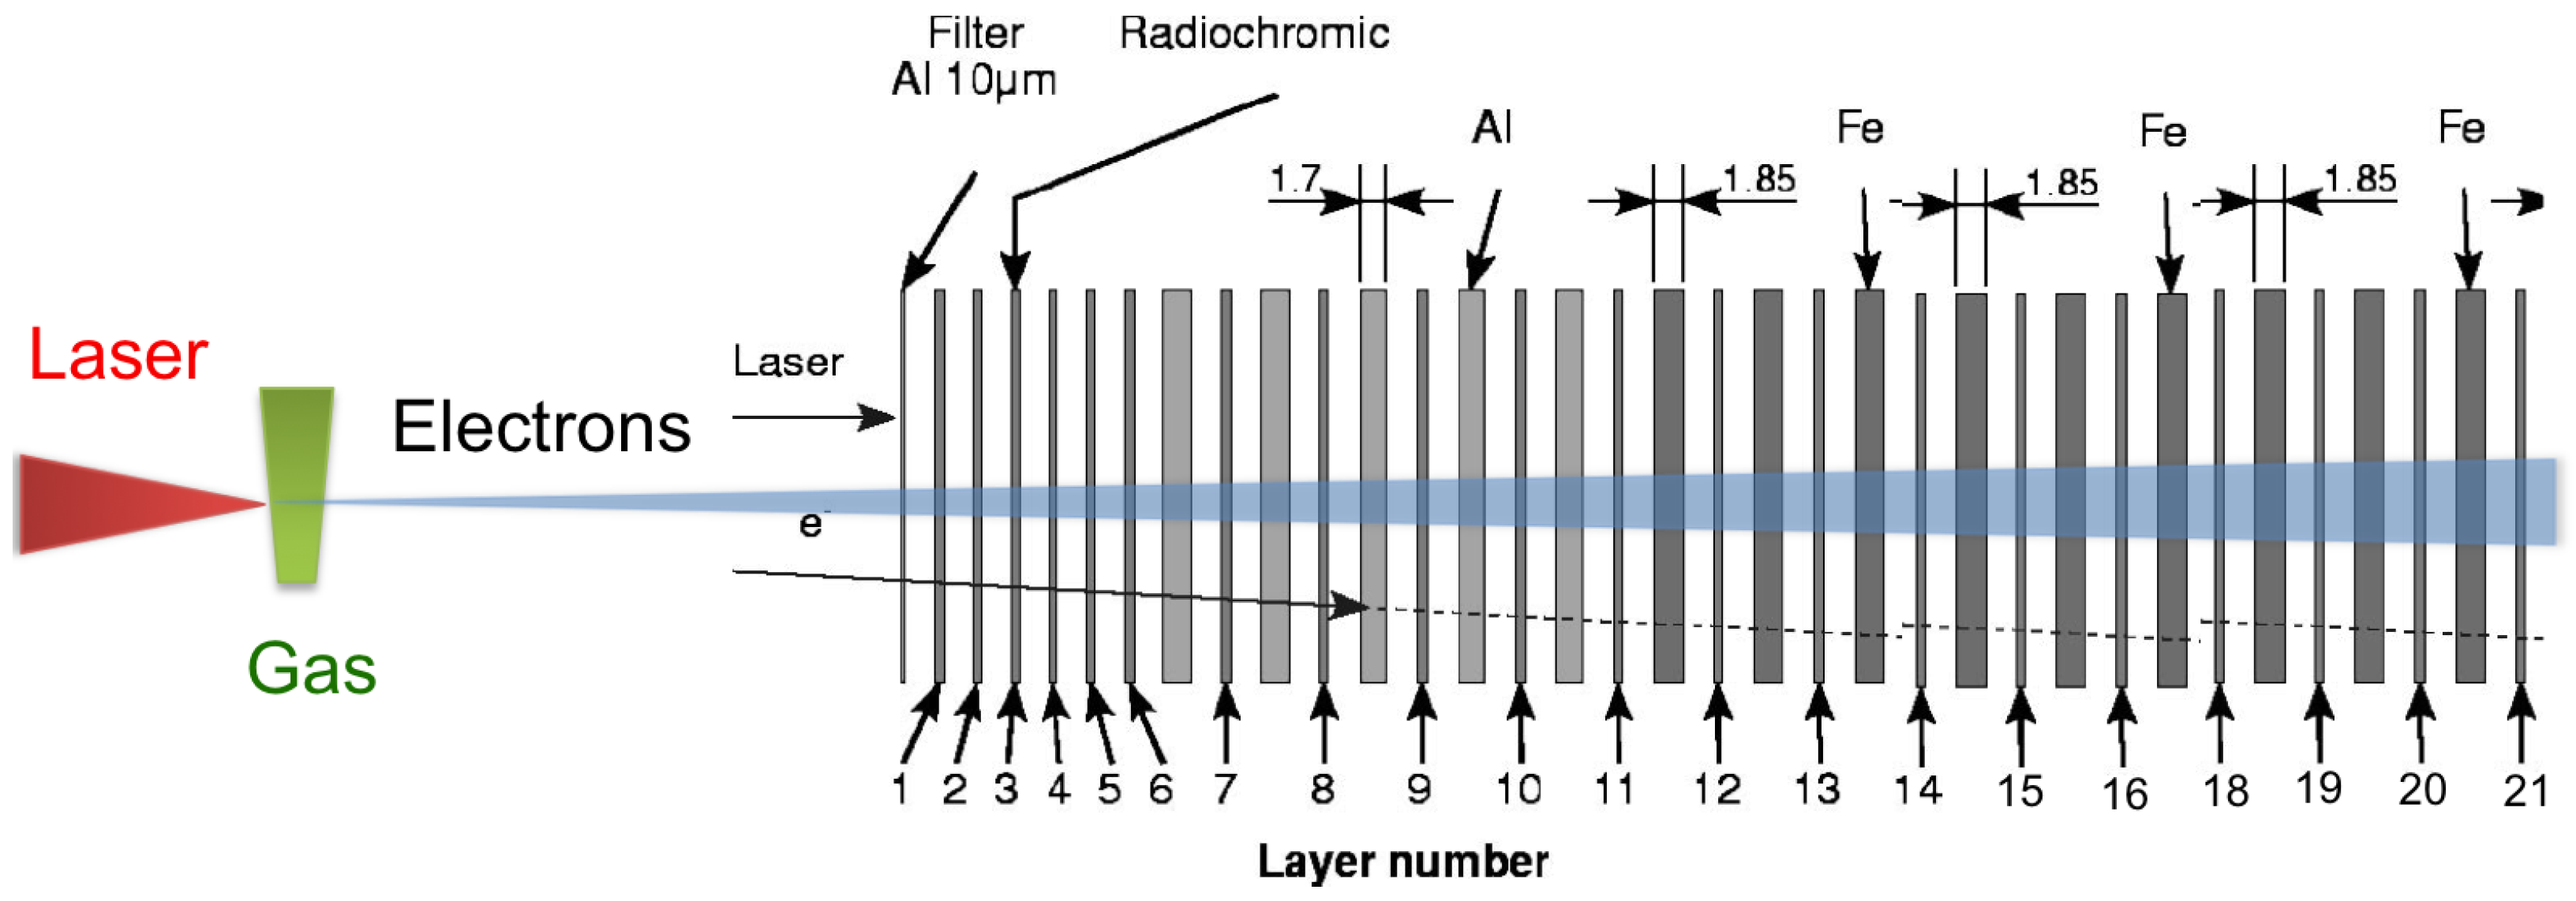
31] consisting of sandwiched radiochromic films (RCF) as shown in details in
Figure 14. The active compound of RCFs is a micro-crystalline monomer belonging to the diacetylene molecule family, uniformly distributed in a gelatine matrix. Under exposure to ionising radiation, the crystallised diacetylenes undergoes a solid-state polymerisation reaction producing a dye polymer referred to as polydiacetylene, which results as a change in the Optical Density (OD) in the layer, and it is a localised process.
Figure 14.
Layout of the SHEEBA detector set-up showing electron propagation direction, films type and distribution. The thickness of the metal layers is in millimetres.
Figure 14.
Layout of the SHEEBA detector set-up showing electron propagation direction, films type and distribution. The thickness of the metal layers is in millimetres.
The polymerisation begins during the irradiation and does not stop after exposure, but stabilises to its asymptotic value within 24 h. Because of their sensitivity to ionising radiation, the first layer of SHEEBA is always a thin Aluminium foil, which act as a stop filter for optical (scattered laser) and UV radiation and soft X-rays. The electrons propagate in the detector releasing their energy till they stop into the medium via several physical mechanisms. In order to take into account these effects and the different materials in the stack, a Monte Carlo code was used [
31], which is based upon CERN library GEANT 4.2.0 [
49]. The code enabled to model the detailed geometry of the detector and to calculate the electron stopping power. According to the calculations, in our configuration the detector is sensitive to electrons in the range between 100 keV and 100 MeV. Retrieval of the actual energy spectrum can be obtained starting from the energy deposited in each layer and convergence of the retrieval process requires that the electrons are completely absorbed in the detector. However, a first direct estimate of the maximum electron energy can be obtained by simply observing the number of layers with signal and comparing this value to the expected energy loss per layer for a given incident electron energy.
The key information of these simulations is the penetration depth of the electrons as a function of their initial kinetic energy. By using this function, the electron spectrum can be deconvolved considering the position of each layer in the stack [
31] and the energy can be resolved as a function of the angle of emission as demonstrated in a recent experiment [
21]. We used HD810 and MD55 types, to obtain charge, angular and spectral information of the full electron bunch. This detector was used in the first phase of the SITE experiment to obtain a first estimate of the properties of accelerated electron bunches. The images of
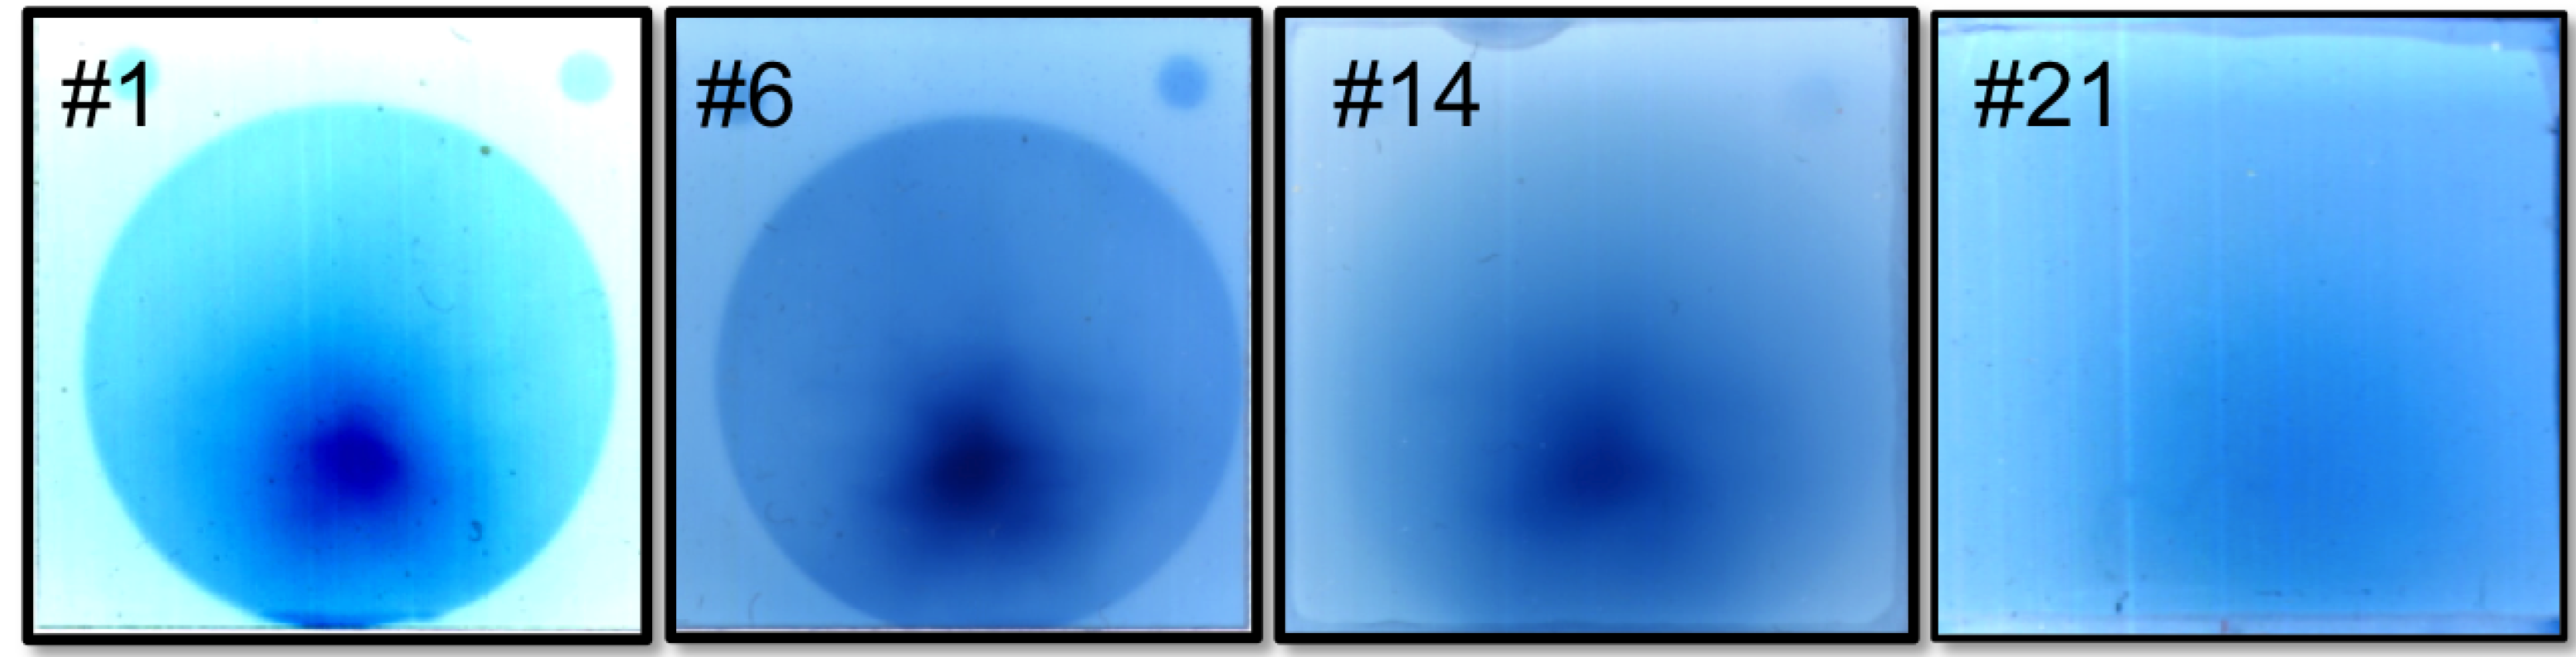
Figure 15 shows four layers of the detector including the first layer and the last layer, all showing electron signal. In this particular circumstance, the presence of signal on all the layers does not allow the full spectrum to be recovered. However, according to the calculated energy loss per layer of RCF, presence of signal on the layer 21 of our detector can be explained assuming electron energy in the range between 10 and 100 MeV. Indeed, analysis of RCF data shows that in our conditions (F/15), at a fixed pulse duration of about 30 fs collimated (10 mrad) electron bunches were obtained with an energy in the 100 MeV region.
Figure 15.
First signals recorded by the SHEEBA detector after exposure to accelerated electrons over 30 laser shots after laser irradiation of a 4 mm nitrogen gas-jet at an intensity of 2 × 10¹⁸ W/cm2. According to these data, signal is found up to the last layer of the detector, which indicates average electron energy in the 100 MeV range.
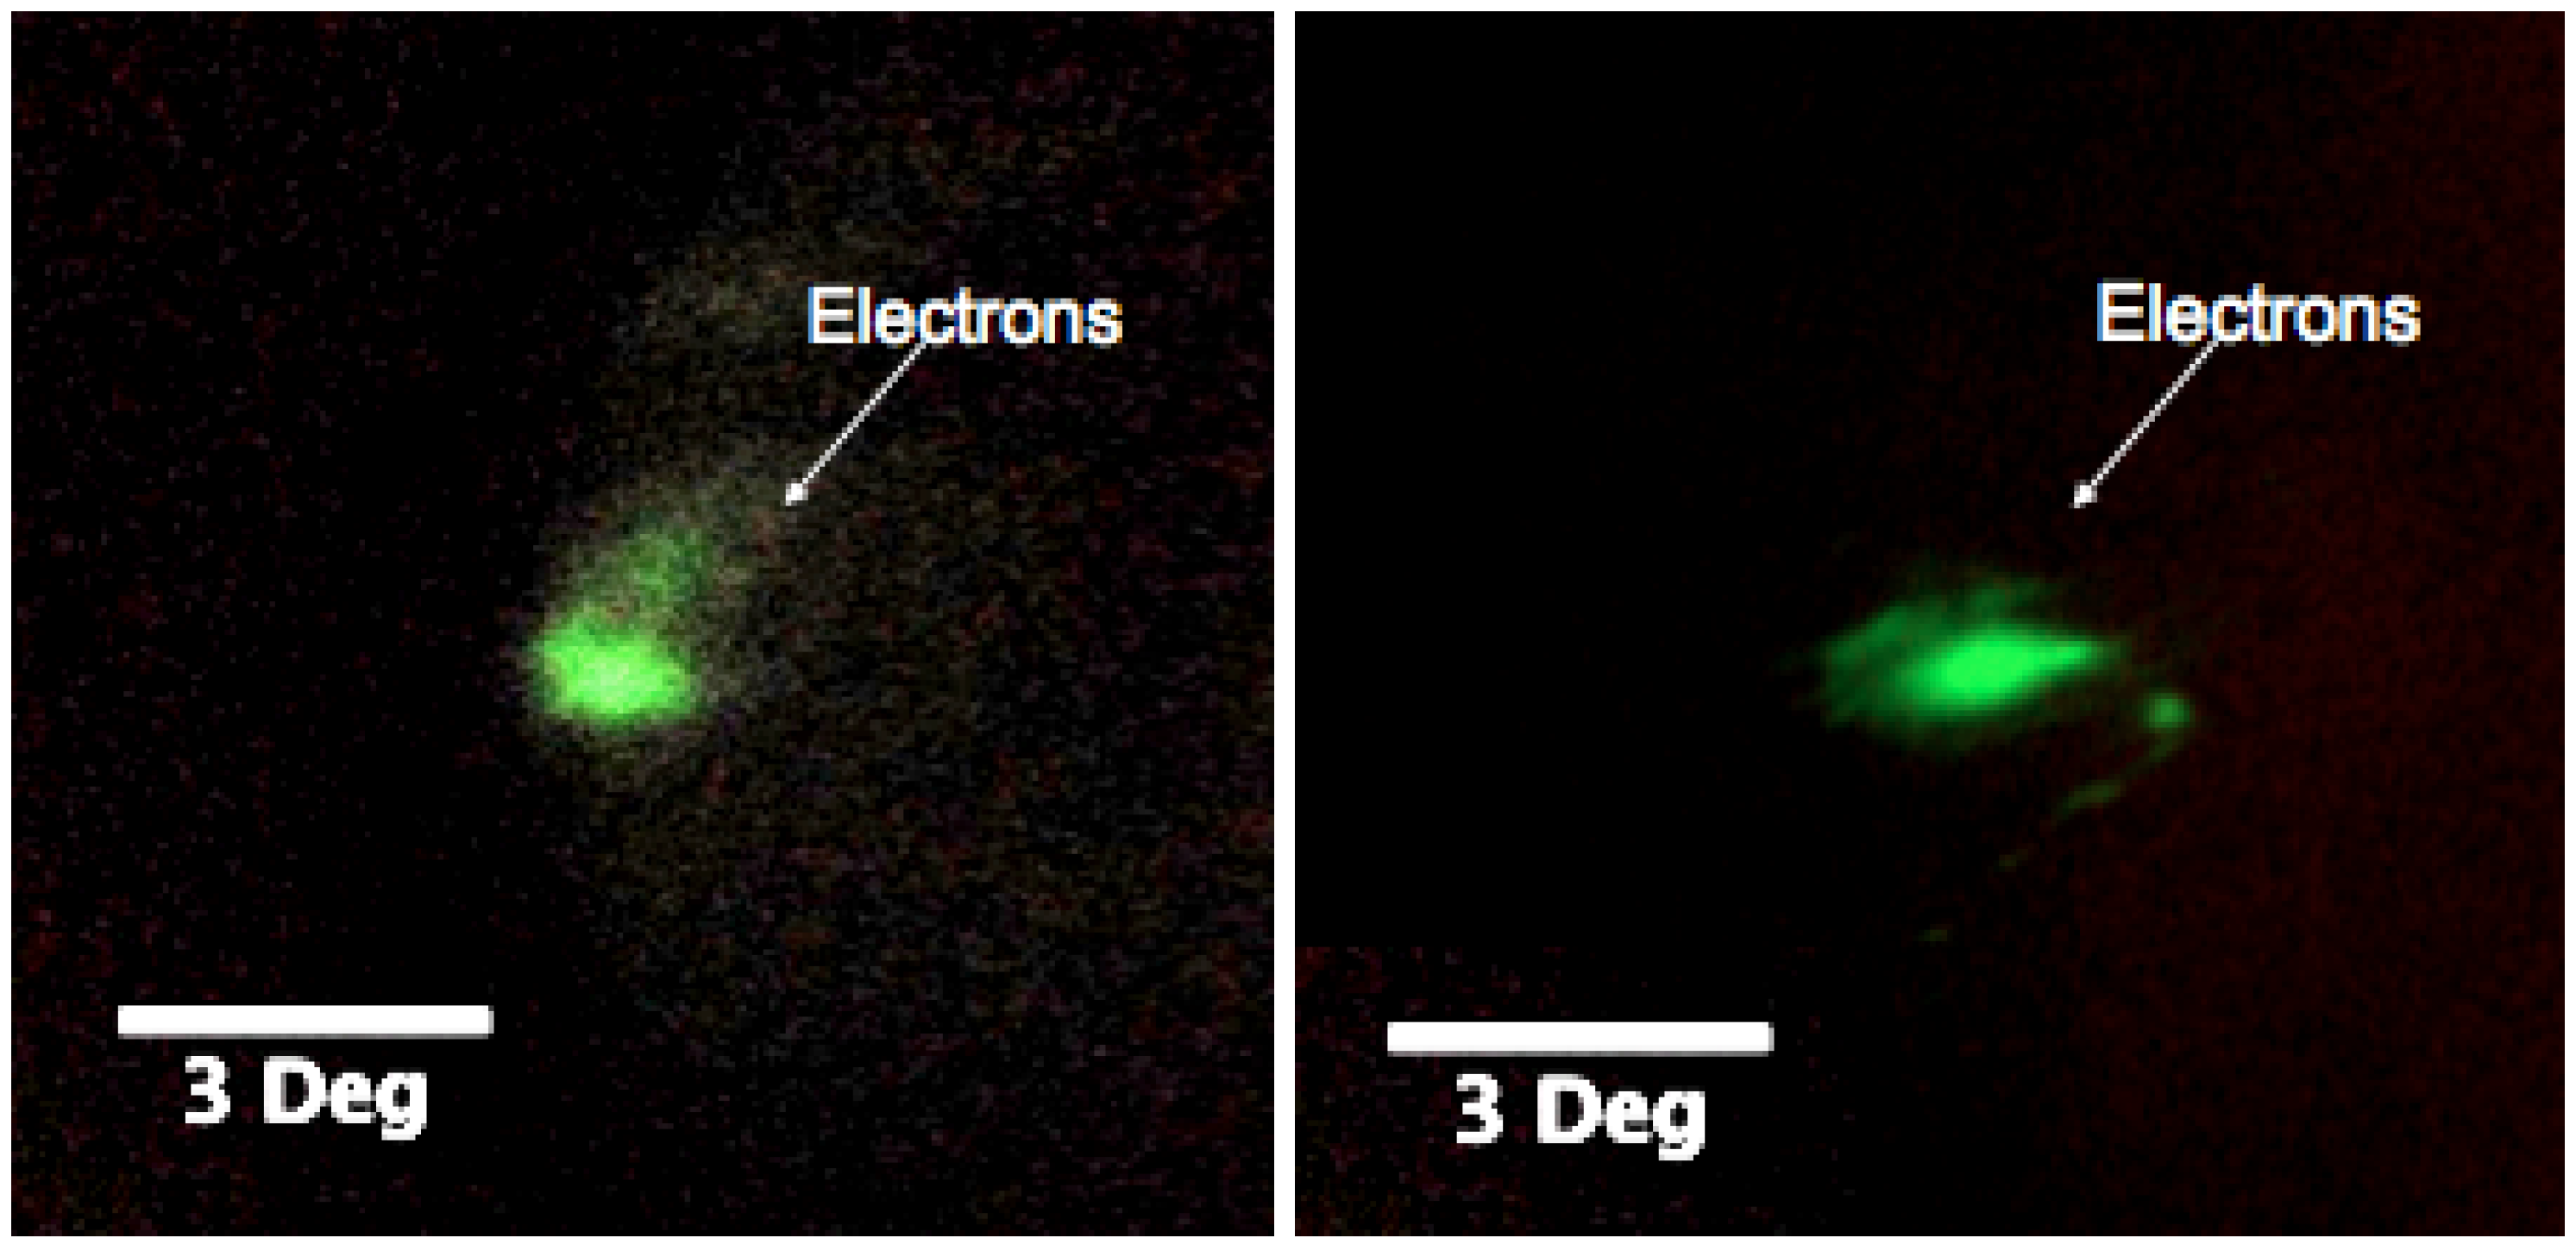
A more detailed shot-by-shot characterisation of accelerated electron bunches was carried out using a LANEX scintillating screen placed at 40 cm downstream along the electron propagation direction. The LANEX screen enabled us to record electron bunch properties generated in a wide range of geometrical conditions, namely the position of the focal spot relative to the gas-jet and the density of the gas. Different conditions were characterised by three different bunch properties showing: (a) no-collimation (
i.e.,
>100 mrad angle of emission), (b) medium collimation (30 mrad) and (c) high collimation (10 mrad). The images of
Figure 16 refer to the latter condition (case c), which corresponds to the condition in which a proper accelerating structure (the bubble) is produced. In these conditions, the bubble self-injects electrons and accelerates them to the 100 MeV level discussed above. This is the condition described in detail in [
48] and is expected to lead to peak energies close to the GeV at full laser power.
Figure 16.
Image of the first accelerated electron bunches obtained at FLAME during the SITE experimental campaign. Images were obtained with a LANEX screen placed at a distance of 40 cm downstream along the laser propagation direction and show generation of collimated electron bunches with mrad range divergence.
These preliminary data [
50] obtained during the commissioning of the FLAME system enabled us to confirm that the self-injection regime had been achieved at the new installation as expected according to the design specifications. Following these early results, a dedicated experimental campaign has been established aiming at exploring the full potential of the FLAME system for acceleration with self-injection in gas-jet targets. This campaign is now half-way through; the latest results are currently under analysis and will be the subject of forthcoming publications.


