Laser Induced Multiphoton Effects in Nano-Graphene Molecules

Abstract
:1. Introduction
2. Theory
2.1. Formalism of the HHG Calculation
2.2. Simulation Details
3. Results and Discussions
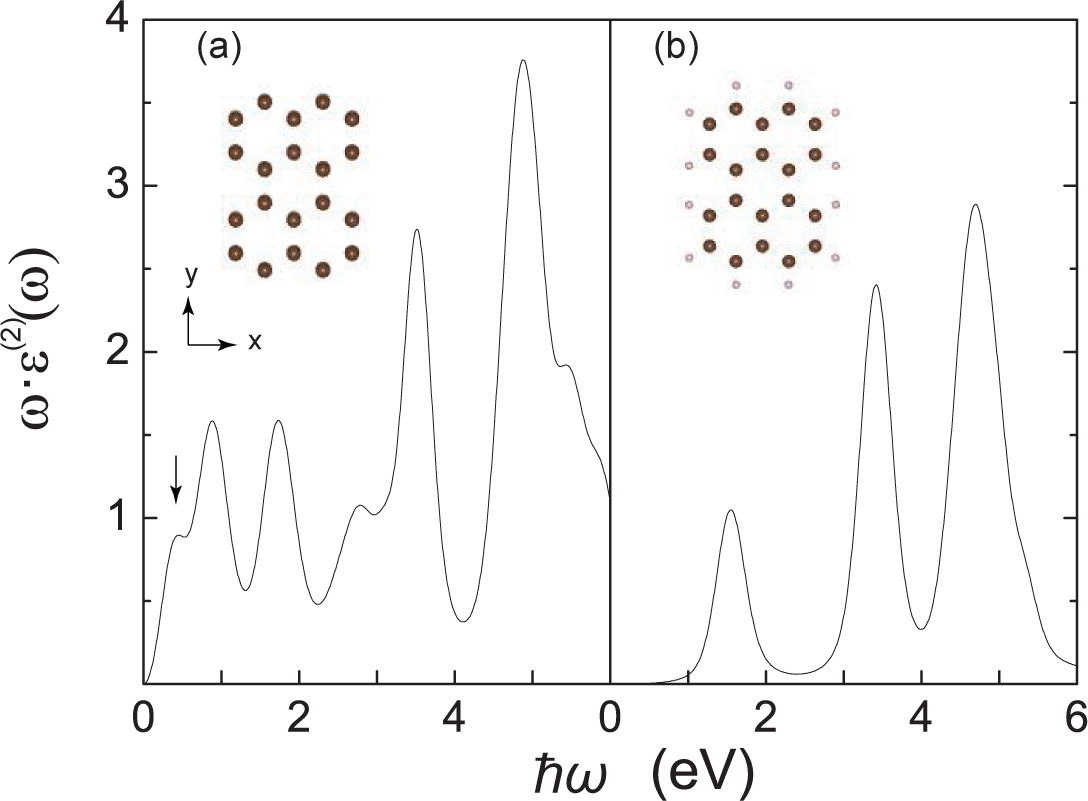
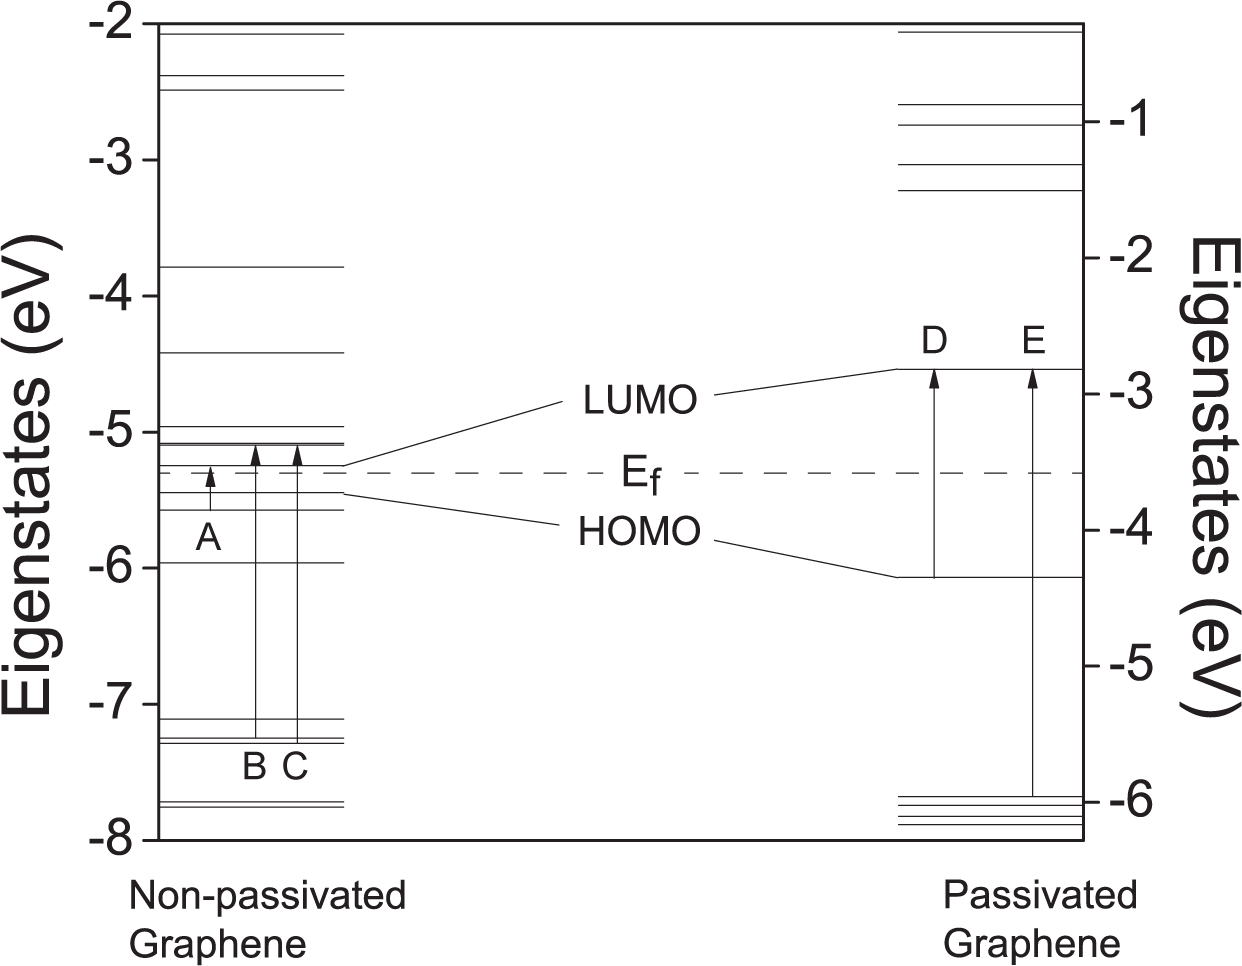
3.1. Graphene Molecules without/with Hydrogen Passivation
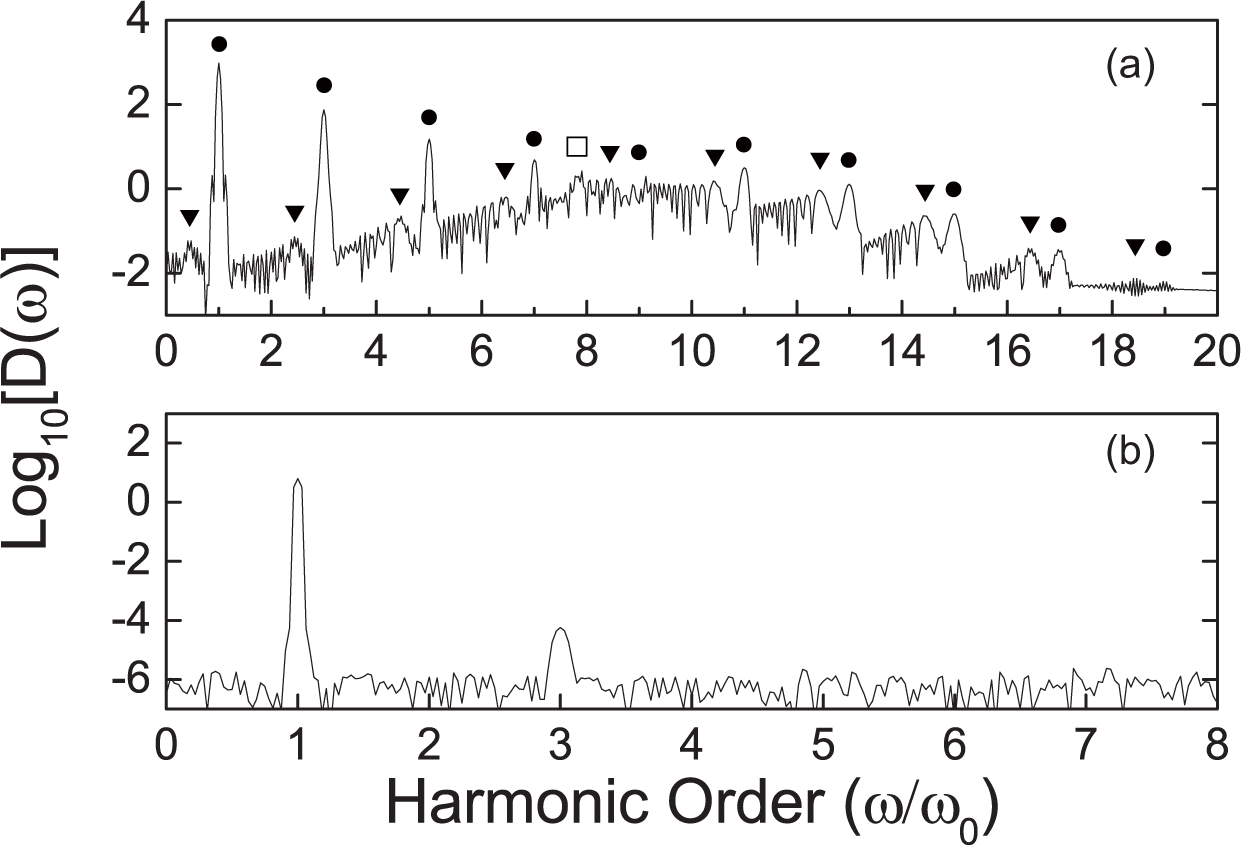
3.2. Peaks with Fractional Harmonic Orders
4. Conclusions
Acknowledgments
References
- Bucksbaum, P.H.; Bashkansky, M.; Freeman, R.R.; McIlrath, T.J.; DiMauro, L.F. Suppression of multiphoton ionization with circularly polarized coherent light. Phys. Rev. Lett. 1986, 56, 2590–2593. [Google Scholar]
- Johann, U.; Luk, T.S.; Egger, H.; Rhodes, C.K. Rare-gas electron-energy spectra produced by collision-free multiquantum processes. Phys. Rev. A. 1986, 34, 1084–1103. [Google Scholar]
- Van der Zwan, E.V.; Lein, M. Molecular imaging using high-order harmonic generation and above-threshold ionization. Phys. Rev. Lett. 2012, 108, 043004:1–043004:5. [Google Scholar]
- Squirrel, J.M.; Wokosin, D.L.; White, J.G.; Barister, B.D. Long-term two-photon fluorescence imaging of mammalian embryos without compromising viability. Nat. Biotechnol. 1999, 17, 763–767. [Google Scholar]
- Farrell, J.P.; Petretti, S.; Förster, J.; McFarland, B.K.; Spector, L.S.; Vanne, Y.V.; Decleva, P.; Bucksbaum, P.H.; Saenz, A.; Gühr, M. Strong field ionization to multiple electronic states in water. Phys. Rev. Lett. 2011, 107, 083001:1–083001:4. [Google Scholar]
- Varró, S.; Ehlotzky, F. Higher-harmonic generation from a metal surface in a powerful laser field. Phys. Rev. A. 1994, 49, 3106–3109. [Google Scholar]
- Kim, I.J.; Kim, C.M.; Kim, H.T.; Lee, G.H.; Lee, Y.S.; Park, J.Y.; Cho, D.J.; Nam, C.H. Highly efficient high-harmonic generation in an orthogonally polarized two-color laser field. Phys. Rev. Lett. 2005, 94, 243901:1–243901:4. [Google Scholar]
- Son, Y.-W.; Cohen, M.L.; Louie, S.G. Half-metallic graphene nanoribbons. Nature 2006, 444, 347–349. [Google Scholar]
- Longo, R.C.; Carrete, J.; Gallego, L.J. Ab initio study of 3d, 4d, and 5d transition metal adatoms and dimers adsorbed on hydrogen-passivated zigzag graphene nanoribbons. Phys. Rev. B. 2011, 83, 235415:1–235415:9. [Google Scholar]
- Martins, T.B.; Miwa, R.H.; da Silva, A.J.R.; Fazzio, A. Electronic and transport properties of boron-doped graphene nanoribbons. Phys. Rev. Lett. 2007, 98, 196803:1–196803:4. [Google Scholar]
- Mikhailov, S.A. Non-linear electromagnetic response of graphene. Europhys. Lett. 2007, 79. [Google Scholar] [CrossRef]
- Mikhailov, S.A.; Ziegler, K. Nonlinear electromagnetic response of graphene: Frequency multiplication and the self-consistent-field effects. J. Phys. Condens. Matt. 2008, 20. [Google Scholar] [CrossRef]
- Mikhailov, S.A. Electromagnetic response of electrons in graphene: Non-linear effects. Physica E 2008, 40, 2626–2629. [Google Scholar]
- Dean, J.J.; van Driel, H.M. Second harmonic generation from graphene and graphitic films. Appl. Phys. Lett. 2009, 95, 261910–261913. [Google Scholar]
- Dean, J.J.; van Driel, H.M. Graphene and few-layer graphite probed by second-harmonic generation: Theory and experiment. Phys. Rev. B. 2010, 82, 125411:1–125411:10. [Google Scholar]
- Hendry, E.; Hale, P.J.; Moger, J.; Savchenko, A.K.; Mikhailov, S.A. Coherent nonlinear optical response of graphene. Phys. Rev. Lett. 2010, 105, 097401:1–097401:4. [Google Scholar]
- Jafari, S.A. Nonlinear optical response in gapped graphene. J. Phys. Condens. Matt. 2012, 24. [Google Scholar] [CrossRef]
- Yao, X.; Belyanin, A. Giant optical nonlinearity of graphene in a strong magnetic field. Phys. Rev. Lett. 2012, 108, 255503:1–255503:4. [Google Scholar]
- Atoms in Intense Laser Fields; Gavrila, M. (Ed.) Academic: New York, NY, USA, 1992.
- Eberly, J.H.; Javanainen, J. Rzążewski. Above-threshold ionization. Phys. Rep. 1991, 204, 331–383. [Google Scholar]
- Zhang, G.P. Optical high harmonic generation in C60. Phys. Rev. Lett. 2005, 95. [Google Scholar] [CrossRef]
- Sharma, S.; Dewhurst, J.K.; Ambrosch-Draxl, C. Linear and second-order optical response of III-V monolayer superlattices. Phys. Rev. B. 2003, 67. [Google Scholar] [CrossRef]
- Adolph, B.; Furthmüller, J.; Bechstedt, F. Optical properties of semiconductors using projector-augmented waves. Phys. Rev. B. 2001, 63. [Google Scholar] [CrossRef]
- Kresse, G.; Furthmüller, J. Efficiency of ab-initio total energy calculations for metals and semiconductors using a plane-wave basis set. Comput. Mater. Sci. 1996, 6, 15–50. [Google Scholar]
- Baer, R.; Neuhauser, D.; Ždánská, P.R.; Moiseyev, N. Ionization and high-order harmonic generation in aligned benzene by a short intense circularly polarized laser pulse. Phys. Rev. A. 2003, 68, 043406:1–043406:8. [Google Scholar]
- Ceccherini, F.; Bauer, D. Harmonic generation in ring-shaped molecules. Phys. Rev. A. 2001, 64. [Google Scholar] [CrossRef]
- Moiseyev, N.; Lein, M. Non-hermitian quantum mechanics for high-order harmonic generation spectra. J. Phys. Chem. A. 2003, 107, 7181–7188. [Google Scholar]
- Krause, J.L.; Schafer, K.J.; Kulander, K.C. High-order harmonic generation from atoms and ions in the high intensity regime. Phys. Rev. Lett. 1992, 68, 3535–3538. [Google Scholar]
- Becker, W.; Long, S.; McIver, J.K. Modeling harmonic generation by a zero-range potential. Phys. Rev. A. 1994, 50, 1540–1560. [Google Scholar]
- Lewenstein, M.; Balcou, P.; Ivanov, M.Y.; L’Huillier, A.; Corkum, P.B. Theory of high-harmonic generation by low-frequency laser fields. Phys. Rev. A. 1994, 49, 2117–2132. [Google Scholar]
- Morozov, S.V.; Novoselov, K.S.; Katsnelson, M.I.; Schedin, F.; Ponomarenko, L.A.; Jiang, D.; Geim, A.K. Strong suppression of weak localization in graphene. Phys. Rev. Lett. 2006, 97, 016801:1–016801:4. [Google Scholar]
- Nonlinear Optics in Metals; Bennemann, K.H. (Ed.) Clarendon Press: Oxford, UK, 1998.


© 2013 by the authors; licensee MDPI, Basel, Switzerland This article is an open access article distributed under the terms and conditions of the Creative Commons Attribution license (http://creativecommons.org/licenses/by/3.0/).
Share and Cite
Gu, M.; Zhang, G.; Wu, X. Laser Induced Multiphoton Effects in Nano-Graphene Molecules. Appl. Sci. 2013, 3, 278-287. https://doi.org/10.3390/app3010278
Gu M, Zhang G, Wu X. Laser Induced Multiphoton Effects in Nano-Graphene Molecules. Applied Sciences. 2013; 3(1):278-287. https://doi.org/10.3390/app3010278
Chicago/Turabian StyleGu, Mingqiang, Guoping Zhang, and Xiaoshan Wu. 2013. "Laser Induced Multiphoton Effects in Nano-Graphene Molecules" Applied Sciences 3, no. 1: 278-287. https://doi.org/10.3390/app3010278
APA StyleGu, M., Zhang, G., & Wu, X. (2013). Laser Induced Multiphoton Effects in Nano-Graphene Molecules. Applied Sciences, 3(1), 278-287. https://doi.org/10.3390/app3010278