1. Introduction
As a consequence of the rapid expansion of shale oil output, North America has assumed a leading role in notable achievements in shale oil exploration and development. This has not only transformed the energy supply configuration of the United States and empowered it to achieve energy independence but has also forged a new global energy landscape [
1,
2,
3,
4]. Significant progress has also been attained in continental shale across multiple formations in diverse regions across China [
5]. Abundant shale oil reserves have been confirmed within the Cretaceous Qingshankou Formation of the Songliao Basin [
6], the Permian Lucaogou Formation of the Junggar Basin [
7], and the Triassic Chang 7 Member of the Ordos Basin [
8], as well as other formations.
The Daqing Placanticline tectonic belt in the Songliao Basin is one of the most important oil and gas production areas in China, and the Upper Cretaceous Qingshankou Formation contains a thick succession of organic-rich shale [
9,
10,
11]. Successful shale oil extraction relies predominantly on horizontal well development and large-volume hydraulic fracturing [
12]. The reservoir fracability determines the fracturing efficiency and cost to a certain extent. At present, the focus of reservoir evaluation has shifted from simply searching for oil-bearing sweet spots to simultaneously identifying fracability sweet spots. In the study area, the current fracability evaluation is mostly based on a single parameter, i.e., the brittleness index. However, it has been shown that even formations with a high brittleness index can fail to achieve favorable fracturing results owing to the influence of confining pressure [
13,
14]. Apart from the brittleness index, factors such as rock mechanical properties and in situ stress characteristics also exert significant impacts on the reservoir fracturing performance. Therefore, accurate and effective prediction of reservoir fracability parameters and quality evaluation are particularly crucial for achieving efficient development of shale oil [
15].
The Qingshankou Formation in the central Daqing Placanticline has favorable geological conditions, including elevated total organic carbon (TOC) contents and good porosity and permeability. However, there are no development wells that specifically target shale oil intervals, and only two cored wells have been drilled in the Qingshankou Formation. Thus, it is essential to interpret and evaluate the fracability parameters using logging data. Consequently, based on logging data from 59 archival wells in the central part of the Daqing Placanticline, laboratory core experiments on samples obtained from two cored wells, and mathematical statistical methods, this study established logging interpretation models for fracability parameters, analyzed characteristics such as the brittleness index and in situ geostress anisotropy of the shale reservoirs within the Qingshankou Formation, and conducted classification evaluation of fracability with the overarching goal of providing technical assistance for the development of shale oil.
2. Overview of the Study Area
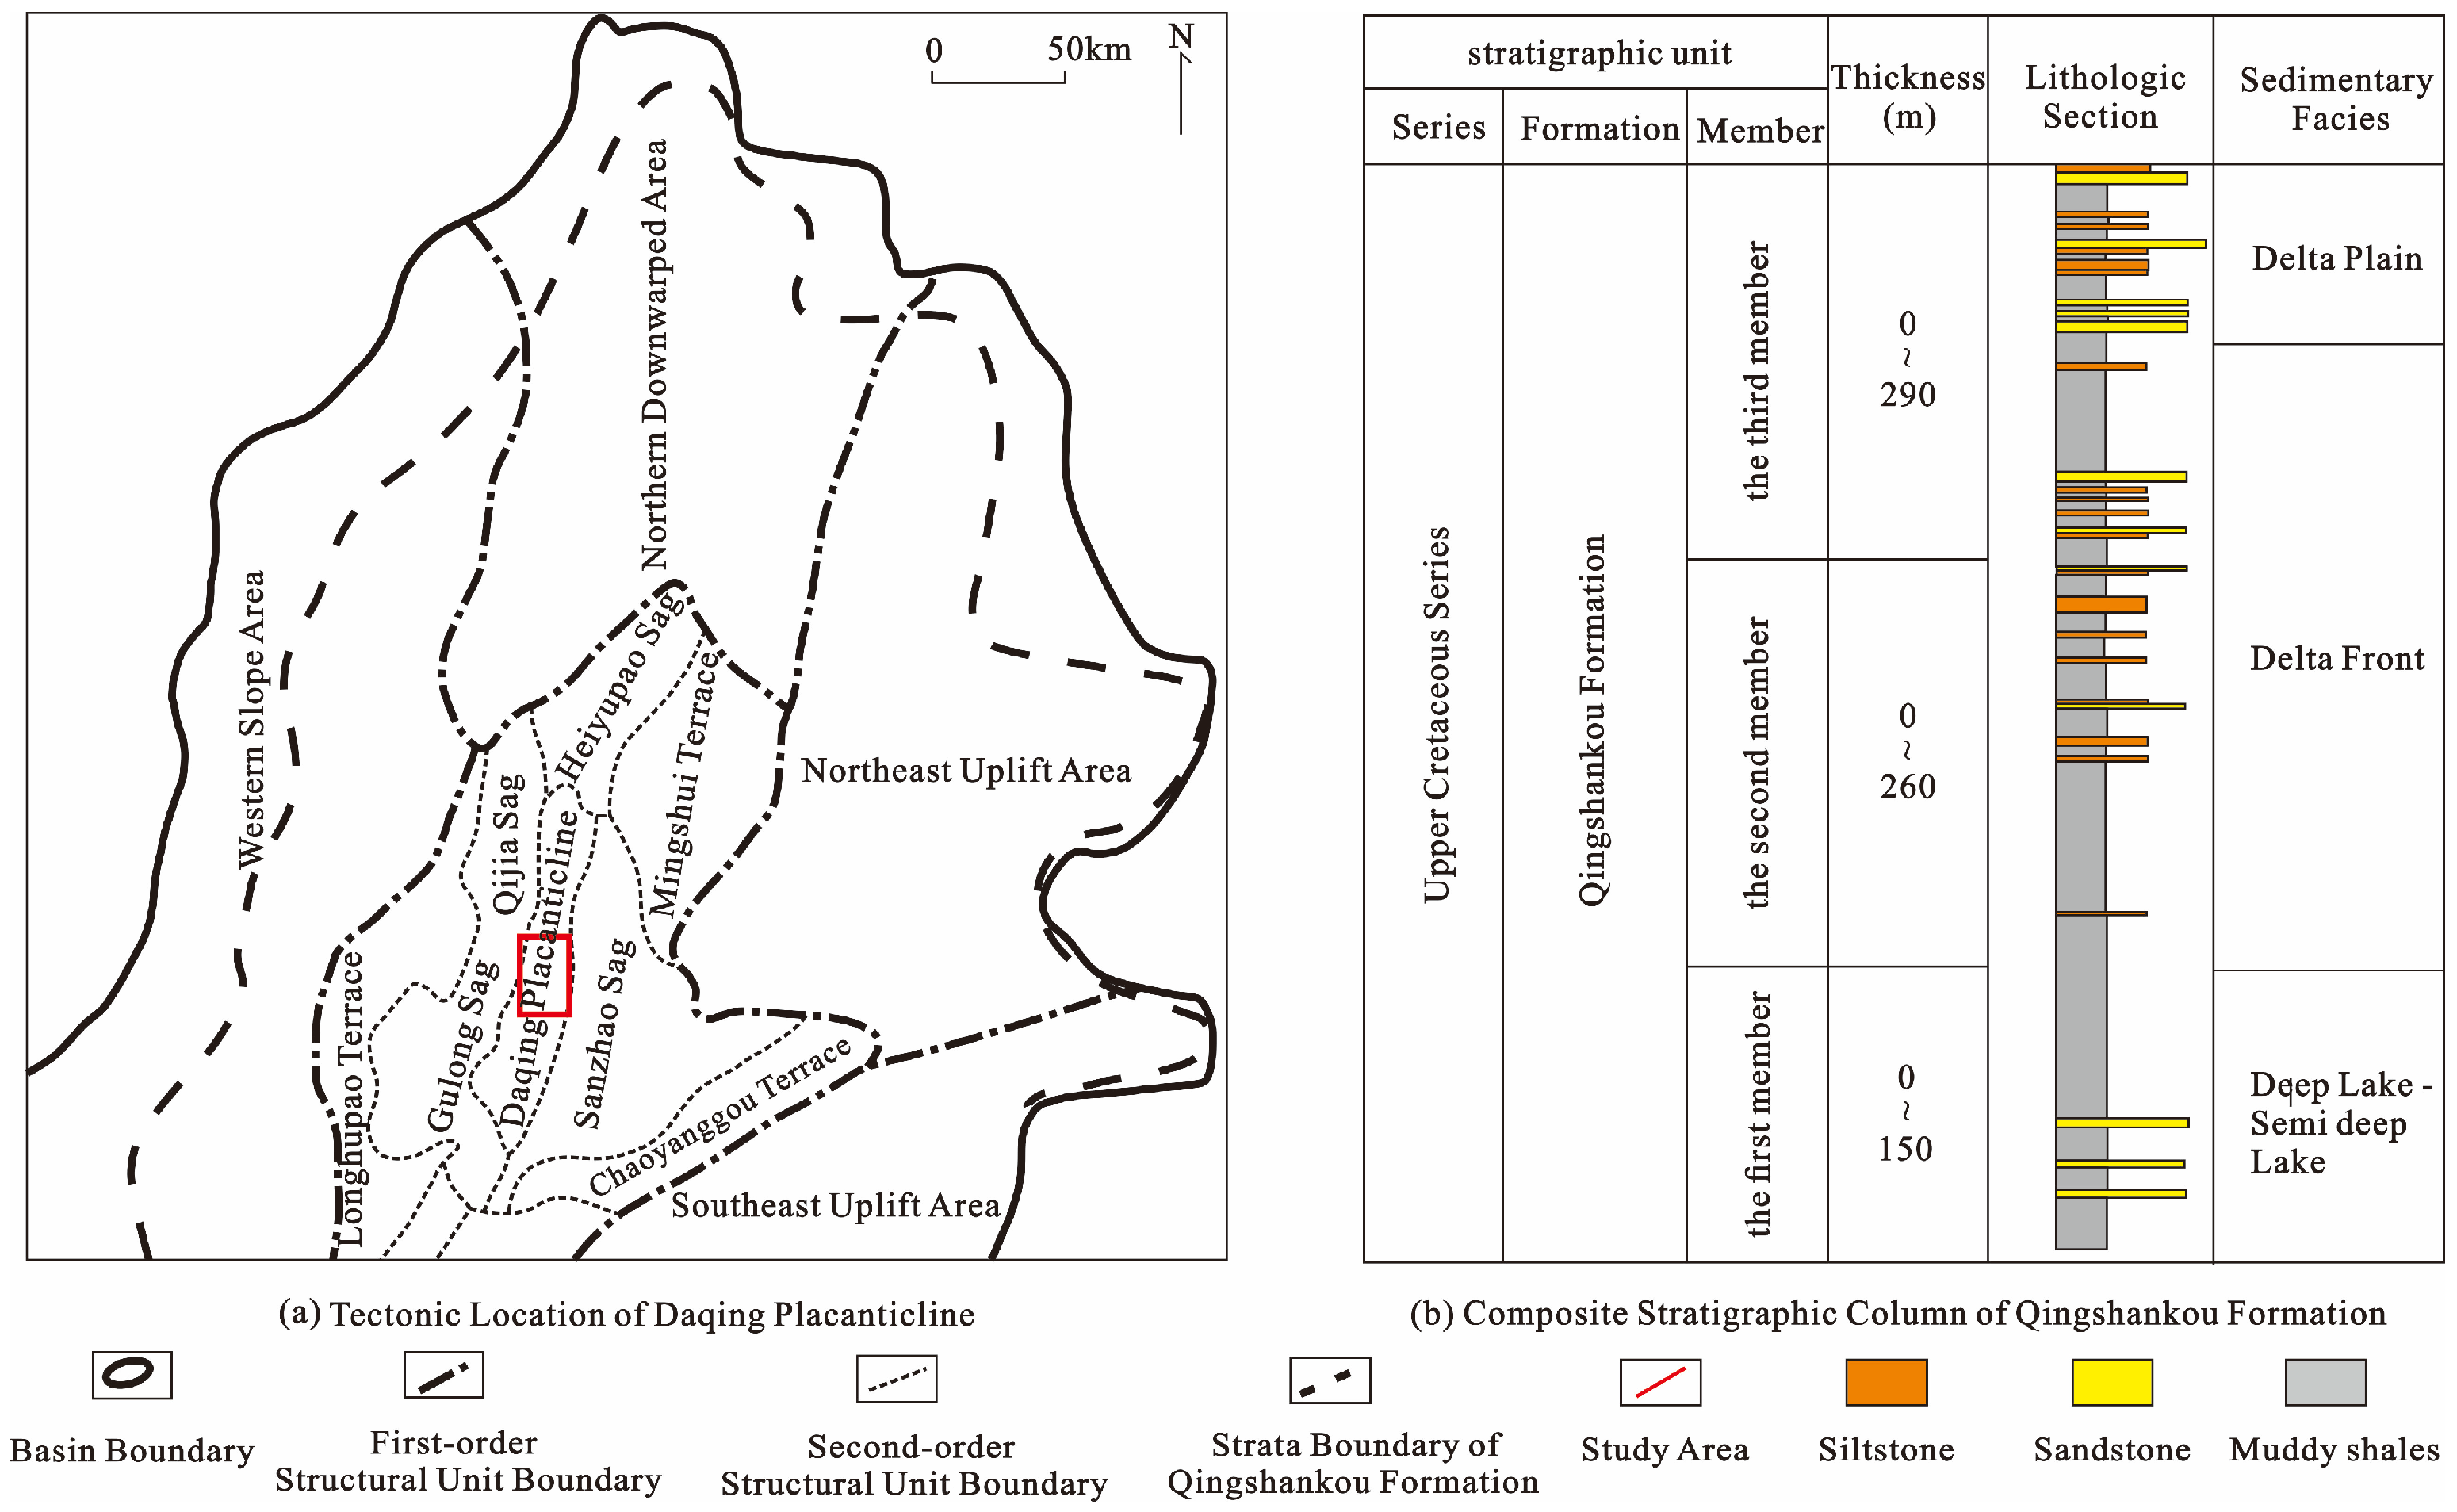
The Daqing Placanticline is a large-scale anticlinal tectonic belt in the central depression zone of the Songliao Basin, Northeast China (
Figure 1a). Situated between the Qijia-Gulong Sag and the Sanzhao Sag, it was formed by intense compressional tectonic forces during the latest Cretaceous and represents the most hydrocarbon-rich region in the basin. Overall, the strata within the structure exhibit a progressive increase in dip angle from top to bottom, accompanied by a concurrent progressive decrease in thickness from the flanks to the crest [
16,
17]. This study concentrated on the central part of the Placanticline, and the target interval is the Cretaceous Qingshankou Formation, which has burial depths of approximately 1400–1800 m. During the depositional stage of the first member of the Cretaceous Qingshankou Formation (Qing 1 Member), a large-scale transgression occurred, and semi-deep to deep lacustrine facies deposits were widely developed across the lake basin, thus generating extensively spread black and grayish-black muddy shales with a bulk thickness of roughly 30–100 m [
18] (
Figure 1b). The second and third members of the Qingshankou Formation (Qing 2 + 3 Members) were deposited under a regressive lacustrine background, with depositional environments encompassing lacustrine and deltaic settings. The succession is dominated by muddy shales, intercalated with sandstone and siltstone beds, and is characterized by distinct sedimentary cycles and well-developed stratification [
19,
20]. The Qing 1 Member and the lower part of the Qing 2 + 3 Members are the most important source rocks and shale oil reservoirs in the basin. The Upper Cretaceous Qingshankou Formation is characterized by distinct mudstone and shale successions intercalated with thin beds of siltstone and sandstone. This strong reservoir heterogeneity results in drastic vertical and lateral variations in the reservoir’s lithology, physical properties, oil-bearing properties, and mechanical properties. Consequently, accurate prediction of the rock mechanical parameters and in situ geostress is critical for engineering design and safe drilling operations. Therefore, for the assessment of shale oil reservoirs in this region, it is imperative to comprehensively consider the distinctive geological setting and to establish targeted interpretation models and evaluation methods.
3. Logging Interpretation Method for Fracability Parameters
Relevant research results in China and abroad have shown that the parameters affecting the fracability of shale include natural fractures, burial depth, brittle mineral content, rock mechanical properties, brittleness index, fracture toughness, stress difference, diagenesis, and bedding [
22,
23,
24,
25,
26,
27]. In the context of practical reservoir stimulation operations, the primary parameters that can directly reflect its fracability are as follows: rock mechanical properties, brittleness index, and in situ geostress [
28]. Therefore, this study focused on these parameters.
Prior to log interpretation, standardization of well logging curves is required to eliminate systematic errors unrelated to formation properties, which are caused by variations in tool types, calibration standards, and operational procedures. The mudstone intervals with stable lithology and continuous distribution in the Qing 1 Member of the Qingshankou Formation are taken as the datum horizon for standardization. Consistency correction is performed on key logging curves, including deep laterolog resistivity, acoustic slowness, litho-density, and compensated neutron. For the deep laterolog resistivity curve, which is significantly affected by tool calibration drift and mud invasion, the ratio method is adopted for multiplicative correction. For acoustic slowness, litho-density, and compensated neutron curves, which are mainly disturbed by additive factors such as borehole conditions and tool baseline deviation, the difference method is used for linear shift correction.
3.1. Rock Mechanics Parameters
Young’s modulus and Poisson’s ratio are typically utilized to describe the mechanical properties of rocks. The former is capable of reflecting the shale’s ability to maintain fractures post-fracturing, whereas the latter reflects the shale’s ability to fracture when subjected to pressure. Generally speaking, as high-quality fracturing intervals, shales featuring a high Young’s modulus and low Poisson’s ratio enable the easy formation and maintenance of fractures, thereby achieving higher efficiency in fracture propagation [
29,
30].
The predominant methodologies for deriving them principally comprise laboratory mechanical testing and geophysical logging data interpretation techniques. The laboratory mechanical testing method provides direct measurements of core properties, but it cannot fully reflect the in situ underground state due to stress release during coring; its distinguishing characteristics are a high level of difficulty, significant expense, and constraints relating to the continuity of sampling [
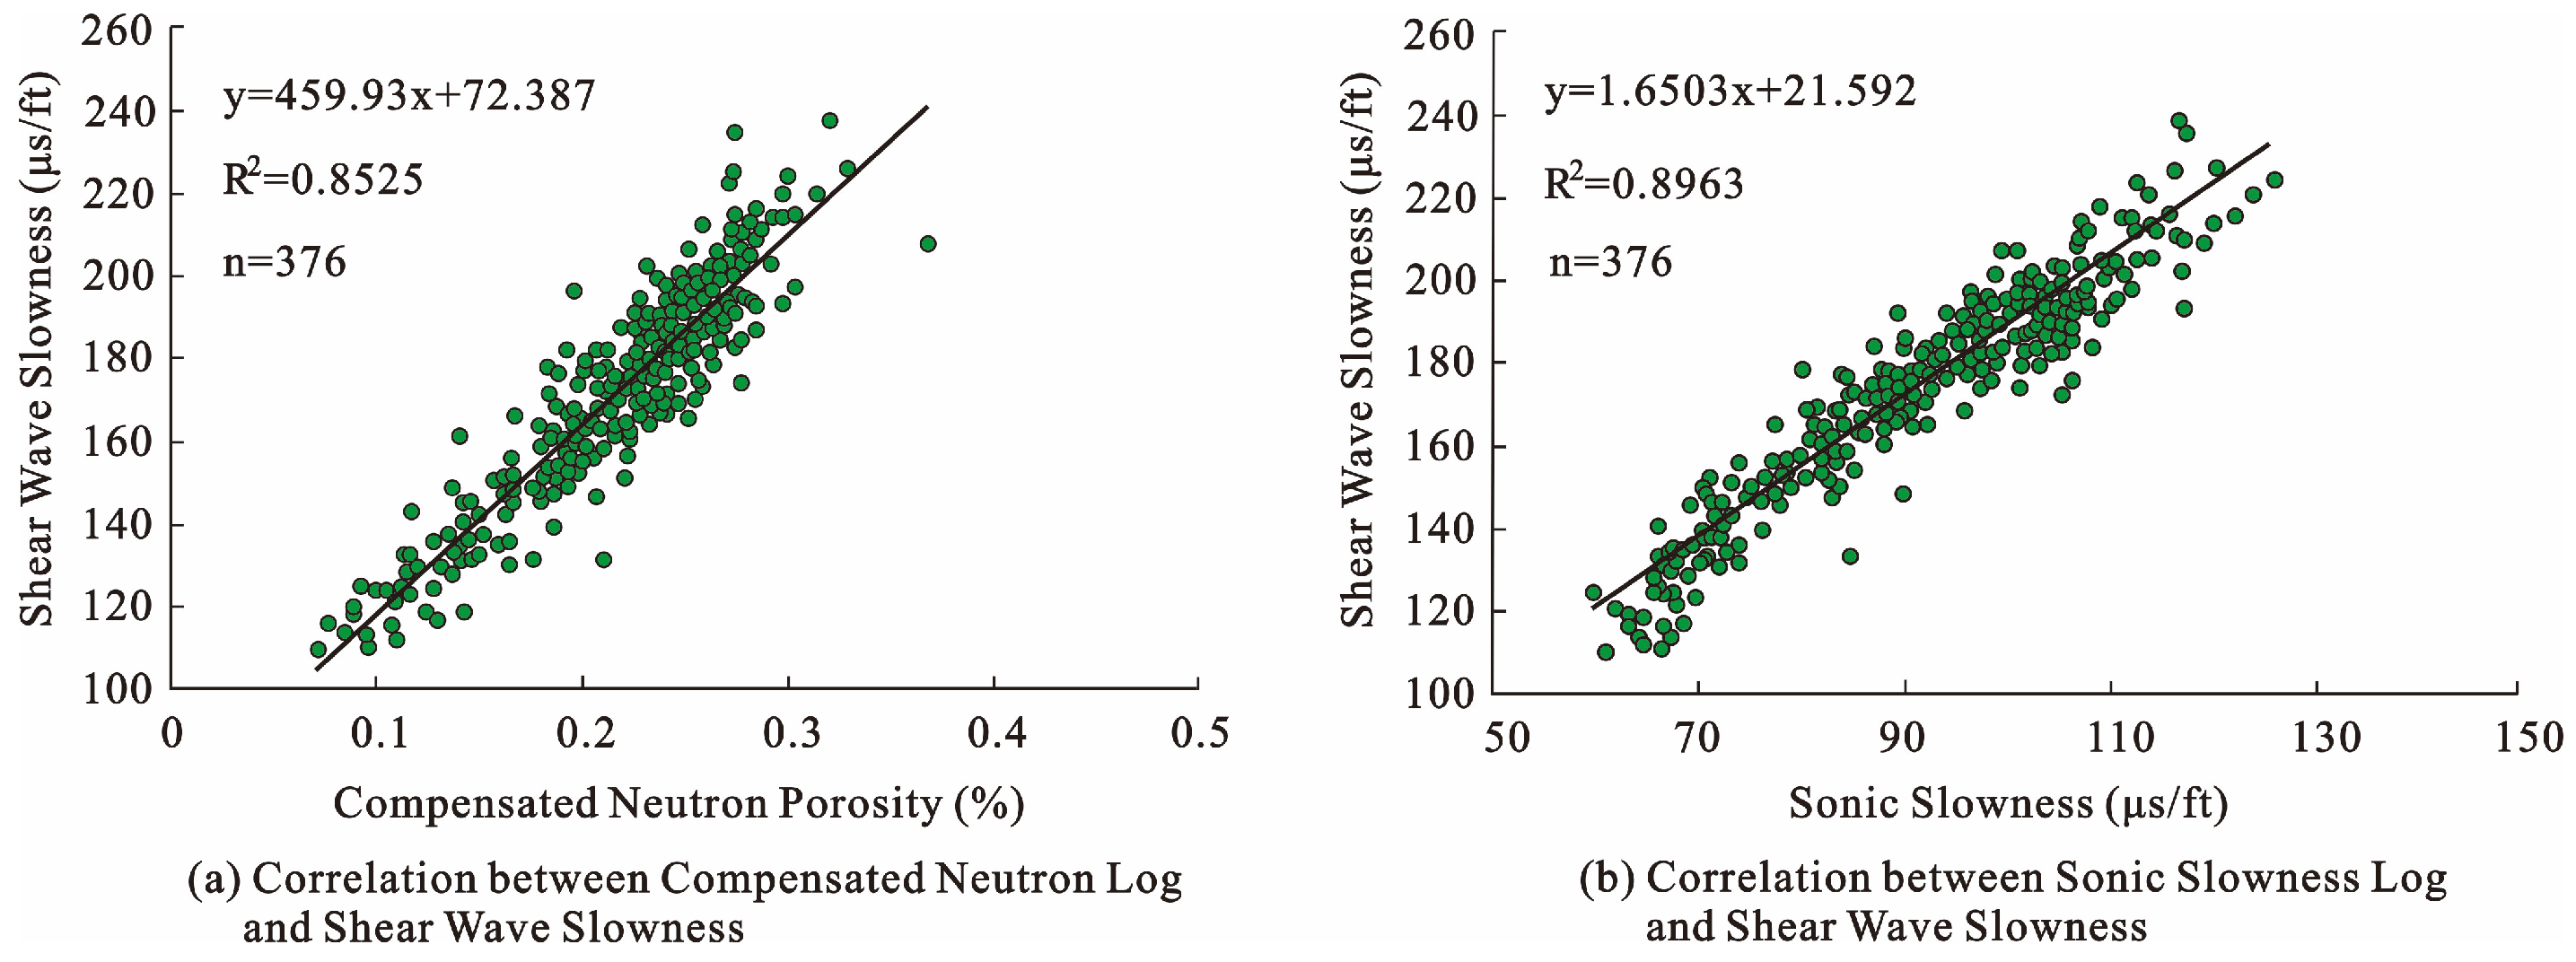
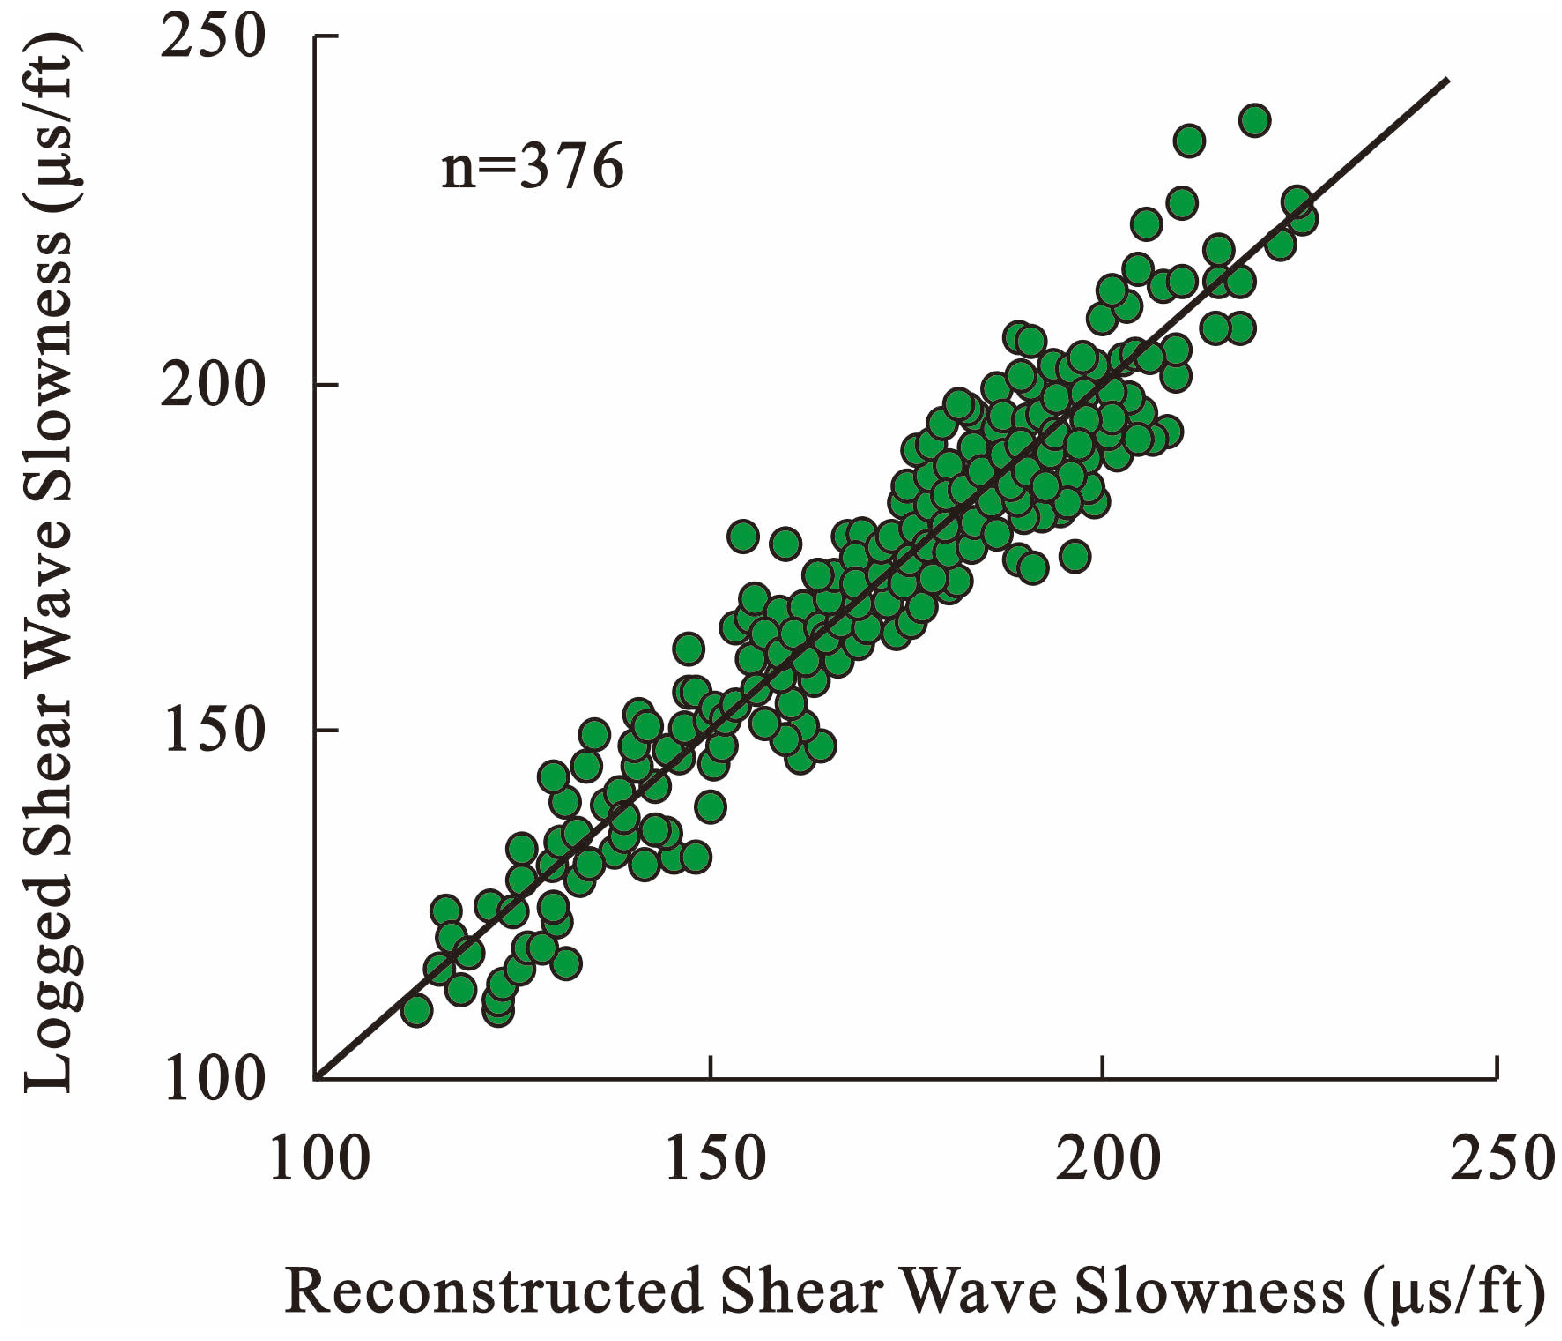
31]. Therefore, this study adopted the logging data interpretation method for acquisition. The logging interpretation method requires shear wave and compressional wave logging data, but conventional acoustic logging is mainly based on compressional waves. Therefore, it is essential to first predict the shear wave slowness using other conventional logging data. The calibration and correction of shear wave slowness were performed using seven typical wells (GY1, SYY1, Y64, Y73, YX56, A34, and GY2HC) from the study area and adjacent sag. Correlation analysis based on conventional logging data (based on 376 samples) shows that shear wave slowness has good correlations with compensated neutron and acoustic slowness logs (
Figure 2). The shear wave slowness calculation formula fitted based on this relationship (Equation (1)) has an average relative error of 3.06% (
Figure 3). By combining the shear wave slowness data obtained from Equation (1) with the compressional wave slowness and density logging data, they can be calculated (Equations (2) and (3)).
In Equation (1),
DTS is the shear wave slowness (μs/ft);
DT is the acoustic slowness (μs/ft); and
CNL is the compensated neutron (%).
In Equations (2) and (3), E is Young’s modulus (GPa); is Poisson’s ratio; DTC is the compressional wave slowness (μs/ft); and DEN is the lithology density (g/cm3).
Figure 2.
Correlations between the shear wave slowness and the compensated neutron and acoustic slowness.
Figure 2.
Correlations between the shear wave slowness and the compensated neutron and acoustic slowness.
Figure 3.
Accuracy comparison of the reconstructed shear wave slowness calculation model and the logged shear wave slowness.
Figure 3.
Accuracy comparison of the reconstructed shear wave slowness calculation model and the logged shear wave slowness.
3.2. Brittleness Index
Reservoir fracability reflects the capacity of a reservoir to undergo effective fracturing and reconstruction. A common and important characterization parameter is the brittleness index. Currently, for the estimation of the brittleness index, two predominant methods are applied. The first method is the mineral composition method [
32] (Equation (4)); this method is characterized by simple calculations and straightforward operation, and its core logic is to take the relative proportions of the brittle minerals in the rock as the key indicators for evaluating shale brittleness. It is well established that a higher brittle mineral content corresponds to an elevated brittleness index, which makes it more suitable for effective development [
33]. For high-quality shale reservoirs, the mineralogical characteristics typically show a brittle mineral content exceeding 40% [
34].
Another methodological approach was proposed by Rickman [
35], which quantifies shale brittleness through the integration of rock mechanical parameters (Equation (5)). According to this computational framework, shale reservoirs with an elevated Young’s modulus and reduced Poisson’s ratio typically exhibit enhanced brittleness. By leveraging logging data, this method yields continuous in situ information, making it suitable for detailed characterization and fine-scale analysis of target reservoirs [
36].
In Equation (5), Emax is the maximum Young’s modulus (GPa); Emin is the minimum Young’s modulus (GPa); is the maximum Poisson’s ratio; and is the minimum Poisson’s ratio.
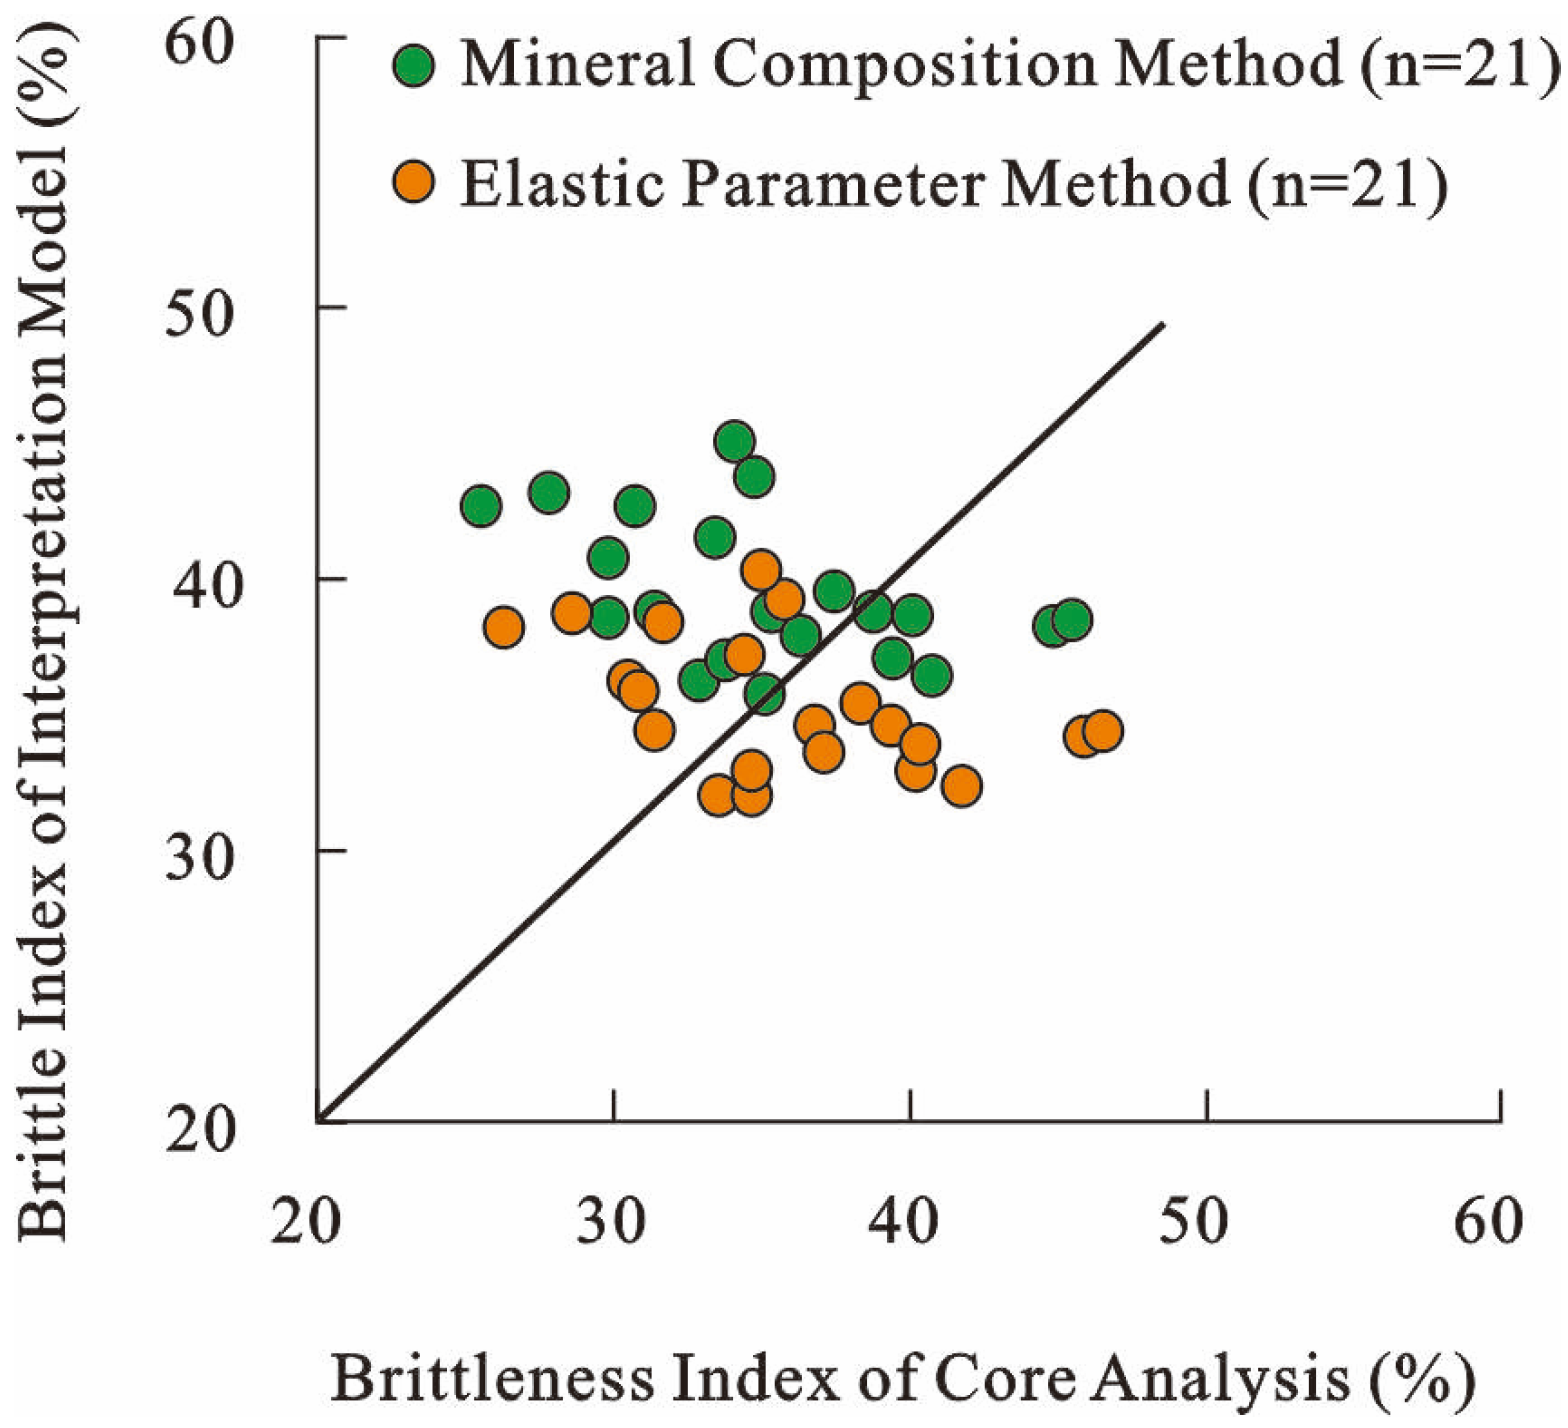
The calculation results of these two brittleness index interpretation models were compared with core analysis data. The average relative error of the mineral composition method is 10.4% (based on 21 samples) and that of the rock mechanics parameter method is 3.2% (based on 21 samples). Therefore, Rickman’s method was adopted to calculate the brittleness index (
Figure 4).
3.3. Horizontal Stress Difference
When conducting hydraulic fracturing stimulation on reservoirs, the stimulation performance is governed by the attributes of the in situ stress field, which is composed of the maximum and minimum horizontal principal stress (σ
H and σ
h) and vertical stress (σ
v). The horizontal stress difference is defined as the stress discrepancy between the maximum and minimum horizontal principal stresses (Equation (6)), and it exerts a critical impact on the propagation of hydraulic fractures and the development of intricate fracture networks. During reservoir stimulation, smaller stress differentials favor the formation of complex fracture networks [
37,
38].
At present, the commonly used in situ stress calculation models include the combined spring model, the poroelastic model, Huang’s model, etc., [
39,
40]. However, these methods do not consider the influence of formation anisotropy on horizontal in situ stress. Since the shale of the Qingshankou Formation in the Songliao Basin shows obvious anisotropy, the method proposed by Higgins (Equations (7)–(13)) was adopted for in situ stress calculation in this study. This model modifies the combined spring framework to incorporate the influence of rock anisotropy [
41].
In Equations (6)–(12), is the stress difference (MPa); z is the depth (m); is the rock’s density (g/cm3); g is the acceleration due to gravity (m/s2); Ev is the vertical Young’s modulus (GPa); Eh is the horizontal Young’s modulus (GPa); Vh is the horizontal Poisson’s ratio; Vv is the vertical Poisson’s ratio; εh is the maximum tectonic stress coefficient; εv is the minimum tectonic stress coefficient; Pp is the formation pore pressure (MPa); and is the Biot coefficient.
The pivotal step of this calculation model is obtaining the parameters C
33, C
44, C
11, C
13, and C
66 in the stiffness coefficient matrix. Among them, C
33 and C
44 were directly derived from logging data (Equations (14) and (15)) [
42]. C
11, C
13, and C
66 were obtained from mechanical wave velocity anisotropy experiments conducted on 42 core samples collected from cored wells XY1 and T1331 in the study area, and calculation formulas were established based on the correlation between the measured data and the calculated C
33 and C
44 values (Equations (16)–(18)):
In Equations (14)–(18), is the core bulk density (g/cm3); vp is the compressional wave velocity of the vertical sample (m/s); and vs is the logging shear wave velocity (m/s).
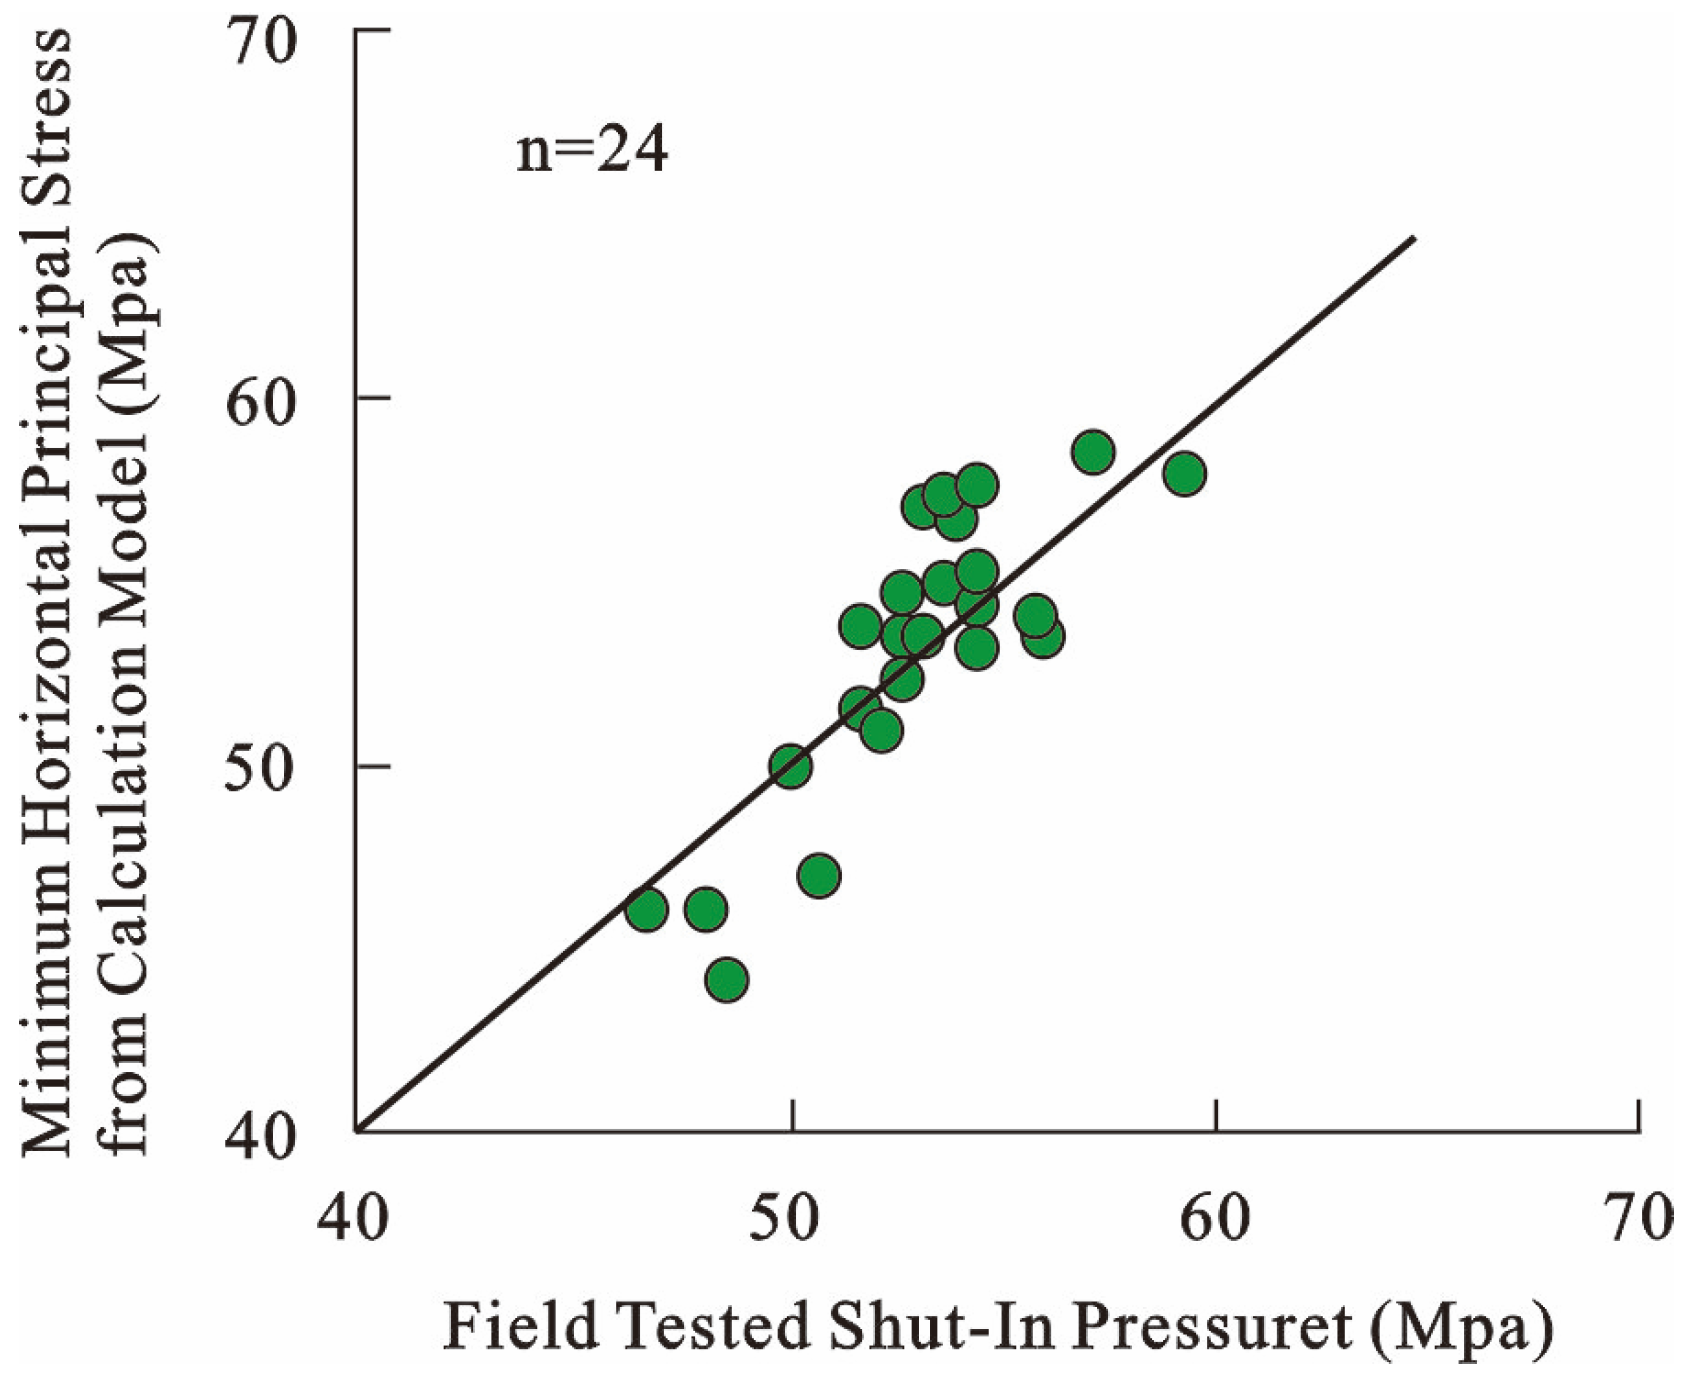
Hydraulic fracturing is widely recognized as the most robust technique for in situ stress determination. The most direct and dependable approach for quantifying the minimum horizontal principal stress relies on the shut-in pressure recorded during hydraulic fracturing operations, which corresponds to the shut-in pressure when fracturing is conducted in a single layer. Nevertheless, the testing method for the maximum horizontal principal stress has invariably been the focus of discussion, and no universally accepted standard testing method has been established to date [
43,
44]. Thus, this study focuses exclusively on evaluating the precision of the computational model for the minimum horizontal principal stress (based on 24 samples), and its mean absolute error between the model predictions and field-measured shut-in pressure is 2.0 MPa (
Figure 5).
4. Fracability Evaluation and Sweet Spot Optimization
4.1. Construction of Fracability Evaluation Model
In the process of establishing a shale fracability evaluation model, the key lies in determining the weight assignment of each parameter. Since different parameters differ in their influence mechanism and degree of fracability, the rationality of parameter weights significantly affects the accuracy of evaluation results. The analytic hierarchy process (AHP) is suitable for comprehensive evaluation in shale reservoir assessment, which involves multi-factor analysis and the interaction of subjective and objective information. Therefore, the AHP is adopted in this study to carry out quantitative weight analysis for all evaluation parameters [
45]; the specific procedure is as follows.
Due to the inconsistent ranges and units of raw data for various parameters (rock mechanics, brittleness index, and in situ stress), the range transformation method is adopted for normalization prior to quantitative evaluation [
46]. Positive indicators (Young’s modulus and brittleness index) are processed using Equation (19), while negative indicators (Poisson’s ratio and stress difference) are handled with Equation (20). This procedure maps all parameters to the interval [0, 1].
In Equations (19) and (20), C is the normalized standard value of the parameter; X is the raw value of the parameter before normalization; Xmax is the maximum raw value of the parameter; and Xmin is the minimum raw value of the parameter.
Subsequently, the AHP was employed to determine the judgment scale values (
Table 1). Values were assigned through pairwise comparison and evaluation of the relative importance of each parameter. According to existing research and field experience, brittleness is regarded as the most critical factor during fracturing stimulation, followed by the influence of in situ stress on fracability, while rock mechanical parameters are ranked the least important [
47,
48]. Accordingly, the element values of the judgment matrix were obtained (
Table 2). The component ratio of each data point in
Table 2 within each column was calculated, yielding judgment matrix A (Equation (21)).
Finally, the weight coefficients of each parameter are obtained by calculating the row averages of matrix
A (Equation (21)), yielding final weight values of 0.455 for the brittleness index, 0.263 for the stress difference, and 0.141 for both Young’s modulus and Poisson’s ratio. A consistency check is typically conducted to verify the rationality of the weights derived from the above steps (Equations (22) and (23)). In this context,
CR represents the consistency ratio: the smaller the
CR value, the better the consistency. The judgment matrix is considered to meet the consistency requirement only when
CR ≤ 0.1 [
49]; otherwise, the judgment matrix needs to be revised.
In Equations (22) and (23),
CI is the consistency index;
RI is the random consistency index (related to the number of parameters;
RI = 0.90 when the number of parameters is 4 (
Table 3));
λmax is the maximum eigenvalue of the judgment matrix (
Table 2); and
n is the number of parameters.
Based on the calculation results, the consistency ratio (
CR) is determined to be 0.0039, which meets the inspection requirements. Therefore, a comprehensive shale fracability evaluation model for the study area can be established (Equation (24)).
In Equation (24), BIn is the normalized brittleness index; is the normalized stress difference (m/s); is the normalized Young’s modulus; and is the normalized Poisson’s ratio.
4.2. Fracability Sweet Spot Optimization
Based on the comprehensive fracability index, the evaluation criteria for shale fracability sweet spots in the target study area were established and categorized into three types: Classes I, II, and III. The classification standard for Class I fracability sweet spots is a fracability index of >0.61 (brittleness index > 45%, stress difference < 2 MPa, Young’s modulus > 13 GPa, Poisson’s ratio < 0.18), with a post-fracturing productivity of greater than 3 m
3/d; the standard for Class II fracability sweet spots is a fracability index of 0.33–0.61 (brittleness index of 40–45%, stress difference of 2–4 MPa, Young’s modulus of 10–13 GPa, Poisson’s ratio of 0.18–0.23), with minor oil flow observed after fracturing; and the standard for Class III fracability sweet spots is a fracability index of <0.33 (brittleness index < 40%, stress difference > 4 MPa, Young’s modulus < 10 GPa, Poisson’s ratio > 0.23), with no oil production capacity under the current technical conditions (
Table 4).
The aforementioned computational framework was applied to derive the fracability index, brittleness index, stress differential, Young’s modulus, and Poisson’s ratio for the Qingshankou Formation across 59 wells located in the central Daqing Placanticline. The characteristics were determined to be as follows.
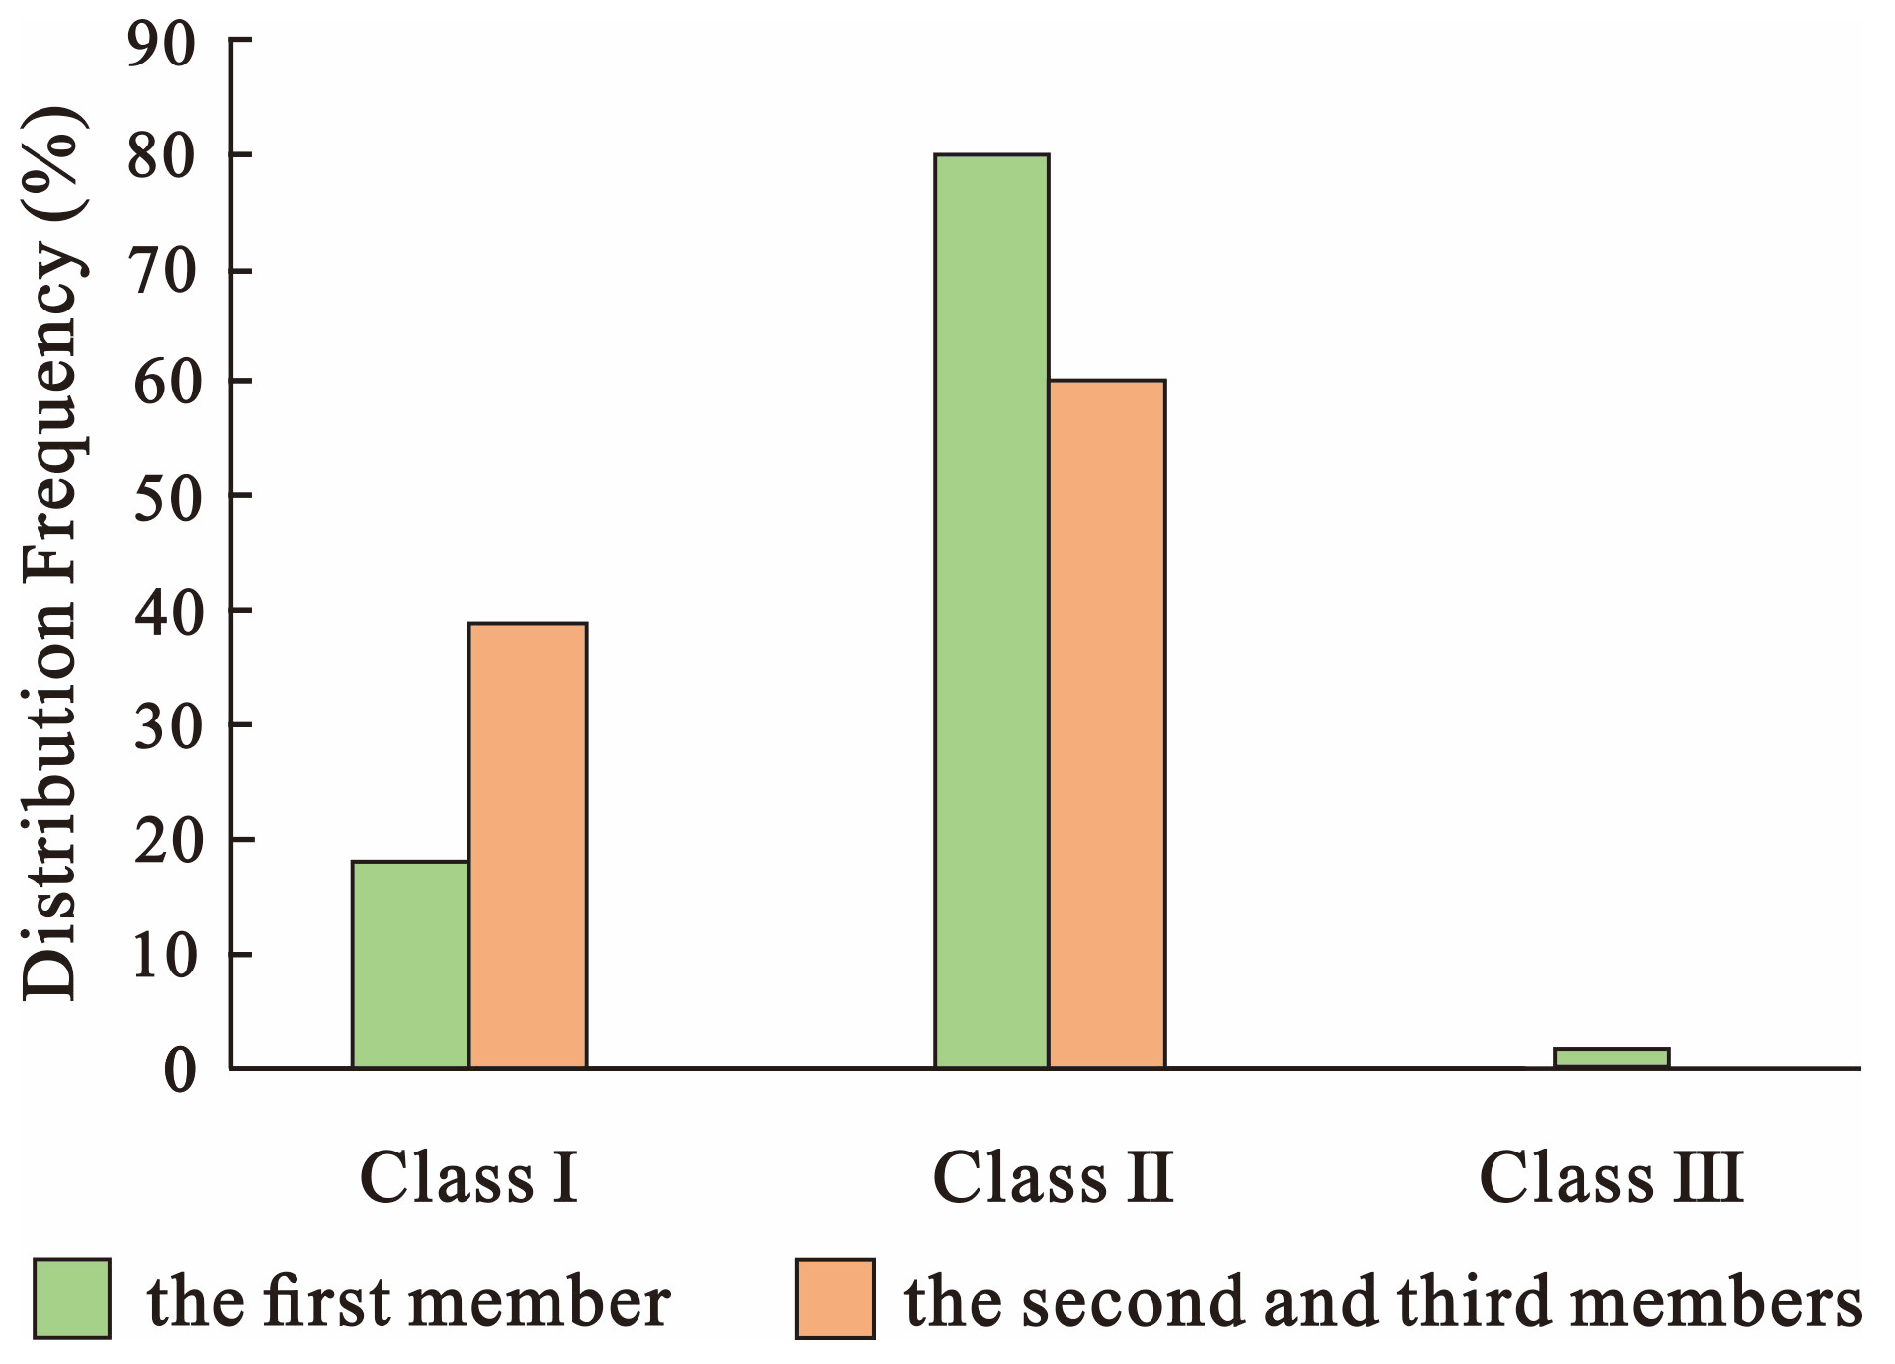
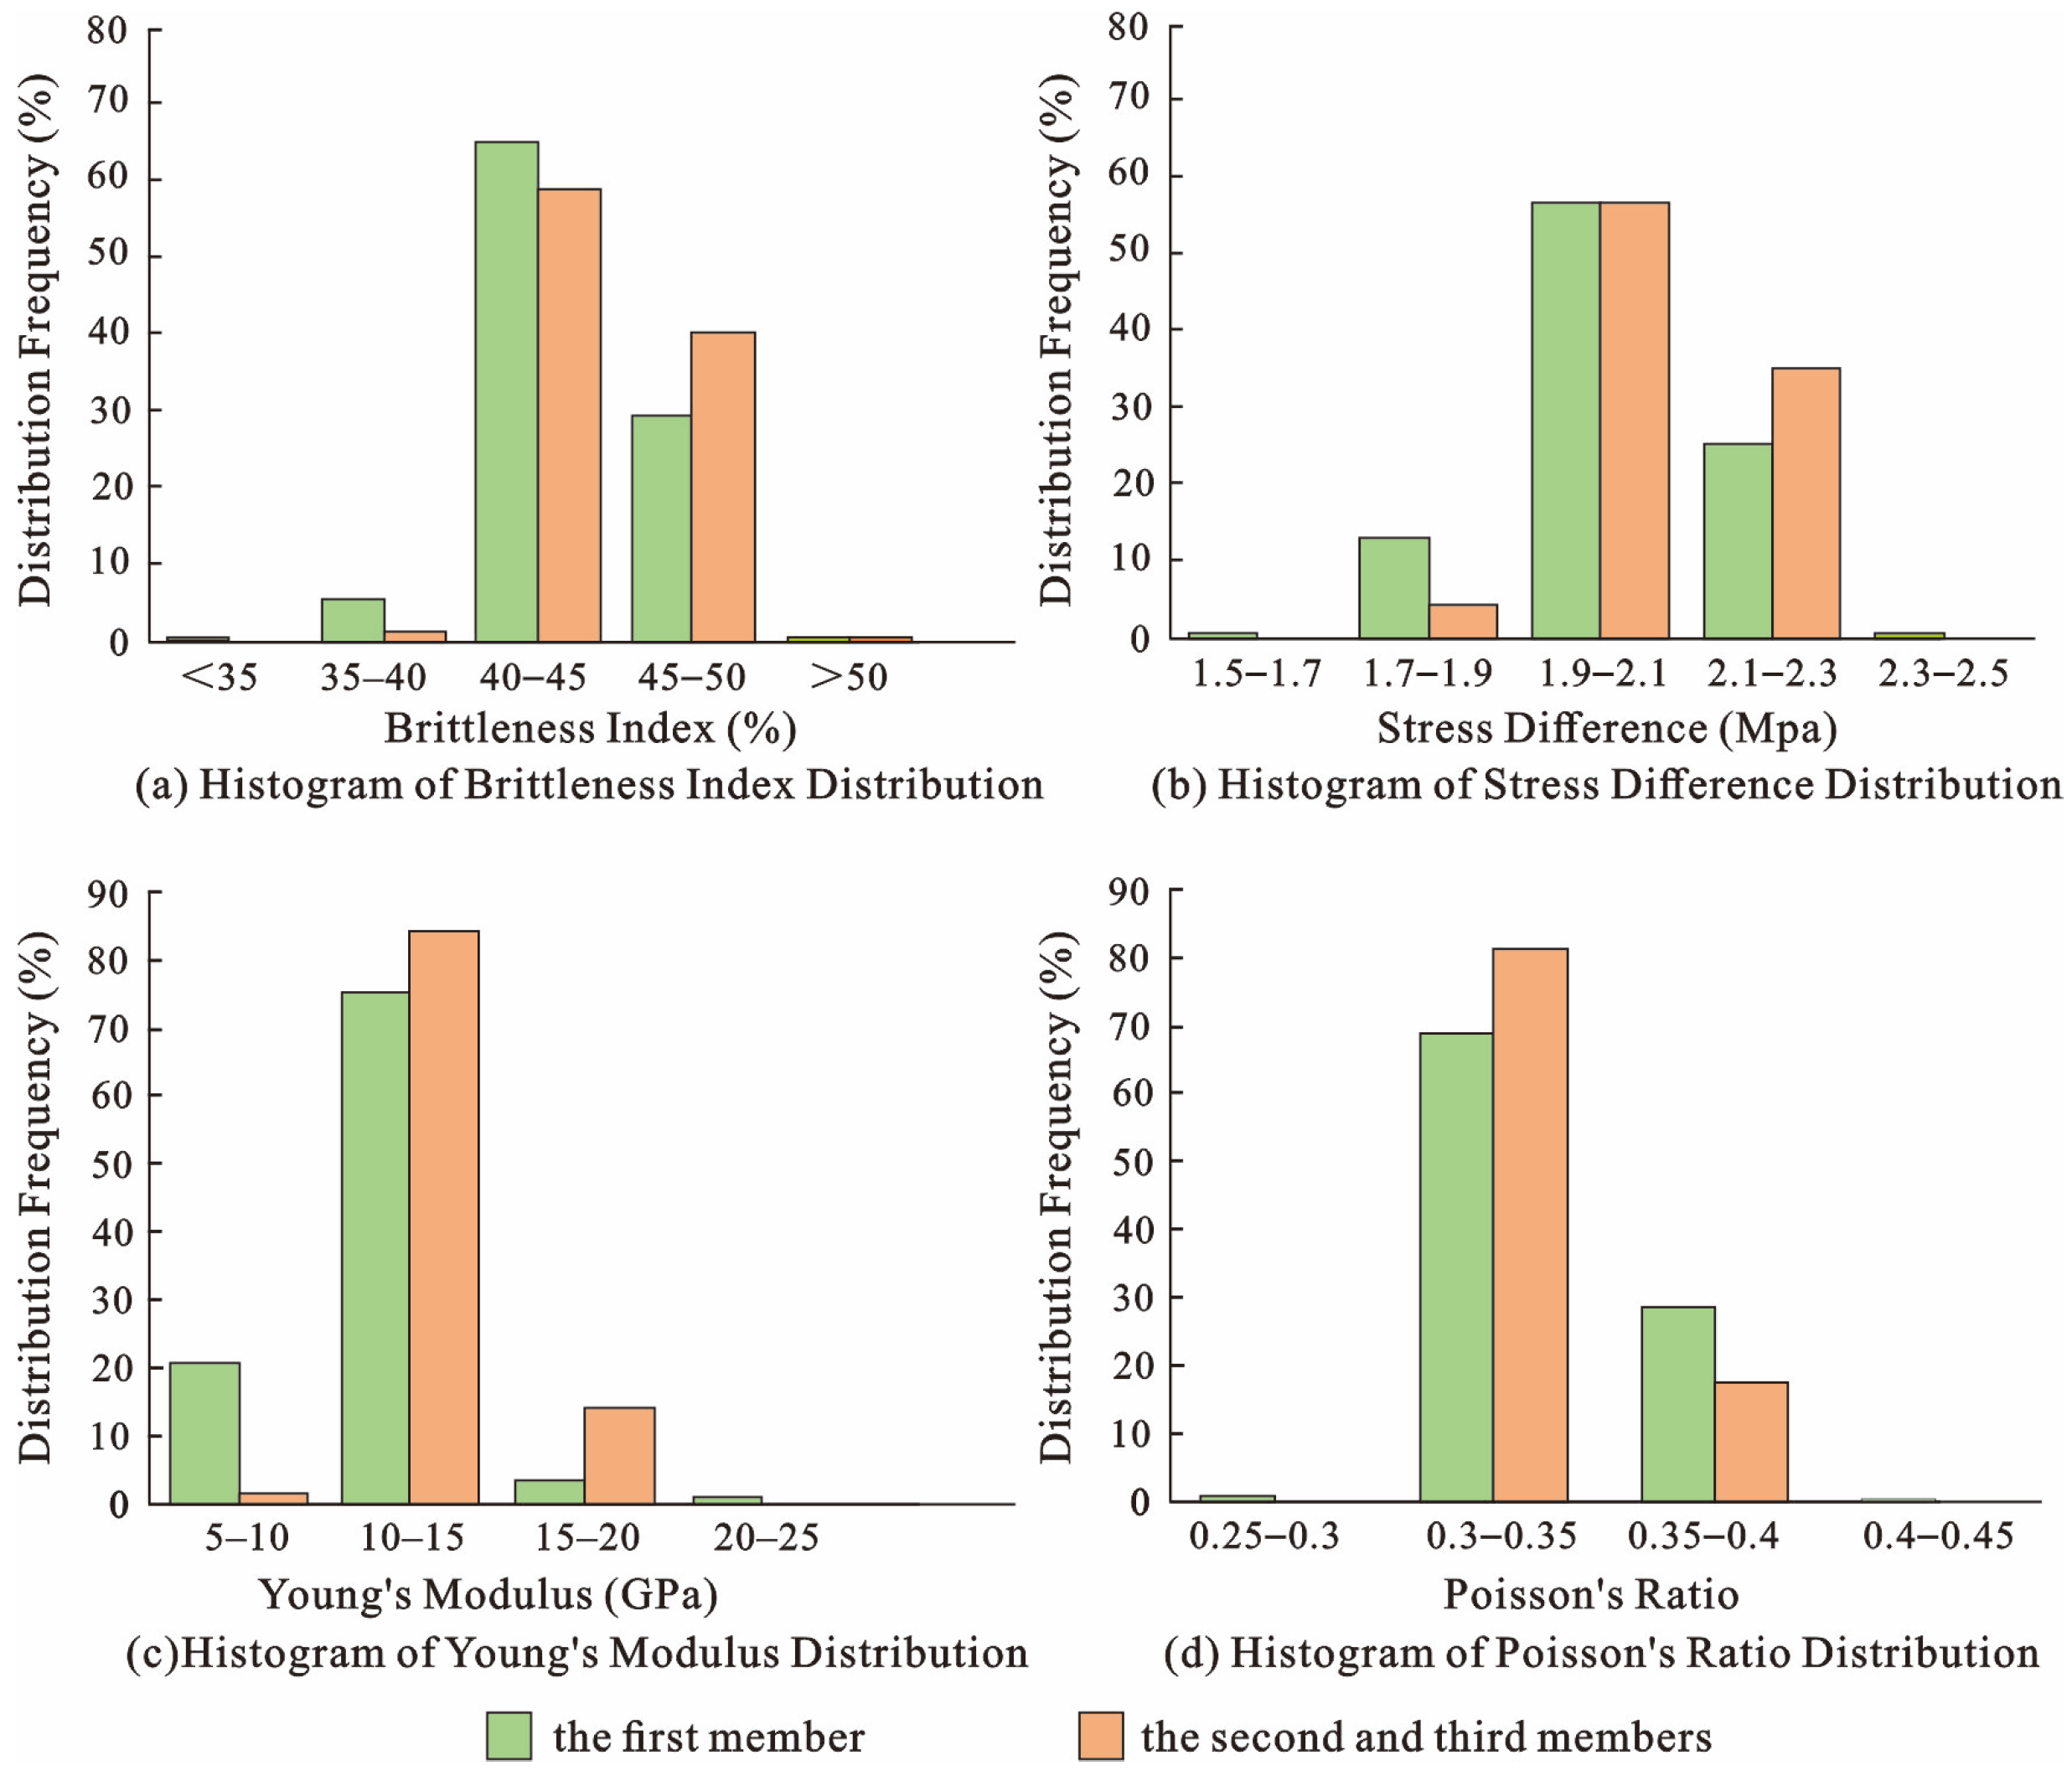
For the Qing 1 Member, the Young’s modulus is relatively low (6.7–21.4 GPa, average of 11.5 GPa); Poisson’s ratio is relatively high (0.26–0.41, average of 0.34); the brittleness index is relatively high (34.1–58.4%, average of 43.7%); the stress difference is low (1.67–2.41 MPa, average of 2.02 MPa); and the fracability index is 0.26–0.79. The fracability sweet spots are mainly Class II (accounting for 79%), followed by a small amount of Class I (accounting for 19%) and a minimal amount of Class III (accounting for 2%) (
Figure 6 and
Figure 7).
For the Qing 2 + 3 Members, Young’s modulus is moderate (9.6–19.5 GPa, with an average of 13.3 GPa); Poisson’s ratio is comparatively high (0.31–0.39, with an average of 0.34); the brittleness index is relatively high (39.5–50.3%, average of 44.6%); the stress difference is low (1.76–2.28 MPa, average of 2.07 MPa); and the fracability index is 0.26–0.79. The fracability sweet spots are mainly Class II (accounting for 61%) and Class I (accounting for 39%) (
Figure 6 and
Figure 7).
An integrated assessment was performed to evaluate the shale intervals within the Qingshankou Formation across 59 wells. The findings reveal that the predominantly hosts Class I and Class II fracability sweet spots, with only a minor proportion of Class III sweet spots. Class I accounts for 29.6% of the cumulative thickness and is predominantly developed at the top of the Qing 1 Member and the middle–upper sections of the Qing 2 + 3 Members. Class II accounts for 67.5% of the cumulative thickness and is predominantly developed at the middle and lower sections of both the Qing 1 Member and the Qing 2 + 3 Members. Overall, the fracability of the Qing 2 + 3 Members is superior to that of the Qing 1 Member, with better fracturability and more easily formed fractures. Moreover, the in situ stress of the Qingshankou Formation shale is typified by
σv >
σH >
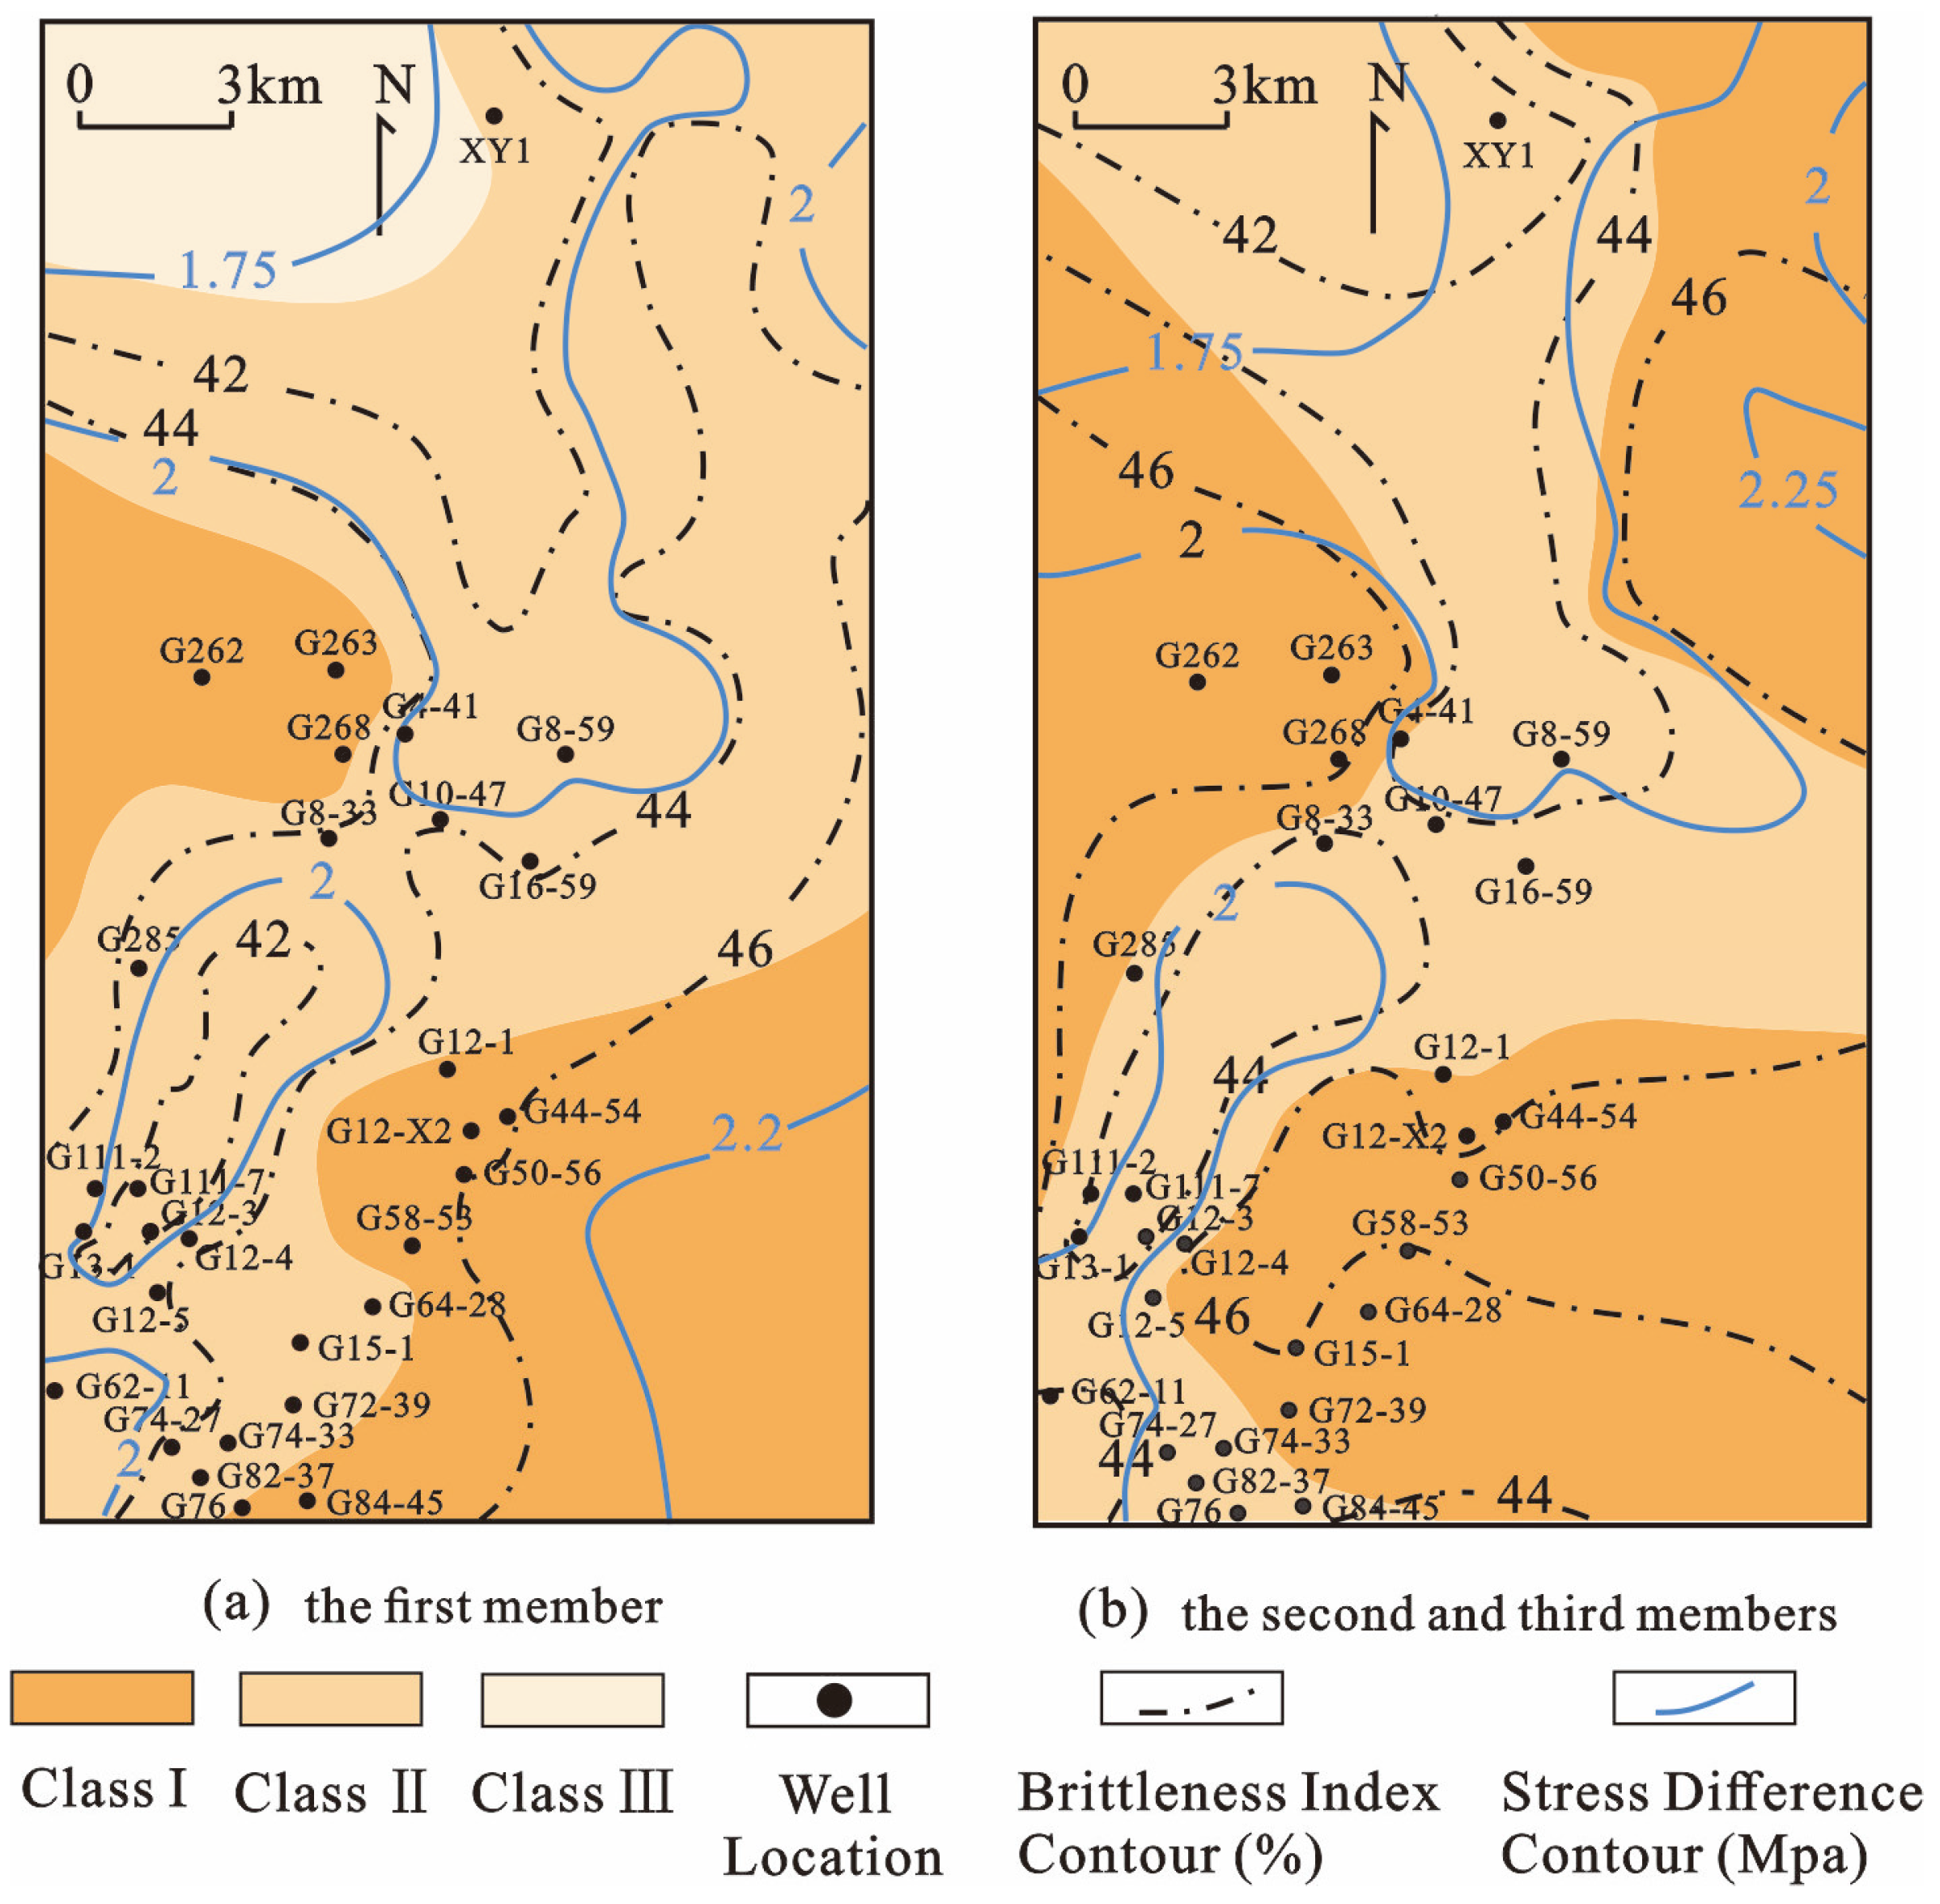
σh, indicating a normal faulting stress mechanism. The horizontal distribution of the favorable areas for the various fracability sweet spots is shown in
Figure 8. The Qing 1 Member predominantly hosts Class II and a minor proportion of Class I. Class II is generally found in a banded pattern across the central region of the study area, whereas Class I is predominantly concentrated in the southeastern region, with a minor proportion also present in the western region. The Qing 2 + 3 Members predominantly host Class I and Class II fracability sweet spots, with no Class III identified. Class I is primarily found across the western, southern, and northeastern regions, while Class II exhibits a curvilinear and banded distribution across the central region of the study area and features a comparatively large average effective thickness (
Figure 8).
5. Application Examples and Discussion
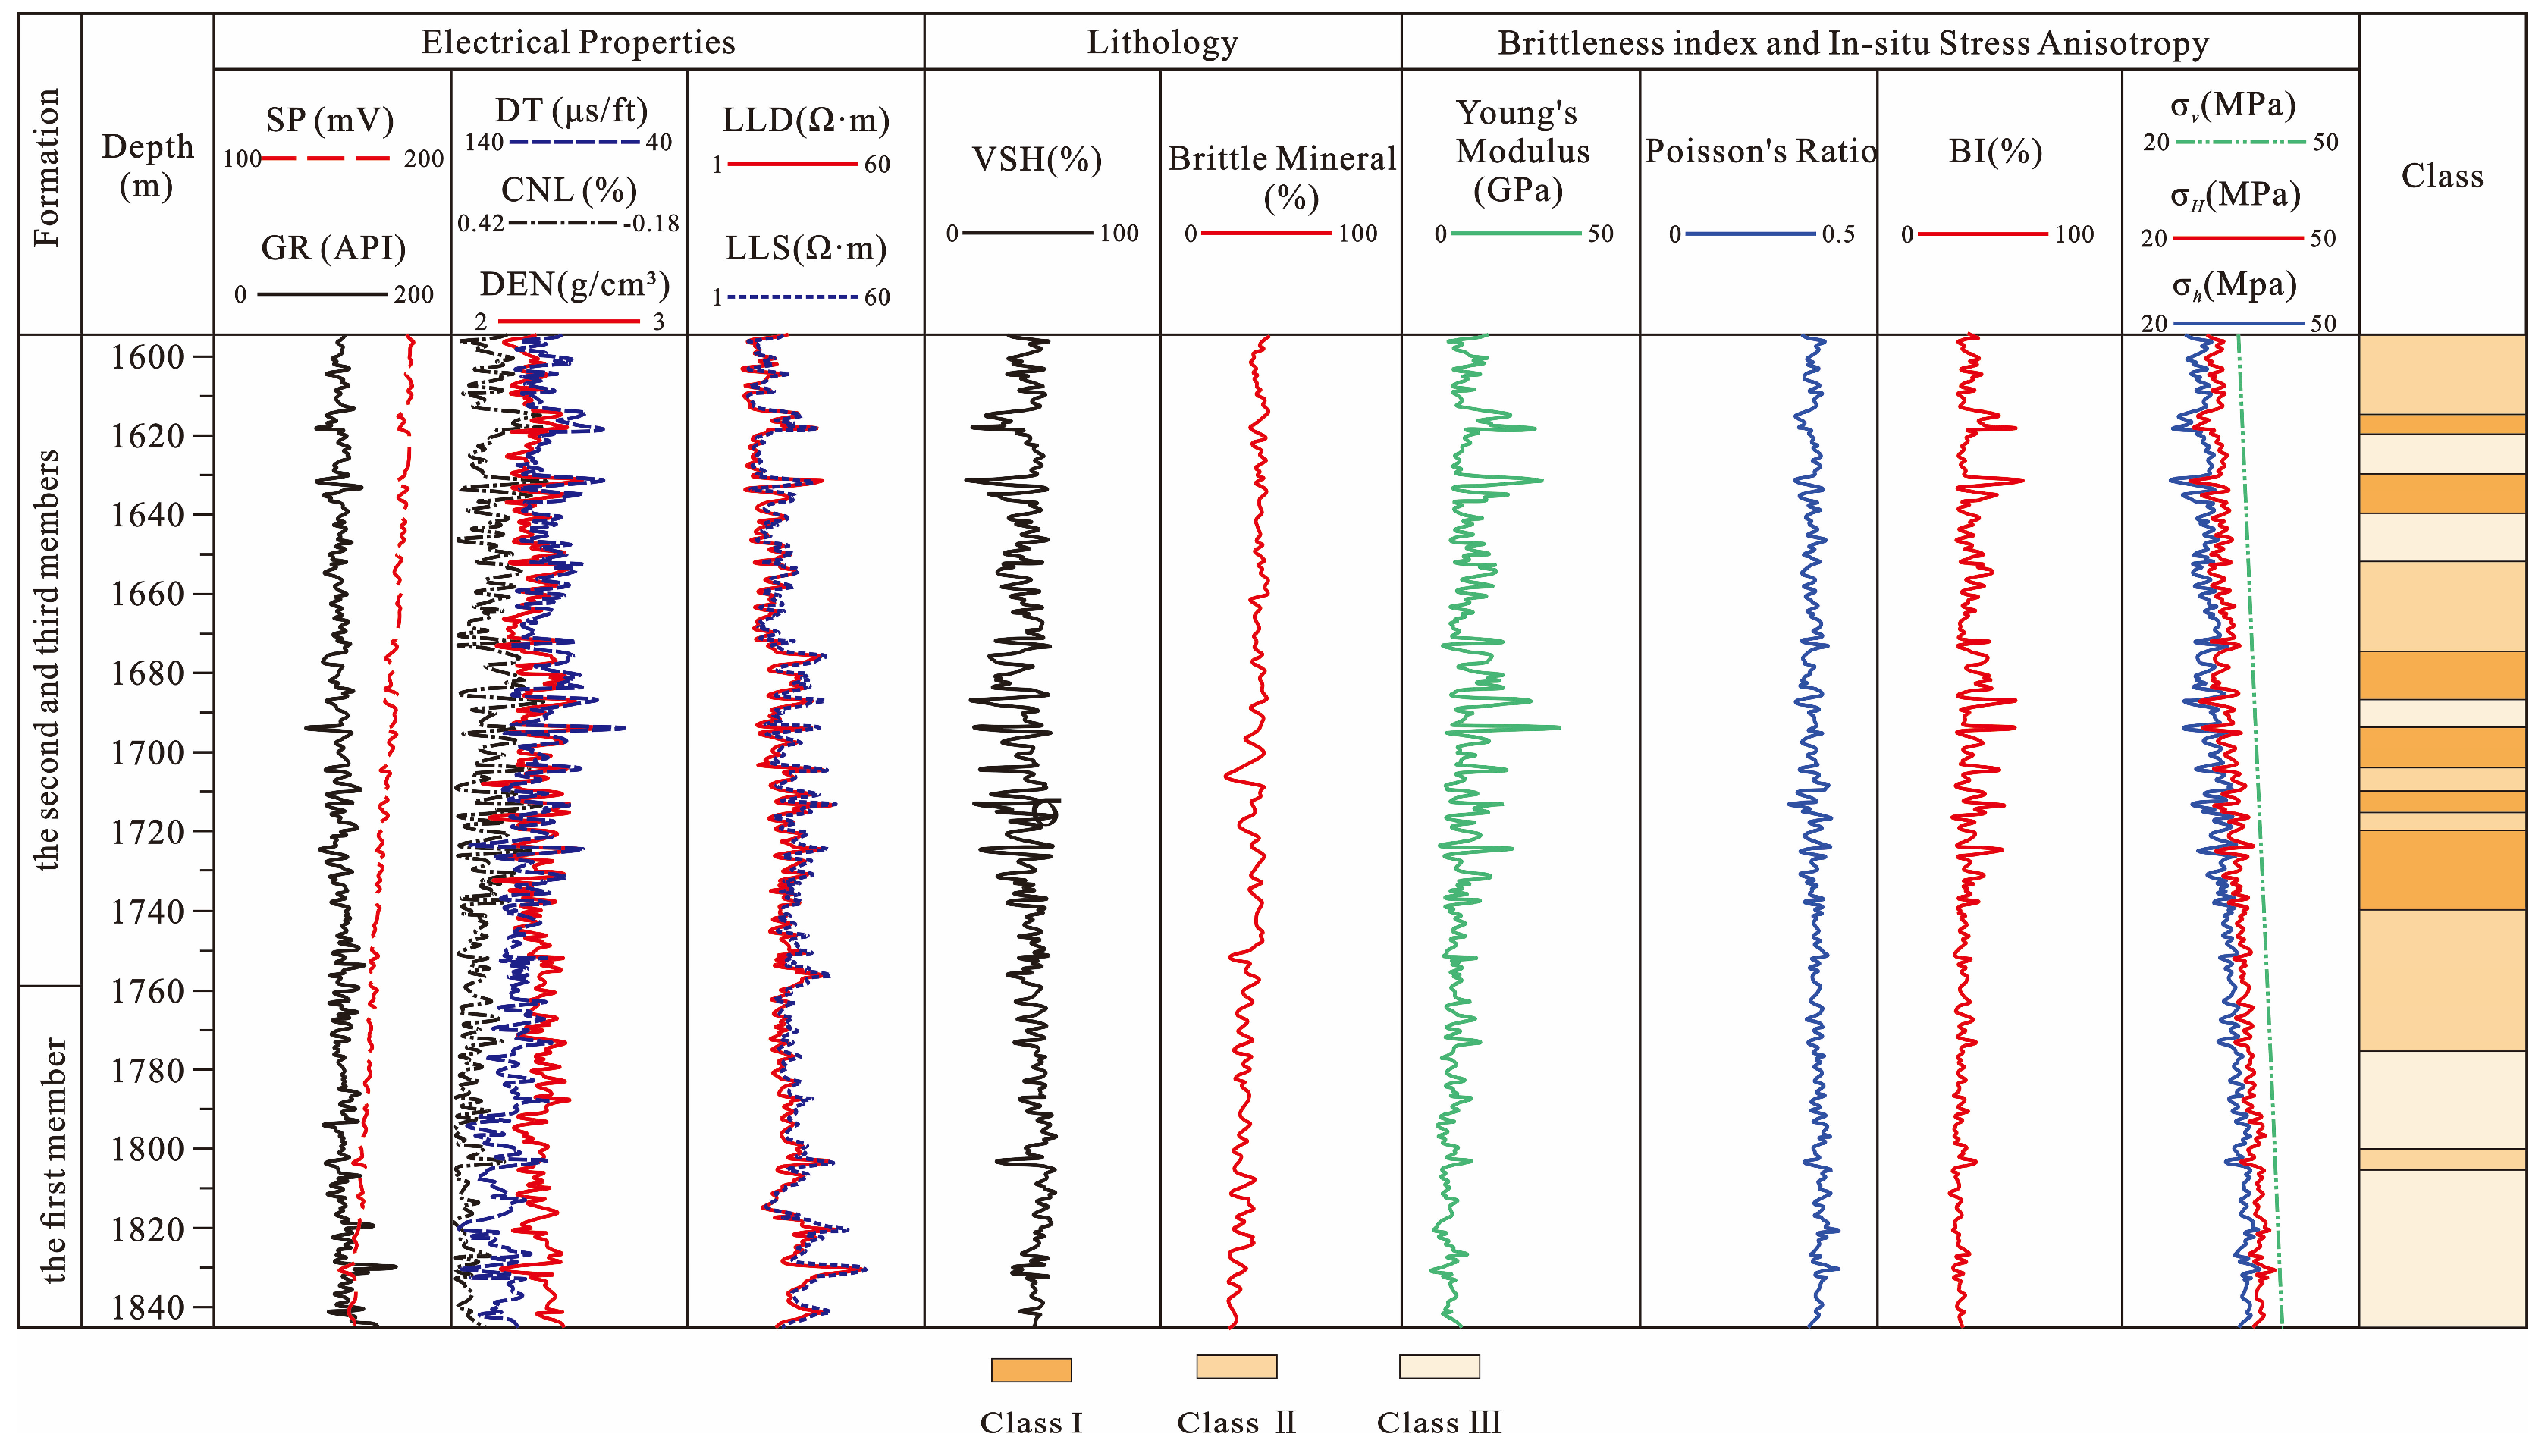
A key exploration well, Well XY1, located in the central part of the Daqing Placanticline, was selected as an application example. First, the logging data were processed by applying the aforementioned methods, and continuous profiles of various parameters were obtained. A Class II fracability sweet spot was identified within the 1597–1617 m depth interval, with a comprehensively calculated fracability index of 0.35. During the actual fracturing production process, the cumulative oil production reached 0.112 tons, which was consistent with the typical behavior of Class II fracability sweet spots, which exhibit low initial oil flow rates. Within the 1803–1842 m depth interval, a Class III fracable interval was identified, with a comprehensively calculated fracability index of 0.13. It was confirmed to be a dry interval with no oil production after fracturing. This case verifies the value of this evaluation framework in guiding fracturing design and predicting production performance. The advantages of this methodology lie in its systematic nature and standardization, which are closely aligned with industry standards (
Figure 9).
Despite the reliability of the logging-derived results, it is essential to acknowledge the inherent uncertainty associated with these parameters, particularly the reconstructed shear wave slowness and calculated mechanical properties. Specifically, the accuracy of these derived parameters is highly dependent on two key factors: the quality of the input logging data and the calibration of the underlying petrophysical and geomechanical models (e.g., stress calculation models). While the calibration process using core data ensures a reasonable match with formation conditions, uncertainties may still arise from simplifications in the theoretical model, assumptions regarding rock anisotropy, and the inherent noise in the raw logging curves. Therefore, the results presented in this study should be interpreted with due consideration to these model-related uncertainties.
6. Conclusions
(1) Leveraging conventional well logging datasets, laboratory core analysis data, and statistical methods, a fracability parameter interpretation model for the Cretaceous Qingshankou Formation shale within the central Daqing Placanticline is established and demonstrates high prediction accuracy. The shale of the Qingshankou Formation within the central Daqing Placanticline exhibits a low-to-moderate Young’s modulus, elevated Poisson’s ratio, enhanced brittleness index, and reduced stress differential, and the in situ stress is characteristic of a normal faulting stress mechanism (σv > σH > σh). It has a sufficient in situ stress foundation to form complex fracture networks during reconstruction work and good fracturability.
(2) Based on the comprehensive fracability index, the study area predominantly hosts Class I and Class II fracability sweet spots. Class I sweet spots are primarily developed at the top of the Qing 1 Member and the middle–upper sections of the Qing 2 + 3 Members. Horizontally, they are distributed in the southeastern and western regions of the Qing 1 Member, as well as the western, southern, and northeastern regions of the Qing 2 + 3 Members. Class II sweet spots are developed in the middle and lower sections of both the Qing 1 Member and the Qing 2 + 3 Members. Horizontally, they are generally distributed in curvilinear and banded patterns in the central regions of the Qing 1 Member and the Qing 2 + 3 Members.
Author Contributions
Conceptualization, Y.C., S.W. and C.M.; methodology, Y.C. and S.W.; software, Y.C. and S.W.; validation, Y.C., S.W. and Y.W.; formal analysis, S.W. and H.Y.; investigation, Y.C.; resources, C.M.; data curation, Y.W. and D.G.; writing—original draft preparation, Y.C. and S.W.; writing—review and editing, Y.C. and S.W.; visualization, D.G.; supervision, C.M. and Y.W.; project administration, C.M.; funding acquisition, C.M. All authors have read and agreed to the published version of the manuscript.
Funding
This research was supported by the Heilongjiang Provincial Department of Education’s basic research expenses (2024YSKYFX-01). Fund Name: Control of Clay Mineral Transformation in Gulong Shale on the Formation of High-Quality Reservoirs Under Volcanic Activity.
Institutional Review Board Statement
Not applicable.
Informed Consent Statement
Not applicable.
Data Availability Statement
The original contributions presented in the study are included in the article, further inquiries can be directed to the corresponding author.
Acknowledgments
The authors would like to express sincere gratitude to Wenfu Zhou, Xiaoxing Li, Guilei Wang, Peng Xie and Wenhao Xia for their valuable assistance and support throughout this research. We are very grateful to the reviewers and editors for their contributions to improving this paper.
Conflicts of Interest
Author Youzhi Wang and Dan Gao were respectively employed by the Exploration and Development Research Institute of PetroChina Daqing Oilfield Company Limited and Training Center of Liaohe Oilfield Company. The remaining authors declare that the research was conducted in the absence of any commercial or financial relationships that could be construed as a potential conflict of interest.
References
- Zou, C.N.; Pan, S.X.; Zhao, Q. On the connotation, challenge and significance of China’s “energy independence” strategy. Pet. Explor. Dev. 2020, 47, 416–426. [Google Scholar] [CrossRef]
- Anna, M.M.; Lynn, M.W.; Tim, C.W.K.; Joyce, M.B.; Jennifer, C.M.; Martin, S. Microbial production and modification of gases in sedimentary basins: A geochemical case study from a Devonian shale gas play, Michigan Basin. AAPG Bull. 2003, 87, 1355–1375. [Google Scholar]
- Jin, Z.J.; Zhu, R.K.; Liang, X.P.; Shen, Y.Q. Several Issues Worthy of Attention in Current Lacustrine Shale Oil Exploration and Development. Pet. Explor. Dev. 2021, 48, 1471–1484. [Google Scholar] [CrossRef]
- Pan, S.Q.; Zou, C.N.; Li, Y.; Jing, Z.H.; Liu, E.T.; Yuan, M.; Zhang, G.S.; Yang, Z.; Wu, S.T.; Qiu, Z.; et al. Major Biological Events and Fossil Energy Formation: On the Development of Energy Science under the Earth System Framework. Pet. Explor. Dev. 2021, 48, 581–594. [Google Scholar] [CrossRef]
- Zhao, W.Z.; Jia, A.L.; Wei, Y.S.; Wang, J.L.; Zhu, H.Q. Progress in shale gas exploration in China and prospects for future development. China Pet. Explor. 2020, 25, 31–44. [Google Scholar]
- Xu, X.Y.; Liu, W.B.; Chen, S.; Bai, J.; Li, Y.H. Breakthroughs in continental shale oil and gas exploration in the southern Songliao Basin and its implications for carbon neutrality. Nat. Gas Ind. 2022, 42, 12–20. [Google Scholar]
- Zhi, D.M.; Tang, Y.; Zheng, M.L.; Xu, Y.; Cao, J.; Ding, J.; Zhao, C.Y. Geological characteristics and accumulation controlling factors of shalereservoirs in Fengcheng Formation, Mahu sag, Junggar Basin. China Pet. Explor. 2019, 24, 615–623. [Google Scholar]
- Fu, J.H.; Fan, L.Y.; Liu, X.S.; Hu, X.Y.; Li, J.H.; Ji, H.F. New progresses, prospects and countermeasures of natural gas exploration inthe Ordos Basin. China Pet. Explor. 2019, 24, 418–430. [Google Scholar]
- Zheng, J.D.; Wang, C.Y.; Zhang, H.B.; Wang, X.L.; Zhu, J.H. Logging evaluating methods of seven property parameters and enriched layers for Gulong shale oil reservoir in Songliao Basin. Pet. Geol. Oilfield Dev. Daqing 2021, 40, 87–97. [Google Scholar]
- Shao, H.M.; Gao, B.; Hong, S.X.; Li, L.L.; Wang, J.P.; Wang, Y.C.; Bai, X.J.; Tan, W.L. Progress and application of the experimental technologies for the shale oil reservoirs: A case study on Gulong area in Songliao Basin. Pet. Geol. Oilfield Dev. Daqing 2020, 39, 97–106. [Google Scholar]
- Cui, B.W.; Zhao, Y.; Zhang, G.; Sun, X.H.; Zhang, Y.F.; Bai, Y.F.; Zhang, Y.Q. Estimation method and application for OOIP of Gulong shale oil in Songliao Basin. Pet. Geol. Oilfield Dev. Daqing 2022, 41, 14–23. [Google Scholar]
- Zhao, P.; Xie, L.Z.; Ge, Q.; Zhang, Y.; Jun, L.; He, B. Numerical study of the effect of natural fractures on shale hydraulic fracturing based on the continuum approach. Pet. Sci. Eng. 2020, 189, 107038. [Google Scholar] [CrossRef]
- Sui, L.; Ju, Y.; Yang, Y.Y.; Yang, Y.; Li, A.S. A quantification method for shale friability based on analytic hierarchy process. Energy 2016, 115, 637–645. [Google Scholar] [CrossRef]
- Zhen, H.B.; Zhao, H.F.; Jia, Z.J.; Xu, F.Y.; Sun, Y.Q.; Zeng, W.T.; Zhu, Q. Method for interpreting in situ stress based on pump shutdown pressure drop curves in deep coal seams. Energies 2025, 18, 6023. [Google Scholar] [CrossRef]
- Lei, Q.; Weng, D.W.; Xiong, S.C.; Liu, H.B.; Guan, B.S.; Deng, Q.; Yan, X.M.; Liang, H.B.; Ma, Z.Y. Progress and development directions of shale oil reservoir stimulation technology of China National Petroleum Corporation. Pet. Explor. Dev. 2021, 48, 1198–1207. [Google Scholar] [CrossRef]
- Xiang, C.F.; Feng, Z.H.; Wang, F.D.; Zhang, S.; Peng, P.; Liang, X.D. Tectonically Controlled Late-stage Rapid Hydrocarbon Accumulation: Evidence from Fluid Inclusions and Authigenic Illite in Daqing Placanticline, Songliao Basin. Acta Geol. Sin. 2012, 86, 1799–1808. [Google Scholar]
- Huang, L.; Tong, H.M.; Yang, D.H.; Fan, J.Y.; Huang, H.T. A new model for the formation and evolution of middle-shallow faults in the Daqing Placanticline, Songliao Basin. Acta Geol. Sin. 2019, 93, 597–605. [Google Scholar]
- Huang, Y.; Chang, J.; Qiu, N.S.; Lin, T.F.; Fu, X.L.; Tang, B.N.; Li, J.H. Pressure field characteristics and overpressure geneses of Qingshankou Formation in Qijia-Gulong sag, Songliao Basin. Acta Pet. Sin. 2024, 45, 1800–1817. [Google Scholar]
- Yu, D.S.; He, Y.H.; Xing, B.R.; Huo, Z.W.; Gao, B. Sedimentary Evolution, Distribution and Sedimentary Model of Gaotaizi Oil Reservoir in Daqing Placanticline. Acta Sedimentol. Sin. 2024, 42, 238–250. [Google Scholar]
- Bai, X.F.; Li, J.H.; Zheng, Q.; Chen, F.J. Orderly distribution and differential enrichment of conventional and unconventional hydrocarbons in the Cretaceous Qingshankou Formation, northern Songliao Basin, NE China. Pet. Explor. Dev. 2025, 52, 1140–1149. [Google Scholar] [CrossRef]
- He, W.Y.; Liu, B.; Zhang, J.Y.; Bai, L.H.; Tian, S.S.; Chi, Y.A. Geological characteristics and key scientific and technological problems of Gulong Shale Oil in Songliao Basin. Earth Sci. 2023, 48, 49–62. [Google Scholar]
- Chong, K.K.; Grieser, B.; Jaripatke, O.; Passman, A. A Completions Roadmap to Shale-Play Development: A Review of Successful Approaches toward Shale-Play Stimula-tion in the Last Two Decades. In Proceedings of the International Oil and Gas Conference and Exhibition in China, Beijing, China, June 2010; SPE-130369-MS; Society of Petroleum Engineers: Richardson, TX, USA, 2010. [Google Scholar]
- Sun, N.; Gu, Y.; Zhang, X.L.; Zhang, H.; Zhai, Z.Y.; Qi, X.Z. Fractureability evaluation of shale gas reservoirs. Energy Sources Part A Recovery Util. Environ. Eff. 2022, 44, 2595–2603. [Google Scholar]
- Ross, D.J.; Bustin, R.M. Shale gas potential of the lower jurassic gordondale member, northeastern British Columbia, Canada. Bull. Can. Pet. Geol. 2007, 55, 51–75. [Google Scholar] [CrossRef]
- Warpinski, N.R.; Clark, J.A.; Schmidt, R.A.; Huddle, C.W. Laboratory investigation on the effect of in-situ stresses on hydraulic fracture containment. Soc. Pet. Eng. J. 1982, 22, 333–340. [Google Scholar] [CrossRef]
- Anderson, G.D. Effects of friction on hydraulic fracture growth near unbonded interfaces in rocks. Soc. Pet. Eng. J. 1981, 21, 21–29. [Google Scholar] [CrossRef]
- Zhang, L.Q.; Zhou, J.; Braun, A.; Han, Z.H. Sensitivity analysis on the interaction between hydraulic and natural fractures based on an explicitly coupled hydrogeomechanical model in PFC2D. Pet. Sci. Eng. 2018, 167, 638–653. [Google Scholar] [CrossRef]
- Wang, X.J.; Liang, L.X.; Zhao, L.; Liu, X.J.; Qin, Z.J.; Li, W. Rock Mechanical Properties and Fracturability Evaluation of Oil-bearing Shale in Lucaogou Formation of Jimsar Sag, Junggar Basin. Oil Gas Geol. 2019, 40, 661–668. [Google Scholar]
- Tang, Y.; Xing, Y.; Li, L.Z.; Zhang, B.H.; Jiang, S.X. Influence factors and evaluation methods of the gas shale fracability. Earth Sci. Front. 2012, 19, 356–363. [Google Scholar]
- Sena, A.; Castillo, G.; Chesser, K.; Voisey, S.; Estrada, J.; Carcuz, J.; Carmona, E.; Hodgkins, P. Seismic reservoir characterization in resource shale plays: Stress analysis and sweet spot discrimination. Lead. Edge 2011, 30, 758–764. [Google Scholar] [CrossRef]
- Zhang, G.J.; Cheng, Q.; Zhang, L.; Liu, W.C.; Zhao, Y.J.; Wu, H.; Shen, C.B. Calculation of 3D Reservoir Rock Mechanical Parameters of Metamorphic Rock Reservoirs in the Bozhong 19-6 Gas Field of the Bohai Bay Basin and Their Significance. Earth Sci. 2025, 50, 551–568. [Google Scholar]
- Jarvie, D.M.; Hill, R.J.; Ruble, T.E.; Pollastro, R.M. Unconventional shale-gas systems: The Mississip p ian Barnett Shale of north-central Texas as one model for thermogenic shale-gas assessment. AAPG Bull. 2007, 91, 475–499. [Google Scholar] [CrossRef]
- Ross, D.J.; Bustin, R.M. The importance of shale composition and pore structure upon gas storage potential of shale gas reservoirs. Mar. Pet. Geol. 2009, 26, 916–927. [Google Scholar] [CrossRef]
- Jiang, Z.X.; Zhang, W.Z.; Liang, C.; Wang, Y.S.; Liu, H.M.; Chen, X. Characteristics and evaluation elements of shale oil reservoirs. Acta Pet. Sin. 2014, 35, 184–196. [Google Scholar]
- Rickman, R.; Mullen, M.; Petre, E.; Grieser, B.; Kundert, D. A Practical Use of Shale Petrophysics for Stimulation Design Optimization: All Shale Plays Are Not Clones of the Barnett Shale. In Proceedings of the SPE Annual Technical Conference and Exhibition, Denver, CO, USA, September 2008; SPE-115258-MS; Society of Petroleum Engineers: Richardson, TX, USA, 2008. [Google Scholar]
- Cao, D.P.; Han, J.X.; Xiao, J.F.; Liu, Q.; Fu, F.Q.; Liu, D. Method for evaluating the brittleness of shale minerals under the constraints of elastic characteristics. Chin. J. Geophys. 2023, 66, 4781–4791. [Google Scholar]
- Zou, Y.S.; Gao, B.D.; Zhang, S.C.; Ma, X.F.; Sun, Z.Y.; Wang, F.; Liu, C.Y. Multi fracture nonuniform initiation and vertical propagation behavior in thin interbedded tight sandstone: An experimental study. Pet. Sci. Eng. 2022, 213, 110417. [Google Scholar] [CrossRef]
- Chi, A.; Li, X.X.; Zhang, J.; Jia, D.; Tan, W.J. Experimental investigation of propagation mechanisms and fracture morphology for coalbed methane reservoirs. Pet. Sci. 2018, 15, 815–829. [Google Scholar] [CrossRef]
- Hou, M.X.; Ge, X.R. Study on a calculation model for 3D in-situ rock stress tensor. Rock Soil Mech. 2007, 10, 2017–2021. [Google Scholar]
- Huang, R.Z.; Zhuang, J. A New Method for Predicting Formation Fracture Pressure. Oil Drill. Prod. Technol. 1986, 3, 1–14. [Google Scholar]
- Higgins, S.; Goodwin, S.; Donald, A.; Bratton, T.; Tracy, G. Anisotropic Stress Models Improve Completion Design in the Baxter Shale. In Proceedings of the SPE Annual Technical Conference and Exhibition, Denver, CO, USA, September 2008; SPE-115736-MS; Society of Petroleum Engineers: Richardson, TX, USA, 2008. [Google Scholar]
- Liu, Z.H.; Song, L.T.; Wang, C.S.; Sun, T.; Yang, X.M.; Li, X. Evaluation method of the least horizontal principal stress by logging data in anisotropic fast formations. Pet. Explor. Dev. 2017, 44, 745–752. [Google Scholar] [CrossRef]
- Yang, Y.H.; Sun, D.S.; Qin, X.H.; Li, A.W.; Sun, W.F.; Zhang, Z.Y.; Li, R.; Meng, W.; Chen, Q.C. Error analysis and discussion of determining the maximum horizontal principalstress by hydraulic fracturing based on the compliance analysis of testing system. Chin. J. Rock Mech. Eng. 2024, 43, 3385–3396. [Google Scholar]
- Haimson, B.C.; Coret, F.H. ISRM suggested methods for rock stress estimation—Art 3: Hydraulic fracturing (HF) and/or hydraulic testing of re-existing fractures (HTPF). Int. J. Rock Mech. Min. Sci. 2003, 40, 1011–1020. [Google Scholar] [CrossRef]
- Cui, Y.F.; Wang, G.W.; Jones, S.J.; Zhou, Z.L.; Ran, Y.; Lai, J.; Li, R.J.; Deng, L. Prediction of diagenetic facies using well logs—A case study from the upper Triassic Yanchang Formation, Ordos Basin, China. Mar. Pet. Geol. 2017, 81, 50–65. [Google Scholar] [CrossRef]
- Wu, J.J.; Zhang, S.H.; Cao, H.; Zheng, M.M.; Sun, P.; Xu, L. Fracability Evaluation of Shale Gas Reservoir-a Case Study in the Lower Cambrian Niutitang Formation, Northwestern Hunan, China. J. Pet. Sci. Eng. 2018, 164, 675–684. [Google Scholar] [CrossRef]
- Sheng, Q.H.; Li, W.C. Evaluation method of shale fracability and its application in Jiaoshiba area. Prog. Geophys. 2016, 31, 1473–1479. [Google Scholar]
- Boersma, Q.D.; Douma, L.A.; Bertotti, G.; Barnhoorn, A. Mechanical controls on horizontal stresses and fracture behaviour in layered rocks: A numerical sensitivity analysis. J. Struct. Geol. 2020, 130, 103907. [Google Scholar] [CrossRef]
- Zhou, Y.B.; Xiao, F.Y.; Zeng, F.R.; Chen, Y.L.; Ge, X.M. Continental shale logging facies division and reservoir classification method in Dongyuemiao, Fuxing area of eastern Sichuan. Prog. Geophys. 2025, 40, 1032–1044. [Google Scholar]
| Disclaimer/Publisher’s Note: The statements, opinions and data contained in all publications are solely those of the individual author(s) and contributor(s) and not of MDPI and/or the editor(s). MDPI and/or the editor(s) disclaim responsibility for any injury to people or property resulting from any ideas, methods, instructions or products referred to in the content. |