1. Introduction
Spatial variability of geotechnical parameters is an intrinsic characteristic of natural soils formed through complex depositional and post-depositional processes. Early research recognized that soil properties exhibit inherent randomness rather than deterministic uniformity [
1]. Subsequent developments in probabilistic geotechnics established formal frameworks for uncertainty quantification, including first-order reliability approaches [
2] and random field theory for spatially correlated media [
3]. Comprehensive statistical characterization of geotechnical variability was later summarized by Phoon and Kulhawy [
4]. Compared with slopes and shallow foundations, tunnel–soil interaction systems are mechanically more complex and more sensitive to spatial heterogeneity in both strength and hydraulic parameters [
5]. Insufficient representation of subsurface variability may therefore lead to substantial discrepancies between assumed and actual ground conditions, potentially resulting in excessive settlement during construction.
Hydro-mechanical coupling plays a decisive role in tunnel excavation [
6], particularly in saturated soft soils. Excavation induces unloading and stress redistribution while simultaneously altering groundwater flow paths, leading to pore pressure evolution and effective stress changes. Numerical investigations have demonstrated that inclusion of seepage significantly increases predicted displacement and stress levels around tunnels [
7]. Analytical solutions have further clarified pore pressure distributions in underwater tunnelling scenarios [
8]. More recent coupled analyses confirm that neglecting seepage may underestimate deformation and consolidation settlements in soft ground [
9]. Despite these advances, most hydro-mechanical simulations adopt deterministic ground models, typically assuming homogeneous or simplified layered soils, without explicitly incorporating spatial randomness in permeability and stiffness.
Random field theory has been extensively applied in slope and foundation reliability analyses to represent spatially correlated soil parameters. For example, the influence of coefficient of variation and correlation length on foundation reliability has been quantified using two-dimensional random fields [
10], and the impact of autocorrelation structure on probabilistic risk assessment has been systematically examined [
11,
12]. In tunnel engineering, spatial variability has been introduced into face stability and deformation analyses [
13,
14,
15]. These studies demonstrate that parameter variability can significantly affect predicted mechanical response and failure probability. However, applications in soft soil tunnelling remain limited, especially regarding hydraulic parameters such as permeability, which often exhibit large dispersion and strong spatial correlation. The quantitative relationship between hydraulic parameter spatial variability and construction-induced surface settlement therefore remains insufficiently clarified.
From a risk assessment perspective, probabilistic concepts were formally introduced into tunnelling by Einstein [
16], who emphasized systematic risk analysis in underground construction. Monte Carlo-based probabilistic frameworks were subsequently employed in major infrastructure projects to classify and manage construction risks. Integrated evaluation approaches combining fault tree analysis and multi-criteria decision methods have also been proposed for TBM tunnelling [
17]. Furthermore, probabilistic assessment of groundwater-related hazards has highlighted the importance of hydrogeological uncertainty in underground works [
18]. Multi-level frameworks incorporating both quantitative indicators and expert judgment have been developed to evaluate tunnelling-induced risks to adjacent structures [
19,
20]. Although these contributions have advanced tunnel risk management methodologies, several limitations remain. Many existing approaches emphasize qualitative or semi-quantitative evaluation, without directly linking spatial parameter randomness to probabilistic deformation outcomes. In addition, loss quantification is often decoupled from reliability analysis, limiting the consistency of risk metrics. Most importantly, the combined influence of hydraulic parameter spatial variability and hydro-mechanical coupling on settlement probability distributions has rarely been integrated into a unified, engineering-oriented risk assessment framework.
To address the limitations in previous studies, this research investigates tunnel construction deformation in soft soil considering the spatial variability of hydraulic parameters and their influence on construction risk. Existing studies have generally recognized the importance of hydro-mechanical coupling in soft ground tunnelling, but the heterogeneous distribution of key parameters such as permeability and elastic modulus has often been simplified or ignored, leading to insufficient understanding of uncertainty in deformation response and risk evolution [
21,
22,
23]. In particular, the combined effects of seepage, parameter randomness, and spatial correlation on settlement behavior have not been systematically quantified.
Accordingly, this study conducts statistical analyses of site investigation and monitoring data to characterize soil parameter distributions and settlement trough features, and develops a fluid–solid coupled numerical model to evaluate the effect of groundwater seepage on tunnel-induced deformation. Based on random field theory, a stochastic finite element framework is established to assess the influence of spatial variability and correlation structure on settlement uncertainty. Furthermore, an engineering-oriented risk assessment framework is proposed by integrating settlement-related loss indicators, failure probability, and reliability indices to evaluate construction risk under different scenarios. The study provides a quantitative basis for risk-informed tunnel design and construction management in soft soil environments.
2. Statistical Analysis of Hydraulic Parameters
Based on extensive geotechnical investigation data from completed projects in Shanghai, a database of soil parameters was established and representative layers were selected for statistical analysis. Particular focus was placed on the permeability coefficient and compression modulus, which govern groundwater flow and soil mechanical response, respectively, in hydro-mechanical coupling. Tunnel excavation disturbs the initial equilibrium state of the ground, triggering interaction between the seepage and stress fields. Changes in groundwater level and pore water pressure alter the effective stress, leading to soil deformation and settlement. Therefore, permeability and compressibility are the key parameters controlling the coupled hydraulic–mechanical response.
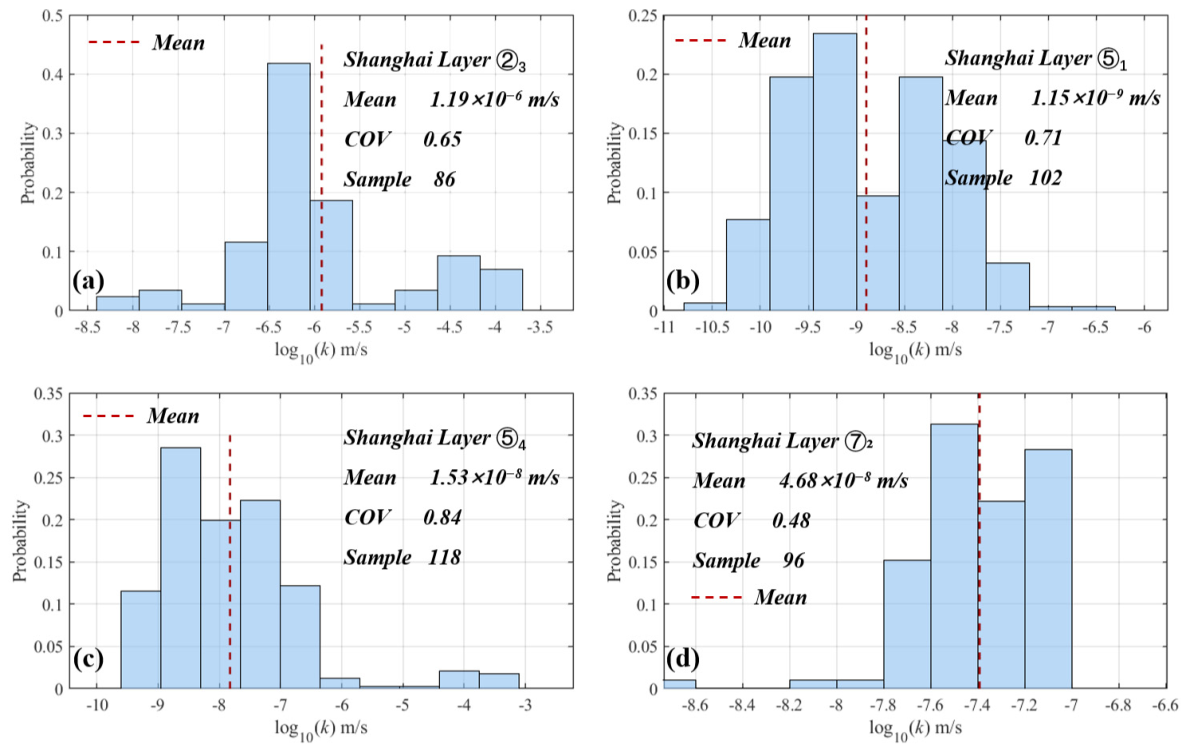
The probability distributions of permeability coefficients for typical Shanghai soil layers are shown in
Figure 1. After log
10 transformation, the data generally limited outliers likely caused by stratigraphic heterogeneity. The coefficients of variation (COV) exceed 0.5 for all layers, indicating significant spatial variability and underscoring the necessity of probabilistic characterization in coupled analyses of tunnel excavation.
Similarly, a statistical analysis was conducted on the compression modulus of each soil layer to characterize its distribution pattern and variability. The results indicate noticeable differences among the soil layers, with mean compression modulus values ranging approximately from 3.84 to 12.47 MPa and coefficients of variation between 0.15 and 0.30, suggesting a moderate level of dispersion overall. The corresponding mean values and coefficients of variation for each soil layer are summarized in
Table 1, providing a basis for subsequent deformation analysis and parameter selection.
3. Methodology
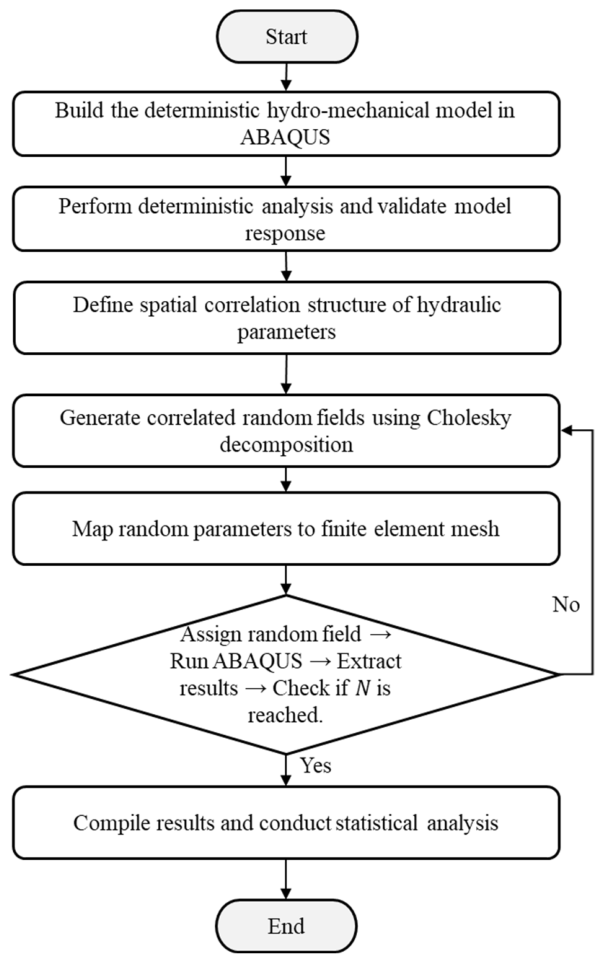
Based on the previously established permeability database for the Shanghai soft soil region, the statistical characteristics of key hydraulic and mechanical parameters, including mean values, coefficients of variation, and probability distribution types, have been obtained. These statistical descriptors provide the quantitative foundation for subsequent deterministic and stochastic modelling. To systematically evaluate the influence of hydraulic parameter variability on tunnel excavation deformation, a hydro-mechanical probabilistic analysis framework is developed, as illustrated in
Figure 2. The workflow integrates deterministic finite element modelling, spatial random field generation, and batch stochastic simulations to capture both coupled seepage–deformation mechanisms and parameter uncertainty.
The procedure consists of the following stages:
- (1)
A deterministic hydro-mechanical finite element model is first established in ABAQUS and validated against monitoring data.
- (2)
Spatial correlation lengths and statistical distributions of hydraulic parameters are defined based on site investigation results.
- (3)
Correlated random fields are generated using the Karhunen–Loève (KL) expansion method and then mapped onto the finite element mesh.
- (4)
Monte Carlo simulations are then performed by repeatedly assigning random fields, running ABAQUS analyses, and extracting settlement responses until the target number of samples is reached.
- (5)
Finally, all simulation outputs are compiled for statistical evaluation and probabilistic risk assessment.
3.1. Hydro-Mechanical Coupled Numerical Model
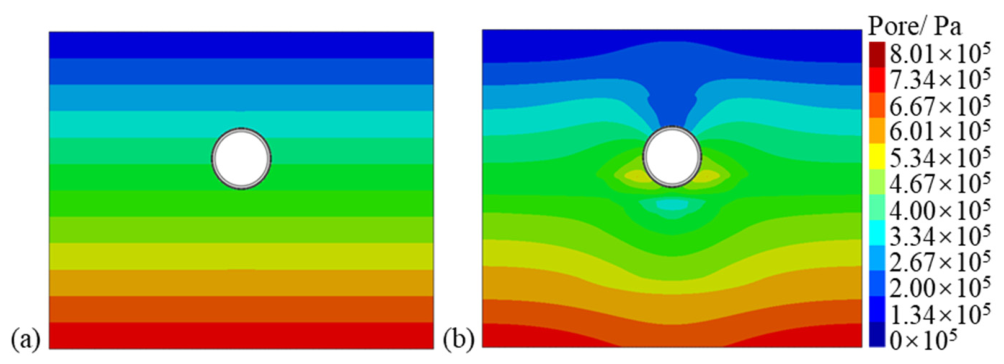
Tunnel excavation in saturated soft soils triggers a coupled response between deformation of the soil skeleton and groundwater seepage. Excavation-induced unloading modifies the total stress field and changes drainage conditions, which in turn drives pore pressure redistribution and alters effective stress. As a result, ground deformation is controlled not only by mechanical stress release but also by the transient evolution of pore water pressure and seepage flow. To capture these interactions, a fully coupled hydro-mechanical model is adopted, in which stress equilibrium of the porous medium and seepage continuity are solved simultaneously, because deformation and pore pressure dissipation occur concurrently during tunnel excavation and cannot be accurately captured using uncoupled mechanical or seepage analyses. This model therefore provides a deterministic basis for evaluating seepage-amplified settlement and subsequent stochastic analyses with spatially variable hydraulic parameters.
The equilibrium equation of the porous medium is expressed as
where
σ is the total stress tensor,
ρ is the bulk density of the saturated soil–fluid mixture, and g is the gravitational acceleration vector. According to the effective stress principle,
where
σ′ is the effective stress tensor carried by the soil skeleton,
u is the pore water pressure, and
I is the identity tensor. The seepage behaviour follows Darcy’s law,
where
q is the Darcy seepage velocity vector (discharge per unit area),
k is the hydraulic conductivity (permeability coefficient), and
h is the hydraulic head. Darcy’s law is selected because groundwater flow in soft soils and sandy interlayers generally remains under laminar flow conditions, for which this relationship is widely validated. By combining Darcy’s law with mass conservation, the seepage continuity equation is written as
where
εv is the volumetric strain of the soil skeleton and
t is time. This equation is required to satisfy fluid mass conservation while accounting for volume change in the deformable porous medium during consolidation. Equations (1)–(4) form the governing system for hydro-mechanical coupling.
In practical seepage processes, hydro-mechanical coupling manifests as a bidirectional interaction. Variations in pore water pressure modify the effective stress state, thereby influencing deformation and settlement. Conversely, deformation alters pore structure and hydraulic conductivity, leading to redistribution of pore pressure and seepage velocity. This nonlinear feedback can be viewed as direct coupling (pore pressure acting on the soil skeleton) and indirect coupling (deformation-induced hydraulic evolution). The governing equations are solved simultaneously using a pore pressure–displacement finite element formulation, where displacement and pore pressure are primary variables. This unified framework captures excavation-induced stress release, pore pressure redistribution, and consolidation settlement, providing a realistic deterministic basis for subsequent stochastic analyses considering spatial variability of hydraulic parameters.
3.2. Finite Element Model
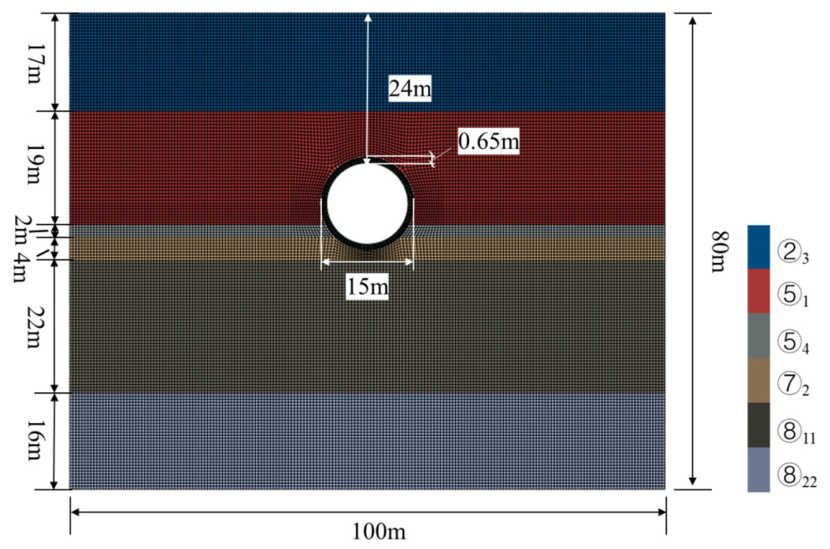
A two-dimensional plane strain finite element model was developed to simulate the transverse response of shield tunnel excavation based on Abaqus 2022. The model dimensions are 100 m × 80 m to minimize boundary effects. The tunnel has an outer diameter of 15 m, lining thickness of 0.65 m, and burial depth of 24.5 m, as shown in
Figure 3.
The soil layers from top to bottom include silty sand (②
3), clay (⑤
1), silty clay (⑤
4), fine sand (⑦
2), clay (⑧
11), and interbedded sandy clay and silty sand (⑧
22), as shown in
Figure 3. Soil behavior was modeled using the Mohr–Coulomb constitutive model. The compression modulus obtained from site investigation was converted into elastic modulus for numerical implementation. Material parameters of soils, lining, and grouting are summarized in
Table 2. γ denotes unit weight, E denotes elastic modulus, μ denotes Poisson’s ratio, c denotes cohesion, and φ denotes internal friction angle.
The model consists of 32,632 nodes and 32,116 elements, using coupled pore pressure–displacement elements (CPE4P) and reduced-integration elements (CPS4R). The CPE4P element is a four-node bilinear plane strain element with coupled displacement and pore pressure degrees of freedom, where each node includes two displacement components and one pore pressure variable, enabling simulation of hydro-mechanical coupling behavior. The CPS4R element is a four-node bilinear plane stress element with reduced integration, primarily used to model structural components such as tunnel lining, featuring two displacement degrees of freedom per node and improved computational efficiency. Lateral boundaries were constrained in the horizontal direction, the bottom boundary was fully fixed, and the ground surface was defined as a free boundary. Tunnel excavation was simulated using element deactivation and lining activation to represent stress release and structural installation. The initial seepage field was assumed to be hydrostatic. After excavation, pore pressure redistribution and consolidation were simulated over a two-year period to obtain stabilized settlement.
3.3. Random Field Modelling of Hydraulic Parameters
Spatial variability of hydraulic parameters is an intrinsic characteristic of natural soils and must be incorporated to realistically represent heterogeneous ground conditions. In this study, permeability coefficient and compression modulus is modelled as a spatially correlated random field. The spatial correlation between two arbitrary points is described by an exponential autocorrelation function:
where
is the correlation coefficient,
and
are the horizontal and vertical separation distances between two spatial locations, and
dx and
dy denote the horizontal and vertical correlation lengths, respectively. The correlation length controls the spatial persistence of parameter fluctuations.
Given a vector of independent standard normal random variables
, the correlated Gaussian random field
can be expressed as
where
represents the spatially correlated standard normal field.
Since hydraulic conductivity typically follows a lognormal distribution in soft soils, a transformation is applied to obtain the physical random field:
where
is the hydraulic conductivity at spatial location (
x,
y), and
and
are the mean and standard deviation of the logarithmic permeability.
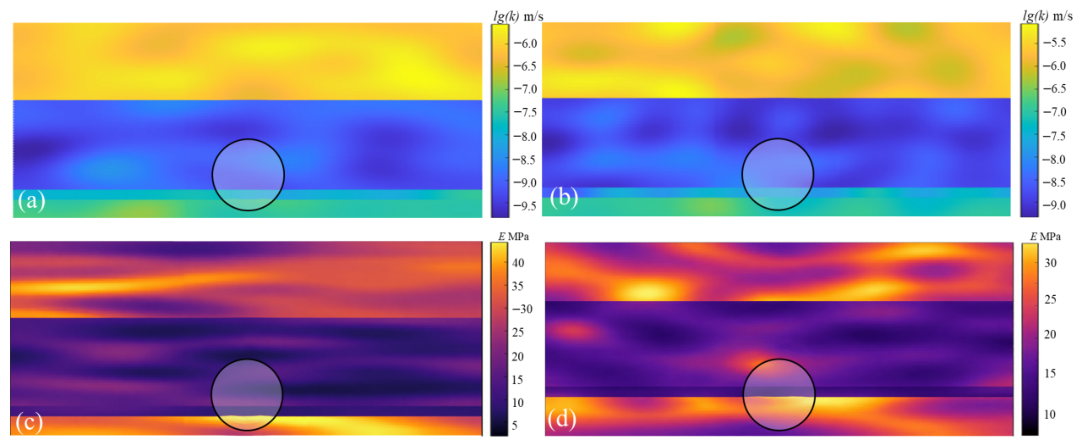
The generated random field is mapped onto the finite element mesh, assigning spatially varying hydraulic properties to each element. Through this procedure, both the statistical characteristics and spatial correlation structure of hydraulic parameters are preserved. The random field model therefore provides a quantitative representation of parameter heterogeneity and forms the basis for stochastic hydro-mechanical simulations.
5. Risk Assessment
5.1. Risk Assessment Procedure
To reasonably assess engineering risk and support risk-informed decision-making, it is necessary to classify risk events into different levels. The criteria for risk classification should comprehensively consider the project construction stage, actual scale, importance level, and specific risk management objectives. In general, the risk level is jointly determined by the probability of occurrence and the associated consequences (loss). Therefore, it is first necessary to establish grading standards for both probability and loss, and then determine the overall risk level of an event accordingly.
- (1)
Grading standard for risk occurrence probability:
The grading standard for risk occurrence probability during metro shield tunneling construction may refer to the classification method specified in Code for Risk Management of Underground Construction in Urban Rail Transit (GB 50652-2011) [
27], as shown in
Table 5 and
Table 6.
- (2)
Risk loss levels and evaluation criteria:
According to the probability of risk occurrence and the associated loss, the risk level for engineering construction should be classified into four grades, in accordance with the provisions shown in
Table 7.
In addition, the assessment of risk uncontrollability should be incorporated into the risk evaluation process, and its classification criteria are presented in
Table 8.
The risk magnitude is defined as the product of the probability of occurrence and the potential consequences. The calculation formula is expressed as follows:
which can be simplified as
When incorporating the uncontrollability of risk, the improved expression is
where
R—risk magnitude (risk level);
P—estimated score of risk occurrence probability (see
Table 5);
C—estimated score of risk-induced loss (see
Table 6);
U—estimated score of risk uncontrollability (see
Table 7).
Using the above formula, the magnitude of a specific risk can be calculated. Furthermore, a fuzzy evaluation method is adopted to classify the calculated risk values according to the concept of fuzzy intervals. The grading results and corresponding estimated value ranges are presented in
Table 9.
5.2. Loss Assessment
In the previous section, the maximum ground surface settlement was selected to calculate the failure probability because it serves as a clear indicator for evaluating engineering safety. It directly corresponds to the critical “failure” state and determines whether the most sensitive and critical buildings or pipelines within the affected area may be damaged. Once the settlement exceeds the prescribed limit, functional or structural failures—such as pipeline rupture or building cracking—may occur. Therefore, the maximum settlement is a direct criterion for identifying whether the project is in a failure state.
In contrast, the settlement trough area is an index that comprehensively reflects both the extent and severity of deformation. It provides a better quantification of the economic loss and consequence severity once failure occurs. Unlike the maximum settlement, which represents a single point value, the settlement trough area simultaneously considers the influence width of settlement and the magnitude of settlement at different locations. Accordingly, the maximum settlement is used to determine the probability of risk occurrence, while the settlement trough area is adopted as a loss indicator to quantify the potential consequences if risk occurs. Combining these two indices enables a more comprehensive risk assessment.
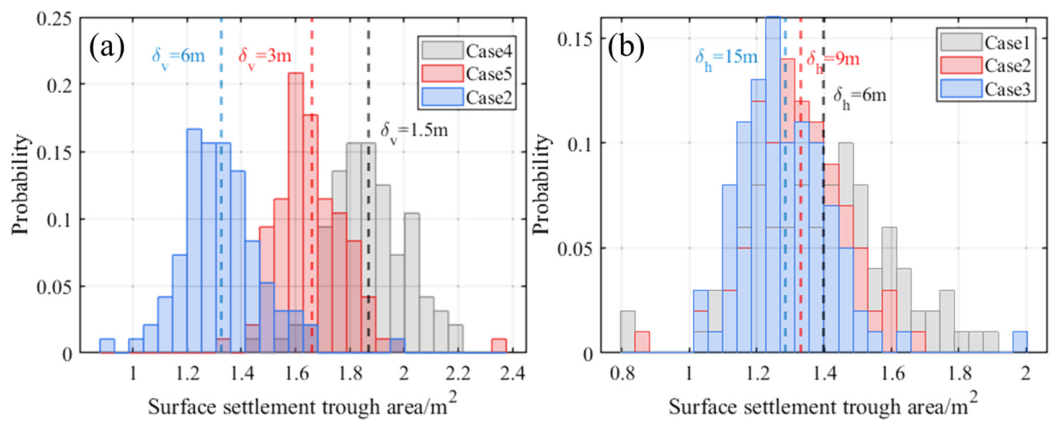
Based on the stochastic analysis results of the five working conditions presented in the previous section, the ground surface settlement trough area under each condition was calculated, and its statistical characteristics were analyzed. The corresponding frequency histograms are shown in
Figure 11. As the vertical correlation length increases (
δv), the mean settlement trough area decreases from 1.87 m
2 to 1.28 m
2, while the coefficient of variation increases. Conversely, as the horizontal correlation length (
δh) increases, the mean settlement trough area rises from 1.40 m
2 to 1.66 m
2, whereas the coefficient of variation gradually decreases.
A fitting analysis was conducted on the distribution of ground surface settlement trough area under Cases 1–5. The results indicate that both the normal and lognormal distributions provide satisfactory fits, while the lognormal distribution performs better overall, yielding more accurate results, more stable residuals, and no systematic bias. It also demonstrates stronger adaptability to data with moderate dispersion. In particular, at the tail of the data (high-probability regions), the deviation is smaller, and the simulated data more closely match the actual distribution characteristics. A comparison of fitting performance indices is presented in
Table 10.
All evaluation indices show that the lognormal distribution outperforms the normal distribution. Specifically, the coefficient of determination () approaches 1 when the explanatory power for data variability is stronger (with moderate dispersion and higher absolute values). The root mean square error (RMSE) approaches 0 when the average deviation between fitted and observed values is smaller. The mean absolute error (MAE) approaches 0 when the absolute difference between fitted and actual values is lower. For the Kolmogorov–Smirnov (KS) test, when , the distribution hypothesis is accepted, and a larger p-value indicates higher reliability.
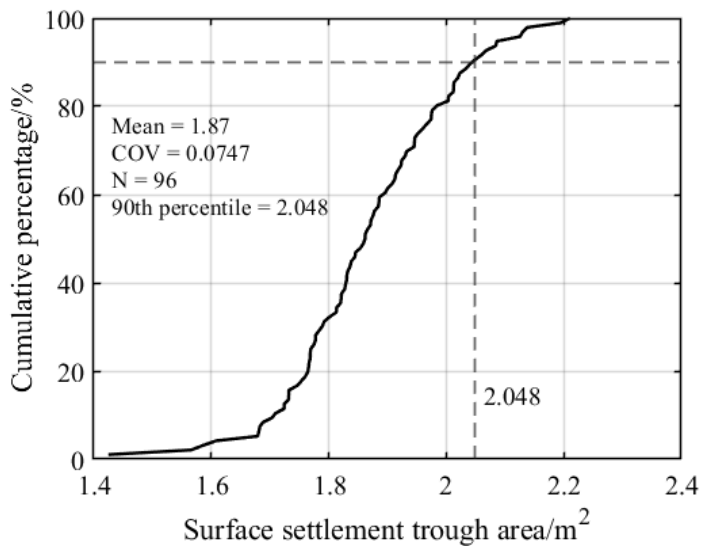
Therefore, the data for Case 1 approximately follow a lognormal distribution with a mean of 1.87 and a standard deviation of 0.14, exhibiting no significant skewness, as shown in
Figure 12. The corresponding probability density function (PDF) and cumulative distribution function (CDF) are given in Equations (14) and (15), respectively.
Similarly, the data for Case 2 approximately follow a lognormal distribution with a mean of 1.66 and a standard deviation of 0.14; Case 3 follows a lognormal distribution with a mean of 1.33 and a standard deviation of 0.15; Case 4 follows a lognormal distribution with a mean of 1.40 and a standard deviation of 0.22; and Case 5 follows a lognormal distribution with a mean of 1.29 and a standard deviation of 0.14. Based on the fitted distribution curves, the quantile value can be determined using Equation (16),
where
denotes the p-quantile of the standard normal distribution.
In accordance with risk probability classification standards and drawing on the concept of graded risk control, deformation induced by shield tunnel construction is categorized into different control levels. The loss control values (i.e., settlement trough area) corresponding to different risk levels under six working conditions are calculated. The loss values associated with each failure level adopted in this study for graded construction deformation control are presented in
Table 11.
5.3. Result Analysis
Using the risk level classification method established in this section, and based on the calculated failure probabilities of ground surface deformation from the previous section, together with the calculated ground loss values and the proposed control thresholds presented herein, the safety risk of ground surface deformation under the six working conditions was evaluated. The assessment results are shown in
Table 12.
Under conditions of relatively small vertical correlation length, the risk level is higher, which is consistent with general engineering experience. Risk control can be implemented throughout the entire process of “pre-construction prediction—in-construction control—post-construction remediation.” Through accurate prediction, graded control, and dynamic adjustment, ground surface deformation can be maintained within allowable limits, thereby effectively managing safety risks associated with tunnel-induced surface deformation.
Prior to construction, potential high-risk zones should be identified based on geological investigation data and numerical simulation results. During construction, differentiated deformation control measures should be adopted according to real-time monitoring data (e.g., the development trend of the settlement trough) and corresponding risk levels (such as Level III or Level II). For example, pre-construction ground improvement methods, including deep mixing piles and high-pressure jet grouting piles, may be applied to reinforce weak strata; precise site investigation should be conducted to obtain reliable soil mechanical parameters; and adjacent pipelines and structures should be pre-strengthened and protected. During shield tunneling, excavation parameters should be optimized by controlling advance rate, cutterhead rotation speed, synchronous grouting pressure and volume, maintaining earth chamber pressure balance, and strictly regulating muck discharge. In addition, segment installation quality and tail void grouting effectiveness must be ensured to prevent groundwater seepage. After construction, secondary grouting reinforcement may be implemented, and multidimensional monitoring points—covering ground surface, tunnel structure, and adjacent pipelines—should be arranged for dynamic observation. Timely repair of segment cracking and water leakage should also be carried out. For special conditions such as river crossings, soft soil lenses, or tunneling adjacent to existing tunnels, targeted measures including composite cutterheads, intensified grouting holes, and isolation piles should be adopted. By implementing a quantitative risk-based dynamic control strategy throughout the entire construction process, the management effectiveness of ground deformation risk can be significantly enhanced, ensuring the safety of tunnel construction and the surrounding environment.
6. Conclusions and Outlook
This study establishes a probabilistic risk assessment framework for tunnel construction deformation in soft soils by explicitly incorporating spatial variability of hydraulic parameters within a hydro-mechanically coupled finite element model. The proposed framework integrates three components: (i) statistical characterization of permeability and compression modulus based on site investigation data to define parameter distributions and correlation structures; (ii) development of a stochastic hydro-mechanical finite element model using random field theory and Monte Carlo simulation to quantify settlement uncertainty; and (iii) construction of an engineering-oriented risk evaluation system that combines failure probability, reliability index, and settlement trough area as a loss indicator to classify construction risk levels under different correlation scenarios.
Although the proposed framework provides useful engineering insights, its applicability is constrained by the project-specific database, simplified constitutive assumptions, and the limited consideration of uncertain parameters. Future studies are therefore encouraged to incorporate three-dimensional excavation effects, additional geotechnical uncertainties, and real-time monitoring data for model updating and broader validation. The main conclusions are summarized as follows:
- (1)
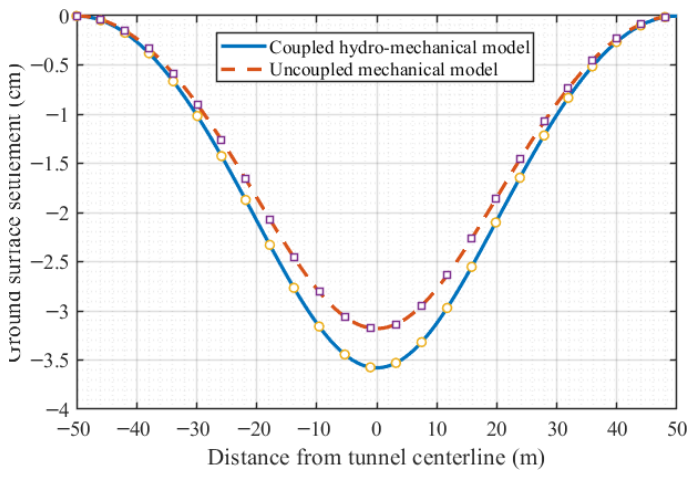
Hydro-mechanical coupling significantly amplifies excavation-induced ground deformation. Compared with the uncoupled condition, inclusion of seepage effects increases the maximum surface settlement from 3.18 cm to 3.58 cm, corresponding to an increase of 12.6%, confirming that neglecting groundwater–soil interaction may lead to systematic underestimation of deformation. Moreover, stochastic simulations demonstrate that most settlement realizations and their mean values exceed deterministic predictions, highlighting the necessity of incorporating spatial variability in soft soil tunnelling analysis.
- (2)
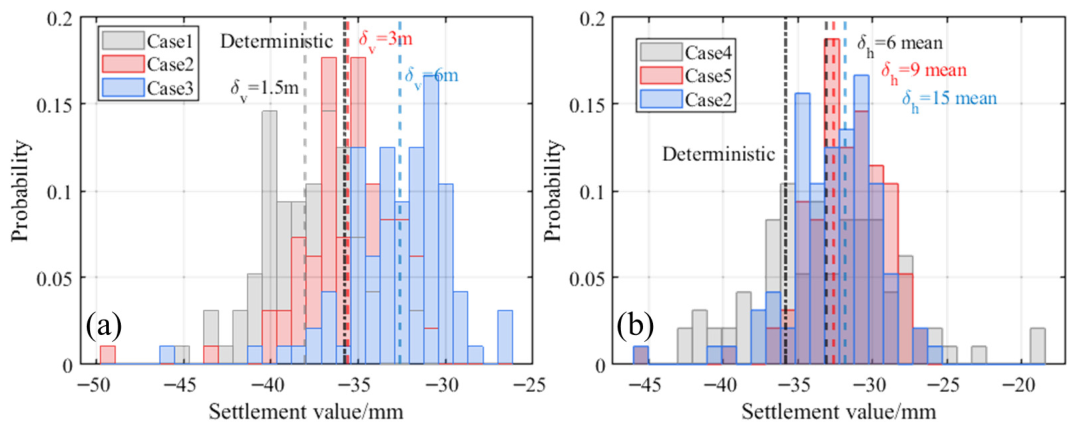
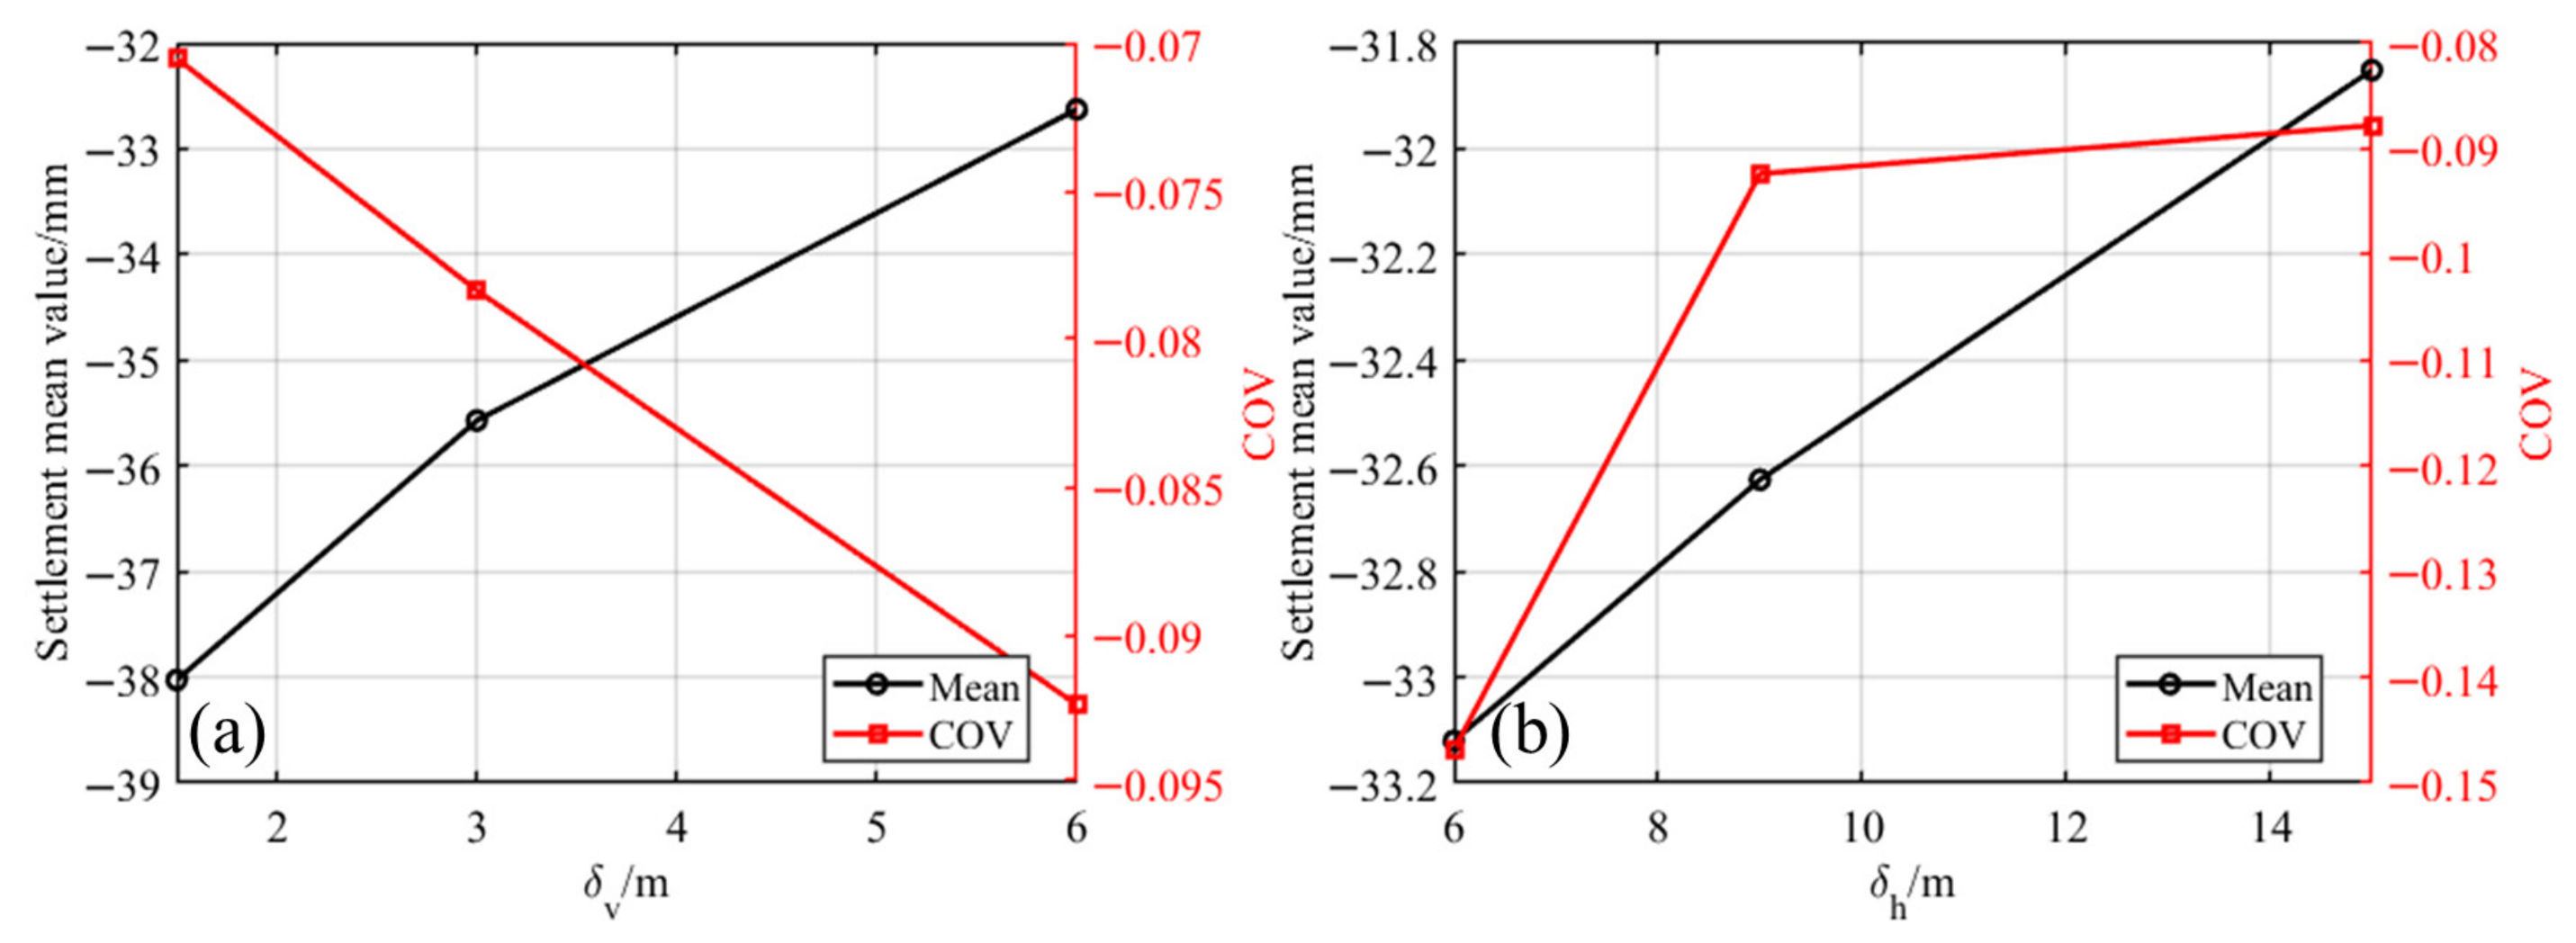
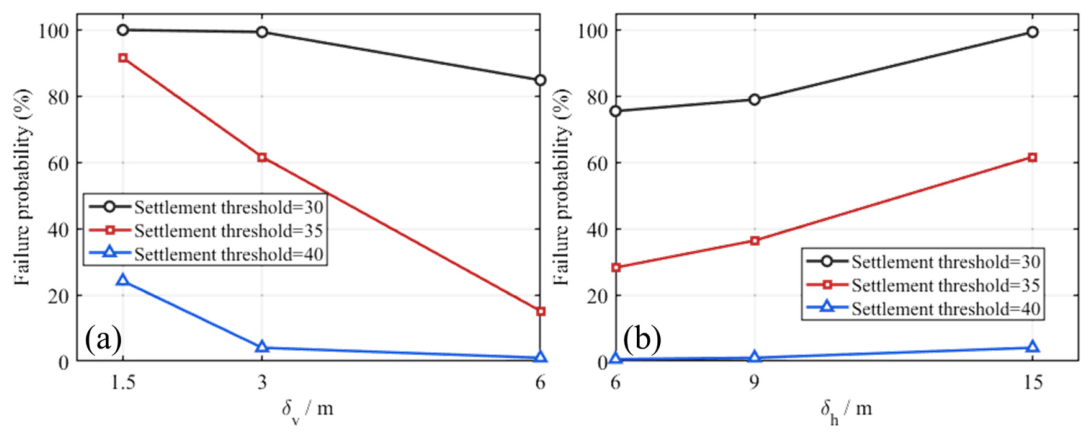
The spatial correlation structure of hydraulic parameters plays a decisive role in deformation uncertainty and failure probability. As the vertical correlation length increases from 1.5 m to 6 m, the mean settlement trough area decreases from 1.87 m2 to 1.28 m2, while the failure probability under a 40 mm settlement threshold decreases markedly from 24.21% to 1.01%. Under a 35 mm threshold, the corresponding failure probabilities decrease from 91.58% to 15.15%. Increasing the vertical correlation length reduces the mean maximum settlement but increases its coefficient of variation, resulting in a significant decrease in exceedance probability under prescribed settlement control thresholds. In contrast, increasing the horizontal correlation length slightly reduces dispersion but enlarges the lateral continuity of high-settlement zones, thereby increasing failure probability. These results indicate that vertical correlation exerts stronger control over deformation magnitude, whereas horizontal correlation primarily influences the spatial extent of risk.
- (3)
The settlement trough area follows a lognormal distribution and provides a rational quantitative indicator for consequence assessment. Compared with the normal distribution, the lognormal model yields higher goodness-of-fit indices and more stable residual behavior. By integrating failure probability, settlement-related loss, and uncontrollability factors into a unified risk matrix, the evaluated risk levels range from Moderate (Level II) to Relatively High (Level III), depending on correlation scenarios. Smaller vertical correlation lengths correspond to higher risk levels, which is consistent with engineering observations in heterogeneous soft strata.
Overall, the proposed framework establishes a systematic pathway from spatial parameter characterization to probabilistic deformation prediction and quantitative risk classification. It provides methodological support for risk-informed design and dynamic construction control of shield tunnels in saturated soft soil environments.




 ,
,