1. Introduction
Interventional cardiology, an image-guided discipline that uses fluoroscopy to diagnose and treat cardiovascular lesions, enables real-time visualization of the vascular anatomy during procedures. Exposure to ionizing radiation is unavoidable because radiographic imaging is intrinsically guided by fluoroscopy.
Many interventional cardiovascular procedures require prolonged fluoroscopy and repeated cine acquisition to navigate the complex vascular anatomy and achieve their therapeutic objectives. Consequently, patients might be exposed to relatively high radiation doses compared with other diagnostic imaging examinations, underscoring the need for systematic dose monitoring, management, and optimization [
1].
According to the Korea Disease Control and Prevention Agency (KDCA) 2023 National Medical Radiation Evaluation Yearbook, the public use of medical radiation is steadily increasing. Among various procedures, the use of angiography increased by 21.3% in 2023 compared with that in 2020. While angiography accounted for only 0.2% of total medical radiation during 2023, it contributed 2.3% of the total patient radiation dose, ranking third among all diagnostic imaging examinations. The per-capita effective dose from angiography was 0.07 mSv. Specifically, cardiac angiography was the most frequently performed examination, accounting for 39.3% of all angiographic procedures and contributing to a radiation dose of 26.4% [
2].
Since 1996, six international organizations, including the World Health Organization and the International Atomic Energy Agency, have jointly recommended the management of patient radiation doses through International Basic Safety Standards No. 115. The International Commission on Radiological Protection (ICRP) recommends the establishment and use of diagnostic reference levels (DRLs) to optimize patient exposure. Dose management and optimization based on these levels have become essential components of national healthcare systems worldwide [
3,
4,
5].
Previous investigations into DRLs have consisted of measuring radiation doses absorbed by standard phantoms or patients. However, ICRP Publication 135 recommends the establishment of the DRLs based on actual patient dose data. If the calculated DRLs are high, the equipment and examination protocols must be inspected to ensure appropriate optimization [
6].
The DRLs do not have dose limits or constraints. Clinical DRLs should be derived from dose distributions monitored over extended periods and cover national or regional scopes. The DRL values are selected based on typical examinations of patient groups within a specific weight range or, in specific circumstances, standard phantoms across a wide range of equipment types.
The DRLs do not apply to individual patients; rather, they are arbitrary thresholds derived from national or regional radiation data. The DRLs supplement professional judgment and do not distinguish between poor and excellent medical practice. Modern national DRLs have been established according to Digital Imaging and Communications in Medicine (DICOM) protocols. Currently, medical institutions that can collect dose information from hospital or radiological information systems are encouraged to collect and store patient dose data using DICOM Radiation Dose Structured Reports (RDSR) [
7].
Diagnostic reference levels are now recognized as key tools for managing radiation exposure during medical imaging and interventional procedures [
8]. They are typically derived from national or regional dose distributions, and are commonly defined as the 75th percentile of an appropriate patient dose metric for a given examination or procedure [
6]. They serve as practical benchmarks for dose evaluation and optimization. When doses routinely exceed the DRLs, facilities are encouraged to review clinical practice arrangements, equipment settings, and imaging protocols to identify opportunities for improvement. The DRLs are advisory rather than regulatory dose limits. Their purpose is not to indiscriminately reduce doses, but rather to determine radiation doses that are as low as reasonably achievable (ALARA) while maintaining diagnostically adequate image quality, thereby operationalizing ALARA principles and optimization [
9,
10].
International organizations, including the International Atomic Energy Agency and the European Union (EU), have actively promoted the implementation and use of DRLs among a broad range of diagnostic and interventional procedures, and recommend that member states establish and apply national DRLs tailored to local clinical practice and available technology [
6].
The EU, Japan, and the United States have promoted radiation dose management and quality improvement by periodically updating their national DRLs.
National DRLs were established in South Korea in 2008, when the Korea Ministry of Food and Drug Safety first developed and announced them. Since 2013, the KDCA has been responsible for providing national DRLs for various types of medical tests involving radiation, which are updated every 3–5 years [
11].
According to the ICRP Publication 135, surveys for establishing DRLs should include sufficiently large samples to ensure representative patient data. For surveys conducted within a single facility, data are collected from at least 20 patients per examination. Furthermore, when surveys involve a randomly selected subset of facilities, data from approximately 20 to 30 facilities are considered sufficient to derive a national DRL [
6].
In Korea, DRLs have been developed and published for multiple imaging modalities and examinations, including computed tomography (CT), mammography, and fluoroscopic studies [
11,
12,
13,
14]. National DRLs for angiographic and interventional procedures were updated in 2012 and 2019 but were largely confined to the radiology domain, and national DRLs specific to coronary angiography (CAG) and interventional cardiology procedures have not yet been formally reported. The KDCA updated the national DRLs for neurointerventional and abdominal interventional radiology in 2012 and 2019, respectively. Despite these updates in other vascular fields, to our knowledge, the cardiovascular sector has yet to undergo a national DRL survey conducted by the KDCA [
15].
In South Korea, DRLs are established every five years depending on the type of equipment. However, with the exception of CT, previous DRLs for other imaging modalities have been determined based on on-line and on-site surveys.
Therefore, we developed a digital system for establishing DRLs for angiography and interventional radiology. Specifically, through a pilot operation, we aimed to establish DRLs using a DICOM-based application to ensure the continuous setting of reference levels for future angiographic and interventional radiology procedures.
To date, South Korea’s DRLs for angiography have focused primarily on general radiology-based procedures. Through combining manual data collection with digital information gathering, this study aimed to confirm the feasibility of automated collection of dose information using DICOM and to establish the first national DRLs for CAG and interventional cardiology procedures in Korea, based on a nationwide patient-dose survey conducted in 2024.
2. Materials and Methods
2.1. Data Acquisition and Study Population
Among 114 institutions that are members of the Korean Society of Interventional Cardiology and are certified to conduct cardiovascular interventional procedures, 20 institutions expressed a willingness to participate and were included in this study.
Radiation-dose data for CAG and interventional procedures were collected from these 20 cardiovascular centers. To facilitate the systematic acquisition of dosimetric data, a dedicated server was established to receive and store the DICOM RDSR and procedure reports generated by the angiography systems at each participating institution.
In the data collection process, standard Korean body sizes were considered through targeting adults aged ≥20 years ranging in body weight from 55.2 kg to 89.1 kg. This specific weight range represents the 25th and 95th percentiles of the national standard body weight data [
16].
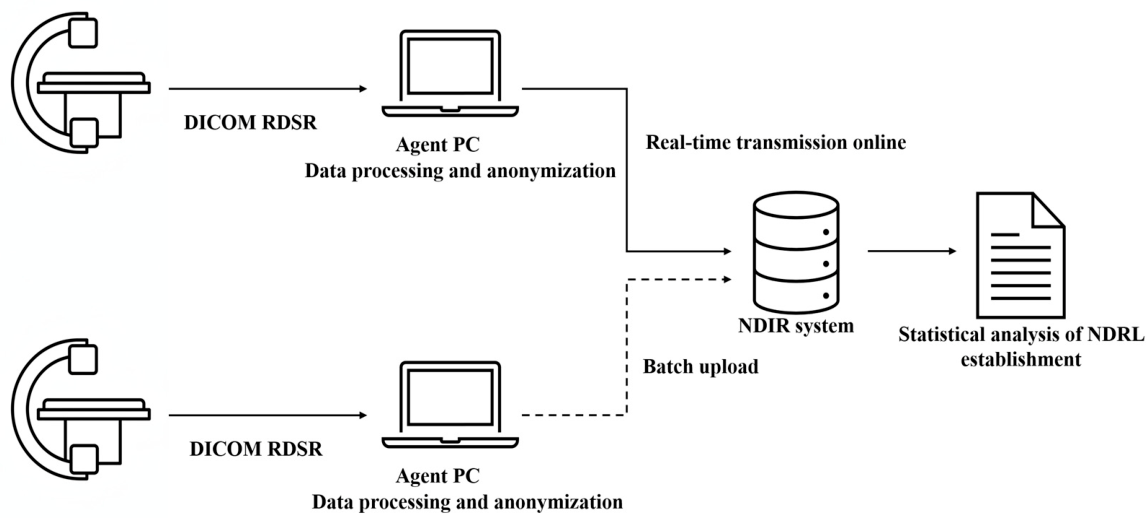
The data transfer pathways were categorized into two modes according to the network security policies of the participating institutions (
Figure 1).
Real-time transmission: At 14 institutions, DICOM RDSR data were transmitted directly to the central server in real time. These institutions use a DICOM modality worklist function to select the examination orders before starting patient procedures. The RDSR information generated by the angiography system was collected after examinations were completed. The dose data generated by the equipment were first sent to an agent system installed within the internal network of the hospital and subsequently transmitted to the central server.
Batch upload: Data were temporarily stored on internal workstations and uploaded to the central server in batches at six institutions, where external network access was restricted because of internal security protocols. These institutions used a post-prescription workflow in which examination orders were entered into the hospital’s information system after the completion of procedures. Consequently, the DICOM RDSR information generated after the examination was sent to the agent system, where dose and prescription data were manually mapped before being collectively updated on the central server.
2.2. System Design for DICOM RDSR Data Collection and Data Processing
Data were collected over 9 months in 2024. Raw data stored on a proprietary server were aggregated into a unified database for analysis.
The National Dose Index Registry (NDIR) was configured to transmit DICOM RDSR data from CAG and interventional procedures to collect patient dose information for this study. The NDIR comprises two primary software components.
The first is an agent system installable within medical institutions, developed using Java 1.8 (Oracle Corp., Austin, TX, USA), JavaFX 1.8.0_202-b08 (Oracle Corp., Austin, TX, USA), and SQLite 3.34 (
https://sqlite.org accessed on 20 January 2024) software.
The primary dosimetric parameters extracted were cumulative kerma-area product (KAP, Gy·cm2) and fluoroscopy time (FT, s) per procedure. All datasets were de-identified before analysis to ensure patient privacy and data security. Institutional identifiers and all patient-related sensitive information were removed according to data protection requirements. The agent system is designed to map pre-entered exam codes before data transmission. To prevent leakage of patient data, all data were programmed to be automatically deleted immediately after transmission.
The second is a server system for data collection that was developed based on Java 1.8 (Oracle Corp., Austin, TX, USA) software using the Spring Framework, with Apache Tomcat 8.5 (Apache Software Foundation, Wilmington, DE, USA) software as the web server and MySQL 8.0 (Oracle Corp., Austin, TX, USA) software as the database. The server system aggregates collected data and enables DRLs to be established on a quarterly basis.
2.3. Procedure Classification
We classified procedures into seven categories based on their characteristics and clinical diagnostics (
Table 1). Specific examination names at each medical institution were mapped within the client system based on selected categories. Accordingly, radiation dose information was extracted from DICOM RDSR data.
2.4. Statistical Analysis and Establishment of DRLs
Descriptive statistics, including mean, median, first (Q1), and third (Q3) quartiles, were calculated for the cumulative KAP and FT within each procedure category. We established DRLs and reference values based on empirical distribution of the dosimetric data. Q3 was established as the upper DRL, whereas Q1 was proposed as the lower DRL. The 50th percentile was designated as the target dose to facilitate the optimization of radiation protection.
This study was exempted from Institutional Review Board review for human subject research as only anonymous data were analyzed.
3. Results
Data from 1980 CAGs and interventional procedures between April and December 2024 were included. We analyzed various procedures, including CAG with percutaneous coronary intervention (PCI), CAG with percutaneous transluminal coronary angioplasty (PCTA), CAG with provocation for coronary spasm, acute myocardial infarction (AMI), chronic total occlusion, CAG alone, and PCI alone.
Dose data were obtained from 20 angiographic systems: eight, 10, and two were located in Seoul, Gyeonggi and Gangwon, and Gyeongsang and Jeolla regions, respectively.
Table 2 summarizes the distribution of the systems according to manufacturer.
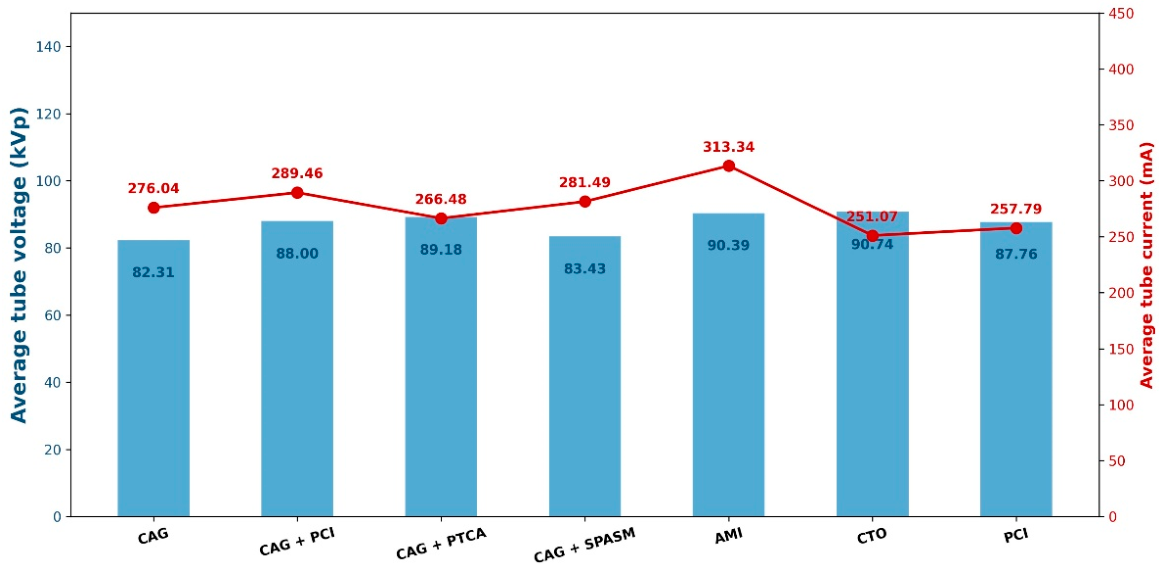
Figure 2 shows that the average tube voltage and tube current were: CAG, 82.32 kVp and 276.04 mA; and CAG + PCI, 88.00 kVp and 289.46 mA, respectively.
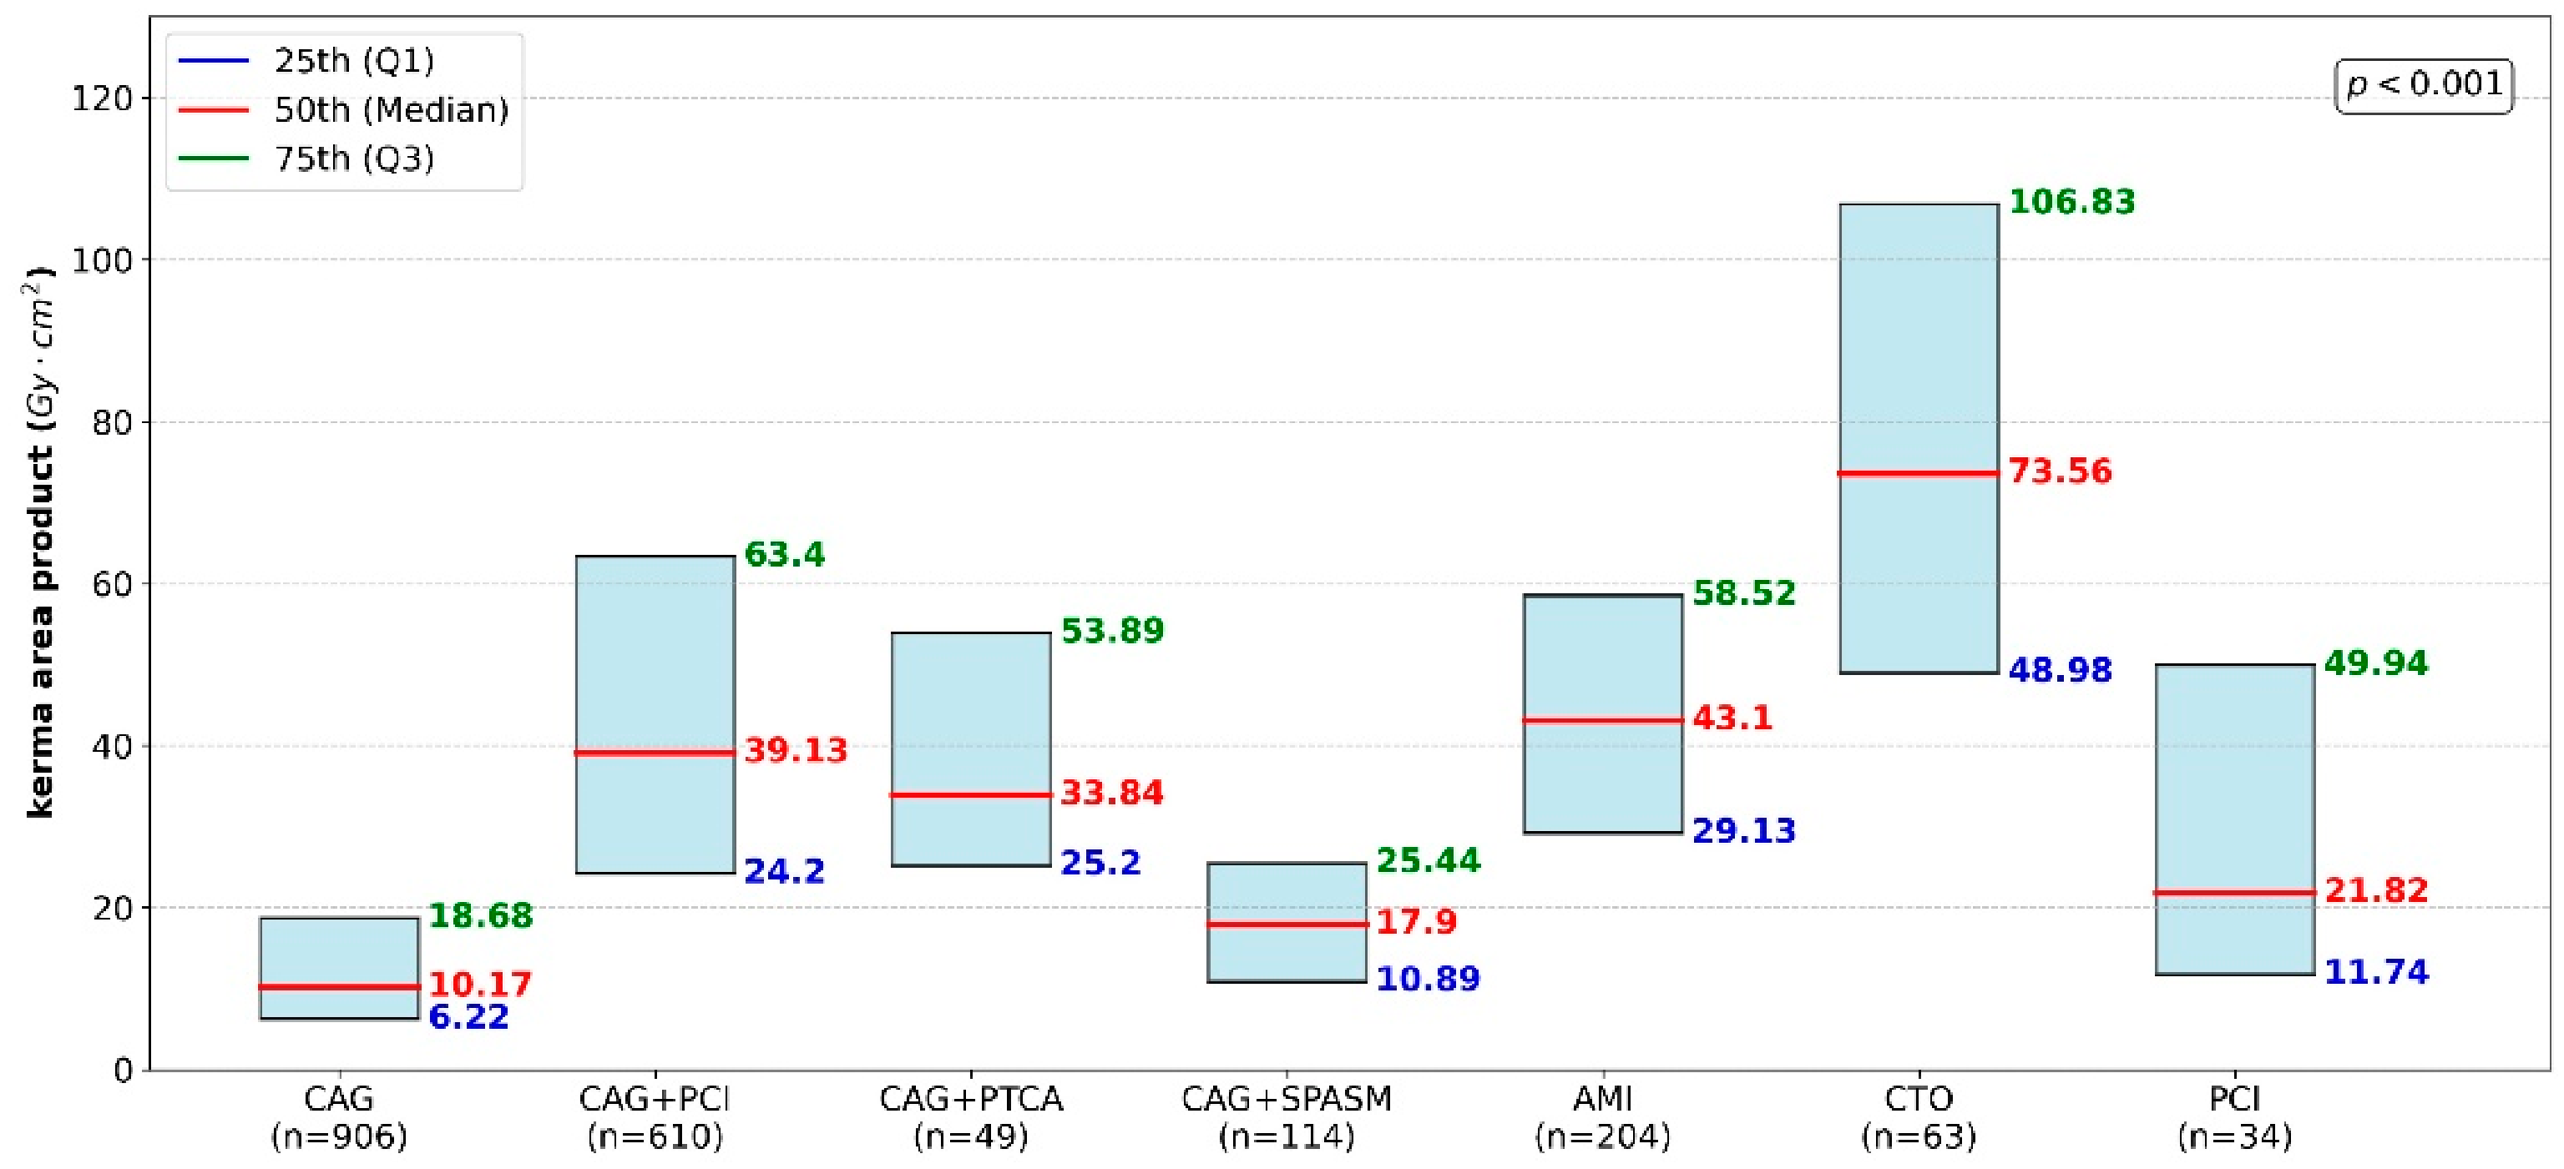
The 25th, 50th, and 75th percentiles of KAP were calculated for each procedure category. The 25th, 50th, and 75th percentiles were defined as lower DRL, target dose, and upper DRL, respectively. The 75th percentile KAP values were as follows: CAG, 18.68 Gy·cm
2; CAG + PCI, 63.40 Gy·cm
2; CAG + PTCA, 53.89 Gy·cm
2; CAG + spasm, 25.44 Gy·cm
2; AMI, 58.52 Gy·cm
2; CTO, 106.83 Gy·cm
2; and PCI, 49.94 Gy·cm
2.
Figure 3 shows the total percentile distribution and average KAP values.
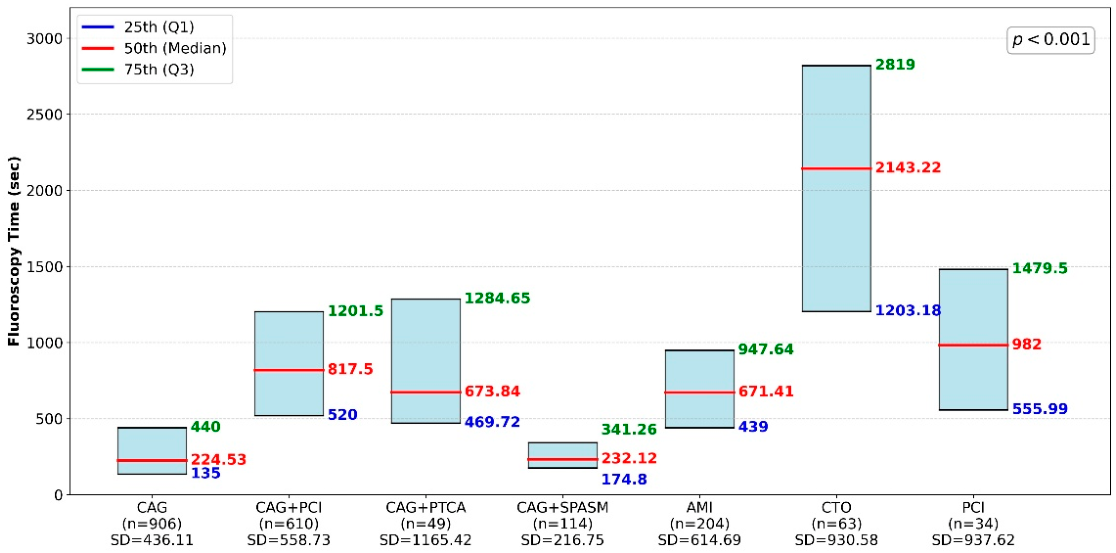
The FT data were analyzed using the same percentile-based approach. The 75th percentile FT values were as follows: CAG, 440.00 s; CAG + PCI, 1201.50 s; CAG + PTCA, 1284.65 s; CAG + spasm, 341.26 s; AMI, 947.64 s; CTO, 2819.00 s; and PCI, 1479.50 s.
Figure 4 summarizes the 25th, 50th, and average FT values. The 75th percentile values of both the KAP and FT were adopted as the proposed national DRLs for the seven procedural categories.
The one-sample t-test results indicated that both KAP and FT were significantly different from the test value (0) across all procedures (p < 0.001). The mean KAP and FT values for CAG were 14.92 (75% confidence interval [CI], 14.39–15.46) and 395.84 (75% CI, 379.97–411.72), respectively. For CAG + PCI, they were 48.78 (75% CI, 47.15–50.41) and 938.28 (75% CI, 912.23–964.33), respectively. For CAG + PTCA, they were 42.89 (75% CI, 38.89–46.89) and 1091.80 (75% CI, 897.94–1285.67), respectively. For CAG + SPASM, they were 18.68 (75% CI, 17.75–19.61) and 298.52 (75% CI, 275.05–322.00), respectively. For AMI, they were 56.38 (75% CI, 53.10–59.66]) and 874.69 (75% CI, 825.04–924.34), respectively.
CTO procedures recorded the highest mean KAP and FT values at 78.95 (75% CI, 71.15–86.75) and 2099.02 (75% CI, 1912.14–2285.90), respectively. Finally, the mean KAP and FT values for PCI were 34.13 (75% CI, 29.72–38.54) and 1192.61 (75% CI, 1055.44–1329.79), respectively.
4. Discussion
Here, we established the first official national DRLs for CAG and interventional cardiology in Korea. We developed a national dose registry framework in which clinical radiation dose data were collected in the form of DICOM RDSRs, and analyzed procedure-specific datasets aggregated from routine clinical practice. Through leveraging standardized RDSR outputs, our approach enabled the consistent extraction of dose metrics and facilitated robust cross-institutional quantitative analyses.
The European Study on Clinical Diagnostic Reference Levels for X-ray Medical Imaging (EUCLID) European Congress of Radiology-EuroSafe Imaging has investigated clinical DRLs. A comparison of DRLs among procedure types identified the highest KAP (106.83 Gy·cm2) and the longest FT (2819.00 s) during CTO interventions. This finding is clinically plausible because CTO lesions are chronically occluded and frequently characterized by diffuse lesions and/or severe calcification, which increases procedural complexity and difficulty. Consequently, CTO often requires prolonged fluoroscopy and repeated image acquisition, leading to higher cumulative patient radiation exposure. These characteristics highlight CTO interventions as priority targets for optimization strategies, including protocol standardization, careful use of cine runs, and reinforced operator training focused on dose reduction techniques.
In contrast, KAP was the lowest (18.68 Gy·cm2) for CAG in our study, which had the second shortest FT (440.00 s), which is consistent with its primarily diagnostic nature and relatively standardized workflow. Compared with CAG alone, the combined procedures CAG + PCI, CAG + PTCA, and CAG + spasm were associated with increased radiation exposure, reflecting the structural features of these workflows, in which an interventional component follows diagnostic angiography within the same session. The KAP for CAG + PCI was approximately 3.4-fold higher than that for CAG alone, and the FT was approximately 3-fold longer (increase of approximately 12.7 min). This increase likely reflects additional complexity associated with device manipulation, lesion preparation, and confirmatory imaging required during the interventional phase after completing the diagnostic component.
The procedural categories in this study were designed to reflect real-world clinical settings, specifically to provide distinct DRLs for complex cases such as CTO versus standard PCI and PTCA. Complex interventions often require extended fluoroscopy and increased imaging, which significantly increases the risk of high radiation doses to a patient’s skin. Consequently, implementing category-specific DRLs proposed in this study is crucial for mitigating radiation-related risks, including deterministic and stochastic radiation hazards, thereby ensuring patient safety.
Compared with international data (
Table 3), the DRLs for CAG and PCI calculated herein were relatively low, indicating that Korean medical institutions have proactively adopted modern equipment and adhered to radiation dose reduction protocols. A related comprehensive analysis of DRLs for interventional procedures in Korea and other countries reported substantial variations in procedural radiation doses and in the standards used to establish DRLs [
15]. In particular, their analysis revealed that Korean DRLs were generally lower than those in European countries and in the United States of America, and the adoption of advanced technologies is widespread in leading medical institutions [
17,
18]. Overall, the national DRLs and achievable doses proposed herein provide a baseline for benchmarking and quality improvement in interventional cardiology in South Korea. Future studies should assess temporal trends following DRL dissemination, evaluate institutional outliers and determinants of higher doses, and explore risk-adjusted DRLs that account for the size of patients, lesion complexity, and procedural approaches to further refine optimization strategies.
In a 2019 study by Kim et al., the PTCA category broadly included procedures for complex lesions such as CTO and multivessel disease, which accounts for the substantial difference in the results reported in our study [
4]. Furthermore, this discrepancy is also likely attributable to Kim et al.’s data having been collected between 2016 and 2017, a transitional period during which analog and digital imaging systems coexisted [
4]. Since then, medical institutions in Korea have adopted new and advanced equipment. Additionally, following a radiation dose reduction campaign initiated by the Korean Society of Interventional Cardiology, numerous institutions have shown heightened awareness of radiation exposure and have subsequently optimized their clinical protocols. We consider that these factors collectively contributed to the enhanced outcomes observed in our study.
The establishment of national DRLs in this study extends beyond the presentation of numerical benchmarks, and provides a framework to support future radiation dose reduction efforts in Korean clinical practice. At the institutional level, DRLs can serve as references for internal self-audit dose assessments, enabling facilities to determine whether their routine practice is aligned with national benchmarks and to prioritize optimization when typical values are persistently elevated. Furthermore, DRLs might also support equipment performance evaluations and the development or refinement of operational guidelines, including protocol standardization and periodic quality assurance activities. Moreover, DRLs can be integrated into operator education and training programs to improve dose awareness among interventionalists and staff, thereby fostering a sustained culture of radiation safety.
At the national level, procedure-specific DRLs enable cross-institutional benchmarking, and support the development of comparative analyses and feedback mechanisms. Such systems can facilitate the identification of outliers, the dissemination of best practices from lower-dose centers, and the implementation of targeted quality improvement initiatives. Over the mid- to long-term, national DRL data can serve as foundational evidence for dose optimization policies, including updates to clinical guidance, resource allocation for equipment modernization, and national strategies for radiation protection in interventional cardiology.
Continuous and systematic data collection is essential for the effective implementation and maintenance of DRLs. The feasibility and validity of DRL development were supported by using DICOM RDSR-based dose data, which provided standardized machine-generated records of patient dose metrics. This approach improves data consistency and minimizes the limitations of manual recording, while emphasizing the potential for the future adoption of automated dose monitoring systems. Such automation could strengthen surveillance capacity, enable the timely detection of practice changes, and support periodic DRL updates to reflect advances in technology and evolving clinical practice patterns.
5. Conclusions
National DRLs for general angiography and interventional radiology in Korea were established in 2012 and 2019, respectively. However, the present study has essentially established the first official national DRLs specifically for CAG and interventional procedures. These DRLs were derived by stratifying the data according to real-world clinical diagnostic distributions. The proposed DRLs provide a practical framework for optimizing radiological examinations and minimizing patient exposure to radiation during routine clinical practice.
This study demonstrates the potential of an automated dose monitoring system based on DICOM RDSR in the cardiovascular field. Through improving the system’s accessibility, we have enhanced the possibility for a broader range of medical institutions to join DRL initiatives. This progress is expected to serve as a cornerstone for regular updating and management of national DRLs in interventional cardiology.
This study has some limitations. The predominant use of CAG equipment from a single manufacturer in domestic hospitals limited the possibility of conducting a comprehensive comparative evaluation across different brands. Data were collected only from institutions that voluntarily participated during a period of healthcare systemic instability; therefore, the results may not fully represent the conditions across all medical institutions. Potential statistical variations arising within the data collection process, specifically between automated DICOM RDSR extraction and manual data entry, were excluded from the analysis.