Article

Elastic Stress Distribution Characteristics in the Anchorage Section Considering Anchor Cable Morphology
1
School of Civil Engineering, Qingdao University of Technology, Qingdao 266520, China
2
Qingdao Metro Group Co., Ltd., Qingdao 266520, China
3
Qingdao Metro Line 6 Co., Ltd., Qingdao 266520, China
4
School of Civil Engineering, Harbin Institute of Technology, Harbin 150006, China
*
Author to whom correspondence should be addressed.
Appl. Sci. 2026, 16(9), 4084; https://doi.org/10.3390/app16094084
Submission received: 25 February 2026 / Revised: 15 April 2026 / Accepted: 21 April 2026 / Published: 22 April 2026

Abstract

The prestressed anchor cable is widely used in foundation pit engineering, but its universal bending shape in the anchorage section will significantly affect the load transfer and stress distribution. Based on Cox’s shear-lag model, this paper presents a theoretical analysis of the load transfer behavior at the anchor cable–grout interface and establishes an elastic distribution model of axial force and shear stress that accounts for the anchor cable shape. Furthermore, the influence of cable shape on the elastic stress distribution in the anchorage section under different load conditions, different anchorage lengths, and different bending radii is compared and analyzed. Finally, through a comparative analysis between the model calculation results and experimental data, the proposed distribution model shows good agreement with the experimental results. The findings reveal the evolution of the elastic stress distribution in the anchorage section under different cable shapes and provide a theoretical reference for the axial force loss of prestressed anchor cables in service.

1. Introduction

As an efficient and economical reinforcement technology, prestressed anchor cable has been widely used in the fields of slope stability, deep foundation pit support, underground engineering, and dam reinforcement [1,2,3]. It transfers the tensile load to the stable rock-soil layer deep in the potential slip surface, fully mobilizing and utilizing the self-stabilization ability of the distal rock-soil mass [4,5,6,7]. The long-term service performance of the anchor cable, especially the axial force loss in the anchorage section, directly determines the service effect and service life of the project [8].
However, a large number of spot checks and model tests have found that the anchor cables in the anchoring section generally have different degrees of bending, rather than the straight force under the ideal design state [9,10,11]. The origin of this bending form is complex, involving uneven geological conditions, deviated boreholes, slurry defects, rock and soil creep, and the impact of various factors such as the failure of the middle support [12,13,14]. Bending deformation of the anchor cable body is almost inevitable. This bending phenomenon alters the internal stress distribution of the anchor cable, leading to redistribution or even partial loss of prestress [15,16,17], thereby weakening its reinforcement efficiency. Moreover, it may aggravate stress concentration and fatigue damage of the cable body, posing a potential threat to the long-term durability and normal operation of the structure.
In engineering practice, the maximum borehole deviation can reach up to 5.8%, a phenomenon that results in the actual effective anchorage length of the anchor cable being shorter than the design value and causes significant changes in the axial force distribution. At present, research efforts in academia and engineering have mostly focused on the cause analysis of borehole deviation and deviation correction techniques [15,16]. However, studies on how the anchor cable configuration affects the stress distribution along the anchorage length and the load transfer mechanism remain relatively insufficient. In particular, the influence pattern of bending configuration on axial force loss has not yet been systematically revealed.
The load transfer mechanism of prestressed anchor cable anchorage sections has always been a concern for the academic community, and many theoretical models and analytical methods have been established one after another. Many researchers have analyzed the distribution of shear stress and axial force in the anchorage section and have given some distribution models, such as the Phillips model [17], and other models [18,19]. Yu et al. [20] constructed a computational model for the bond shear stress of the bending anchorage section based on the two-dimensional elasticity theory. Through theoretical analysis and numerical simulation, Zhou et al. [21] obtained an analytical model of the anchor cable reinforcement effect and load transfer considering borehole deviation. Zhu et al. [14] derived the interfacial stress distribution model of bending anchor cables based on the method of elasticity. The results show that the existence of the bending anchorage section makes the axial force and interfacial bond shear stress redistribute significantly. Specifically, with the increase in bending radius, the distribution ratio of inner and outer shear stress decreases. However, existing studies generally assume that the anchor cable within the anchorage section is in an ideal straight state. Although Zhu et al. [14] proposed an analytical model for the curved anchorage section considering borehole deviation, they did not explicitly account for the changes in stress distribution induced by the curvature of the anchor cable. Moreover, systematic analyses of axial force loss under different bending radii, anchorage lengths, and load levels, taking into account the anchor cable configuration, remain insufficient. Therefore, further investigation into the stress distribution law and axial force loss characteristics along the anchorage length of curved anchor cables is necessary.
In this study, theoretical analysis and laboratory test methods are used to systematically explore the stress distribution characteristics of anchor cables under different bending shapes. The analytical derivation is based on the shear-lag model framework of Cox [22], with an explicit incorporation of curvature-induced frictional shear stress, thereby establishing a mechanical model that describes the distribution patterns of axial force and interfacial shear stress along the anchorage segment of a curved anchor cable. It is explicitly stated that the present analysis is limited to the elastic stage of the anchorage system, where the anchor cable and grout remain fully bonded without slip. The curvature-induced stress redistribution discussed herein is an elastic phenomenon and does not involve progressive debonding or sliding. In terms of experimental research, the pull-out model tests of three typical bending anchor cables are designed and carried out. Through the comparison and analysis of the measured data and the theoretical prediction results, combined with the existing research results for cross-comparison, it is suggested that the model has good reliability.

2. Engineering Background

Through field investigations of a large number of excavation projects, it is found that the shape of anchor cables during construction is not an ideal straight line, but rather a continuous and regular curve. To prevent the anchor cables from accumulating at the cross section, isolation supports are installed on the anchor cables; however, these supports cause the cable shape to vary along the longitudinal direction. The reason for this phenomenon lies in the manufacturing process of the anchor cables. According to the site construction code, the maximum spacing of the isolation supports used is 2.0 m. In addition, to prevent the strands from being displaced by gravity, the strands are tied together between two adjacent isolation supports. The diameter at the tying point is smaller than that at the isolation support, so the contact surface between the grout and the steel strand is not straight but forms a continuous and regular wavy curve, as shown in Figure 1.
In addition, when multiple steel strands are arranged in the same borehole, differences in their bending curvatures lead to uneven load distribution under conventional equal-elongation tensioning, resulting in significant prestress loss. The elastic model proposed in this paper analyzes the axial force loss and distribution patterns for different anchor cable shapes, providing a theoretical reference for understanding and mitigating the load imbalance problem.

3. Distribution Model

The governing equations for the straight anchor cable are based on the classical one-dimensional shear-lag model, which originated from the pioneering work of Cox [22] on stress transfer in fibrous materials and was later extended to many bonded reinforcement systems. In this paper, based on the governing equations for the straight anchor cable, an additional frictional shear stress term induced by curvature is introduced for the curved anchor cable, and a subsequent analysis of stress redistribution is carried out under different curvature, load, and anchorage length conditions. The following assumptions are made during the derivation:
  • The material and interface are all ideal linear elasticity; the constitutive structure of the anchor cable and grout obeys Hooke’s law, and the interface between the anchor cable and grout is assumed to be perfectly bonded, without slip (for the bending anchor cable, its bending friction follows Coulomb’s law of friction).
  • The contact pressure between the grouting body and the steel strand is always perpendicular to the contact surface.
  • The load condition is static end loading, and the initial stress field is uniform. For the bending cable, the bending radius is constant along the anchorage section, and the friction effect is uniformly distributed. This constant-curvature assumption is an idealized simplification. In actual engineering practice, the anchor cable shape often exhibits a wavy configuration (Figure 1), but the cable segments between adjacent isolation supports (spaced at 2.0 m intervals) can be approximated as arcs with nearly constant curvature. The model is applicable to cases with uniformly curved or gently varying curvature, while its applicability is limited to scenarios involving sharp bends or significant curvature variations.
Under the above engineering background and hypothesis conditions, in order to reveal the stress distribution law and load transfer mechanism of the anchor cable in a straight line and bending state quantitatively, the distribution models of axial force and shear stress along the anchorage section with different anchor cable shapes are established.

3.1. Linear Anchor Cable Distribution Model

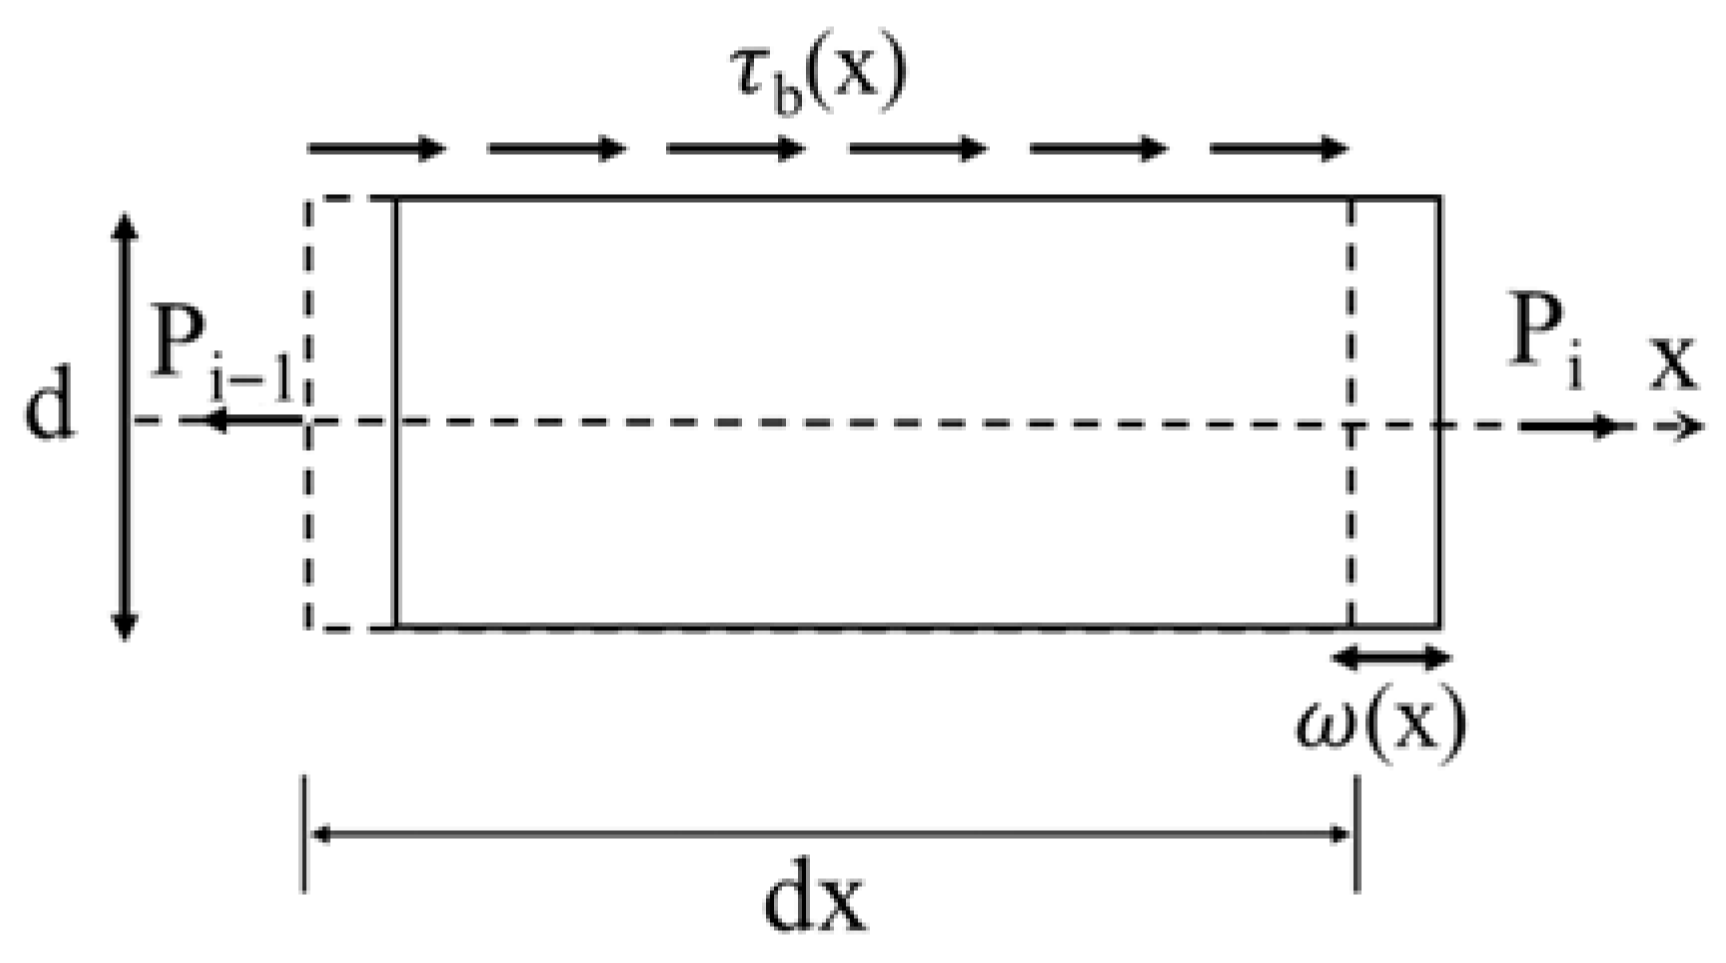
The anchorage section is discretized, as shown in Figure 2, and the lateral resistance acting on each section is uniformly distributed, which can be obtained from the balance of forces and Hooke’s law [21]:
d P d x = π d τ b ( x )
d ω ( x ) d x = P ( x ) E s A s
where P ( x ) is the axial force of the anchor cable, ω ( x ) is the shear displacement between the anchor cable and the grout, τ b ( x ) is the bond shear stress between the anchor cable and the grout, E s is the modulus of elasticity of the anchor cable, A s is the cross-sectional area of the anchor cable, and d is the diameter of the anchor cable.
Assuming that the shear action of the grout on the anchor cable is a continuous elastic medium, there is a linear transfer function [22]:
τ b ( x ) = k ω ( x )
where k = 2 π G g ln ( D / d ) , G g is the shear modulus of grouting, and D is the diameter of the borehole.
Let β 2 = π d k E s A s , first take the derivative of Equation (2), and then combine the result with Equations (1) and (3) to obtain
d 2 ω d x 2 β 2 ω ( x ) = 0
The general solution of the above second-order homogeneous differential equation is
ω ( x ) = A cosh ( β x ) + B sinh ( β x )
Taking the boundary condition, at the proximal end of the anchoring section ( x = 0 ) , the axial force of the anchor cable is equal to the applied load P 0 , and at the distal end of the anchoring section ( x = L ) , the axial force of the anchor cable is equal to 0. By substituting the boundary conditions into the combined Equation (1), the distribution formula of the axial force of the linear anchor cable can be obtained [22]:
P ( x ) = P 0 sinh [ β ( L x ) ] sinh ( β L )
Correspondingly, the formula of shear stress distribution between the linear anchor cable and grout is [22]
τ b ( x ) = β P 0 π d cosh [ β ( L x ) ] sinh ( β L )
Above is the linear cable calculation model as a comparison model to discuss the bending model of the stress distribution law.

3.2. Bending Anchor Cable Distribution Model

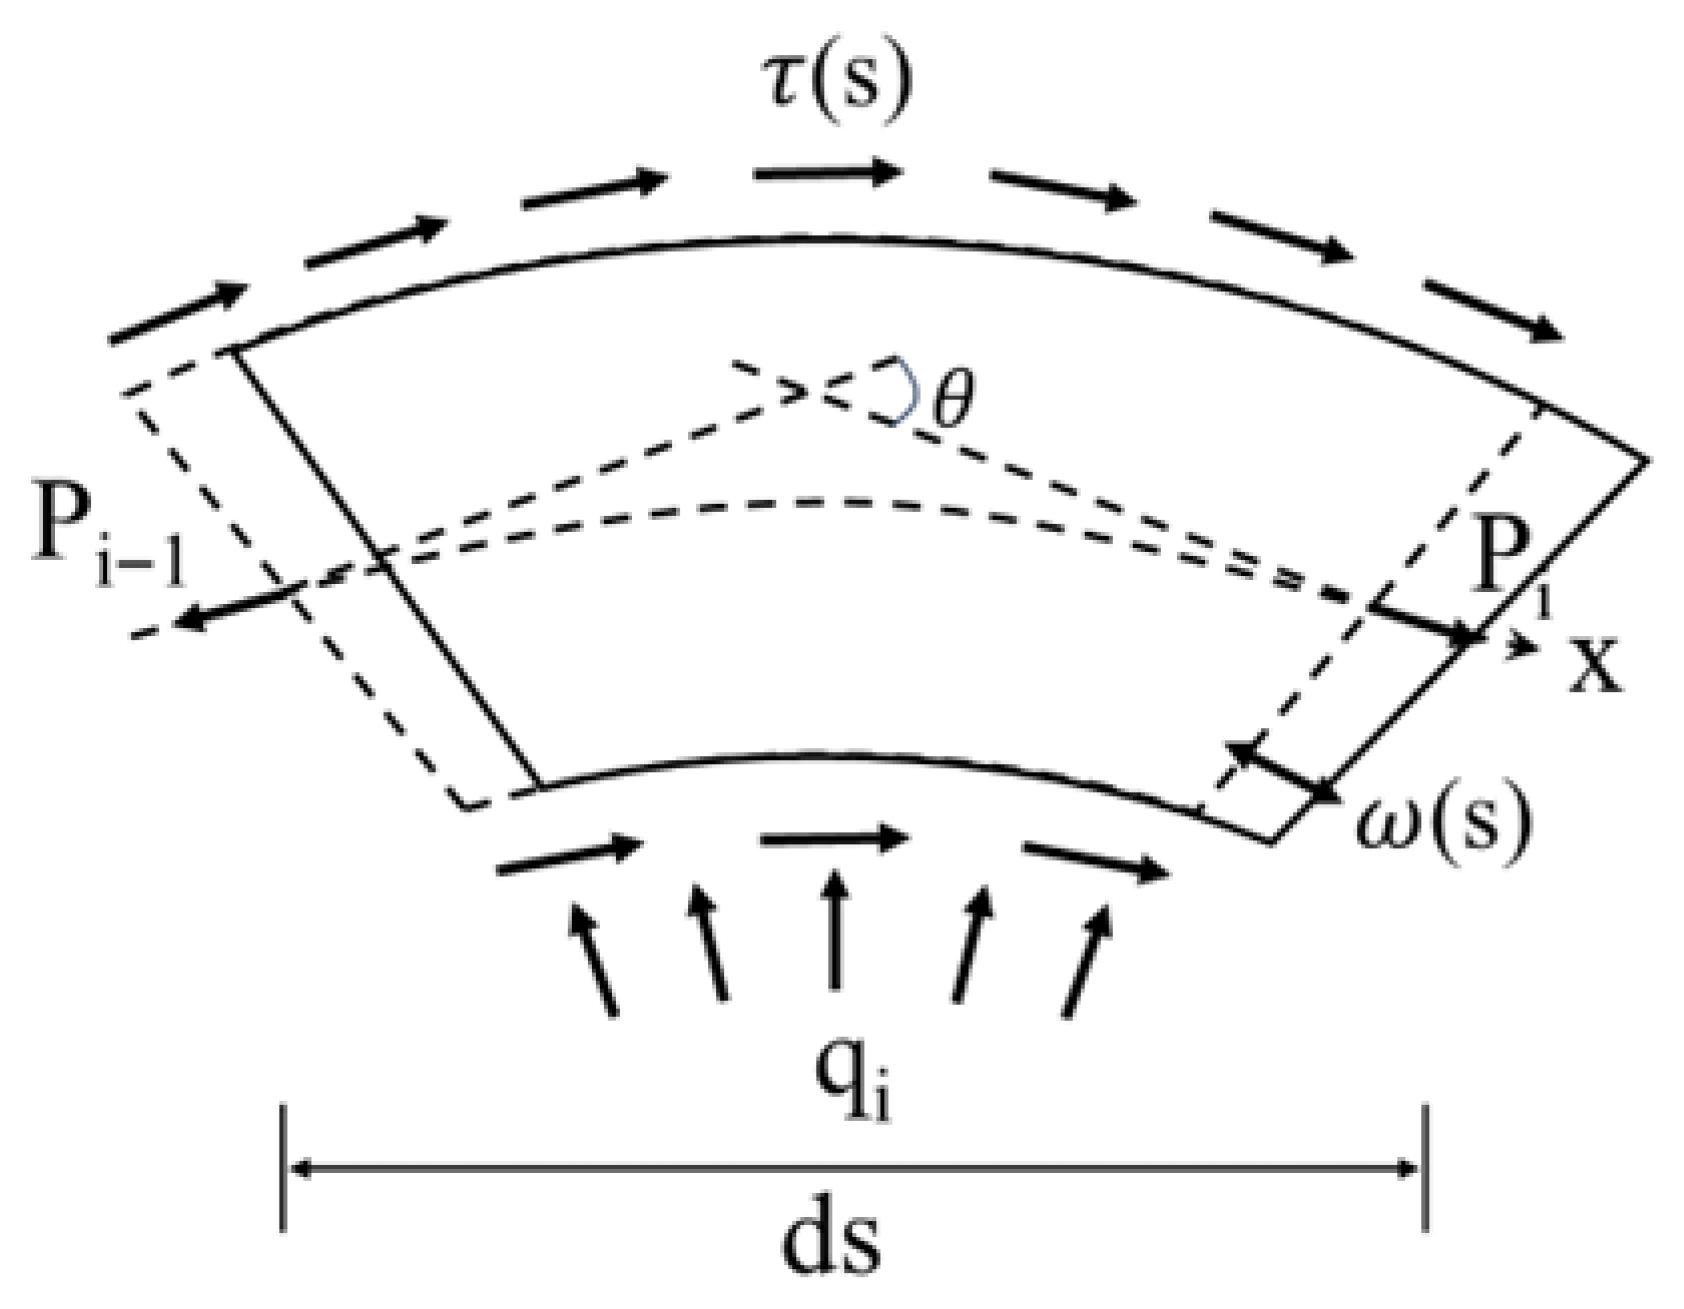
Same as the linear model, the anchorage section is discretized, and the bending micro-section is obtained by taking any micro-element as shown in Figure 3. According to Equations (1) and (2), it can be known that
d P ( s ) d s = π d τ ( s )
d w ( s ) d s = P ( s ) E s A s
where s is the bending anchor cable arc length.
Because the additional stress q i = P R will be generated by the bending of the anchor cable [23], and the contact surface between the bending anchor cable and the grout is assumed to be a continuous and regular bending surface, the frictional shear stress generated by the additional stress is uniformly distributed. The total shear stress can be divided into two components: the original bond shear stress τ b ( s ) and the frictional shear stress τ f ( s ) induced by the additional stress. Thus, the relationship can be expressed as
τ ( s ) = τ b ( s ) + τ f ( s ) = k w ( s ) + μ P ( s ) π d R
where R is the bending radius corresponding to the curved arc segment, and μ is the friction coefficient at the interface between the anchor cable and the grouting body. According to reference [24], the interfacial friction coefficient generally ranges from 0.25 to 0.4. Since the composition of the grouting material in this paper is similar to that in the reference, based on test data and back-calculation, the friction coefficient can be taken as 0.35.
Combining Equations (8)–(10) yields the following differential equation:
d 2 P d s 2 + μ R d P d s β 2 P ( s ) = 0
The general solution to the above second-order homogeneous equation is
P ( s ) = A e r 1 s + B e r 2 s
Let α = μ 2 R and γ = α 2 + β 2 . Taking the boundary condition at the proximal end of the anchorage section ( s = 0 ) , the axial force of the anchor cable is equal to the applied load P 0 , and at the distal end of the anchorage section ( s = Q ) , the axial force of the anchor cable is equal to 0. The distribution formula of the axial force of the bending anchor cable can be obtained by simplification:
P ( s ) = P 0 e α s sinh γ ( Q s ) sinh ( γ Q )
Correspondingly, the shear stress distribution formula between the bending anchor cable and the grouting body is
τ ( s ) = P 0 e α s π d sinh ( γ Q ) γ cosh γ ( Q s ) + α sinh γ ( Q s )
When R (linear anchor cable), the formula is reduced to Equations (6) and (7).

4. Examples and Discussion

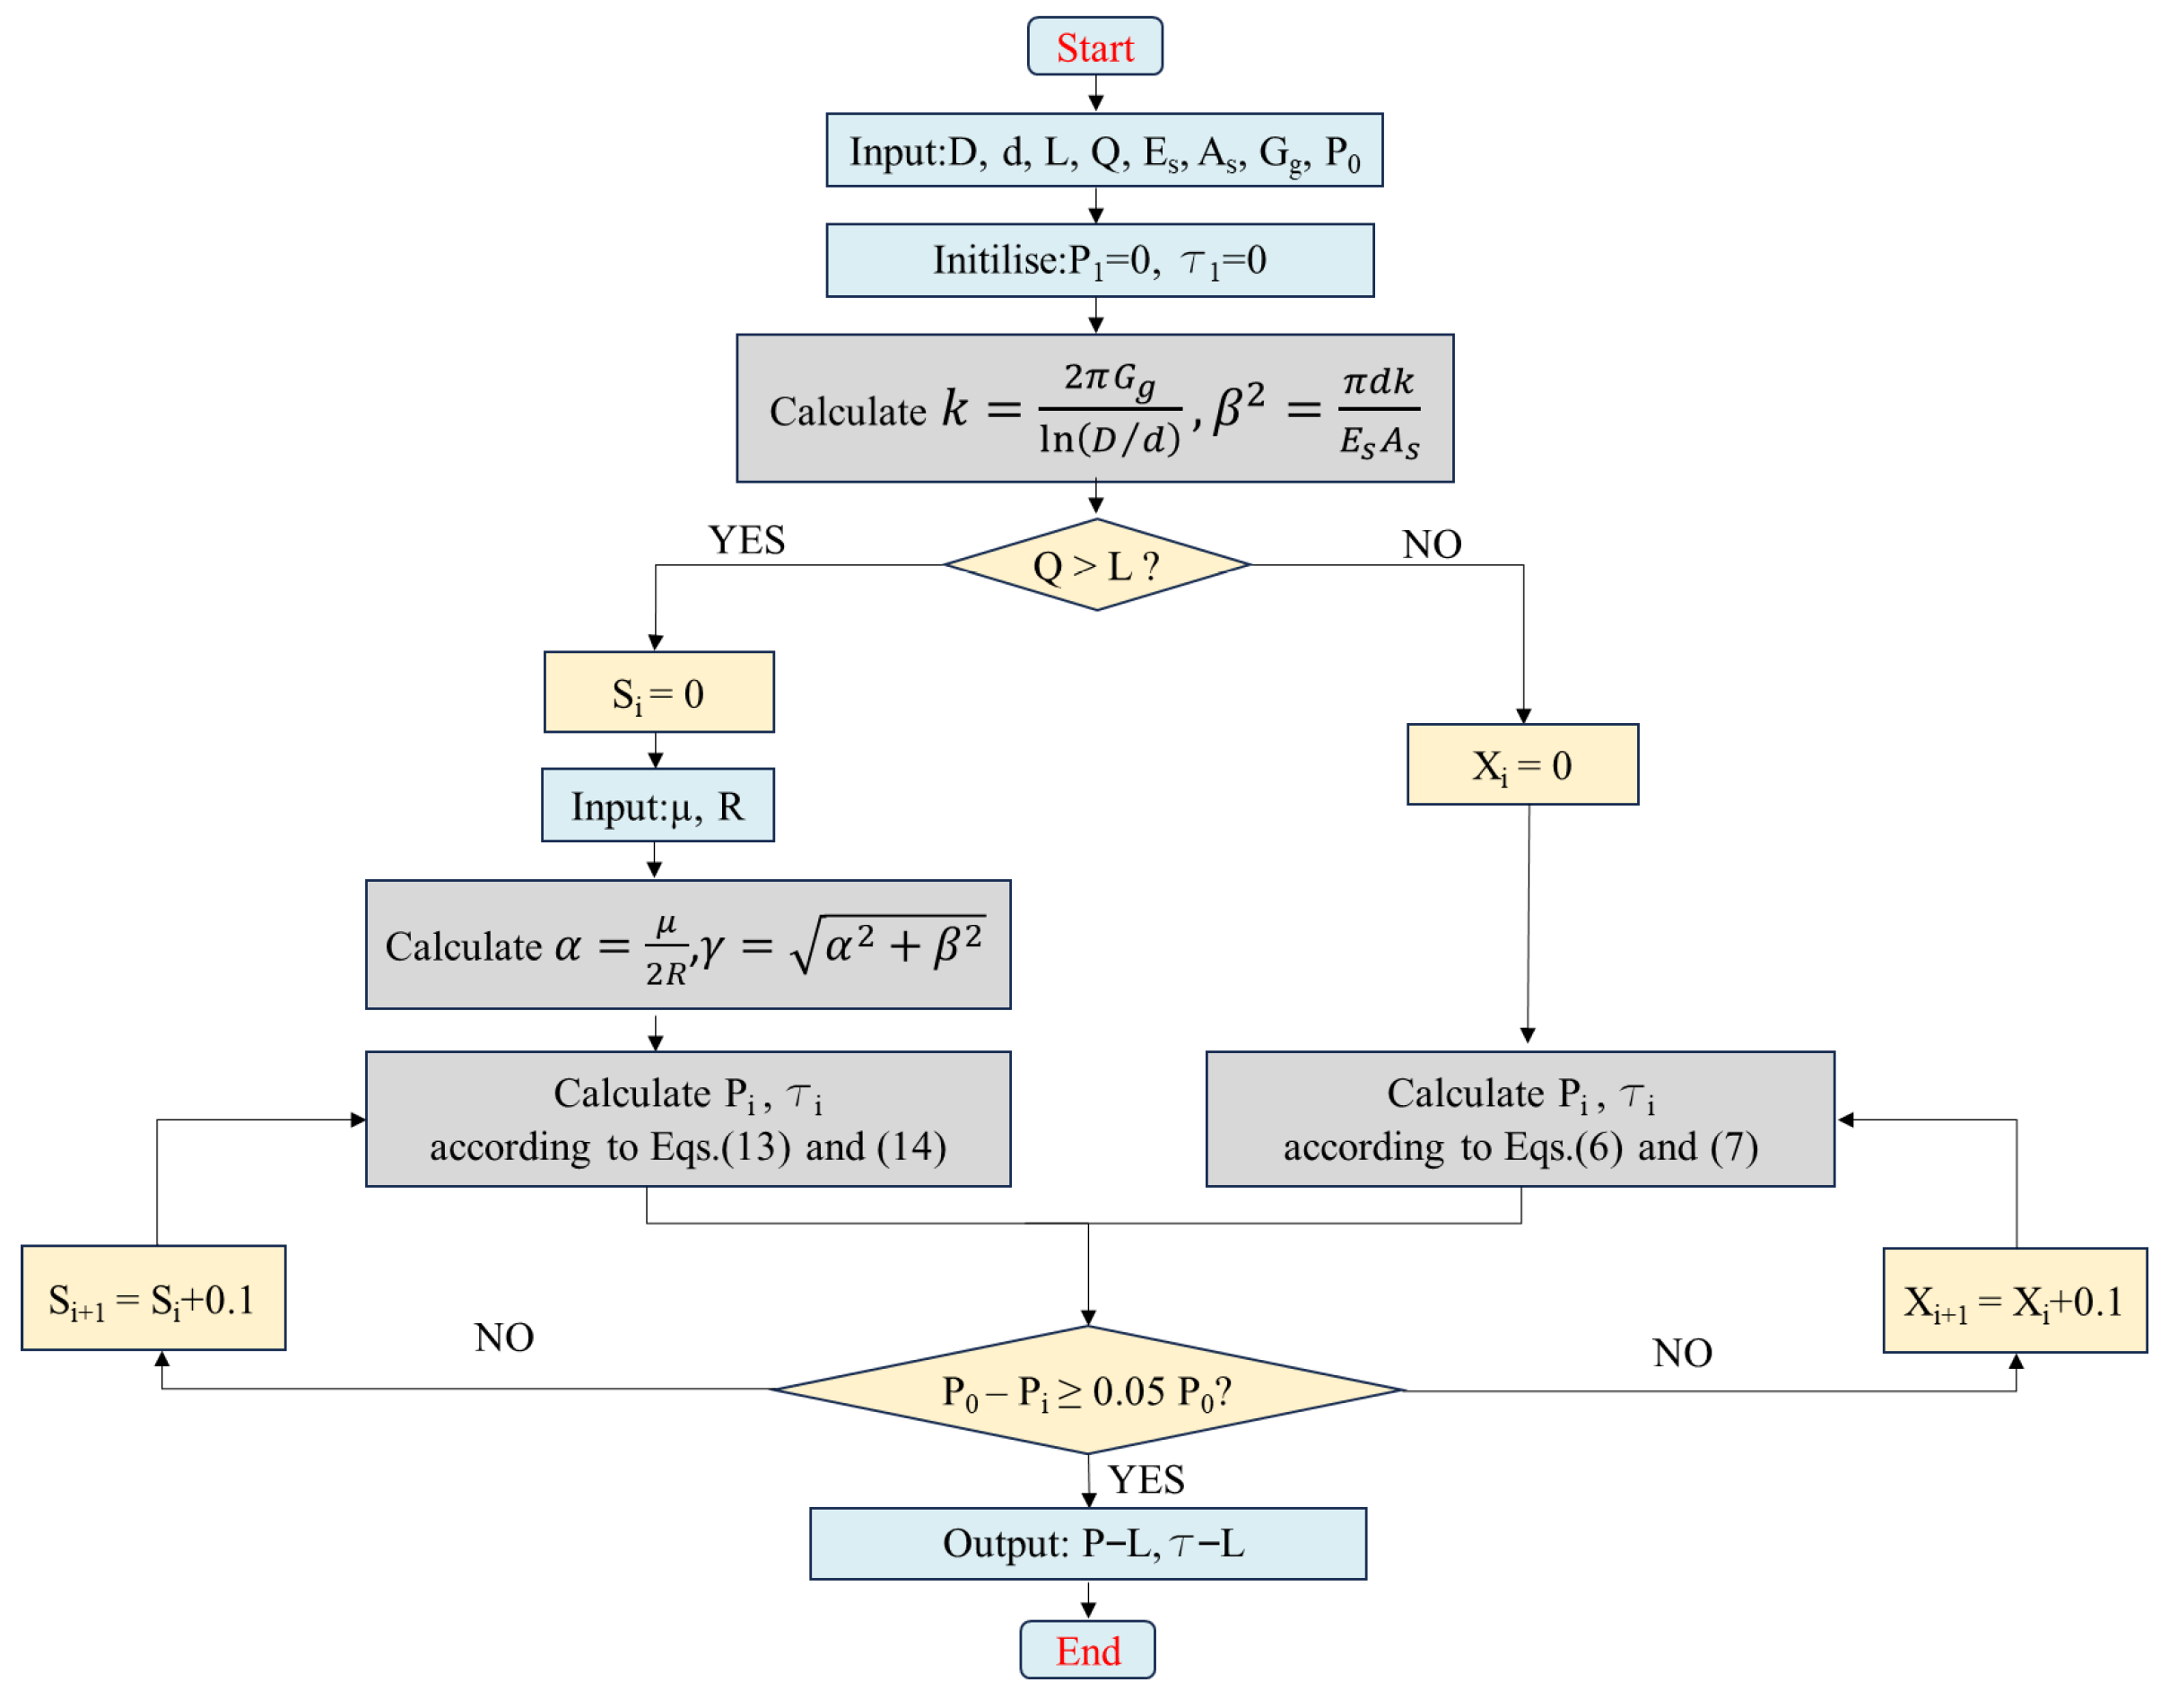
According to the deduced stress distribution model of linear and bending anchor cables, P0 = 300 kN, L = 6 m, R = 3 m, Es = 1.95 × 10⁵ MPa, As = 140 mm2, d = 15.2 mm, D = 110 mm, and K = 600 MPa/m [14]. The K value is a parameter inherited from the literature, intended to maintain comparability with existing analytical models. The distribution of axial force and shear stress in different forms of anchor cables is calculated. Since the distal end of the anchorage section is assumed to be stress-free (axial force P = 0) under ideal boundary conditions, the position where the axial force decays to 0.05P0 is defined as the effective load transfer length for comparative purposes. The calculation procedure is summarized in Figure 4.

4.1. Stress Distribution Under Different Load Conditions

Under tensile loads P0 = 100 kN, P0 = 200 kN, P0 = 300 kN, and P0 = 400 kN, the stress distribution of linear and bending anchorage cables (R = 3 m) along the length of anchorage was compared.
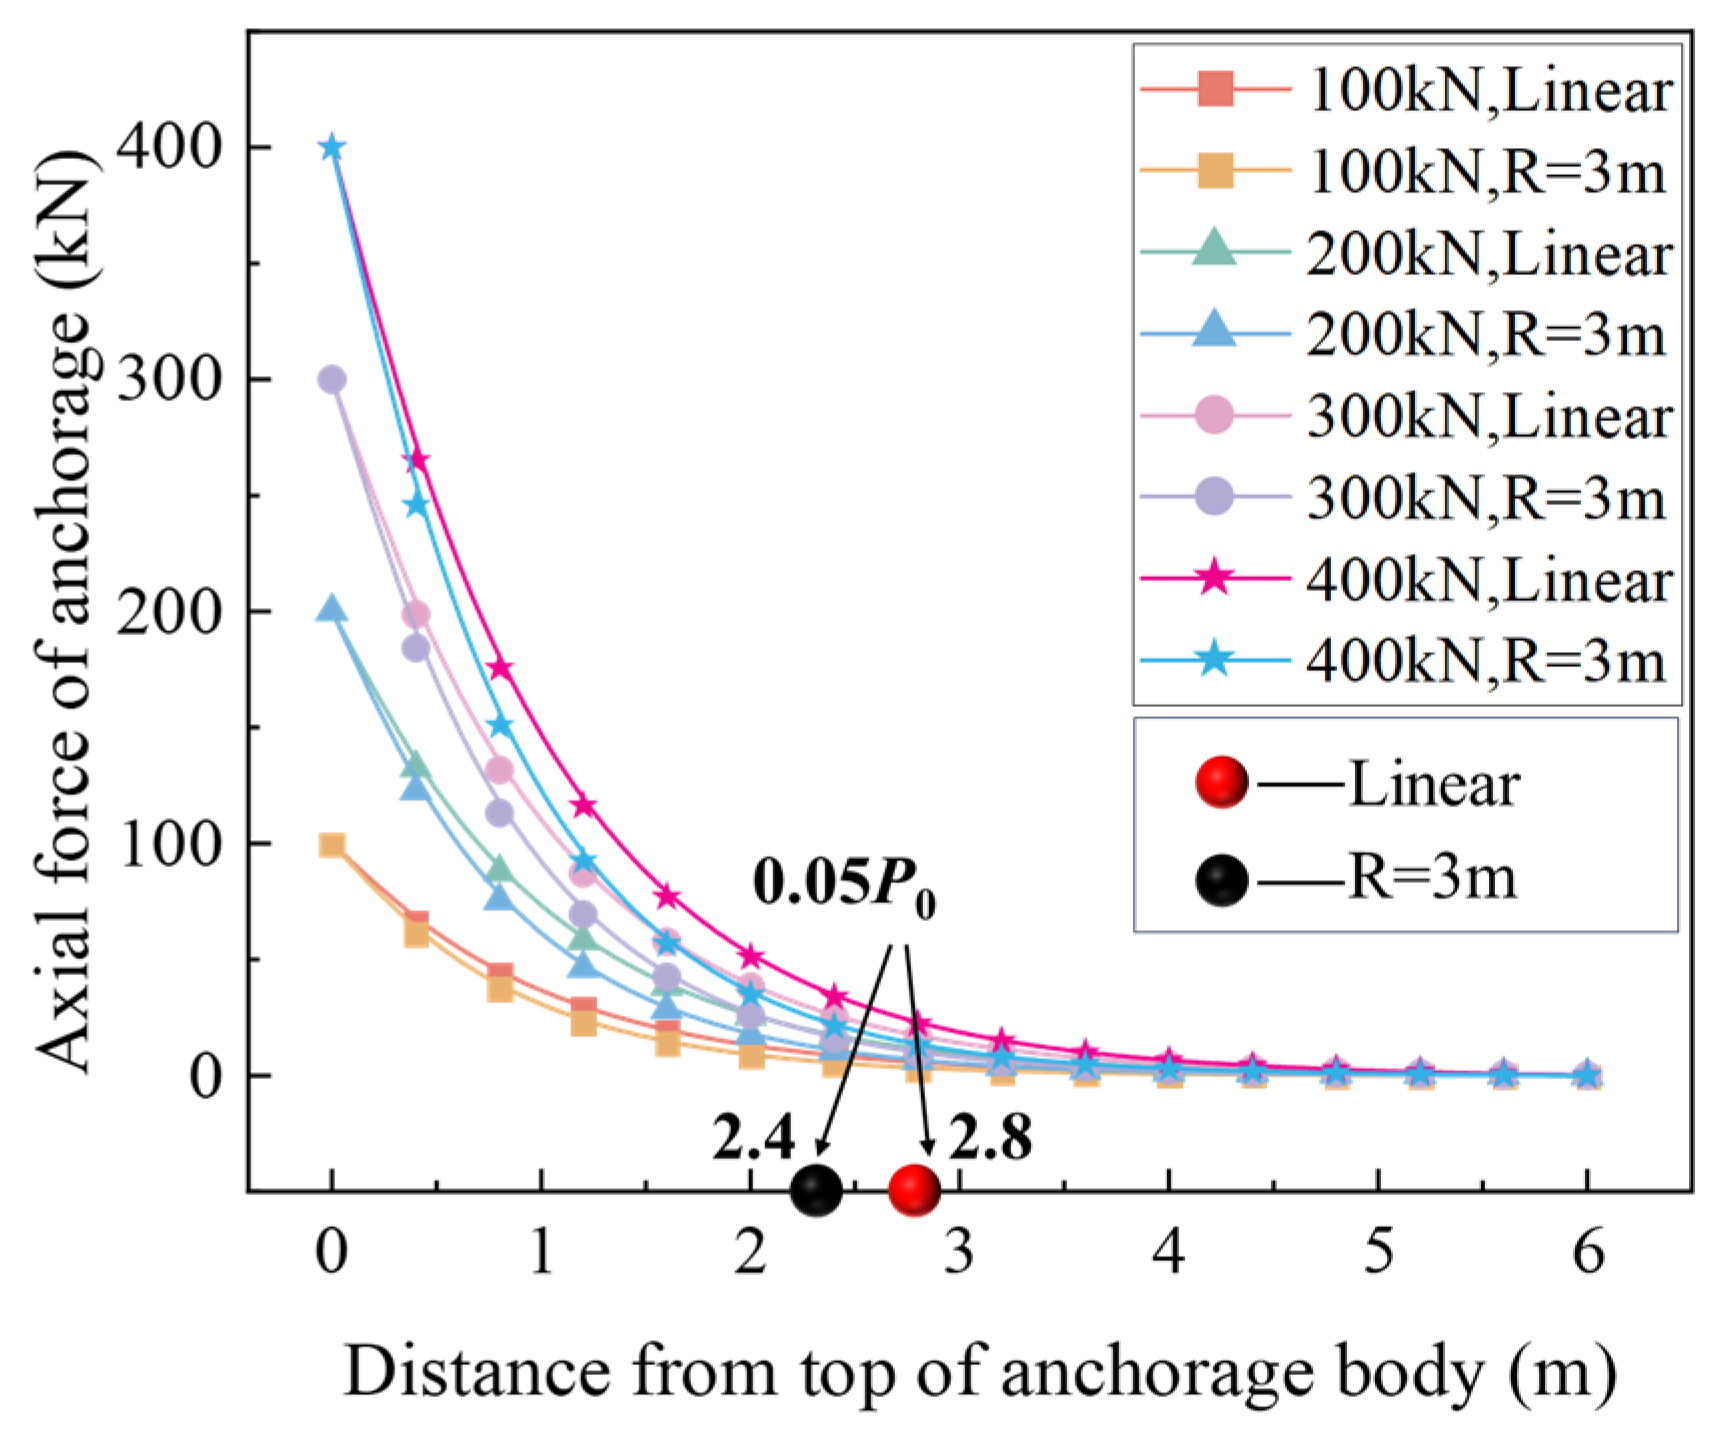
Under different load conditions, the axial force distributions of the two types of anchor cables are shown in Figure 5. The distribution of axial force along the anchorage length of the two types of anchorage cables is similar in general. Axial force peaks all appear at the proximal end of the anchorage section and monotonically attenuate along the anchorage section to the distal end and finally approach 0. This law is in line with the stress mode of typical tensile anchor cables [14]. However, there are obvious differences in the axial force attenuation process between the two. The axial force attenuation rate of the bending anchor cable is significantly higher than that of the linear anchor cable in the whole anchoring section, resulting in the axial force value at the same section being generally lower. The attenuation of the axial force of the linear anchor cable to 0.05P0 is located at 2.8 m of the anchorage section, while the corresponding position of the bending anchor cable is 2.4 m. In addition, the position of the end point of the axial force attenuation of the two types of anchor cables does not change with the increase in the load.
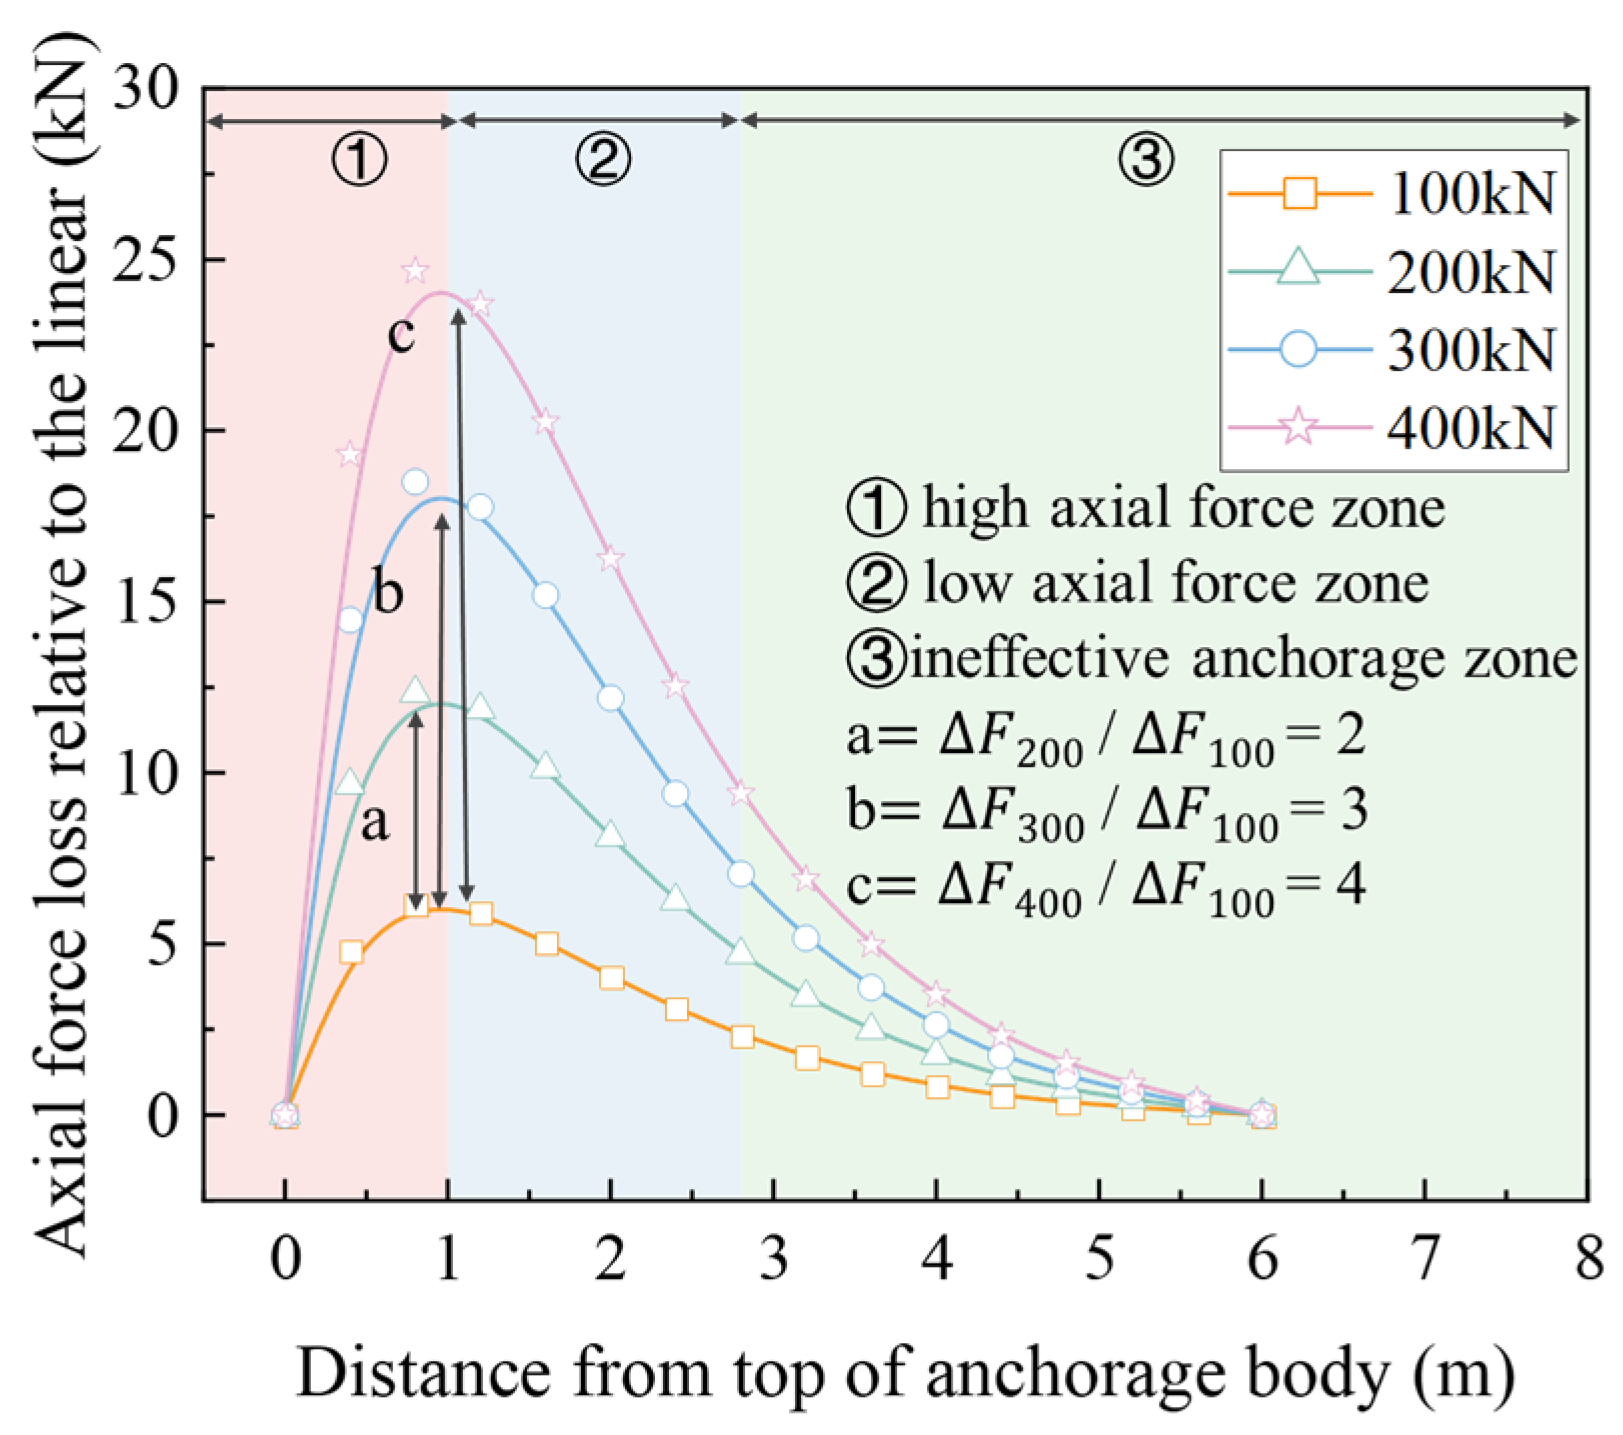
Figure 6 further shows that the axial force difference between linear and bending anchors increases rapidly at first and then converges gradually along the anchorage section. With the peak point (L = 0.9 m) and the end point of linear cable attenuation (L = 2.8 m) as the bounds, it is divided into three sections. In the high axial force region (L < 0.9 m), the additional radial stress caused by the geometric bending of the cable body significantly enhances the interface friction effect [23], which consumes a large amount of axial force, making the axial force difference between the bending anchor cable and the linear anchor cable gradually increase in this region, and the maximum value of the difference increases multiplicatively with the load. At 200 kN, 300 kN, and 400 kN loads, it is about two, three, and four times the value of the 100 kN load, respectively. In the low axial force region (0.9 m < L < 2.8 m), the contribution of the friction effect decreases rapidly, and the axial force difference between the two types of anchor cables decreases accordingly. At the ineffective anchorage zone (L > 2.8 m), the axial force difference tends to 0 in the end.
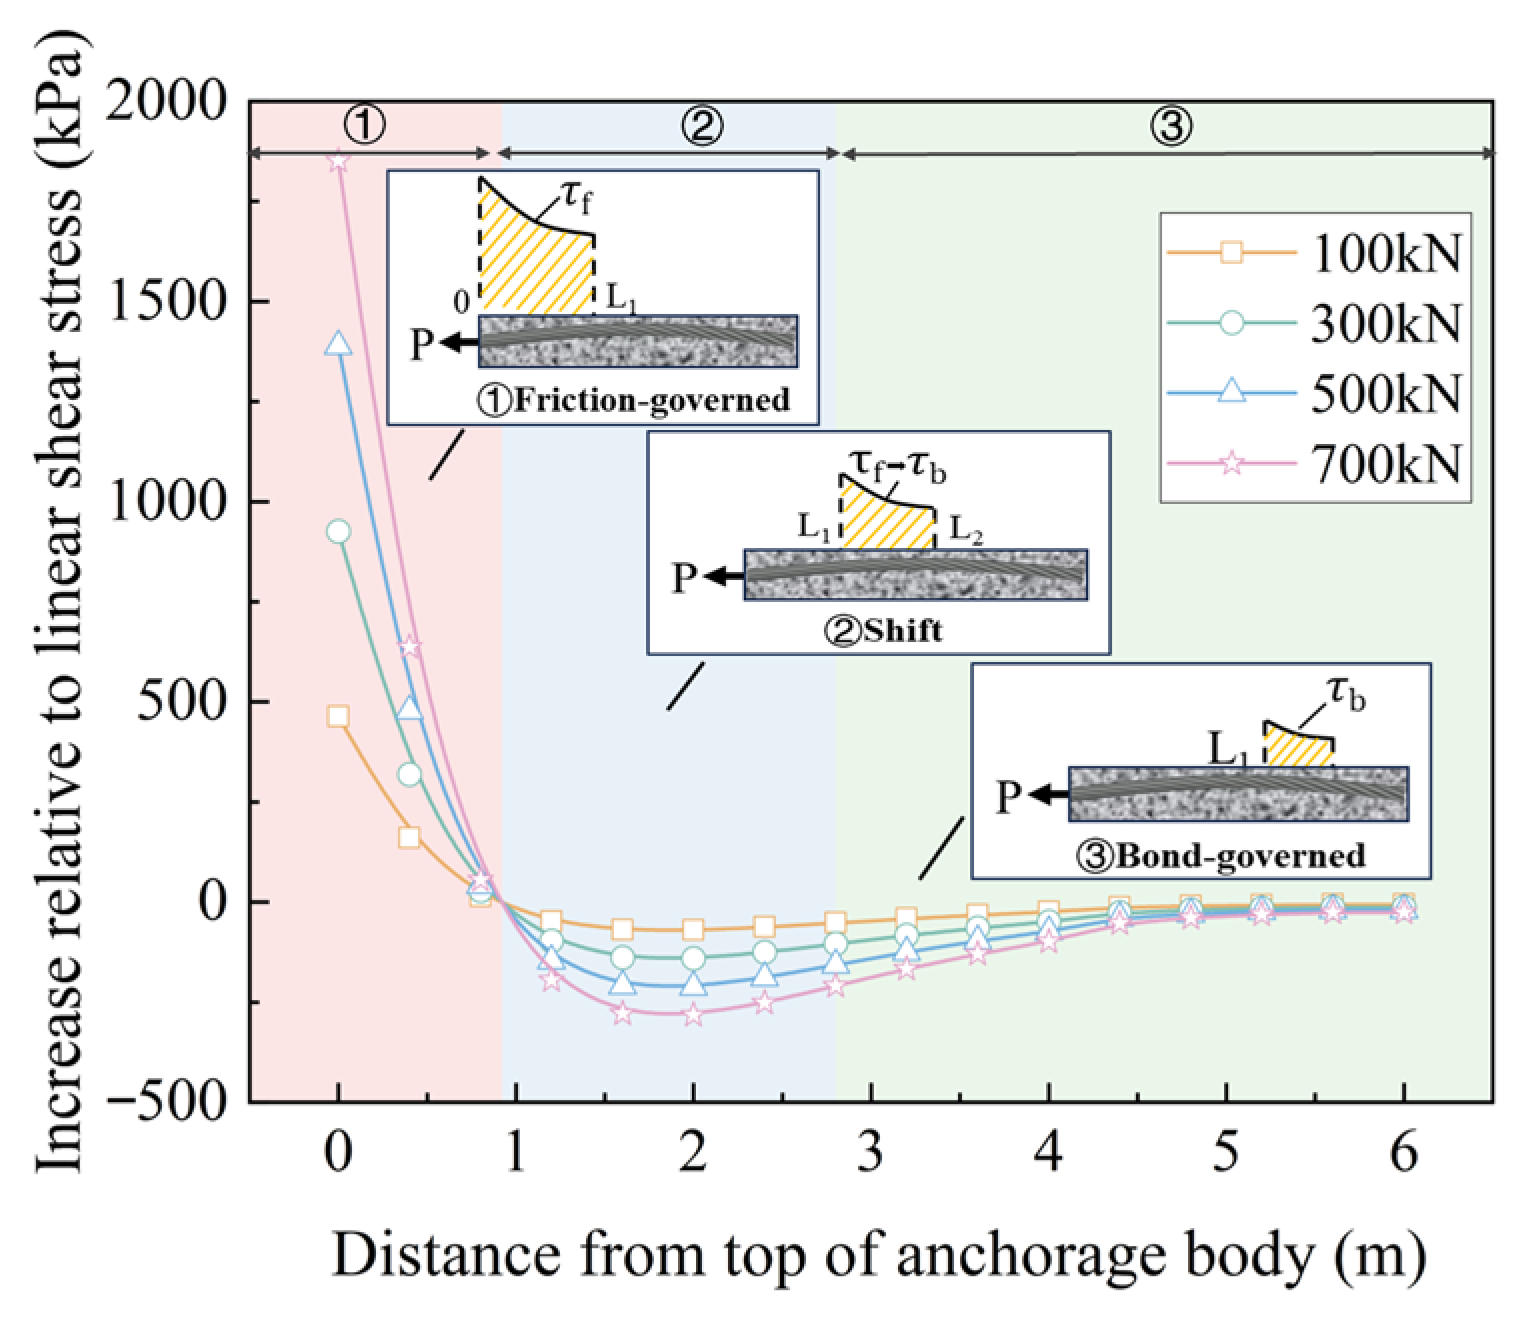
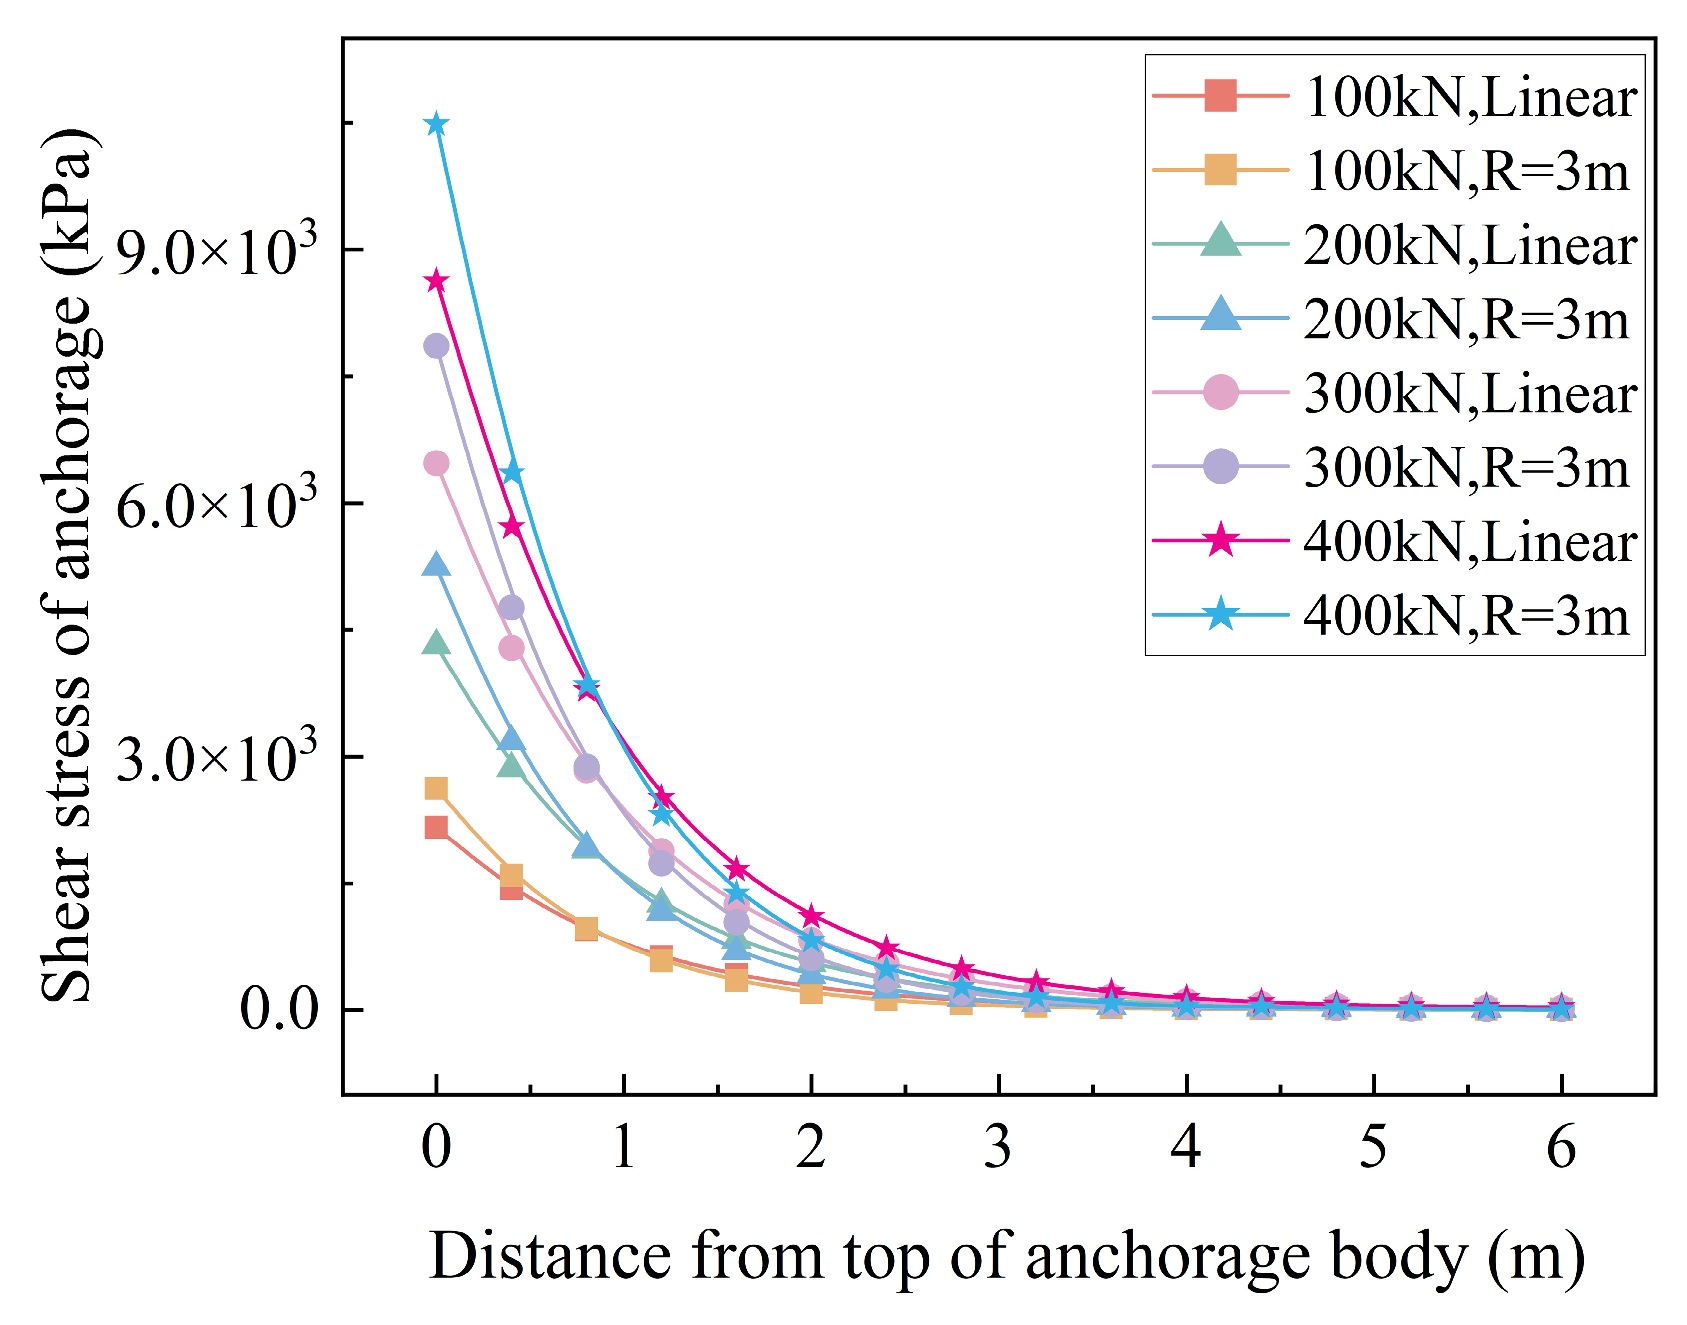
Under different load conditions, the shear stress distribution characteristics of the two types of anchor cables are shown in Figure 7. In general, the shear stress of the two types of anchor cables shows that the peak value appears at the proximal end of the anchor section and then gradually decays along the anchor section to the distal end, and finally approaches zero. This trend is in line with the typical shear stress distribution law of tensile anchor cables. Specifically, in the proximal region of the anchoring section (L < 0.9 m), the shear stress of the bending anchor cable is obviously higher than that of the linear anchor cable at the same position; when L > 0.9 m, the shear stress of the bending cable becomes lower than that of the linear cable. In order to further reveal the internal mechanism, Figure 8 compares the variation trend of the shear stress difference between the two types of anchor cables. In the range of L > 0.9 m, the difference decreases gradually with the increase in anchorage depth. The main reason is that the interface friction shear stress caused by the additional stress of the bending anchor cable is dominant; with the continuous consumption of the friction effect, the friction shear stress gradually weakens, resulting in the shear stress difference gradually converging to 0.
In the range of 0.9 m < L < 2.8 m, the shear stress difference is always negative, and shows a nonlinear change, increasing first and then decreasing. This phenomenon can be explained by the fact that with the axial force transfer along the anchorage section, the interface friction effect gradually weakens, and the shear stress mechanism is gradually transformed from friction-dominated to bonding-dominated. When the difference reaches the minimum value, the influence of friction shear stress basically disappears. At this time, the shear stress of the two types of anchor cables is mainly controlled by the bonding effect. After entering the ineffective anchorage zone of L > 2.8 m, the shear stress difference between the two types of anchorage cables finally approaches 0, indicating that the mechanical behavior of the two types of anchorage cables tends to be the same in this zone.

4.2. Stress Distribution Under Different Anchorage Lengths

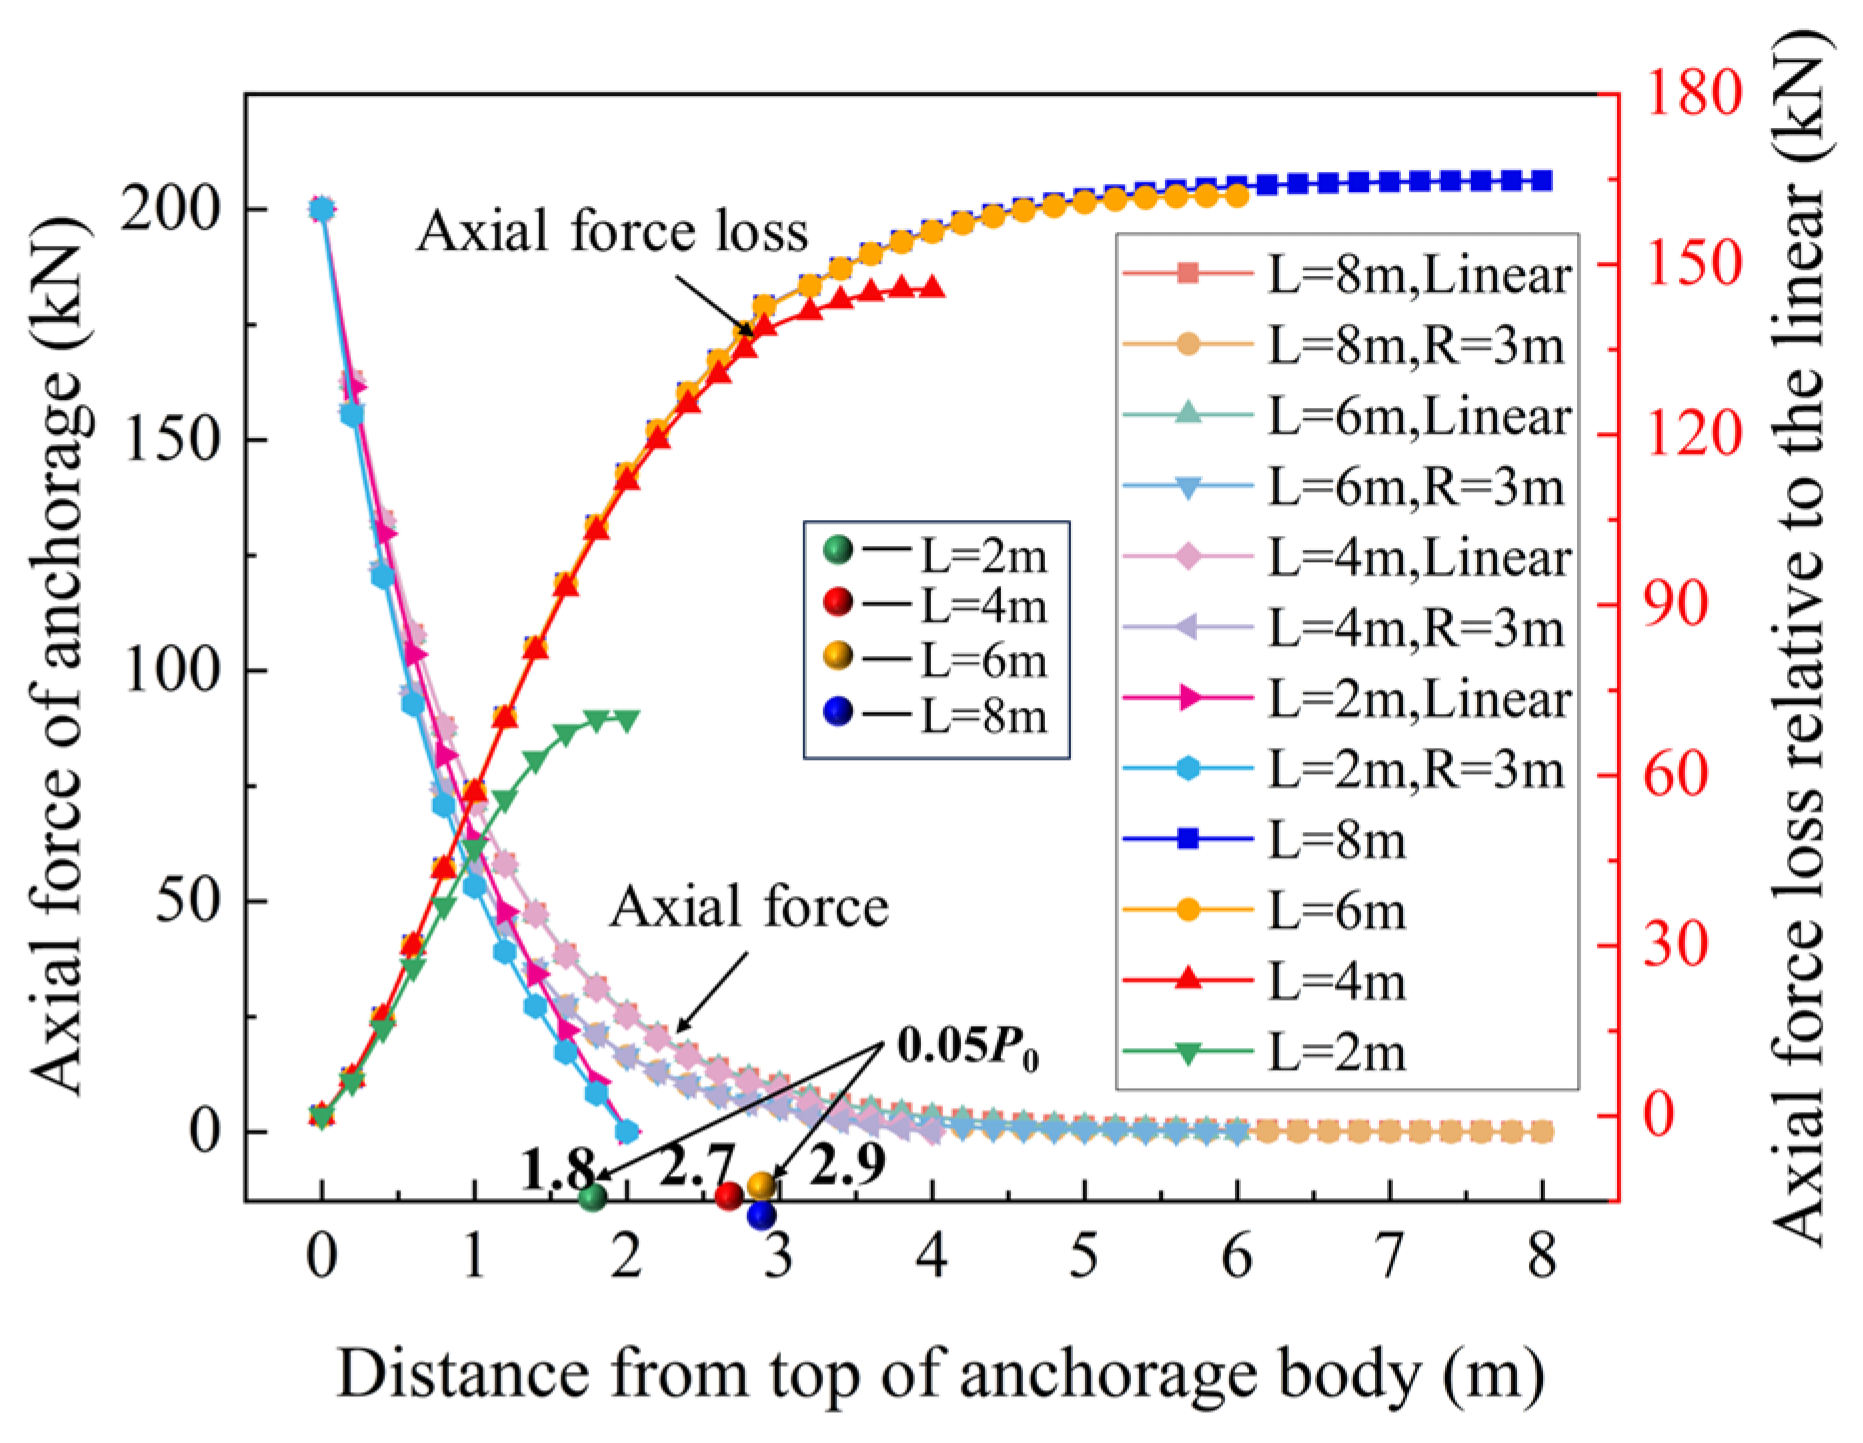
Under the conditions of different anchoring lengths (L = 2 m, 4 m, 6 m, 8 m), the axial force distribution law of the linear anchor cable and the bending anchor cable (R = 3 m) in the anchoring section is shown in Figure 9. The axial force of the two types of anchor cables attenuates non-linearly along the direction of the anchoring depth from the end of the load, and the overall distribution characteristics are consistent. However, at the same section position, the axial stress of the bending anchor cable is generally lower than that of the linear anchor cable, and the stress attenuation rate is significantly greater, indicating that the load transfer of the bending anchor cable is more concentrated, and the interface friction effect plays an important role in the near-end region.
With the increase in anchorage depth, the effective transmission depth corresponding to the axial force attenuation to 0.05P0 of the two types of anchorage cable shows a trend of delay, but the delay range gradually decreases. Specifically, when the anchorage length is 2 m, the axial force distribution covers almost the whole anchorage section. For the anchors of 6 m and 8 m, the axial force is significantly concentrated in the range of about 3 m near the loading end. The axial force attenuates rapidly after reaching the peak value at the proximal end, and the attenuation gradient gradually slows down with the increase in depth. Under the parameters of this study, corresponding to the anchorage lengths of 2 m, 4 m, 6 m, and 8 m, the depths at which the axial force decays to 0.05P0 are about 1.8 m, 2.7 m, 2.9 m, and 2.9 m, respectively. This law is consistent with the results obtained by Chen et al. [25] based on field pull-out tests. The above results reveal that the bearing capacity of the anchor cable does not increase infinitely with the increase in the anchoring depth, but there is a critical anchoring depth [26], that is, the minimum length required to achieve the complete pull-out resistance [27]. Once this critical value is exceeded, continuing to increase the anchorage depth has a very limited lifting effect on the bearing capacity [28,29]. In addition, with the increase in anchorage length, the cumulative axial force loss caused by interface friction increases significantly, and the loss is mainly concentrated in the front region of the anchorage section. Therefore, too long an anchorage length is not only economical but also may cause the axial force distribution along the depth to be significantly uneven, which is not conducive to the full use of material strength.
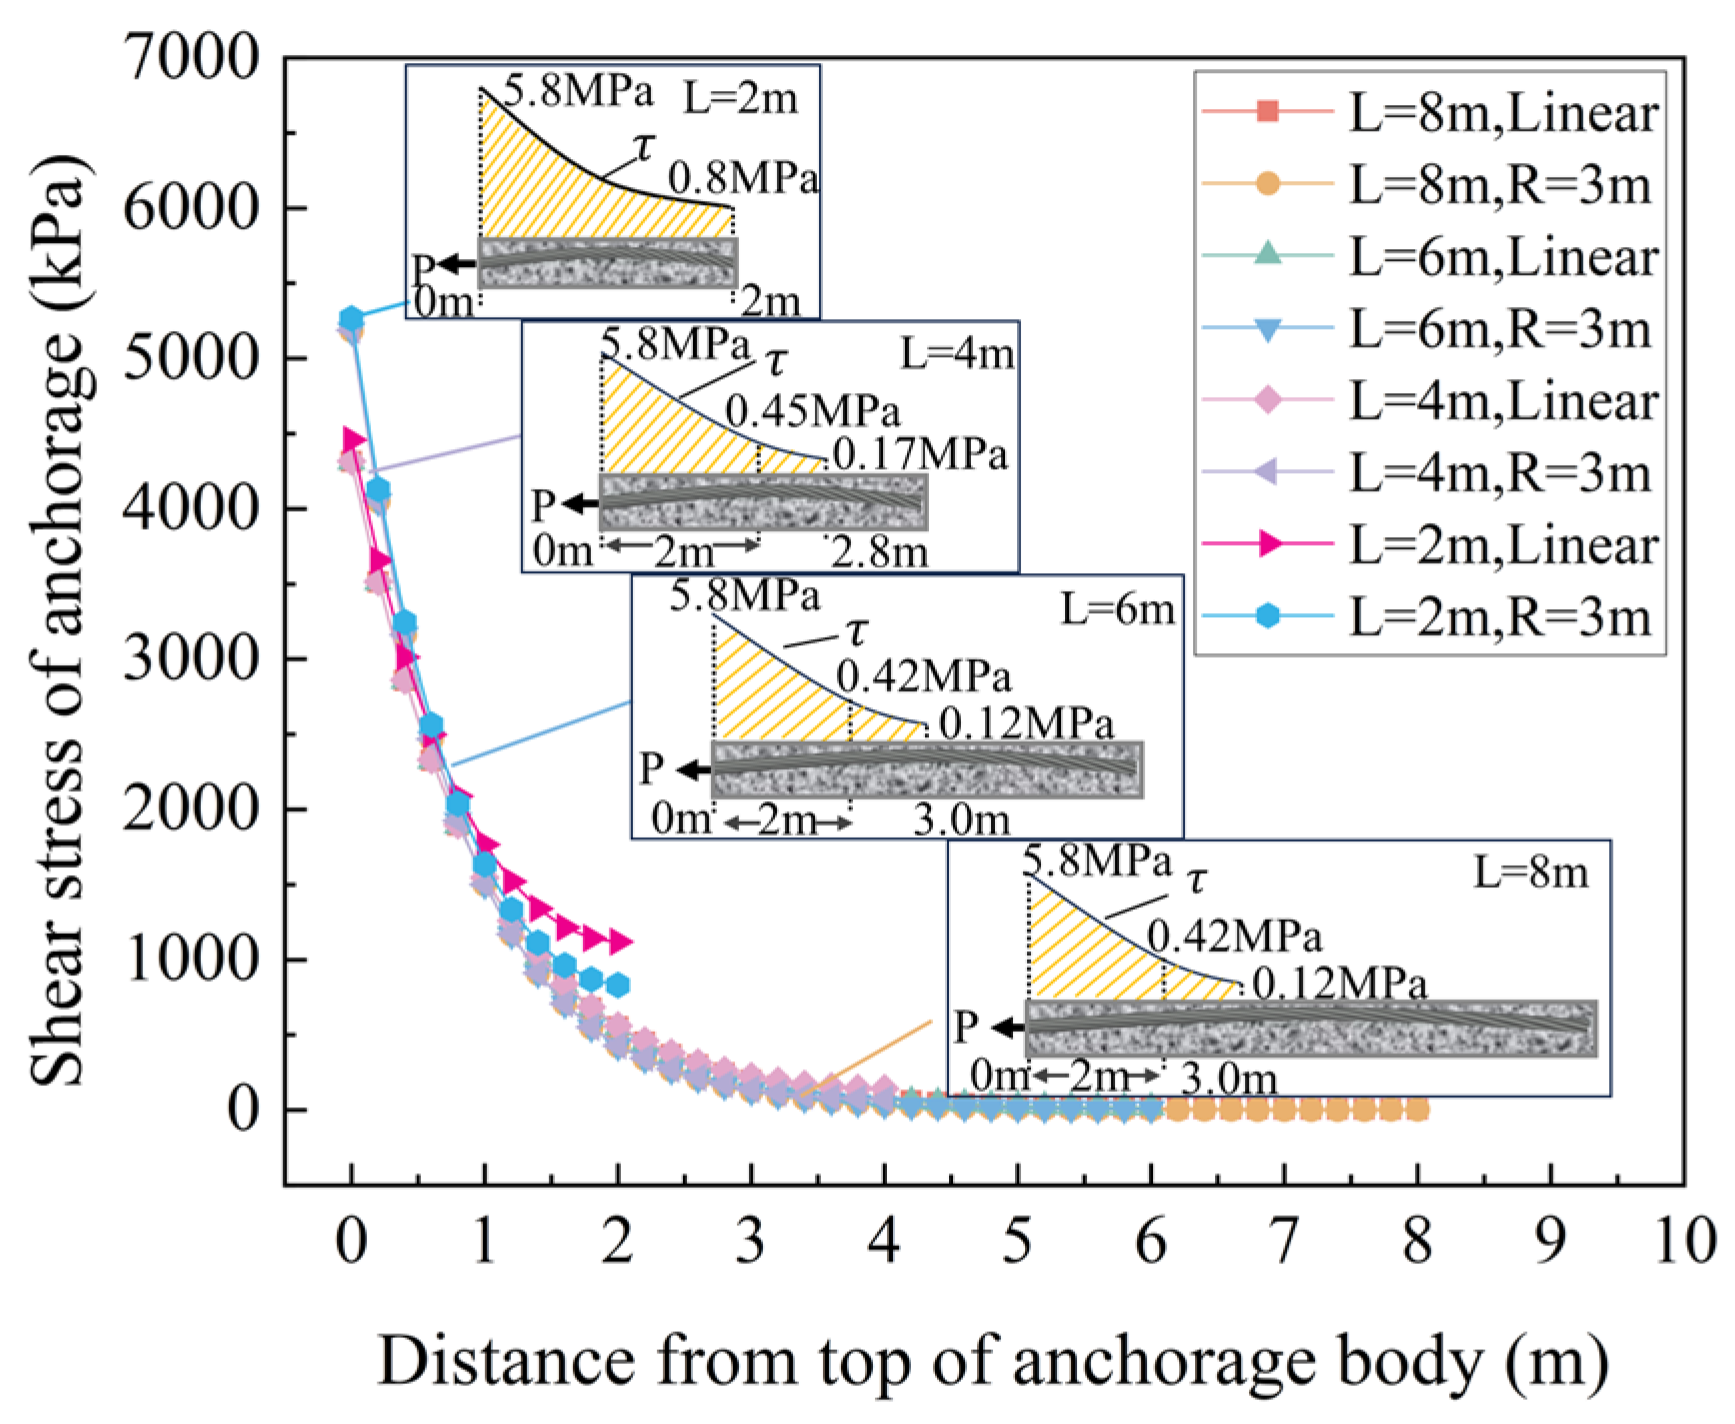
The distribution of interfacial shear stress along the anchorage depth between linear and curved anchorage cables (R = 3 m) is shown in Figure 10. In general, the shear stress of the two types of anchorage cable reaches the peak value at the top of the anchorage section (where the load is applied) and attenuates nonlinearly with the increase in depth, and finally approaches zero. In the proximal region (L < 0.9 m), the shear stress of the bending anchor cable is generally higher than that of the linear anchor cable with the same cross section, which is mainly due to the additional radial compressive stress caused by the bending anchor cable, which strengthens the interface friction effect. The difference gradually decreases with increasing depth. After 0.9 m, the shear stress of the bending cable is lower than that of the linear cable. This transition reflects that the friction loss caused by bending consumes more axial force at the proximal end, resulting in a decrease in the subsequent stress transfer level. It is worth noting that when the anchorage length is 2 m and 4 m, the utilization efficiency of the anchorage length is the highest, but the shear stress distribution is too concentrated, and the average value of shear stress is too large for the anchorage length of 2 m, which has the risk of debonding.
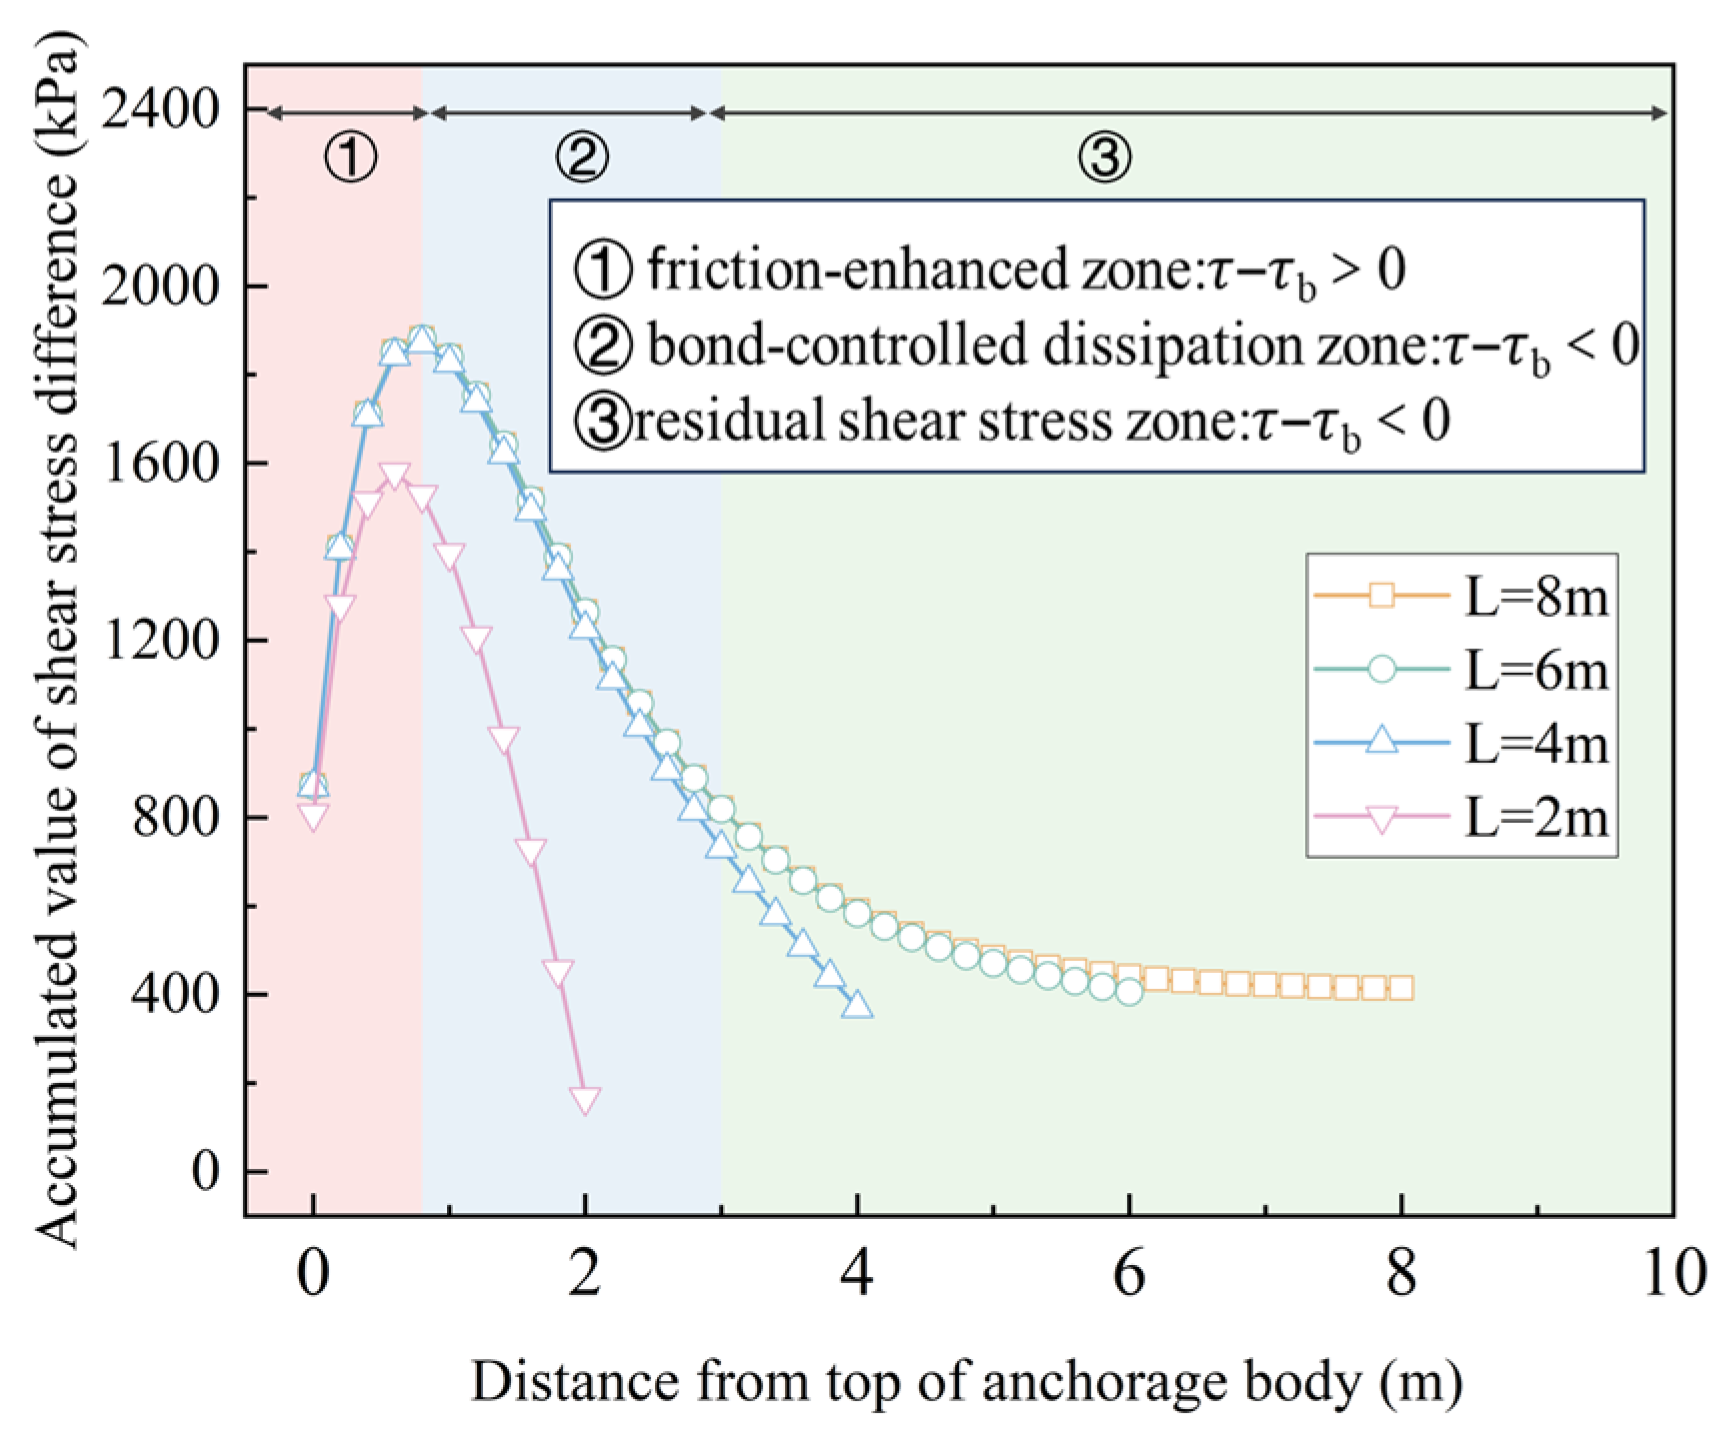
In addition, Figure 11 shows the cumulative shear stress difference as a function of anchoring depth and anchoring length. With L = 0.9 m and L = 3.0 m as the bounds, it can be divided into three characteristic stages: In the friction lifting region (L < 0.9 m), the cumulative value of shear stress difference increases continuously with depth, but the growth rate decreases gradually. This indicates that the additional frictional shear stress caused by anchor cable bending gradually weakens with the continuous dissipation of axial force along the depth, so the growth rate of the cumulative difference also slows down. In this section, the cumulative peak value increases with the increase in anchorage length, and tends to be stable when the anchorage length exceeds 4 m. In the bonding control region (0.9 m < L < 3.0 m), the cumulative value decreases with depth. At this stage, the shear stress composition of the bending anchor cable changes significantly; the contribution of friction shear stress continues to decline, and the effect of bond shear stress gradually increases, resulting in the total shear stress level of the bending anchor cable being lower than that of the linear anchor cable, so the cumulative difference decreases gradually. The above-mentioned law continues to the residual shear stress region (L > 3.0 m), and the shear stress behavior of the two types of anchor cables tends to be the same at this time.

4.3. Stress Distribution Under Different Bending Radius

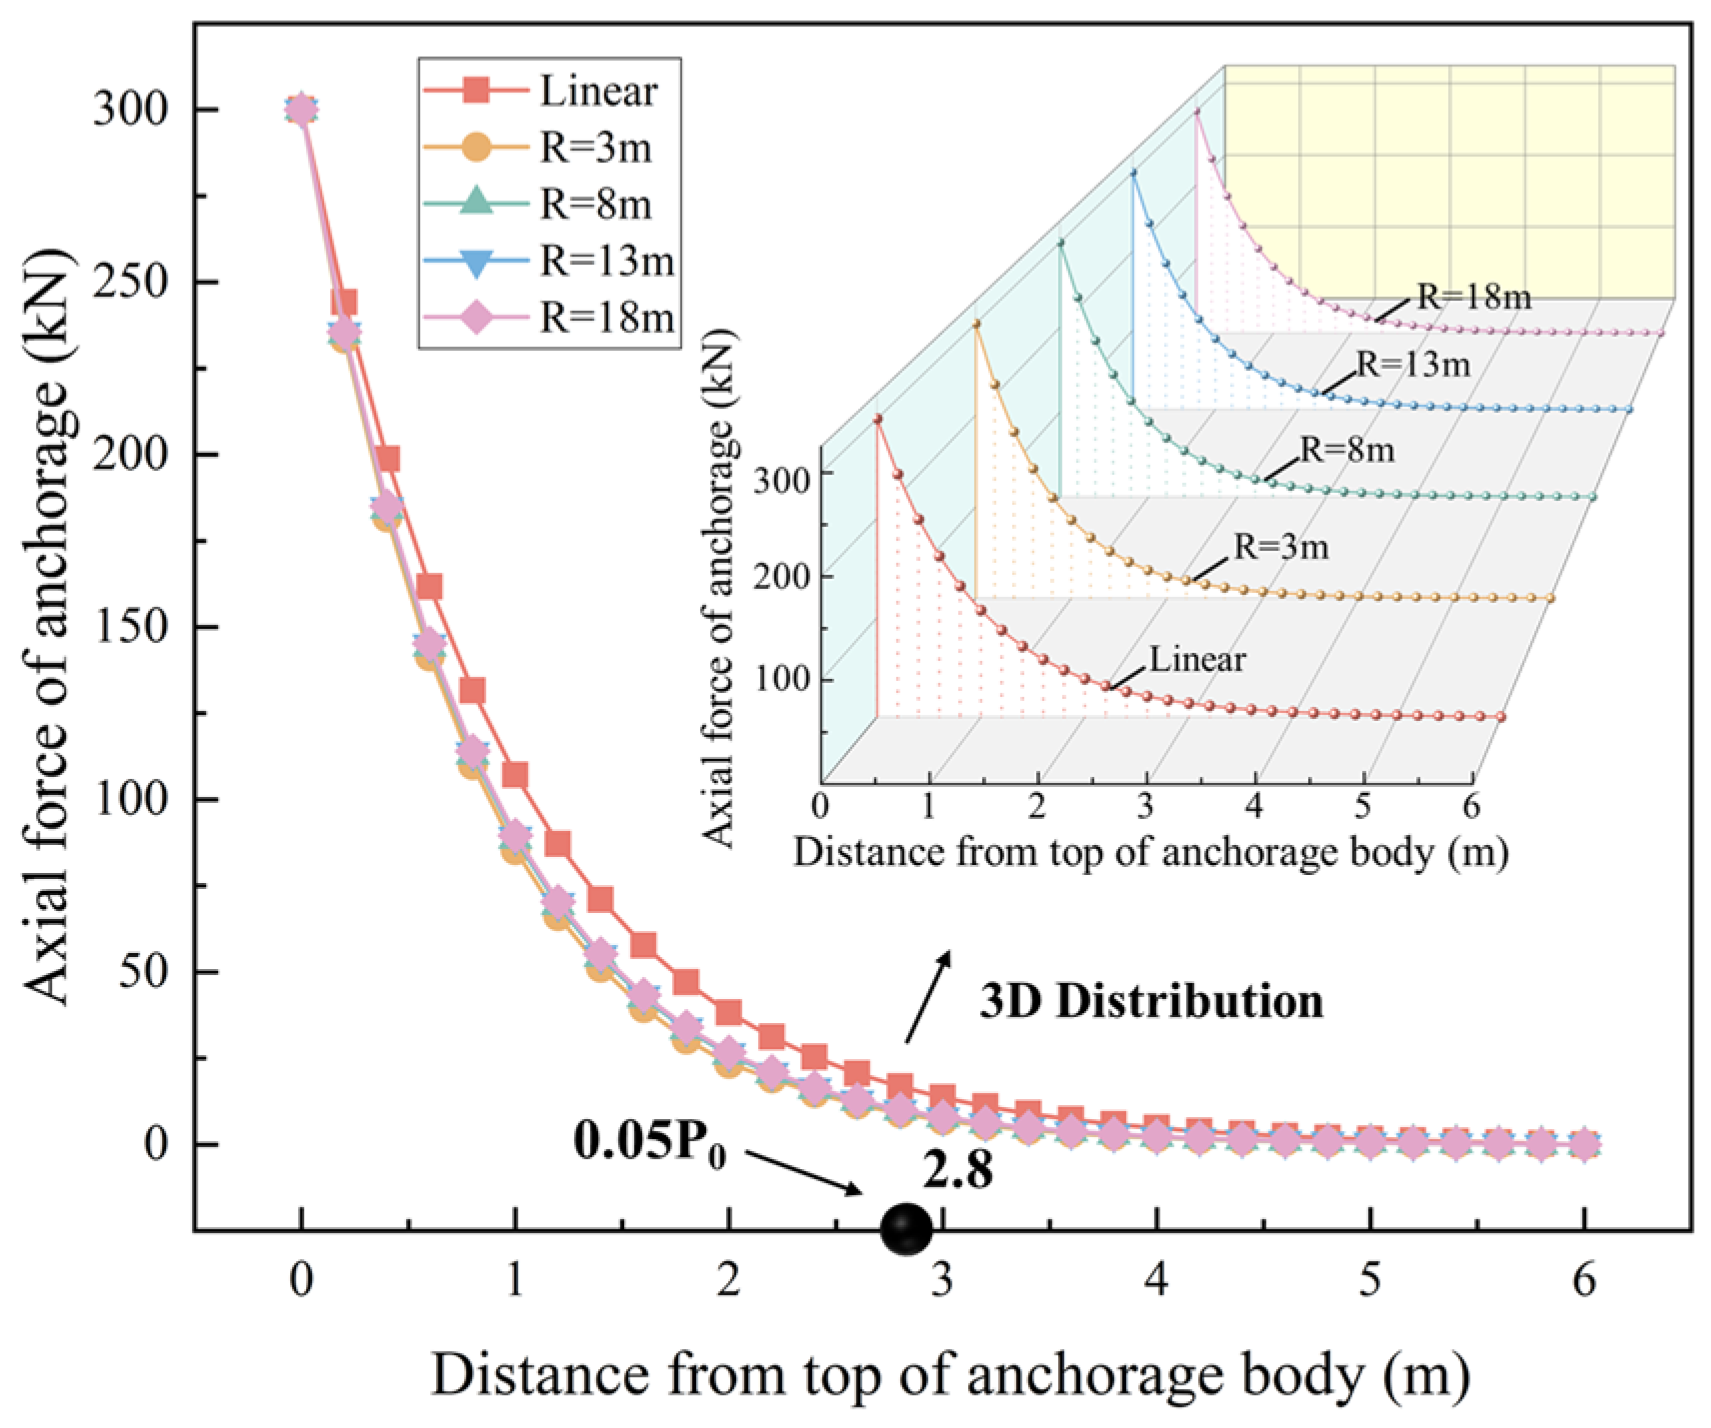
In order to explore the influence of the bending radius on the axial force distribution of the anchoring section, as shown in Figure 12, based on the established calculation parameters, the bending radius is R = 3 m, R = 8 m, R = 13 m, R = 18 m, and a linear anchor cable R , the distribution characteristics of axial force. The results show that the axial force attenuates from the end to the far end along the anchorage length under different bending radii, but the bending effect significantly changes the dynamic characteristics of the attenuation: the smaller the bending radius, the lower the axial force value at the same section, the faster the axial force attenuation rate, and the critical position of the axial force attenuation to 0.05P0 is basically unchanged.
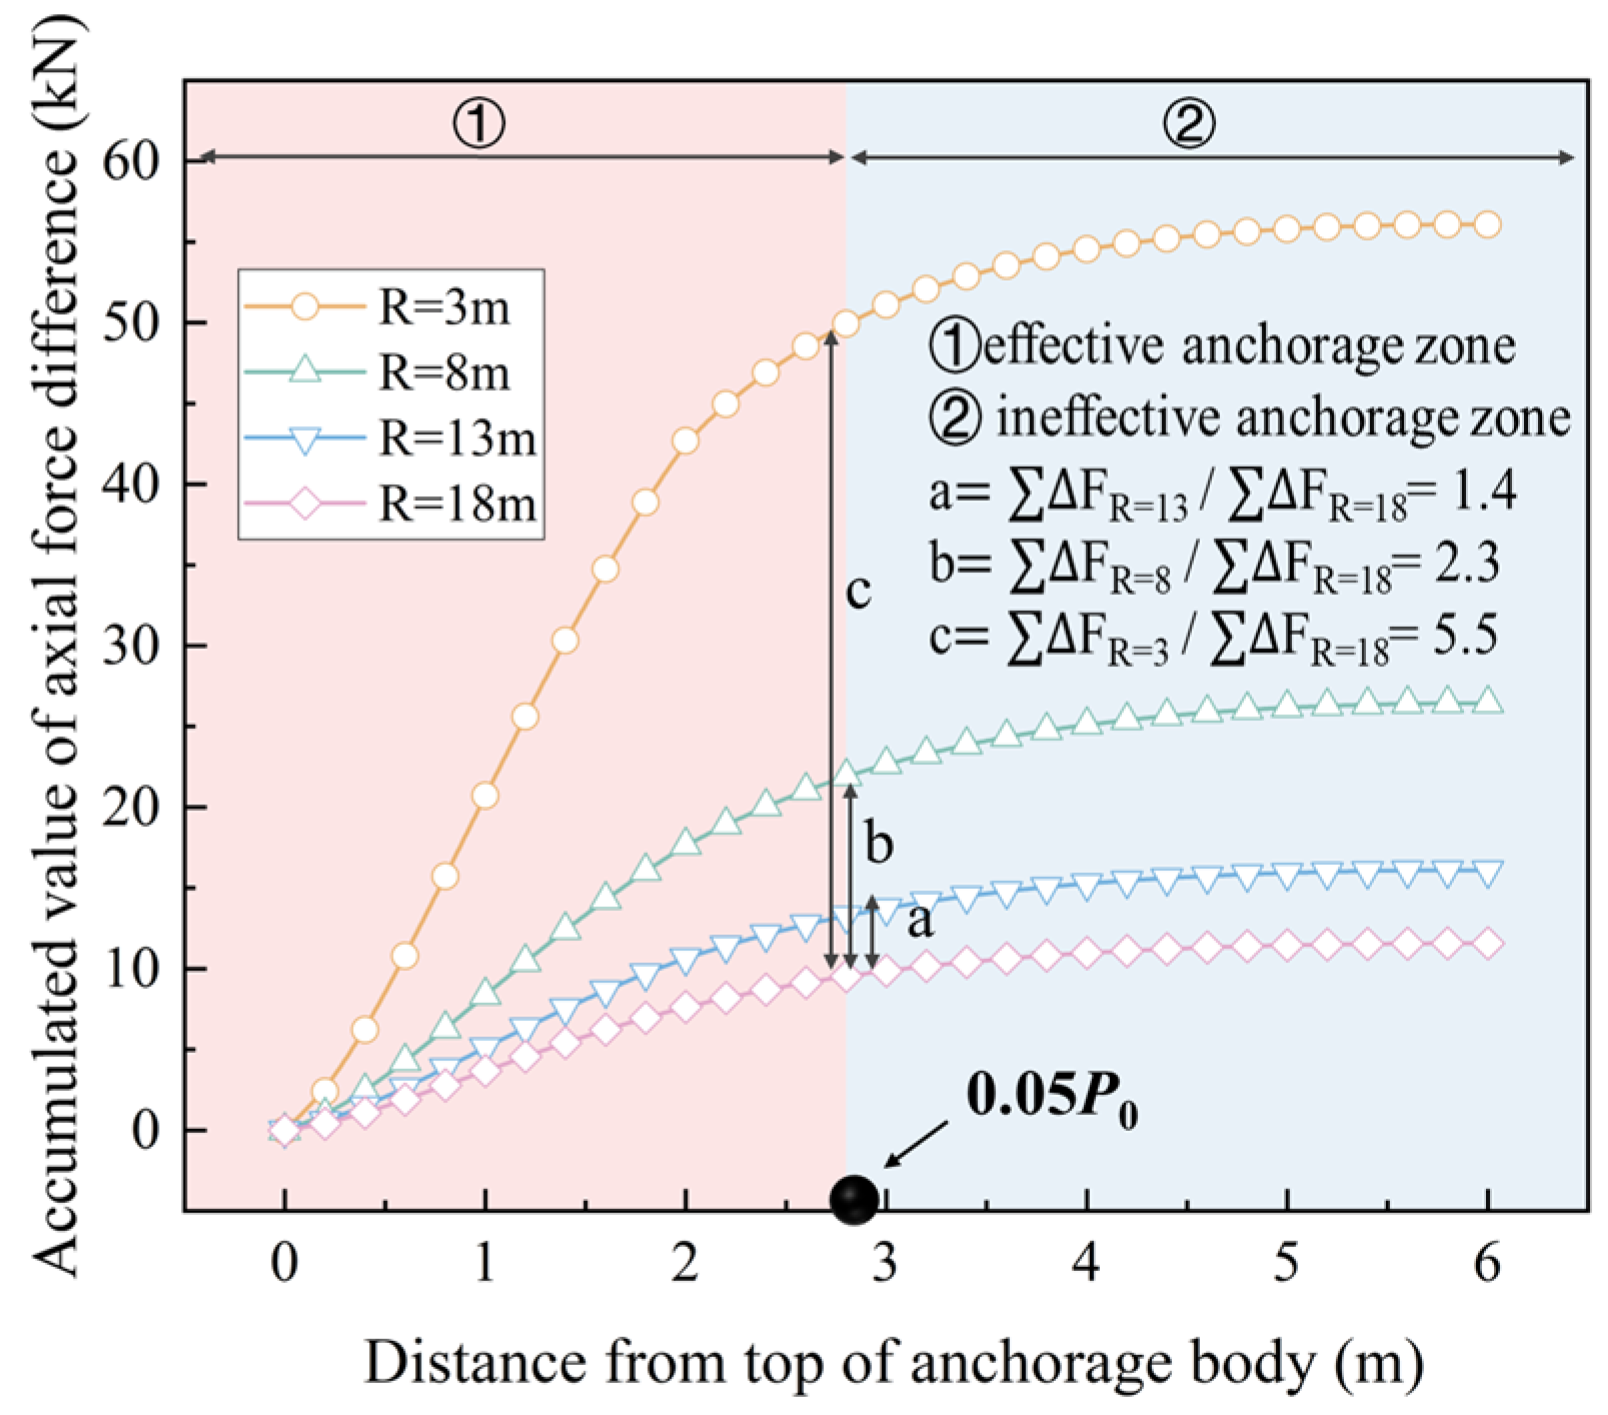
The effective anchorage zone and the ineffective anchorage zone are divided by the end point of axial force attenuation (L = 2.8 m), as shown in Figure 13. In the effective anchorage zone, the cumulative value of axial force loss of the bending cable relative to the linear cable increases with the anchorage depth, and the cumulative rate increases significantly with the decrease in the bending radius. In the ineffective anchorage zone, the cumulative value of axial force loss tends to be stable. At L = 2.8 m, the cumulative values of axial force losses corresponding to R = 3 m, R = 8 m and R = 13 m are 5.5, 2.3 and 1.4 times those at R = 18 m, respectively. The results show that the smaller the bending radius is, the more significant the axial force loss caused by the additional friction effect caused by the bending of the anchor cable is.
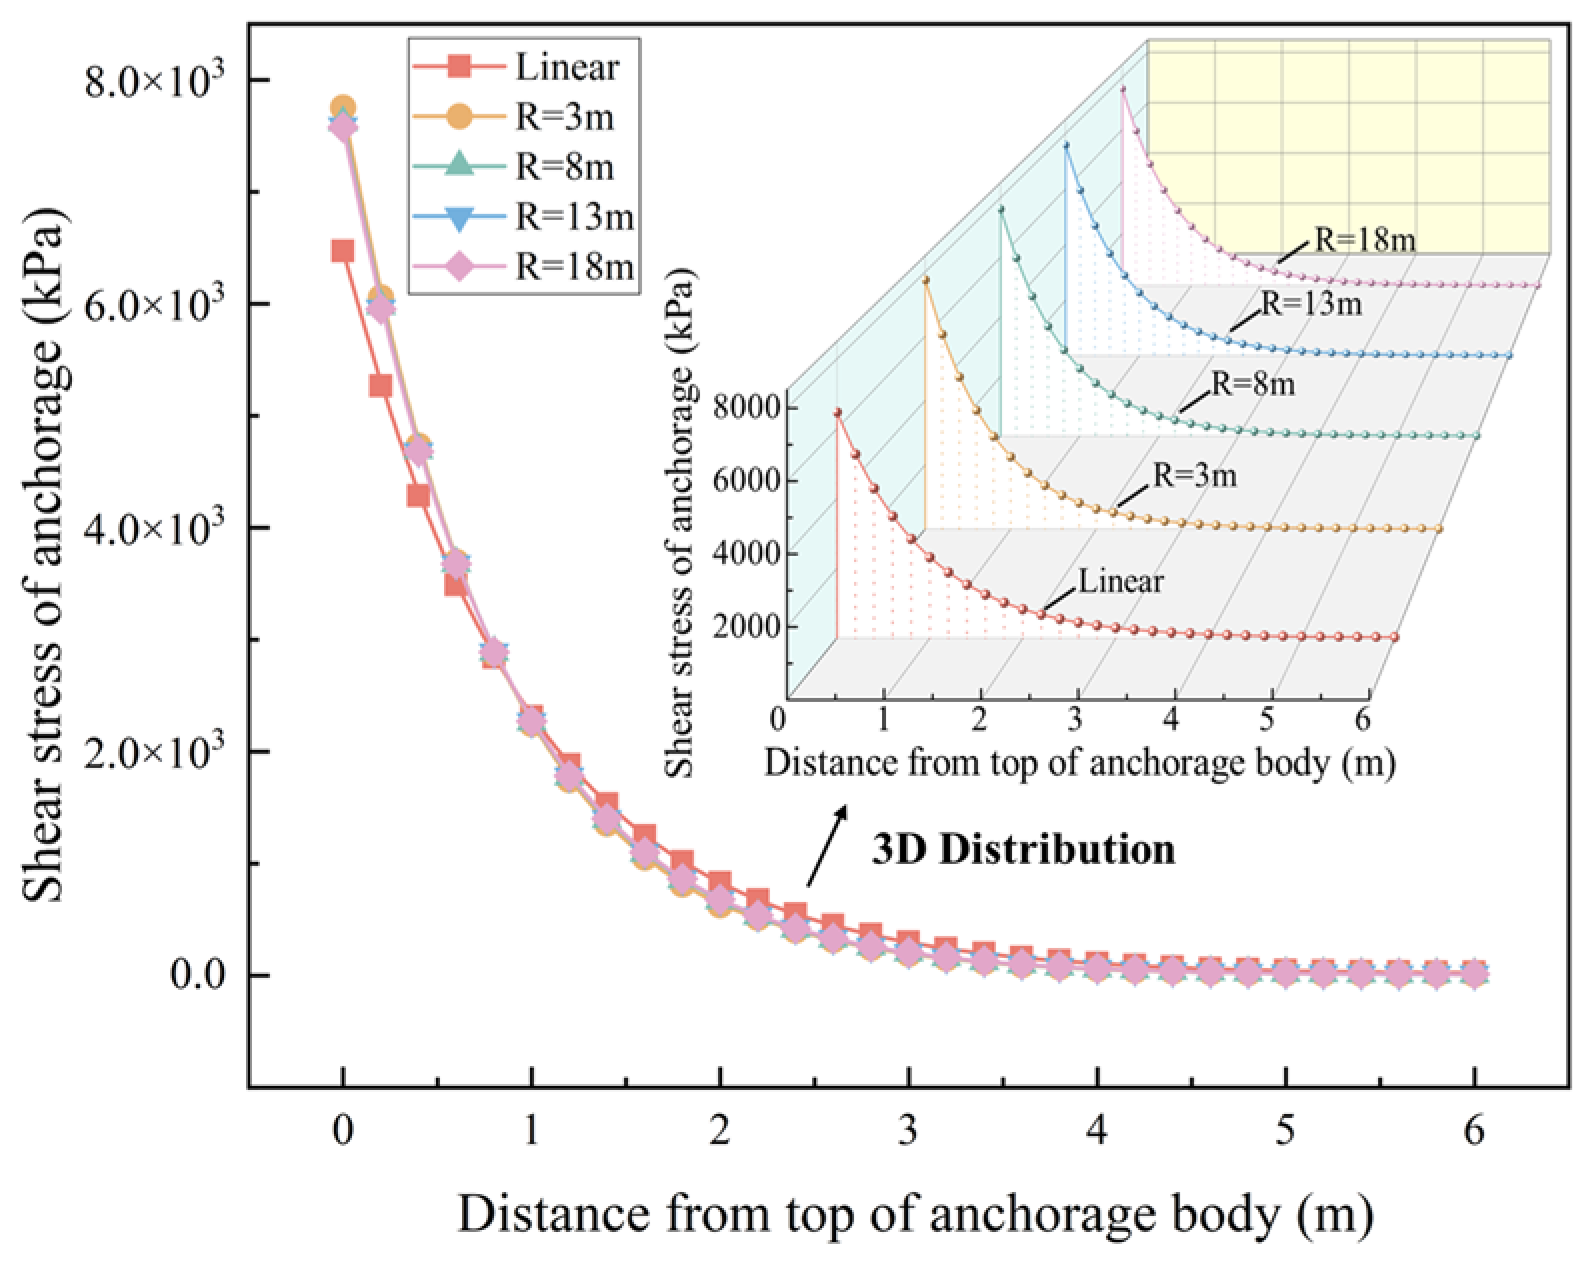
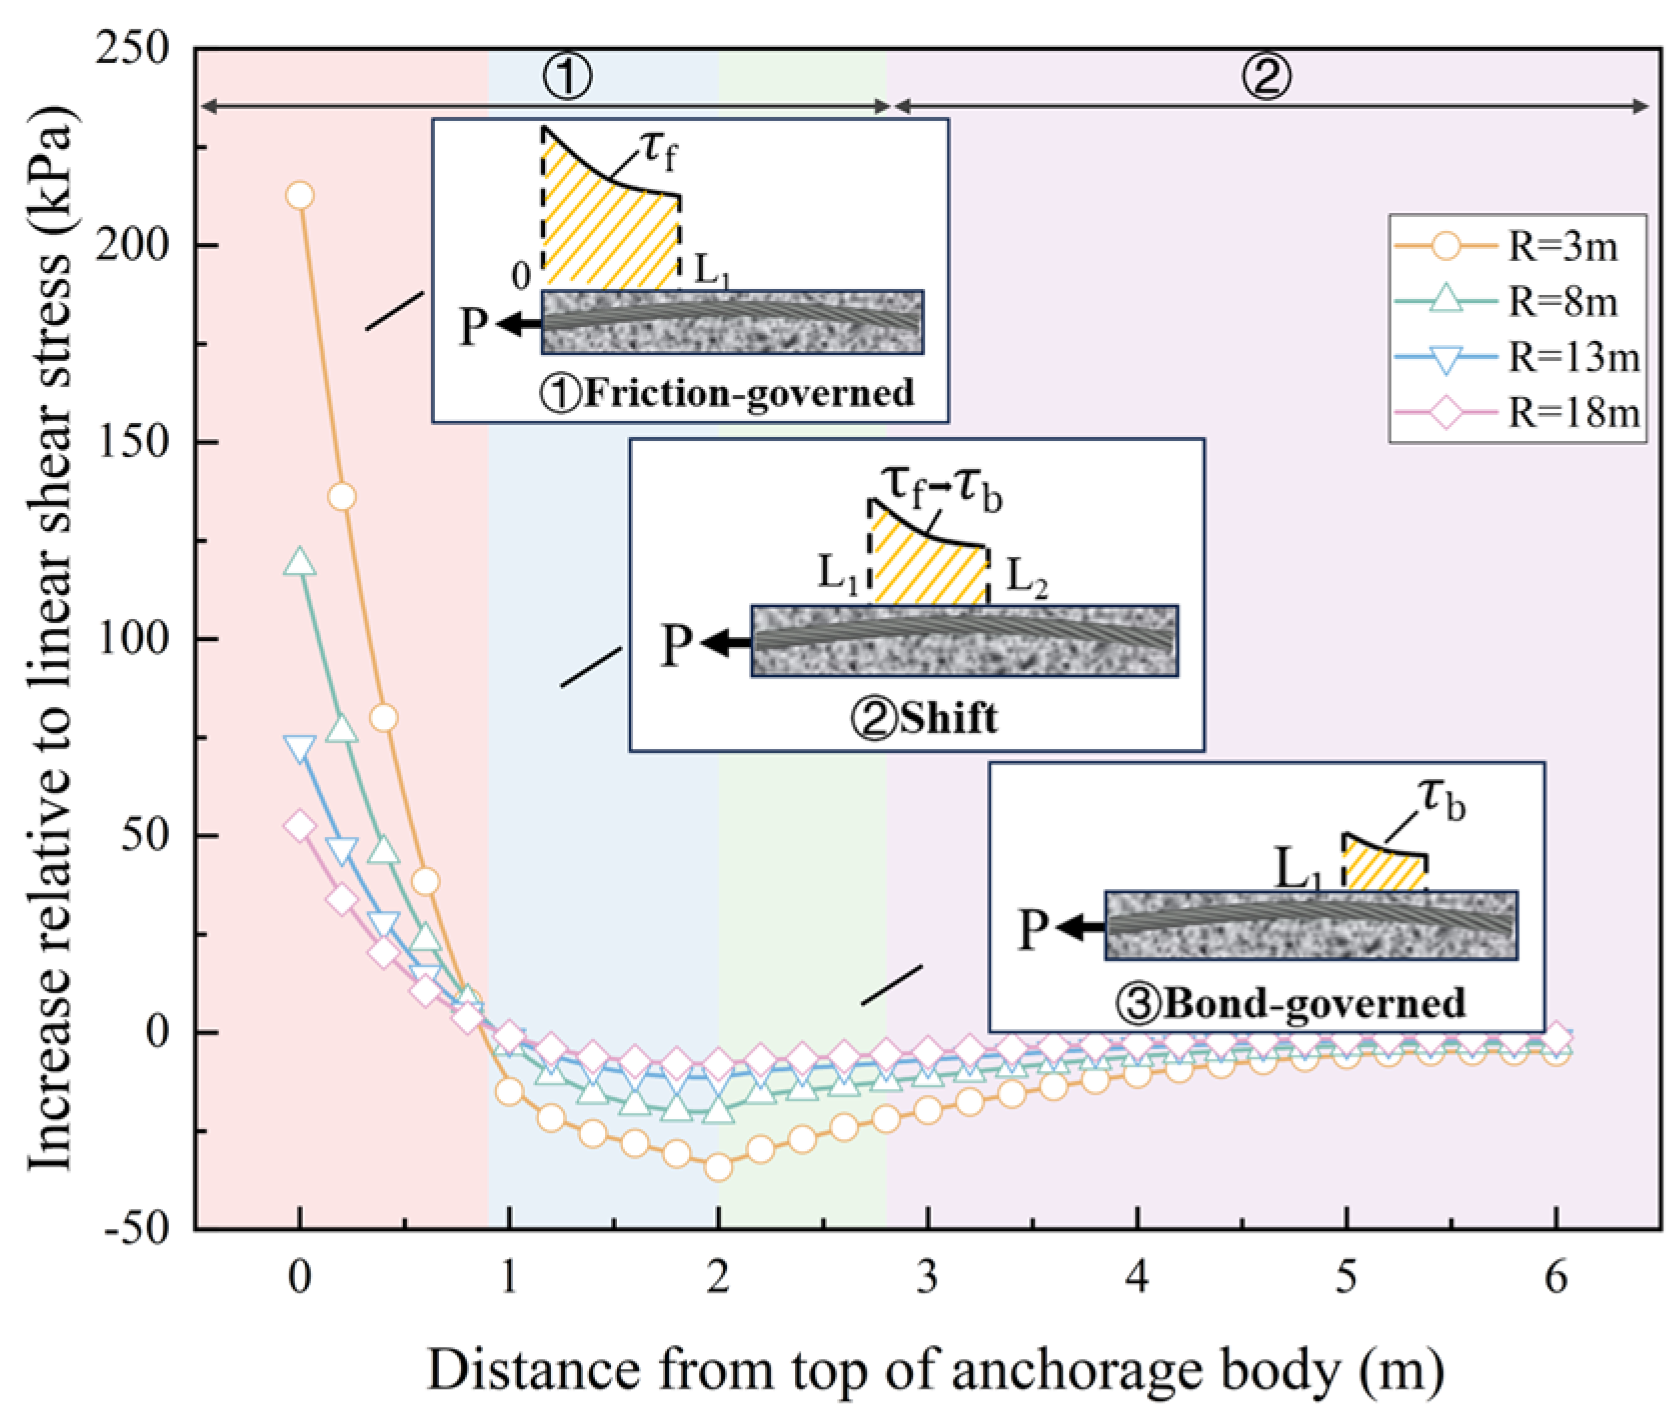
Under the conditions of different bending radii, the overall trend of shear stress distribution along the anchorage section is shown in Figure 14, which shows that the shear stress gradually decays along the anchorage length from the load-applying end. However, the decrease in bending radius significantly changes the distribution shape and numerical value of shear stress. With the increase in the bending radius, the axial force attenuation rate at the same section gradually slows down.
At the proximal end of the effective anchorage zone (L < 0.9 m), the shear stress of the bending anchor cable is higher than that of the linear anchor cable, and the relative difference between the two shear stresses gradually decreases with depth and finally tends to zero. This phenomenon is mainly caused by the friction shear stress caused by the additional radial stress caused by bending. As the axial force is transmitted forward, the friction effect continuously consumes energy, resulting in a gradual reduction in the difference. The smaller the bending radius is, the larger the difference is, indicating that the bending effect aggravates the friction loss at the proximal end. At the distal end of the effective anchorage zone (0.9 m < L < 2.8 m), the shear stress of the bending anchor cable turns lower than that of the linear anchor cable, and the shear stress difference between the bending anchor cable and the linear anchor cable shows a trend of first decreasing and then increasing, and the minimum value appears at L = 2.0 m. The minimum value decreases with the decrease in the bending radius, indicating that the interface mechanics mechanism is gradually transferred from friction shear stress to bond shear stress in this section, as shown in Figure 15.
After entering the ineffective anchorage zone (L > 2.8 m), the shear stress difference between the two types of anchorage cables gradually converges and finally tends to zero. It shows that the additional mechanical effects caused by bending have disappeared basically in this region, the shear stress distribution is no longer affected by curvature, and the stress state at the interface tends to be consistent.

4.4. Sensitivity Analysis of Friction Coefficient μ

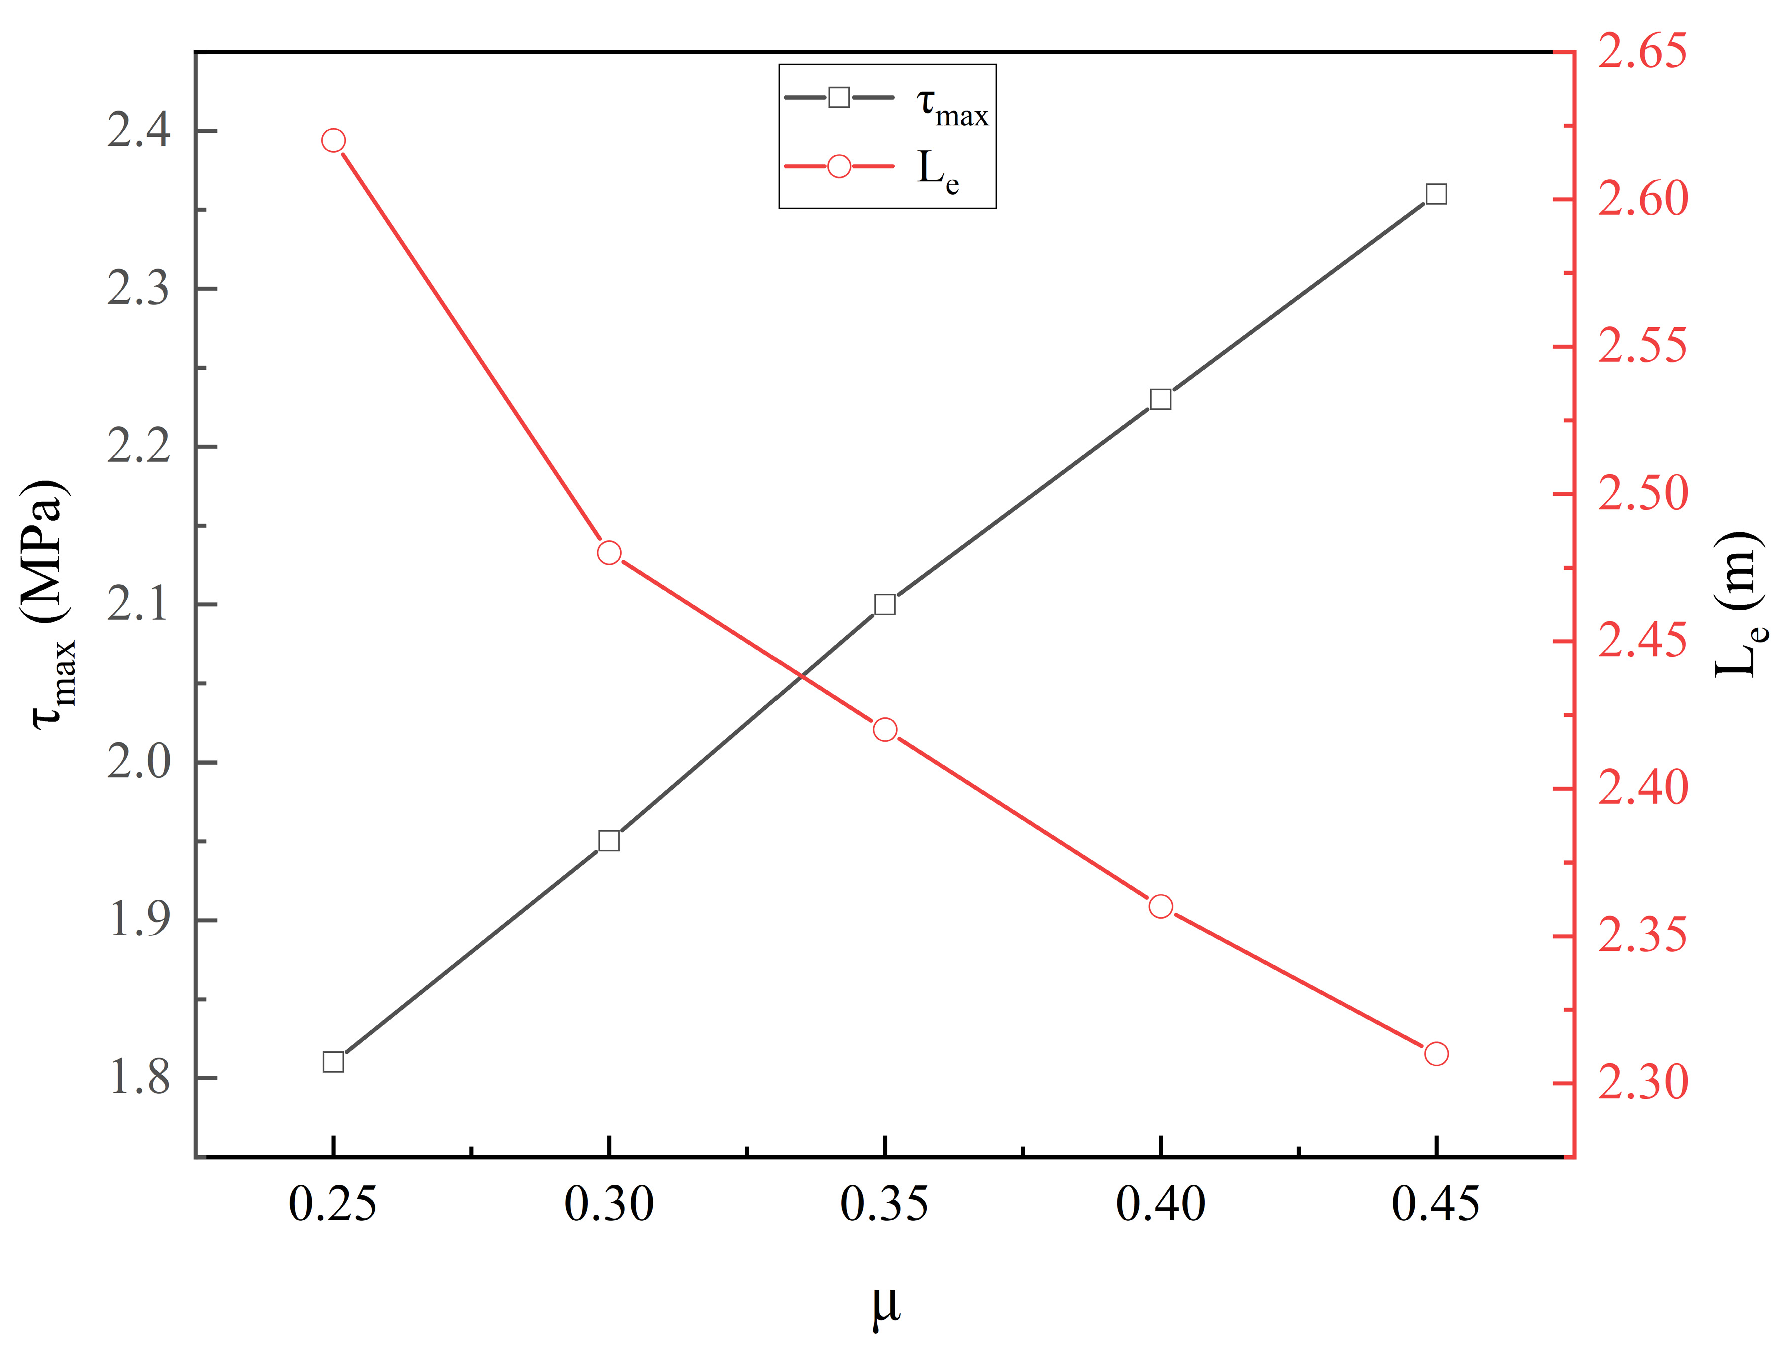
To evaluate the influence of the interface friction coefficient μ on the model predictions, with all other parameters held constant, μ was varied from 0.25 to 0.45 in steps of 0.05, and the axial force distribution and shear stress distribution of the curved anchor cable were calculated accordingly, as shown in Figure 16. The results show that an increase in μ leads to a higher proximal peak shear stress and faster decay of axial force. When μ increases from 0.25 to 0.45, the effective transfer length (the location where the axial force decays to 0.05P0) decreases from 2.62 m to 2.31 m, representing a variation of approximately 12%; the peak interface shear stress increases from 1.81 MPa to 2.36 MPa, with a variation of about 15%.

5. Experimental Design

In order to perform a reliability comparative analysis of the proposed analytical model and to accurately characterize the interfacial stress distribution and axial force loss between the curved anchor cable and the grout, this study developed a dedicated pull-out test system. The test setup and instrumentation were designed to allow direct comparison between measured strains and predicted axial force and shear stress distributions.

5.1. Specimen Preparation

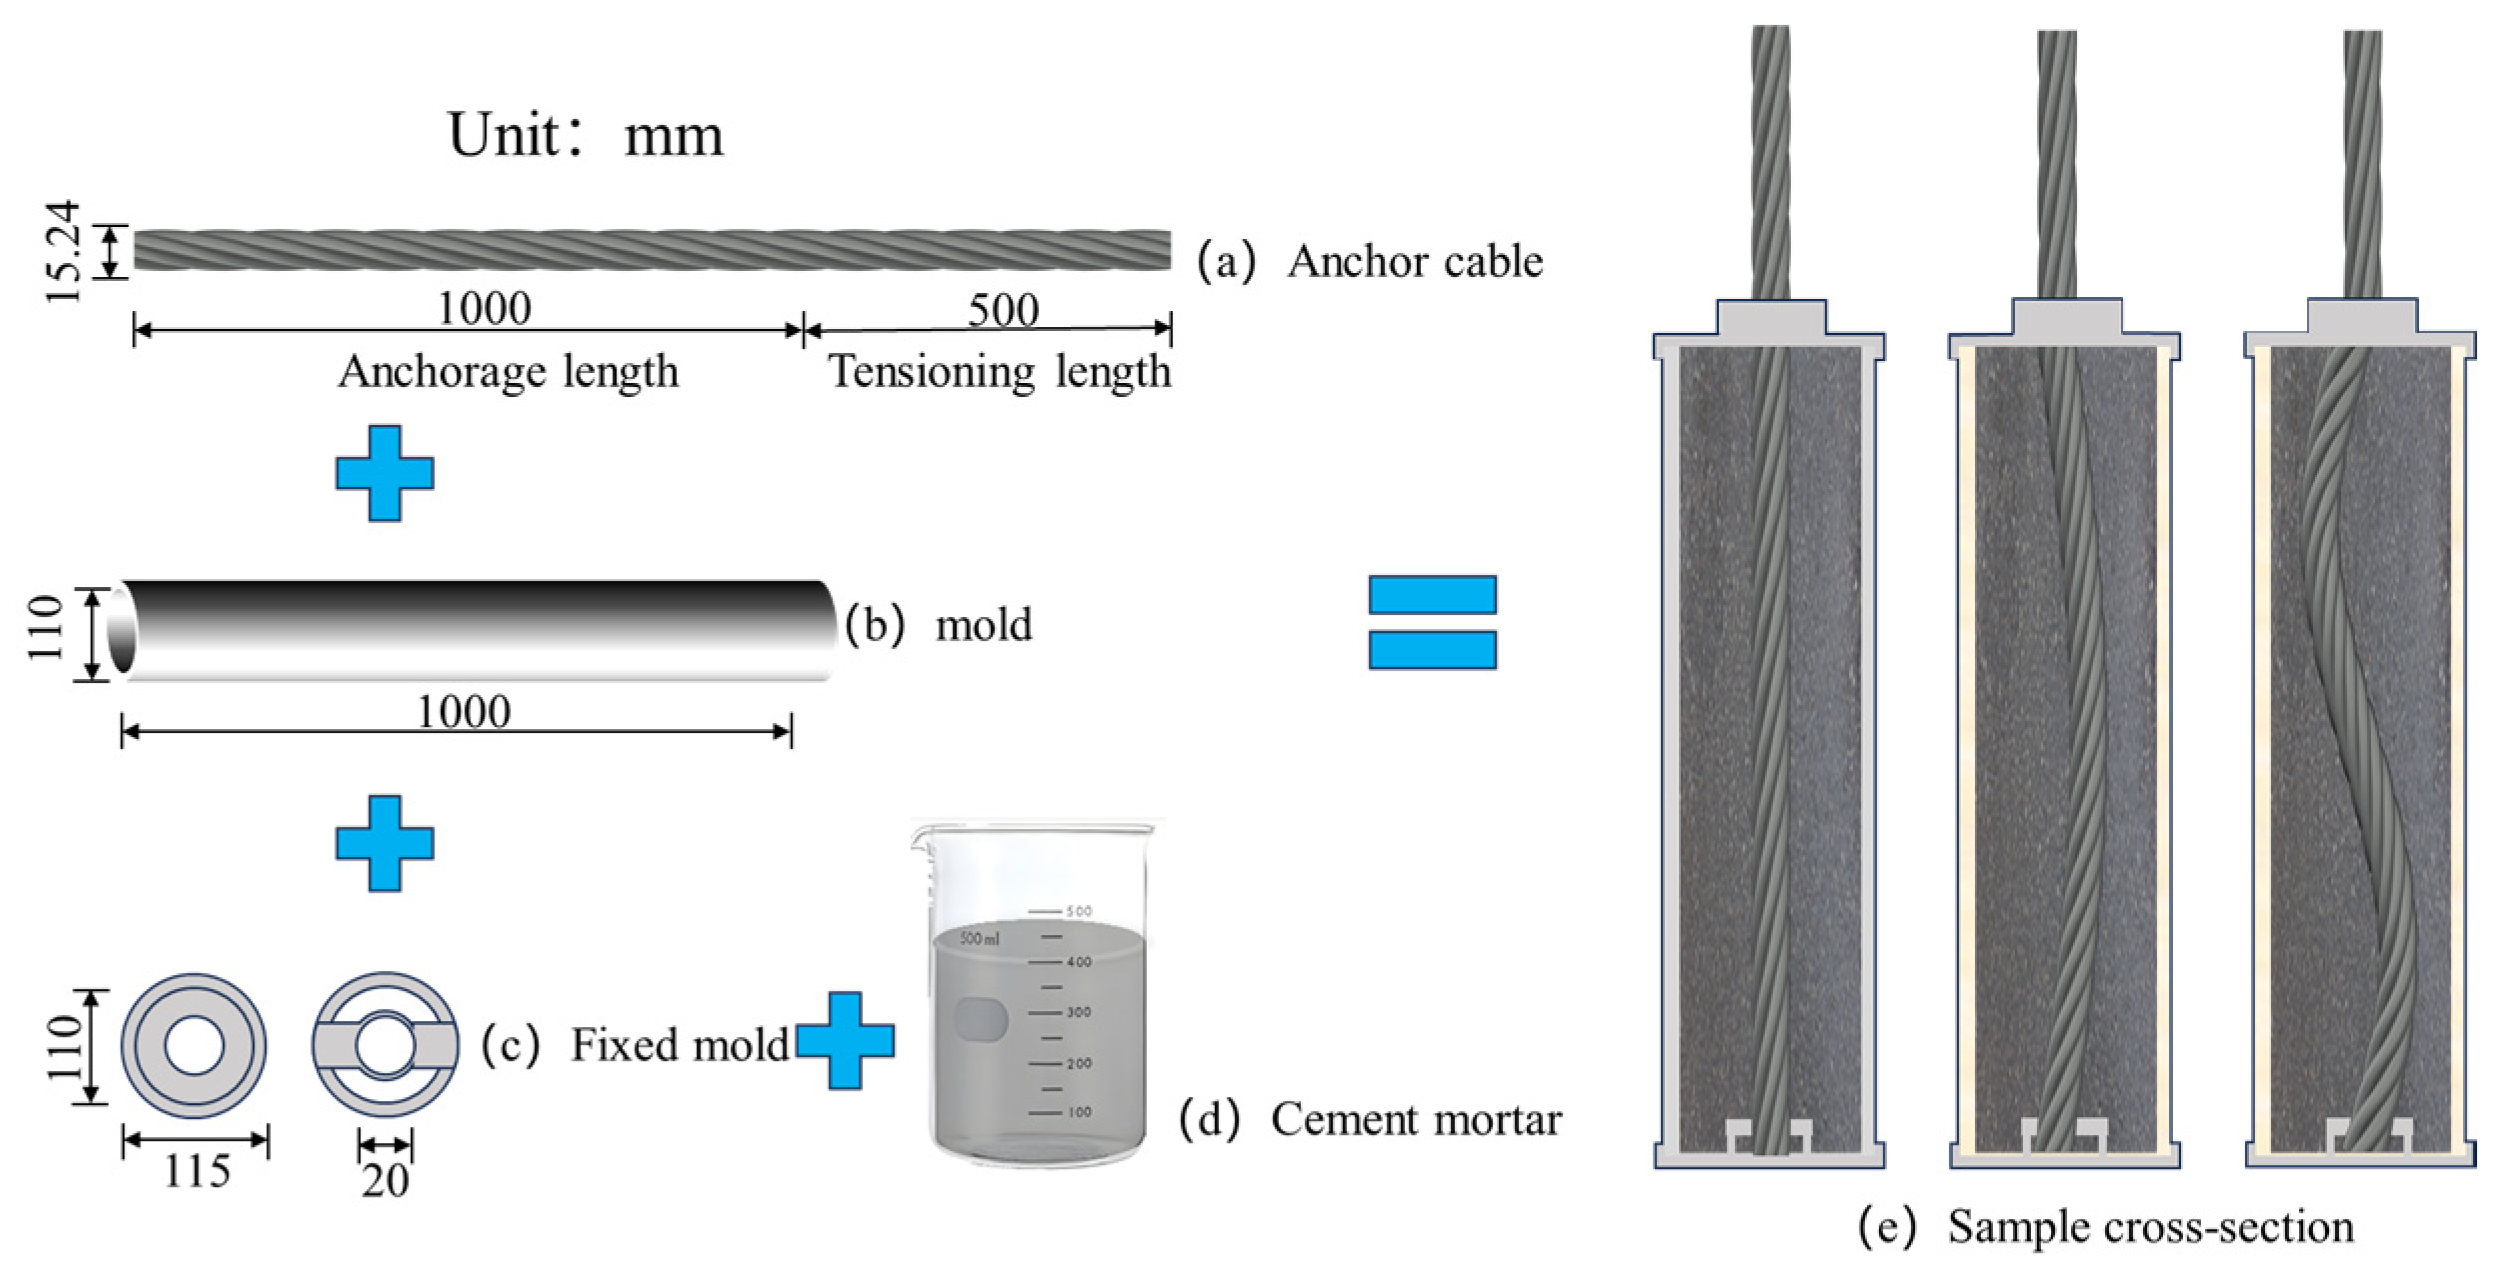
A mold with an outer diameter of 110 mm was used to simulate the borehole. The anchor cable was made of high-strength, low-relaxation prestressed steel strand, whose cross-sectional properties and elastic response meet common engineering standards. Three types of anchor cable shapes were fabricated using a custom-made fixing mold: linear, arc-shaped, and S-shaped. The anchorage length was uniformly set to 1.0 m for all specimens are shown in Table 1. During specimen preparation, the fixing mold was first used to constrain the shape of the anchor cable, and then both ends of the mold were sealed. Grouting was performed from the bottom of the PVC tube, with air exhausted from the top, until uniform slurry continuously emerged from the top opening, at which point grouting was stopped, and the top was immediately sealed. After grouting, the specimens were left to stand for 24 h and then moved to a standard curing room for 28 days of curing, during which vibration or external loading was avoided. All specimens were subjected to vibration treatment during pouring and curing to ensure close contact between the anchor cable and the surrounding medium. The detailed geometric configurations are shown in Figure 17.

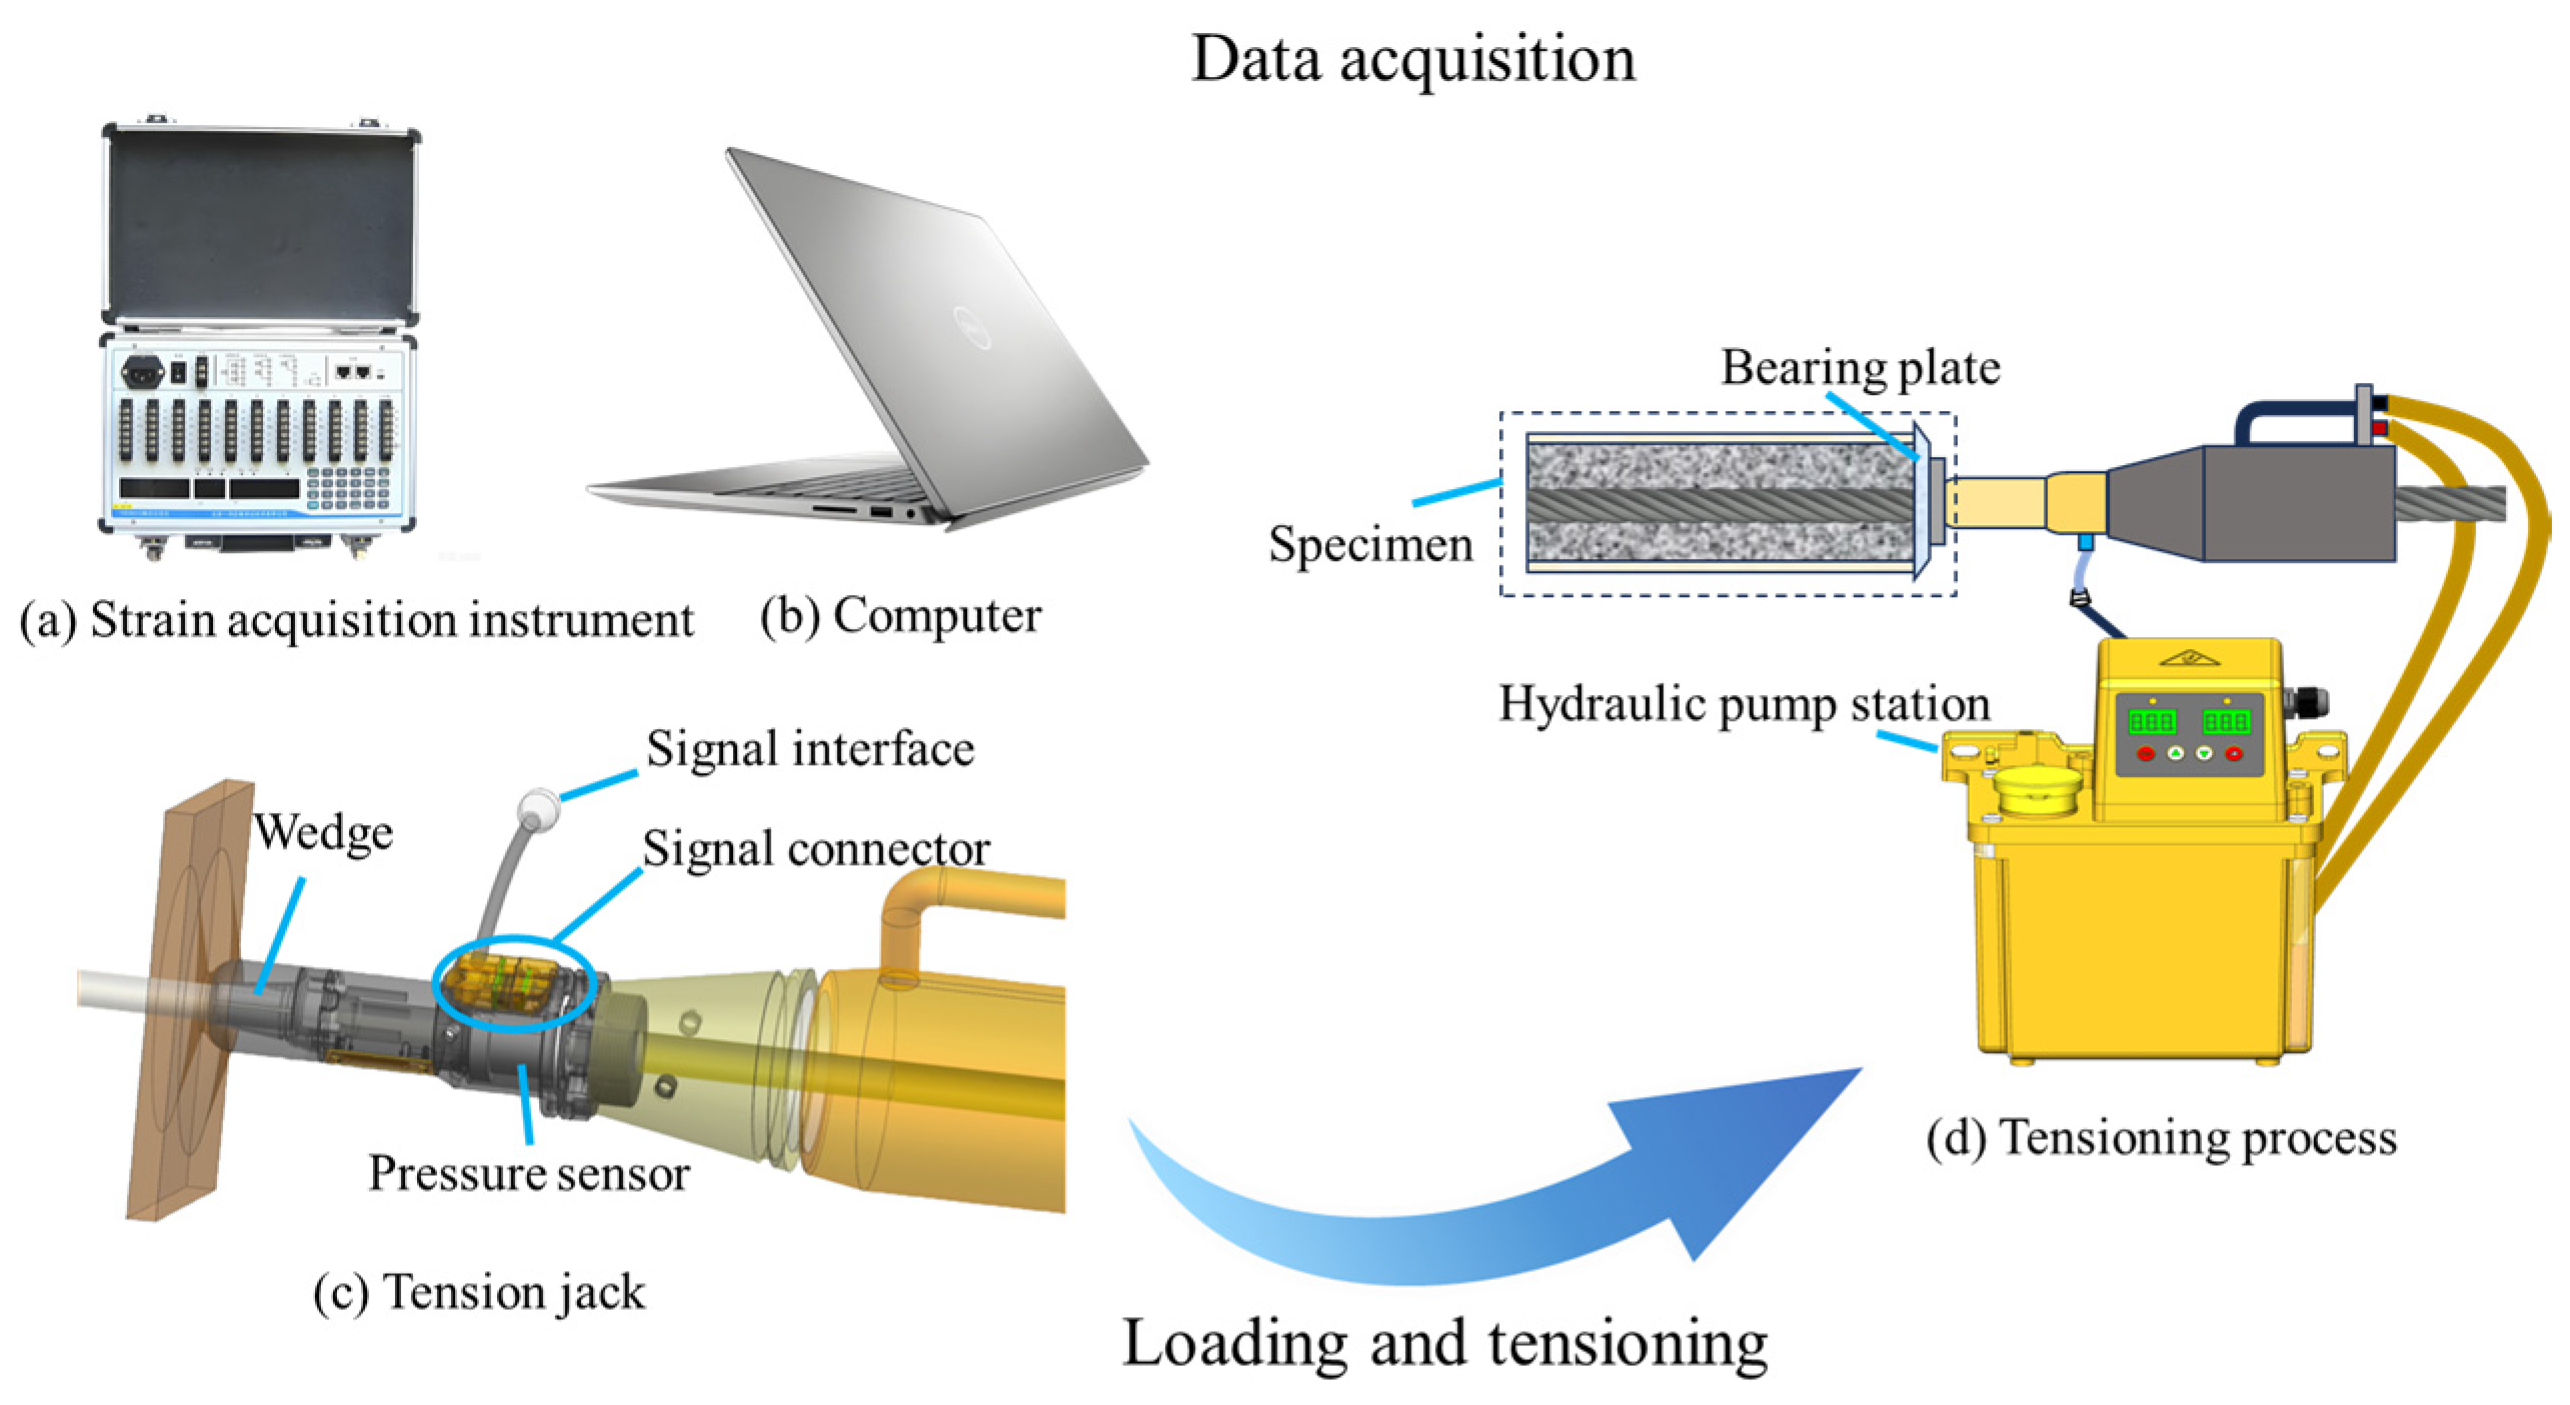
5.2. Instrumentation and Data Acquisition

To measure the internal stress distribution along the anchor cable–grout interface, strain gauges were pre-attached to the surface of the steel strand at intervals of 10 cm along the anchorage length. Before attachment, the surface of the steel strand was polished with sandpaper to a bright finish and wiped clean with acetone. Cyanoacrylate adhesive was used for rapid positioning, followed by covering and reinforcement with epoxy resin adhesive to ensure cooperative deformation between the strain gauge and the steel strand. For the arc-shaped and S-shaped curved specimens, one strain gauge was placed on the inner side (compression side) and one on the outer side (tension side) of the curved arc at each measurement point cross-section to capture the non-uniform strain distribution induced by curvature. All strain gauges were sealed with three layers of epoxy resin adhesive for waterproofing. The lead wires were routed straight along the anchor cable surface and fixed to avoid bending or stressing, thereby minimizing disturbance to the local stress field. The strain gauges were connected to a DH3820 high-precision static strain data acquisition system was sourced from Jiangsu Donghua Testing Technology Co., Ltd., in Taizhou, China, using the quarter-bridge method. The sampling frequency was set to 1 Hz, and data were continuously collected for 30 min. The average value over the stable segment was taken as the strain value at that measurement point. Each strain gauge was zero-balanced before loading.
During the pull-out test, the applied tensile load was measured by a built-in load cell in the hydraulic jack, and the corresponding strain readings were recorded at each loading step. The axial force at each measurement section was calculated from the measured strain using Hooke’s law:
P ( x ) = E s A s ε ( x )
where ε ( x ) is the measured strain at location x. The interfacial shear stress τ(x) was then derived from the equilibrium equation:
τ ( x ) = 1 π d d P ( x ) d x
where d is the diameter of the steel strand. A central difference scheme was used to numerically evaluate the derivative from discrete strain measurements.
Table 1. Experimental scheme.
CategoryAnchorage LengthBending Radius
Linear type1 m-
Arc type1 m3 m
S-type1 m0.5 m

5.3. Loading Protocol

A stepwise loading procedure was adopted, and the test process is shown in Figure 18. At the free end of the anchor cable, a stepwise tensile load was applied through a center-hole jack at a loading rate of 0.5 kN/min, with an increment of 5 kN per step. After each load step, the load was held for 5 min, and then the strain data were recorded.

6. Model Comparison

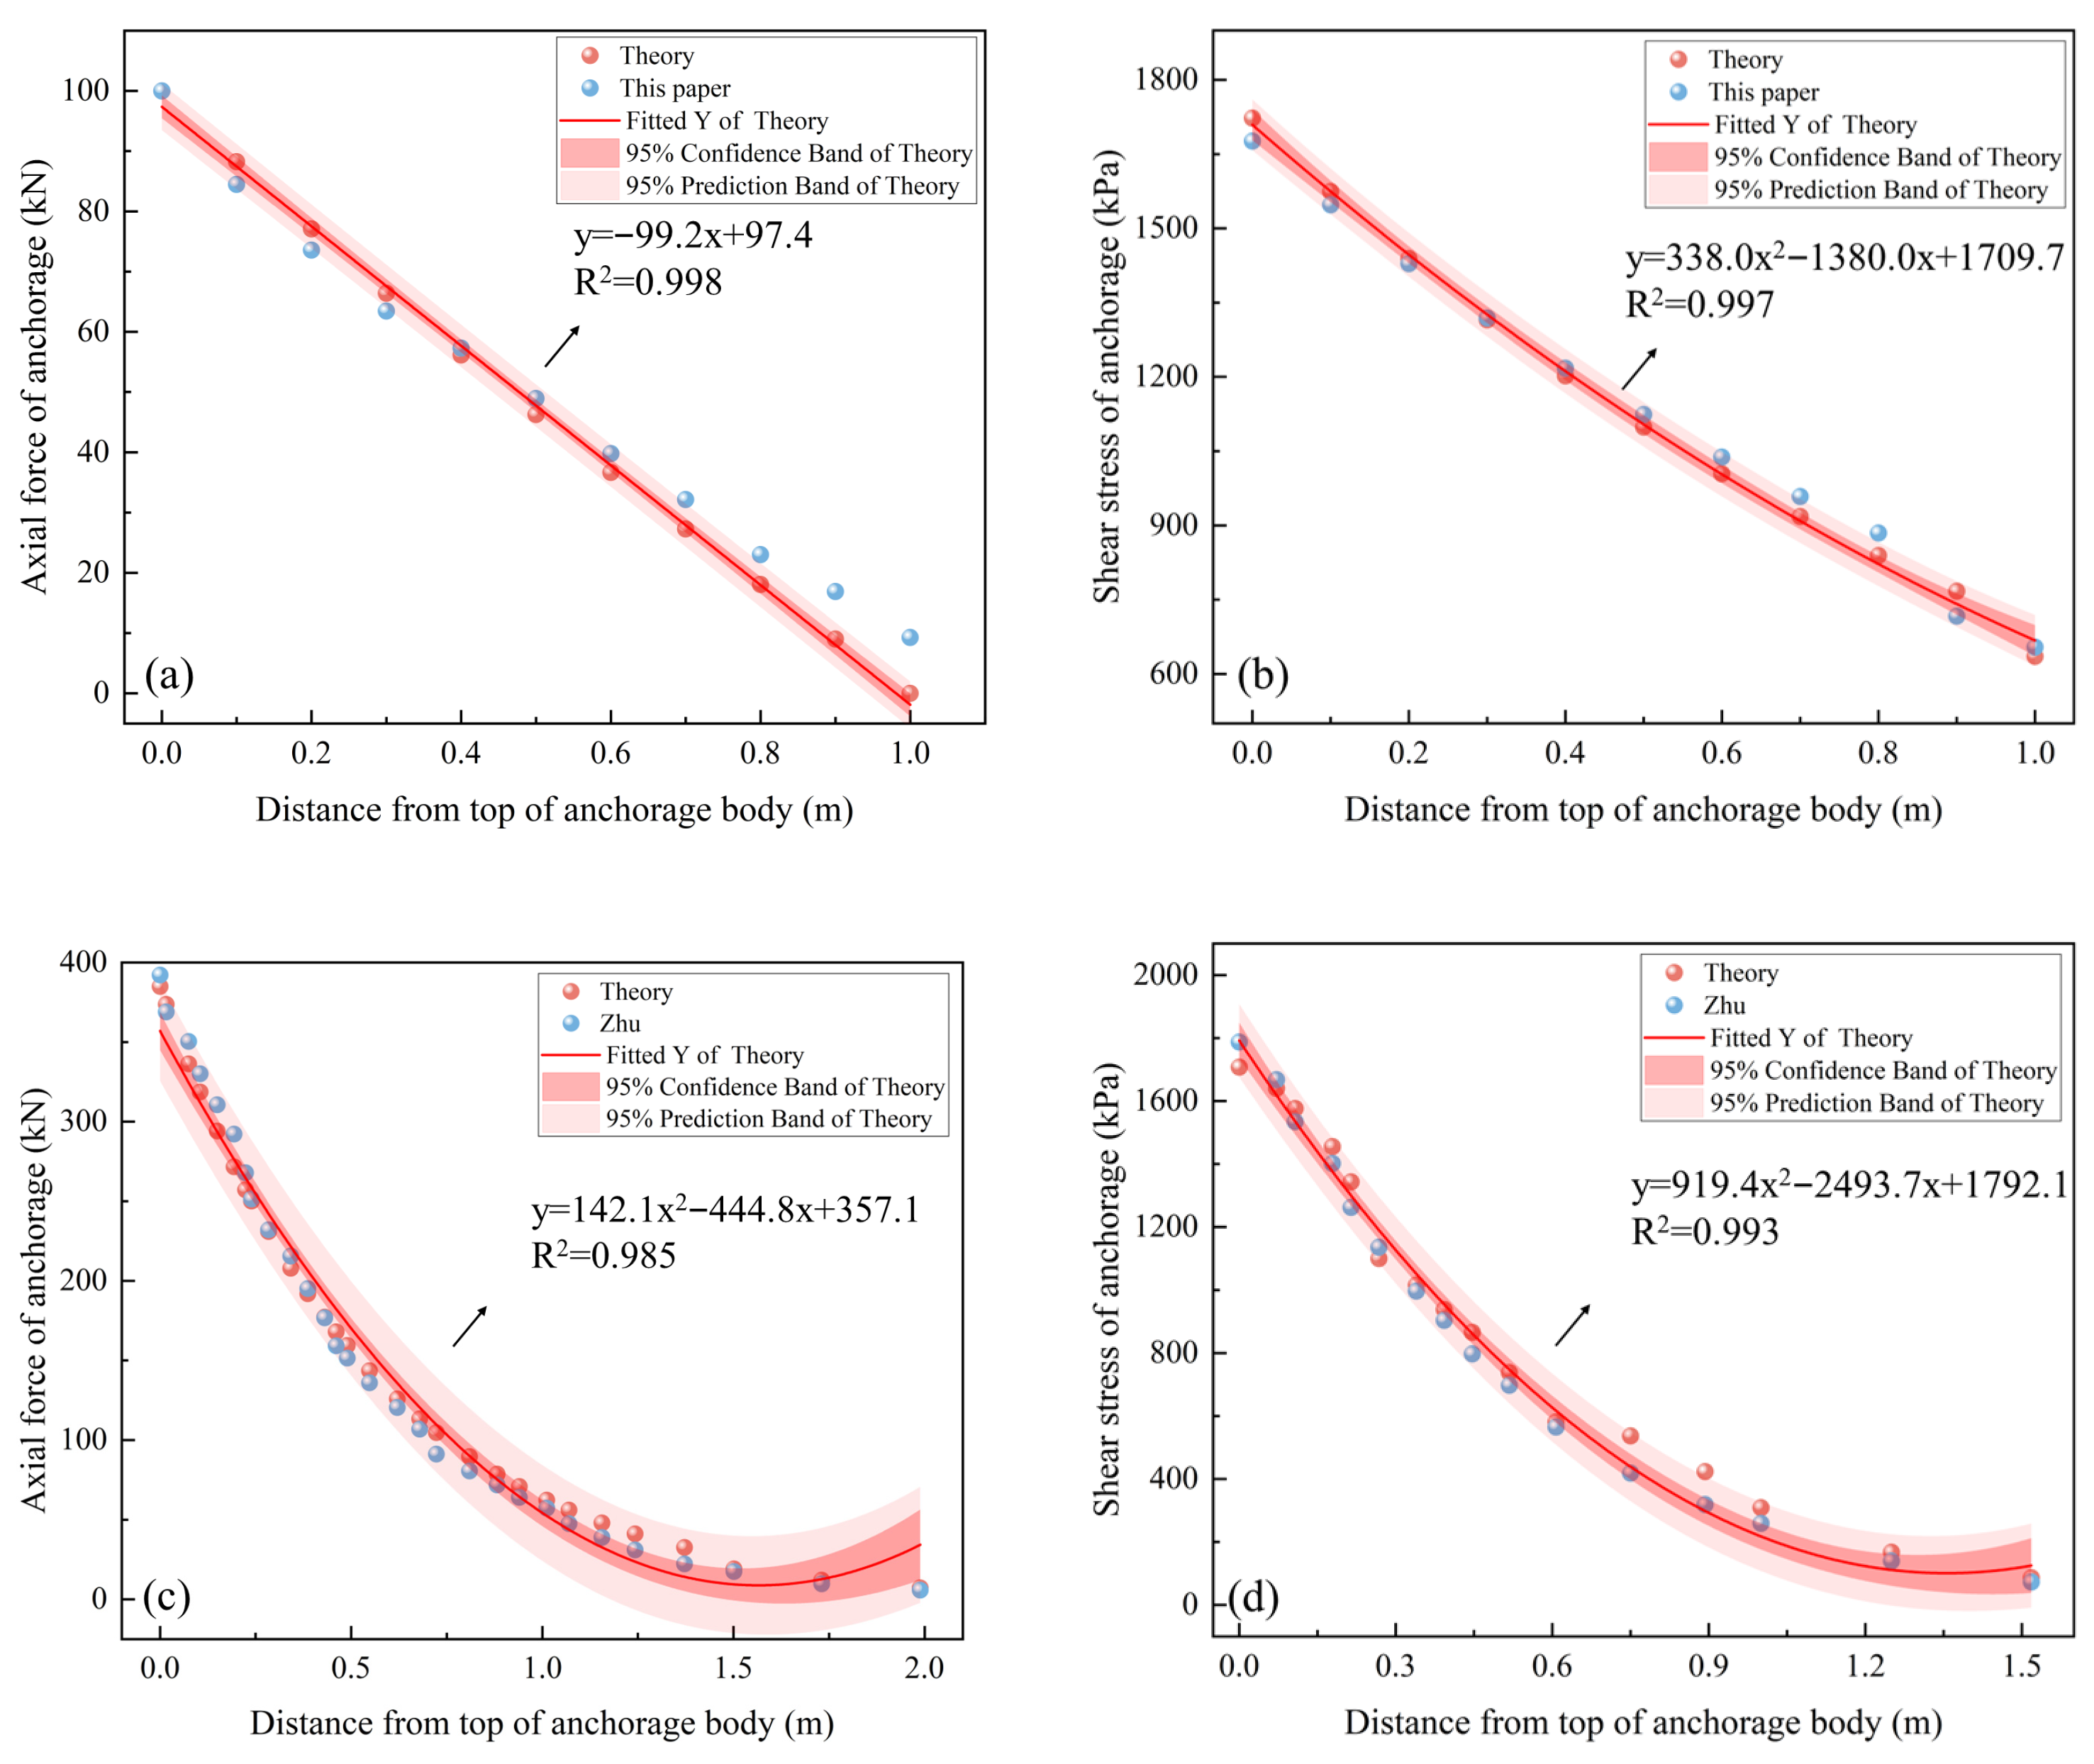
In order to verify the reliability of the calculation model, the pull-out test is used as the main verification method in this study, and the theoretical calculation results of the model are compared with two types of test data: one is the outdoor model test data of Zhu et al. [14], and the other is the pull-out data of the indoor test independently implemented by this study.
It should be noted that the model is derived under the assumption of constant curvature along the anchorage section. For the S-shaped specimen (R = 0.5 m), the curvature varies significantly, and the constant-curvature assumption no longer holds. The failure of the strain gauges during loading for this specimen indirectly reflects the presence of local stress concentrations. Therefore, the model is applicable to anchor cables with uniformly curved or mildly bent configurations. The good agreement between the model predictions and the measured data for the arc-shaped specimen (R = 3 m) confirms the reliability of the model within its applicable scope.
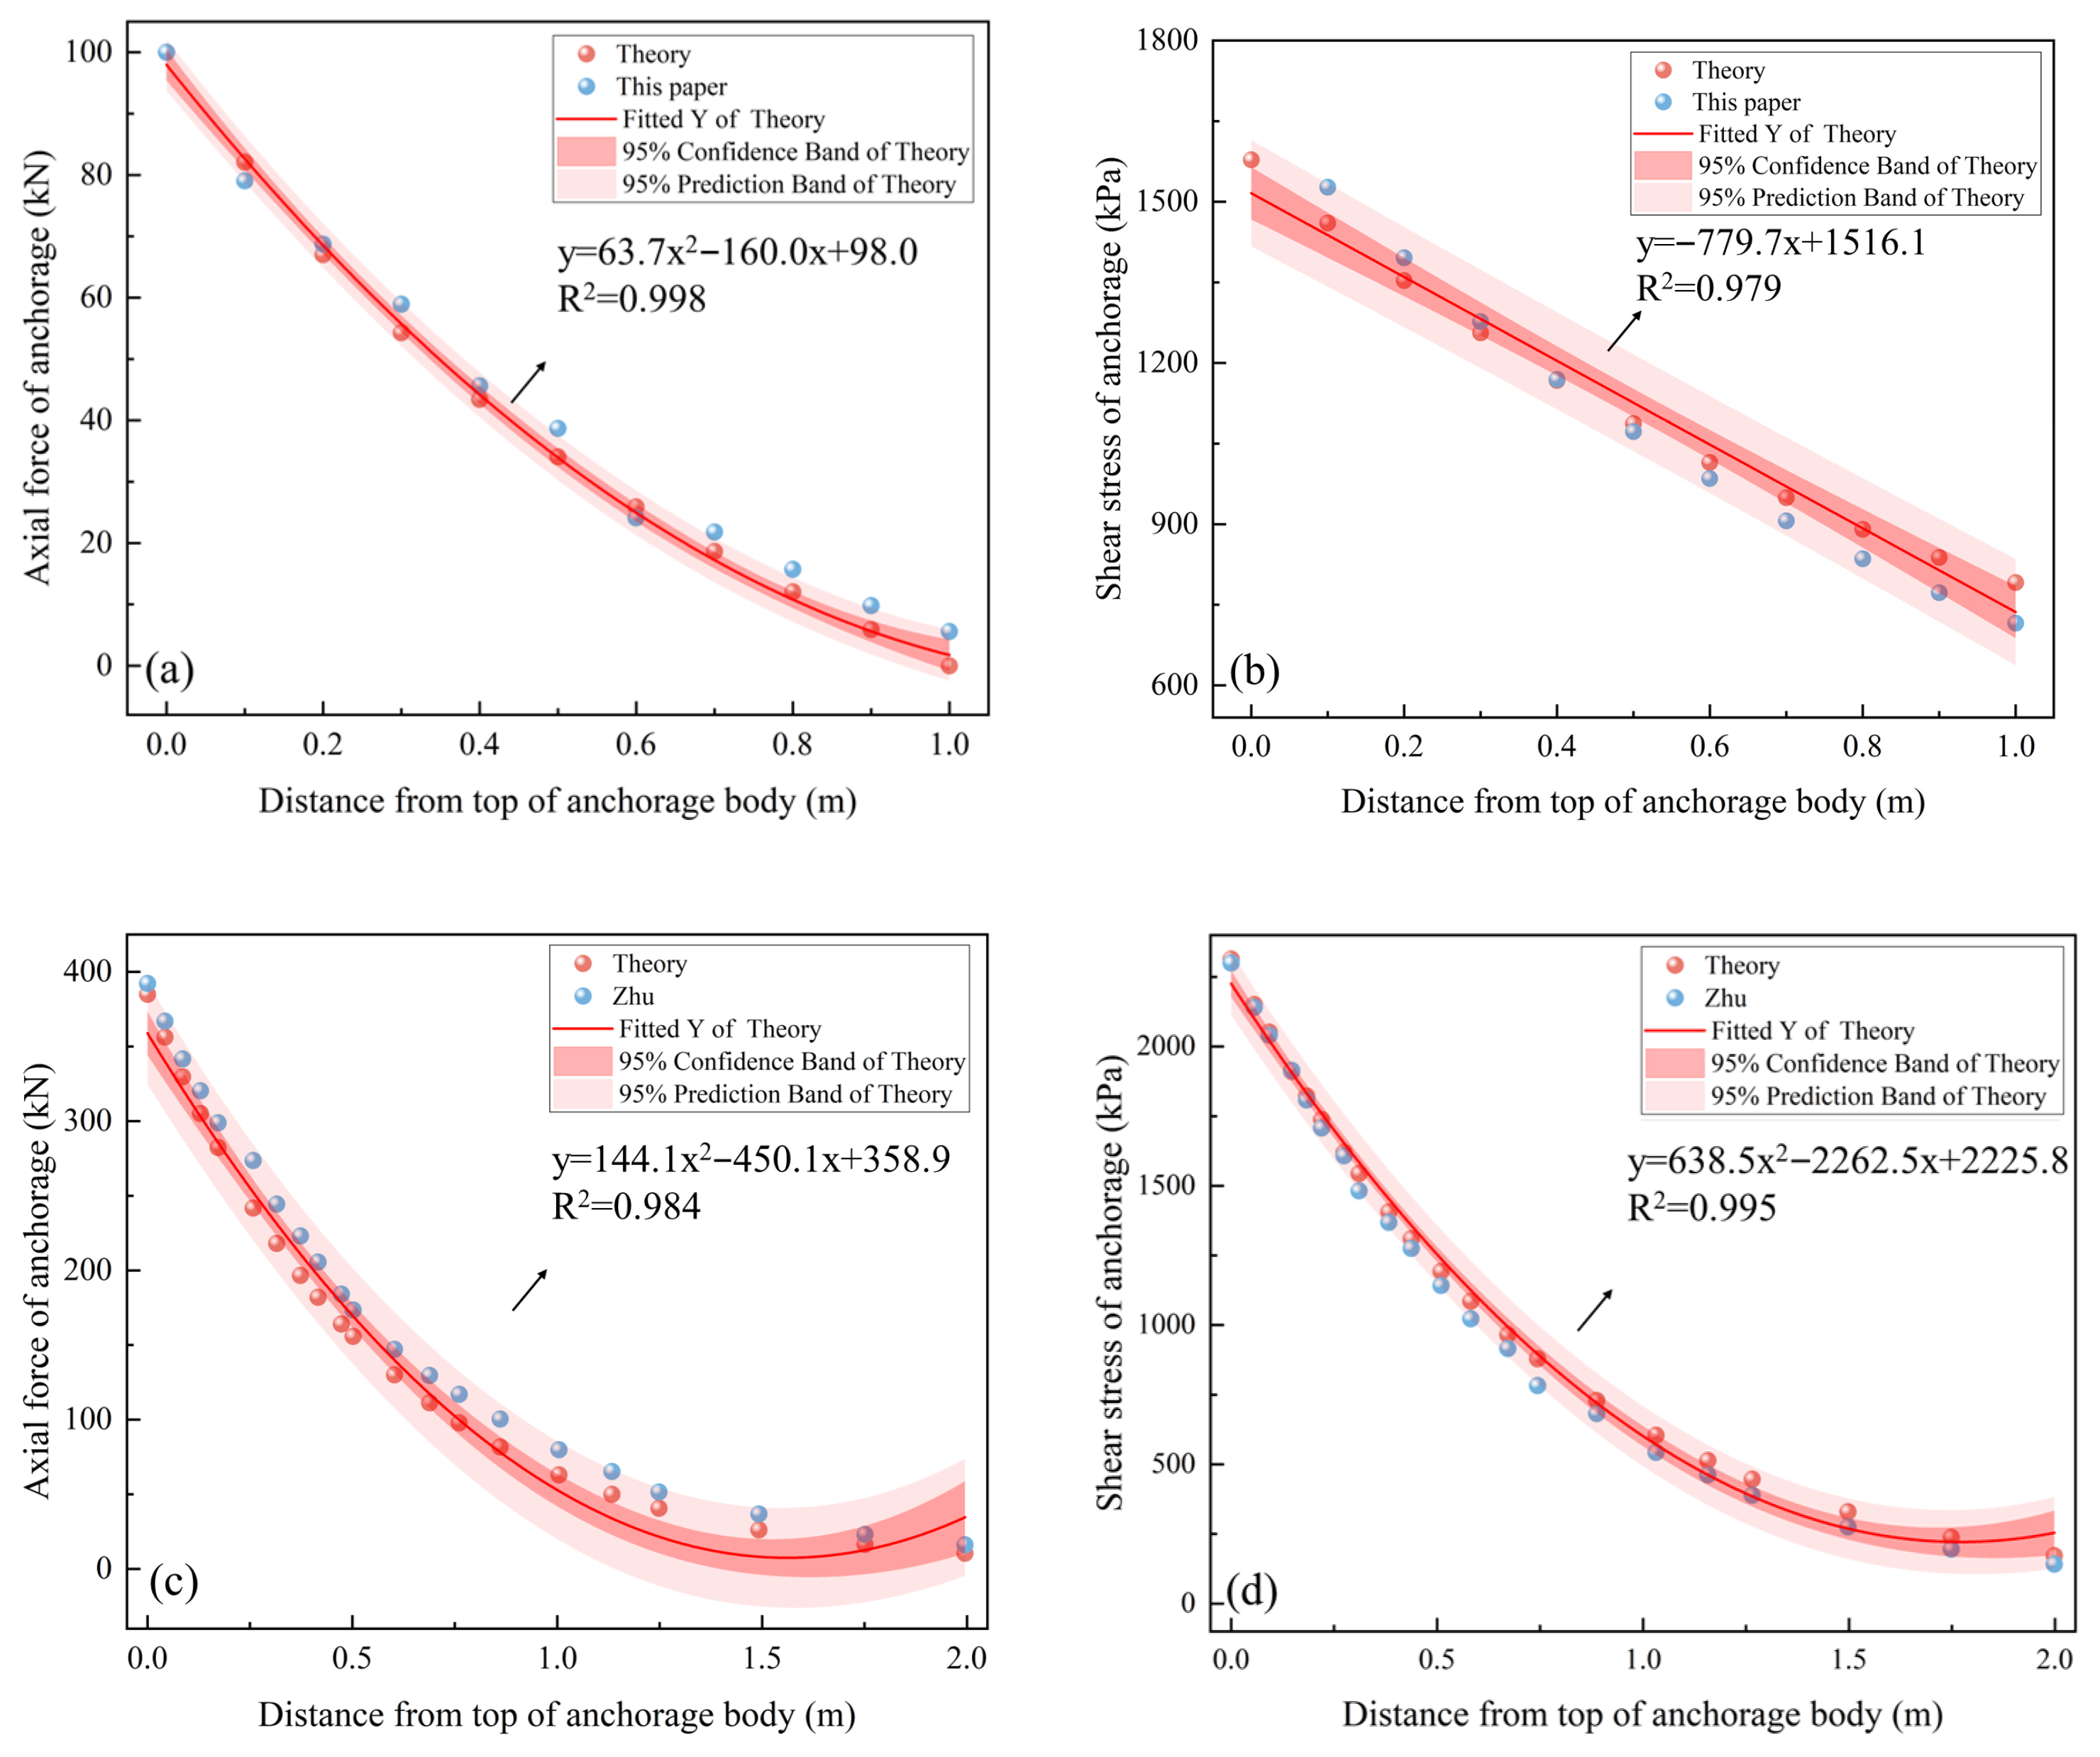
By fitting the calculation results of the linear and bending-type models and comparing them with the indoor model test results of Zhu et al. [14] and the pull-out test data from this study, the results show that the model predictions agree well with the experimental data in terms of overall trends. As shown in Figure 13 and Figure 14, both the axial force and shear stress of the two types of anchor cables reach their maximum values at the beginning of the anchorage section. As the load transfers toward the end, the reductions in axial force and shear stress gradually increase and eventually approach 0.
However, the local verification results at the end of the anchoring section are different. As shown in Figure 19a and Figure 20a, the axial force at the end of the anchorage section measured by the pull-out test in this study is significantly higher than the model calculation results, while the test data of Zhu et al. [14] are basically consistent with the model prediction. The analysis shows that the difference is mainly related to the boundary conditions set by the calculation model. The model assumes that the axial force at the end of the full length of the anchorage section (x = L) is zero (P = 0), but in the actual pull-out test, the anchorage length is short in the laboratory test, and the axial force at the end is not zero. Therefore, the experimental data of this study show that the theoretical value is lower than the measured value at the end. In contrast, the data of Zhu et al. [14] cover the complete anchorage length, so they agree well with the model. In conclusion, although there are some deviations in the boundary conditions, the calculation model can effectively reflect the mechanical transfer law of the anchor system as a whole, which suggests that the model is capable of capturing the overall trend of axial force and shear stress distribution for the tested configurations.

7. Conclusions

Based on the Cox shear-lag model, this paper establishes an elastic stress distribution model that accounts for the curved configuration of the anchor cable. Through model calculations, the influence of the curved shape of the anchor cable on the elastic stress distribution characteristics at the anchor cable–grout interface is investigated under different load conditions, different anchorage lengths, and different bending radii. The reliability of the model is verified by comparing the model calculation results with existing experimental data as well as the pullout data obtained in this study. The findings are as follows:
(1)
Compared with the linear anchor cable, the additional radial stress caused by curvature at the proximal end of the anchoring section of the curved anchor cable enhances the interface friction effect, resulting in a rapid attenuation of axial force and shear stress and a shortening of the effective load transfer length. As the bending radius decreases, the stress attenuation rate increases further.
(2)
The increase in external load will linearly amplify the stress difference between the bending cable and the linear cable, but it does not change the basic distribution pattern along the anchorage depth. At the same time, there is a critical anchorage length (about 2.9 m under the parameters of this study), beyond which, the contribution of increasing the anchorage section to the ultimate uplift force is extremely limited, which provides a clear theoretical basis for optimizing anchorage design and avoiding material waste.
(3)
The established theoretical calculation model can effectively predict the stress distribution trend of the bending anchor cable as a whole. The reliability of the model in predicting the attenuation law of axial force and interfacial shear stress along the anchorage section is verified by comparing the data of the indoor pull-out test with previous research results. Although there are local deviations from the ideal boundary conditions, the model successfully reveals the stress distribution law of the bending anchor cable, which provides a valuable reference for evaluating the influence of the shape of the anchor cable in practical projects.
(4)
The analytical model presented in this paper is derived under the assumption of constant curvature along the anchorage section and is suitable for predicting the axial force and shear stress distributions in anchor cables with uniformly curved or mildly bent configurations. For cases involving sharp bends or significant curvature variations, the predictive accuracy of the model is limited, and numerical simulations are recommended for further analysis.
It should be noted that this study only analyzes the stress distribution characteristics of the anchorage system in the elastic stage, without addressing interface damage evolution or ultimate failure states. In practical engineering, the ultimate pullout capacity of anchor cables is closely related to the interfacial bond-slip behavior. Therefore, in future research, based on the elastic stress distribution model established in this paper, a nonlinear bond-slip constitutive relationship will be introduced to further develop a full-process analysis model for curved anchor cables from the elastic stage to progressive failure. This will help reveal the influence mechanism of cable curvature on the ultimate bearing capacity of the anchorage system, providing a more comprehensive theoretical basis for the optimal design of prestressed anchor cables.

Author Contributions

Data curation, writing—original draft, X.J.; project administration, Q.L.; supervision, L.L.; project administration, Q.X.; supervision, Z.X.; data curation, X.Q.; conceptualization, Z.Y. All authors have read and agreed to the published version of the manuscript.

Funding

This research was funded by the National Natural Science Foundation of China, grant number 42372327, and the National Natural Science Foundation of China, grant number 42177153.

Institutional Review Board Statement

Not applicable.

Informed Consent Statement

Not applicable.

Data Availability Statement

The data presented in this study are available on request from the corresponding author.

Conflicts of Interest

Author Quanwei Liu was employed by the company Qingdao Metro Group Co., Co., Ltd. Authors Linsheng Liu, Qingfei Xin and Zeyu Xin were employed by the company Qingdao Metro Line 6 Co., Ltd. The remaining authors declare that the research was conducted in the absence of any commercial or financial relationships that could be construed as a potential conflict of interest.

References

  1. Zhang, Z.; Xu, G.; Dai, L.; Cheng, T.; Xi, B.; Chen, M.; Yang, J. A Modified Bearing Capacity Model for Inclined Shallow Anchor Cable with Experimental Verification. Appl. Sci. 2024, 14, 11457. [Google Scholar] [CrossRef] [Scilit]
  2. Wang, C.; Wang, H.; Qin, W.; Tian, H. Experimental and Numerical Studies on the Behavior and Retaining Mechanism of Anchored Stabilizing Piles in Landslides. Bull. Eng. Geol. Environ. 2021, 80, 7507–7524. [Google Scholar] [CrossRef] [Scilit]
  3. Wu, C.; Kong, L.; Guo, Q.; Cao, H. Enlarged Head Pressure-Dispersed Anchor Cable for Foundation Pit Engineering Purposes. Appl. Sci. 2022, 12, 12400. [Google Scholar] [CrossRef] [Scilit]
  4. Epackachi, S.; Esmaili, O.; Mirghaderi, S.R.; Behbahani, A.A.T. Behavior of Adhesive Bonded Anchors under Tension and Shear Loads. J. Constr. Steel Res. 2015, 114, 269–280. [Google Scholar] [CrossRef] [Scilit]
  5. Showkati, A.; Maarefvand, P.; Hassani, H. An Analytical Solution for Stresses Induced by a Post-Tensioned Anchor in Rocks Containing Two Perpendicular Joint Sets. Acta Geotech. 2016, 11, 415–432. [Google Scholar] [CrossRef] [Scilit]
  6. Tao, Z.; Zhu, C.; He, M.; Karakus, M. A Physical Modeling-Based Study on the Control Mechanisms of Negative Poisson’s Ratio Anchor Cable on the Stratified Toppling Deformation of Anti-Inclined Slopes. Int. J. Rock Mech. Min. Sci. 2021, 138, 104632. [Google Scholar] [CrossRef] [Scilit]
  7. Qin, X.; Ling, X.; Tian, S.; Wang, W.; Ma, Z.; Ji, X. Study on the Mechanical Response and Mechanism of High-Performance Mineral-Based Cementitious Materials Solidifying Discarded Ballast in Aqueous-Saline Environments. Transp. Geotech. 2026, 60, 102021. [Google Scholar] [CrossRef] [Scilit]
  8. Dong, Z.; Peng, H.; Liu, T.; Wang, K.; Zheng, J.; Li, H.; Qiu, X. Study on the Mechanism of Prestress Loss Caused by Friction in the Free Segment of Anchor Cables. Constr. Build. Mater. 2024, 413, 134927. [Google Scholar] [CrossRef] [Scilit]
  9. Li, Y.; Tian, H.; Li, D. A Novel Constitutive Law of Confined Grouted Rock Bolt under Pull-out Load Based on a Fully Nonlinear Bond–Slip Model. Can. Geotech. J. 2025, 62, 1–15. [Google Scholar] [CrossRef] [Scilit]
  10. Ma, S.; Ma, D. Grouting Material for Broken Surrounding Rock and Its Mechanical Properties of Grouting Reinforcement. Geotech. Geol. Eng. 2021, 39, 3785–3793. [Google Scholar] [CrossRef] [Scilit]
  11. Wang, S.R.; Wang, Y.H.; Gong, J.; Wang, Z.L.; Huang, Q.X.; Kong, F.L. Failure Mechanism and Constitutive Relation for an Anchorage Segment of an Anchor Cable under Pull-out Loading. Acta Mech. 2020, 231, 3305–3317. [Google Scholar] [CrossRef] [Scilit]
  12. Zhang, J.; Li, M.; Yi, J.; Liu, Z. Investigation on the Stability of Fissured Slopes Reinforced with Anchor Cables under Seismic Action. Math. Probl. Eng. 2021, 2021, 9262138. [Google Scholar] [CrossRef] [Scilit]
  13. Yan, M.; Xia, Y.; Liu, T.; Bowa, V.M. Limit Analysis under Seismic Conditions of a Slope Reinforced with Prestressed Anchor Cables. Comput. Geotech. 2019, 108, 226–233. [Google Scholar] [CrossRef] [Scilit]
  14. Zhu, B.; Li, Q.; Wu, Y.; Li, J. Analytical Model for Predicting Stress Distribution and Load Transfer of Tension-Type Anchor Cable with Borehole Deviation. Int. J. Geomech. 2020, 20, 04020085. [Google Scholar] [CrossRef] [Scilit]
  15. Albusairi, M.; Torres-Verdín, C. Fast-Forward Modeling of Borehole Nuclear Magnetic Resonance Measurements Acquired in Deviated Wells and Spatially Heterogeneous Formations. Geophysics 2023, 88, D95–D113. [Google Scholar] [CrossRef] [Scilit]
  16. Zhou, K.; Mao, J.; Li, Y.; Zhang, H.; Deng, Z. Prediction and Parametric Analysis of 3D Borehole and Total Internal Thermal Resistance of Single U-Tube Borehole Heat Exchanger for Ground Source Heat Pumps. Energy Built Environ. 2023, 4, 179–194. [Google Scholar] [CrossRef] [Scilit]
  17. Phillips, S.H.E. Factors Affecting the Design of Anchorages in Rock; Cementation Research Ltd.: Sandy, UT, USA, 1970. [Google Scholar]
  18. Hu, X.; Zhou, C.; Xu, C.; Liu, D.; Wu, S.; Li, L. Model Tests of the Response of Landslide-Stabilizing Piles to Piles with Different Stiffness. Landslides 2019, 16, 2187–2200. [Google Scholar] [CrossRef] [Scilit]
  19. Zhou, C.; Hu, X.; Zheng, W.; Xu, C.; Wang, Q. Displacement Characteristic of Landslides Reinforced with Flexible Piles: Field and Physical Model Test. J. Mt. Sci. 2020, 17, 787–800. [Google Scholar] [CrossRef] [Scilit]
  20. Yu, G.; Zhu, B.; Suo, Y.; Wu, X. Elastic Theoretical Analysis on the Shear Stress Distribution of Tensile Type Anchorage Segment under Borehole Deviation. Hydrogeol. Eng. Geol. 2015, 42, 114–119. [Google Scholar] [CrossRef]
  21. Zhou, C.; Hu, Y.; Xiao, T.; Ou, Q.; Wang, L. Analytical Model for Reinforcement Effect and Load Transfer of Pre-Stressed Anchor Cable with Bore Deviation. Constr. Build. Mater. 2023, 379, 131219. [Google Scholar] [CrossRef] [Scilit]
  22. Cox, H.L. The Elasticity and Strength of Paper and Other Fibrous Materials. Br. J. Appl. Phys. 1952, 3, 72–79. [Google Scholar] [CrossRef] [Scilit]
  23. Chen, Z.; Yu, Y.; Wang, X.; Wu, X.; Liu, H. Experimental Research on Bending Performance of Structural Cable. Constr. Build. Mater. 2015, 96, 279–288. [Google Scholar] [CrossRef] [Scilit]
  24. Rao, X. Study on Anchorage Performance and Load-Transfer Mechanism of Embedment Section of Prestressed Rock Cable Bolt. Ph.D. Thesis, Chongqing University, Chongqing, China, 2008. [Google Scholar]
  25. Chen, W.; Hong, C.; Chen, X.; Luo, G.; Su, D. Comparative Analysis of Anchor Cables in Pullout Tests Using Distributed Fiber Optic Sensors. Can. Geotech. J. 2023, 60, 1861–1876. [Google Scholar] [CrossRef] [Scilit]
  26. Franco, A.; Royer-Carfagni, G. Effective Bond Length of FRP Stiffeners. Int. J. Non-Linear Mech. 2014, 60, 46–57. [Google Scholar] [CrossRef] [Scilit]
  27. Vlachopoulos, N.; Cruz, D.; Forbes, B. Utilizing a Novel Fiber Optic Technology to Capture the Axial Responses of Fully Grouted Rock Bolts. J. Rock Mech. Geotech. Eng. 2018, 10, 222–235. [Google Scholar] [CrossRef] [Scilit]
  28. Li, C.C.; Kristjansson, G.; Høien, A.H. Critical Embedment Length and Bond Strength of Fully Encapsulated Rebar Rockbolts. Tunn. Undergr. Space Technol. 2016, 59, 16–23. [Google Scholar] [CrossRef] [Scilit]
  29. Høien, A.H.; Li, C.C.; Zhang, N. Pull-out and Critical Embedment Length of Grouted Rebar Rock Bolts-Mechanisms When Approaching and Reaching the Ultimate Load. Rock Mech. Rock Eng. 2021, 54, 1431–1447. [Google Scholar] [CrossRef] [Scilit]
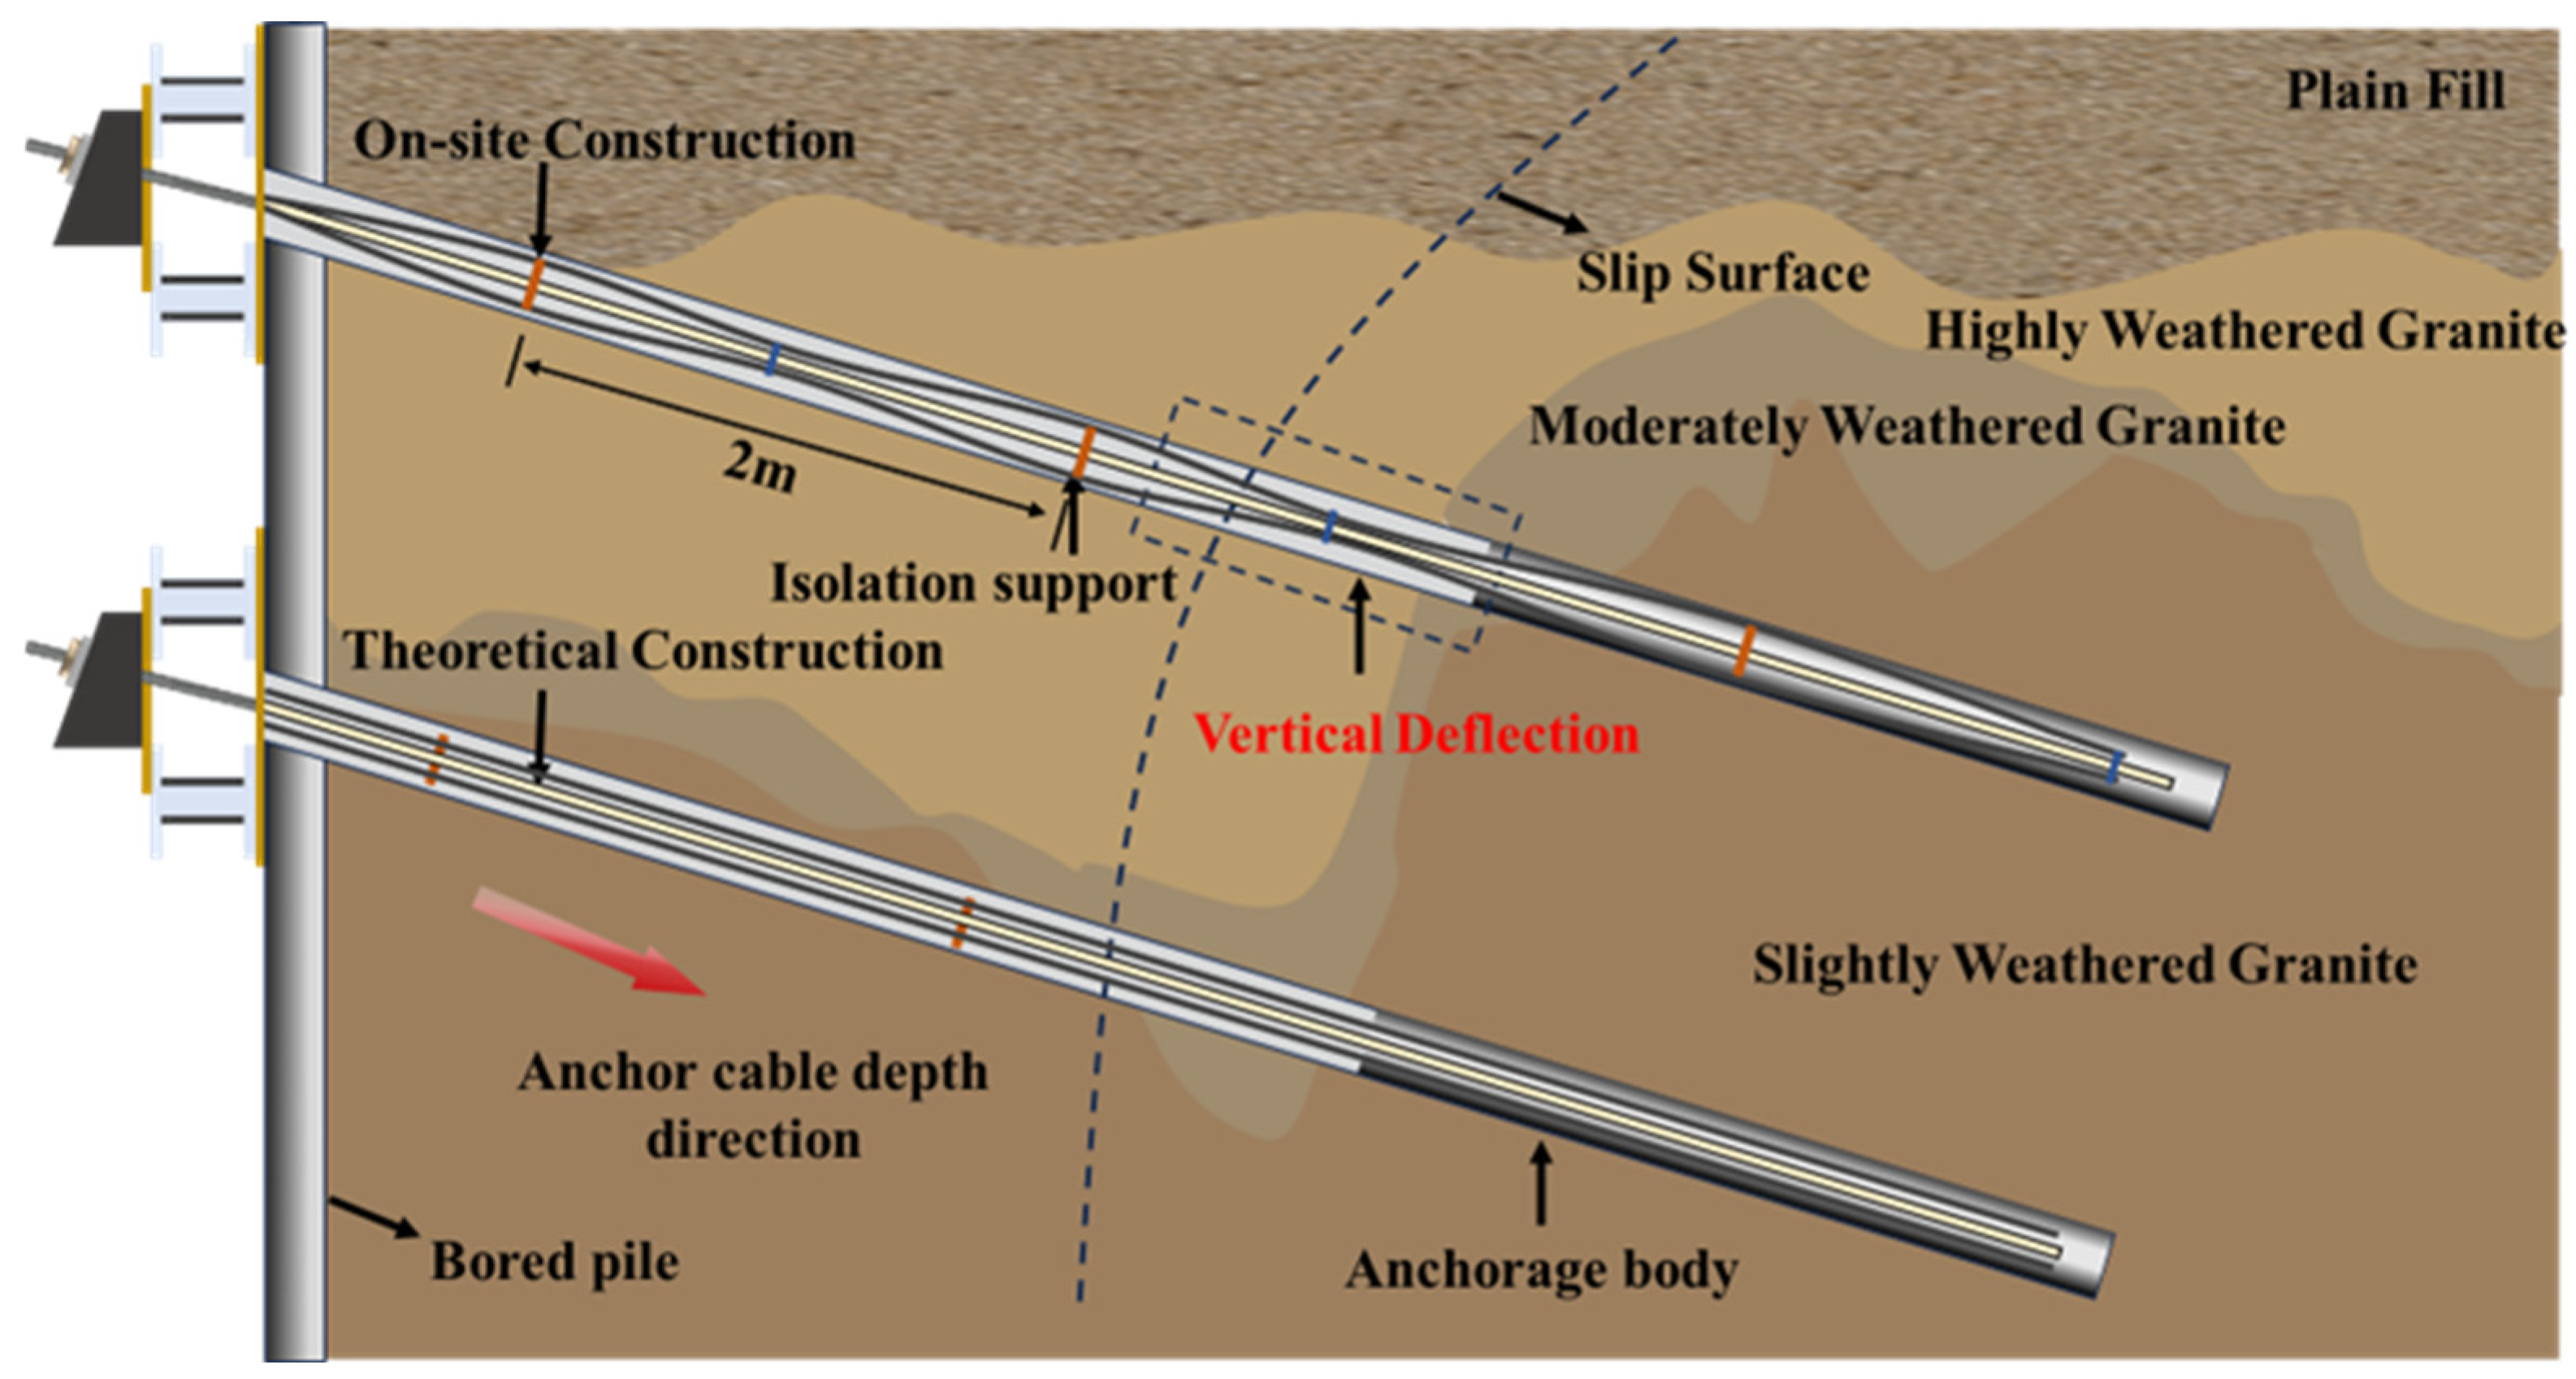
Figure 1. On-site construction and theoretical construction.
Applsci 16 04084 g001
Figure 2. Differential element analysis of linear anchor cable.
Applsci 16 04084 g002
Figure 3. Differential element analysis of the bending anchor cable.
Applsci 16 04084 g003
Figure 4. Distribution model flow chart.
Applsci 16 04084 g004
Figure 5. Axial force distribution.
Applsci 16 04084 g005
Figure 6. Relative attenuation of axial force.
Applsci 16 04084 g006
Figure 7. Shear stress distribution.
Applsci 16 04084 g007
Figure 8. Relative attenuation of shear stress.
Applsci 16 04084 g008
Figure 9. Comparison of axial force distribution of linear and bending anchorage cables with different anchorage lengths.
Applsci 16 04084 g009
Figure 10. Shear stress distribution.
Applsci 16 04084 g010
Figure 11. Relative attenuation of shear stress.
Applsci 16 04084 g011
Figure 12. Axial force distribution.
Applsci 16 04084 g012
Figure 13. Relative attenuation of axial force.
Applsci 16 04084 g013
Figure 14. Shear stress distribution.
Applsci 16 04084 g014
Figure 15. Relative attenuation of shear stress.
Applsci 16 04084 g015
Figure 16. Sensitivity analysis of the friction coefficient μ.
Applsci 16 04084 g016
Figure 17. Material specifications and sample diagrams.
Applsci 16 04084 g017
Figure 18. Test diagram.
Applsci 16 04084 g018
Figure 19. Linear model comparison results. (a,c) axial force comparison, (b,d) shear force comparison.
Applsci 16 04084 g019
Figure 20. Bending model comparison results. (a,c) axial force comparison, (b,d) shear force comparison.
Applsci 16 04084 g020
Disclaimer/Publisher’s Note: The statements, opinions and data contained in all publications are solely those of the individual author(s) and contributor(s) and not of MDPI and/or the editor(s). MDPI and/or the editor(s) disclaim responsibility for any injury to people or property resulting from any ideas, methods, instructions or products referred to in the content.