Article

Application of Natural Deep Eutectic Solvents (NADES) for the Extraction of Floral Phenolics and Anthocyanin Degradation Kinetics


by
Bartłomiej Zieniuk
Department of Chemistry, Institute of Food Sciences, Warsaw University of Life Sciences-SGGW, 159C Nowoursynowska Str., 02-776 Warsaw, Poland
Appl. Sci. 2026, 16(8), 4036; https://doi.org/10.3390/app16084036
Submission received: 25 March 2026 / Revised: 6 April 2026 / Accepted: 19 April 2026 / Published: 21 April 2026
(This article belongs to the Section Chemical and Molecular Sciences)

Featured Application

Natural deep eutectic solvents (NADES) can be used as eco-friendly extraction media for producing flower-derived phenolic and antioxidant extracts intended for food, cosmetic, and nutraceutical uses. The findings also offer practical guidance for choosing solvents by showing that extraction efficiency and anthocyanin storage stability may favor different solvent systems.

Abstract

Natural deep eutectic solvents (NADES) are promising eco-friendly alternatives to traditional solvents for extracting phenolic compounds from plant materials. However, their effectiveness depends on both solvent composition and the botanical matrix. This study examined water, ethanol, and choline chloride–urea (CCU) and choline chloride–glycerol (CCG) systems containing 30% or 60% NADES for the extraction of anthocyanins, total phenolic content, total flavonoid content, and antioxidant capacity (DPPH and ABTS) from cornflower, safflower, and pomegranate flowers. Pomegranate flowers exhibited the highest levels of anthocyanins, total phenolics, and antioxidants, while safflower showed the highest total flavonoid content. Overall, the 60% NADES formulations delivered the best extraction results, whereas ethanol had the lowest overall efficiency. A combined heatmap analyzing all responses identified 60% CCU and 60% CCG as the most effective solvents across all tested materials. Anthocyanin stability in pomegranate flower extracts was further evaluated over 8 weeks at 4 and 20 °C. First-order kinetic analysis revealed that ethanol and 60% CCG maintained the highest anthocyanin stability, whereas 60% CCU exhibited the lowest stability, especially at 20 °C. These findings support the use of NADES as efficient solvents for floral bioactives, while indicating that the highest extraction yield does not necessarily correlate with the best storage stability.

1. Introduction

Anthocyanins are an important class of plant phenolics responsible for the red, purple, and blue colors of many fruits and flowers [1,2]. In addition to their use as natural colorants, anthocyanins and related phenolic compounds are of growing interest for food, cosmetic, and pharmaceutical applications because of their antioxidant and anti-inflammatory properties [2,3]. Therefore, developing efficient extraction strategies for these compounds is important both for ingredient production and for the valorization of bioactive-rich plant materials within circular economy approaches [3,4]. Despite this interest, industrial and laboratory extraction of phenolics and pigments still mainly depends on conventional solvents, particularly water and volatile organic solvents (VOCs) like ethanol, methanol, and acetone [1,2]. Although ethanol is often seen as a relatively “green” organic solvent compared to methanol or acetone, heavy reliance on volatile solvents presents ongoing challenges such as flammability, solvent emissions, and possible residue concerns in consumer products [2,5,6]. These issues, along with growing regulatory and consumer demands for safer and more sustainable processes, have sped up the search for alternative extraction media that can lessen environmental impact while maintaining high extraction efficiency [2,5,6].
Natural Deep Eutectic Solvents (NADES) have emerged as a promising type of “green” solvent capable of addressing many issues associated with traditional extraction methods [1,2,3,4,5,6]. NADES are typically prepared by mixing naturally occurring metabolites, such as a hydrogen bond acceptor (HBA) like choline chloride with a hydrogen bond donor (HBD) such as polyols, organic acids, sugars, or amides at specific molar ratios to create a eutectic mixture with a lower melting point [7]. Many NADES are characterized by low vapor pressure and low volatility, and they are often made from naturally occurring or food-relevant components, which has increased interest in them as alternative extraction media. Additionally, several studies have shown that certain NADES formulations are biodegradable and have relatively low cytotoxicity, although these properties heavily depend on solvent composition, concentration, and application context [8,9,10]. Importantly, the strong hydrogen-bonding network in NADES can effectively dissolve polar phytochemicals, including many phenolics and anthocyanins, and may generate a microenvironment that minimizes oxidative or thermal damage to sensitive pigments during processing and storage [8].
Previous studies have shown that choline chloride-based NADES can be effective for extracting plant phenolics and anthocyanins, and that water content is a critical factor influencing viscosity, polarity, mass transfer, and overall extraction efficiency [11,12,13,14,15]. However, most existing research focuses on individual plant matrices, making it challenging to compare solvent performance across floral materials with varying phytochemical profiles. The three chosen floral species showcase distinct phytochemical profiles and practical uses. Punica granatum flowers are high in anthocyanins, making them noteworthy for their antioxidant and antidiabetic properties [16]. Centaurea cyanus petals are appreciated as edible flowers and as sources of blue natural pigments and antioxidants for food purposes [17]. Carthamus tinctorius petals are recognized for their flavonoids and natural colorants, relevant to food and health applications [18]. Overall, these samples offer a diverse set of floral matrices to study how NADES effectiveness varies with botanical makeup.
Although NADES have shown strong potential for extracting phenolic and anthocyanin compounds from plant materials, the existing literature is still mainly composed of single-matrix studies. As a result, it is unclear whether solvent systems that work well in one floral or plant matrix will perform similarly in others with different pigment and phenolic profiles. Additionally, extraction efficiency and post-extraction anthocyanin stability are often considered separately, even though both are essential for the practical use of flower-derived extracts. This is especially important for floral materials, where anthocyanin-rich extracts may be appealing as functional ingredients or colorants, but their value depends not only on extraction yield but also on stability during storage [3,4,6]. Therefore, a comparative evaluation that combines extraction performance across multiple floral matrices with subsequent anthocyanin degradation behavior remains necessary.
Accordingly, the aim of this study was to compare selected choline chloride-based NADES with conventional solvents for the extraction of anthocyanins, phenolics, flavonoids, and antioxidant activity from three dried floral matrices, and to determine whether the solvent system that improves extraction also supports anthocyanin stability during storage. This combined extraction–stability approach was intended to provide a more application-oriented basis for selecting NADES for flower-derived extracts.

2. Materials and Methods

2.1. Materials

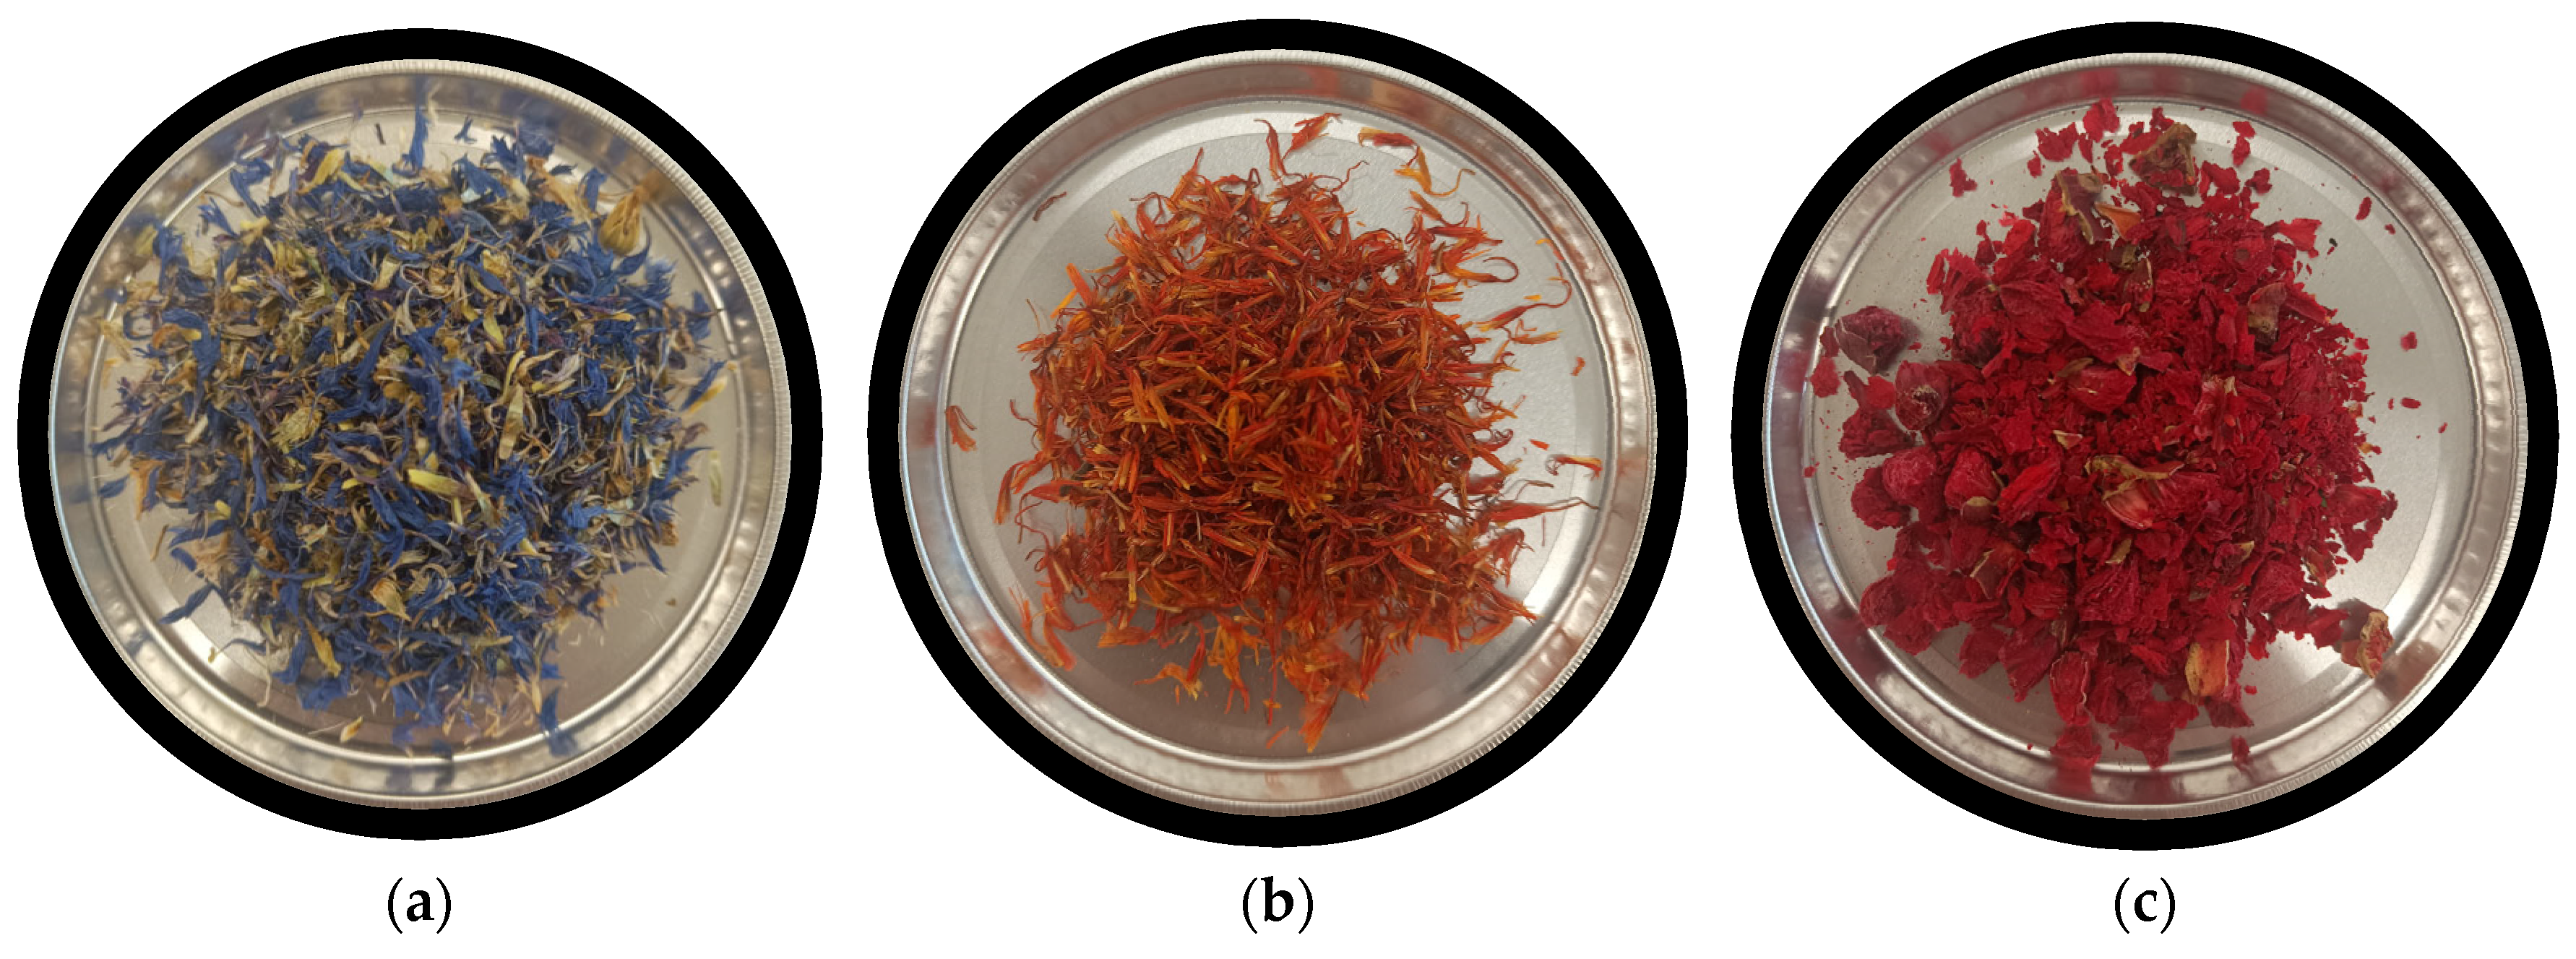
Dried floral materials served as the initial plant matrix for extraction experiments. They were pomegranate flowers (Punica granatum L.), cornflower petals (Centaurea cyanus L.), and safflower petals (Carthamus tinctorius L.) (Figure 1). All materials were purchased as commercial, single-ingredient dried botanicals from NANGA (Blękwit, Poland). According to the product labels, the declared countries of origin were Azerbaijan (pomegranate flower), Albania (cornflower petals), and China (safflower petals). Upon receipt, samples were stored in a dry, cool place protected from light until analysis. Before extraction, each dried material was ground using a coffee grinder (Esperanza, Ożarów Mazowiecki, Poland).

2.2. Chemicals and Reagents

Choline chloride, urea, glycerol, Folin–Ciocalteu reagent, sodium carbonate, aluminum chloride, sodium acetate, 2,2-diphenyl-1-picrylhydrazyl (DPPH), 2,2′-azinobis(3-ethylbenzothiazoline-6-sulfonic acid) diammonium salt (ABTS), potassium persulfate, Trolox, gallic acid, quercetin, potassium chloride, ethanol, and hydrochloric acid were of analytical grade and purchased from Merck Life Science sp. z o.o. (Poznań, Poland) and Avantor Performance Materials Poland S.A. (Gliwice, Poland).

2.3. Preparation of Natural Deep Eutectic Solvents

Two choline chloride-based natural deep eutectic solvents (NADES) were prepared: choline chloride–urea (CCU) and choline chloride–glycerol (CCG), both at a molar ratio of 1:2. Choline chloride served as the hydrogen bond acceptor, while urea and glycerol acted as hydrogen bond donors. The NADES were prepared by direct heating. Appropriate amounts of the components were weighed into sealed glass containers and heated in a water bath at 70 °C for 2 h until homogeneous, transparent liquids were formed. The mixtures were stirred manually at intervals during heating. After cooling to room temperature, the NADES were diluted with distilled water to create extraction systems containing 30% NADES + 70% water and 60% NADES + 40% water. These solvent systems are referred to as 30% CCU, 60% CCU, 30% CCG, and 60% CCG.

2.4. Extraction Procedure

Extraction was conducted using six solvent systems: water, ethanol, 30% CCU, 60% CCU, 30% CCG, and 60% CCG. Ground plant material (1.0 g) was placed into 50 mL centrifuge tubes, and 15 mL of the respective solvent was added (solid-to-solvent ratio 1:15, w/v). The mixtures were vortexed for 1 min and then incubated in a water bath at 60 °C for 30 min. After extraction, the samples were centrifuged at 8000 rpm for 10 min (MPW-352, MPW Med. Instruments, Warsaw, Poland). The resulting supernatants were used directly for anthocyanin analysis. To determine total phenolic content, total flavonoid content, and antioxidant activity (DPPH and ABTS), 15 mL of distilled water was added to the remaining extract, followed by centrifugation at 8000 rpm for 10 min. Then, 3 mL of the supernatant was transferred to a centrifuge tube and diluted to 45 mL for the respective spectrophotometric assays. For all spectrophotometric assays, measurements were taken against suitable blanks, including reagent blanks and solvent-specific reference samples prepared with the corresponding extraction media, to account for background absorbance and potential interference from NADES or traditional solvents.

2.5. Determination of Total Monomeric Anthocyanins

Total monomeric anthocyanin content was determined using the pH differential method [19,20]. Briefly, 0.3 mL of the extract was mixed separately with 9.7 mL of pH 1.0 buffer (0.025 M potassium chloride) and 9.7 mL of pH 4.5 buffer (0.4 M sodium acetate). After equilibration in the dark for 30 min at room temperature, absorbance was measured at 525 and 700 nm using a UV–Vis spectrophotometer (Rayleigh UV-1601, Beijing Beifen-Ruili Analytical Instrument (Group) Co., Ltd., Beijing, China). Monomeric anthocyanin concentration was calculated as cyanidin-3-glucoside equivalents and expressed as mg cyanidin-3-glucoside equivalents per g dry weight (mg C3GE/g DW).

2.6. Determination of Total Phenolic Content

Total phenolic content (TPC) was measured using the Folin–Ciocalteu method [13]. For this assay, 0.18 mL of extract was diluted with 4.92 mL of distilled water and combined with 0.30 mL of Folin–Ciocalteu reagent. After 3 min, 0.60 mL of 17.7% (w/v) sodium carbonate solution was added. The mixture was vortexed and left to incubate in the dark for 60 min at room temperature. Absorbance was then recorded at 750 nm against a blank using the UV–Vis spectrophotometer mentioned earlier. A gallic acid calibration curve was prepared, and the results are expressed as milligrams of gallic acid equivalents per gram of dry weight (mg GAE/g DW).

2.7. Determination of Total Flavonoid Content

Total flavonoid content (TFC) was determined using the aluminum chloride colorimetric method [21,22]. In brief, 1.0 mL of extract was combined with 0.20 mL of aluminum chloride solution, 0.20 mL of 1 M sodium acetate, and 5.60 mL of distilled water. The mixture was incubated in the dark for 30 min at room temperature, after which absorbance was measured at 430 nm against the blank. The results were quantified using a quercetin calibration curve and expressed as milligrams of quercetin equivalents per gram of dry weight (mg QE/g DW).

2.8. DPPH Radical Scavenging Activity

DPPH radical scavenging activity was determined spectrophotometrically [23]. A 0.004% (w/v) solution of DPPH in methanol was freshly prepared. Then, 0.30 mL of the extract was mixed with 2.70 mL of the DPPH solution. After incubation in the dark for 30 min at room temperature, absorbance was measured at 517 nm. Antioxidant activity was calculated using a Trolox calibration curve and expressed as mmol Trolox equivalents per g dry weight (mmol TE/g DW).

2.9. ABTS Radical Cation Scavenging Activity

ABTS radical cation scavenging activity was measured using a modified ABTS assay [24]. A 7 mM ABTS stock solution was prepared in distilled water and reacted with potassium persulfate to reach a final concentration of 2.45 mM. The mixture was kept in the dark at room temperature for 16 h to produce the ABTS radical cation. Before testing, the working ABTS solution was diluted with distilled water to achieve an absorbance of 0.700 ± 0.020 at 734 nm. For the assay, 40 µL of the extract was combined with 4.0 mL of the prepared ABTS solution. After a 6 min reaction at room temperature, the absorbance was read at 734 nm. Trolox served as the calibration standard, and the results were expressed as mmol Trolox equivalents per g of dry weight (mmol TE/g DW).

2.10. Storage Stability of Anthocyanins

Based on the screening results, one floral material was selected for the storage study. Extracts made with water, ethanol, 60% CCG, and 60% CCU were stored at 4 °C and 20 °C under isothermal conditions for 8 weeks (56 days). Samples were kept away from light during storage. Anthocyanin content was measured weekly using the pH differential method described earlier. The results were presented as relative anthocyanin content (%) (Equation (1)) relative to the initial value on day 0 for each solvent–temperature pair:
Relative   anthocyanin   content % = C t C 0 × 100
where Ct is the anthocyanin content at a given storage time and C0 is the initial anthocyanin content measured at day 0.

2.11. Kinetic Analysis of Anthocyanin Degradation

Anthocyanin degradation is often described by first-order kinetics in storage studies, so this model was chosen as the primary kinetic method [25]. To verify, zero-, first-, and second-order models were also tested, and model suitability was evaluated using the coefficient of determination (R2). The first-order model was kept as the consistent basis for comparing estimates of k, t1/2, and T90. Anthocyanin degradation during storage was described using a first-order kinetic model (Equation (2)):
ln C t C 0   = k t
where Ct is the anthocyanin content at time t, C0 is the initial anthocyanin content, and k is the apparent first-order degradation rate constant (day−1). The degradation rate constant was obtained from the slope of the linear regression of ln(Ct/C0) versus storage time.
The half-life of anthocyanin degradation (t1/2) and the time required to retain 90% of the initial anthocyanin content (T90) were calculated as follows (Equations (3) and (4)):
t 1 / 2 = l n ( 2 ) k
T 90 = 0.10536 k
To evaluate the effect of temperature, the activation energy (Ea) was calculated according to the Arrhenius equation using the rate constants obtained at 4 °C and 20 °C. In addition, the temperature coefficient (Q10) was calculated as (Equation (5)):
Q 10 = k 20 k 4 10 / ( 20 4 )
where k20 and k4 are the degradation rate constants at 20 °C and 4 °C, respectively.

2.12. Statistical Analysis

All analyses were carried out in triplicate, and results are presented as mean ± standard deviation (SD). Statistical analysis was performed using Statistica 13.3 software (TIBCO Software Inc., Palo Alto, CA, USA). The normality of data distribution was assessed using the Shapiro–Wilk test, and homogeneity of variance was verified using Levene’s test. When assumptions for parametric testing were fulfilled, one-way analysis of variance (ANOVA) was performed, followed by Tukey’s honestly significant difference (HSD) post hoc test at a significance level of p < 0.05. To evaluate the overall extraction effectiveness of the tested solvents across three floral materials, a heatmap of the composite standardized performance index (Z-overall) was created. For each material, assay results (anthocyanins, TPC, TFC, DPPH, and ABTS) were standardized across solvents as z-scores. Hierarchical clustering was conducted using Ward’s linkage method and Euclidean distance on the z-scored data. The heatmap was produced with the ChiPlot online platform [26].

3. Results and Discussion

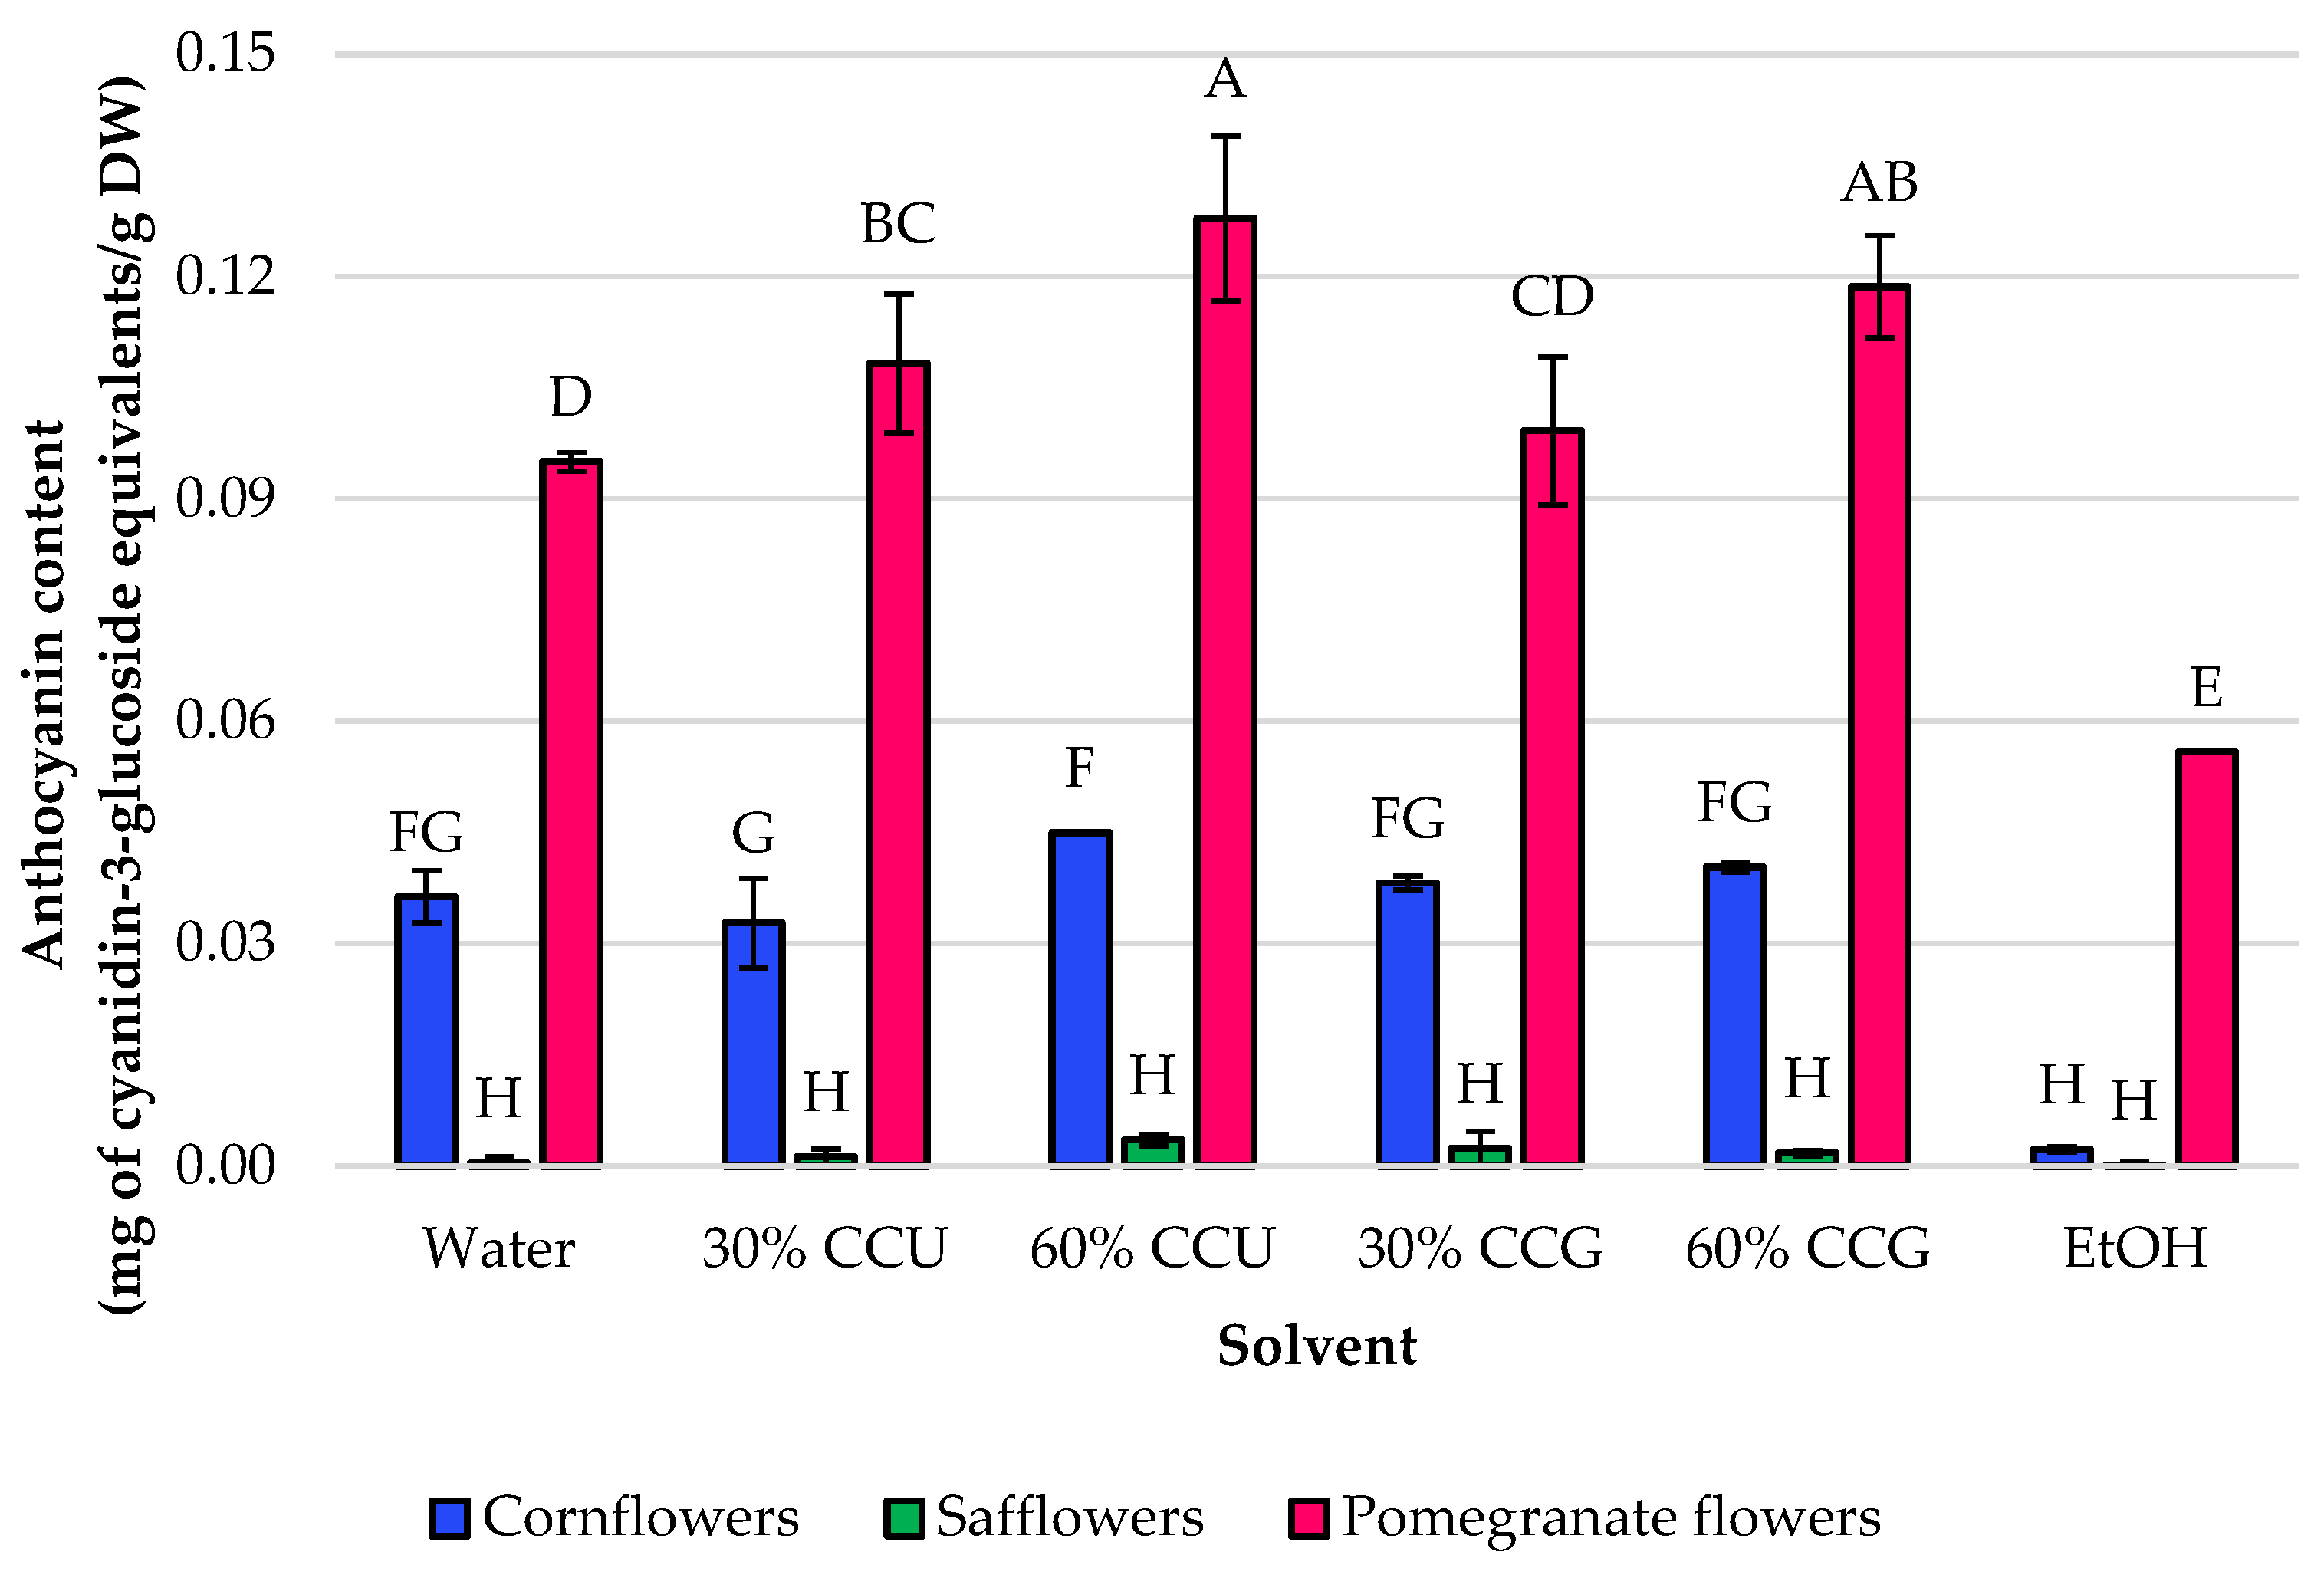
Anthocyanin concentration depended strongly on the floral matrix and, to a lesser extent, on the solvent system (Figure 2). Among the three materials, pomegranate flowers produced the highest anthocyanin levels by far (0.056–0.128 mg of cyanidin-3-glucoside equivalents/g DW), followed by cornflower petals (0.002–0.045 mg/g), while safflower petals contained only trace amounts near the detection limit (0.000–0.004 mg/g).
For pomegranate flowers, aqueous NADES clearly improved anthocyanin recovery compared to water and ethanol. The highest content was achieved with 60% CCU (0.128 ± 0.011 mg/g), followed by 60% CCG (0.119 ± 0.007 mg/g) and 30% CCU (0.108 ± 0.009 mg/g). Water extraction resulted in an intermediate value (0.095 ± 0.001 mg/g), while ethanol yielded the lowest anthocyanin content (0.056 ± 0.000 mg/g).
For cornflower petals, anthocyanin content was significantly lower than in pomegranate flowers, but the same trend was observed, i.e., NADES performed better than ethanol. The highest value was achieved with 60% CCU (0.045 ± 0.001 mg/g), while water and CCG-based mixtures were similar (0.036–0.040 mg/g). Ethanol extraction produced a very low anthocyanin level (0.002 mg/g), significantly less than those of the aqueous and NADES-based systems. In the case of safflower petals, anthocyanin levels were minimal across all solvents (≤0.004 mg/g). Although 60% CCU showed the highest mean (0.004 ± 0.001 mg/g), the differences among solvent systems were small and not statistically significant, indicating that safflower was not an anthocyanin-rich matrix.
The matrix-dependent variation mentioned is a well-known phenomenon, as the abundance, release, and profile of bioactive compounds are inherently linked to the morphological and cellular characteristics of the plant material being analyzed [27]. In the anthocyanin-rich matrices, especially pomegranate flower and, to a lesser extent, cornflower petals, NADES-based systems generally performed better than ethanol. This likely reflects their supramolecular structure and hydrogen-bonding capacity, which may improve the dissolution of polar phenolics such as anthocyanins [5,28]. The superior performance of the 60% CCU and 60% CCG systems suggests that extraction depended on a balance between solvent–solute interactions and mass transfer. NADES are known to form extensive hydrogen-bonding networks with phenolic hydroxyl groups, which can improve the dissolution of anthocyanins and related compounds [4,5]. Adding water lowers viscosity and improves penetration of plant tissue, whereas excessive dilution may weaken the supramolecular interactions responsible for solubilization [3,12]. The current results align with this pattern, as the more NADES-rich systems outperformed the 30% formulations while still remaining aqueous.
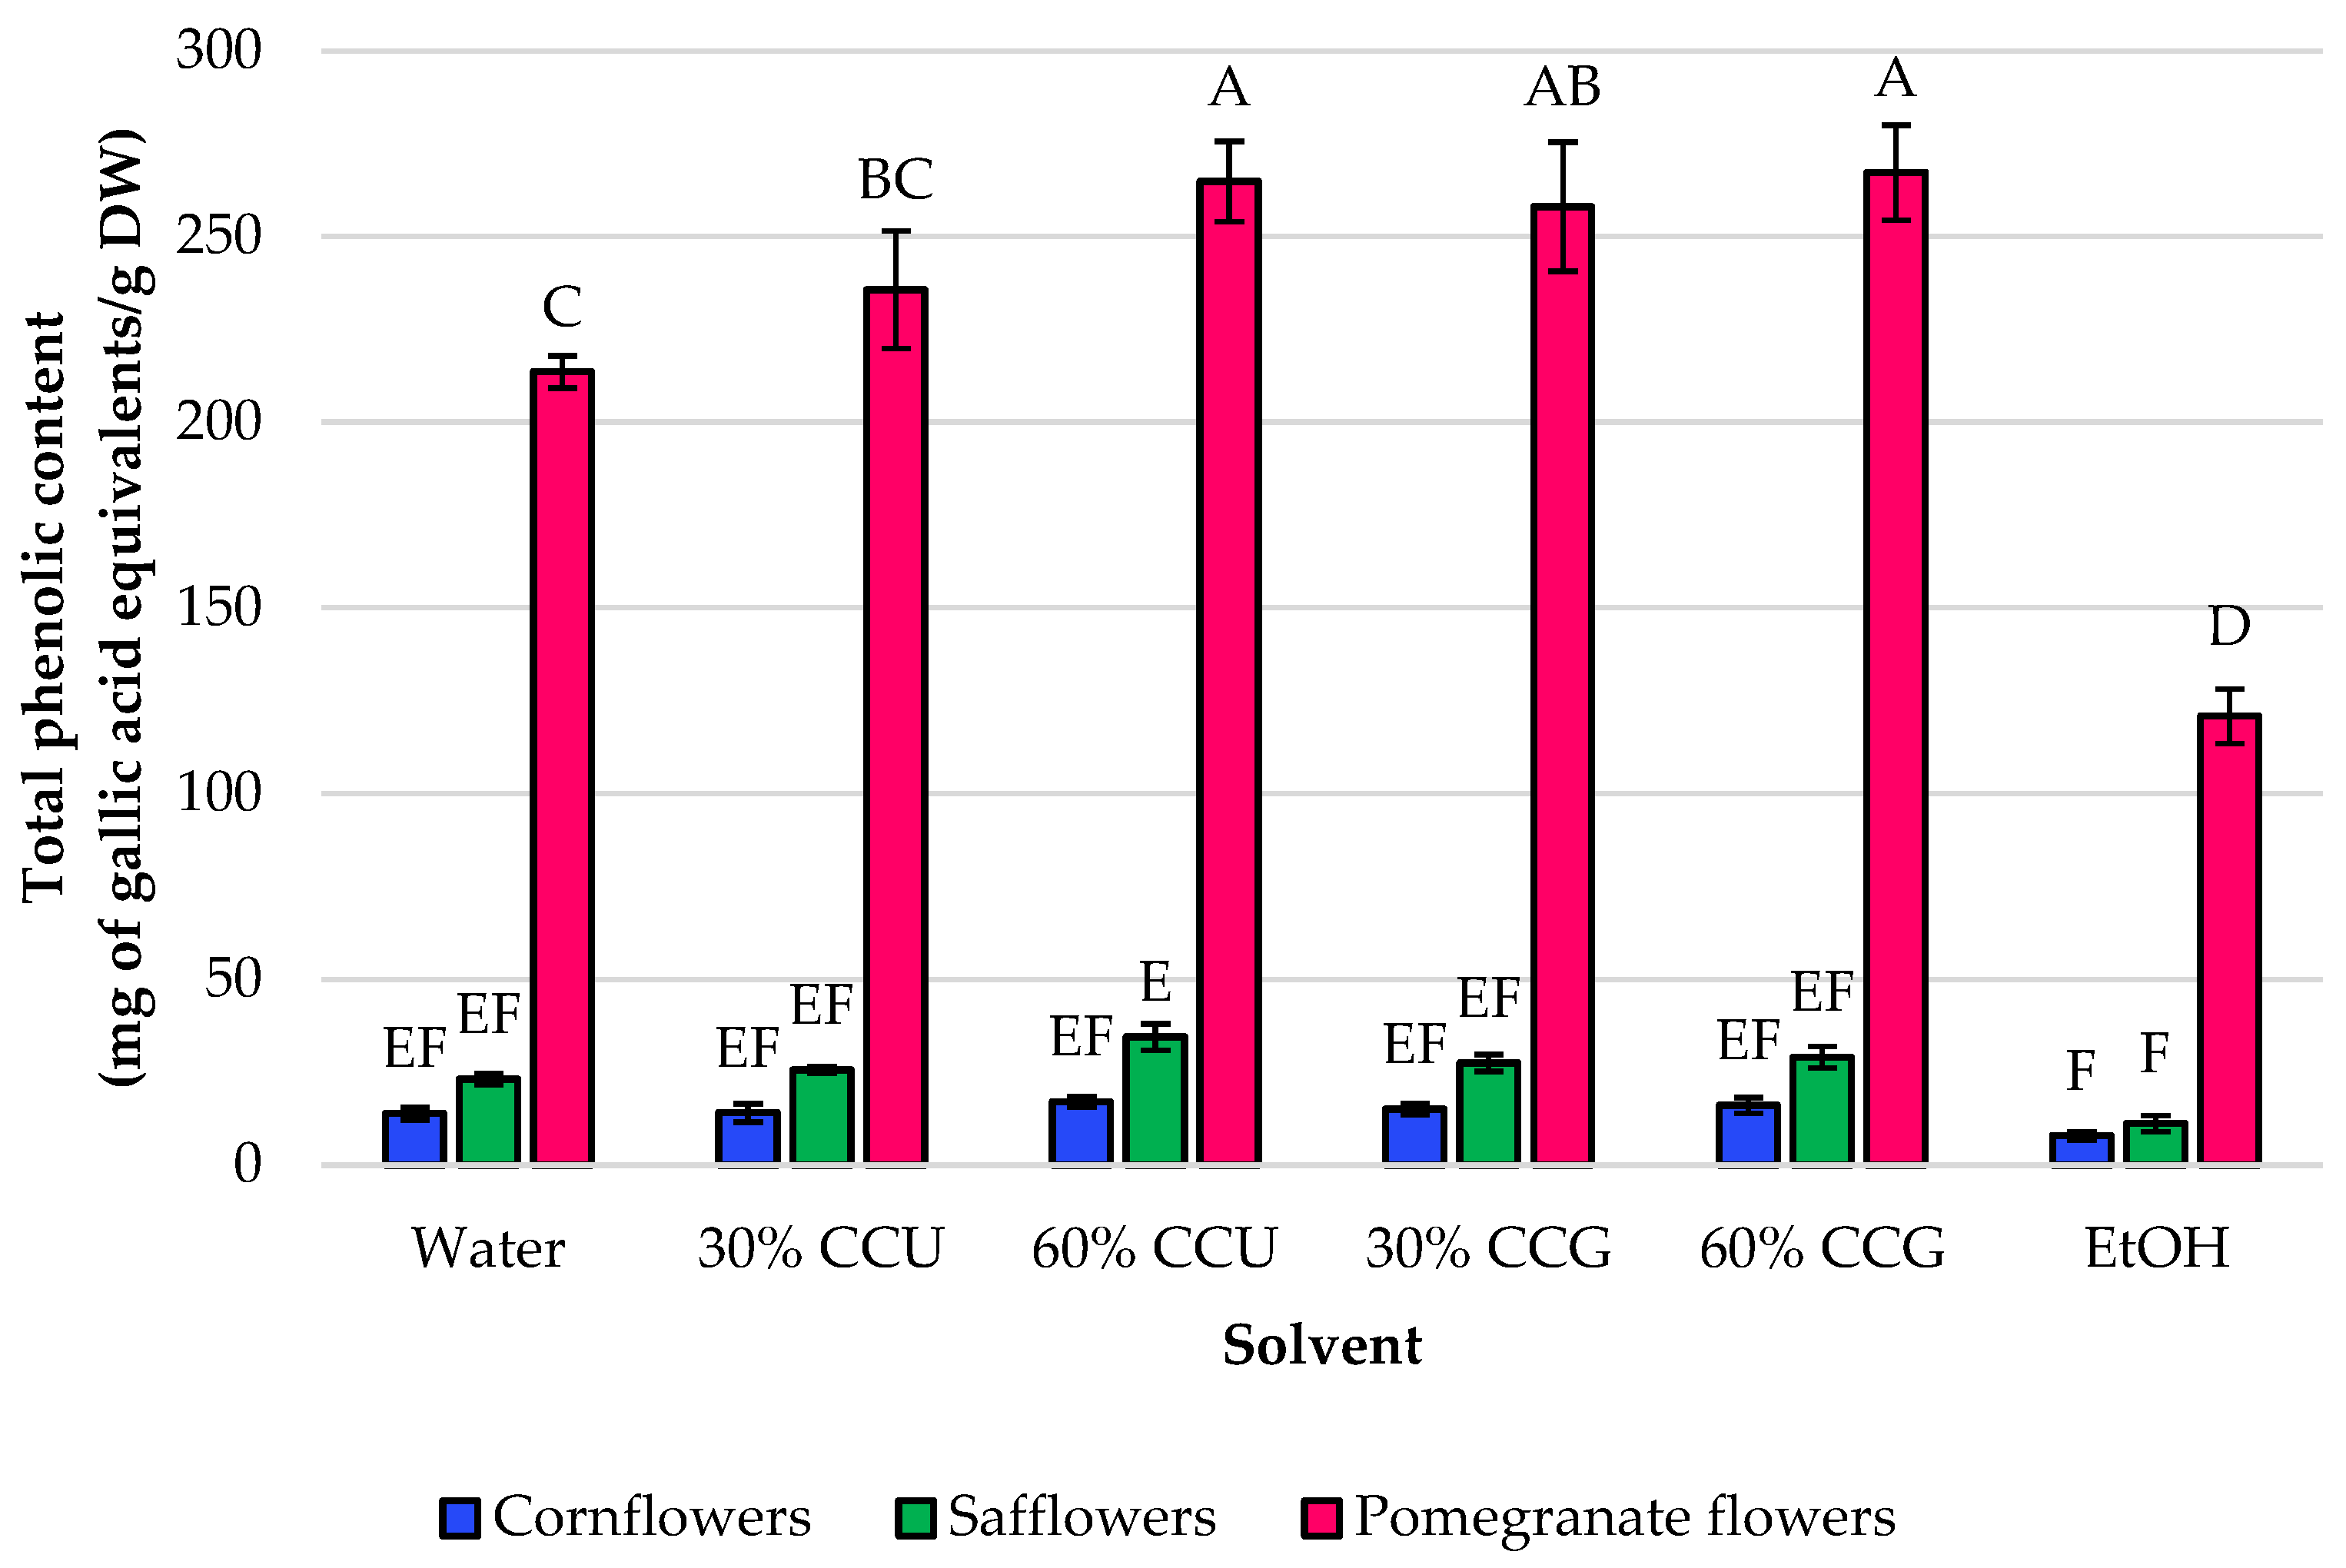
Total phenolic content was also strongly matrix-dependent, with pomegranate flowers showing substantially higher values than safflower and cornflower (Figure 3). For pomegranate flowers, TPC ranged from 120.8 ± 7.4 mg GAE/g (using ethanol as the solvent) to 267.2 ± 12.8 mg GAE/g (with 60% CCG). Water extraction yielded 218.1 ± 4.3 mg GAE/g, while NADES generally increased TPC compared to ethanol and, in several cases, also compared to water. The highest phenolic recoveries were achieved with the more NADES-rich formulations, specifically 60% CCG (267.2 ± 12.8 mg GAE/g) and 60% CCU (264.8 ± 10.8 mg GAE/g).
For safflower petals, TPC values ranged from 11.2 ± 2.2 to 34.5 ± 3.6 mg GAE/g DW. Ethanol yielded the lowest value, whereas the remaining solvent systems produced higher values that were, in most cases, not significantly different from one another, although 60% CCU showed the highest mean. For cornflower petals, TPC values ranged from 7.9 ± 1.1 to 17.1 ± 1.4 mg GAE/g DW. Although 60% CCU showed the highest mean and ethanol the lowest, no statistically significant differences were observed among the solvent systems under the tested conditions.
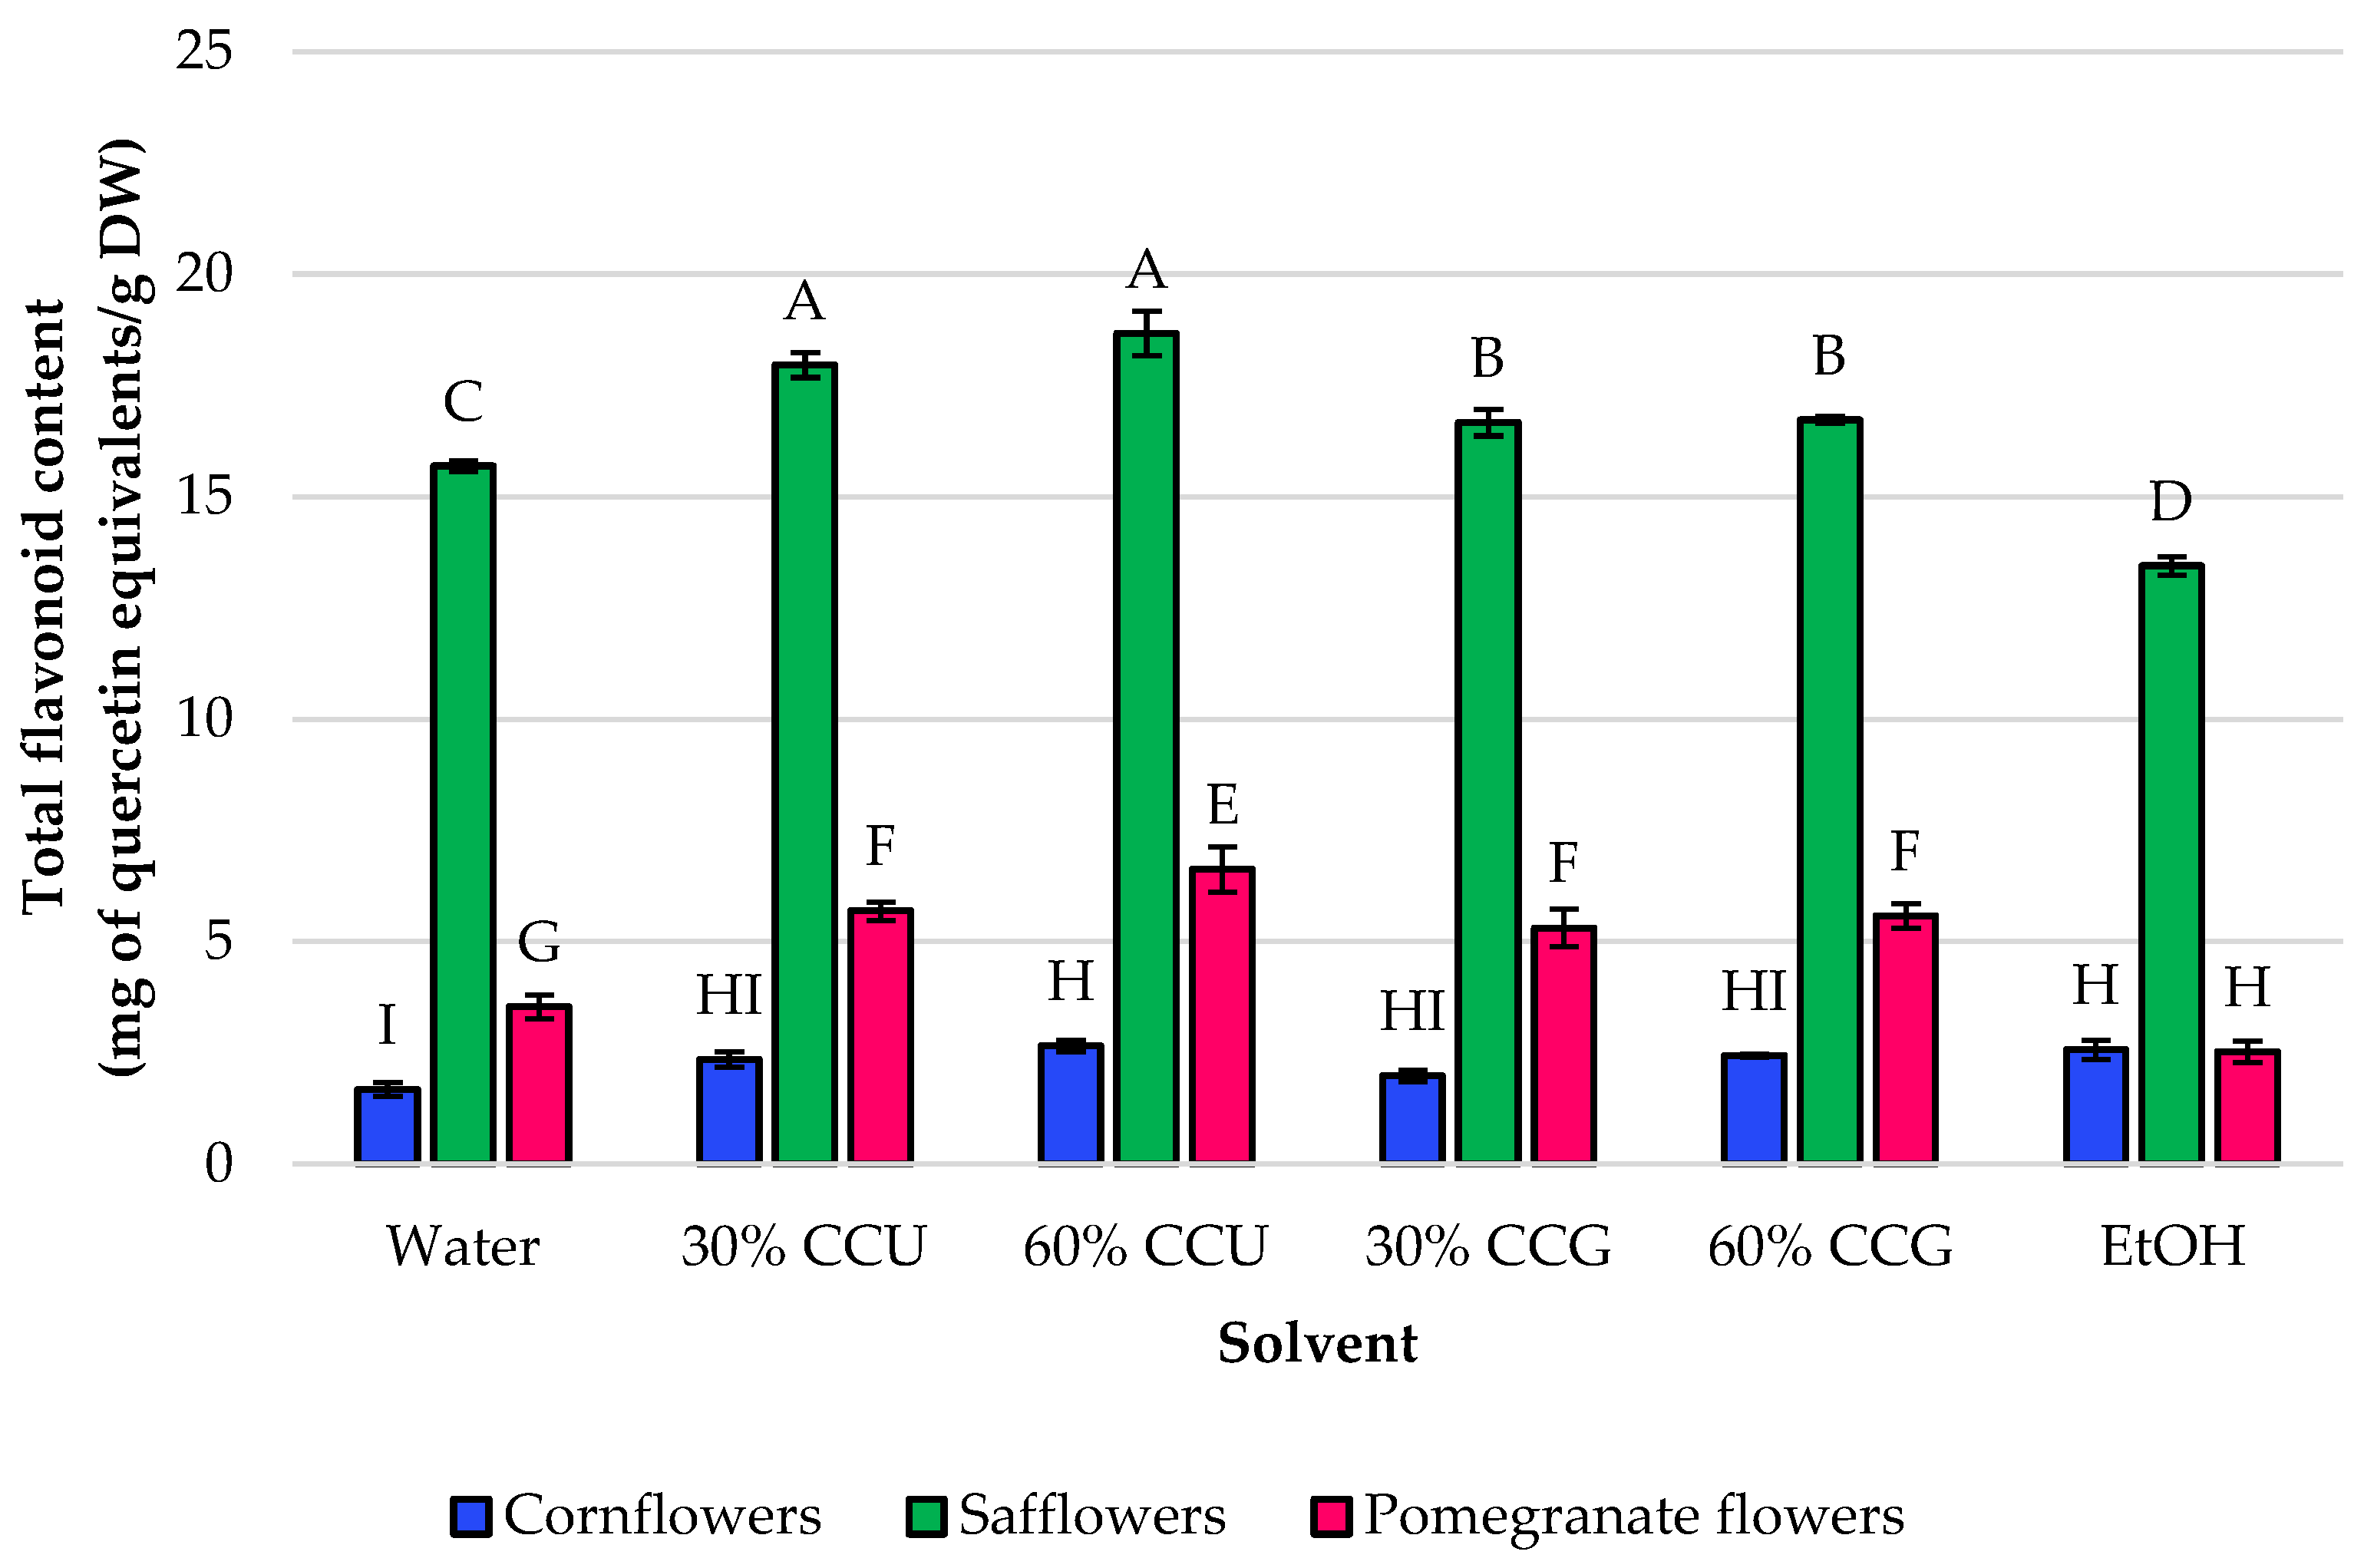
Safflower extracts exhibited the highest flavonoid levels (13.45–18.67 mg QE/g DW), followed by pomegranate flowers (2.52–6.63 mg QE/g DW), while cornflower extracts had the lowest amounts (1.68–2.66 mg QE/g DW) (Figure 4). In safflower petals, both CCU-based NADES increased flavonoid recovery compared to water (15.688 ± 0.119 mg QE/g) and ethanol, with 60% CCU achieving the highest average. CCG-based NADES produced intermediate results (16.661–16.723 mg QE/g), indicating that several NADES formulations performed similarly well in this matrix.
In pomegranate flowers, TFC values were generally lower but followed a similar solvent trend. The highest TFC was obtained with 60% CCU (6.625 ± 0.504 mg QE/g), followed by 30% CCU (5.689 ± 0.206 mg QE/g) and CCG formulations (5.307–5.578 mg QE/g). Water extraction yielded 3.534 ± 0.272 mg QE/g, while ethanol again resulted in the lowest flavonoid recovery (2.524 ± 0.246 mg QE/g). For cornflower petals, TFC values were the lowest among the studied materials. The highest mean value was observed for 60% CCU (2.660 ± 0.133 mg QE/g), with ethanol (2.574 ± 0.216 mg QE/g) and 60% CCG (2.438 ± 0.037 mg QE/g) showing similarly high means. Water extraction gave the lowest average (1.675 ± 0.154 mg QE/g), while 30% CCG also showed a relatively low value (1.983 ± 0.130 mg QE/g).
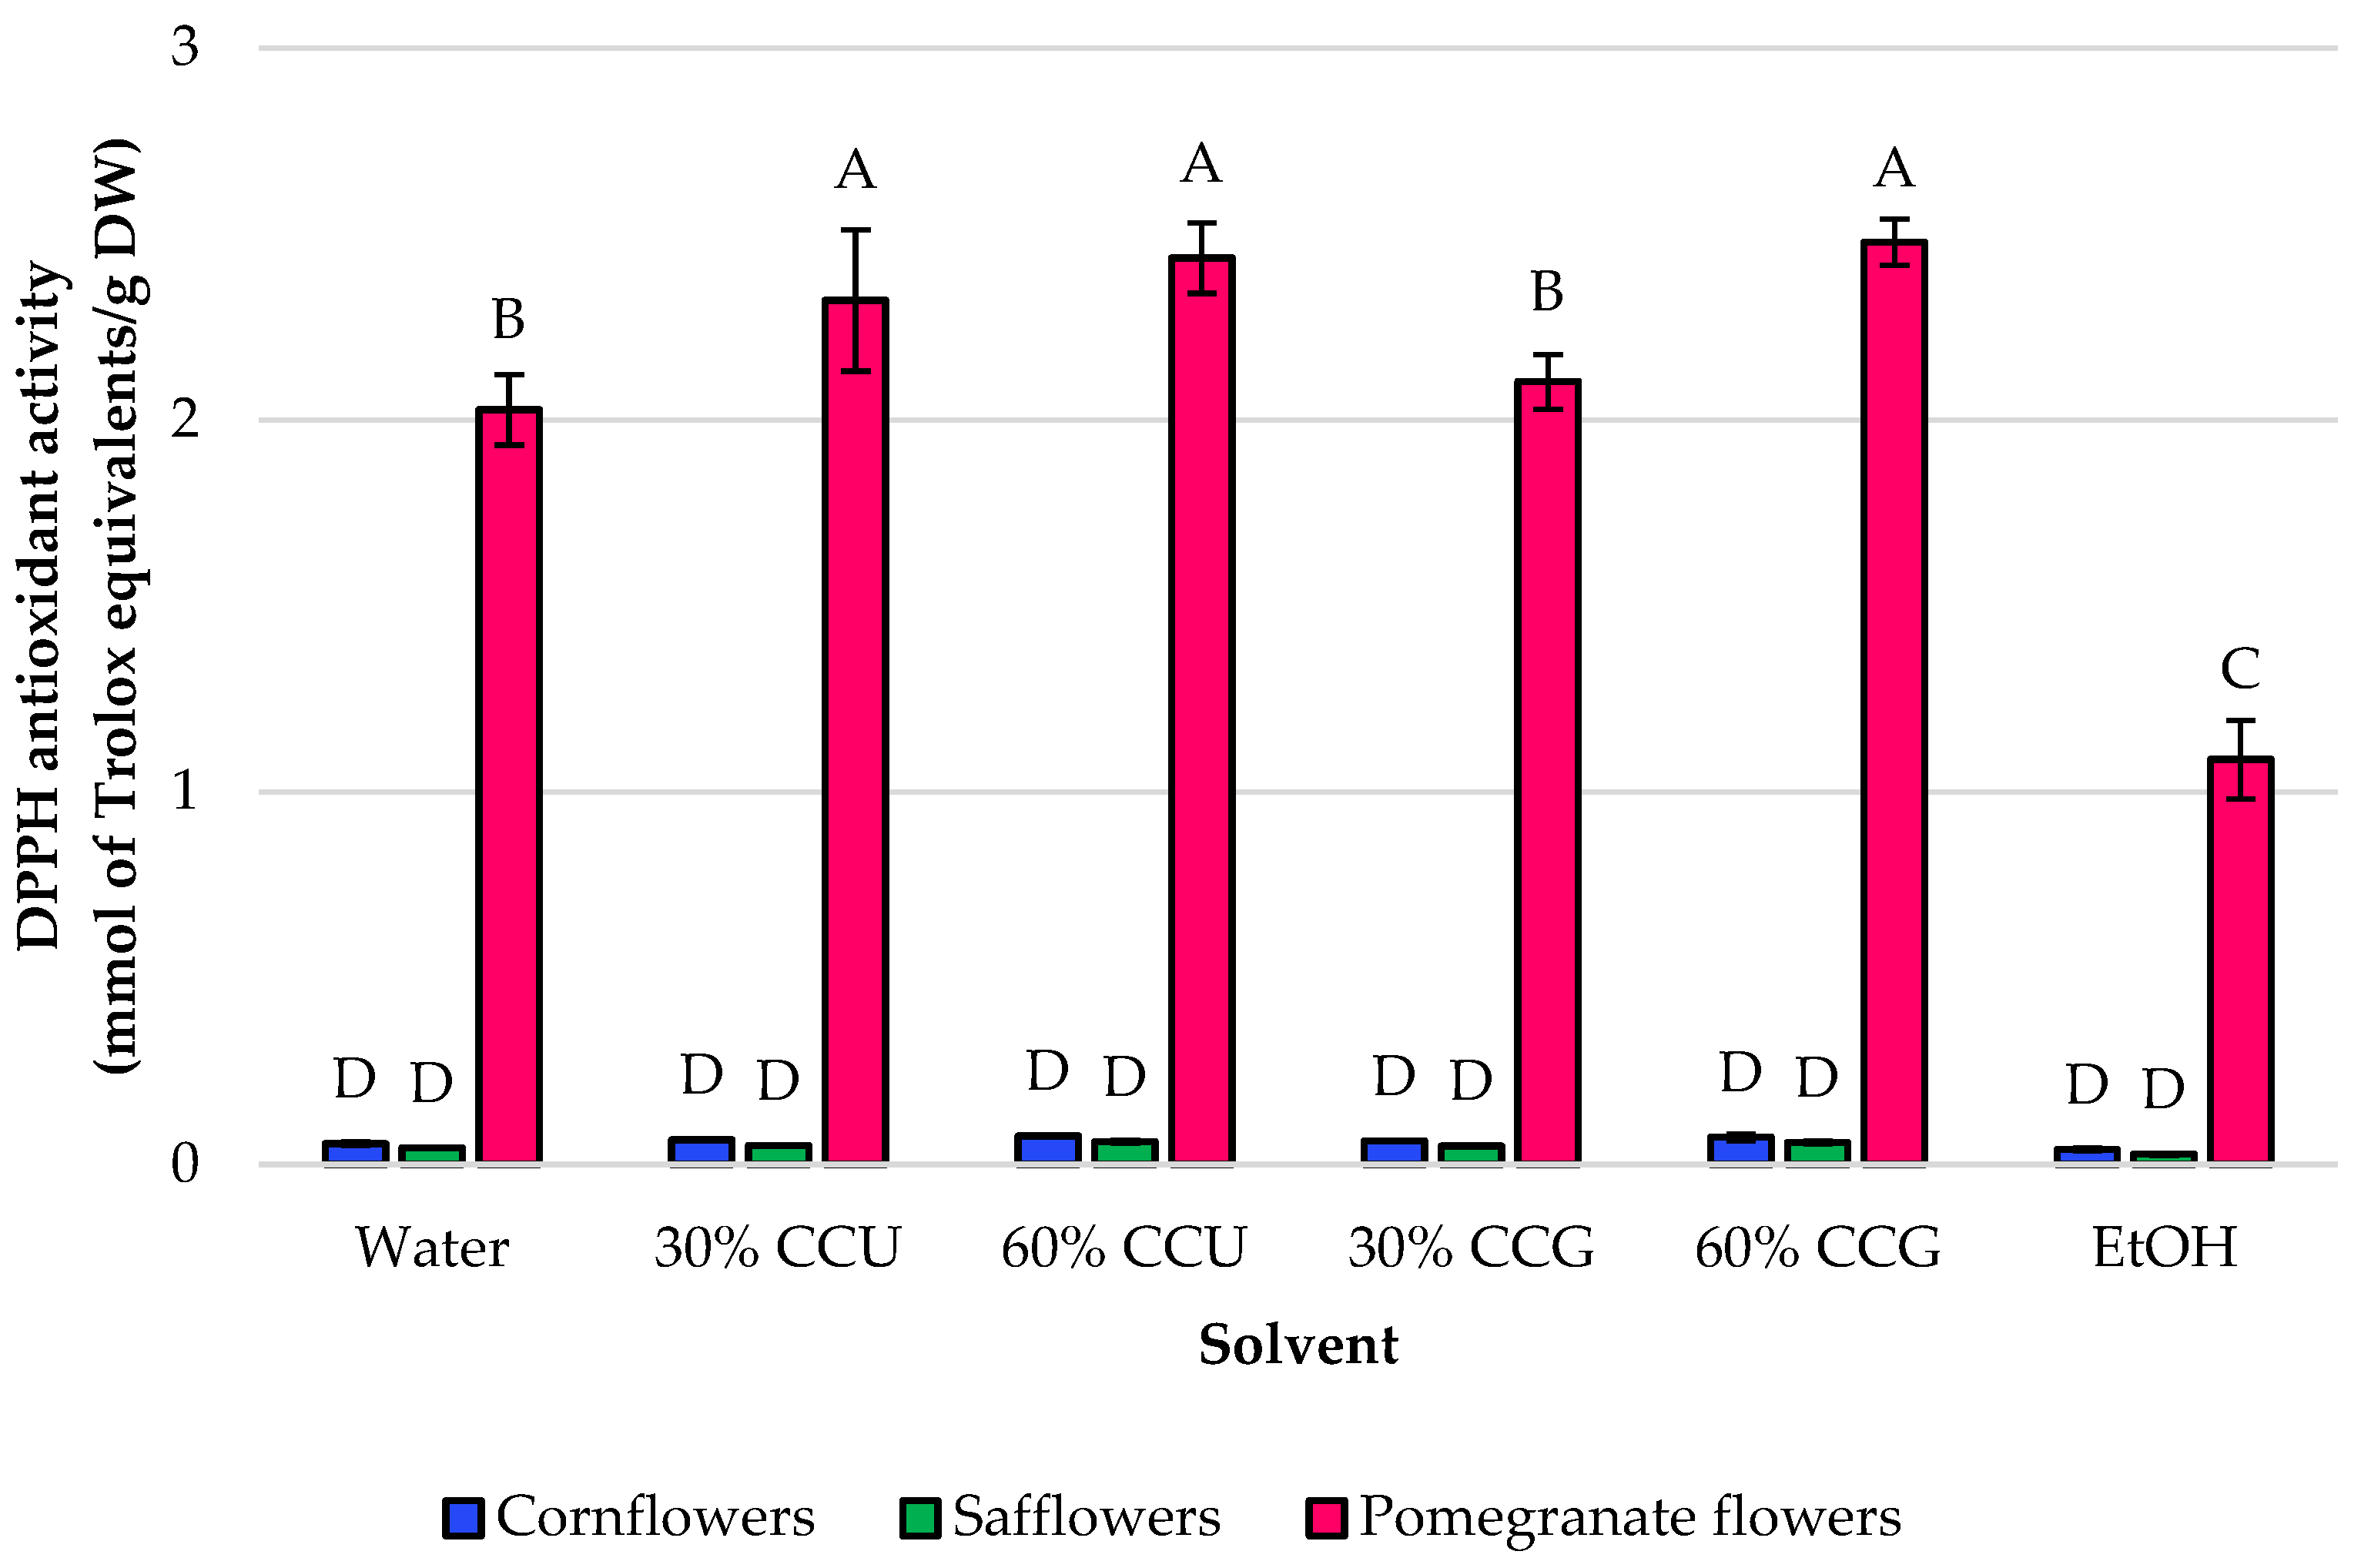
The observed matrix dependence in this study likely reflects inherent differences in the phytochemical composition and tissue features of the three floral materials. Pomegranate flowers consistently exhibited the highest TPC values, aligning with earlier research showing that pomegranate floral tissues are among the plant’s phenolic-rich organs and can reach high phenolic levels depending on the cultivar and extraction methods [16,29]. This matrix is also known to contain anthocyanins such as pelargonidin 3,5-diglucoside and pelargonidin 3-glucoside, along with abundant non-anthocyanin phenolics, including ellagitannins and gallic acid derivatives, which is consistent with the significantly higher anthocyanin content, TPC, and antioxidant activity observed here [30]. Conversely, safflower petals are characterized by a flavonoid-rich chemistry dominated by quinochalcone-type pigments and related flavonoids, especially hydroxysafflor yellow A, anhydrosafflor yellow B, and carthamin [31]. This may explain why this matrix displayed the highest TFC values but not the highest anthocyanin levels. This interpretation aligns with the well-known flavonoid-rich composition of C. tinctorius, where numerous flavonoids have been identified [18]. Cornflower petals, in turn, are valued as a source of blue pigments and antioxidant phenolics, and reported constituents include cyanidin-derived pigments such as centaurocyanin, along with flavonoids and phenolic acids [32]. However, under the current conditions, their total extractable anthocyanin and phenolic levels were lower than those of pomegranate flowers. The superior performance of NADES compared to ethanol, and sometimes even water, is consistent with their known extraction properties, as these solvents can improve phenolic metabolite recovery through favorable hydrogen-bonding interactions and adjustable polarity. Previous studies on safflower have also indicated that deep eutectic solvents can enhance the extraction of phenolics and flavonoids relative to conventional solvents [33,34], while also increasing the stability of safflower colorants compared with water or aqueous ethanol [35]. Overall, these results suggest that solvent effects should be interpreted in light of the specific metabolite composition of each matrix, rather than as a universal extraction pattern across different floral materials. The DPPH assay clearly distinguished among the three floral matrices (Figure 5). Pomegranate flower extracts showed significantly higher radical scavenging activity than cornflower and safflower, regardless of the solvent used. In this matrix, the highest activity was observed in NADES-based systems, especially 60% CCG (2.478 ± 0.063 mmol TE/g DW) and 60% CCU (2.436 ± 0.095 mmol TE/g DW), while the ethanolic extract exhibited the lowest value (1.088 ± 0.105 mmol TE/g DW). Water extraction produced an intermediate result (2.028 ± 0.095 mmol TE/g DW), confirming that NADES enhances the recovery of active compounds from pomegranate flowers.
In cornflower petals, DPPH values were much lower than in pomegranate flowers. Although 60% CCU and 60% CCG showed the highest mean values and ethanol the lowest mean, differences among solvent systems were not statistically significant.
A similar situation was observed for safflower petals. The mean DPPH values varied numerically among solvents, with 60% CCU showing the highest average and ethanol the lowest, but these differences were not statistically significant.
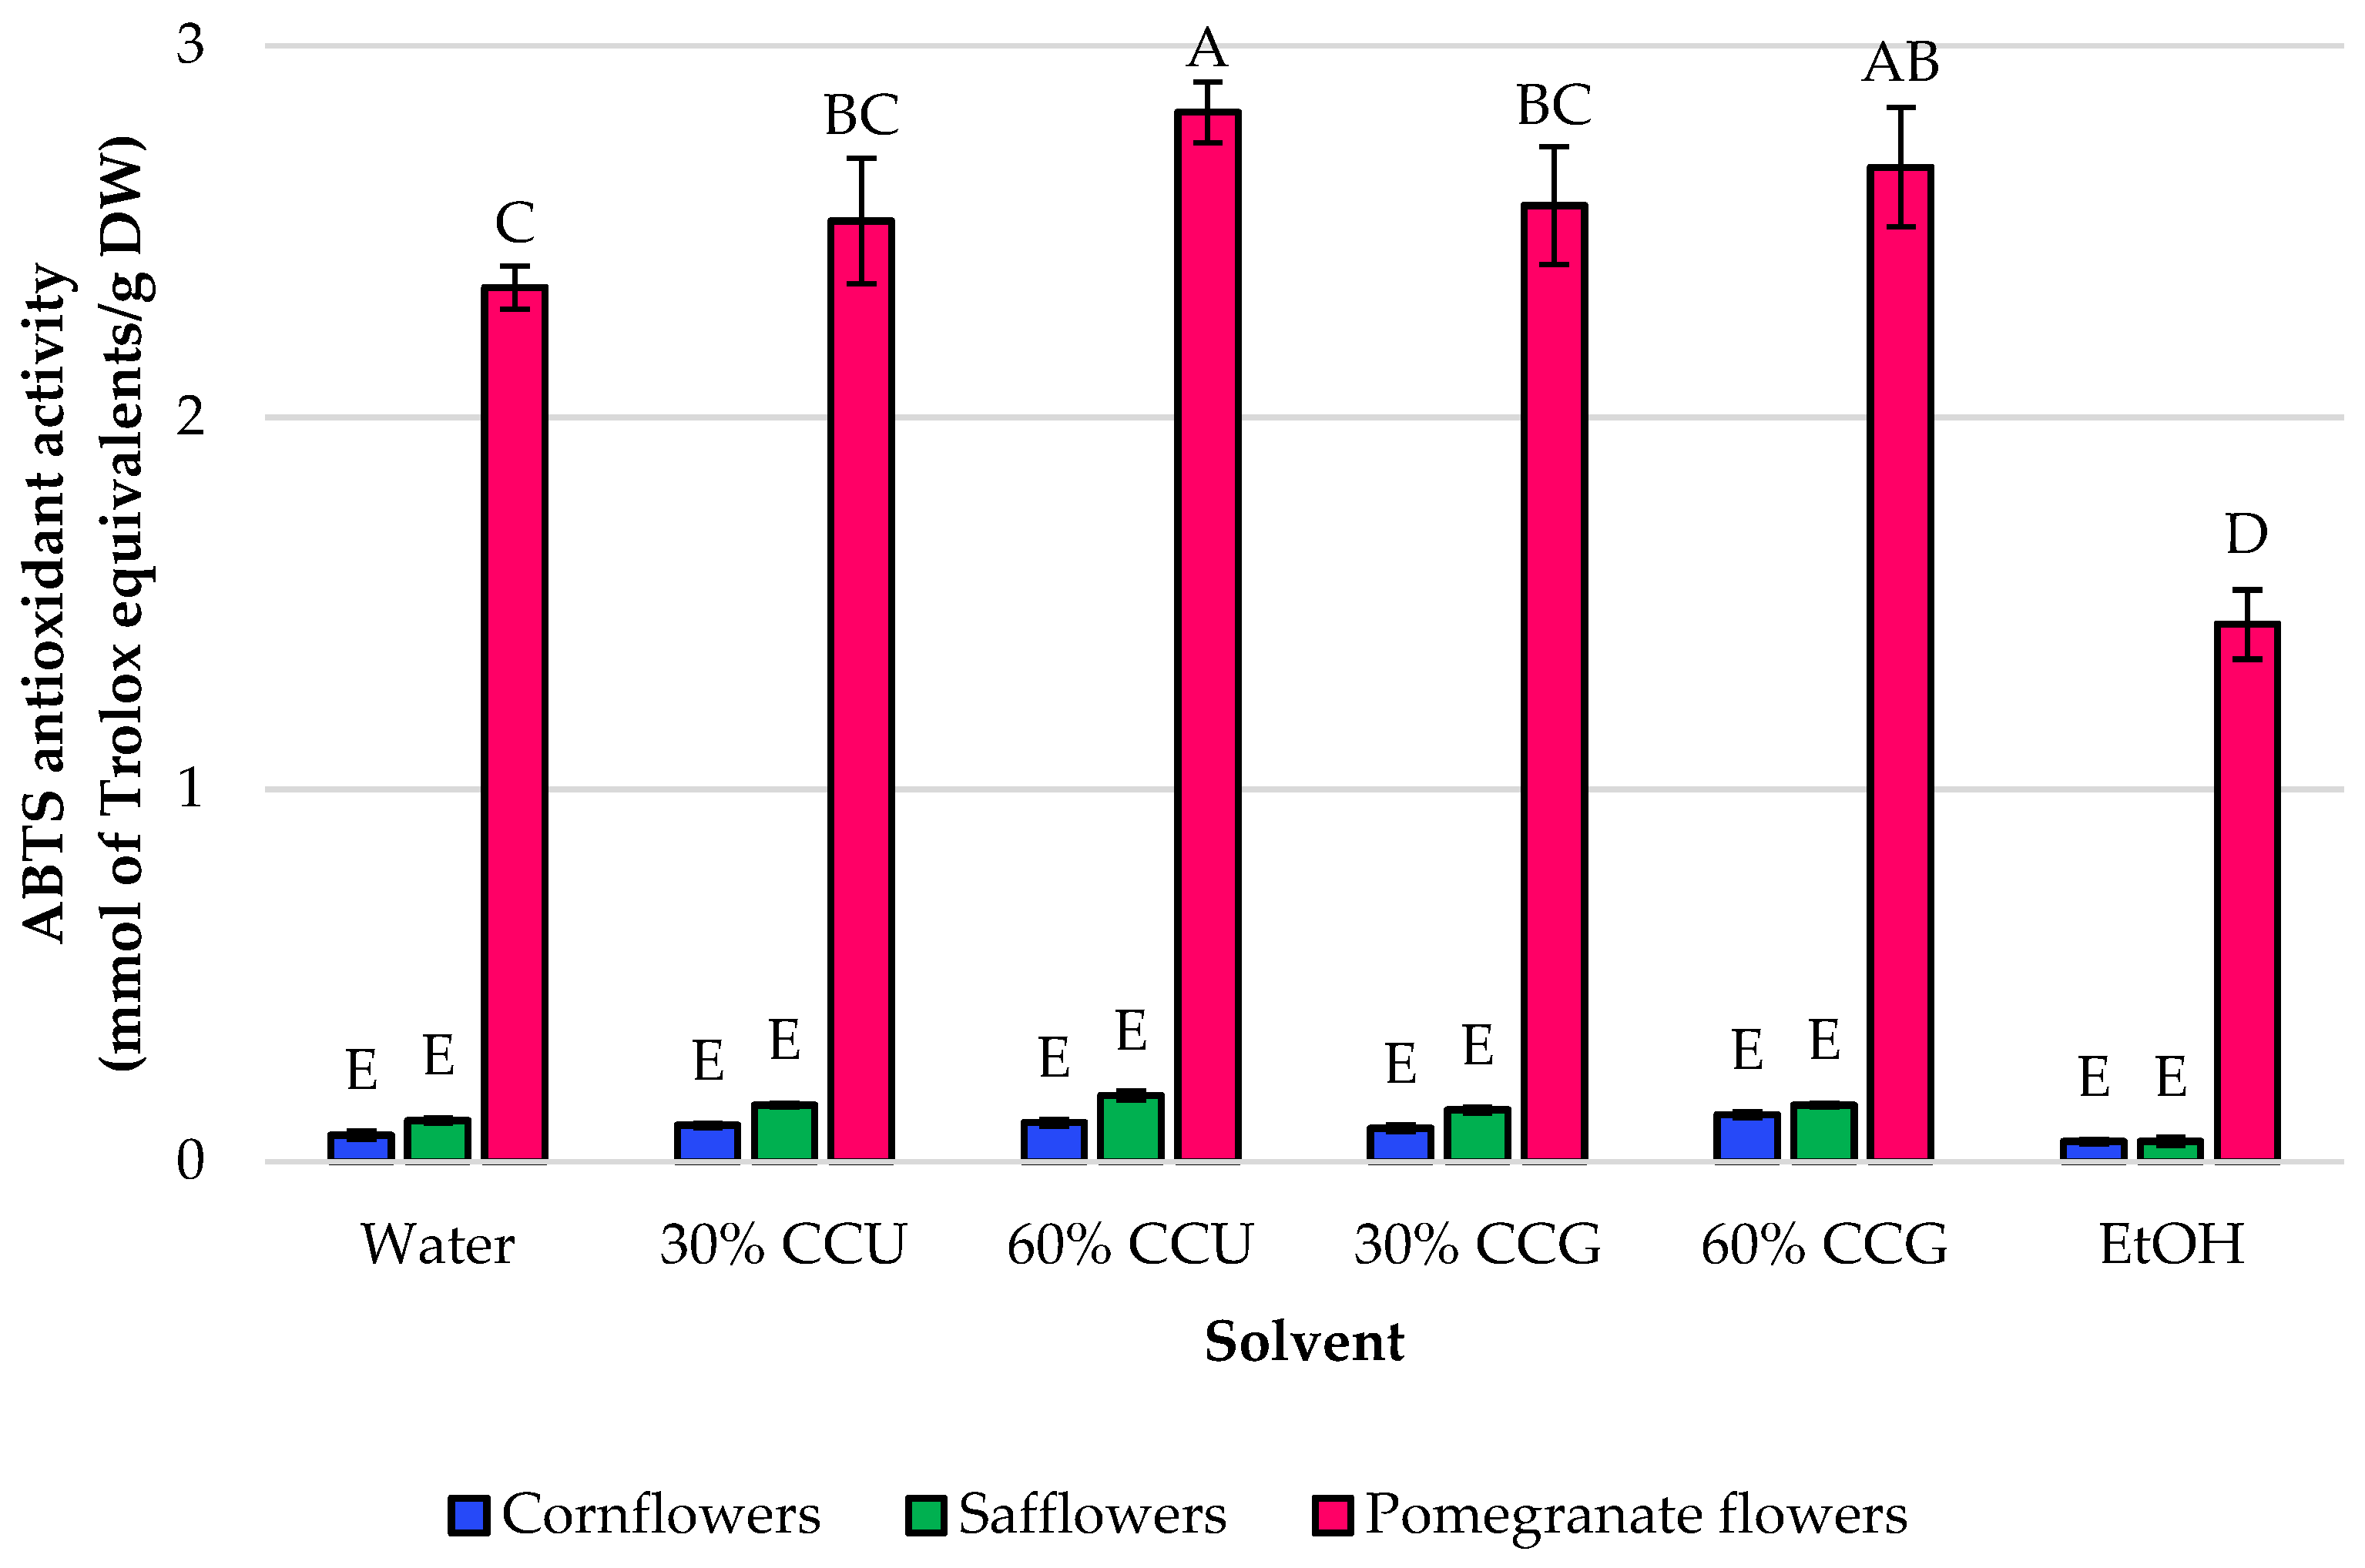
The ABTS assay confirmed the same broad matrix-dependent pattern, with pomegranate flower extracts showing significantly higher antioxidant capacity than safflower and cornflower extracts (Figure 6). In pomegranate flowers, the highest activity was achieved with 60% CCU (2.821 ± 0.082 mmol TE/g DW), followed by 60% CCG (2.672 ± 0.160 mmol TE/g DW) and 30% CCG (2.569 ± 0.158 mmol TE/g DW). Water extraction reached 2.349 ± 0.058 mmol TE/g DW, whereas ethanol again gave the lowest value (1.444 ± 0.093 mmol TE/g DW). Thus, in pomegranate flowers, NADES-rich systems also favored the recovery of compounds contributing to ABTS radical scavenging.
For safflower petals, ABTS values were markedly lower than in pomegranate flowers. Although 60% CCU showed the highest mean value, no statistically significant differences were observed among the solvent systems. In cornflower petals, ABTS values were the lowest among the three matrices. While 60% CCG showed the highest mean and ethanol the lowest mean, the differences among solvent systems were not statistically significant.
Taken together, the DPPH and ABTS assays showed that antioxidant activity was primarily matrix-dependent, with pomegranate flowers representing the richest source of antioxidant compounds, whereas safflower and cornflower extracts showed markedly lower scavenging abilities. For pomegranate flowers, the overall trend suggested that NADES-rich formulations, especially 60% CCU and 60% CCG, were the most favorable media for recovering compounds contributing to antioxidant activity. As summarized in Table 1, safflower was distinguished mainly by its high flavonoid content, whereas solvent-related differences in cornflower were generally smaller.
Because the present study relied on spectrophotometric assays, the results should be seen as overall indicators of anthocyanins, phenolics, flavonoids, and antioxidant capacity rather than as profiles of individual compounds. Despite this limitation, the antioxidant assays generally mirrored the patterns of anthocyanins and TPC, especially in pomegranate flowers, although the connection with TFC was less consistent. Notably, this pattern was most evident for pomegranate flowers, in which the highest DPPH and ABTS values were observed for the 60% NADES formulations, especially 60% CCU and 60% CCG, broadly matching the high anthocyanin and TPC values obtained for this matrix. This consistency between compositional and antioxidant data supports the idea that the increased activity of these extracts was linked to greater recovery of redox-active metabolites, rather than to assay-specific variability [17,36].
At the same time, the two antioxidant assays were not completely identical in how they ranked the best-performing solvent systems. This was especially clear for cornflower, where 60% CCU produced the highest value in the DPPH assay, while 60% CCG performed slightly better in the ABTS test. Such differences are expected because DPPH and ABTS differ in radical type, reaction medium, and sensitivity toward specific classes of antioxidants. ABTS is often considered more responsive to a broader range of hydrophilic and lipophilic antioxidants, whereas DPPH may rely more on structural features that govern hydrogen atom or electron donation [36,37].
Moreover, the close link between antioxidant capacity and the previously discussed anthocyanin/TPC/TFC results also indicates that no single group of compounds was solely responsible for the observed activity. Instead, the radical-scavenging response likely came from the combined contribution of several classes of phenolic compounds, including flavonoids and, in the case of more heavily pigmented extracts, anthocyanins. This interpretation aligns with published data showing that antioxidant activity in floral extracts is usually related to the overall phenolic profile rather than a single constituent group [16,35,38].
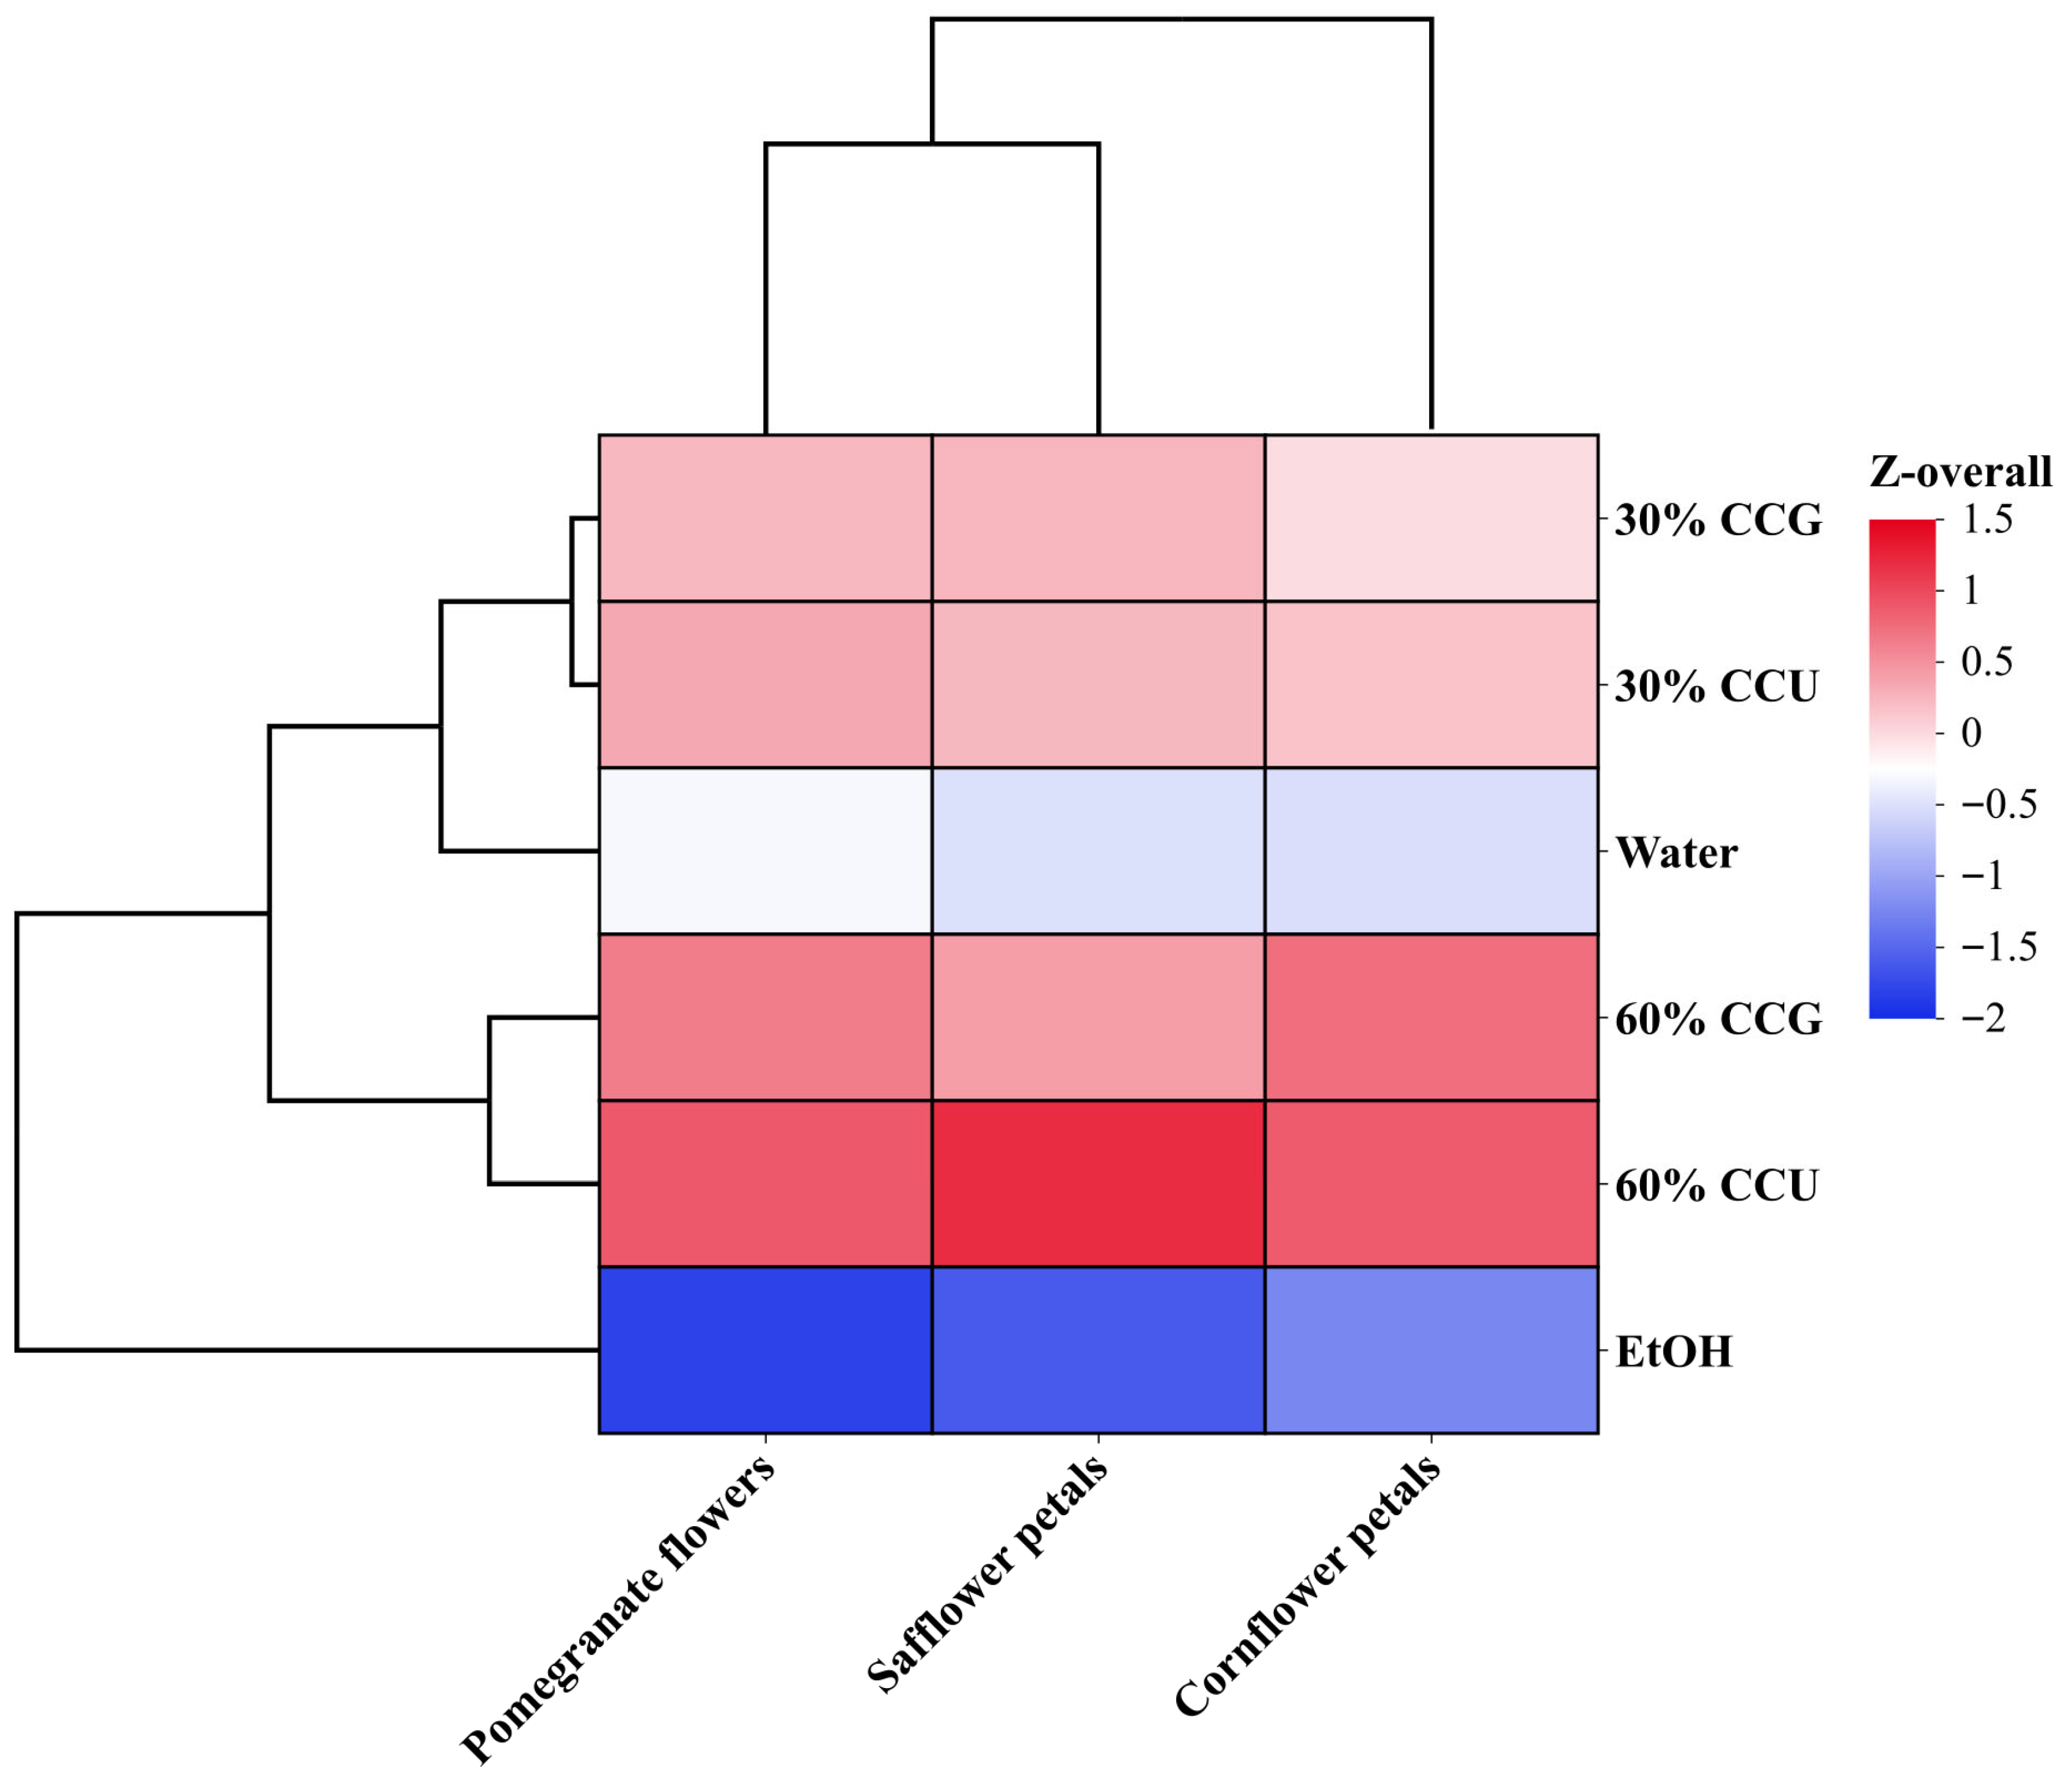
As shown in Figure 7, to aid solvent selection across the three floral matrices, the extraction results were combined into a unified standardized performance index (Z-overall) based on anthocyanins, TPC, TFC, DPPH, and ABTS. The heatmap showed a clear and consistent pattern of solvent ranking across materials. In all three cases, ethanol exhibited the lowest overall performance, with strongly negative values, indicating below-average extraction efficiency compared to the other solvents. Conversely, the 60% NADES formulations proved most effective, with 60% CCU achieving the highest composite score overall, closely followed by 60% CCG.
The intermediate group included the 30% CCU and 30% CCG systems, which generally performed better than water but not as well as the more NADES-rich 60% formulations. Water occupied a middle-to-lower position, outperforming ethanol but falling short of most NADES-based systems. This pattern indicates that increasing the NADES proportion from 30% to 60% enhanced the overall extraction of bioactive compounds across the tested matrices.
Hierarchical clustering further supported these findings. The two 60% NADES systems grouped together, reflecting their similarly high and consistent extraction performance. Ethanol formed a separate branch, confirming its markedly different and poorest extraction profile. The 30% NADES systems also clustered closely, indicating they behaved similarly across the three materials. Overall, Figure 7 and Table 1 show that 60% CCU and 60% CCG were the most suitable solvents for broad-spectrum recovery of bioactive compounds, while ethanol was the least suitable under the tested conditions.
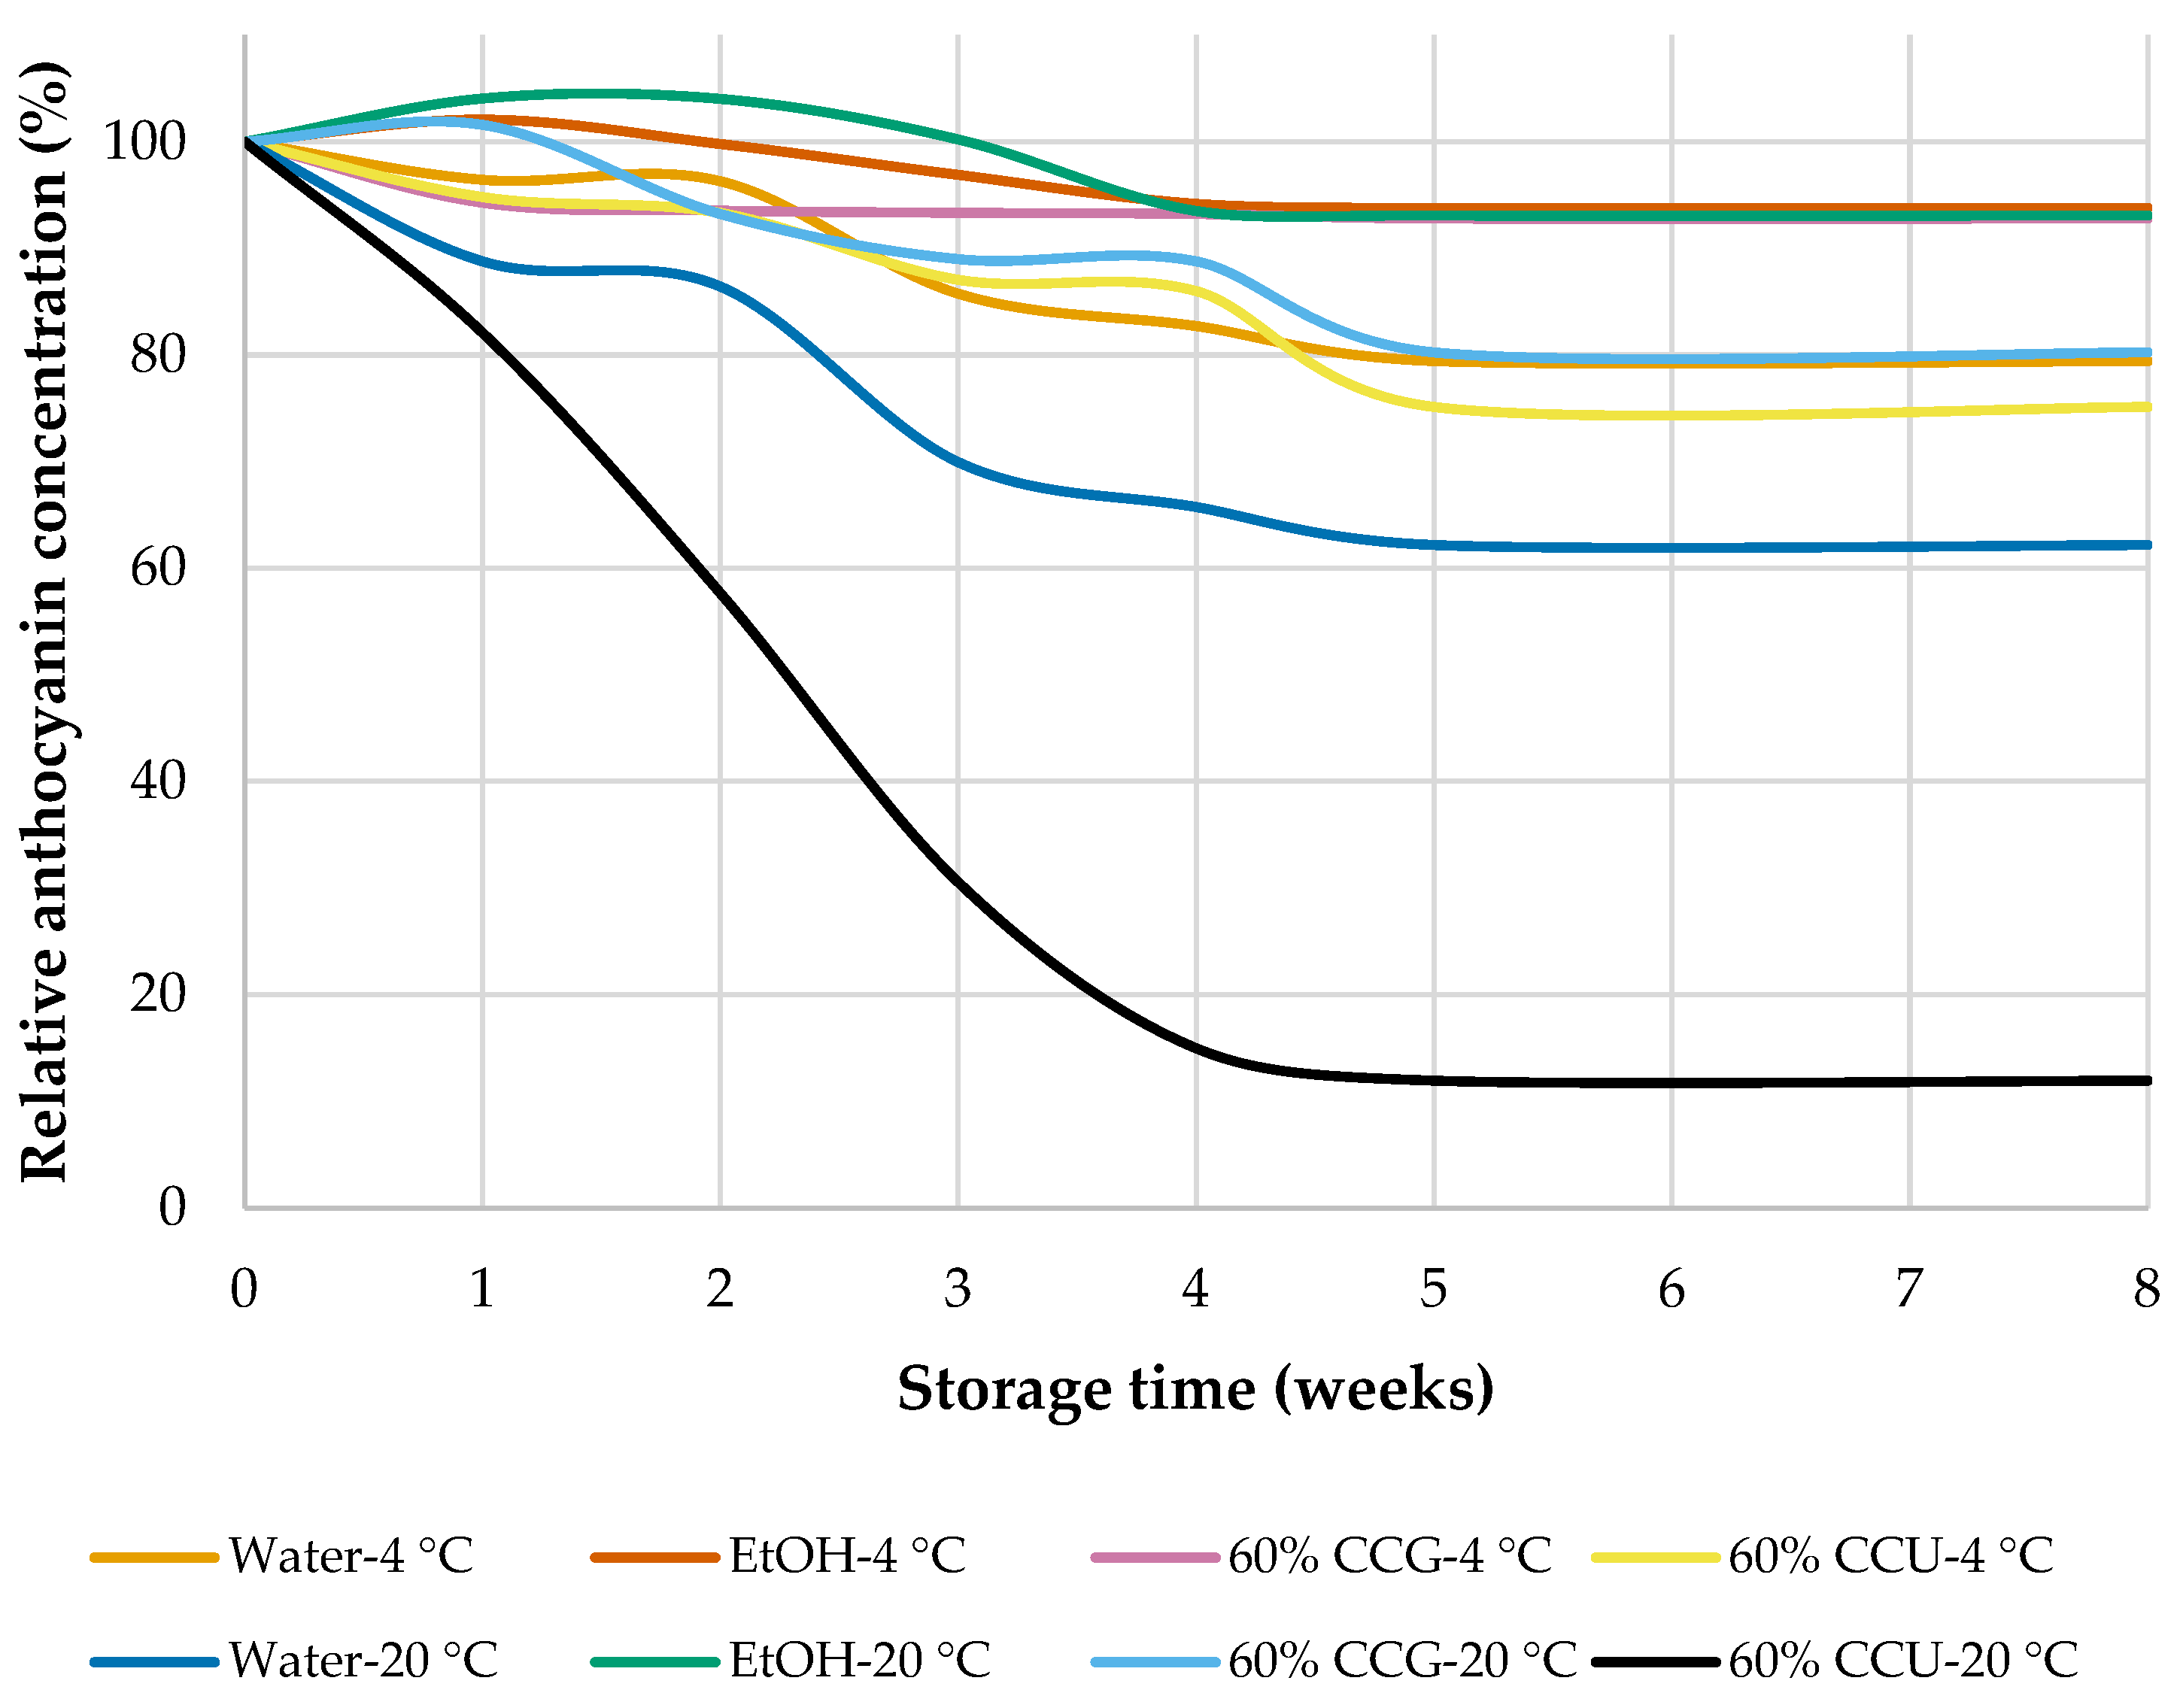
The relative anthocyanin content of the selected extracts was monitored over an 8-week storage period at 4 °C and 20 °C to assess the impact of solvent system and temperature on pigment stability (Figure 8). Generally, storage at 4 °C better preserved anthocyanins than at 20 °C, although the extent of degradation varied significantly with the solvent used. Overall, the greatest losses were observed in the 60% CCU extract stored at 20 °C, whereas ethanolic extracts exhibited the highest stability at both temperatures.
At 20 °C, anthocyanin degradation was rapid in the water extract, with the relative content decreasing from 100% at t = 0 to 88.8% after 1 week, 70.0% after 3 weeks, and 62.2% after 8 weeks, indicating a loss of nearly 38% of the initial anthocyanin content. A more moderate decline occurred in the 60% CCG sample, where the relative content stayed close to the initial level during the first week and then gradually dropped to 80.3% after 8 weeks. Conversely, the 60% CCU extract showed very poor stability at 20 °C, with anthocyanins decreasing to 82.1% after 1 week, 57.7% after 2 weeks, 30.6% after 3 weeks, and just 11.9% after 8 weeks, nearly losing all pigment during storage. Among all samples stored at 20 °C, the ethanolic extract was the most stable, maintaining 93.1% of the initial anthocyanin content after 8 weeks.
At 4 °C, the overall ranking of solvent stability remained the same, but degradation occurred much more slowly. The water extract retained 79.4% of its initial anthocyanin content after 8 weeks, significantly higher than the 62.2% observed at 20 °C. Although the 60% CCU extract was more stable at 4 °C than at 20 °C, it still showed notable degradation, decreasing to 75.1% of the initial concentration after 8 weeks. In contrast, both ethanol and 60% CCG offered strong protection against anthocyanin loss at the lower temperature. The ethanolic extract preserved 93.8% of its original content, while the 60% CCG extract was the most stable NADES-based system, maintaining 92.8% of the initial anthocyanin level after 8 weeks. These results suggest that refrigeration significantly enhances extract stability, especially for the water- and CCU-based systems, though the protective effect of low temperature was less critical for ethanol and 60% CCG, which already demonstrated relatively high stability.
Overall, the storage study demonstrated that temperature and solvent composition jointly determined anthocyanin stability. Lower storage temperature consistently reduced anthocyanin degradation, while the choice of solvent had a marked influence on pigment preservation. Ethanol and 60% CCG were the most favorable media for anthocyanin stability, whereas 60% CCU was the least stable system, particularly under ambient storage conditions (20 °C).
The storage study revealed that anthocyanin preservation did not solely depend on extraction efficiency. Although 60% CCU was effective for recovering anthocyanins, it was clearly the least suitable medium for storage afterward, especially at 20 °C. In contrast, ethanol and 60% CCG preserved the pigments much more effectively. This difference between extraction yield and storage stability has also been observed in other anthocyanin systems, where the solvent used for extraction significantly influences the degradation process later on. Not all DES/NADES provide the same level of pigment protection [19,39,40,41]. The consistently better retention at lower temperatures aligns with the well-known temperature sensitivity of anthocyanins during storage [41].
The degradation of anthocyanins during storage was modeled using a first-order kinetic approach, with the relevant parameters summarized in Table 2. Although some individual datasets showed similar or slightly higher R2 values for alternative kinetic models, the first-order model provided acceptable fits overall and was therefore used for comparison, consistent with previous anthocyanin degradation studies [39]. Generally, the degradation rate constant (k) was higher at 20 °C than at 4 °C, confirming that higher storage temperature accelerates anthocyanin loss across all solvent systems. The model’s fit was moderate to very good depending on the solvent–temperature combination (R2 = 0.6821–0.9864), indicating that first-order kinetics effectively described anthocyanin degradation under the tested conditions. The lowest fit was observed for the ethanolic extract stored at 20 °C (R2 = 0.6821), whereas the highest fit was obtained for 60% CCU at 20 °C (R2 = 0.9864).
Among the tested solvents, the 60% CCU extract at 20 °C showed the fastest degradation by far, with the highest rate constant (k = 0.0853 day−1), the shortest half-life (t1/2 = 8.13 days), and the lowest T90 value (1.24 days), indicating very poor anthocyanin stability under ambient storage conditions. In contrast, the ethanolic extract exhibited the lowest degradation rates at both temperatures, with k = 0.0019 day−1 at 4 °C and k = 0.0026 day−1 at 20 °C, corresponding to half-lives of 364.81 and 266.60 days, respectively. The 60% CCG system also showed relatively high stability, especially at 4 °C, with k = 0.0020 day−1 and t1/2 = 346.57 days. The water extract exhibited intermediate stability, with degradation constants of 0.0112 day−1 at 4 °C and 0.0204 day−1 at 20 °C, yielding half-lives of 61.89 and 33.98 days, respectively. The 60% CCU extract at 4 °C was more stable than at 20 °C but degraded faster than ethanol and 60% CCG, with k = 0.0059 day−1 and t1/2 = 117.48 days.
Overall, the stability ranking based on k and t1/2 indicated that ethanol and 60% CCG are the most stable, followed by water, with 60% CCU being the least stable, especially at 20 °C. The temperature sensitivity of anthocyanin degradation also depended heavily on the solvent system. The lowest Q10 value was observed for ethanol (1.217), indicating the smallest effect of temperature increase from 4 °C to 20 °C. Conversely, 60% CCU exhibited an exceptionally high Q10 (5.310) and the highest activation energy (Ea = 112.77 kJ/mol), demonstrating a very strong temperature dependence of anthocyanin degradation in this solvent. Intermediate temperature sensitivity was noted for water (Q10 = 1.455, Ea = 25.31 kJ/mol) and 60% CCG (Q10 = 1.773, Ea = 38.68 kJ/mol). Overall, the kinetic analysis confirmed that both storage temperature and solvent composition significantly influence anthocyanin stability. Refrigerated storage markedly enhances pigment preservation, while ethanol and 60% CCG yield the most favorable stability profiles. Conversely, 60% CCU proved to be the least suitable solvent system for anthocyanin preservation, especially at 20 °C.
The kinetic analysis supports the previously mentioned interpretation. The acceptable to very good fit of the first-order model aligns with the literature, where anthocyanin losses during storage and heating are often described by first-order kinetics [39]. Therefore, the lower k values and longer t1/2 and T90 times observed at 4 °C indicate significantly slower pigment depletion under refrigerated conditions. Conversely, the very high k value obtained for 60% CCU at 20 °C confirms that this solvent created the most degradation-prone environment. The exceptionally high Ea and Q10 values calculated for CCU further suggest that anthocyanin degradation in this system was much more sensitive to temperature changes than in ethanol, water, or 60% CCG [40].
The particularly poor stability of the 60% CCU extract may plausibly be linked to the alkaline nature reported for choline chloride–urea systems. In a physicochemical study of choline chloride–urea eutectic mixtures, all tested systems were alkaline, with pH values ranging from 9.27 to 10.97, and water-containing mixtures remained around pH 10 [42]. This matters because anthocyanins are most stable in acidic media, whereas increasing pH promotes conversion of the flavylium form to less stable, often colorless structures, including carbinol pseudobase and chalcone, with significant degradation under neutral to alkaline conditions [19,39,41]. Therefore, the rapid loss of anthocyanins in 60% CCU, especially at 20 °C, can reasonably be attributed in part to an unfavorable pH environment. A plausible explanation for the better anthocyanin preservation observed in CCG compared to CCU is the difference in the solvent microenvironment created by the hydrogen-bond donor. Glycerol-rich systems can form dense hydrogen-bond networks and may provide a more protective solvation environment for anthocyanins, while urea-based systems may create a less favorable medium for the flavylium form, especially if the extract pH shifts toward alkalinity. Since the pomegranate flower anthocyanins were not individually profiled in this study, these interactions should be regarded as mechanistic hypotheses rather than direct evidence. In contrast, the good preservation observed in ethanol and especially in 60% CCG shows that anthocyanin stabilization depends on the specific solvent environment rather than simply on the presence of a NADES. This aligns with previous studies indicating that some eutectic systems can enhance anthocyanin stability, while others may speed up browning or pigment loss depending on their composition and physicochemical properties [1,19,43]. Therefore, the current results suggest that 60% CCG is the most suitable NADES for balancing extraction efficiency with anthocyanin preservation during storage, while 60% CCU seems unsuitable for ambient storage despite its strong extraction performance. This is especially important for pomegranate flower extracts, whose functionality is closely connected to anthocyanin retention [44,45]. Although the different extraction and stability behaviors of CCU and CCG can be discussed in physicochemical terms, the present study did not include direct measurements of solvent viscosity or density. This should be considered when interpreting the mechanism behind the observed solvent effects. According to previous research, the extraction performance of DES/NADES is heavily influenced by physicochemical parameters such as viscosity, density, polarity, and pH, because these properties affect solvent penetration into plant tissue, mass transfer, and the stability of dissolved compounds [15,46,47]. In particular, high viscosity may limit mass transfer, whereas water dilution can alter viscosity and density in ways that enhance extraction efficiency. Therefore, the differing behaviors of CCU and CCG observed here should be viewed as formulation-dependent effects supported by the extraction and storage results, rather than as a direct physicochemical comparison of the two systems.

4. Conclusions

This study demonstrated that both the botanical matrix and the solvent system significantly influence the recovery of bioactive compounds from dried floral materials. Among the tested matrices, pomegranate flowers were the richest in anthocyanins, phenolics, and antioxidant compounds, while safflower was notable for its high flavonoid content. Generally, NADES-based systems, i.e., especially the more NADES-rich formulations such as 60% CCU and 60% CCG, produced better extraction results than water and ethanol, confirming their potential as effective green solvents for floral bioactives. The storage study further indicated that extraction efficiency and storage stability should be assessed separately when choosing a solvent. Overall, solvent selection must be tailored to the specific floral matrix and the intended use. For pomegranate flowers, 60% NADES systems, especially 60% CCG and 60% CCU, were the most effective for extraction, while 60% CCG offered the best compromise between extraction efficiency and anthocyanin stability during storage. For safflower petals, several NADES formulations performed similarly in phenolic recovery, but safflower was mainly distinguished by its high flavonoid content. For cornflower petals, differences between solvents were generally minor, suggesting a limited practical advantage of one formulation over another under the tested conditions. Therefore, no single NADES can be deemed universally optimal across all three species. Instead, the most appropriate solvent depends on the botanical matrix and the specific goal of the extract. Furthermore, a key limitation of this study is the absence of chromatographic profiling of individual anthocyanins and phenolics. Future research should combine the current screening method with HPLC-DAD or LC-MS analysis to confirm which specific compounds are preferentially extracted and stabilized by each NADES formulation.

Funding

This research received no external funding.

Institutional Review Board Statement

Not applicable.

Informed Consent Statement

Not applicable.

Data Availability Statement

The original contributions presented in this study are included in the article. Further inquiries can be directed to the corresponding author.

Conflicts of Interest

The author declares no conflicts of interest.

Abbreviations

The following abbreviations are used in this manuscript:
ABTS2,2′-Azino-bis(3-ethylbenzothiazoline-6-sulfonic acid)
ANOVAAnalysis of variance
C3GECyanidin-3-glucoside equivalents
CCUCholine chloride–urea
CCGCholine chloride–glycerol
DPPH2,2-Diphenyl-1-picrylhydrazyl
EtOHEthanol
GAEGallic acid equivalents
HBAhydrogen bond acceptor
HBDhydrogen bond donor
HSDHonestly significant difference
NADESNatural Deep Eutectic Solvent
QEQuercetin equivalents
SDStandard Deviation
TETrolox equivalents
TFCTotal flavonoid content
TPCTotal phenolic content
VOCsVolatile Organic Compounds

References

  1. Dai, Y.; Rozema, E.; Verpoorte, R.; Choi, Y.H. Application of Natural Deep Eutectic Solvents to the Extraction of Anthocyanins from Catharanthus Roseus with High Extractability and Stability Replacing Conventional Organic Solvents. J. Chromatogr. A 2016, 1434, 50–56. [Google Scholar] [CrossRef] [Scilit]
  2. Silva, D.T.d.; Pauletto, R.; Cavalheiro, S.d.S.; Bochi, V.C.; Rodrigues, E.; Weber, J.; Silva, C.d.B.d.; Morisso, F.D.P.; Barcia, M.T.; Emanuelli, T. Natural Deep Eutectic Solvents as a Biocompatible Tool for the Extraction of Blueberry Anthocyanins. J. Food Compost. Anal. 2020, 89, 103470. [Google Scholar] [CrossRef] [Scilit]
  3. Grillo, G.; Gunjević, V.; Radošević, K.; Redovniković, I.R.; Cravotto, G. Deep Eutectic Solvents and Nonconventional Technologies for Blueberry-Peel Extraction: Kinetics, Anthocyanin Stability, and Antiproliferative Activity. Antioxidants 2020, 9, 1069. [Google Scholar] [CrossRef] [Scilit]
  4. Fu, X.; Wang, D.; Belwal, T.; Xie, J.; Xu, Y.; Li, L.; Zou, L.; Zhang, L.; Luo, Z. Natural Deep Eutectic Solvent Enhanced Pulse-Ultrasonication Assisted Extraction as a Multi-Stability Protective and Efficient Green Strategy to Extract Anthocyanin from Blueberry Pomace. Lebenson. Wiss. Technol. 2021, 144, 111220. [Google Scholar] [CrossRef] [Scilit]
  5. Radošević, K.; Ćurko, N.; Gaurina Srček, V.; Cvjetko Bubalo, M.; Tomašević, M.; Kovačević Ganić, K.; Radojčić Redovniković, I. Natural Deep Eutectic Solvents as Beneficial Extractants for Enhancement of Plant Extracts Bioactivity. Lebenson. Wiss. Technol. 2016, 73, 45–51. [Google Scholar] [CrossRef] [Scilit]
  6. Panić, M.; Gunjević, V.; Cravotto, G.; Radojčić Redovniković, I. Enabling Technologies for the Extraction of Grape-Pomace Anthocyanins Using Natural Deep Eutectic Solvents in up-to-Half-Litre Batches Extraction of Grape-Pomace Anthocyanins Using NADES. Food Chem. 2019, 300, 125185. [Google Scholar] [CrossRef] [Scilit] [PubMed]
  7. Aktaş, H.; Kurek, M.A. Deep Eutectic Solvents for the Extraction of Polyphenols from Food Plants. Food Chem. 2024, 444, 138629. [Google Scholar] [CrossRef] [Scilit]
  8. Paiva, A.; Craveiro, R.; Aroso, I.; Martins, M.; Reis, R.L.; Duarte, A.R.C. Natural Deep Eutectic Solvents—Solvents for the 21st Century. ACS Sustain. Chem. Eng. 2014, 2, 1063–1071. [Google Scholar] [CrossRef] [Scilit]
  9. Martínez, G.M.; Townley, G.G.; Martínez-Espinosa, R.M. Controversy on the Toxic Nature of Deep Eutectic Solvents and Their Potential Contribution to Environmental Pollution. Heliyon 2022, 8, e12567. [Google Scholar] [CrossRef] [Scilit]
  10. Popović, B.M.; Gligorijević, N.; Aranđelović, S.; Macedo, A.C.; Jurić, T.; Uka, D.; Mocko-Blažek, K.; Serra, A.T. Cytotoxicity Profiling of Choline Chloride-Based Natural Deep Eutectic Solvents. RSC Adv. 2023, 13, 3520–3527. [Google Scholar] [CrossRef] [Scilit]
  11. Guo, N.; Ping-Kou; Jiang, Y.-W.; Wang, L.-T.; Niu, L.-J.; Liu, Z.-M.; Fu, Y.-J. Natural Deep Eutectic Solvents Couple with Integrative Extraction Technique as an Effective Approach for Mulberry Anthocyanin Extraction. Food Chem. 2019, 296, 78–85. [Google Scholar] [CrossRef] [Scilit]
  12. Franco-Londoño, M.; Laribi, M.; Strelkov, S.E.; Saldaña, M.D.A. Extraction of Anthocyanins from Cranberry Pomace Using HIUS and NADES: Antioxidant and Antifungal Activity. Lebenson. Wiss. Technol. 2025, 235, 118616. [Google Scholar] [CrossRef] [Scilit]
  13. Makarova, A.; Özten, C.; Zieniuk, B. Utilizing Natural Deep Eutectic Solvents (NADESs) for Sustainable Phytonutrient Recovery: Optimization and Multi-Matrix Extraction of Bioactive Compounds. Appl. Sci. 2025, 15, 4843. [Google Scholar] [CrossRef] [Scilit]
  14. Martins, K.P.; Hernandez Brito, N.L.; Costa, G.B.; Silva Ramos, J.; Silvestre Barbosa Alessi, A.C.; Santos, T.A.; Melo da Silva, A.E.; Machado, I.F.; Medeiros Marques, L.L.; Droval Arcain, A.A.; et al. Natural Deep Eutectic Solvents (NADES) in Food Systems: Emerging Applications, Extraction Efficiency, Safety Concerns, and Regulatory Challenges. J. Agric. Food Chem. 2025, 73, 32982–32994. [Google Scholar] [CrossRef] [Scilit] [PubMed]
  15. Bragagnolo, F.S.; Strieder, M.M.; Pizani, R.S.; de Souza Mesquita, L.M.; González-Miquel, M.; Rostagno, M.A. Revisiting Natural Deep Eutectic Solvents (NADES) as Extraction Media and Ready-to-Use Purposes. Trends Analyt. Chem. 2024, 175, 117726. [Google Scholar] [CrossRef] [Scilit]
  16. Zhang, H.; Wang, M.; Yu, G.; Pu, J.; Tian, K.; Tang, X.; Du, Y.; Wu, H.; Hu, J.; Luo, X.; et al. Comparative Analysis of the Phenolic Contents and Antioxidant Activities of Different Parts of Two Pomegranate (Punica granatum L.) Cultivars: “Tunisia” and “Qingpi”. Front. Plant Sci. 2023, 14, 1265018. [Google Scholar] [CrossRef] [Scilit]
  17. Salachna, P.; Pietrak, A.; Łopusiewicz, Ł. Antioxidant Potential of Flower Extracts from Centaurea spp. Depends on Their Content of Phenolics, Flavonoids and Free Amino Acids. Molecules 2021, 26, 7465. [Google Scholar] [CrossRef] [Scilit]
  18. Xian, B.; Wang, R.; Jiang, H.; Zhou, Y.; Yan, J.; Huang, X.; Chen, J.; Wu, Q.; Chen, C.; Xi, Z.; et al. Comprehensive Review of Two Groups of Flavonoids in Carthamus tinctorius L. Biomed. Pharmacother. 2022, 153, 113462. [Google Scholar] [CrossRef] [Scilit] [PubMed]
  19. Kurek, M.A.; Custodio-Mendoza, J.A.; Aktaş, H.; Pokorski, P. Exploring Deep Eutectic Solvent Extraction’s Impact on Anthocyanin Degradation Kinetics in Various Conditions. Lebenson. Wiss. Technol. 2024, 198, 115994. [Google Scholar] [CrossRef] [Scilit]
  20. Jiang, T.; Mao, Y.; Sui, L.; Yang, N.; Li, S.; Zhu, Z.; Wang, C.; Yin, S.; He, J.; He, Y. Degradation of Anthocyanins and Polymeric Color Formation during Heat Treatment of Purple Sweet Potato Extract at Different pH. Food Chem. 2019, 274, 460–470. [Google Scholar] [CrossRef] [Scilit]
  21. Aryal, S.; Baniya, M.K.; Danekhu, K.; Kunwar, P.; Gurung, R.; Koirala, N. Total Phenolic Content, Flavonoid Content and Antioxidant Potential of Wild Vegetables from Western Nepal. Plants 2019, 8, 96. [Google Scholar] [CrossRef] [Scilit]
  22. Zieniuk, B.; Kowalska, D. Recovery of Phenolic Compounds from Rowan Fruits (Sorbus aucuparia L.): A Comparison of Pretreatment and Extraction Methods. Separations 2025, 12, 305. [Google Scholar] [CrossRef] [Scilit]
  23. Zanetti, M.; Carniel, T.K.; Valério, A.; Oliveira, J.V.d.; Oliveira, D.d.; Araújo, P.H.H.d.; Riella, H.G.; Fiori, M.A. Synthesis of Geranyl Cinnamate by Lipase-catalyzed Reaction and Its Evaluation as an Antimicrobial Agent: Lipase-Catalyzed Synthesis of Geranyl Cinnamate. J. Chem. Technol. Biotechnol. 2017, 92, 115–121. [Google Scholar] [CrossRef] [Scilit]
  24. Moreira, D.C. ABTS Decolorization Assay—In Vitro Antioxidant Capacity. Available online: https://www.protocols.io/view/abts-decolorization-assay-in-vitro-antioxidant-cap-14egnxk86l5d/v1 (accessed on 22 March 2026).
  25. Patras, A.; Brunton, N.P.; O’Donnell, C.; Tiwari, B.K. Effect of Thermal Processing on Anthocyanin Stability in Foods; Mechanisms and Kinetics of Degradation. Trends Food Sci. Technol. 2010, 21, 3–11. [Google Scholar] [CrossRef] [Scilit]
  26. ChiPlot. Available online: https://www.chiplot.online/ (accessed on 22 March 2026).
  27. Bosiljkov, T.; Dujmić, F.; Cvjetko Bubalo, M.; Hribar, J.; Vidrih, R.; Brnčić, M.; Zlatic, E.; Radojčić Redovniković, I.; Jokić, S. Natural Deep Eutectic Solvents and Ultrasound-Assisted Extraction: Green Approaches for Extraction of Wine Lees Anthocyanins. Food Bioprod. Process. 2017, 102, 195–203. [Google Scholar] [CrossRef] [Scilit]
  28. Zannou, O.; Koca, I. Greener Extraction of Anthocyanins and Antioxidant Activity from Blackberry (Rubus spp.) Using Natural Deep Eutectic Solvents. Lebenson. Wiss. Technol. 2022, 158, 113184. [Google Scholar] [CrossRef] [Scilit]
  29. Gościniak, A.; Bazan-Woźniak, A.; Pietrzak, R.; Cielecka-Piontek, J. Pomegranate Flower Extract-the Health-Promoting Properties Optimized by Application of the Box-Behnken Design. Molecules 2022, 27, 6616. [Google Scholar] [CrossRef] [Scilit]
  30. Gigliobianco, M.R.; Cortese, M.; Nannini, S.; Di Nicolantonio, L.; Peregrina, D.V.; Lupidi, G.; Vitali, L.A.; Bocchietto, E.; Di Martino, P.; Censi, R. Chemical, Antioxidant, and Antimicrobial Properties of the Peel and Male Flower by-Products of Four Varieties of Punica granatum L. Cultivated in the Marche Region for Their Use in Cosmetic Products. Antioxidants 2022, 11, 768. [Google Scholar] [CrossRef] [Scilit]
  31. Yan, Z.; Alimu, R.; Wan, J.; Liao, X.; Lin, S.; Dai, S.; Chen, F.; Zhang, S.; Tong, Y.; Liu, H.; et al. Composition of Major Quinochalcone Hydroxysafflor Yellow A and Anhydrosafflor Yellow B Is Associated with Colour of Safflower (Carthamus tinctorius) during Colour-Transition but Not with Overall Antioxidant Capacity: A Study on 144 Cultivars. Food Res. Int. 2022, 162, 112098. [Google Scholar] [CrossRef] [Scilit]
  32. Pires, T.C.S.P.; Dias, M.I.; Barros, L.; Barreira, J.C.M.; Santos-Buelga, C.; Ferreira, I.C.F.R. Incorporation of Natural Colorants Obtained from Edible Flowers in Yogurts. Lebenson. Wiss. Technol. 2018, 97, 668–675. [Google Scholar] [CrossRef] [Scilit]
  33. Dai, Y.; Witkamp, G.-J.; Verpoorte, R.; Choi, Y.H. Natural Deep Eutectic Solvents as a New Extraction Media for Phenolic Metabolites in Carthamus tinctorius L. Anal. Chem. 2013, 85, 6272–6278. [Google Scholar] [CrossRef] [Scilit]
  34. Wang, X.-H.; Wang, J.-P. Effective Extraction with Deep Eutectic Solvents and Enrichment by Macroporous Adsorption Resin of Flavonoids from Carthamus tinctorius L. J. Pharm. Biomed. Anal. 2019, 176, 112804. [Google Scholar] [CrossRef] [Scilit] [PubMed]
  35. Dai, Y.; Verpoorte, R.; Choi, Y.H. Natural Deep Eutectic Solvents Providing Enhanced Stability of Natural Colorants from Safflower (Carthamus tinctorius). Food Chem. 2014, 159, 116–121. [Google Scholar] [CrossRef] [Scilit] [PubMed]
  36. Platzer, M.; Kiese, S.; Herfellner, T.; Schweiggert-Weisz, U.; Miesbauer, O.; Eisner, P. Common Trends and Differences in Antioxidant Activity Analysis of Phenolic Substances Using Single Electron Transfer Based Assays. Molecules 2021, 26, 1244. [Google Scholar] [CrossRef] [Scilit]
  37. Wołosiak, R.; Drużyńska, B.; Derewiaka, D.; Piecyk, M.; Majewska, E.; Ciecierska, M.; Worobiej, E.; Pakosz, P. Verification of the Conditions for Determination of Antioxidant Activity by ABTS and DPPH Assays—A Practical Approach. Molecules 2021, 27, 50. [Google Scholar] [CrossRef] [Scilit]
  38. Różyło, R.; Szymańska-Chargot, M.; Gawlik-Dziki, U.; Dziki, D. Spectroscopic, Mineral, and Antioxidant Characteristics of Blue Colored Powders Prepared from Cornflower Aqueous Extracts. Food Chem. 2021, 346, 128889. [Google Scholar] [CrossRef] [Scilit]
  39. Oancea, S. A Review of the Current Knowledge of Thermal Stability of Anthocyanins and Approaches to Their Stabilization to Heat. Antioxidants 2021, 10, 1337. [Google Scholar] [CrossRef] [Scilit]
  40. Xue, H.; Zhao, J.; Wang, Y.; Shi, Z.; Xie, K.; Liao, X.; Tan, J. Factors Affecting the Stability of Anthocyanins and Strategies for Improving Their Stability: A Review. Food Chem. X 2024, 24, 101883. [Google Scholar] [CrossRef] [Scilit]
  41. Moldovan, B.; David, L.; Chişbora, C.; Cimpoiu, C. Degradation Kinetics of Anthocyanins from European Cranberrybush (Viburnum opulus L.) Fruit Extracts. Effects of Temperature, pH and Storage Solvent. Molecules 2012, 17, 11655–11666. [Google Scholar] [CrossRef] [Scilit]
  42. Sirviö, J.A.; Haataja, R.; Kantola, A.M.; Suopajärvi, T.; Liimatainen, H. Insights into the Role of Molar Ratio and Added Water in the Properties of Choline Chloride and Urea-Based Eutectic Mixtures and Their Cellulose Swelling Capacity. Phys. Chem. Chem. Phys. 2022, 24, 28609–28620. [Google Scholar] [CrossRef] [Scilit]
  43. Jovanović, M.S.; Krgović, N.; Živković, J.; Stević, T.; Zdunić, G.; Bigović, D.; Šavikin, K. Ultrasound-Assisted Natural Deep Eutectic Solvents Extraction of Bilberry Anthocyanins: Optimization, Bioactivities, and Storage Stability. Plants 2022, 11, 2680. [Google Scholar] [CrossRef] [Scilit]
  44. Zhang, L.; Fu, Q.; Zhang, Y. Composition of Anthocyanins in Pomegranate Flowers and Their Antioxidant Activity. Food Chem. 2011, 127, 1444–1449. [Google Scholar] [CrossRef] [Scilit]
  45. Gościniak, A.; Rosiak, N.; Szymanowska, D.; Miklaszewski, A.; Cielecka-Piontek, J. Prebiotic Systems Containing Anthocyanin-Rich Pomegranate Flower Extracts with Antioxidant and Antidiabetic Effects. Pharmaceutics 2024, 16, 526. [Google Scholar] [CrossRef] [Scilit] [PubMed]
  46. Omar, K.A.; Sadeghi, R. Physicochemical Properties of Deep Eutectic Solvents: A Review. J. Mol. Liq. 2022, 360, 119524. [Google Scholar] [CrossRef] [Scilit]
  47. Foroutani, Z.; Afshar Mogaddam, M.R.; Ghasempour, Z.; Ghareaghajlou, N. Application of Deep Eutectic Solvents in the Extraction of Anthocyanins: Stability, Bioavailability, and Antioxidant Property. Trends Food Sci. Technol. 2024, 144, 104324. [Google Scholar] [CrossRef] [Scilit]
Figure 1. Dried floral materials used in this study prior to milling and extraction. (a) Cornflower petals (C. cyanus L.), (b) safflower petals (C. tinctorius L.), (c) pomegranate flowers (P. granatum L.).
Applsci 16 04036 g001
Figure 2. Anthocyanin content of cornflower, safflower, and pomegranate flower extracts obtained with different solvent systems. Results are expressed as mg cyanidin-3-glucoside equivalents per g dry weight (mg C3GE/g DW) and presented as mean ± SD (n = 3). Different letters above bars (A–H) indicate statistically significant differences (Tukey’s HSD test, p < 0.05).
Applsci 16 04036 g002
Figure 3. Total phenolic content (TPC) of cornflower, safflower, and pomegranate flower extracts obtained with different solvent systems. Results are expressed as mg gallic acid equivalents per g dry weight (mg GAE/g DW) and presented as mean ± SD (n = 3). Different letters above bars (A–F) indicate statistically significant differences (Tukey’s HSD test, p < 0.05).
Applsci 16 04036 g003
Figure 4. Total flavonoid content (TFC) of cornflower, safflower, and pomegranate flower extracts obtained with different solvent systems. Results are expressed as mg quercetin equivalents per g dry weight (mg QE/g DW) and presented as mean ± SD (n = 3). Different letters above bars (A–I) indicate statistically significant differences (Tukey’s HSD test, p < 0.05).
Applsci 16 04036 g004
Figure 5. DPPH radical scavenging activity of cornflower, safflower, and pomegranate flower extracts obtained with different solvent systems. Results are expressed as mmol Trolox equivalents per g dry weight (mmol TE/g DW) and presented as mean ± SD (n = 3). Different letters above bars (A–D) indicate statistically significant differences (Tukey’s HSD test, p < 0.05).
Applsci 16 04036 g005
Figure 6. ABTS radical cation scavenging activity of cornflower, safflower, and pomegranate flower extracts obtained with different solvent systems. Results are expressed as mmol Trolox equivalents per g dry weight (mmol TE/g DW) and presented as mean ± SD (n = 3). Different letters above bars (A–E) indicate statistically significant differences (Tukey’s HSD test, p < 0.05).
Applsci 16 04036 g006
Figure 7. Heatmap of the composite standardized performance index (Z-overall) for six solvent systems used to extract bioactive compounds from three floral materials (cornflower, safflower, and pomegranate flower). For each material, individual assay results (anthocyanins, TPC, TFC, DPPH, and ABTS) were standardized across solvents as z-scores, and the resulting values were averaged to obtain the composite Z-overall index. Higher values indicate better overall extraction performance relative to the solvent mean for that matrix. Hierarchical clustering was performed using Ward’s linkage and Euclidean distance on the z-scored data.
Applsci 16 04036 g007
Figure 8. Changes in relative anthocyanin concentration during 8-week storage of the pomegranate flower extract in four solvent systems (water, ethanol, 60% CCG, 60% CCU) at 4 °C and 20 °C. Anthocyanin content was measured at weekly intervals, and the lines connect successive experimental mean values to facilitate visualization of degradation trends.
Applsci 16 04036 g008
Table 1. Matrix-dependent summary of extraction performance across the tested solvent systems.
Floral MatrixDominant Response in This StudyMost Favorable Solvent Systems Under the Tested Conditions *
P. granatum flowerHighest anthocyanin content, TPC, and antioxidant activity60% CCU and 60% CCG for extraction; 60% CCG for extraction–stability balance
C. tinctorius petalsHighest TFCCCU- and CCG-containing systems, particularly 60% formulations
C. cyanus petalsLower overall anthocyanin, TPC, TFC, and antioxidant values than pomegranateNo single solvent showed a clear universal advantage across all responses
* “Most favorable” refers to the best overall performance within the present experimental design and should be interpreted together with the statistical groupings shown in Figure 2, Figure 3, Figure 4, Figure 5 and Figure 6 and the composite Z-overall comparison in Figure 7.
Table 2. First-order degradation kinetics of anthocyanins in the selected flower extract stored for 8 weeks (56 days) at 4 °C and 20 °C in different solvent systems (Water, EtOH, 60% CCG, 60% CCU).
ConditionSlopeR2k (day−1)t1/2 (days)T90 (days)Ea (kJ/mol)Q10
Water-4 °C−0.01120.94510.011261.899.4125.311.455
Water-20 °C−0.02040.94540.020433.985.16
EtOH-4 °C−0.00190.76440.0019364.8155.4513.241.217
EtOH-20 °C−0.00260.68210.0026266.6040.52
60% CCG-4 °C−0.00200.78660.0020346.5752.6838.681.773
60% CCG-20 °C−0.00500.85850.0050138.6321.07
60% CCU-4 °C−0.00590.88670.0059117.4817.86112.775.310
60% CCU-20 °C−0.08530.98640.08538.131.24
R2—coefficient of determination of the first-order regression model; k—first-order degradation rate constant (day−1); t1/2—time required for anthocyanin content to decrease to 50% of its initial value (days); T90—time for 10% anthocyanin loss (days); Ea—activation energy (kJ/mol); Q10—temperature coefficient.
Disclaimer/Publisher’s Note: The statements, opinions and data contained in all publications are solely those of the individual author(s) and contributor(s) and not of MDPI and/or the editor(s). MDPI and/or the editor(s) disclaim responsibility for any injury to people or property resulting from any ideas, methods, instructions or products referred to in the content.