Article

The Study of Influence of Quarry Bench Elevation on the Prediction of Blasting Vibration Using Empirical Attenuation Equations and Artificial Neural Networks


1
Institute of Mineral Resources Engineering, National Taipei University of Technology, Taipei 10608, Taiwan
2
Fortune Construction Co., Ltd., Taipei 11059, Taiwan
*
Author to whom correspondence should be addressed.
Appl. Sci. 2026, 16(7), 3556; https://doi.org/10.3390/app16073556
Submission received: 6 March 2026 / Revised: 1 April 2026 / Accepted: 3 April 2026 / Published: 5 April 2026

Abstract

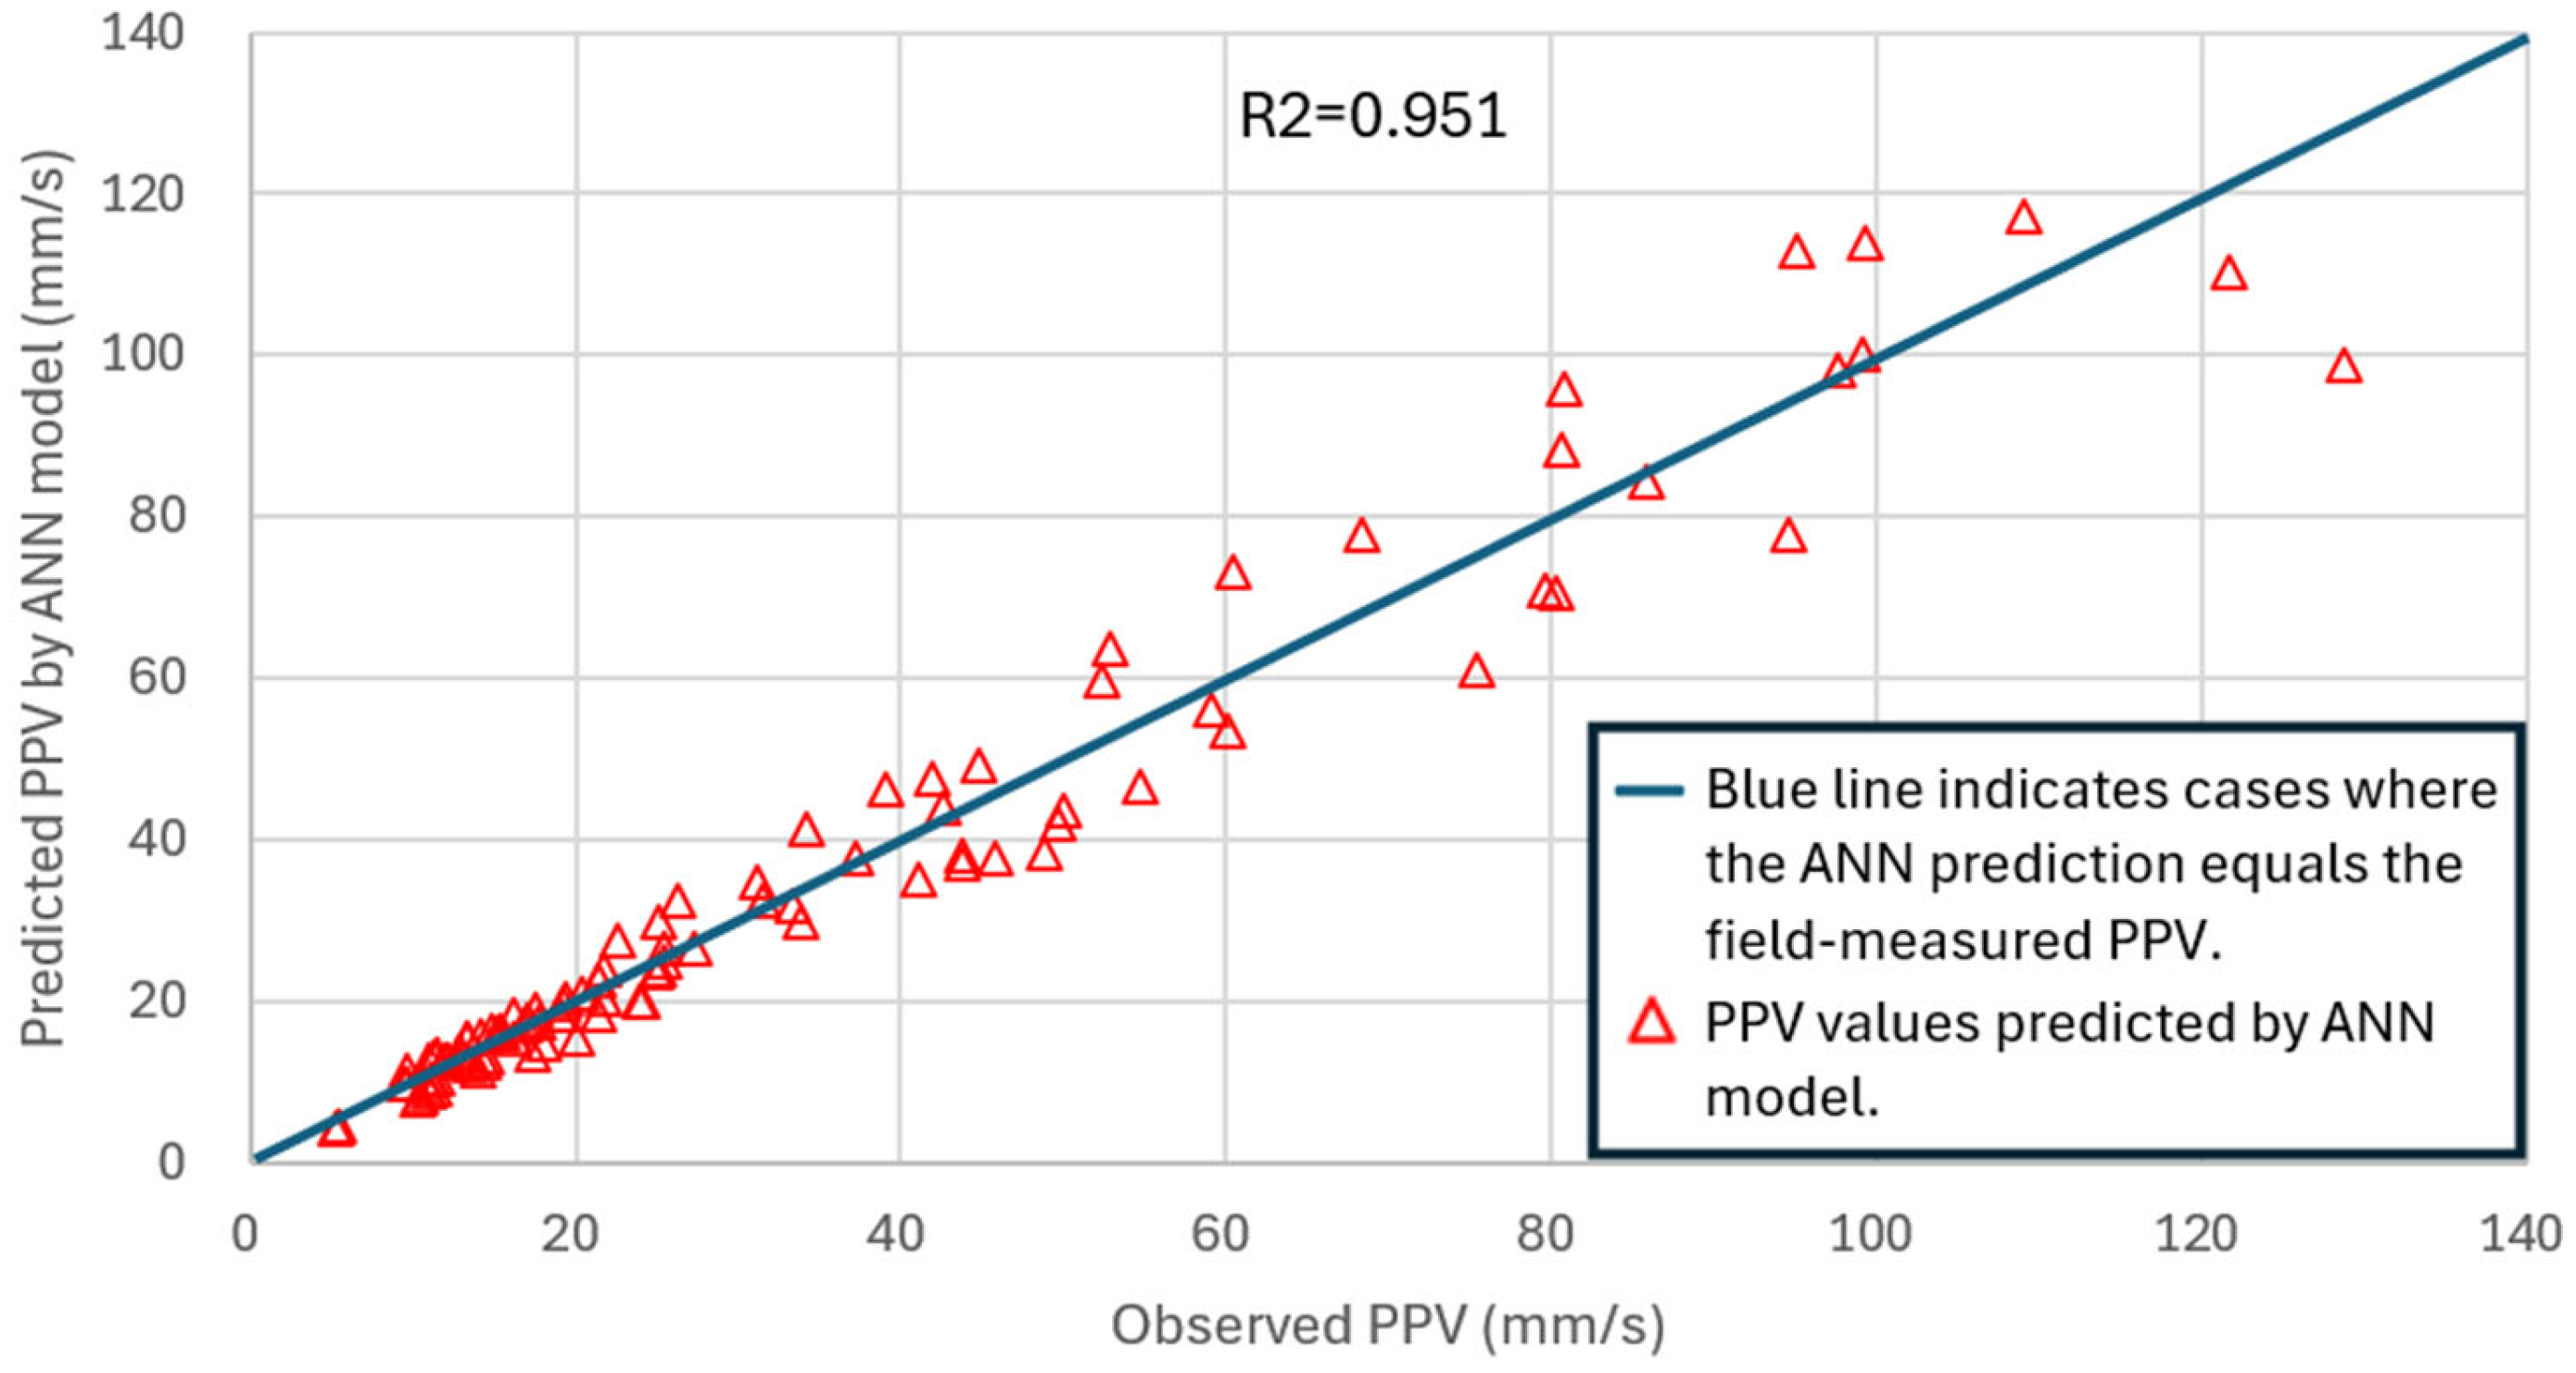
Blasting operations in quarries are frequently carried out across benches with pronounced elevation variations, which affect the propagation of ground vibrations. This study examines vibration attenuation in a marble quarry in eastern Taiwan using both traditional empirical formulas and artificial neural networks (ANNs). Field measurements were collected from 54 production blasts, resulting in 322 vibration records at three distinct elevation levels. Several empirical equations—including an elevation correction factor—were applied and compared. Among these, the equation incorporating an adjusted elevation factor yielded higher R2 values than the other empirical models. In parallel, a three-layer ANN trained in MATLAB, using inputs such as instantaneous charge, distance, elevation difference, and total charge per blast, achieved an R2 of 0.951, highlighting total charge as a key parameter. Both the empirical and ANN methods proved effective for PPV prediction, but the ANN models demonstrated better accuracy when total charge was included.

1. Introduction

Drilling and blasting are the most common production operations used at most cement quarries in Taiwan. Breaking rock by blasting remains the most effective and widely adopted method. However, blasting-induced vibration may damage nearby buildings and adversely affect the local ecology. In general, terrain-based vibration wave models can be used to analyze vibration transmission characteristics. This information can then be used to provide solutions to reduce the vibration influence on the environment and nearby ecology.
This study utilizes peak particle velocity (PPV) measured during quarry blasting operations, together with corresponding blasting design parameters, as the primary dataset. Blasting vibration data were monitored and recorded at benches of different elevation levels of the quarry under study. An artificial neural network (ANN) was used to analyze the monitored data and to identify the most influential parameters. Under identical distance and blasting configuration conditions, PPV values were simulated and predicted. This study compares its results with empirical blast vibration equations (such as USBM, Sadovsky, and C.T.ZHU) [1,2,3], artificial neural network model predictions, and field measurement data to evaluate the accuracy and applicability of each method.
For blast-induced ground vibration, PPV is an evaluation criterion and has been commonly used for more than 80 years. The ground vibration prediction is based upon the distance and the charge weight scaling law [4,5,6,7]. The PPV is given by the following equation [8,9]:
PPV = K (SD)α
where K and α are the site- and geological-dependent constants respectively, and SD is the scaled distance, which is a blasting design parameter defined as a relationship between the distance from the blast and explosive charge weight. The site factors are determined by a logarithmic plot of PPV versus scaled distance. The straight line best representing the data has a negative slope α and an intercept K. The concept behind the scaled distance regression analysis involves the variation in PPV with scaled distance and constants K and α are used depending on the site-specific geological condition [10,11].
According to conventional empirical attenuation models, such as the US Bureau of Mines equation [8] and the Sadovsky empirical equations [12], the PPV evaluation is based upon the horizontal distance between the blasting site and measuring point. For mountain-side contour mining in Taiwan, the blasting wave will transmit toward the benches above and below the blasting bench, which may further amplify and/or attenuate the ground vibration due to the complex terrain [13].
With recent advances in computing and artificial intelligence, artificial neural networks (ANNs) have been widely used in various science applications. ANNs can model highly nonlinear behavior that traditional linear or empirical models cannot capture well. They are now commonly applied to tasks such as classification, regression, pattern recognition, and prediction in fields including blasting vibration analysis.
To improve prediction accuracy, numerous numerical and intelligent approaches have been developed over the years, including artificial neural networks (ANNs) [14,15,16,17,18,19]. In the context of blasting vibration prediction, ANNs can integrate multiple influencing factors—such as charge weight, distance, and elevation—allowing for the modeling of intricate interactions that affect ground vibration propagation. Khandelwal and Singh predict air overpressure using distance and sound pressure level as inputs to a neural network and compared the results with the USBM predictor (cube-root scaled distance) and the multivariate regression analysis (MVRA) equation [20]. Tawadrous used an ANN for blast design and found very good results [21]. By training on a sufficiently large and representative dataset, ANNs are able to generalize and provide reliable predictions, even in scenarios characterized by variable geological conditions and bench elevations. In practical quarry blasting, however, maximum instantaneous charge may not be the only parameter affecting vibration behavior. In operations using non-electric detonators, the scattering of delay timing may cause multiple holes to fire nearly simultaneously, especially when the number of holes and the total explosive charge are large [22,23]. Under such conditions, the actual vibration response may be influenced not only by the nominal charge per delay, but also by the total charge involved in a blast round. Recent ANN-based studies on blast vibration prediction have therefore considered multiple blasting parameters to improve predictive performance [24,25]. This suggests that, for quarry blasts under non-electric initiation systems, incorporating total charge as an additional input variable in ANN modeling may provide a more realistic representation of PPV characteristics.
Accordingly, this study aims to (1) analyze PPV data monitored at quarry benches of different elevation, (2) develop an ANN-based predictive model incorporating blasting design parameters and geometric conditions, (3) compare ANN predictions with conventional empirical attenuation equation and field measurements, and (4) provide preliminary insights and a conceptual framework for evaluating the effects of terrain undulation and elevation differences on the blasting vibration propagation characteristics. Hopefully, the findings of this study can provide more accurate and more reliable vibration assessment in stage-wise quarry mining under complex topographic conditions.

2. Methods

2.1. Site Description and Field Measurements

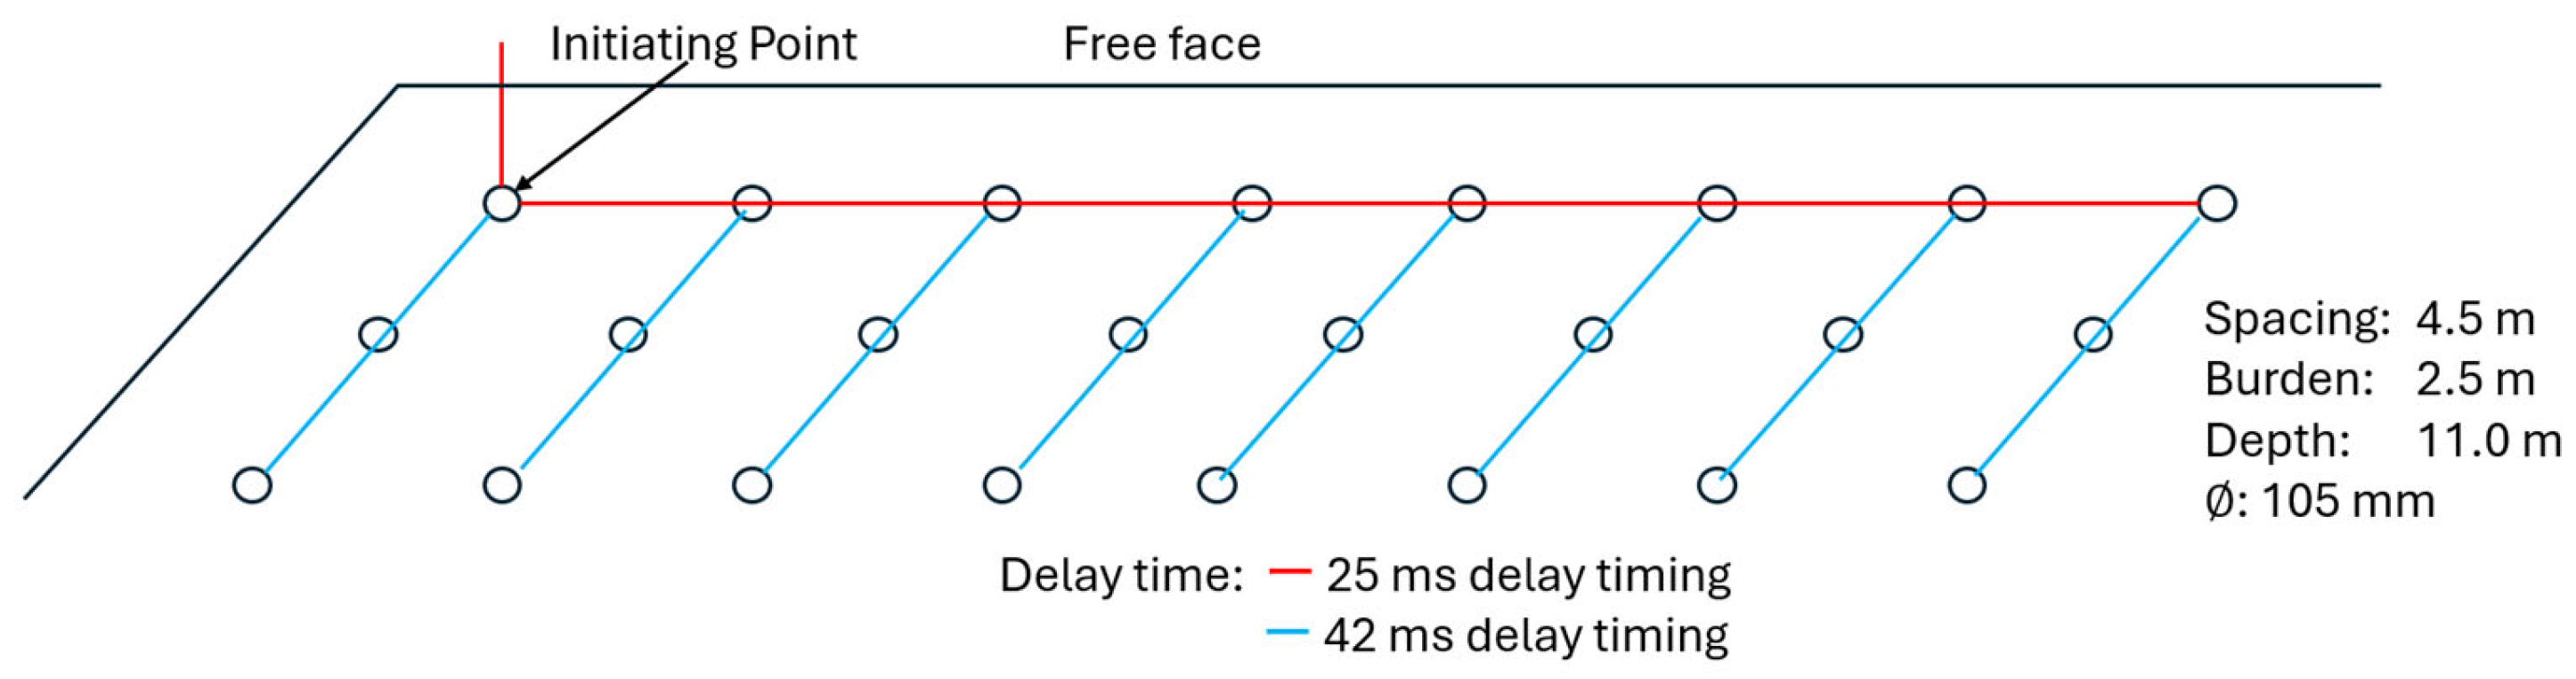
The field study was conducted in a cement raw material quarry located in Hualien County, eastern Taiwan. The rock mass belongs to metamorphic formations and is dominated by marble with a uniaxial compressive strength between 80 and 90 MPa. The marble strata are monoclinic with a thickness of approximately 500 m. Locally, there are dolomite interlayers, green schist, and black schist. The main strata strike is measured as N30E and dip at 25S, with well-developed joints. The quarry is designed with 10 m height benches, and the blasting pattern is summarized in Table 1. A schematic layout of the quarry and vibration monitoring arrangement is shown in Figure 1.
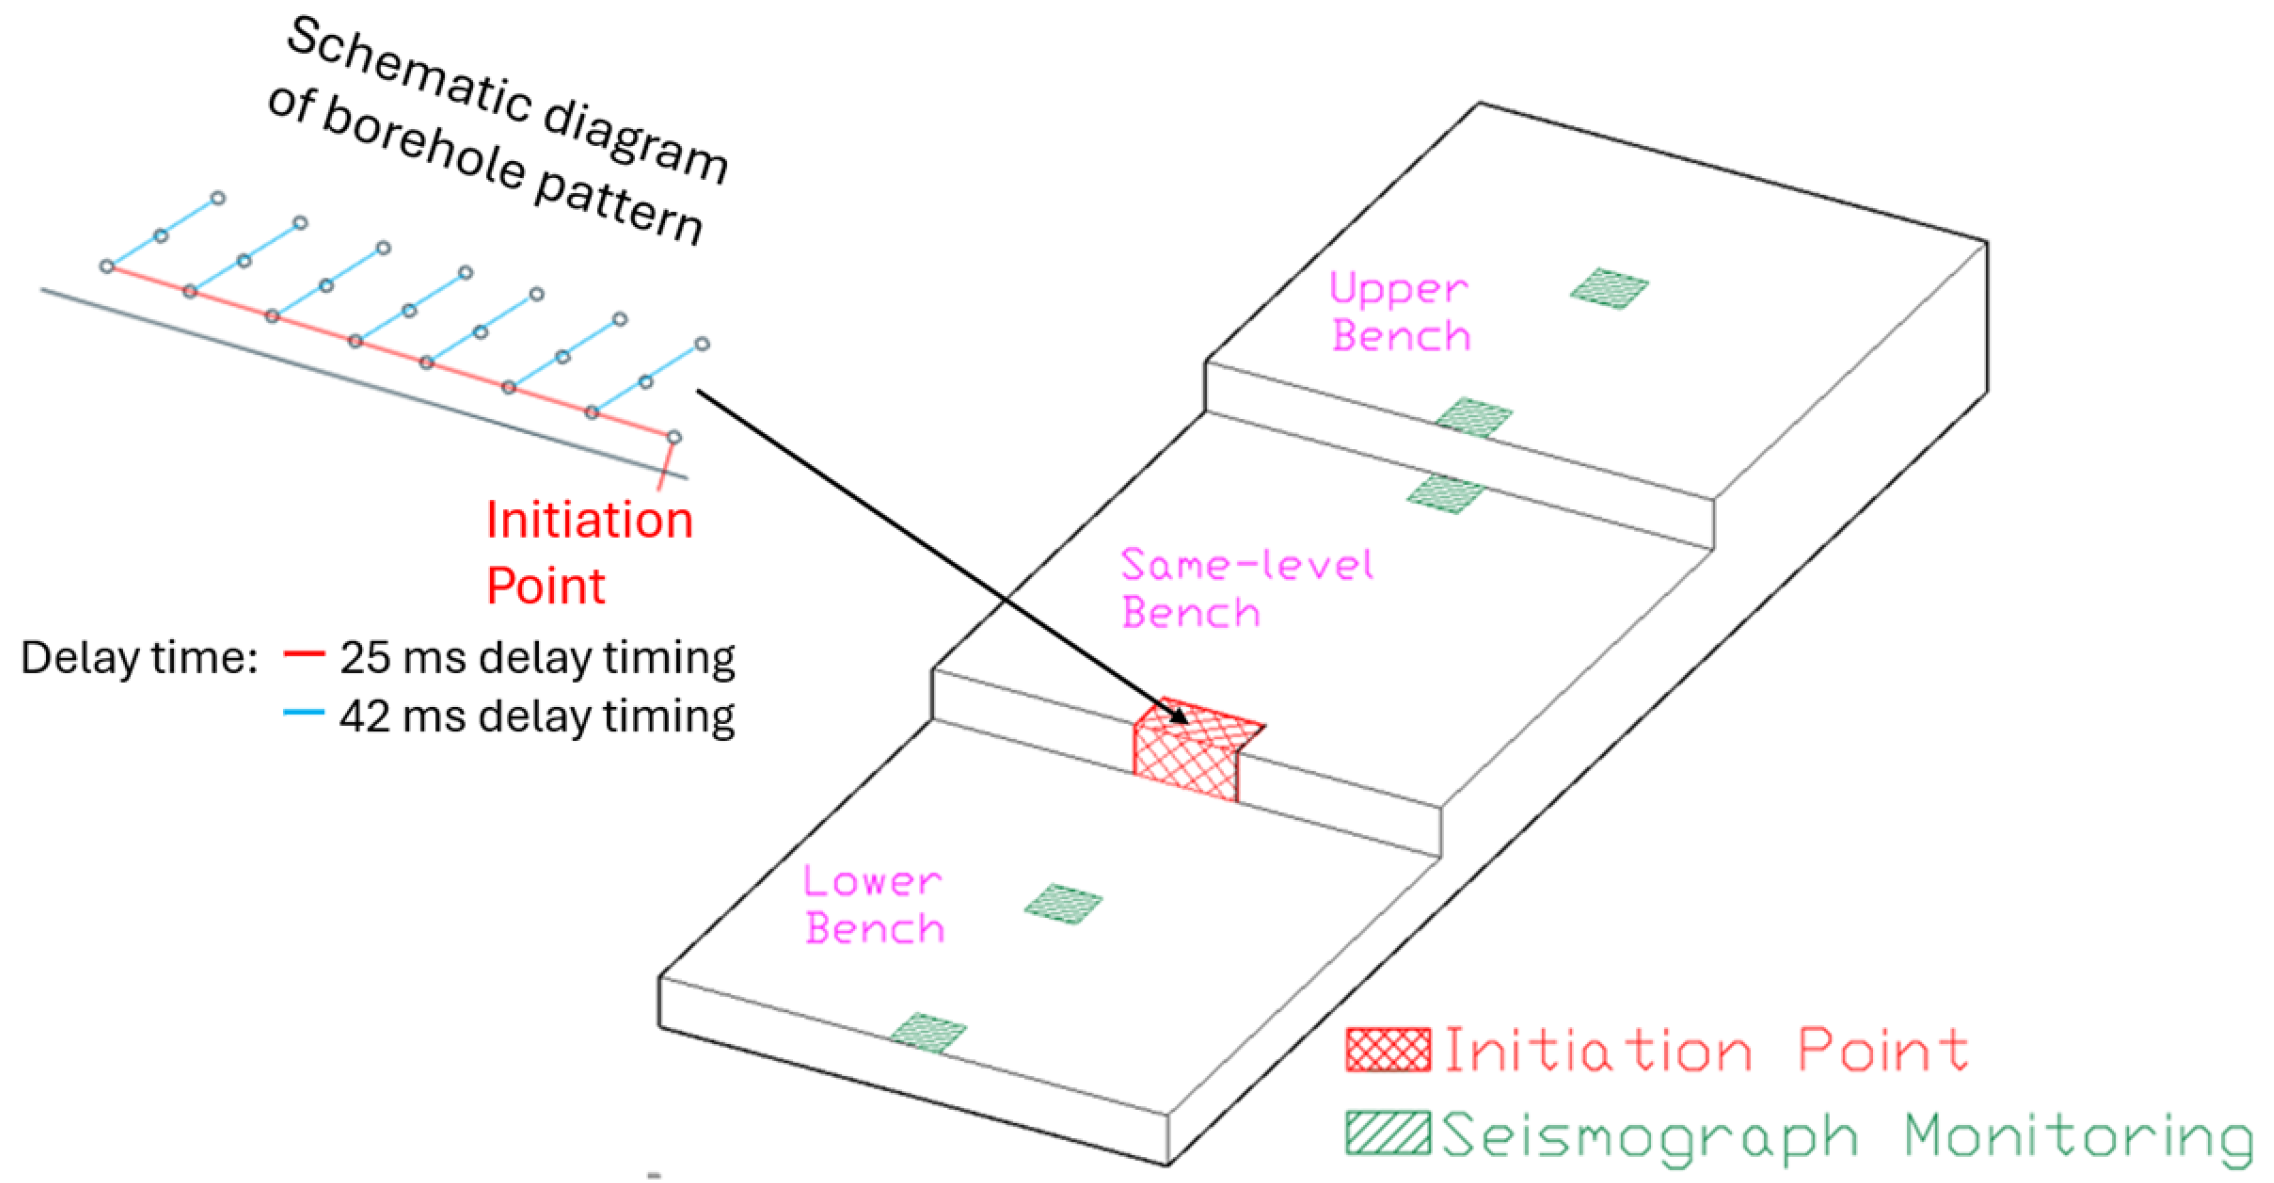
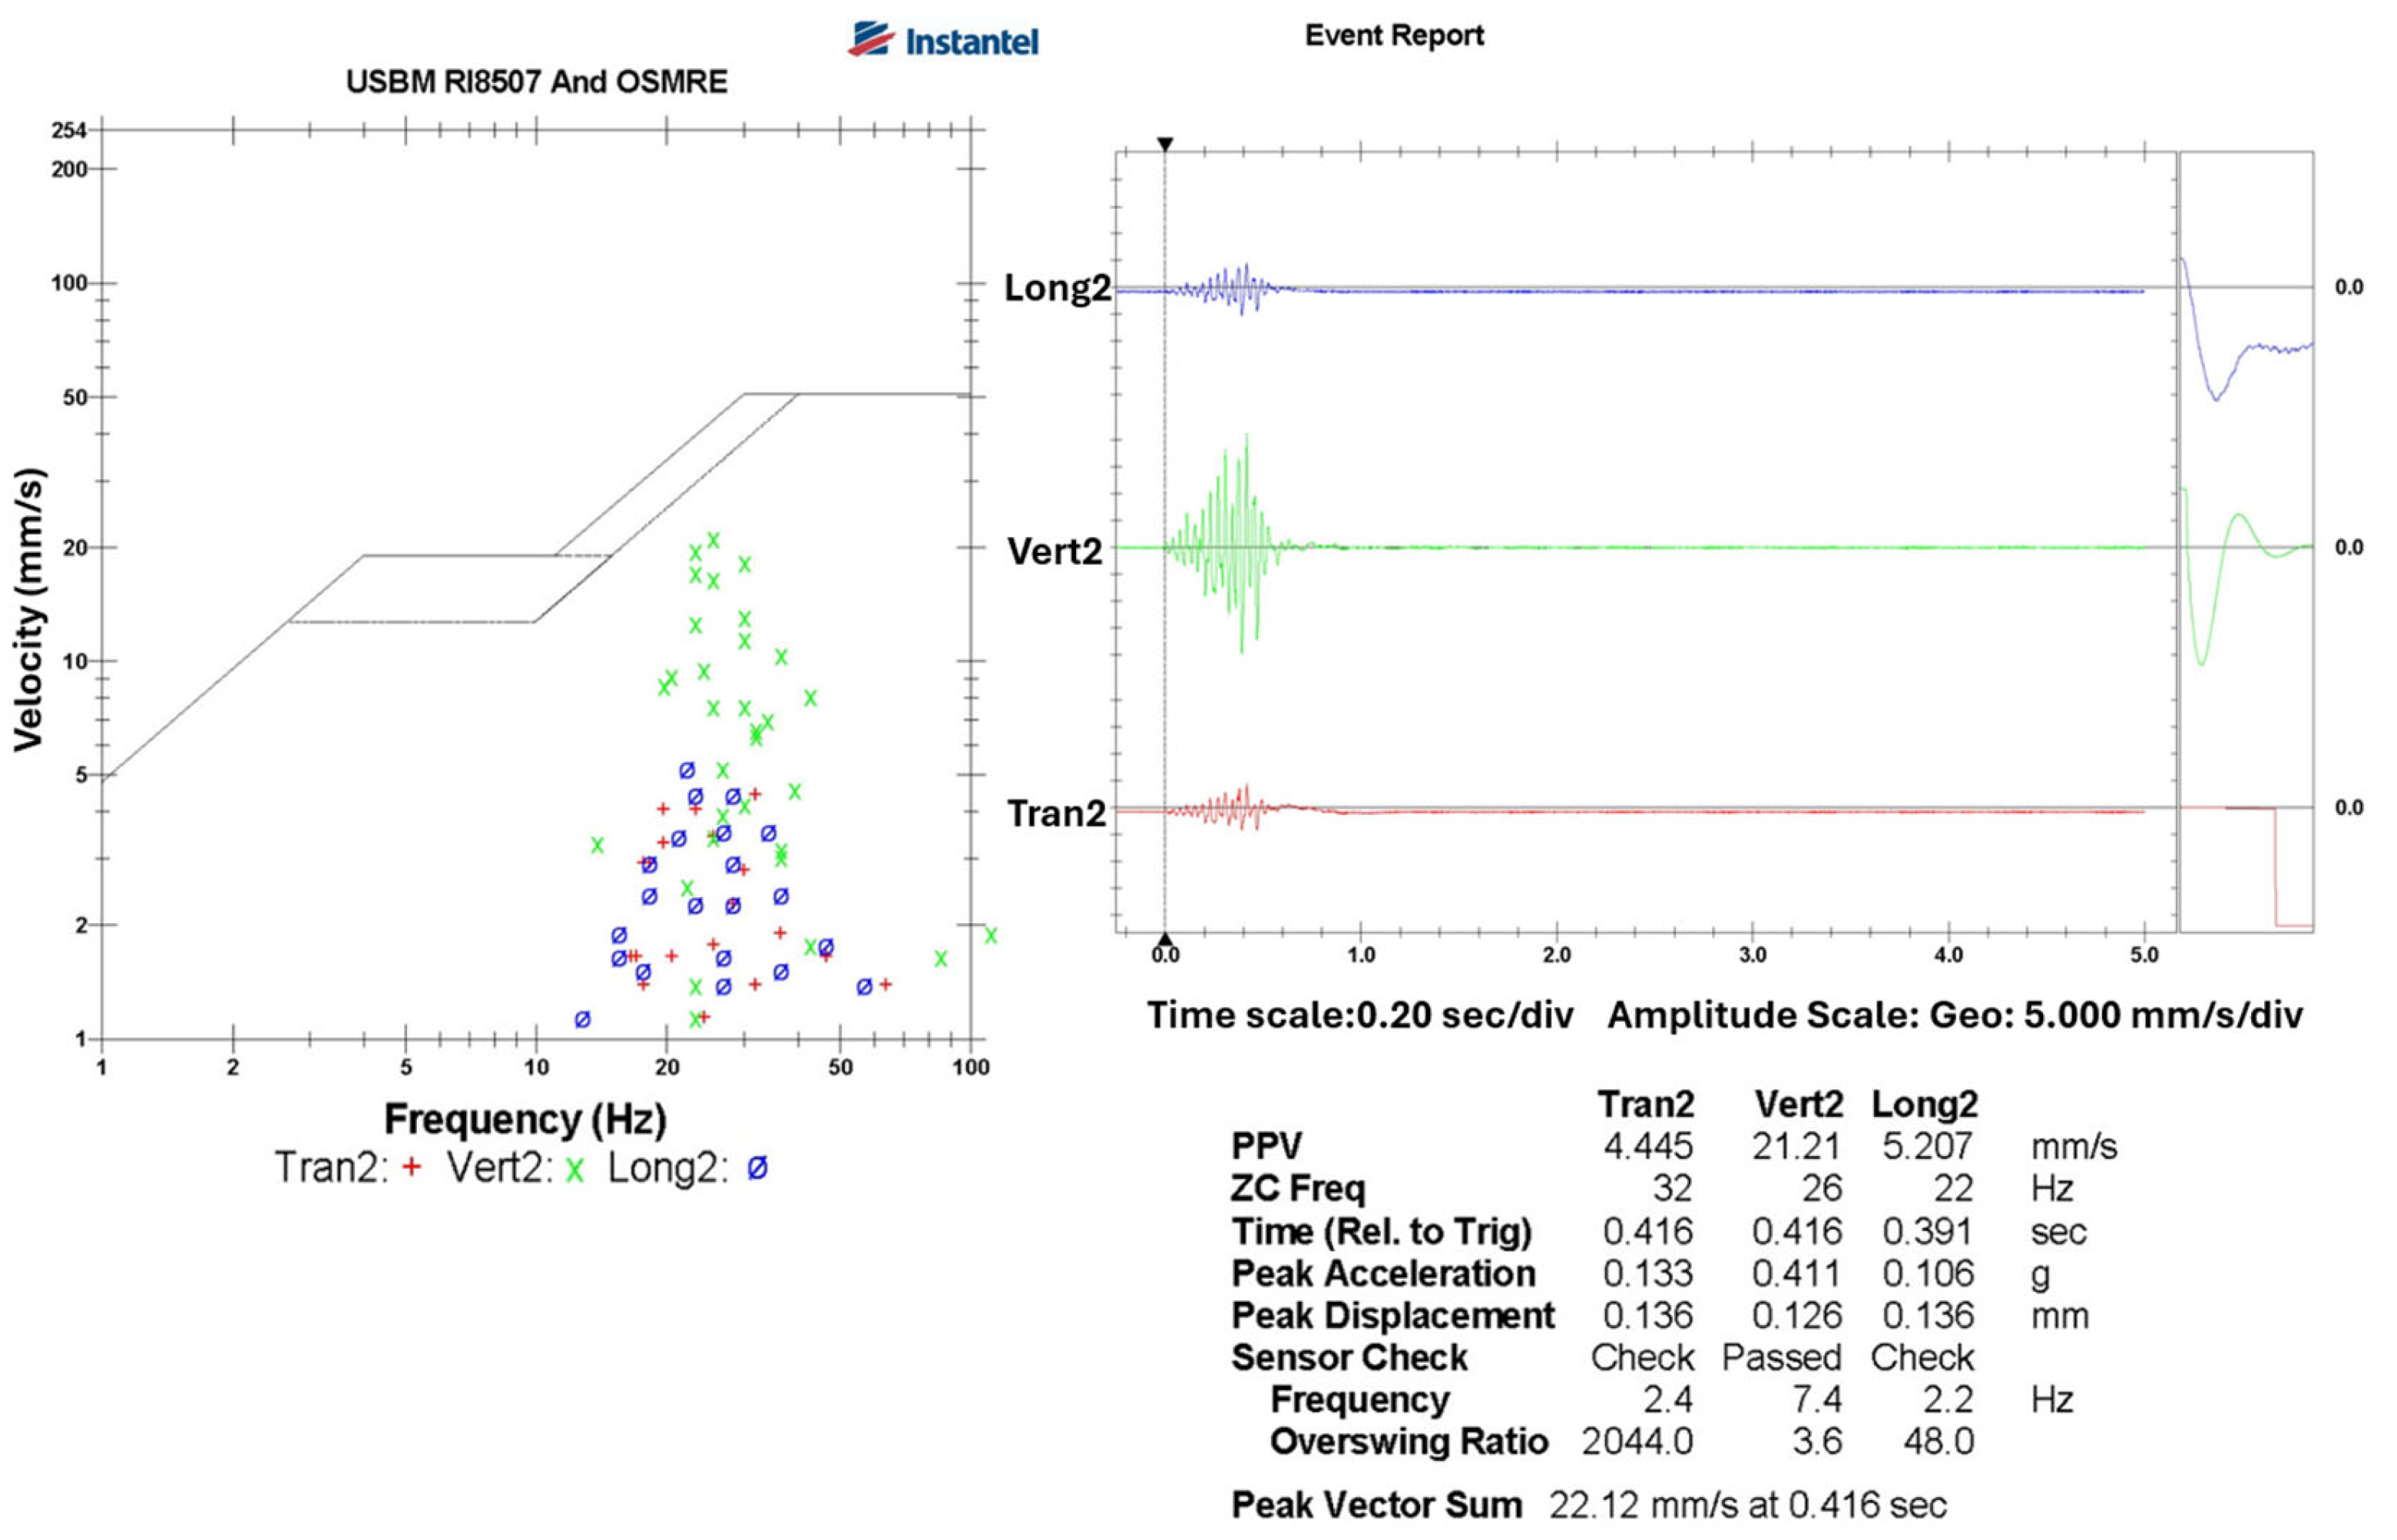
To investigate the influence of elevation differences on the vibration propagation, PPV monitors of Instantel MiniMate Plus were used in this study. It is a portable vibration monitoring device commonly used in blast vibration studies, and it is capable of measuring vibration values in three directions, including acceleration, displacement, and resultant velocity waveform. It features a trigger threshold and measurement accuracy of 0.127 mm/s, a maximum measurable velocity of 254 mm/s, and a sampling rate of 1024 samples per second. As shown in Figure 2, three sets of vibration monitors were installed at different elevation levels relative to the blast bench: (1) same-level bench, (2) upper bench, and (3) lower bench, with an elevation difference of 10 m between adjacent levels. In total, 54 blasts were monitored and 322 vibration data were recorded. An example of the recorded blasting vibration waveform, such as longitudinal, vertical and transverse waveforms, is shown in Figure 3. For every blasting monitored, the total charge of explosives per blast, maximum instantaneous charge (charge detonated within 8 ms), elevation of the blast and monitoring point, distance between the blast source and sensor, and measured PPV were documented. Part of the field blast vibration measurement records is presented in Table 2.

2.2. Empirical Vibration Attenuation and Regression Analysis

Three empirical vibration equations were considered in this study to analyze the attenuation of blast-induced PPV measured. They are (1) USBM [1], (2) Sadovsky [2], and (3) C.T.ZHU [3]. The USBM equation is defined as follows:
V = K ( R Q ) α
where V (mm/s) is the PPV, R (m) is the distance from the blast source, Q (kg) is the maximum instantaneous charge, and K and α are regression coefficients.
The Sadovsky equation is given by the following:
V = K ( Q 3 R ) α
To account for elevation effects, the C.T.ZHU empirical equation introduces an additional term related to elevation that can be written as follows:
V = k ( Q 3 R ) α ( Q 3 H ) β
where H (m) denotes the elevation difference between the blast bench and the monitoring point, and β is an elevation-related exponent.
In this study, regression analyses were initially conducted on all 322 records without separating elevation levels, using both the USBM and Sadovsky equations. The data were then divided into three groups: upper bench (107 records), same-level bench (107 records), and lower bench (108 records). For each group, regression analyses were performed with the USBM and Sadovsky equations. Additionally, for vibration analysis of the upper and lower benches, the C.T.ZHU equation was applied. Best-fit coefficients and the coefficients of determination (R2) were calculated and compared across equations and elevation conditions. The coefficient of determination (R2) is a key metric in regression analysis, representing how well a model fits the observed data. R2 is an effective indicator for evaluating the accuracy of different empirical equations in predicting blast-induced vibration. This study compares the R2 values obtained from the USBM, Sadovsky, and C.T.ZHU regression equations, aiming to identify which equation best fits the measured local vibration data and thus provides reliable vibration prediction and management.

2.3. Artificial Neural Network Model

Empirical equations for blasting vibration prediction generally use maximum instantaneous charge as a key parameter. However, for most quarry blasting operations, including the site investigated in this study, non-electric detonators are still widely used. The inherent delay accuracy limitations of non-electric detonators may cause multiple holes to fire simultaneously due to the scattering of the delay timing, especially when the number of holes and total charge are large [22,23]. In order to verify these effects, this study used a backpropagation ANN and incorporated total charge as one of the input variables [24,25].
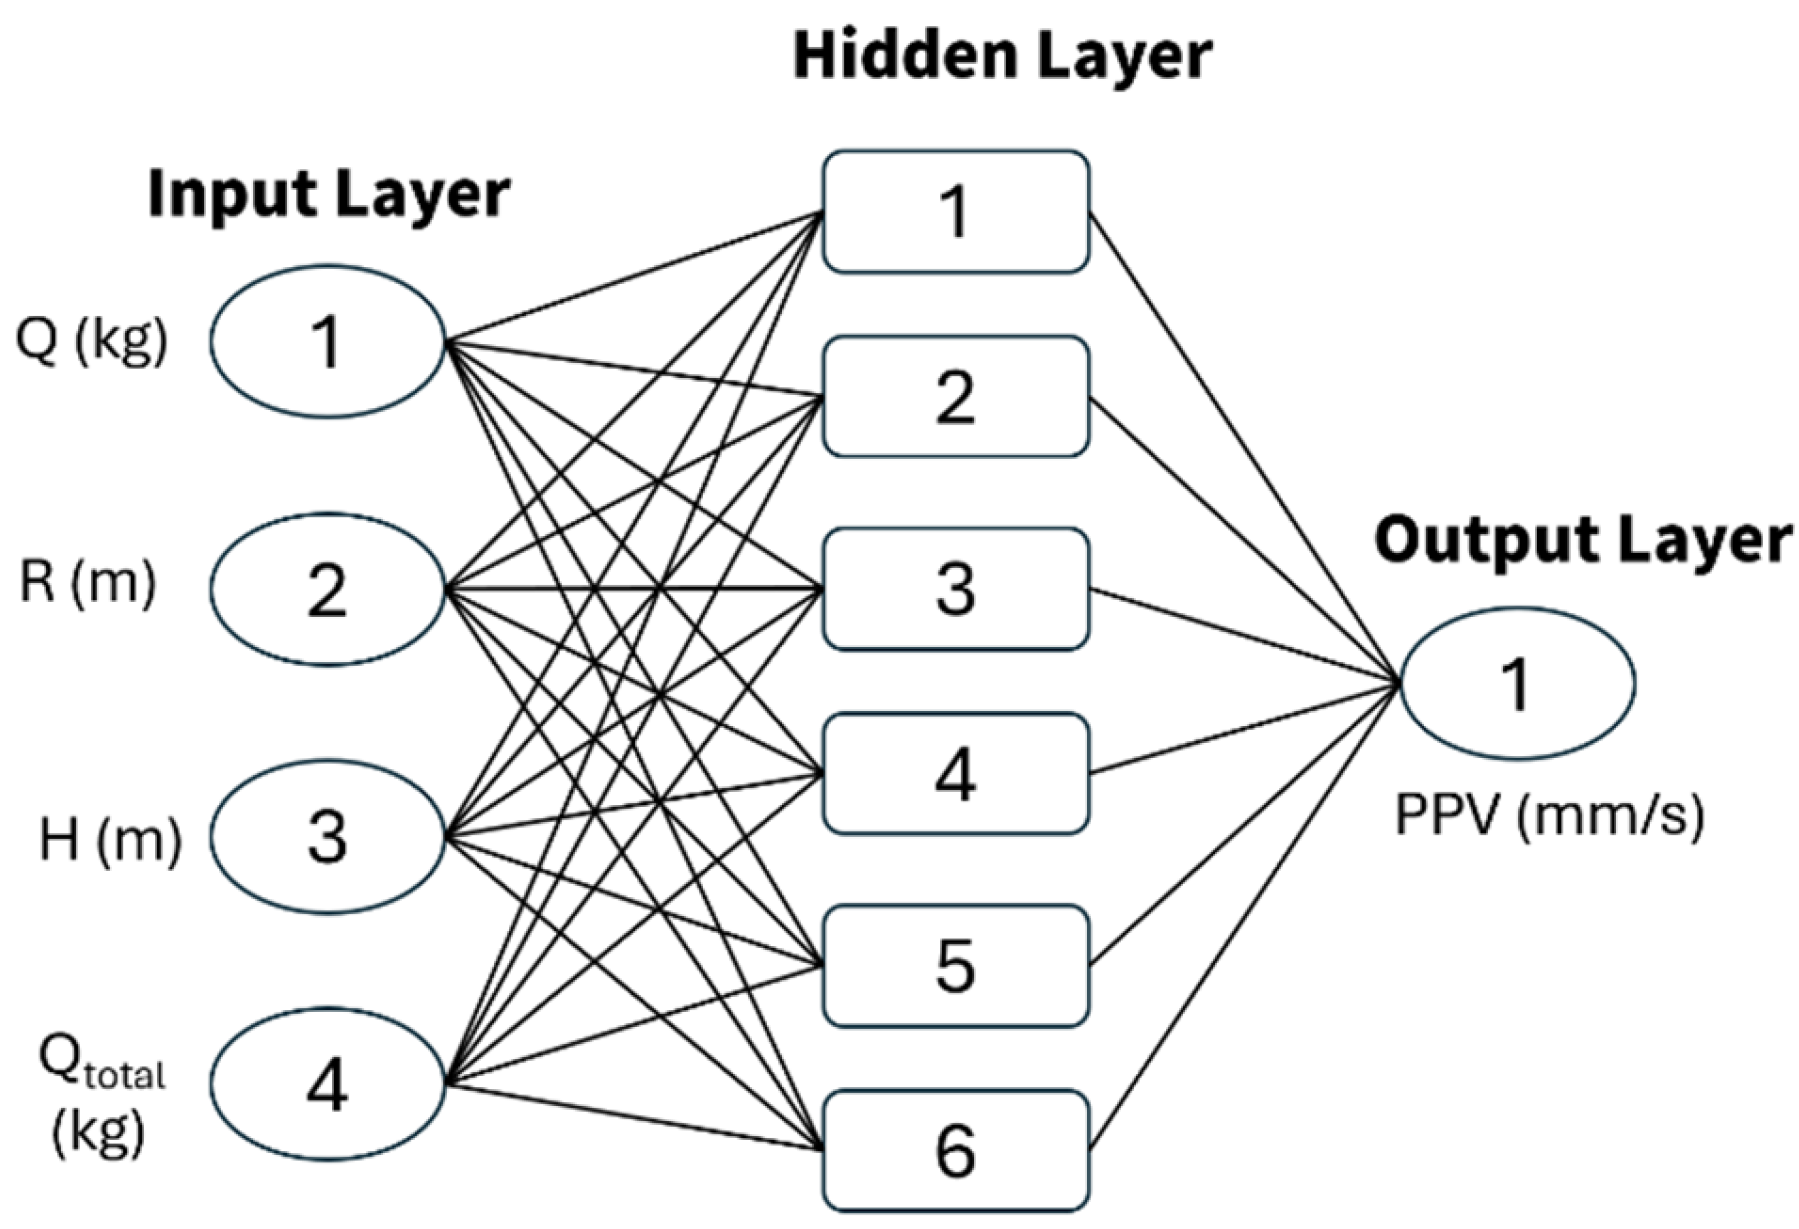
Two ANN input configurations were designed. In Model 1, the input layer consisted of three neurons that represent the maximum instantaneous charge Q, distance R, and elevation difference H. In Model 2, total charge per blast Q_“total” was added as the fourth input neuron. Because the total charge is also considered as one of the important factors that may affect the vibration attenuation characteristic, therefore, it is believed that the total explosive charge input might improve the prediction accuracy.
The ANN structure is a three-layer network comprising an input layer, a single hidden layer, and an output layer. In both models, the output layer contained a single neuron corresponding to PPV. The PPV is the vibration values measured and used for learning and verifying the system. The number of neurons in the hidden layer was determined using a commonly adopted empirical expression [26].
h = m + n + a
where h is the number of hidden neurons, m and n are the numbers of input and output neurons, respectively. a is an integer between 1 and 10. Based on this guideline, the hidden layer was set to six neurons. The resulting structure can be summarized as follows: number of layers = 3; number of input neurons = 3–4; number of hidden neurons = 6; and number of output neurons = 1. The structure of the neural networks is shown in Figure 4.
ANN training and validation were performed using MATLAB. In this study, MATLAB (R2020a) software was used to implement the artificial neural network calculations. For the assumed activation functions, the hidden layer was assigned the nonlinear Tansig (hyperbolic tangent sigmoid transfer function), while the output layer utilized the linear Purelin transfer function. The bias values were randomly initialized by the MATLAB system, and the number of training epochs was set to 1000. Additionally, all input variables were normalized before training the model.
Among the 322 PPV records, 225 (70%) were randomly selected for training, and the remaining 97 records (30%) were used for validation. The Bayesian regularization algorithm was adopted as the training method, which is widely used to improve generalization performance and reduce overfitting in neural network training [27,28]. Typically, it requires more time but is well suited for relatively small and complex datasets.

3. Results

3.1. Regression Results of Empirical Equations

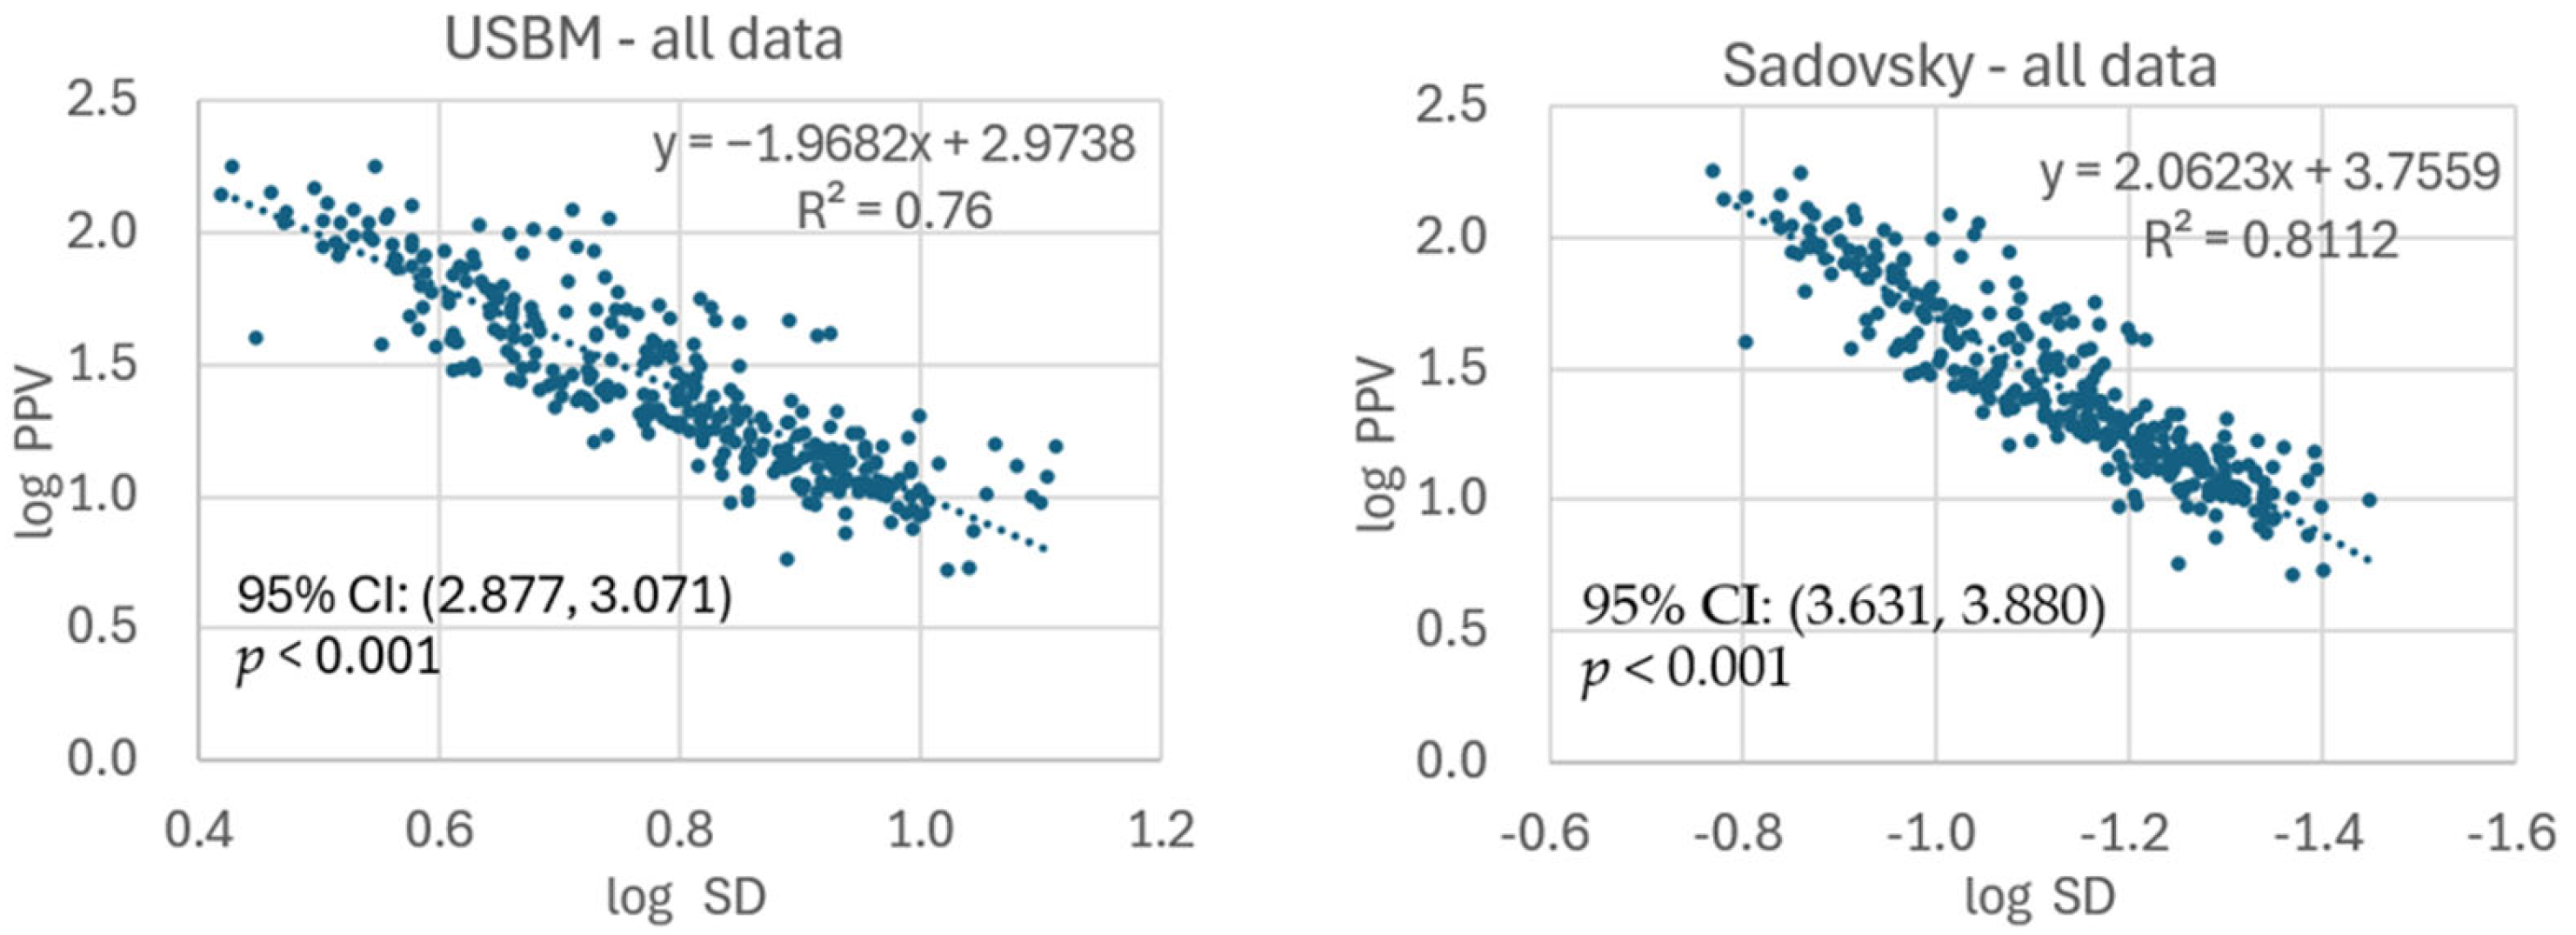
As shown in Figure 5 and Table 3, when all 322 records were analyzed without considering elevation differences, linear regression in the logarithmic space showed that the Sadovsky equation yielded a higher R 2 than the USBM equation. For the full dataset, the USBM equation gave K = 941.456 , α = 1.968 , and R 2 = 0.760 , whereas the Sadovsky equation produced K = 5700.330 , α = 2.062 , and R 2 = 0.811 .
When all data were subjected to regression analysis without considering the effects of change in elevation, the linear regression coefficients of determination R2 for both the USBM and Sadovsky equations reached barely acceptable levels. For the USBM equation, the discrepancies between the predicted and measured PPV values were more concentrated within the range of smaller scaled distances (log SD < 0.7 or SD < 5), with the maximum error exceeding 80 mm/s. This outcome indicates that, under conditions of shorter distances (R) and larger maximum charge weights per delay (Q), the USBM regression model tends to exhibit greater deviations. For the Sadovsky equation, it yielded a higher R2 value than the USBM equation; however, when the scaled distance was higher (log SD > −1.1 or SD > 0.08), the prediction errors also showed an increasing trend. These results suggest that, in the case of this study, both the Sadovsky and USBM equations produced relatively large prediction errors under conditions of short distances and high instantaneous charge weights.

3.2. Effect of Topographic Elevation Changes on Blasting Vibrations

In order to observe the effects of topographic elevation changes at different bench levels on blasting vibrations, this study installed vibration sensors at various elevations and separately verified the recorded values at each elevation using empirical equations. When vibration data with different elevation levels were divided, 107 data of upper bench, 107 data of same-level, and 108 data of lower bench records were analyzed separately. For the upper bench and lower bench, three empirical equations are applied, while the USBM and Sadovsky equations are applied in the same-level bench data.
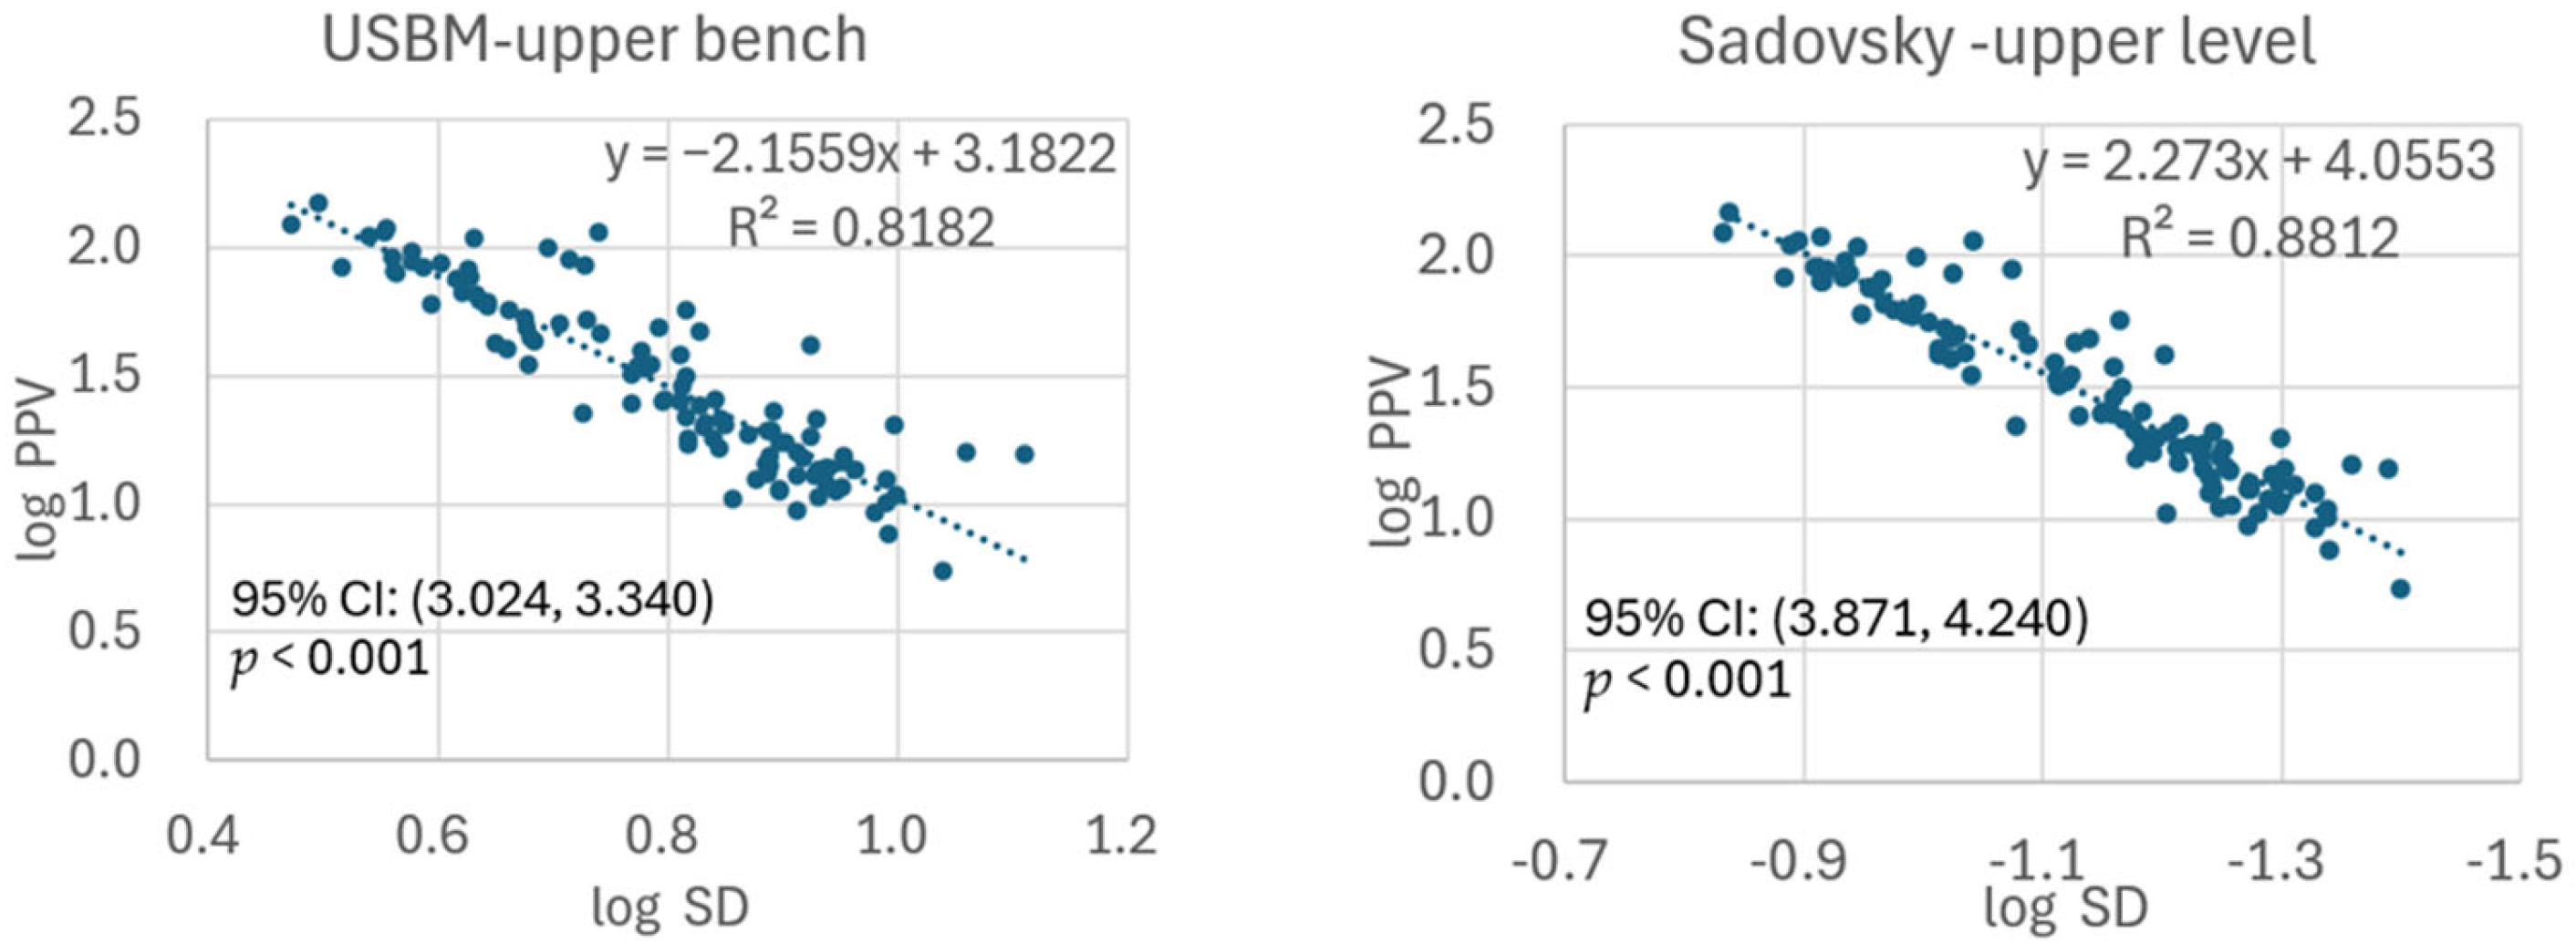
The regression analysis results of the upper bench using the USBM and Sadovsky equations are shown in Figure 6. The Sadovsky equation had a better R2 value (0.8818) than the USBM equation’s R2 value (0.8182). In terms of error distribution, the Sadovsky equation did not show any obvious trend, but the USBM equation had larger errors in the higher SD range (longer distances and lower instantaneous charge weights), indicating that in areas with increased topographic elevation or bench levels, the USBM equation may produce greater deviations in predicting blasting vibrations at longer distances or with smaller instantaneous charge weights.
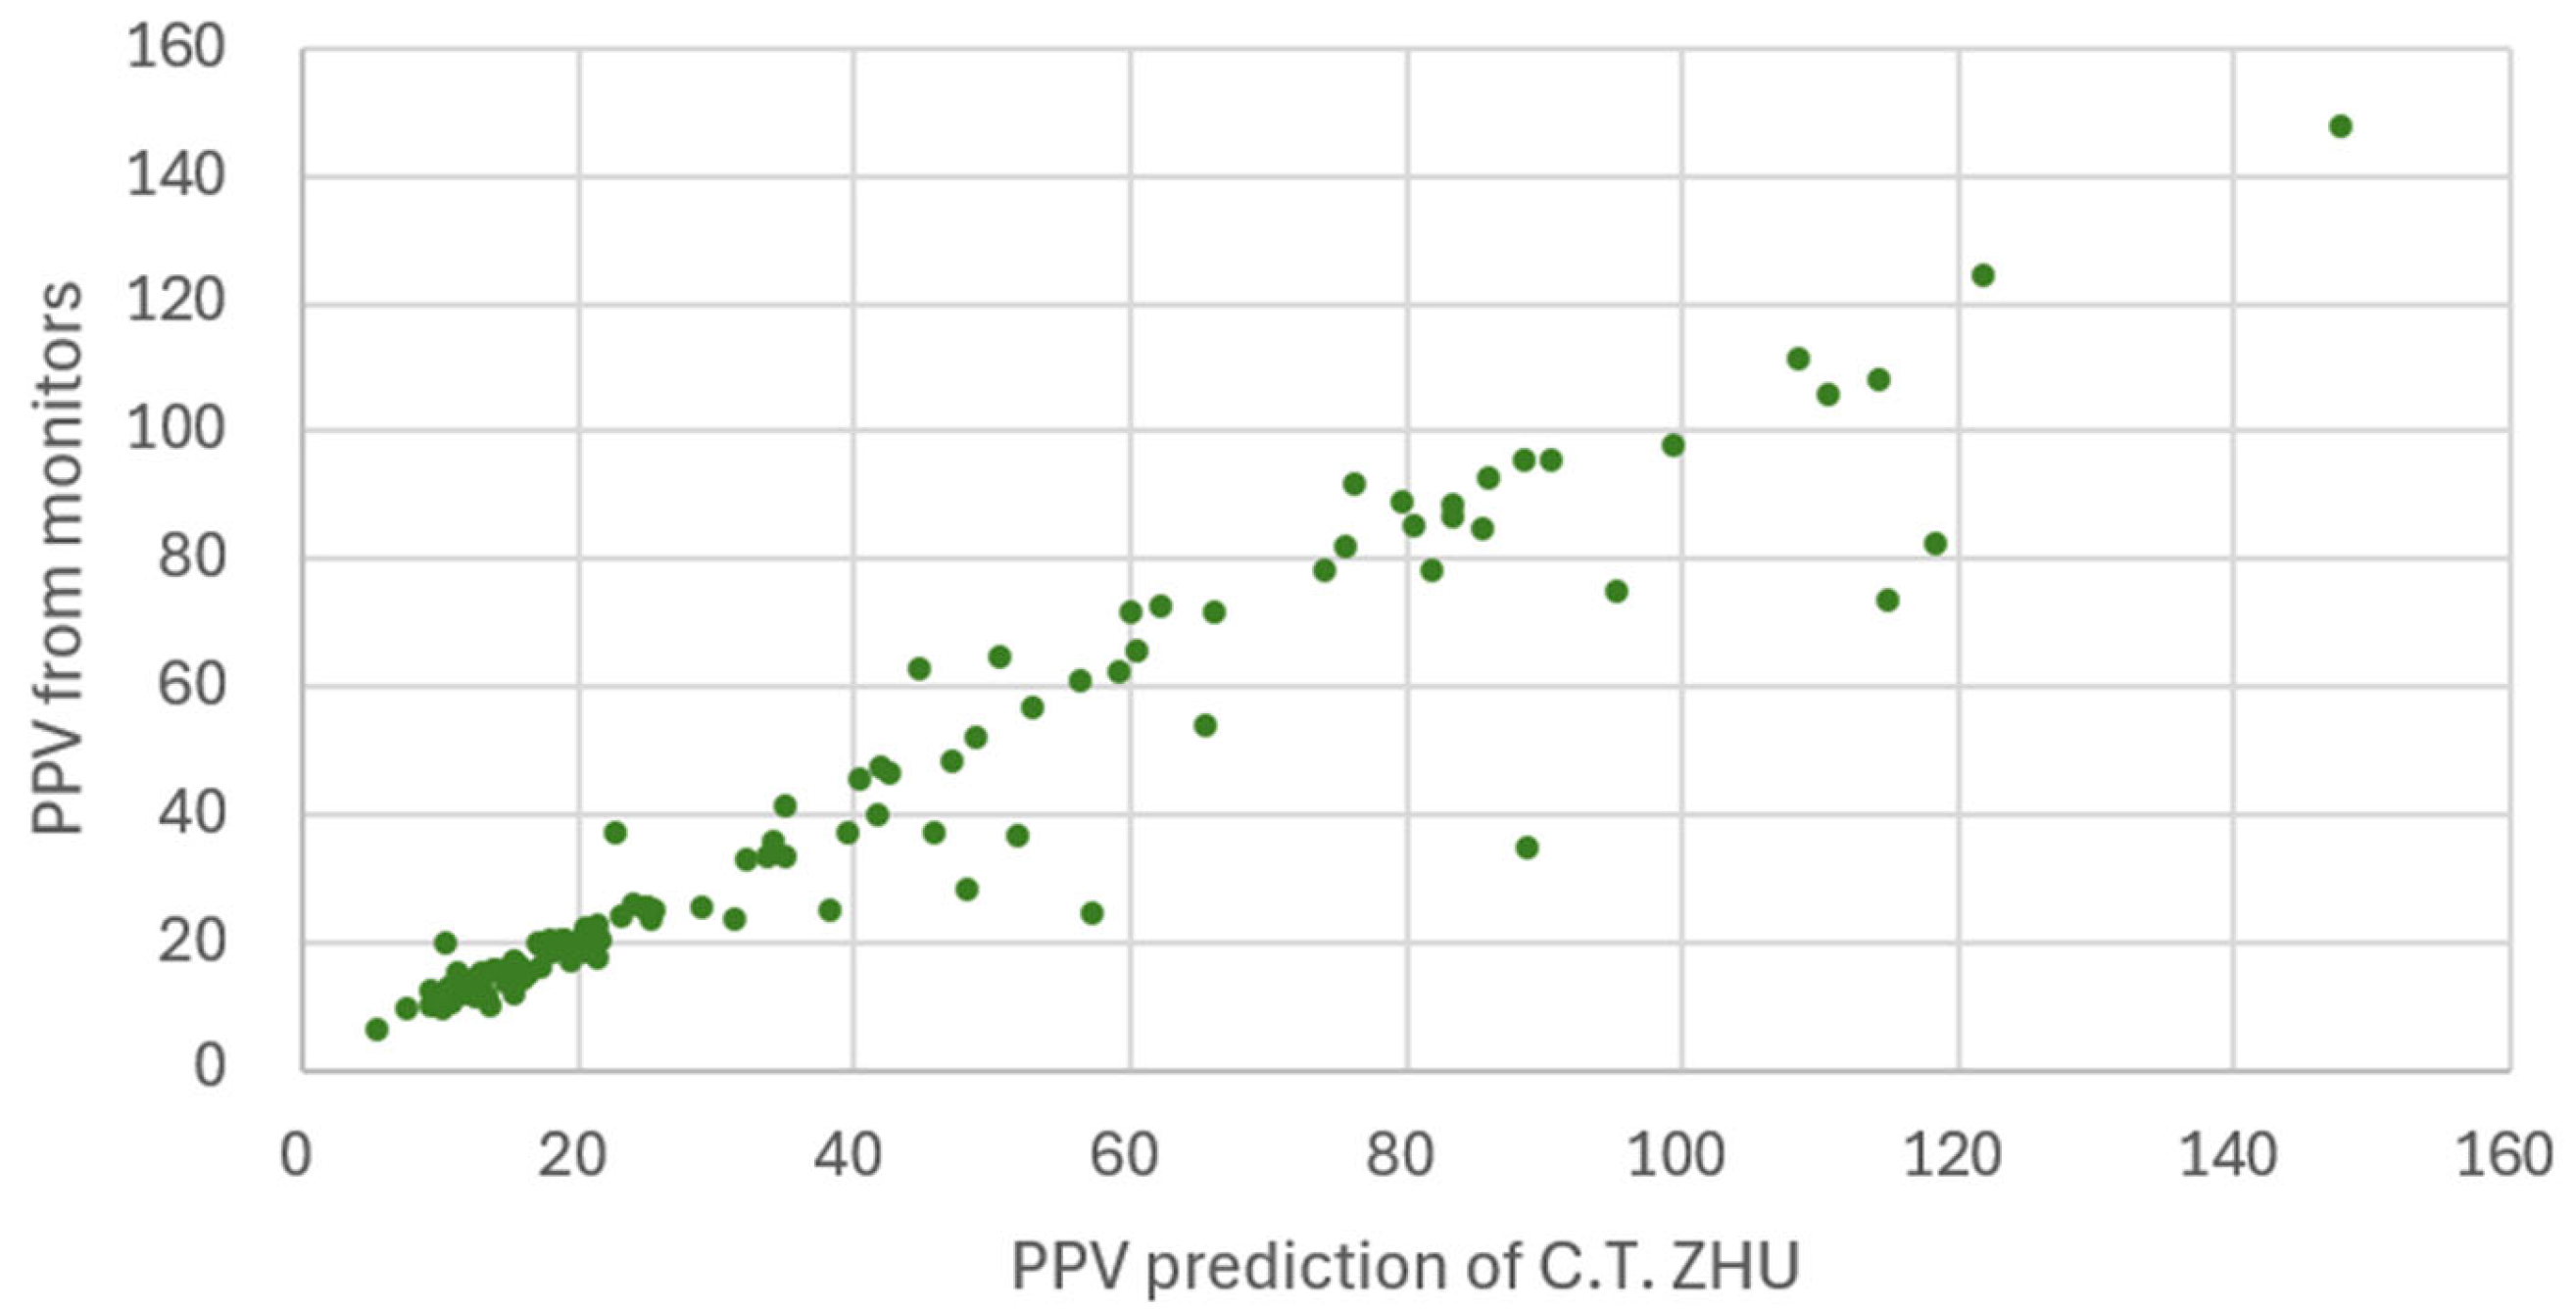
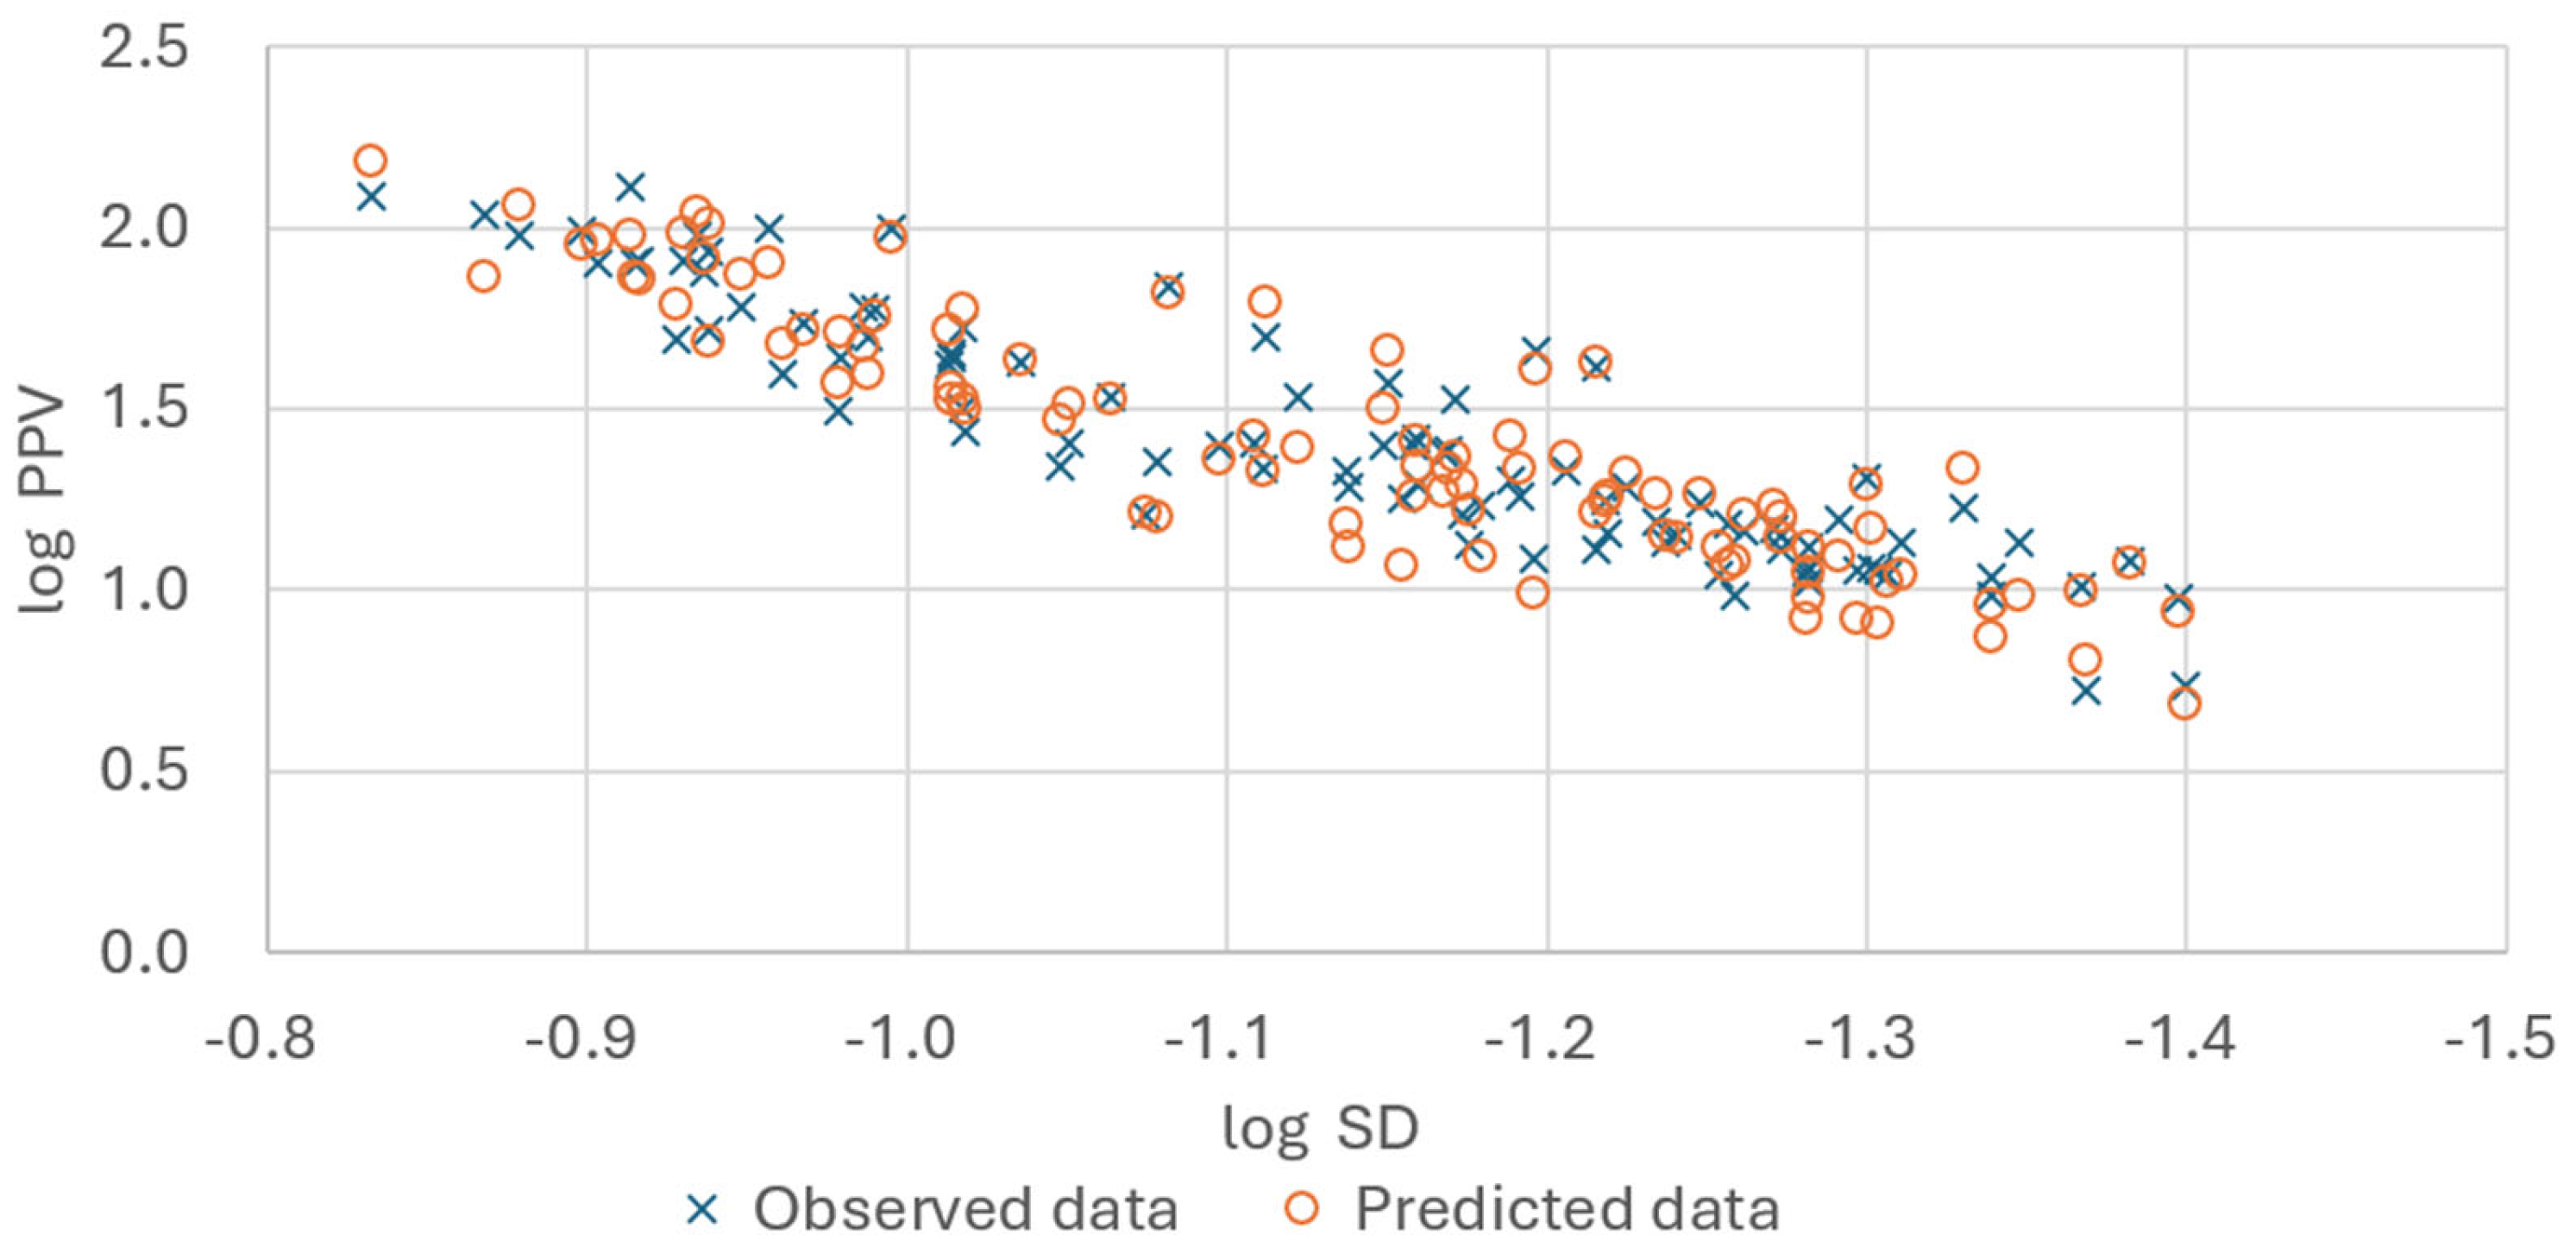
As shown in Table 4, when the C.T.ZHU equation was used and the elevation modification parameter was included for multiple regression analysis, the R2 value reached 0.89, which is slightly higher than that of the Sadovsky equation. However, its MAE (mean absolute error) was 5.2 mm/s and RMSE (root mean squared error) was 10.8. Compared to USBM and Sadovsky equations that do not consider elevation parameters, the error was significantly improved. The reason why the RMSE is higher than the MAE is due to some extreme values having large residuals. The predicted PPV values of C.T.ZHU and the actual measured values are shown in Figure 7.
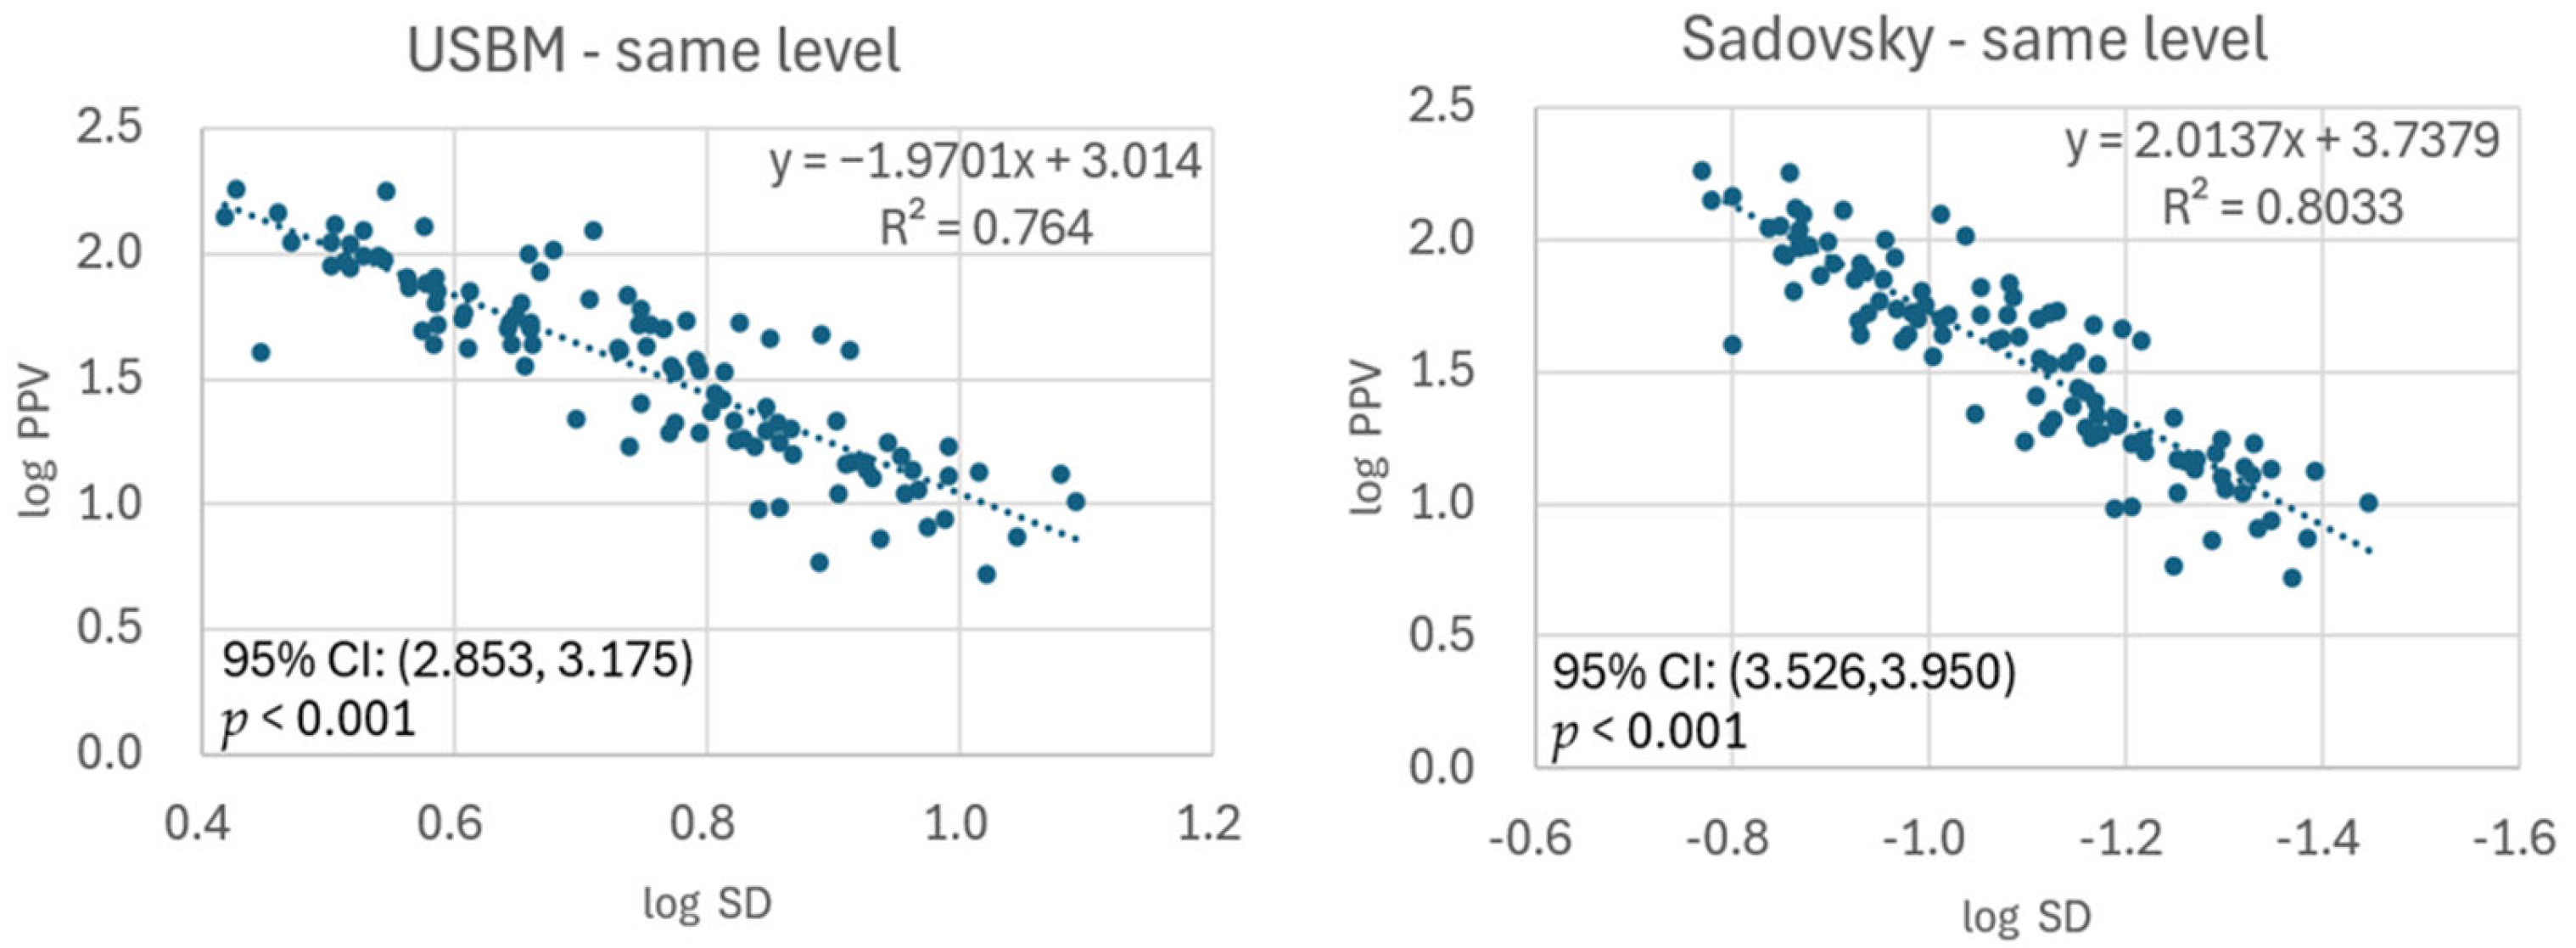
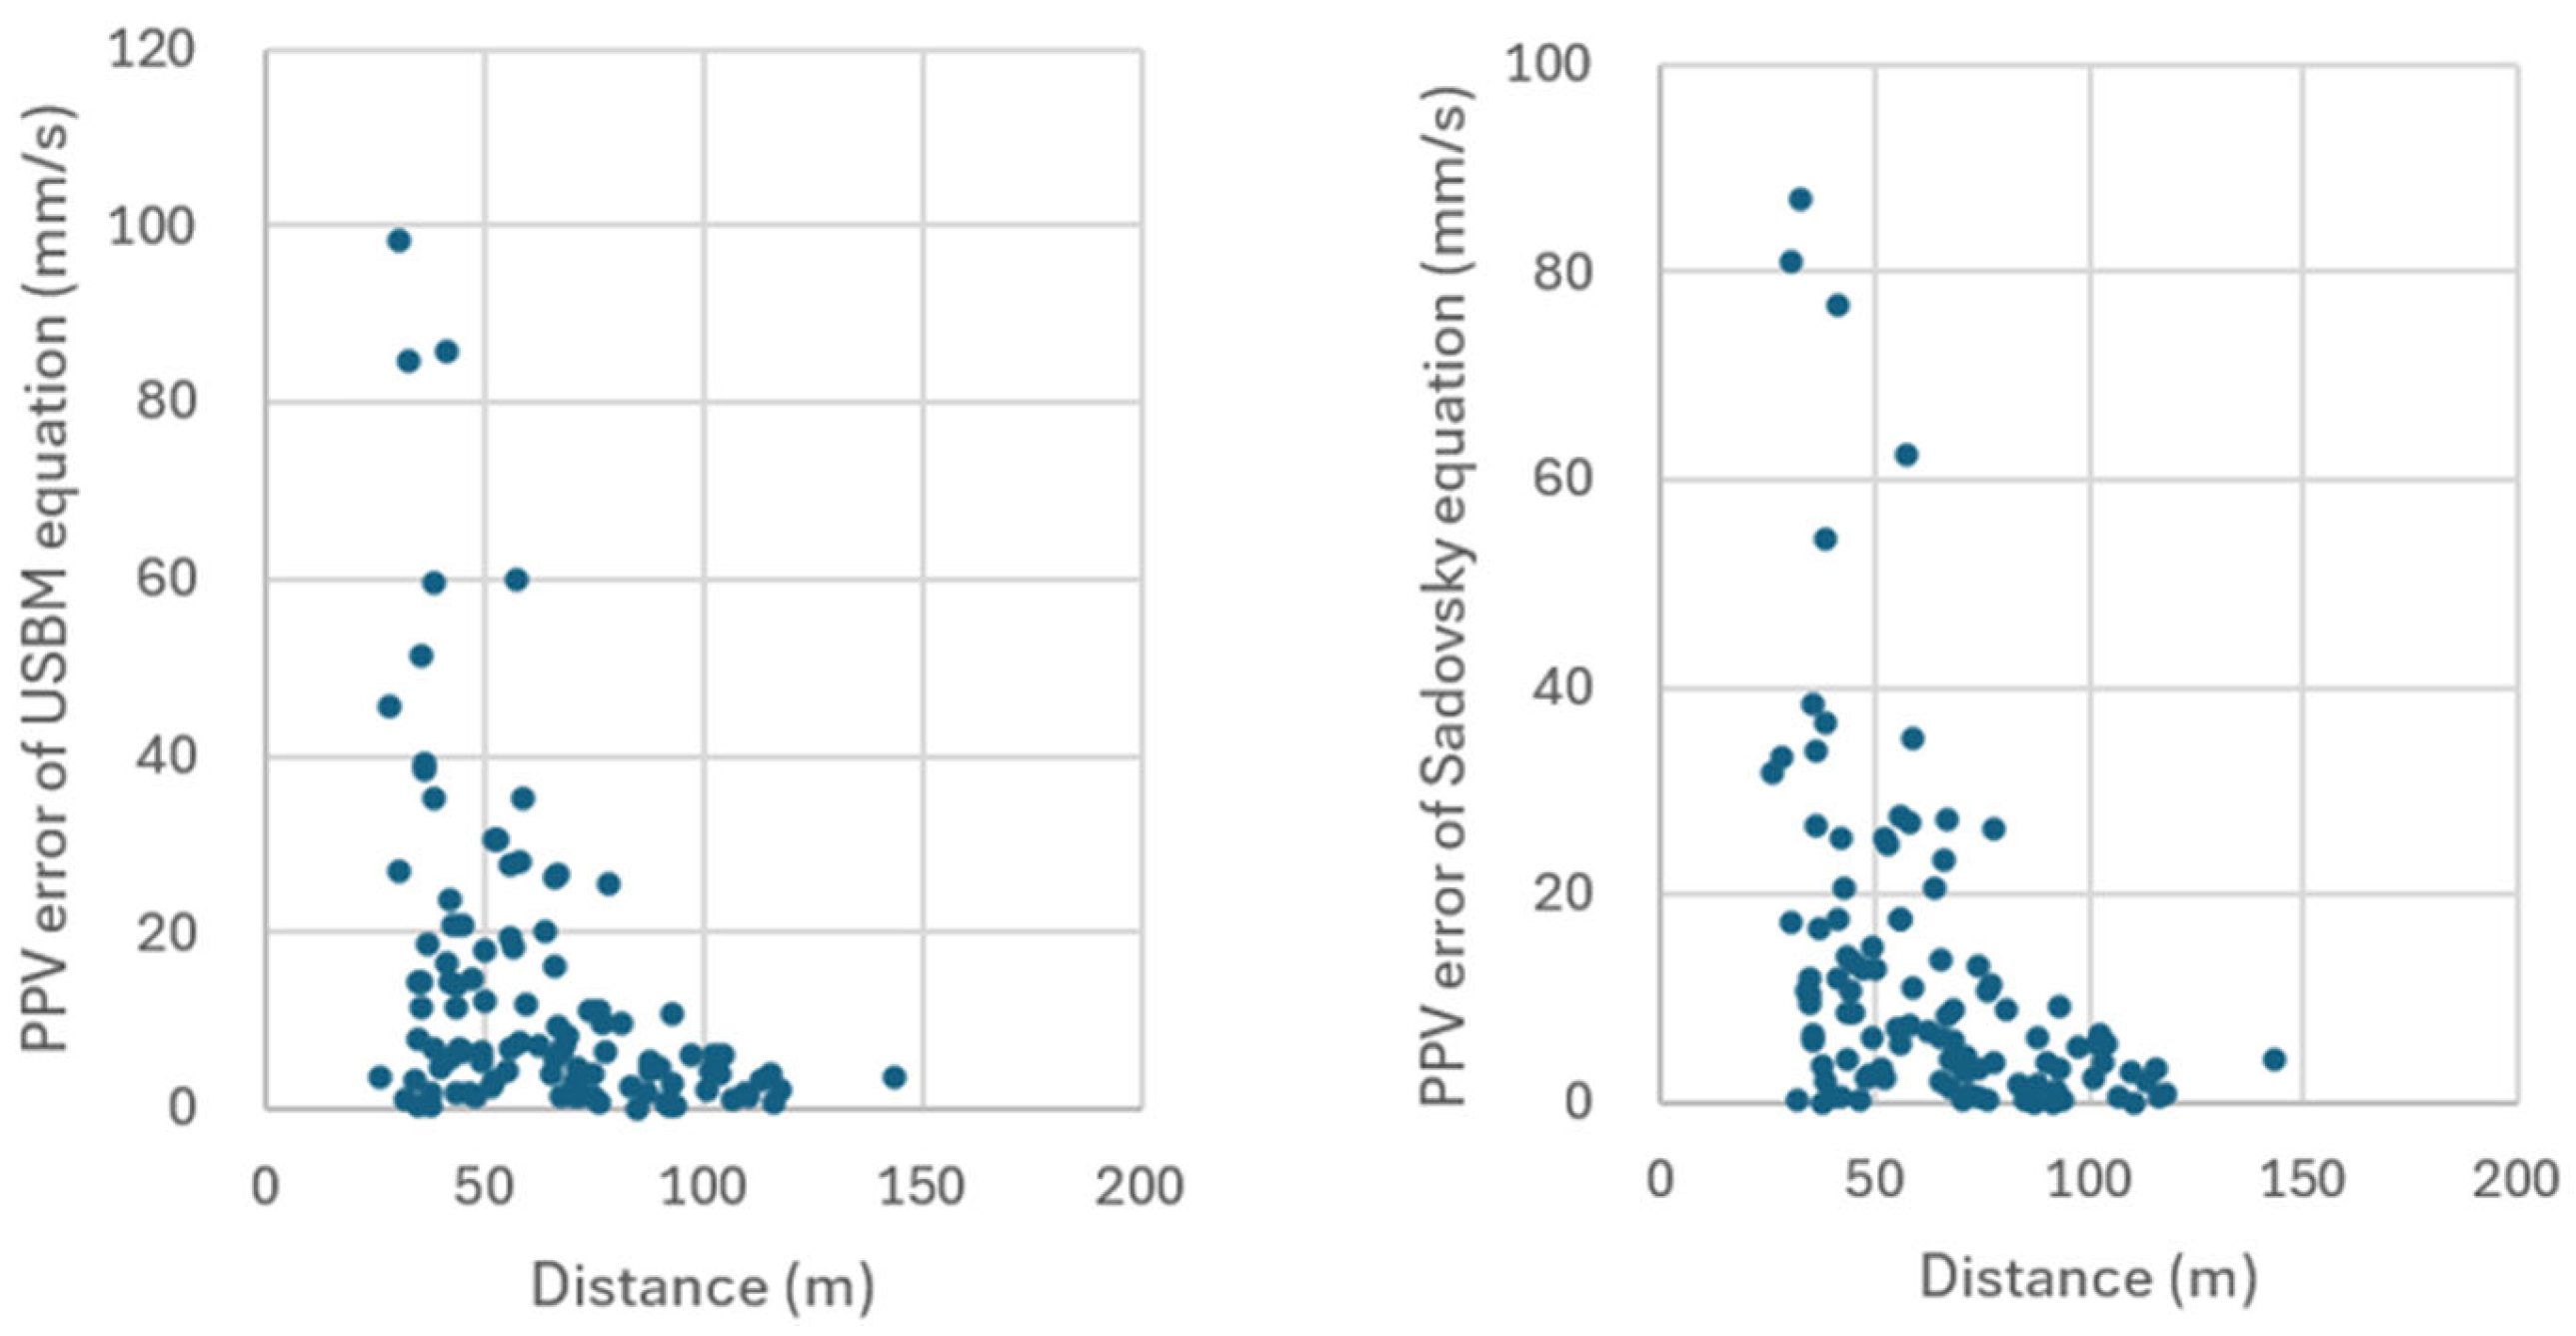
Under the condition where measurements are taken at the same elevation, the C.T.ZHU equation cannot be applied. The results of regression analysis using the selected data from the same level are shown in Figure 8 and Table 5. At the same elevation, both the USBM and Sadovsky equations showed a decrease in R2 values (0.764 and 0.8033 respectively), and within each SD interval, the error distribution was relatively scattered. However, when further analyzing the distribution of error values with distance, it was found that larger prediction errors tended to occur at shorter distances (<60 m) from the vibration source, as shown in Figure 9. It indicates the PPV prediction errors increase when the monitors are set in a short distance when applying the USBM and Sadovsky equations.
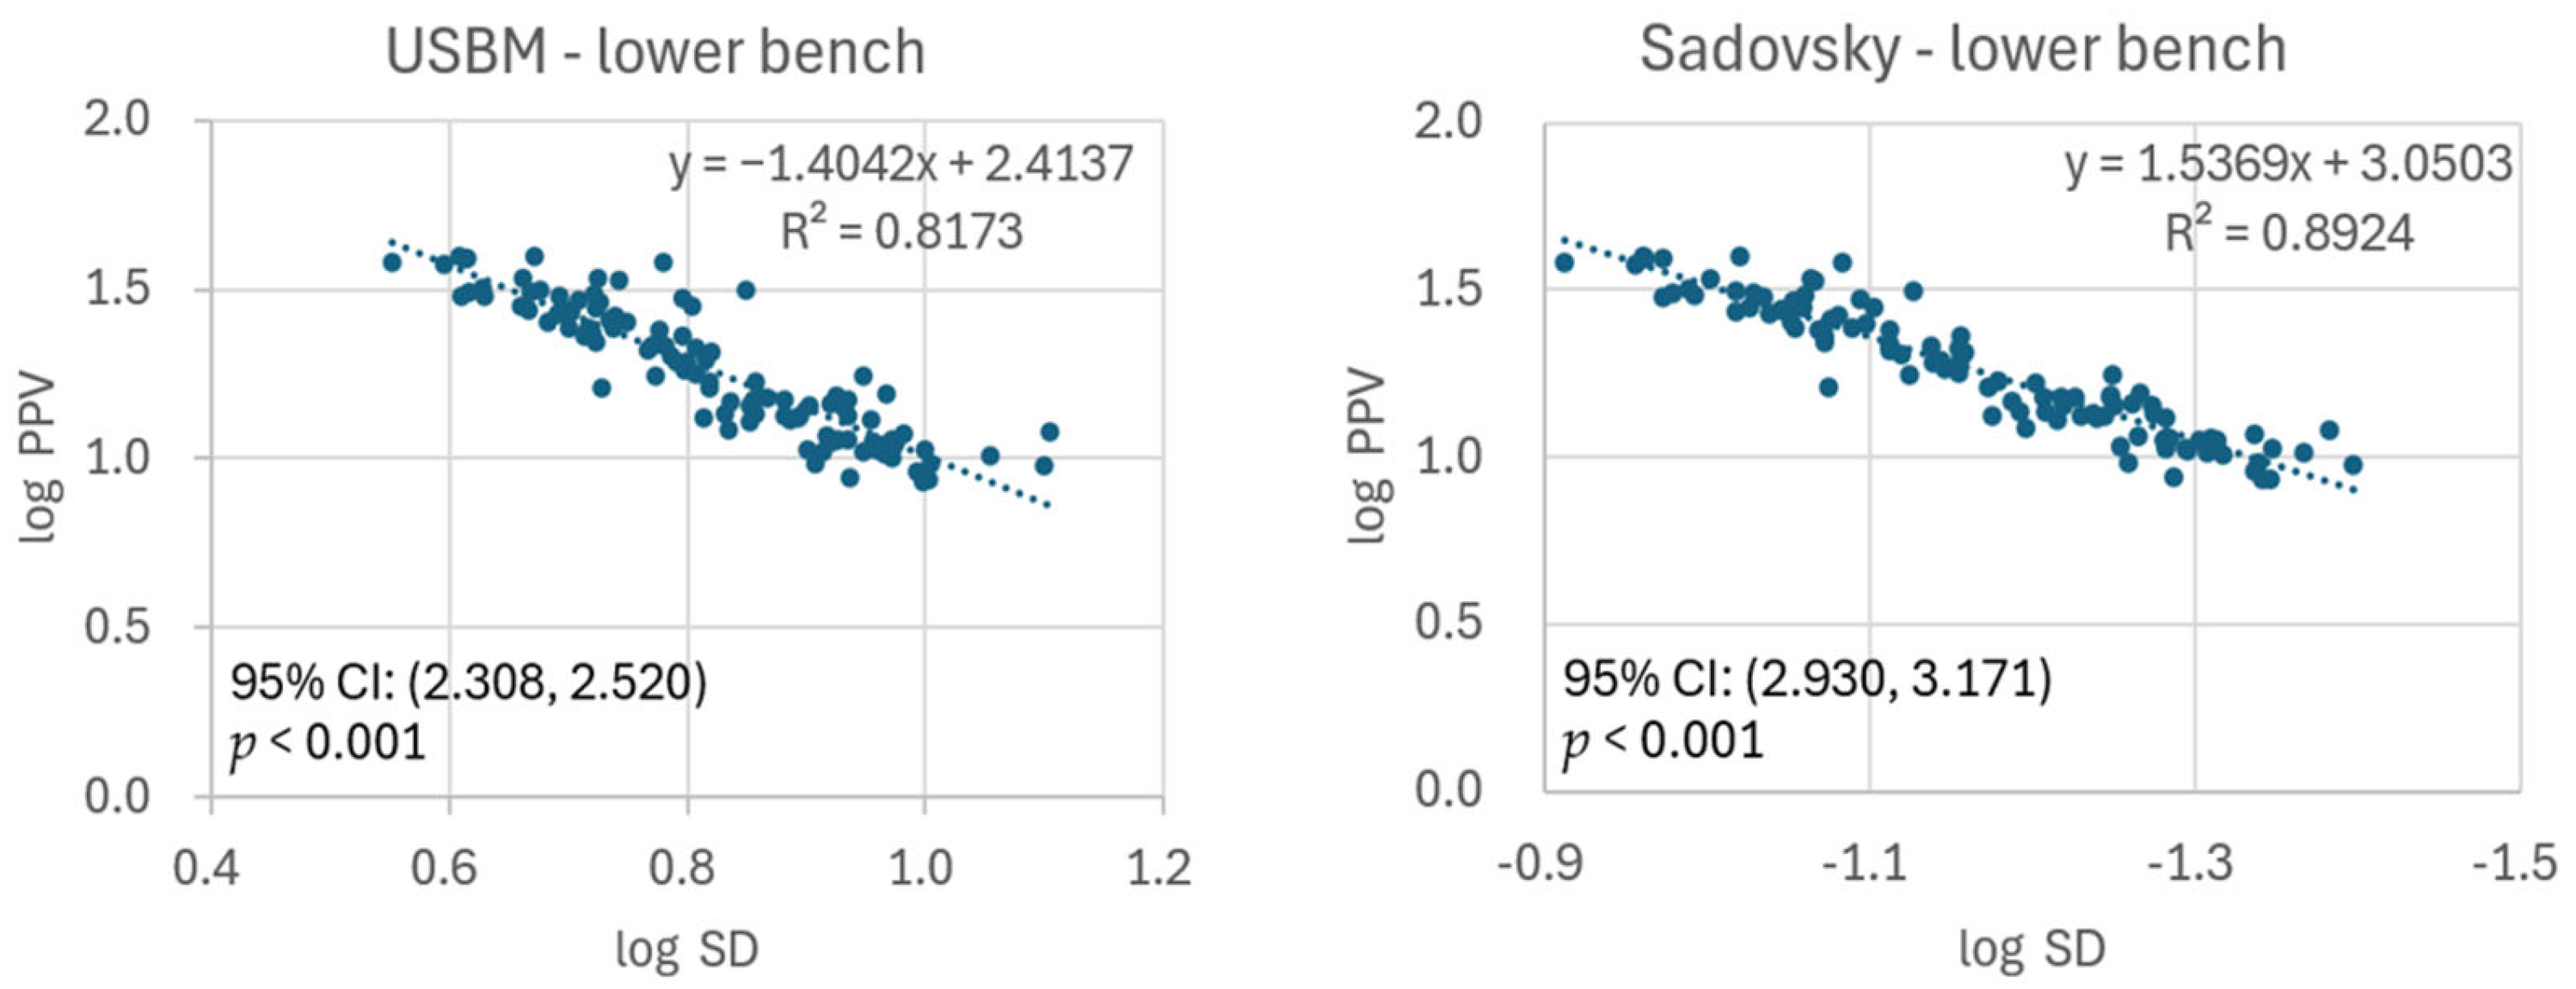
For the lower bench, regression analysis was first conducted using the USBM and Sadovsky equations, as shown in Figure 10. Similarly, the Sadovsky equation yields a better R2 value (0.8924) compared to the USBM equation’s R2 value (0.8173). As with previous findings, both equations tend to exhibit higher error values at shorter distances.
Similarly, incorporating the elevation parameter into the C.T.ZHU equation for regression analysis yields a higher R2 value (0.926) compared to the Sadovsky and USBM equations that do not consider the elevation parameter (0.892 and 0.817, respectively). Additionally, the error values for the MAE and RMSE are also reduced (as shown in Table 6). This indicates that by including the elevation parameter in the empirical equations, the predicted PPV values more closely match the actual onsite measurements.
To statistically examine whether there were significant differences among the models, paired t-tests were applied to the MAE of the three empirical equations, as shown in Table 7. The results indicate that the differences between those models were highly significant (p < 0.001), with the only exception being the paired t-test for the USBM–Sadovsky model at the same level, which yielded a p-value of 0.029. However, this value is still less than 0.05 and thus indicates a statistically significant difference.
Overall, under bench elevation differences, the C.T.ZHU equation [18] consistently provided the highest R2 (≈0.890–0.926), followed by the Sadovsky equation of R2 (≈0.803–0.892), whereas the USBM equation resulted in the lowest R2 (≈0.760–0.818).
This outcome is attributed to the explicit inclusion of an elevation correction in the C.T.ZHU equation, which more accurately captures the influence of bench geometry on vibration wave propagation. For relatively flat terrain, the Sadovsky equation is recommended because of its higher R2 compared with the USBM.

3.3. ANN Prediction and Comparison

For ANN analysis, all input variables—Q, R, H, and Qtotal (total charge per blast)—were normalized prior to model training. Prior to conducting the regression analysis, a Variance Inflation Factor (VIF) assessment was performed to evaluate potential multicollinearity between the independent variables. Firstly, the relationship between Qtotal and Q was examined, yielding an R2 of 0.0231 and a VIF of 1.024. Next, Qtotal was analyzed together with all independent variables, resulting in an R2 of 0.084 and a VIF of 1.091. Taken together, these values indicate that the independent variables are essentially uncorrelated and that multicollinearity is not a concern in this study.
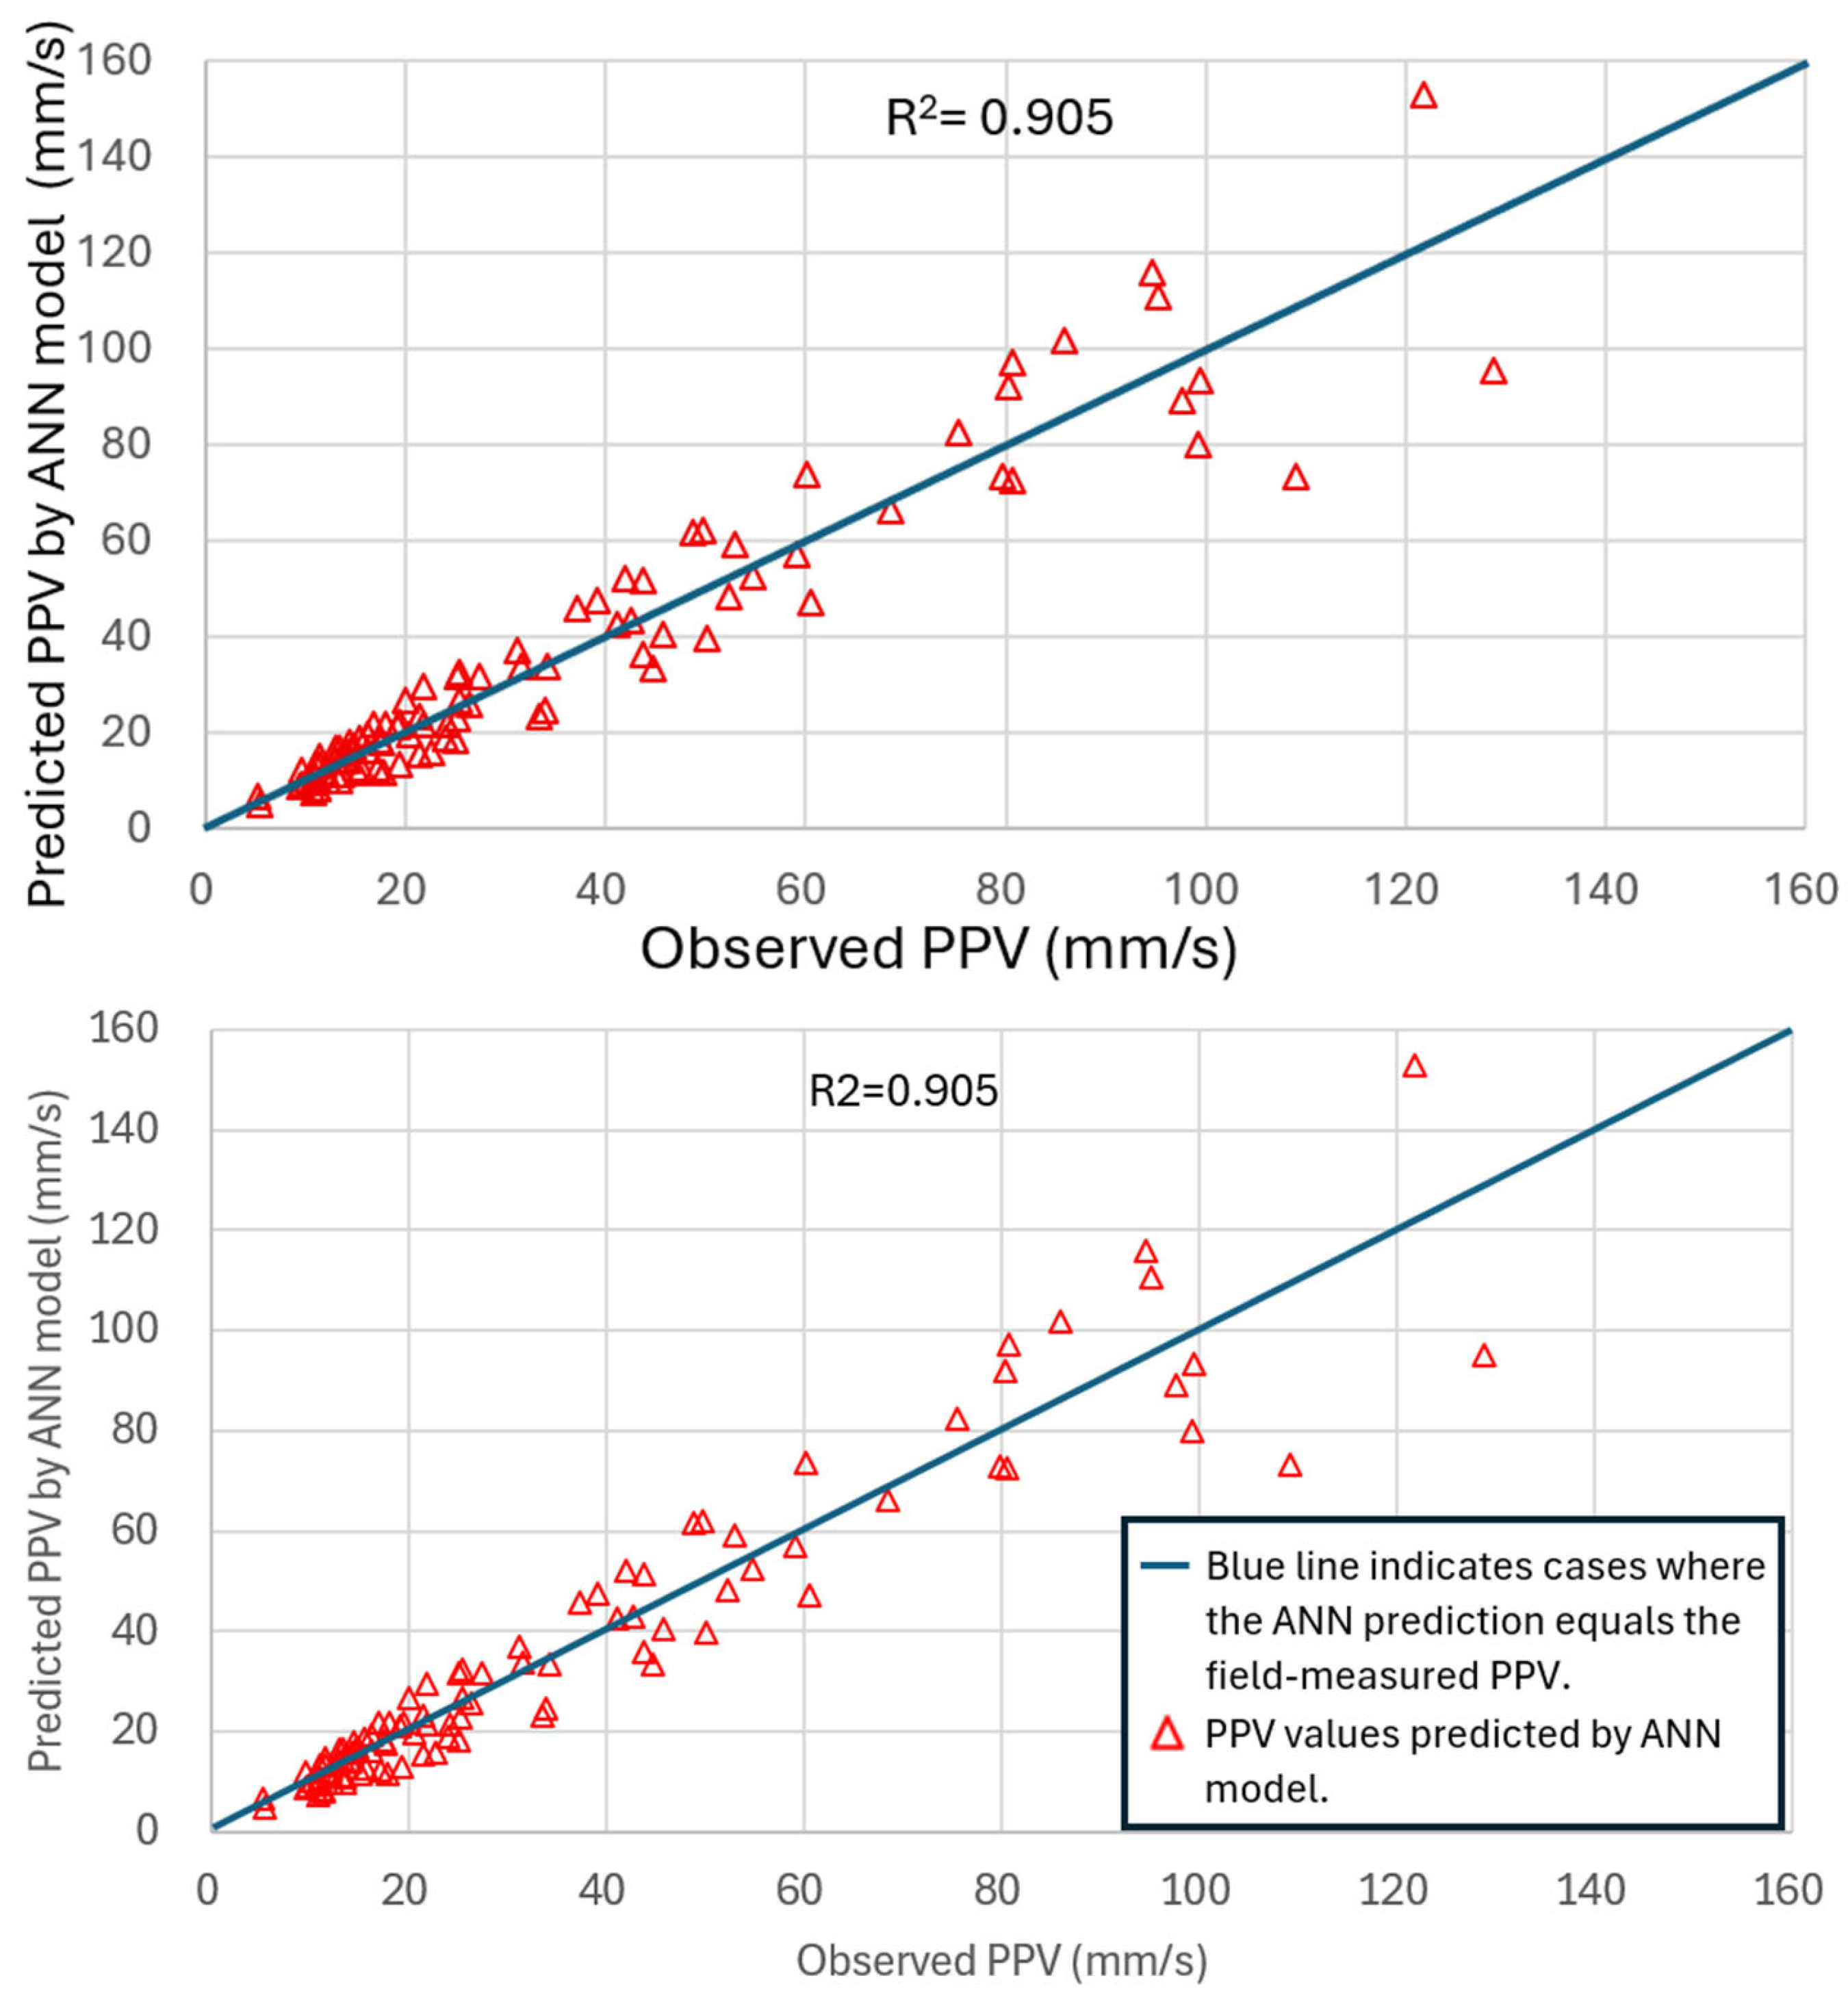
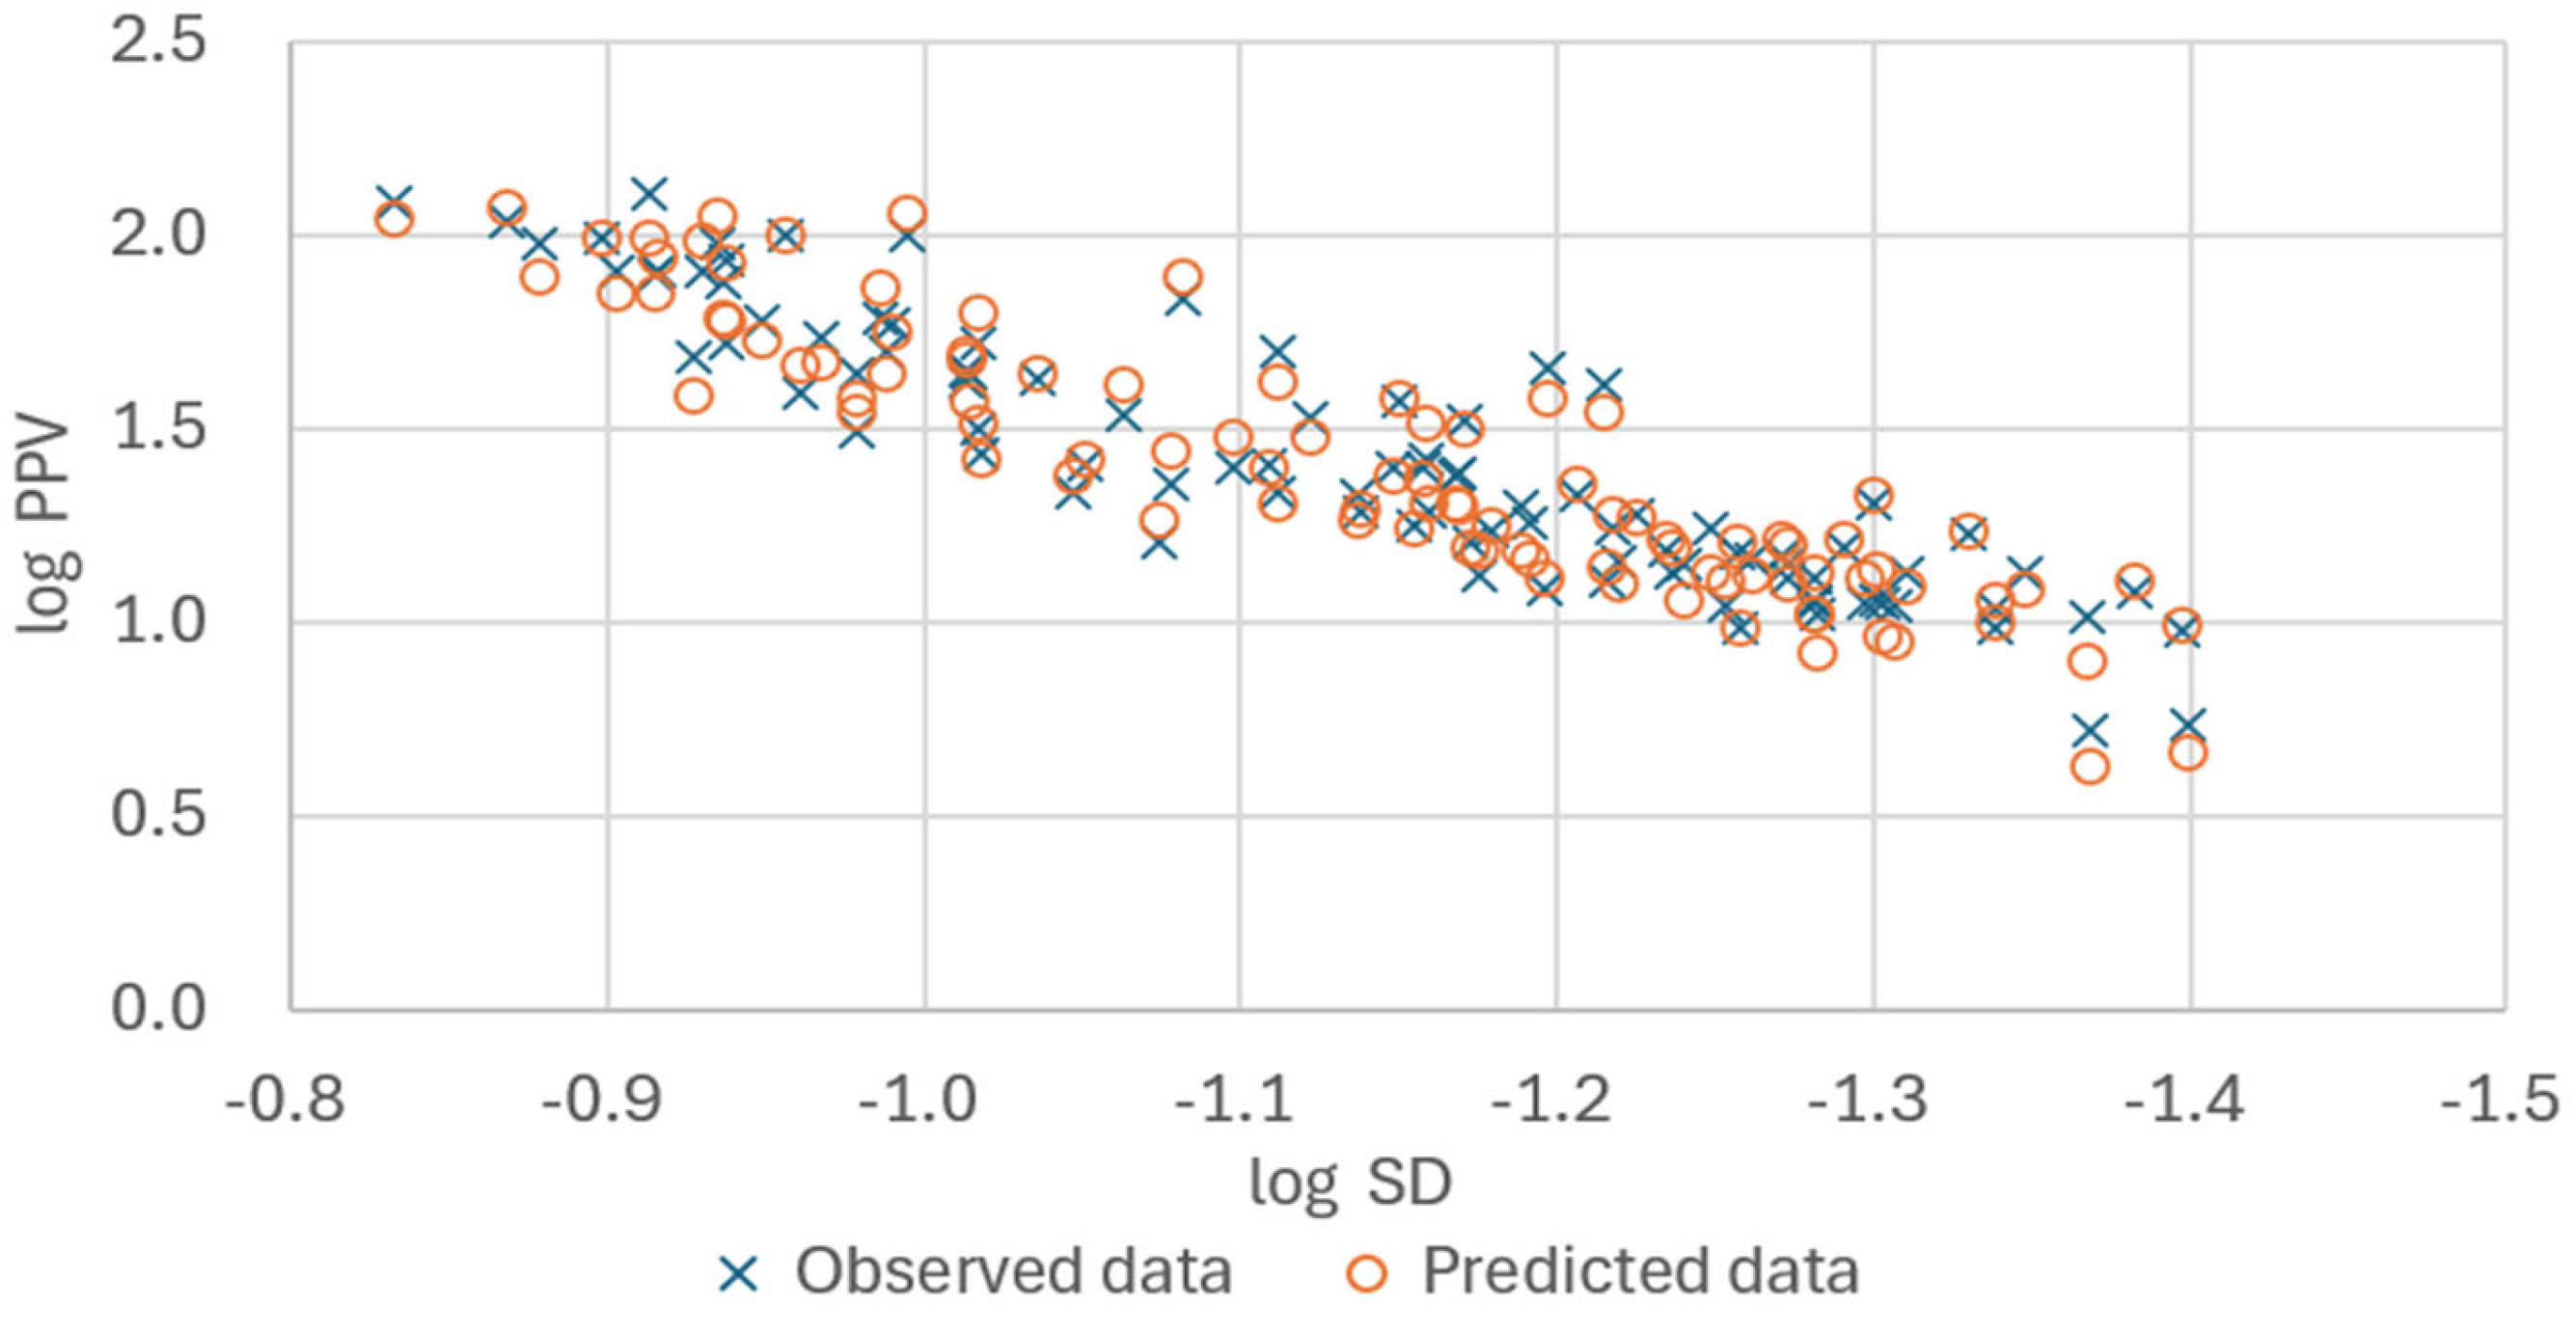
The initial ANN model, which utilized three input features (Q, R, and H), produced the results summarized in Figure 11 and Figure 12. This configuration achieved a coefficient of determination (R2) of about 0.905 on the validation dataset. The distribution of the predicted PPV values demonstrates that the ANN model offers superior predictive reliability compared to the USBM and Sadovsky equations.
By including total charge Q_“total” as the fourth input variable, a comparison of the predicted results from the trained model and the actual measured values is shown in Figure 13 and Figure 14. The ANN’s predictive capability was further enhanced, with the validation R2 increasing from 0.905 to 0.951. The MAE and RMSE errors also decreased to 4.14 mm/s and 6.4 mm/s respectively. This finding indicates that total charge is a critical factor affecting PPV in the studied quarry, particularly because the use of non-electric detonators can result in greater delay variability and a higher likelihood of multiple holes firing nearly simultaneously as both the number of boreholes and total charge rise. The R2 values and error values for each empirical equation and ANN prediction are summarized in Table 8.
To determine whether the prediction errors of the ANN differed significantly from those of the other empirical formula methods, the MAE values were analyzed using paired t-tests, as shown in Table 9. The results show that the paired test p-values for the ANN-4 input neurons model versus the traditional empirical formulas were all less than 0.001, while the p-values for the ANN-3 input neurons model were slightly higher but still below 0.05, indicating that the prediction errors of the models differ significantly.
Compared to empirical equations, predictions based on ANN learning deliver relatively higher R2 values and lower errors overall. Although, for the lower bench, ANN predictions may sometimes show a higher error than empirical formulas, the MAE and RMSE values remain within an acceptable range. Notably, after including the total charge (Qtotal) as an input parameter, the prediction results more closely match the actual measured values.
Furthermore, the application of an ANN allows flexibility to add or modify the input and output parameters according to research needs or site conditions. For example, input neurons can be expanded to include geological factors such as rock mass type or uniaxial strength or blasting design parameters like delay time and drilling angle. The vibration frequency can also be set up as an output neuron as well. This provides a robust approach for handling complex, nonlinear vibration prediction problems.
In summary, elevation differences significantly impact the propagation of blast-induced vibrations. The C.T.ZHU empirical equation, which incorporates elevation as a factor, enables more accurate PPV predictions. Compared to empirical methods, ANN models not only provide more reliable and lower error predictions for blasting vibrations, but also offer greater flexibility to adjust the input and output parameters, allowing predictions to vary rock types or blasting techniques.

4. Discussion

This study compared commonly used empirical vibration attenuation equations and ANN models for predicting blast-induced PPV in a bench blasting quarry with notable elevation differences. The comparative analysis revealed several important findings.
Based on 54 monitored blasts and 322 PPV records under bench elevation differences, the C.T.ZHU empirical equation achieved the highest R 2 (0.890–0.926), followed by the Sadovsky equation (0.803–0.892), whereas the USBM equation exhibited the lowest R 2 (0.760–0.818). The superior statistical performance of the C.T.ZHU equation is attributed to its elevation correction, which better reflects the influence of terrain variation on vibration wave propagation. However, the comparison between the C.T.ZHU formula and the USBM and Sadovsky equations does not represent an equivalent assessment of model complexity. The main implication of the results indicates that topographic and elevation effects are significant for this site and should be considered explicitly in blast vibration prediction, rather than suggesting that the C.T.ZHU equation is universally superior.
The ANN model trained with maximum instantaneous charge Q, distance R, and elevation difference H as inputs yielded a validation R 2 of 0.905. When total charge per blast Qtotal was included as an additional input, the validation R 2 increased to 0.951. This indicates that total charge also significantly affects PPV. This effect is likely related to the use of non-electric detonators at the site. The limited accuracy of non-electric detonators increases the probability of unintentional simultaneous firing when a blast involves more holes and a larger total charge.
The study also highlights the limitations associated with model transferability. Both the empirical relationships and the ANN model were parameters, and the superior performance of the models should be regarded as site-specific rather than universally applicable. The trained ANN weights or the relative ranking of empirical equations should not be directly transferred to other quarries without recalibration using local monitoring data. Additionally, complex design parameters in blasting operations—such as detailed delay time, detonator delay accuracy, borehole pattern, drilling angle control, and subdrilling—were not considered in this model and may contribute to scattering in the vibration data.
The current neural network was evaluated using only a 70/30 train/validation split. This may lead to an optimistically biased estimate of performance, and more extensive resampling-based validation (e.g., repeated k-fold cross-validation or bootstrap validation) would be preferable in future work. Future studies could also systematically investigate the influence of the number of neurons and layers in the hidden layer on model performance, extend ANN training and empirical equation calibration to multiple quarry sites with diverse geological and operational conditions, and explore vibration frequency as an additional output variable, given its importance to building response.

5. Conclusions

This study demonstrates that both elevation-aware empirical equations and appropriately configured ANN models are effective tools for predicting blast-induced PPV in bench blasting with elevation differences. The C.T.ZHU equation performs best among empirical models due to its incorporation of elevation correction, emphasizing the importance of topographic effects in vibration prediction.
Furthermore, incorporating total charge into ANN models can substantially enhance predictive accuracy under non-electric initiation conditions. Despite being site-specific, the findings provide useful insights for improving PPV prediction practices in quarries with varying elevations. Future research should focus on model generalization through multi-site data calibration and advanced validation techniques.

Author Contributions

Conceptualization, C.-H.W. and Y.-C.D.; methodology, C.-H.W. and W.-Y.S.; software, W.-Y.S.; validation, C.-H.W.; formal analysis, C.-H.W. and Y.-C.D.; investigation, W.-Y.S.; resources, Y.-C.D.; data curation, W.-Y.S.; writing—original draft preparation, C.-H.W.; writing—review and editing, Y.-C.D.; visualization, W.-Y.S.; supervision, Y.-C.D.; project administration, C.-H.W.; funding acquisition, C.-H.W. All authors have read and agreed to the published version of the manuscript.

Funding

This research received no external funding.

Data Availability Statement

The data presented in this study are available on reasonable request from the corresponding author but are not publicly available due to restrictions from the quarry operator.

Conflicts of Interest

Author Wei-Yuan Su was employed by the company Fortune Construction Co., Ltd. The remaining authors declare that the research was conducted in the absence of any commercial or financial relationships that could be construed as a potential conflict of interest.

References

  1. Nicholls, H.R.; Johnson, C.F.; Duvall, W.I. Blasting Vibrations and Their Effects on Structures (U.S. Bureau of Mines Bulletin 656); Department of the Interior, Bureau of Mines: Washington, DC, USA, 1971.
  2. Sadovsky, M.A. The seismic effect of explosions. In Proceedings of the All-Union Conference on Explosives; Gostoptekhizdat: Moscow, Russia, 1940; pp. 290–319. [Google Scholar]
  3. Zhu, C.T.; Liu, H.G. Selection of formula on propagation of the parameters of explosive seismic wave along slope. Blasting 1999, 16, 30–34. [Google Scholar]
  4. Zorzal, C.B.; Nogueira, C.L.; Lima, H.M. Blast-induced ground vibrations: A dynamic analysis by FEM. Res. Soc. Dev. 2022, 11, e354211329628. [Google Scholar] [CrossRef]
  5. Tarumasely, N.H.; Wardana, N.K.; Prastowo, R. Analysis of Ground Vibration Levels Due to the Blasting Process at PT. Bumi Suksesindo. J. Geocelebes 2024, 8, 51–61. [Google Scholar] [CrossRef]
  6. Dehghani, H.; Ataee-pour, M.; Ramazanzadeh, A. Development of a model to predict peak particle velocity in a blasting operation. Int. J. Rock Mech. Min. Sci. 2011, 48, 51–58. [Google Scholar] [CrossRef]
  7. He, B.; Lai, S.H.; Mohammed, A.S.; Sabri, M.M.S.; Ulrikh, D.V. Estimation of Blast-Induced Peak Particle Velocity through the Improved Weighted Random Forest Technique. Appl. Sci. 2022, 12, 5019. [Google Scholar] [CrossRef]
  8. Siskind, D.E.; Stagg, M.S.; Kopp, J.W.; Dowding, C.H. Structure Response and Damage Produced by Ground Vibration from Surface Mine Blasting; Report of Investigations RI 8507; U.S. Department of the Interior, Bureau of Mines: Washington, DC, USA, 1980.
  9. Mesec, J.; Kovačević, M.S.; Soldo, B. Estimation of particle velocity based on blast event measurements at different rock units. Soil Dyn. Earthq. Eng. 2010, 30, 1004–1009. [Google Scholar] [CrossRef]
  10. Agrawal, H.; Mishra, A.K. Modified scaled distance regression analysis approach for prediction of blast-induced ground vibration in multi-hole blasting. J. Rock Mech. Geotech. Eng. 2019, 11, 202–207. [Google Scholar] [CrossRef]
  11. Elseman, I.A.R. Measurement and analysis of the effect of ground vibrations induced by blasting at the limestone quarries of the Egyptian Cement Company. In Proceedings of the ICEHM 2000—International Conference on Explosive Hazards and Mining Mechanics; Cairo University: Giza, Egypt, 2000; pp. 54–71. [Google Scholar]
  12. Liu, C.; Wang, F.; Ren, Q.; Chen, B.; Jin, H.; Cui, S.; Zhu, Z. Field test of blasting vibration and adjacent slope stability under the influence of blasting vibration in mining. J. Vibroengineering 2023, 25, 713–728. [Google Scholar] [CrossRef]
  13. Yan, B.; Liu, M.; Meng, Q.; Li, Y.; Deng, S.; Liu, T. Study on the Vibration Variation of Rock Slope Based on Numerical Simulation and Fitting Analysis. Appl. Sci. 2022, 12, 4208. [Google Scholar] [CrossRef]
  14. Sayadi, A.; Monjezi, M.; Talebi, N.; Khandelwal, M. A comparative study on the application of various artificial neural networks to simultaneous prediction of rock fragmentation and backbreak. J. Rock Mech. Geotech. Eng. 2013, 5, 318–324. [Google Scholar] [CrossRef]
  15. Bakhshandeh Amnieh, H.; Bahadori, M. Safe vibrations of spilling basin explosions at “Gotvand Olya Dam” using artificial neural network. Arch. Min. Sci. 2014, 59, 1087–1096. [Google Scholar] [CrossRef]
  16. Trivedi, R.; Singh, T.N.; Raina, A.K. Prediction of blast-induced flyrock in Indian limestone mines using neural networks. J. Rock Mech. Geotech. Eng. 2014, 6, 447–454. [Google Scholar] [CrossRef]
  17. Saadat, M.; Khandelwal, M.; Monjezi, M. An ANN-based approach to predict blast-induced ground vibration of Gol-E-Gohar iron ore mine, Iran. J. Rock Mech. Geotech. Eng. 2014, 6, 67–76. [Google Scholar] [CrossRef]
  18. Fang, C.; Huang, Q.; Xu, J.; Cheng, R.; Chen, L.; Li, R.; Wang, C.; Zhang, L. A Measurement Method of Microsphere with Dual Scanning Probes. Appl. Sci. 2019, 9, 1598. [Google Scholar] [CrossRef]
  19. Hosseini, S.; Pourmirzaee, R.; Armaghani, D.J.; Sabri Sabri, M.M. Prediction of Ground Vibration Due to Mine Blasting Using Ensemble Machine Learning Models. Sci. Rep. 2023, 13, 6591. [Google Scholar] [CrossRef]
  20. Khandelwal, M.; Singh, T.N. Prediction of blast induced air overpressure in opencast mine. Noise Vib. Worldw. 2005, 36, 7–16. [Google Scholar] [CrossRef]
  21. Tawadrous, A.S. Evaluation of artificial neural networks as a reliable tool in blast design. In Proceedings of the 32nd Annual Conference on Explosives and Blasting Technique; International Society of Explosives Engineers (ISEE): Cleveland, OH, USA, 2006; Volume 1, pp. 1–12. [Google Scholar]
  22. Silva, J.; Li, L.; Gernand, J.M. Reliability analysis for mine blast performance based on delay type and firing time. Int. J. Min. Sci. Technol. 2018, 28, 195–204. [Google Scholar] [CrossRef]
  23. Kumar, A.; Gulati, V. Experimental investigation and optimization of surface roughness in negative incremental forming. Measurement 2019, 131, 419–430. [Google Scholar] [CrossRef]
  24. Das, A.; Sinha, S.; Ganguly, S. Development of a blast-induced vibration prediction model using an artificial neural network. J. S. Afr. Inst. Min. Met. 2019, 119, 187–200. [Google Scholar] [CrossRef]
  25. Lawal, A.I.; Idris, M.A. An artificial neural network-based mathematical model for the prediction of blast-induced ground vibrations. Int. J. Environ. Stud. 2019, 77, 318–334. [Google Scholar] [CrossRef]
  26. Lyu, J.; Shi, H.; Zhang, J.; Norvilitis, J. Prediction model for suicide based on back propagation neural network and multilayer perceptron. Front. Neuroinformatics 2022, 16, 961588. [Google Scholar] [CrossRef]
  27. MacKay, D.J.C. Bayesian Interpolation. Neural Comput. 1992, 4, 415–447. [Google Scholar] [CrossRef]
  28. Foresee, F.D.; Hagan, M.T. Gauss–Newton approximation to Bayesian regularization. In Proceedings of the International Conference on Neural Networks (ICNN’97), Houston, TX, USA, 12 June 1997; pp. 1930–1935. [Google Scholar]
Figure 1. Site blasting design schematic diagram.
Applsci 16 03556 g001
Figure 2. Schematic diagram of the location of the blast source and vibration monitors.
Applsci 16 03556 g002
Figure 3. An example of the recorded blasting vibration waveform.
Applsci 16 03556 g003
Figure 4. Artificial neural network structure.
Applsci 16 03556 g004
Figure 5. Results of linear regression of field measurement data using the USBM and Sadovsky equations (all data).
Applsci 16 03556 g005
Figure 6. Results of linear regression of field measurement data using the USBM and Sadovsky equations (upper bench).
Applsci 16 03556 g006
Figure 7. Comparison of PPV values predicted by the C.T.ZHU equation and actual measured values.
Applsci 16 03556 g007
Figure 8. Results of linear regression of field measurement data using the USBM and Sadovsky equations (same-level bench).
Applsci 16 03556 g008
Figure 9. Relationship between PPV prediction errors and distance.
Applsci 16 03556 g009
Figure 10. Results of linear regression of field measurement data using the USBM and Sadovsky equations (lower bench).
Applsci 16 03556 g010
Figure 11. Scatter diagram of observed data and predicted data from ANN with 3 input neurons.
Applsci 16 03556 g011
Figure 12. Comparison of observed data and predicted data from ANN with 3 input neurons.
Applsci 16 03556 g012
Figure 13. Scatter diagram of observed data and predicted data from ANN with 4 input neurons.
Applsci 16 03556 g013
Figure 14. Comparison of observed data and predicted data from ANN with 4 input neurons.
Applsci 16 03556 g014
Table 1. Blasting pattern of field site.
Borehole Diameter105 mm
Borehole Depth11.0 m
Borehole Angle75°
Spacing4.5 m
Burden2.5 m
Stemming3.0 m
Detonator SystemNon-Electric Detonators
Delay Time25 ms between holes
67 ms between rows
Blasting AgentANFO
Table 2. Field blast vibration measurement records (only two blasts are listed).
No. of BlastTotal Charge
(kg)
Charge Per
Delay
(kg)
PPV
(mm/s)
Distance
(m)
Elevation
(m)
11234.0046.563.0626.21050
1234.0046.547.252.921050
1234.0046.541.76157.331060
1234.0046.515.51888.11060
1234.0046.531.41248.171040
1234.0046.511.96386.771040
21428.0013540.132.451060
1428.0013510.15143.391060
1428.0013560.12145.571070
1428.0013514.38589.141070
1428.0013527.14557.381050
1428.0013516.17476.441050
Table 3. Regression analysis of all data.
Parameters P P V = K ( R Q ) a
(USBM)
P P V = K ( Q 3 R ) a
(Sadovsky)
K941.4565700.330
α−1.9682.062
R20.7600.811
Table 4. Regression analysis for the upper bench.
Parameters P P V = K ( R Q ) a
(USBM)
P P V = K ( Q 3 R ) a
(Sadovsky)
P P V = K ( Q 3 R ) α ( Q 3 H ) β
(C.T.ZHU)
K1521.24811,357.9511775.789
α−2.1562.2732.315
β--−2.608
R20.8180.8810.890
MAE8.9 mm/s7.5 mm/s5.2 mm/s
RMSE15.0 mm/s12.7 mm/s10.8 mm/s
Table 5. Regression analysis for the same-level bench.
Parameters P P V = K ( R Q ) a
(USBM)
P P V = K ( Q 3 R ) a
(Sadovsky)
K1032.7615468.900
α−1.9702.014
R20.7640.803
Table 6. Regression analysis for the lower bench.
Parameters P P V = K ( R Q ) a
(USBM)
P P V = K ( Q 3 R ) a
(Sadovsky)
P P V = K ( Q 3 D ) α ( Q 3 H ) β
(C.T.ZHU)
K259.2391122.794591.109
α−1.4041.5371.674
β--−1.345
R20.8170.8920.926
MAE2.78 mm/s2.24 mm/s1.62 mm/s
RMSE4.09 mm/s3.30 mm/s2.46 mm/s
Table 7. Paired t-test for three empirical equations.
ElevationPaired t-Testt-Valuep-Value
upper benchUSBM–Sadovsky5.729.81 × 10−8
USBM-Z.H.U.−5.032.05 × 10−6
Sadovsky–Z.H.U.−4.688.56 × 10−6
lower benchUSBM–Sadovsky−5.286.77 × 10−7
USBM-Z.H.U.−8.694.54 × 10−14
Sadovsky–Z.H.U.−7.971.88 × 10−12
same levelUSBM–Sadovsky−2.222.87 × 10−2
Table 8. Comparison of empirical equation and ANN prediction reliability and error.
Prediction ModelR2MAE
(mm/s)
RMSE
(mm/s)
USBMAll data0.76010.717.8
Upper bench0.8188.915.0
Same-level0.76413.221.7
Lower bench0.8172.784.09
SadovskyAll data0.8119.616.2
Upper bench0.8817.512.7
Same-level0.80312.420.2
Lower bench0.8922.243.30
C.T.ZHUUpper bench0.8905.210.8
Lower bench0.9261.622.46
ANN3 input neurons (Q, R, H)0.9055.98.9
4 input neurons (Q, R, H, Qtotal)0.9514.146.4
Table 9. Paired t-test ANN and empirical equations.
Paired t-Testt-Valuep-Value
ANN-3 input neuronsANN-4 input neurons3.331.22 × 10−3
USBM3.152.15 × 10−3
Sadovsky2.471.53 × 10−2
Z.H.U.4.766.93 × 10−6
ANN-4 input neuronsUSBM5.062.02 × 10−6
Sadovsky4.679.84 × 10−6
Z.H.U.5.211.08 × 10−6
Disclaimer/Publisher’s Note: The statements, opinions and data contained in all publications are solely those of the individual author(s) and contributor(s) and not of MDPI and/or the editor(s). MDPI and/or the editor(s) disclaim responsibility for any injury to people or property resulting from any ideas, methods, instructions or products referred to in the content.