Article

Patient Image-Based Hemodynamics of Intracranial Aneurysms: An In Silico Study

by
Algirdas Maknickas
1,2,*,† and
Jurinda Merkevičiūtė
1,†
1
Department Biomechanical Engineering, Vilnius Gediminas Technical University, Plytines Str. 25, LT-10105 Vilnius, Lithuania
2
Institute of Mechanical Science, Vilnius Gediminas Technical University, Plytines Str. 25, LT-10105 Vilnius, Lithuania
*
Author to whom correspondence should be addressed.
These authors contributed equally to this work.
Appl. Sci. 2026, 16(7), 3233; https://doi.org/10.3390/app16073233
Submission received: 24 February 2026 / Revised: 23 March 2026 / Accepted: 24 March 2026 / Published: 27 March 2026
(This article belongs to the Section Biomedical Engineering)

Abstract

The aim of this research was to calculate hemodynamics of intracaranial aneurysms using computational fluid dynamics. The hemodynamics research of intracranial aneurysms used patient-specific blood pressure data and anonymised DICOM images, from which aneurysm geometries were extracted. The following boundary conditions were established. At the inlet, a pulsatile velocity profile was enforced, and a pressure waveform was assigned at the outlet. Numerical simulations were performed to examine key hemodynamic parameters linked to aneurysm rupture, including wall shear stress, time-averaged wall shear stress, oscillatory shear index, and relative residence time, as well as flow distributions. On the basis of these hemodynamic indicators, the risk of rupture was connected with a geometric property of the aneurysm, the aspect ratio. The hemodynamics parameters obtained ranges with the results of other scientific studies. Finally, it was concluded that combining clinical data, aneurysm geometry, and hemodynamic characteristics can provide clinicians with valuable additional information to use in selection of the appropriate treatment strategy for intracranial aneurysms.

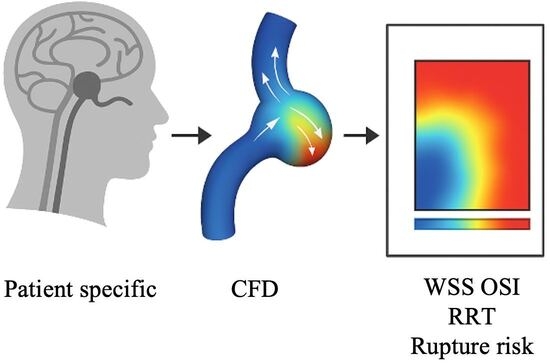
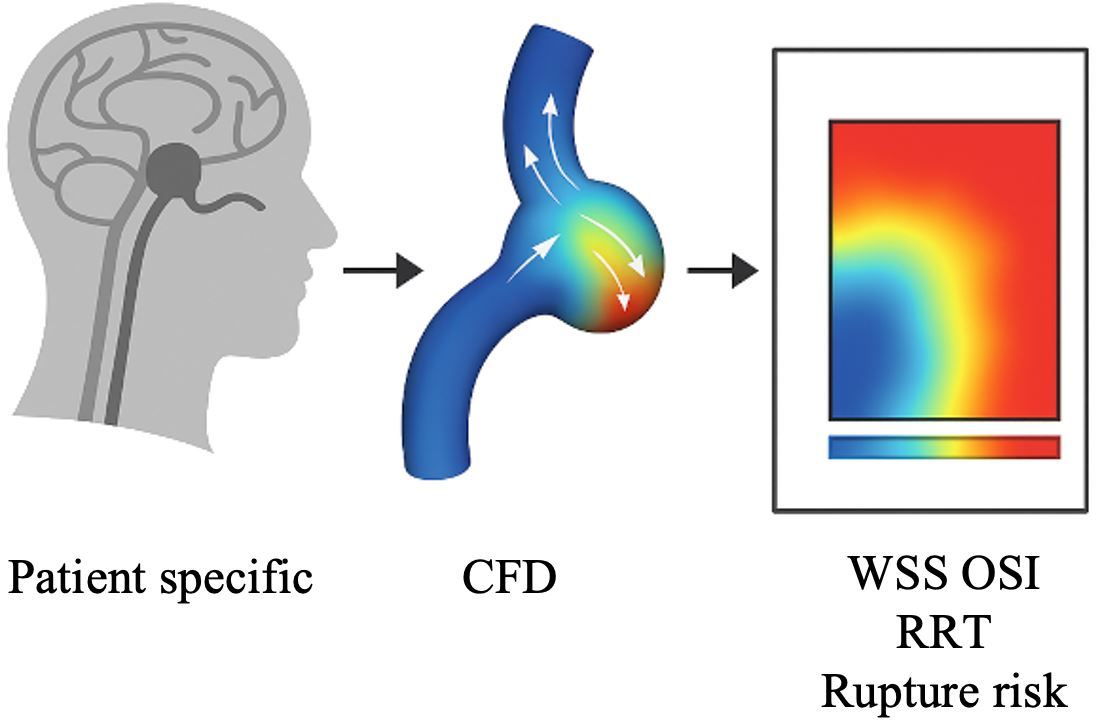
Graphical Abstract

1. Introduction

One of the most common cerebrovascular pathologies is an aneurysm. An aneurysm is an abnormal dilation or bulging of a blood vessel caused by a weakness in the vessel wall. Most brain aneurysms are asymptomatic and small, and they are often discovered incidentally during brain imaging procedures such as computed tomography (CT) or magnetic resonance imaging (MRI), or during autopsy. Aneurysm rupture is a serious and life-threatening condition that requires immediate medical attention. Aneurysms can affect any blood vessel, but they are most commonly found in arteries rather than veins [1]. Intracranial aneurysms are typically classified based on various factors, including their morphology, location, size, and etiology. Among the primary factors contributing to aneurysm formation are genetic predisposition, lifestyle choices, biological sex, vascular and cardiovascular diseases, and physiological stress [2]. The risk factors associated with aneurysm rupture are similar to those contributing to their formation and include lifestyle factors, psychological stress, and underlying vascular diseases. The results of a scientific study conducted in Finland indicate that smoking and female sex increase the risk of aneurysm rupture more significantly than aneurysm size. The overall risk varied greatly and was primarily influenced by three factors: smoking, sex, and blood pressure [3]. In addition to the previous discussed aneurysm rupture risk factors, it is important to note that rupture also depends on geometric and hemodynamic parameters. For example, an irregular aneurysm shape often leads to disturbed flow within the aneurysmal sac, resulting in multiple vortices. This, in turn, causes low wall shear stress in certain regions of the vessel wall, which promotes aneurysm growth [4]. The rupture of an intracranial aneurysm leads to subarachnoid hemorrhage (SAH), a form of hemorrhagic stroke that is often associated with high mortality and significant long-term disability. While the incidence of SAH has remained relatively stable in recent years, current literature reports a growing number of diagnosed unruptured intracranial aneurysms, likely due to advances in imaging techniques and increased screening. This trend is largely attributed to the growing use of advanced diagnostic imaging and the rising frequency of clinical examinations [5]. As reported by the organization Brain Aneurysm, approximately 1 in 20 individuals in Lithuania are affected by a brain aneurysm, which in most cases remains asymptomatic [6]. Accurate assessment of rupture risk in unruptured intracranial aneurysms requires a thorough understanding of the mechanisms driving aneurysm progression and rupture. It is well established that hemodynamic disturbances play a critical role in both aneurysm development and rupture, with larger or enlarging aneurysms generally associated with increased risk. To explore these dynamics, numerous studies have employed computational fluid dynamics (CFD) to analyze the hemodynamic environment within aneurysms and to investigate their growth patterns and rupture potential [7]. In recent decades, CFD has become a widely used tool for simulating arterial blood flow due to its ability to model instantaneous three-dimensional velocity fields and corresponding wall shear stress. In clinical settings, physicians utilize a range of imaging modalities—including computed tomography (CT), magnetic resonance imaging (MRI), and digital subtraction angiography (DSA)—to evaluate the risk of aneurysm rupture. These imaging modalities allow for precise evaluation of aneurysm location, size, and aspect ratio. In addition, assessment of comorbid cardiovascular conditions is crucial [8]. The progression of aneurysmal disease involves a complex interplay between hemodynamic forces, inflammation, and vascular wall remodeling. The structural integrity of the arterial wall is maintained by its elastic medial layers and the supporting collagen fibers. In aneurysmal vessels, the wall does not merely stretch passively under mechanical load, as collagen fibers have limited extensibility. Instead, aneurysm expansion is driven by active biological processes, including collagen remodeling and smooth muscle cell proliferation. These pathological changes are strongly influenced by local blood flow dynamics and inflammatory mechanisms, highlighting the multifactorial nature of aneurysm development [9]. To ensure patient safety, it is essential to understand the causes of aneurysm formation, their types, rupture risk factors, and possible prevention and treatment methods. The diagnosis of intracranial aneurysms (IA) relies on advanced imaging technologies such as CT, MRI, and DSA, which allow for accurate assessment of aneurysm geometrical characteristics [10].
However, in recent years, increasing attention has been given to computational modeling, which can complement traditional diagnostic approaches. CFDs, based on the finite volume or element methods, are the most advanced technique used to evaluate the hemodynamic parameters of aneurysms. These simulations make it possible to identify important biomechanical indicators that are closely associated with aneurysm growth and rupture risk. For optimal accuracy, it is recommended to use patient-specific data to define boundary conditions. In practice, however, acquiring such data is not always feasible.
In this study, three vascular geometries were reconstructed from patient MRI data, enabling anatomically realistic modeling of intracranial aneurysms. Because patient-specific inflow measurements were not available, physiologically representative pulsatile boundary conditions were applied at the inlet. Such an approach is widely used in computational hemodynamics studies of intracranial aneurysms when subject-specific flow measurements are unavailable. Previous investigations have demonstrated that anatomically accurate geometry plays a critical role in determining intra-aneurysmal flow patterns and wall shear stress distributions, even when generalized inflow conditions are used [11,12,13]. Therefore, the present work focuses on analyzing hemodynamic characteristics within patient-specific vascular geometries under physiologically realistic flow conditions.
Although numerous computational fluid dynamics (CFD) studies have investigated intracranial aneurysm hemodynamics and identified parameters such as wall shear stress (WSS), oscillatory shear index (OSI), and relative residence time (RRT) as potential indicators of aneurysm progression and rupture risk, several challenges remain. Many previous investigations rely on idealized geometries, simplified vascular reconstructions, or generalized assumptions regarding local anatomical variability. Consequently, the relationship between detailed patient-specific vascular morphology and the resulting hemodynamic patterns is still not fully understood.
The aim of this research is to contribute to this area by performing detailed computational analysis of hemodynamic parameters in three aneurysm models reconstructed directly from patient MRI data. Although the number of analyzed cases is limited, the objective of this work is not to establish statistical correlations but rather to explore how patient-specific vascular geometry influences the spatial distribution of key hemodynamic indicators, including WSS, TAWSS, OSI, and RRT. By examining these parameters within anatomically realistic vascular models, the study provides additional insight into local flow characteristics that may contribute to aneurysm development and potential rupture risk.

2. Methods

2.1. CFD

In this study, CFD was used to analyze intracranial aneurysms (IA). During the last two decades, CFD has become a fundamental and widely used tool to investigate various biomechanical aspects of intracranial aneurysms. The application of CFD modeling allows for a detailed analysis of the growth and rupture mechanisms of the aneurysm, particularly in relation to local hemodynamic conditions. This approach improves our understanding of the progression of the aneurysm and supports a more accurate risk assessment of rupture. CFD analysis begins with the acquisition of medical imaging data, typically obtained by CT, MRI or DSA. The acquired images must be of sufficient quality and in an appropriate format to enable accurate segmentation of anatomical structures and preparation of models for further analysis. Segmentation and reconstruction techniques are used to convert medical images into digital geometries that define the physical boundaries of the aneurysm and the surrounding vasculature. When imaging is performed in different phases of the cardiac cycle, it is also possible to evaluate the dynamics of the vascular wall. For CFD simulation, the definition of boundary conditions is essential. Since it is impractical to model the entire cardiovascular system, the computational domain must include at least one inlet and one outlet region. To ensure simulation accuracy, it is important to apply physiologically realistic conditions to both the vessel walls and the inlet/outlet boundaries. CFD models solve the Navier–Stokes equations numerically in conjunction with the continuity equation, which governs fluid motion and allows for the simulation of blood flow dynamics within the aneurysm. The solution of Navier–Stokes equations describes the behavior of fluid internal motion in an artery. When simplified, these equations yield classical fluid mechanics formulas such as the Bernoulli and Poiseuille equations. However, in complex geometries and real-world engineering applications, analytical solutions are practically impossible, which is why the Navier–Stokes equations are solved numerically using specialized software. The general (vector) form of the Navier–Stokes equation and continuity condition for uncompresible fluid are [14]:
ρ V t + ρ ( V · ) V = P + μ 2 V + ρ g ,
· V = 0 ,
where ρ is the fluid density, t is time, V is the fluid velocity, P is the pressure acting on the surfaces of the fluid element, μ is the dynamic viscosity, and g is the gravitational acceleration.
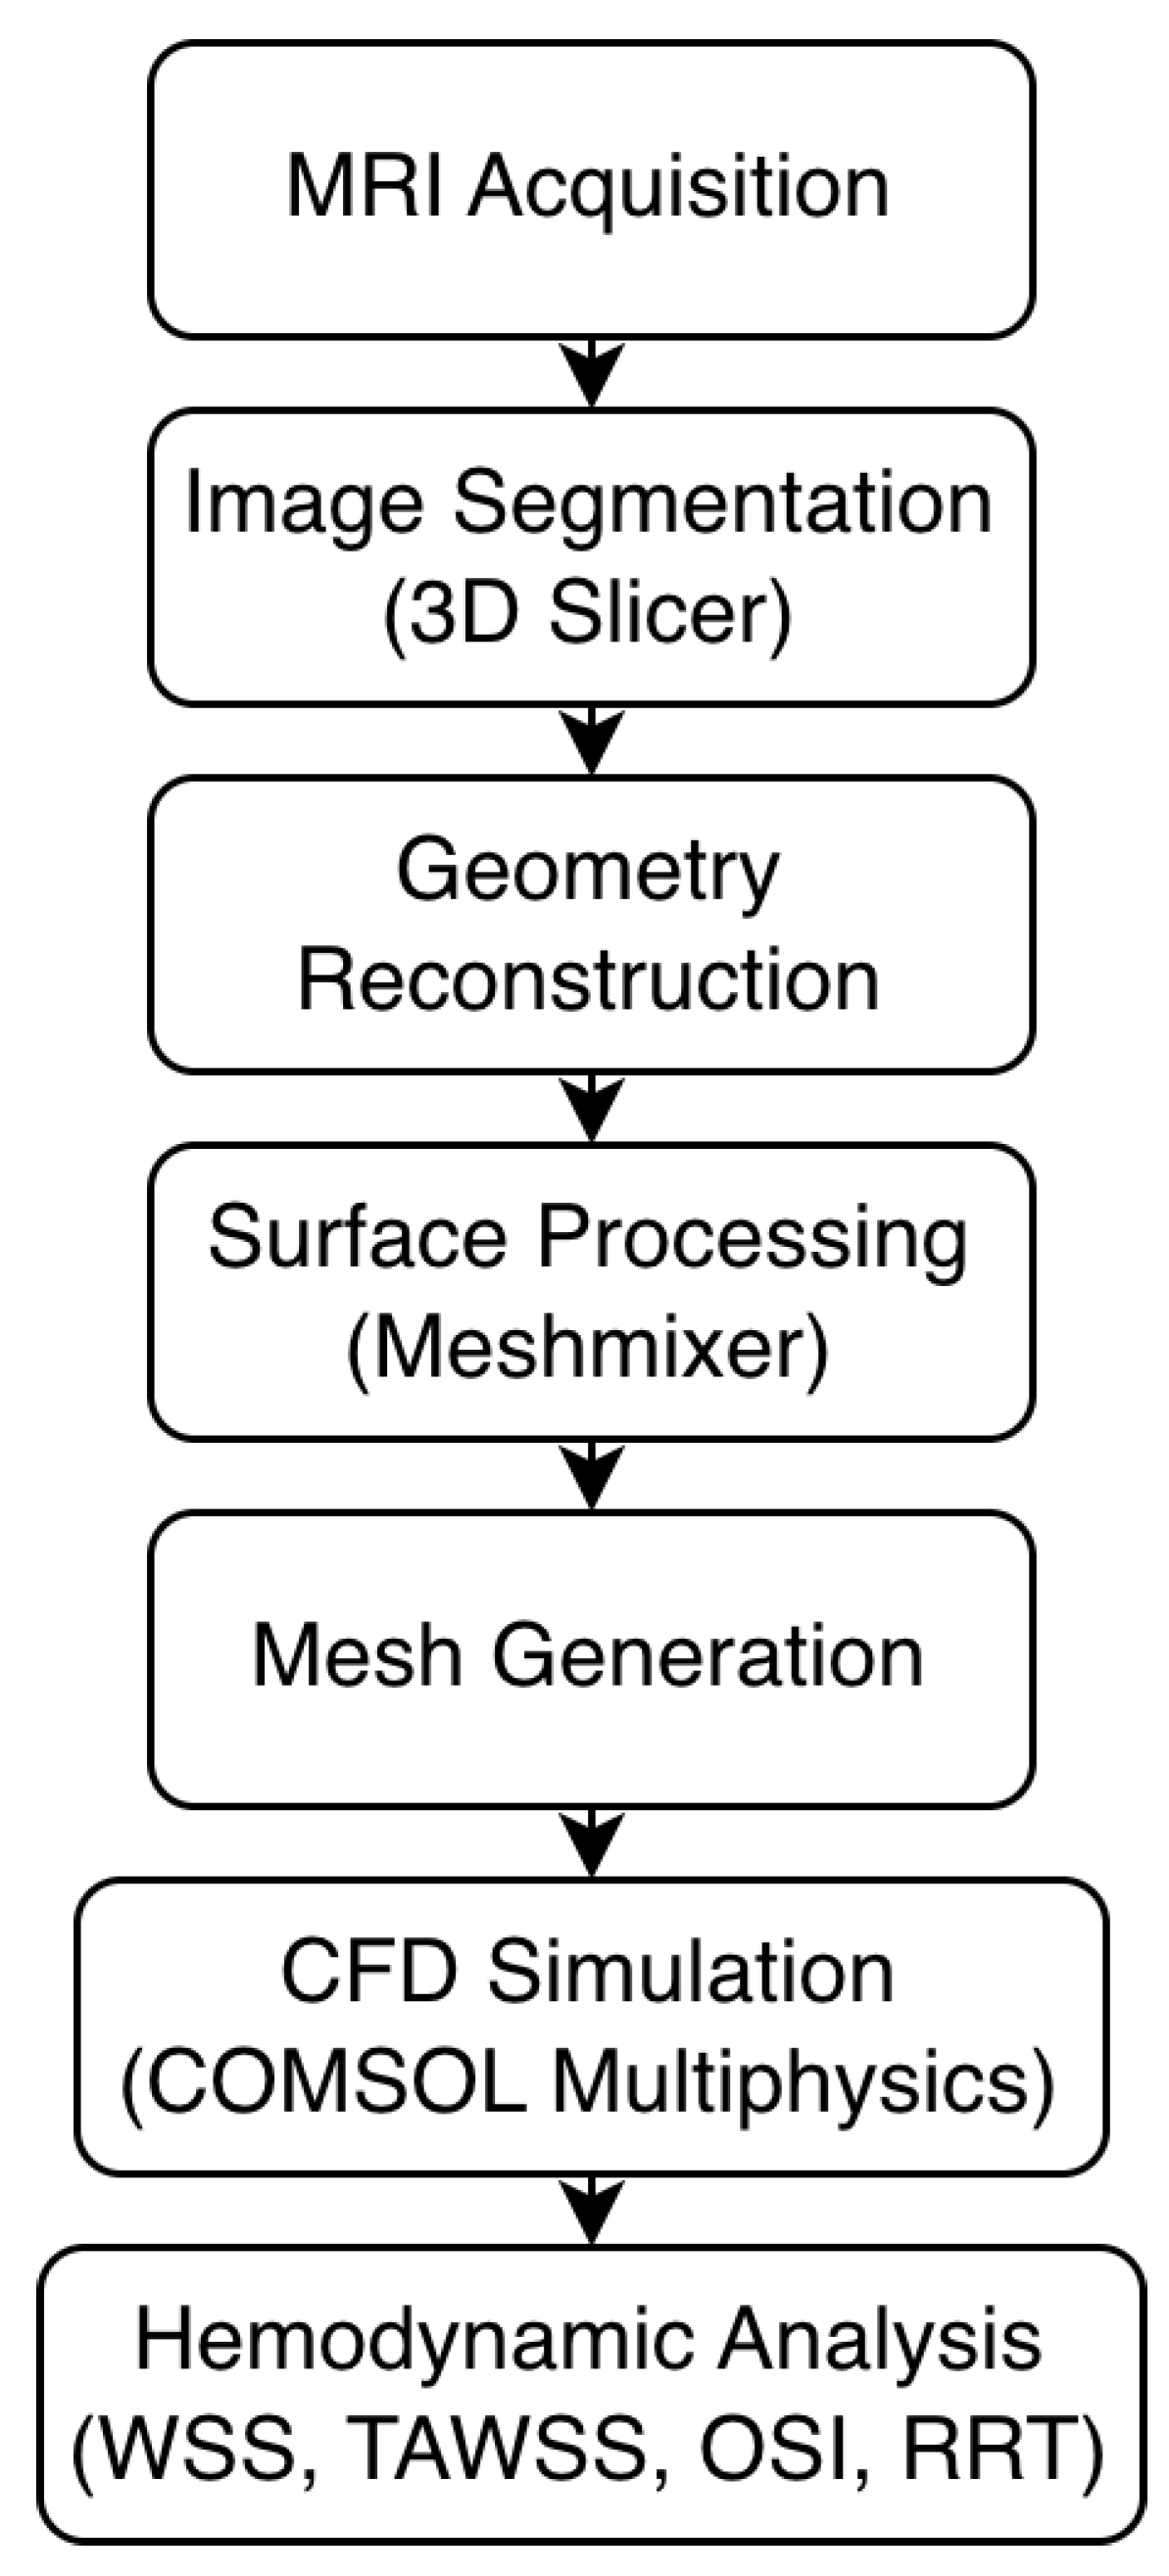
The diagram (Figure 1) illustrates the main steps of the modeling pipeline, beginning with MRI acquisition of patient-specific vascular anatomy, followed by segmentation of the aneurysmal artery using 3D Slicer, geometry refinement in Meshmixer, generation of the computational mesh, and subsequent computational fluid dynamics (CFD) simulations performed in COMSOL Multiphysics 6.3. The resulting velocity and pressure fields were used to compute key hemodynamic parameters including wall shear stress (WSS, Pa), time-averaged wall shear stress (TAWSS, Pa), oscillatory shear index (OSI, dimensionless), and relative residence time (RRT, Pa−1).

2.2. Aneurysm Geometries

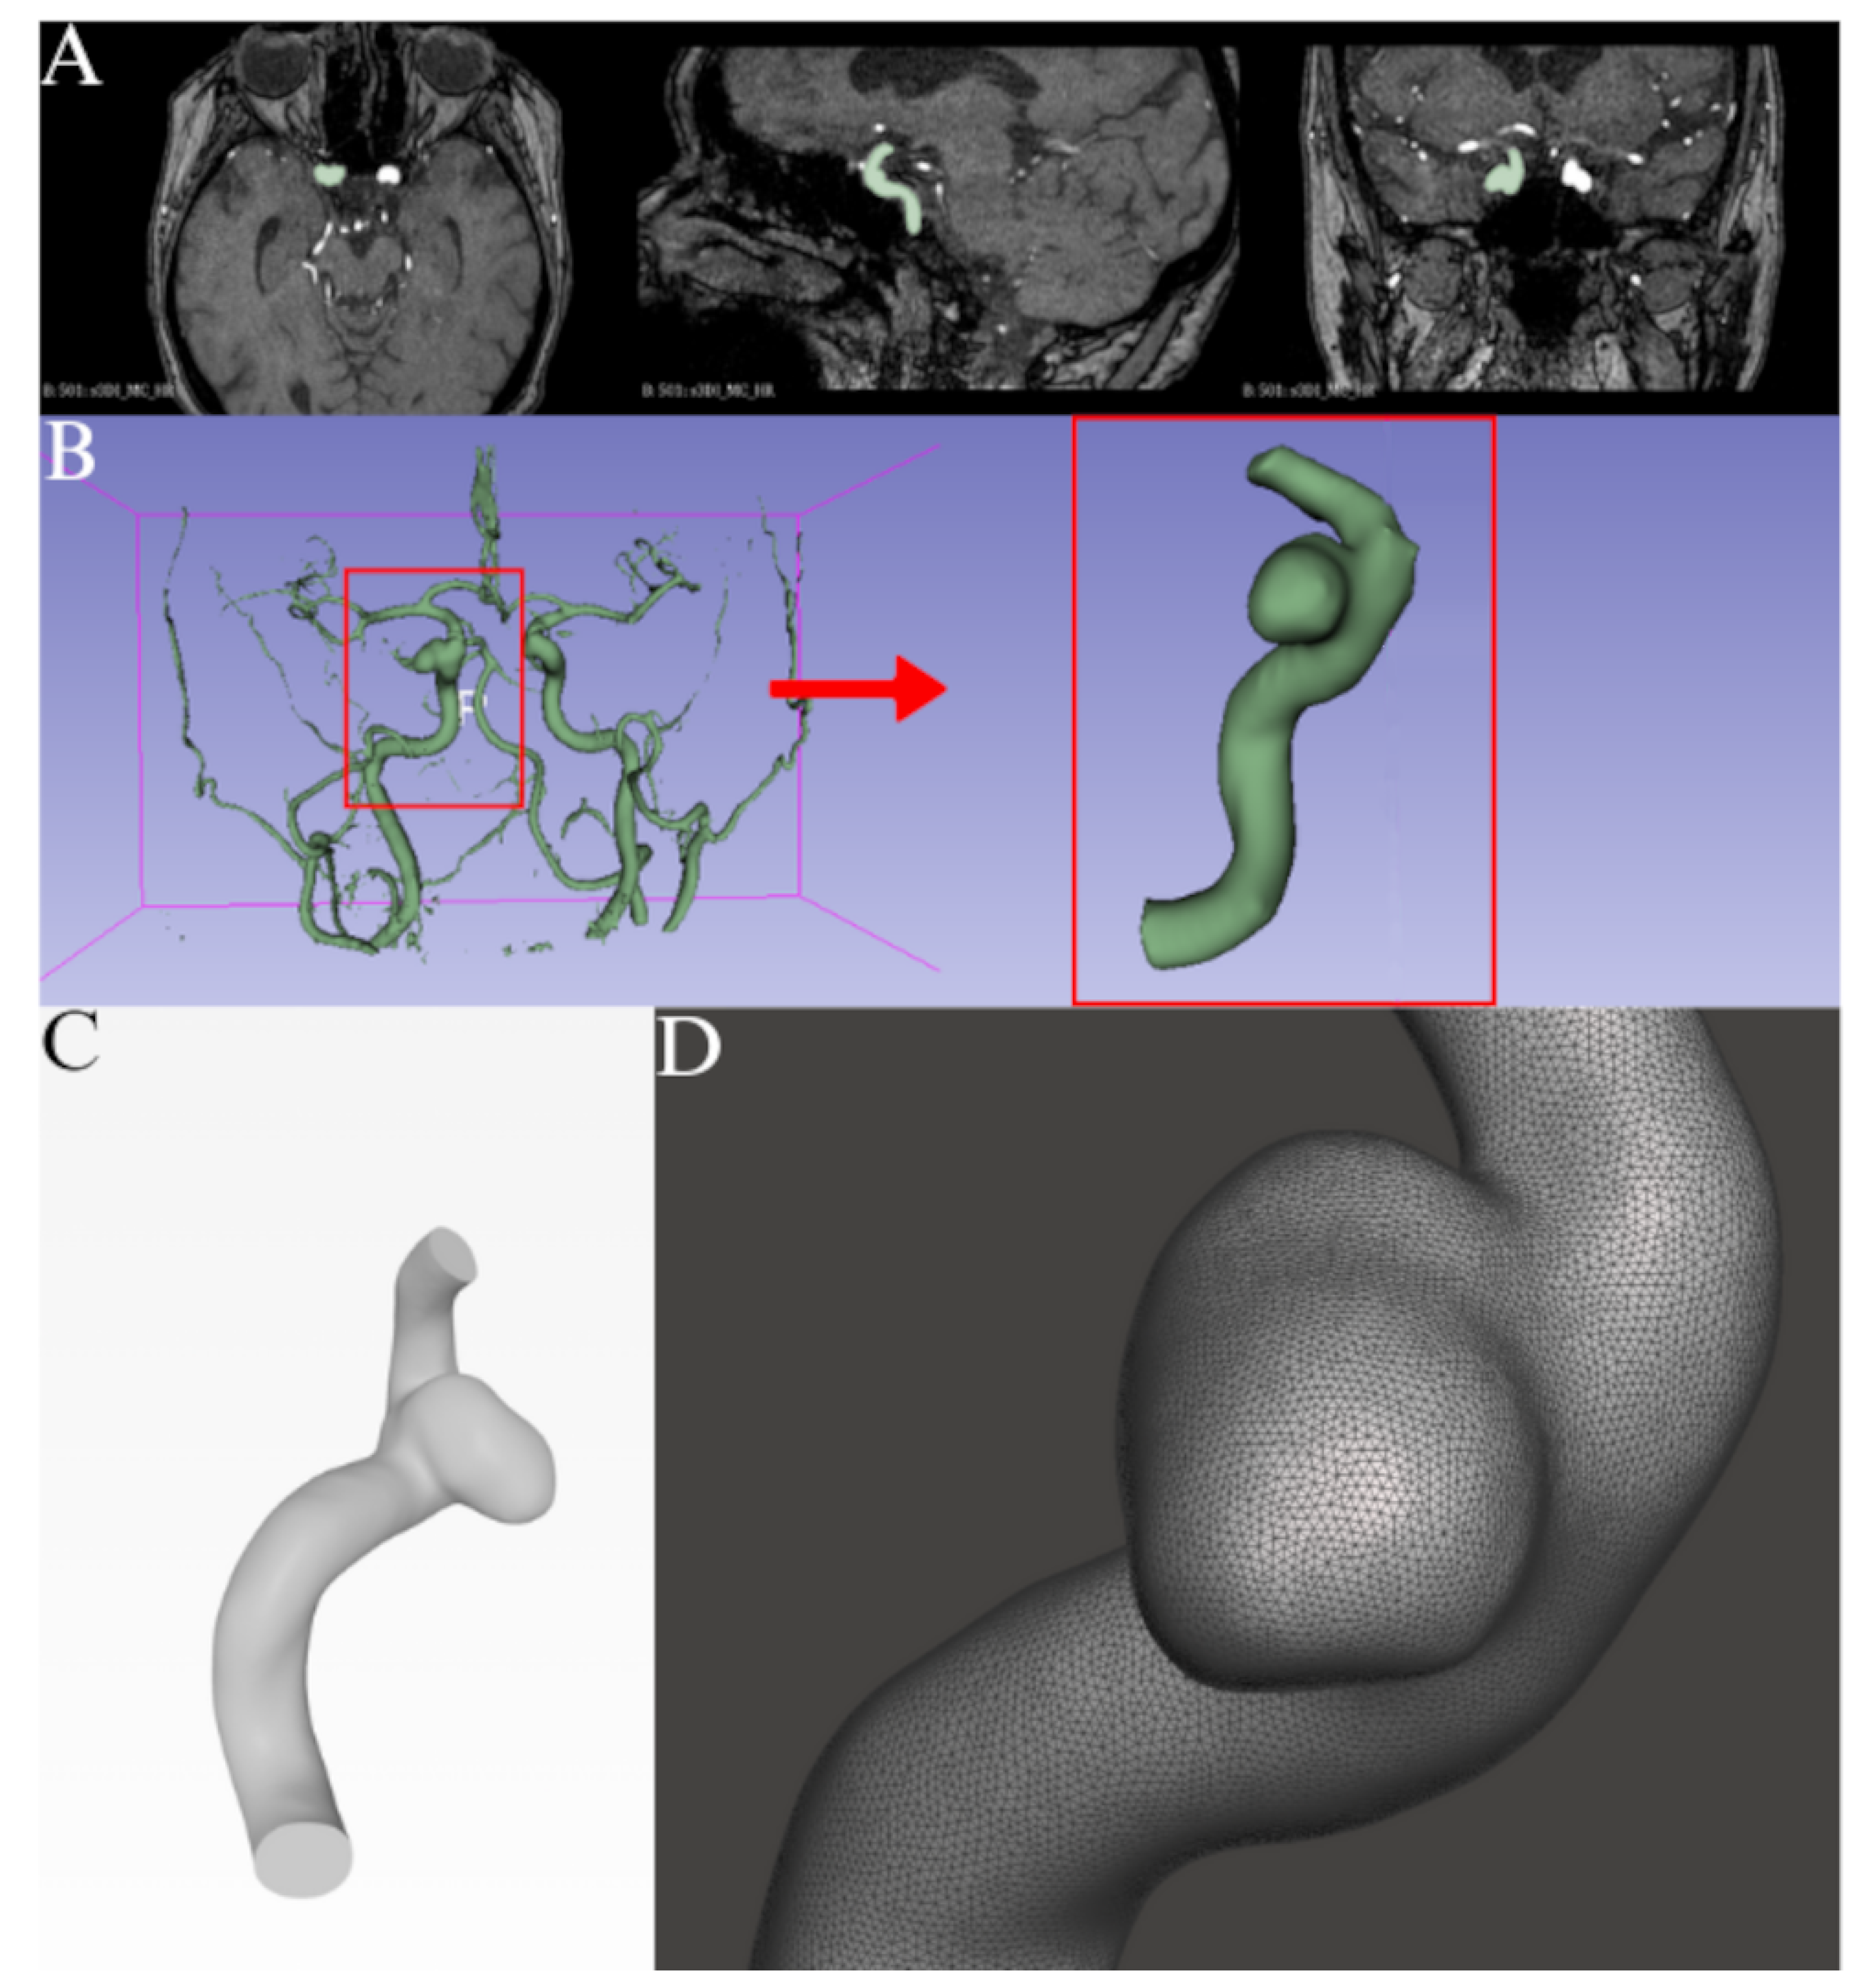
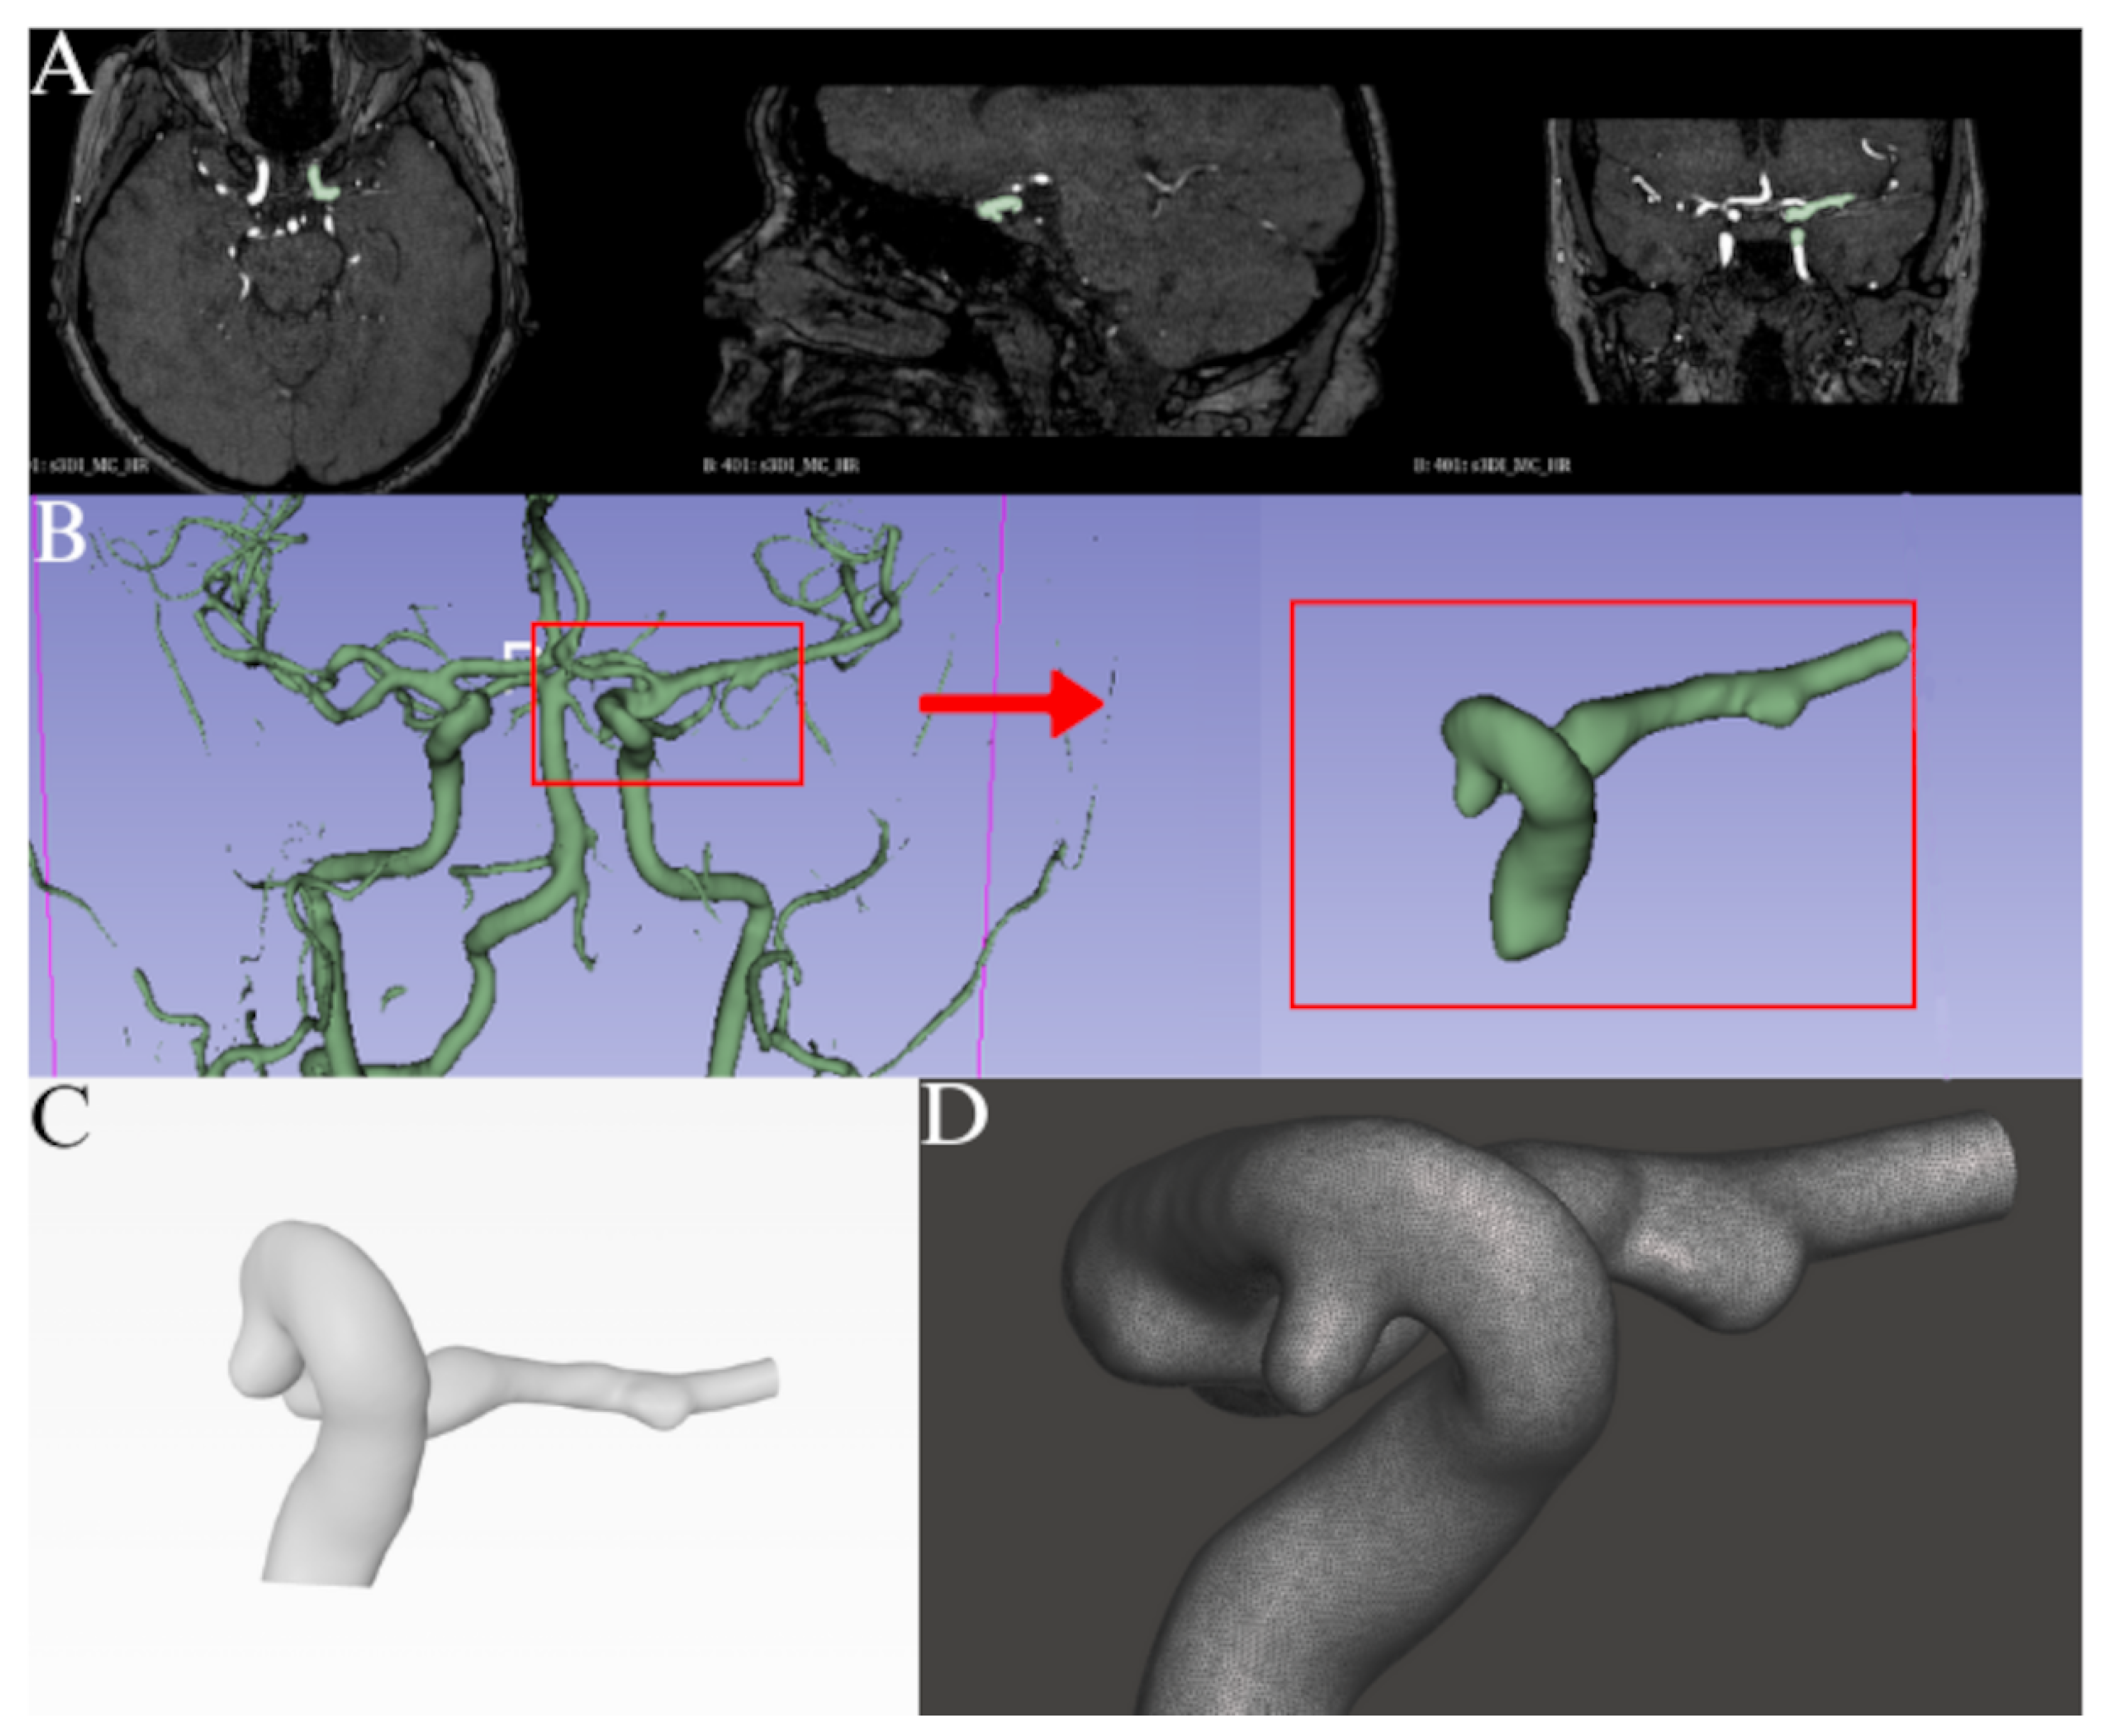
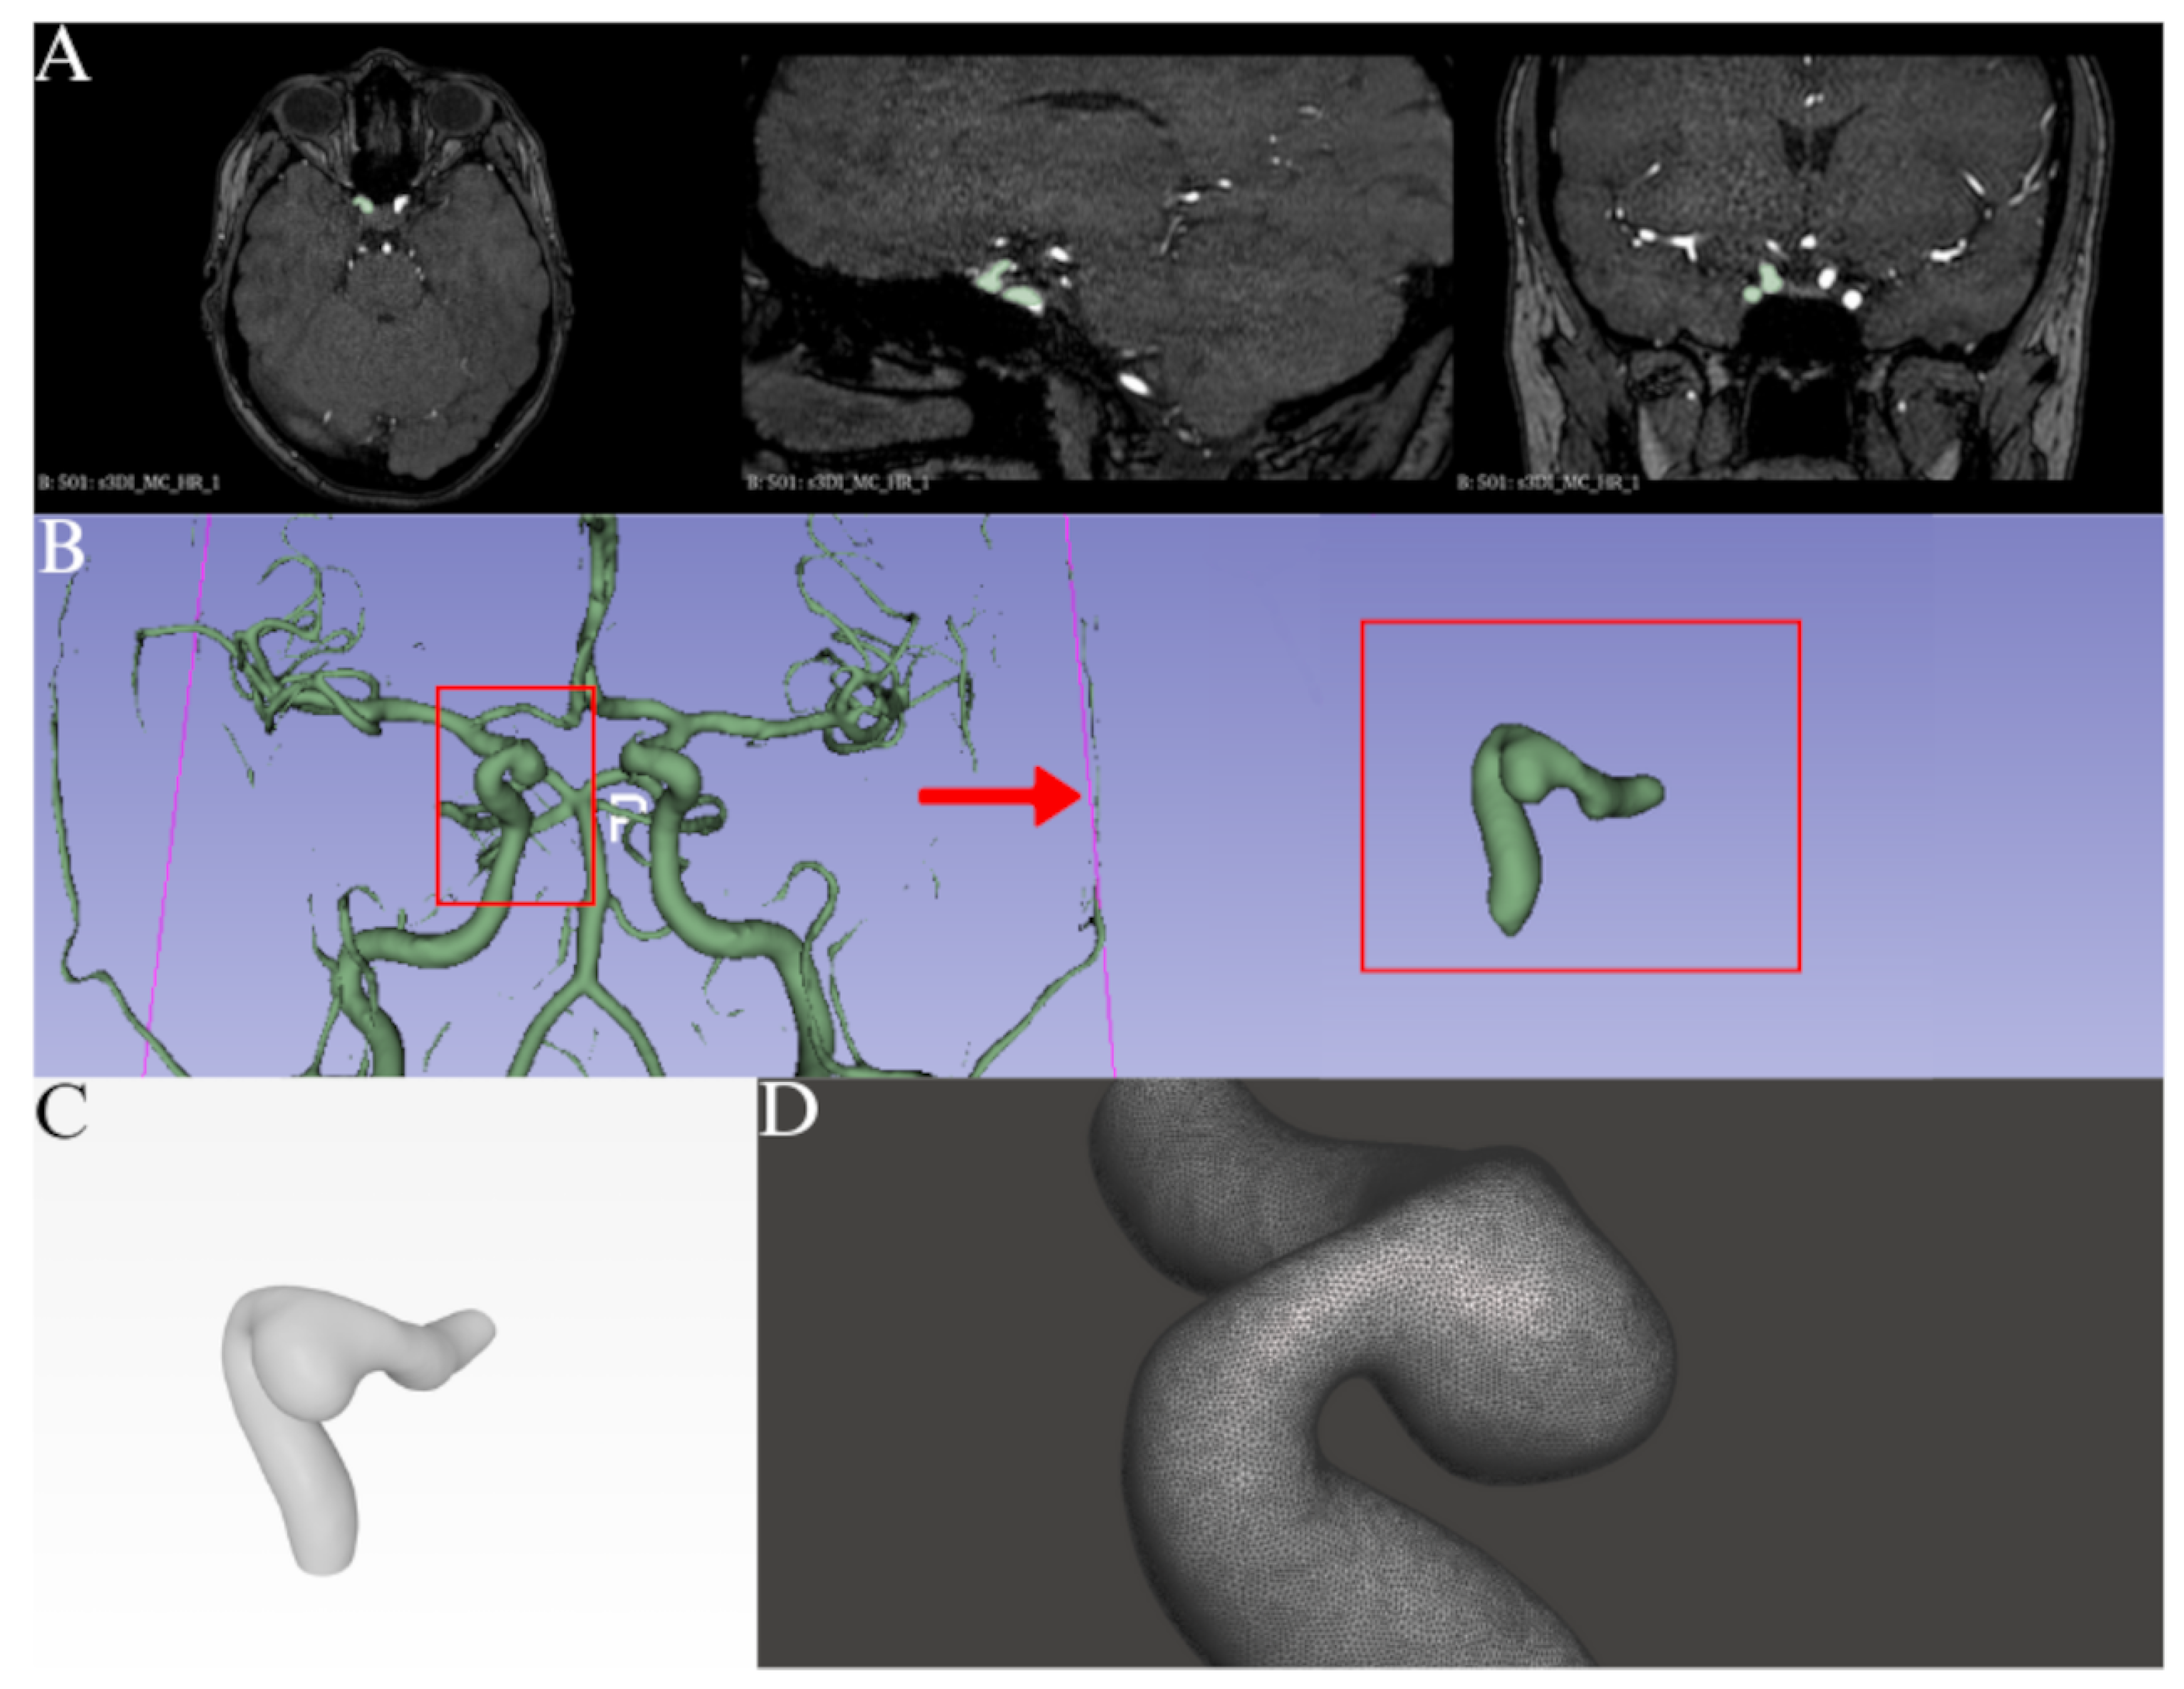
In this study, three patient-specific intracranial aneurysm models were created based on medical imaging and advanced digital modeling techniques. MRI data was acquired using a Philips Achieva 3T scanner, employing the time-of-flight (TOF) angiography sequence. Aneurysm images were randomly chosen, anonymized and saved in DICOM format and then processed to reconstruct accurate vascular geometries for CFD analysis. Segmentation of the images and initial reconstruction of the vascular models were performed using 3D Slicer 5.2 software. During this stage, the dominant arteries and aneurysm regions were identified and isolated, resulting in surface models suitable for further processing (Figure 2A,B, Figure 3A,B and Figure 4A,B). To improve the quality of the models and ensure their suitability for numerical simulation, the geometries were further refined using Meshmixer. This step involved smoothing and optimizing the surface models, as well as removing irregularities that could potentially lead to computational errors during subsequent CFD analysis. Furthermore, geometric issues such as sharp edges and mesh inaccuracies were corrected (Figure 2C,D, Figure 3C,D and Figure 4C,D).
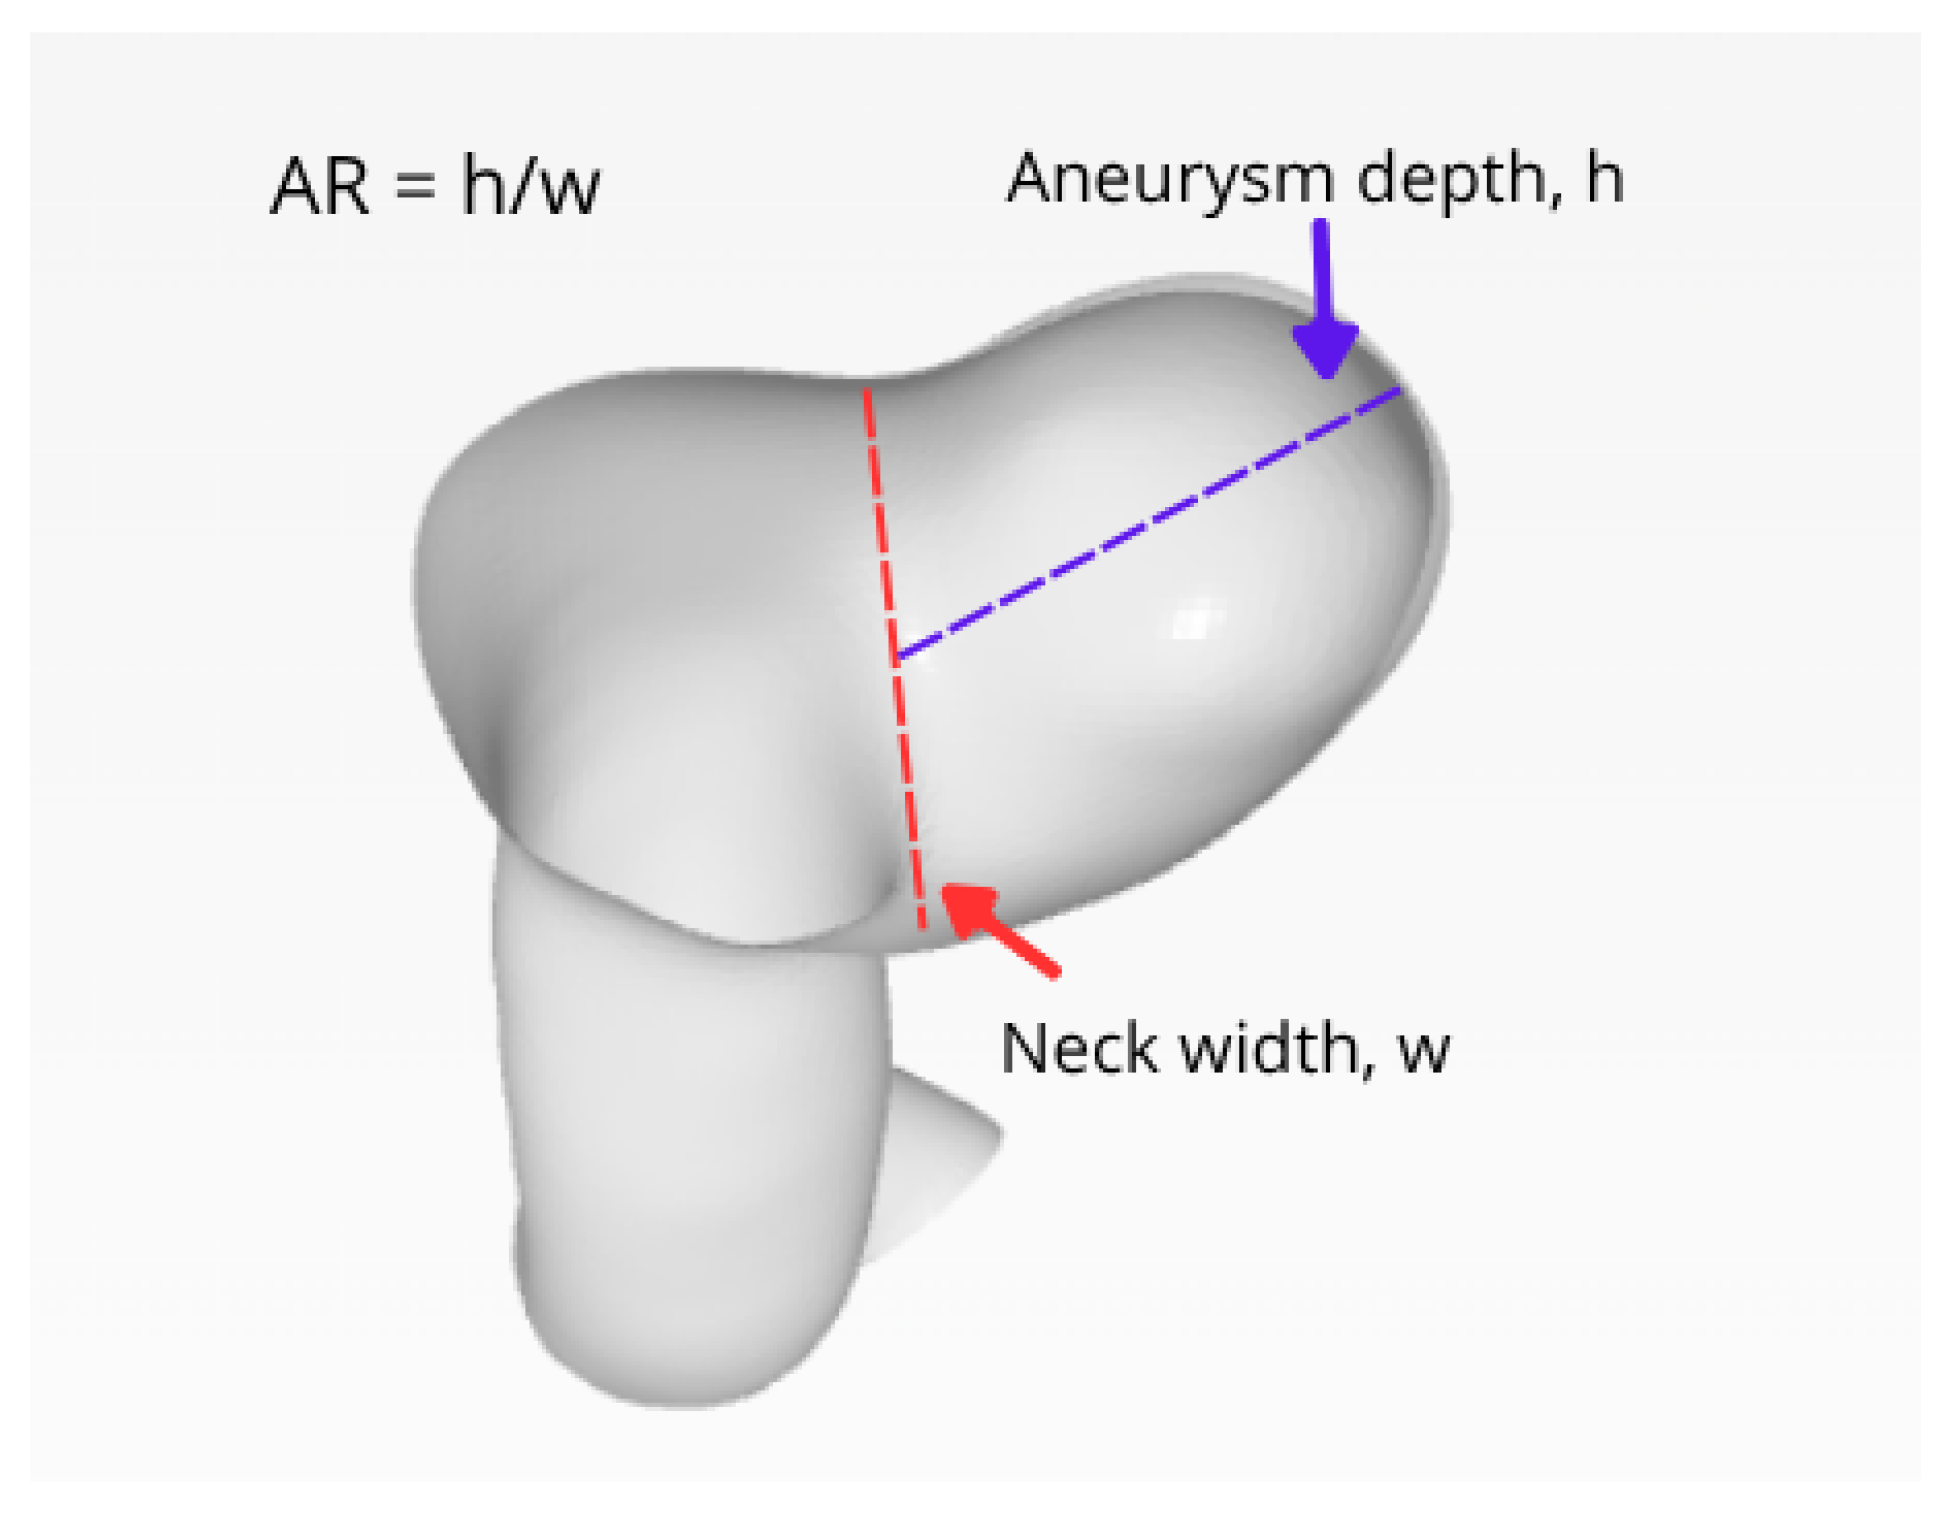
An aspect ratio, calculated as the aneurysm depth relative to neck width, was determined for each aneurysm (Figure 5). The results of the aspect ratio measurements are presented in Table 1.
The final optimized intracranial aneurysm (IA) models were exported to COMSOL Multiphysics 6.3 [15], where boundary conditions were applied and the models were prepared for computational fluid dynamics simulations. This process resulted in three-dimensional IA geometries suitable for detailed hemodynamic analysis, enabling the evaluation of key parameters such as wall shear stress (WSS), time-averaged wall shear stress (TAWSS), the oscillatory shear index (OSI) and the relative residence time (RRT).

2.3. Boundary Conditions

The vessel walls were assumed to be rigid with a no-slip boundary condition. Although vascular compliance can influence local hemodynamics, the rigid-wall approximation is commonly employed in computational studies of intracranial aneurysms and allows for the efficient evaluation of flow patterns and wall shear stress distributions.
Because patient-specific inflow measurements were not available, a physiologically representative pulsatile velocity waveform derived from previously published hemodynamic data was applied at the inlet. This waveform approximates typical flow conditions in intracranial arteries and is widely used in computational studies when patient-specific measurements are not available.
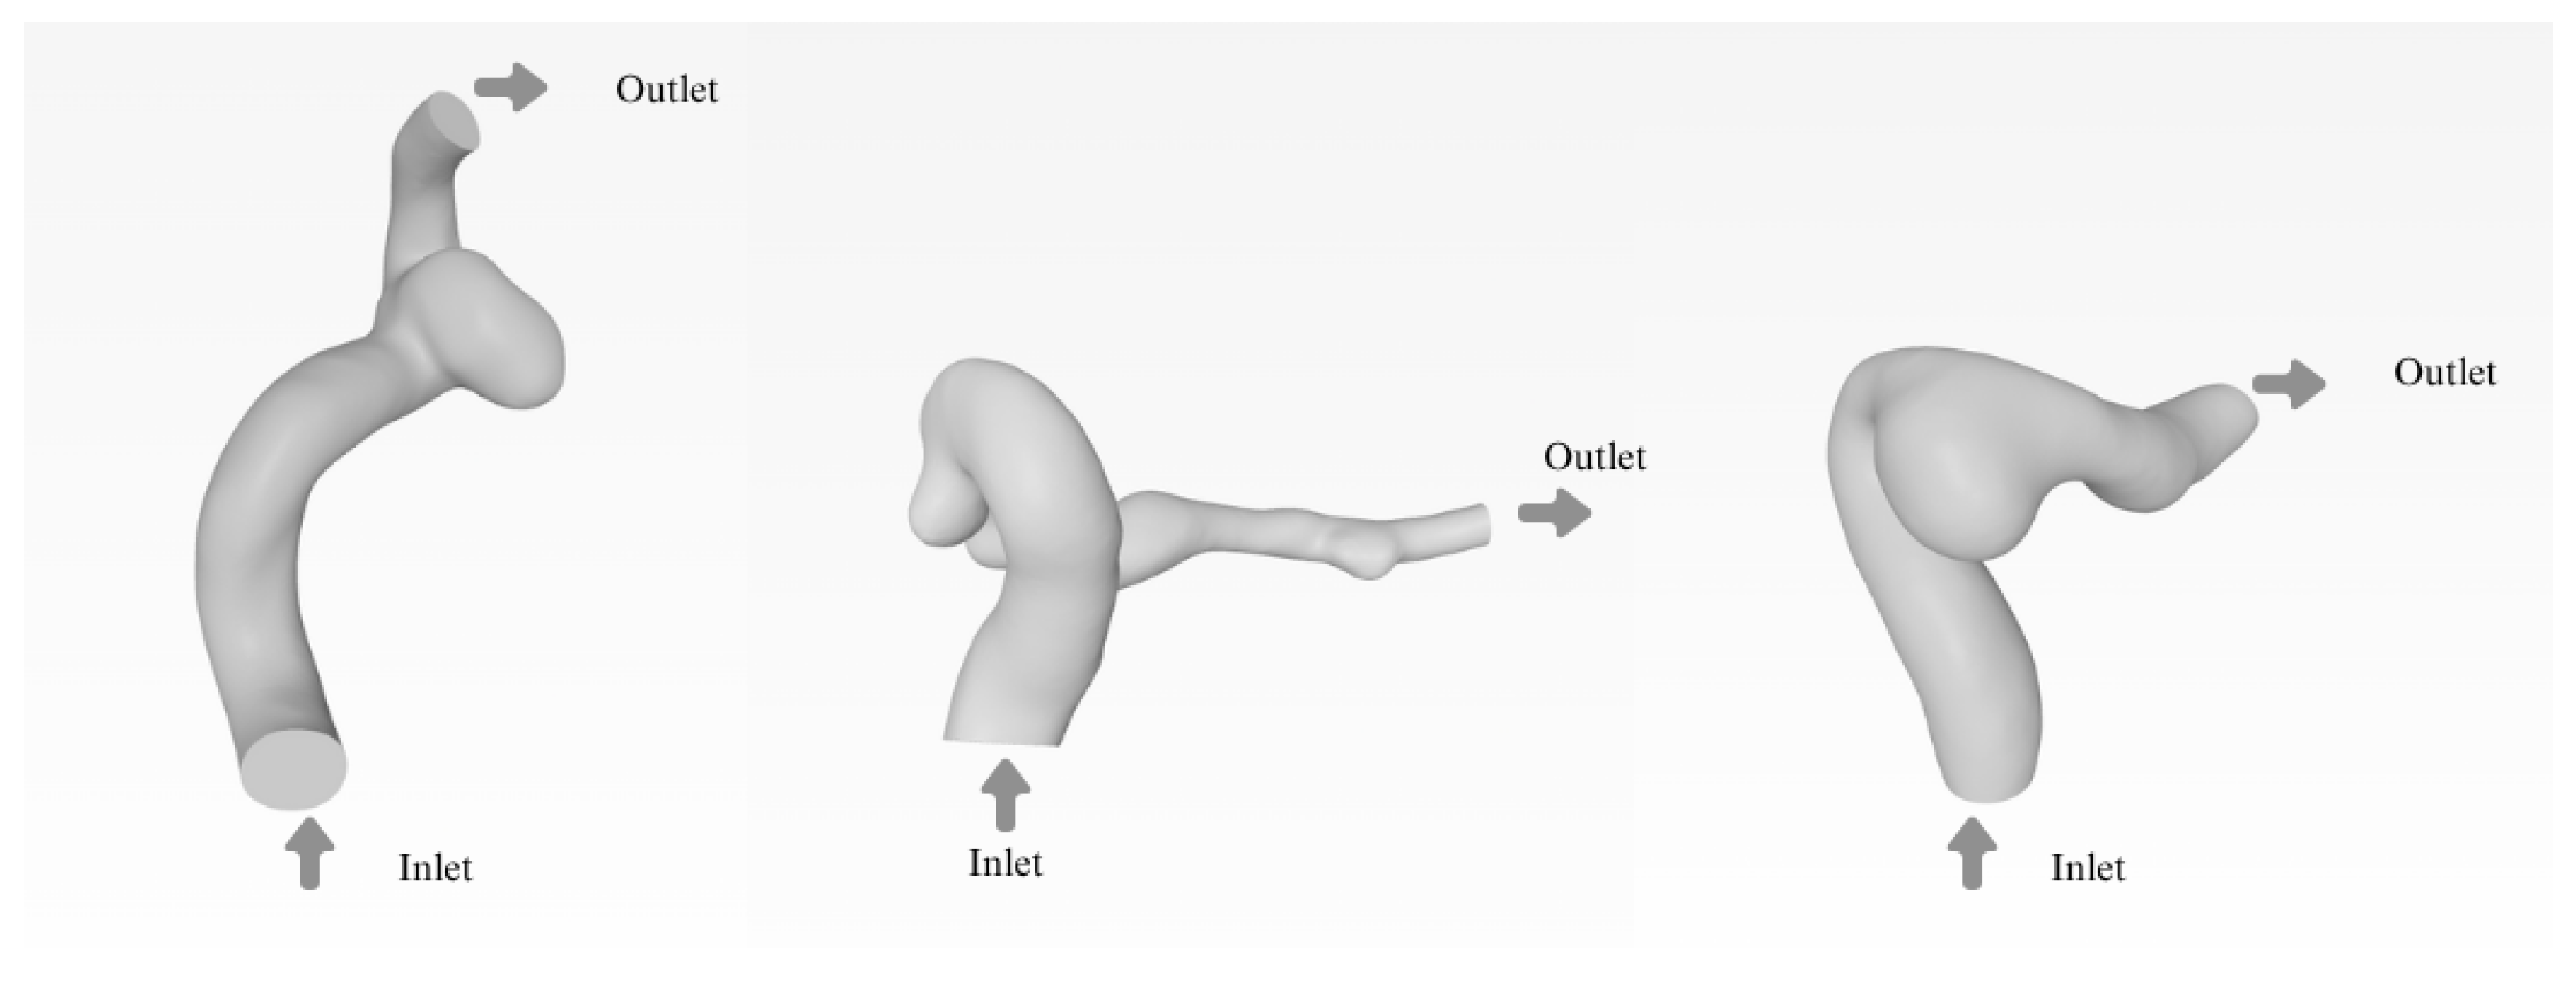
Clearly defining the inlet and outlet regions of the model is essential to perform CFD simulations. These regions are illustrated in Figure 6. The simulations were conducted assuming laminar flow, with blood modeled as a Newtonian fluid, and the vessel wall treated as a rigid body. Additional simulation parameters are summarized in Table 2.
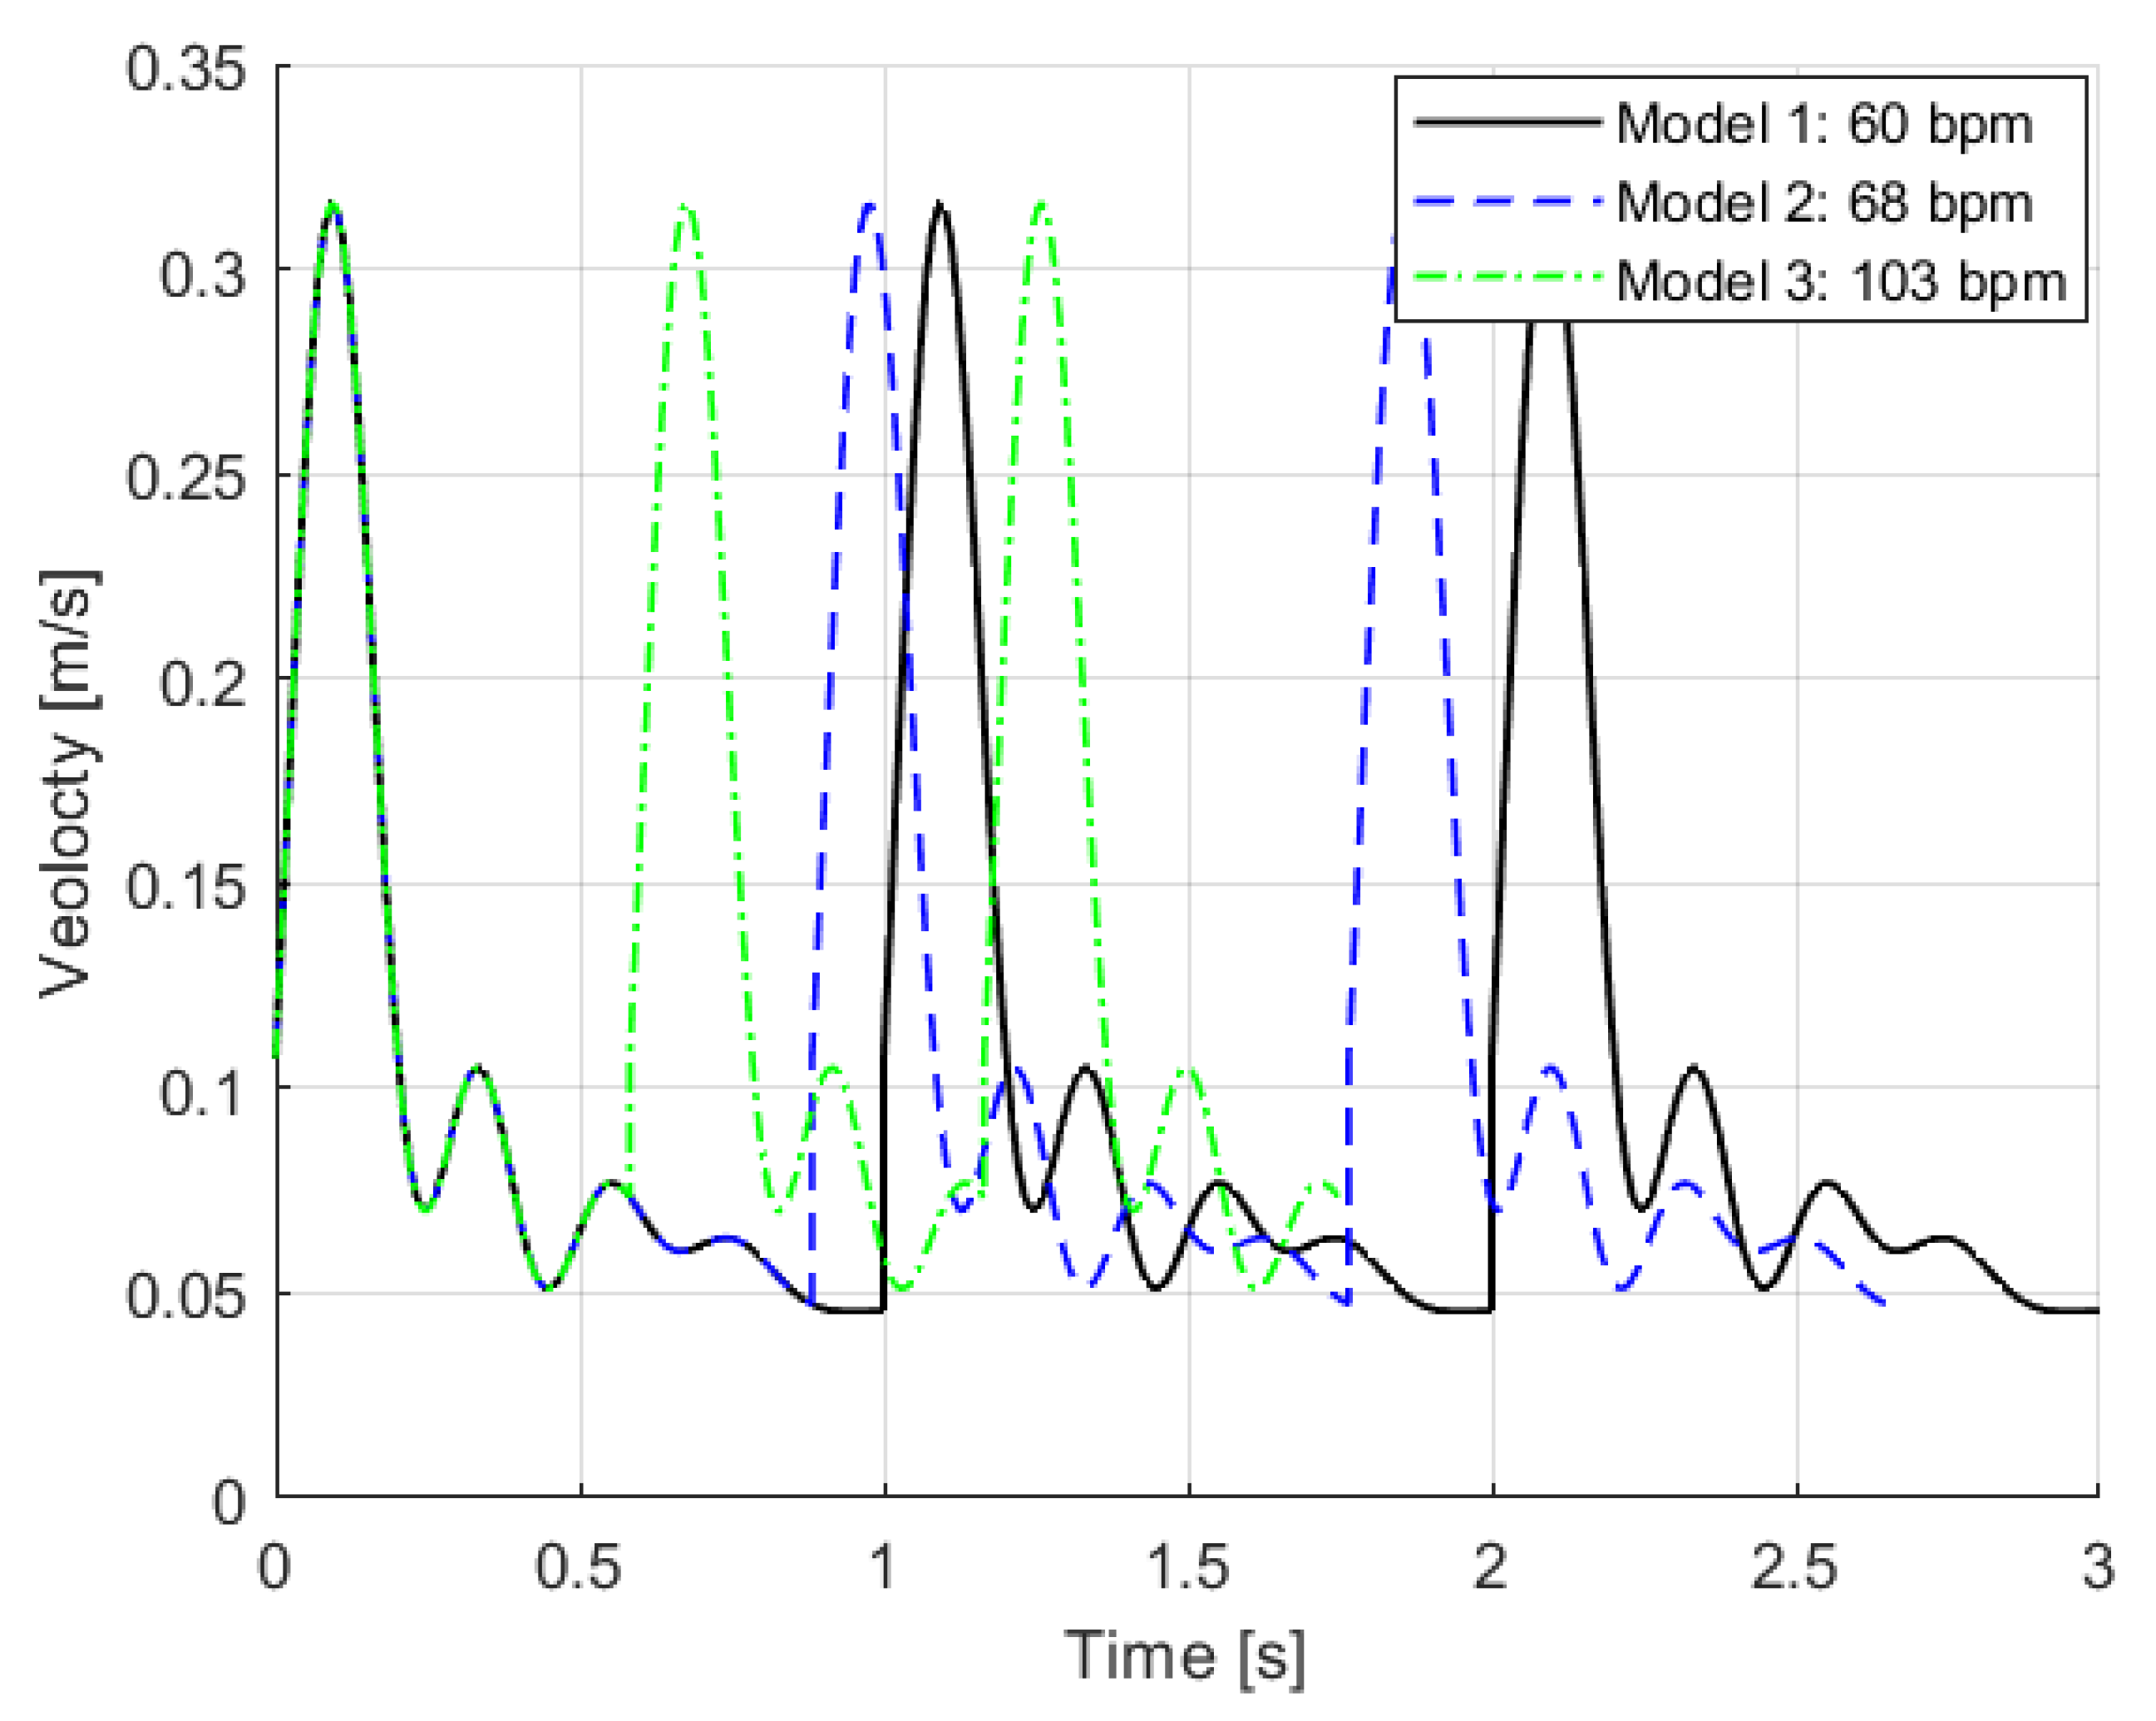
Since patient-specific blood flow velocity data were not available, a pulsatile velocity profile from the Pulse Wave Database [16] was selected for the boundary condition in the inlet (Figure 7). As heart rate varies among individuals, so does the frequency of the pulsatile flow—the higher the heart rate, the more frequently the blood flow pulses.
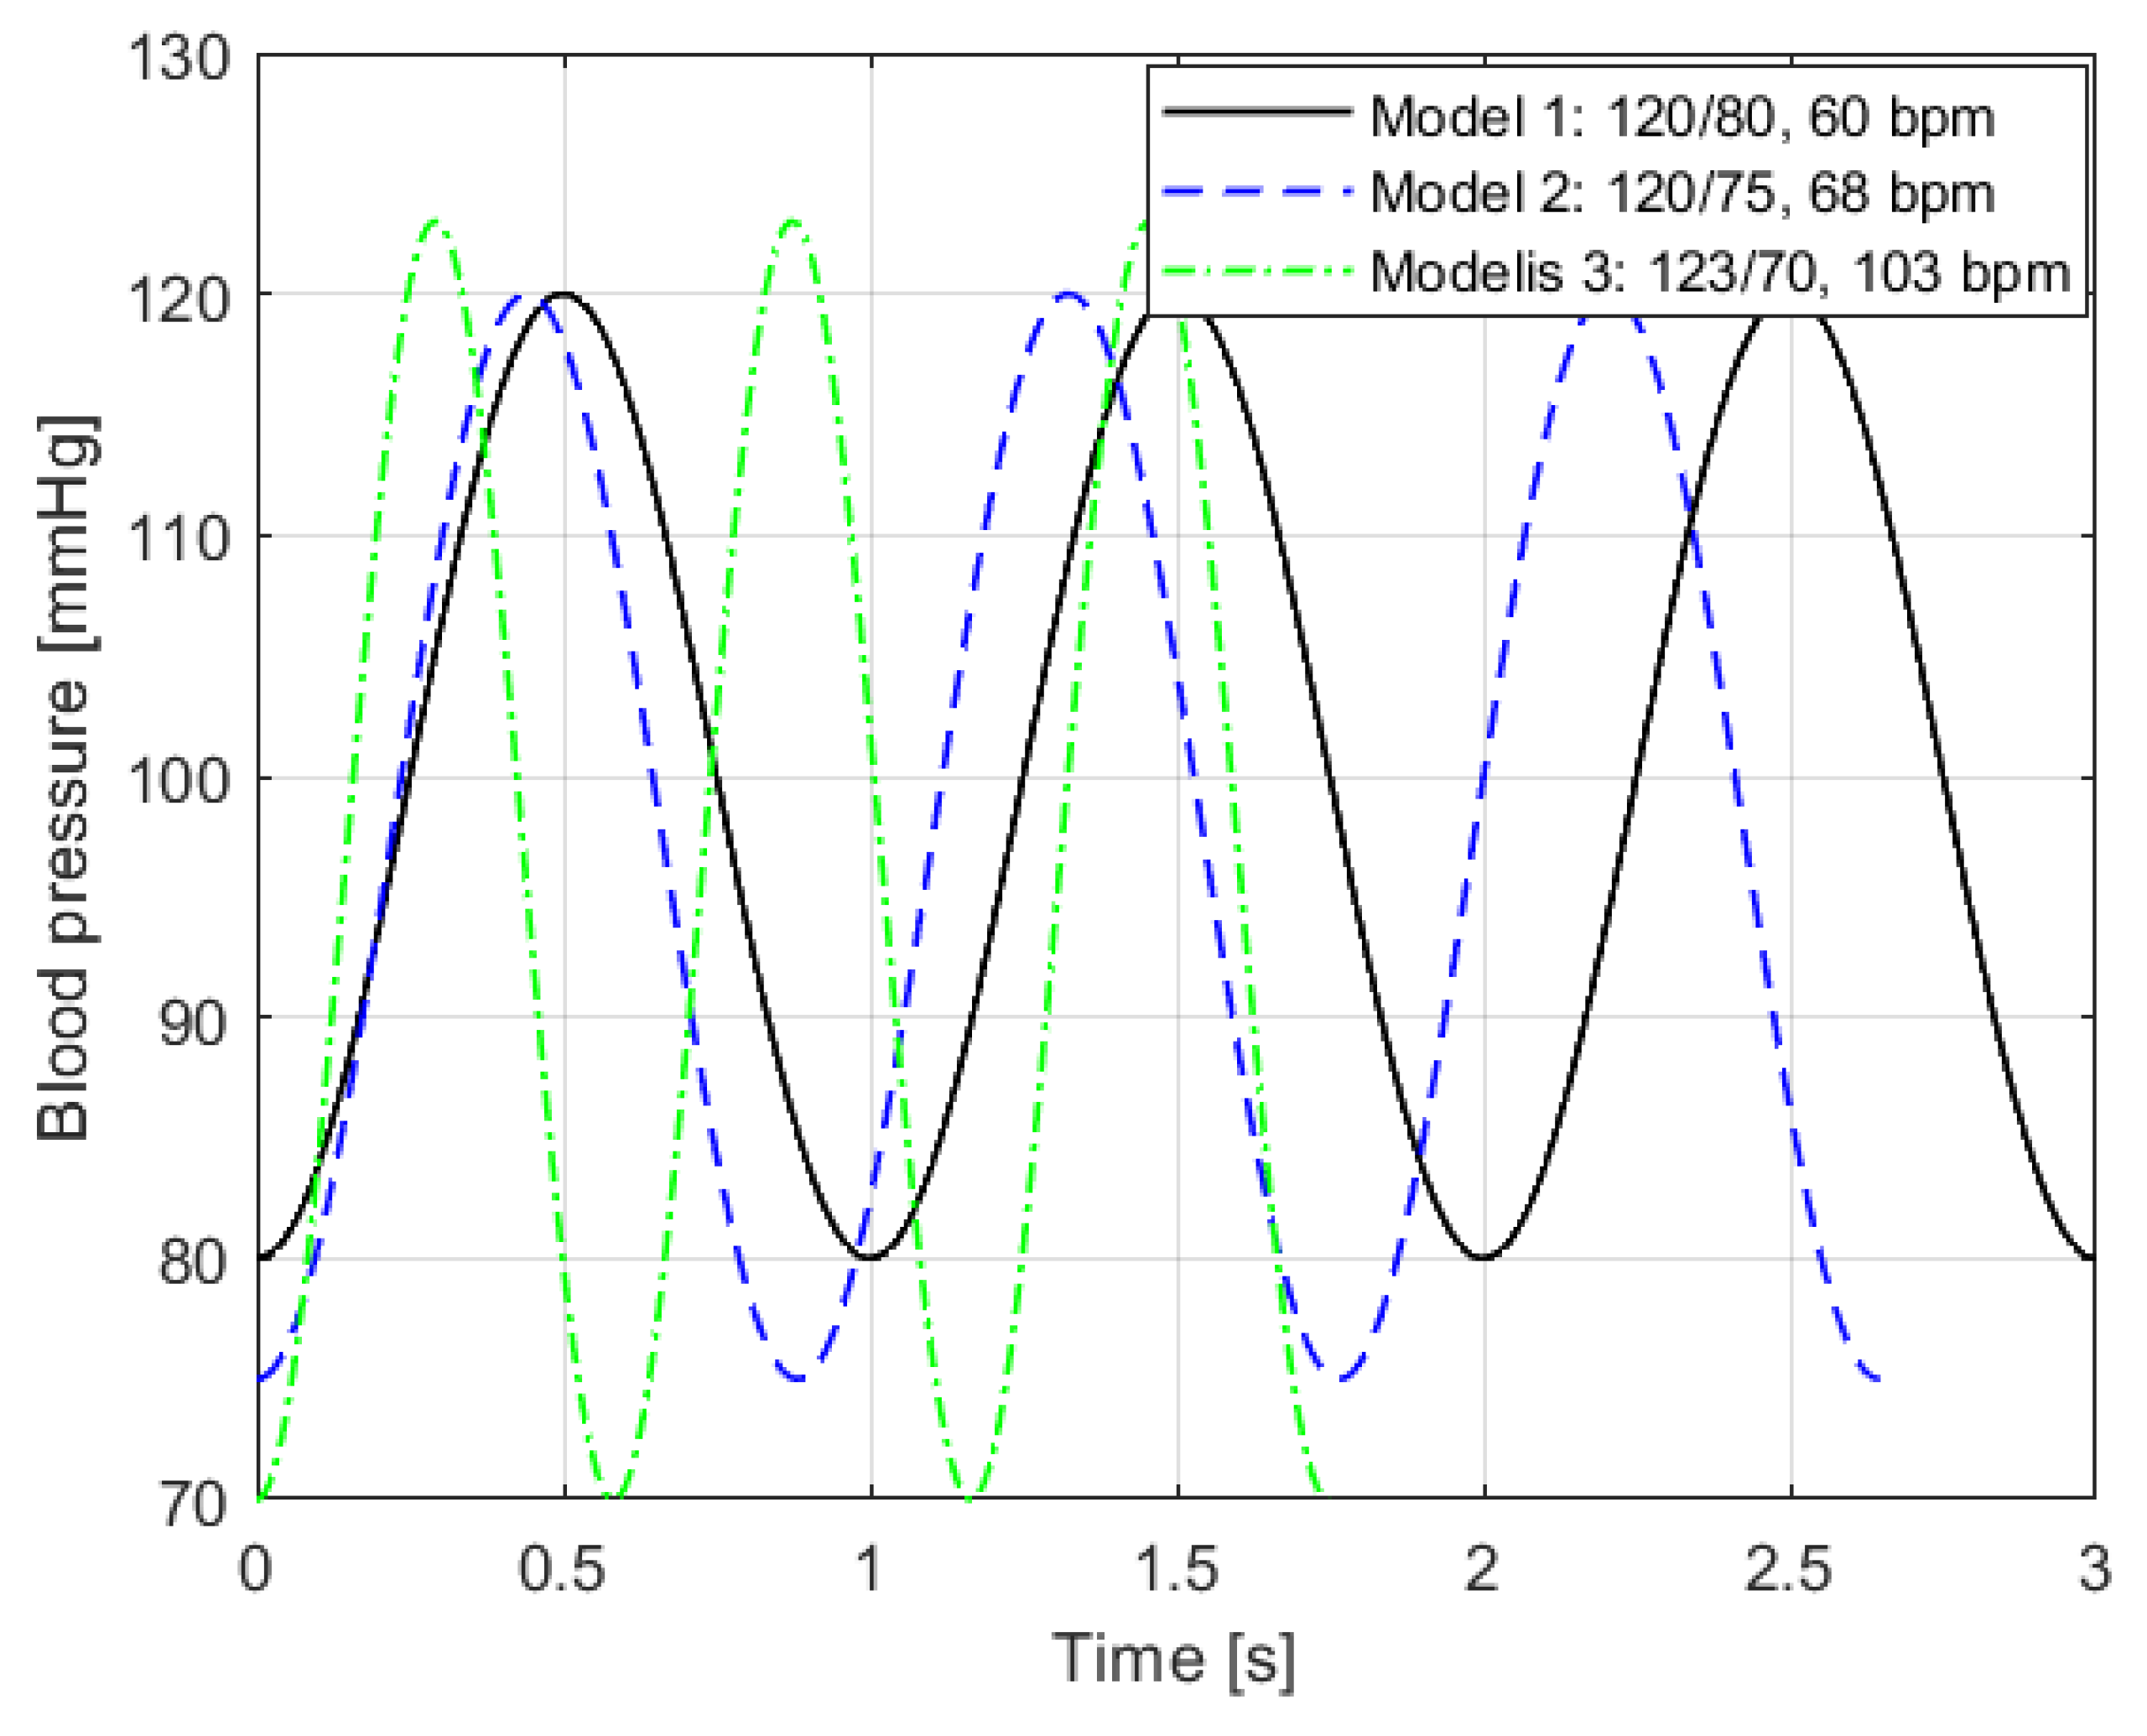
A generalized cosine-based pressure waveform equation was used in the outlet boundary condition, as patient-specific pressure profiles could not be obtained or located in available databases. The applied equation was as follows:
P ( t ) = P dia + ( P sis P dia ) · 1 cos 2 π T mod ( t , T ) 2 ,
where P ( t ) is the instantaneous outlet pressure as a function of time, P dia is the diastolic pressure (minimum pressure in the cycle), P sis is the systolic pressure (maximum pressure in the cycle), T is the duration of one cardiac cycle (in seconds), calculated as T = 60 HR , mod ( t , T ) ensures periodic repetition of the pressure waveform, cos ( · ) generates a smooth, sinusoidal transition between diastolic and systolic phases.
This equation was applied using anonymized patient-specific blood pressure values for each model. Model 1: 120/80 mmHg, HR = 60 bpm, model 2: 120/75 mmHg, HR = 68 bpm, model 3: 123/70 mmHg, HR = 103 bpm. The resulting pressure waveforms are illustrated in Figure 8. The waveform shapes differ between models because of variations in heart rate, which also affects the frequency of blood flow pulsations, similarly to the velocity profiles.
The transient Navier–Stokes equations were solved using the finite element solver implemented in COMSOL Multiphysics. In this study, considering time and hardware limitations, simulations were performed over 3 full cardiac cycles, with 100 time steps per cycle, resulting in a total of 300 time steps. Since the duration of the cardiac cycle depends on the patient’s heart rate, different simulation durations and time step sizes were used for each of the three models to capture the same three cardiac cycles with consistent temporal resolution (100 time steps per cycle) (Table 3). Convergence of the numerical solution was ensured using a relative tolerance of 10 6 . Hemodynamic parameters were evaluated after periodic flow conditions were achieved.

2.4. Hemodynamic Parameters

Numerous hemodynamic parameters are examined in scientific studies; among the most important to assess IA hemodynamics and rupture risk are WSS, TAWSS, OSI and RRT. WSS was calculated on the surface of the vessel wall as the viscous shear force acting tangentially due to blood flow. WSS was evaluated using its three vector components aligned with the local surface normal vector n = ( n x n y n z ) , based on the dynamic viscosity of blood μ = 0.0035 Pa and the velocity field gradients u x , u y , u z .
Blood was modeled as an incompressible Newtonian fluid with a density of ρ 1060 kg m−3. Although blood exhibits non-Newtonian behavior at low shear rates, numerous studies have demonstrated that in large cerebral arteries the Newtonian approximation provides accurate predictions of the overall flow structure and hemodynamic parameters, particularly under physiological shear conditions typical of intracranial circulation.
The magnitude of the WSS vector was calculated as follows [17]:
W S S mag = τ x 2 + τ y 2 + τ z 2 ,
where τ x , τ y , τ z are fluid shear stress components on a wall in x , y , z directions. TAWSS was calculated as the time integral of the WSS magnitude, divided by the total simulation time [18]:
T A W S S = 1 T 0 T W S S mag ( t ) d t .
OSI quantifies changes in the direction of WSS throughout the cardiac cycle. OSI increases when the WSS vector undergoes larger angular deviations and is commonly used to characterize disturbed or oscillatory flow regions. Studies have shown that higher OSI values are associated with ruptured aneurysms or correspond to rupture-prone regions [18]. OSI is defined by the following equation:
O S I = 1 2 1 0 T τ ( t ) d t 0 T τ ( t ) d t + ε ,
where the numerator represents the magnitude of the time-integrated WSS vector; the denominator is the time-integrated magnitude of the WSS vector; to avoid division by zero or numerical instability, a regularization coefficient ε = 10 6 was applied; in COMSOL, this was implemented by integrating each component of the WSS vector ( τ x , τ y , τ z ) separately over time and then computing the magnitude of the resulting integrated vector. This approach ensures an accurate calculation of OSI in regions with low or oscillatory shear stress [18].
RRT reflects the tendency of blood particles to remain near the vessel wall for a prolonged period due to low and oscillatory shear stress. This parameter captures the combined effects of low WSS or TAWSS and high OSI, both of which contribute to an increase in particle residence time near the wall [18]. RRT is defined by the following expression:
R R T = 1 ( 1 2 × O S I ) × T A W S S + ε .
All time integrals in COMSOL Multiphysics 6.3 were computed using the timeint operator.
The vascular geometries reconstructed from MRI data were first optimized using Meshmixer to remove surface artifacts and ensure smooth boundary representation. The final volumetric mesh used for CFD simulations was generated within the COMSOL Multiphysics environment. The computational mesh consisted of approximately 2.8 million tetrahedral elements, with local refinement applied near the vessel walls to accurately resolve velocity gradients relevant for wall shear stress calculations. Mesh quality metrics (minimum element quality, skewness, and aspect ratio) were verified to ensure numerical stability.
To ensure that the numerical results were independent of spatial discretization, a mesh independence test was conducted. Three meshes with increasing spatial resolution were generated and used to compute the hemodynamic parameters. The meshes contained approximately 0.7 mln, 1.4 mln and 2.8 mln elements, respectively. The resulting distributions of wall shear stress (WSS) and oscillatory shear index (OSI) were compared. The difference in the mean WSS values between the two finest meshes was less than 3%, indicating that the solution had reached mesh convergence. Therefore, the mesh with 2.8 mln elements was selected for the final simulations

3. Results and Discussion

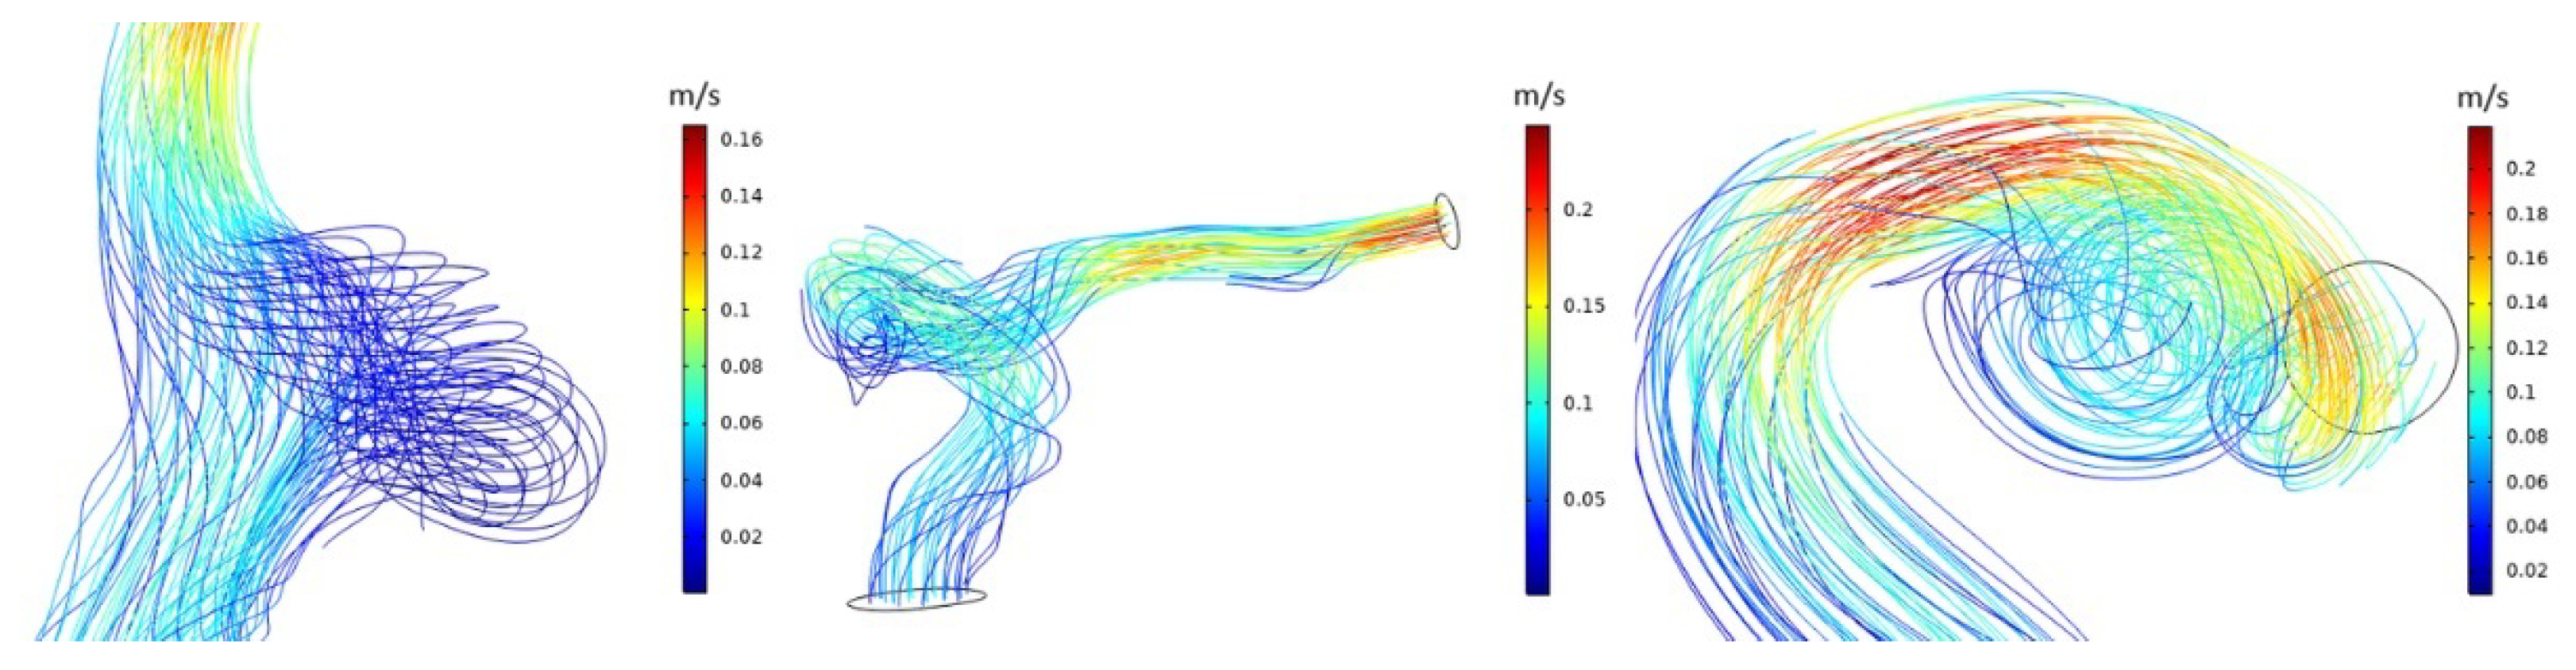
The simulation results for the three models included velocity distribution, WSS, TAWSS, OSI, and RRT. The velocity streamlines for all models are presented in Figure 9. As observed in the Figure 9, Model 3 exhibits higher flow velocities both at the inlet and the outlet of the aneurysm. This may be attributed to the higher heart rate used in this model, which results in more frequent and forceful pulsatile flow.
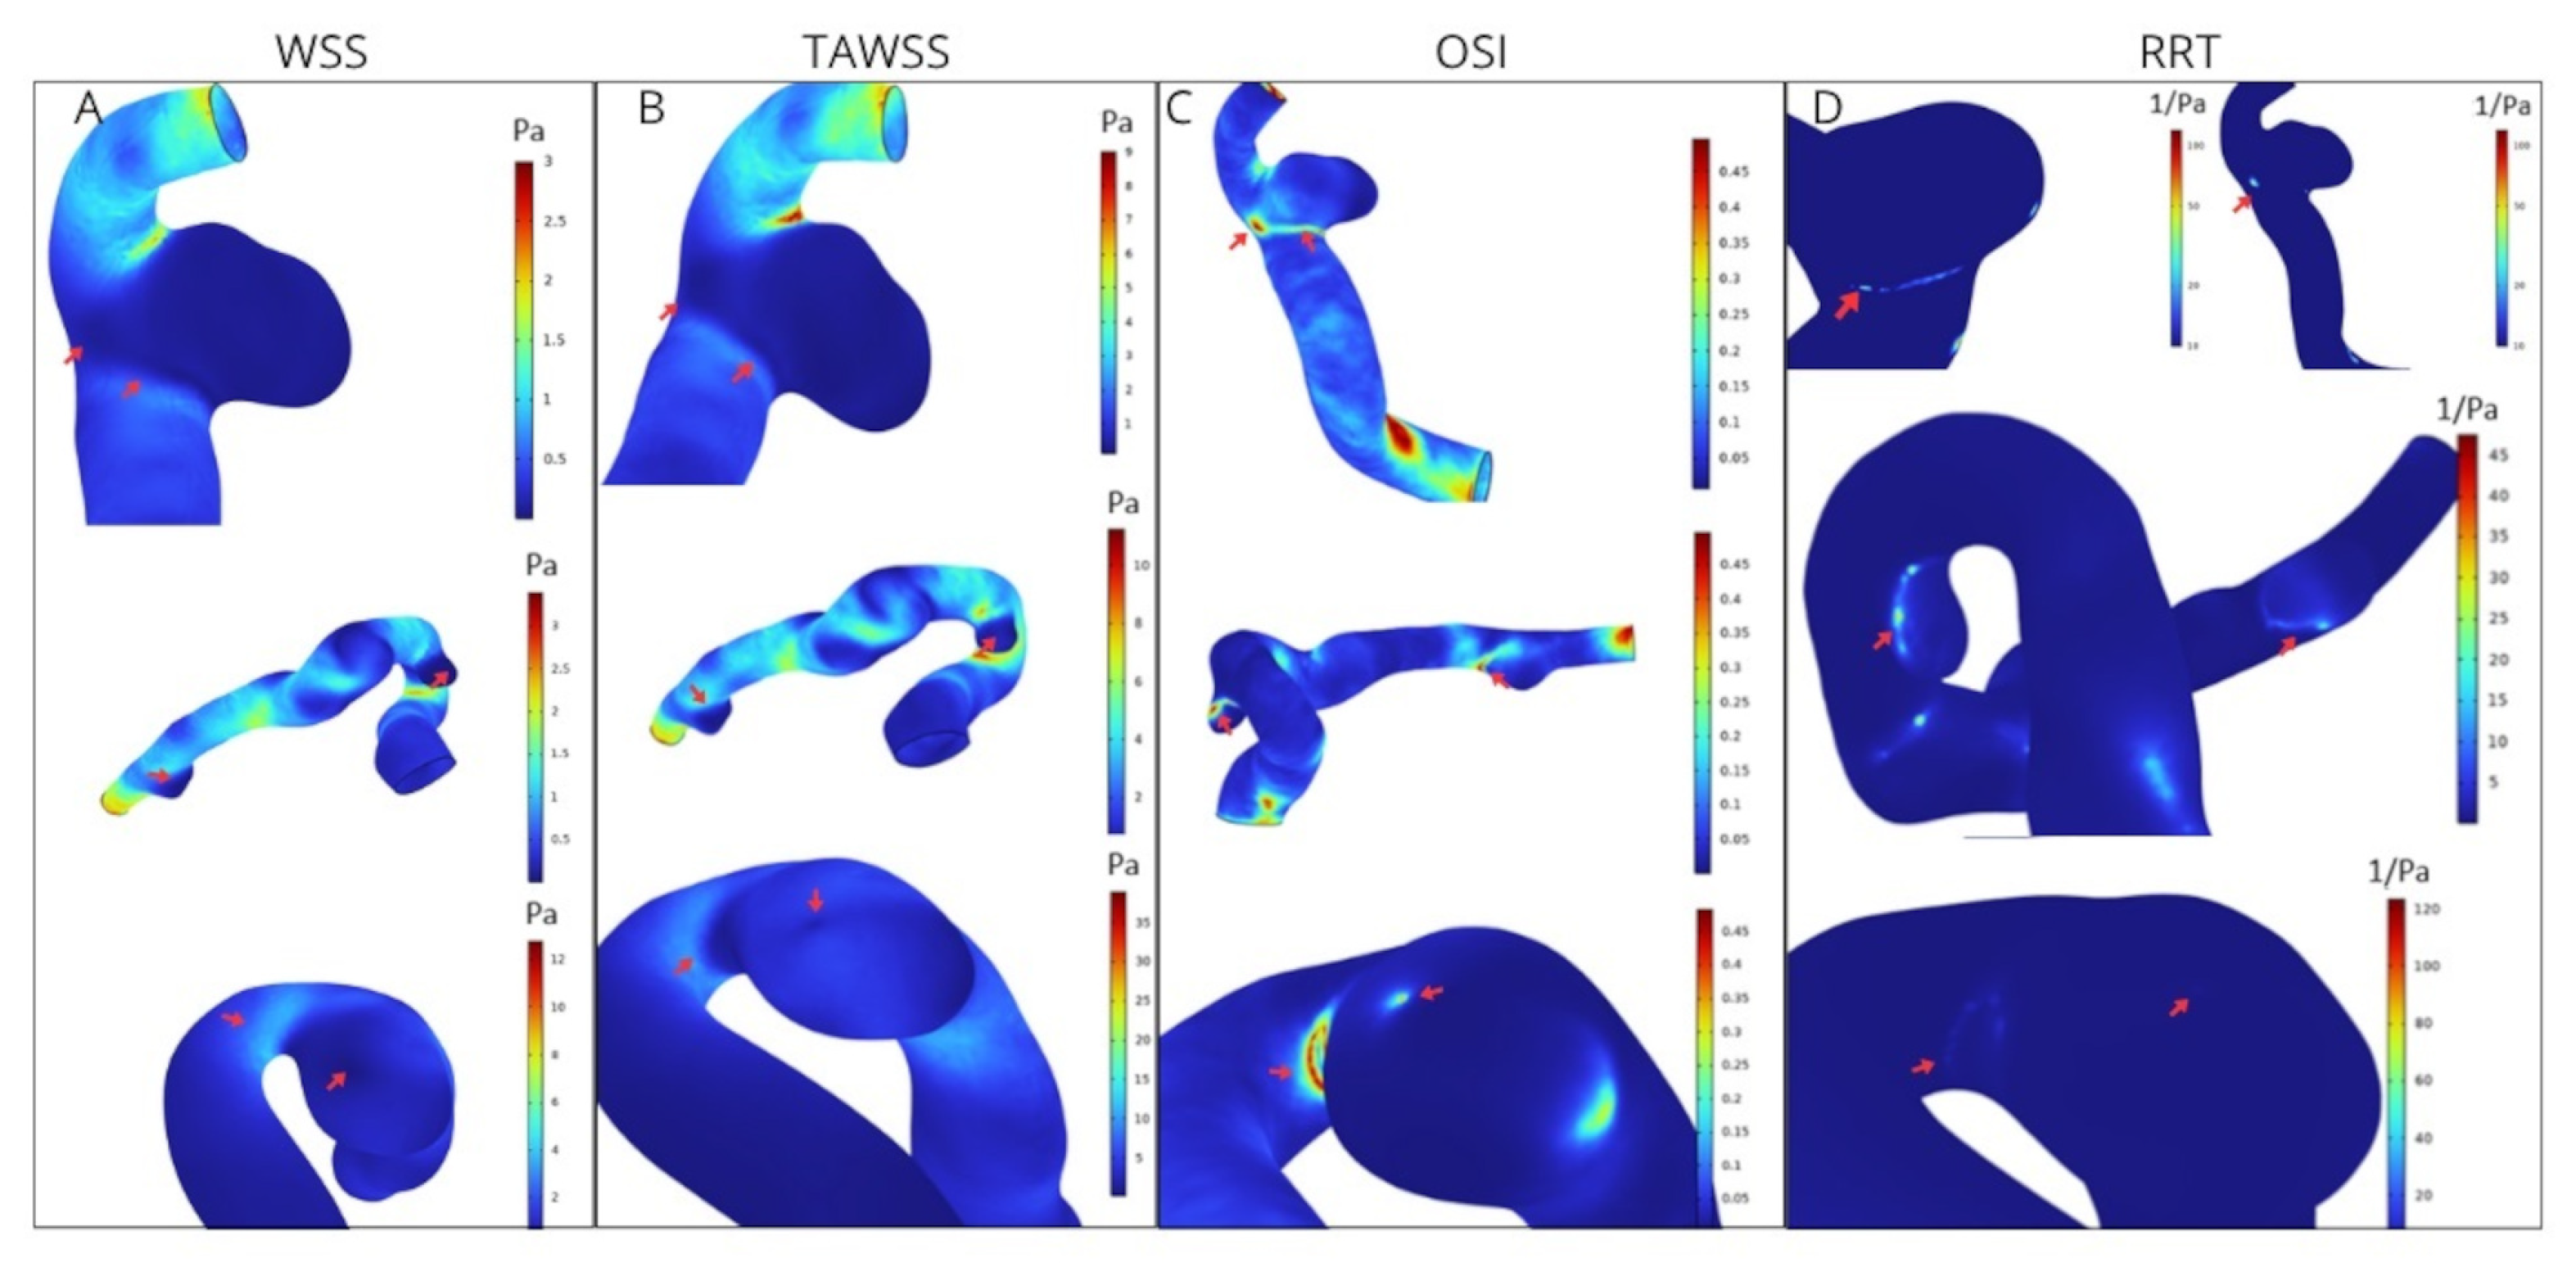
Figure 10 presents the simulation results for all three aneurysm models, displaying distributions of WSS, TAWSS, OSI, and RRT across the vascular geometries. The WSS distributions show spatial variations in the shear forces on the vessel walls. In all models, low WSS values are observed in the aneurysmal sacs. The TAWSS reveals a similar pattern, with a reduced shear stress consistently found within the aneurysm domes, particularly in the regions marked by red arrows. Areas with low WSS and TAWSS correspond to elevated OSI values, and this may indicate altered blood flow in those specific regions. A pronounced increase in RRT is evident in the same regions where low WSS/TAWSS and high OSI are observed. The red arrows in all panels highlight the critical regions where these hemodynamic indicators are located.
Based on the aspect ratio results (Table 1), the MCA aneurysm in Model 2 can be classified as high-risk, with an aspect ratio of 1.94. According to the literature [19], aneurysms with an aspect ratio greater than 1.89 are considered to fall within a high-risk category. The other aneurysms, based on aspect ratio alone, would not be categorized as high-risk. However, when evaluating the models using hemodynamic parameters, potential risk zones can be identified in all aneurysms, even in cases where the aspect ratio is relatively low. This highlights the importance of incorporating detailed hemodynamic analysis in addition to morphological assessment when evaluating aneurysm rupture risk.
As seen from the results, this study successfully analyzed and evaluated several key hemodynamic parameters related to intracranial aneurysms and their pathological condition. The simulations were conducted with an emphasis on using as many patient-specific parameters as possible to ensure higher accuracy of the results. Summarizing the findings across all three models, no extremely high values of WSS or TAWSS were observed. However, elevated OSI and RRT values were noted in specific regions—particularly where WSS and TAWSS were low. These observations align with trends reported in the literature, which often associate low shear stress and high oscillatory behavior with increased risk of aneurysm progression and rupture. Numerous scientific studies have explored the hemodynamics of ruptured aneurysms in an effort to improve rupture risk assessment. Nevertheless, studies diverge on the precise significance of WSS in forecasting rupture risk. As a result, many researchers remain skeptical about the reliability of using WSS alone as a predictive indicator for intracranial aneurysm rupture.
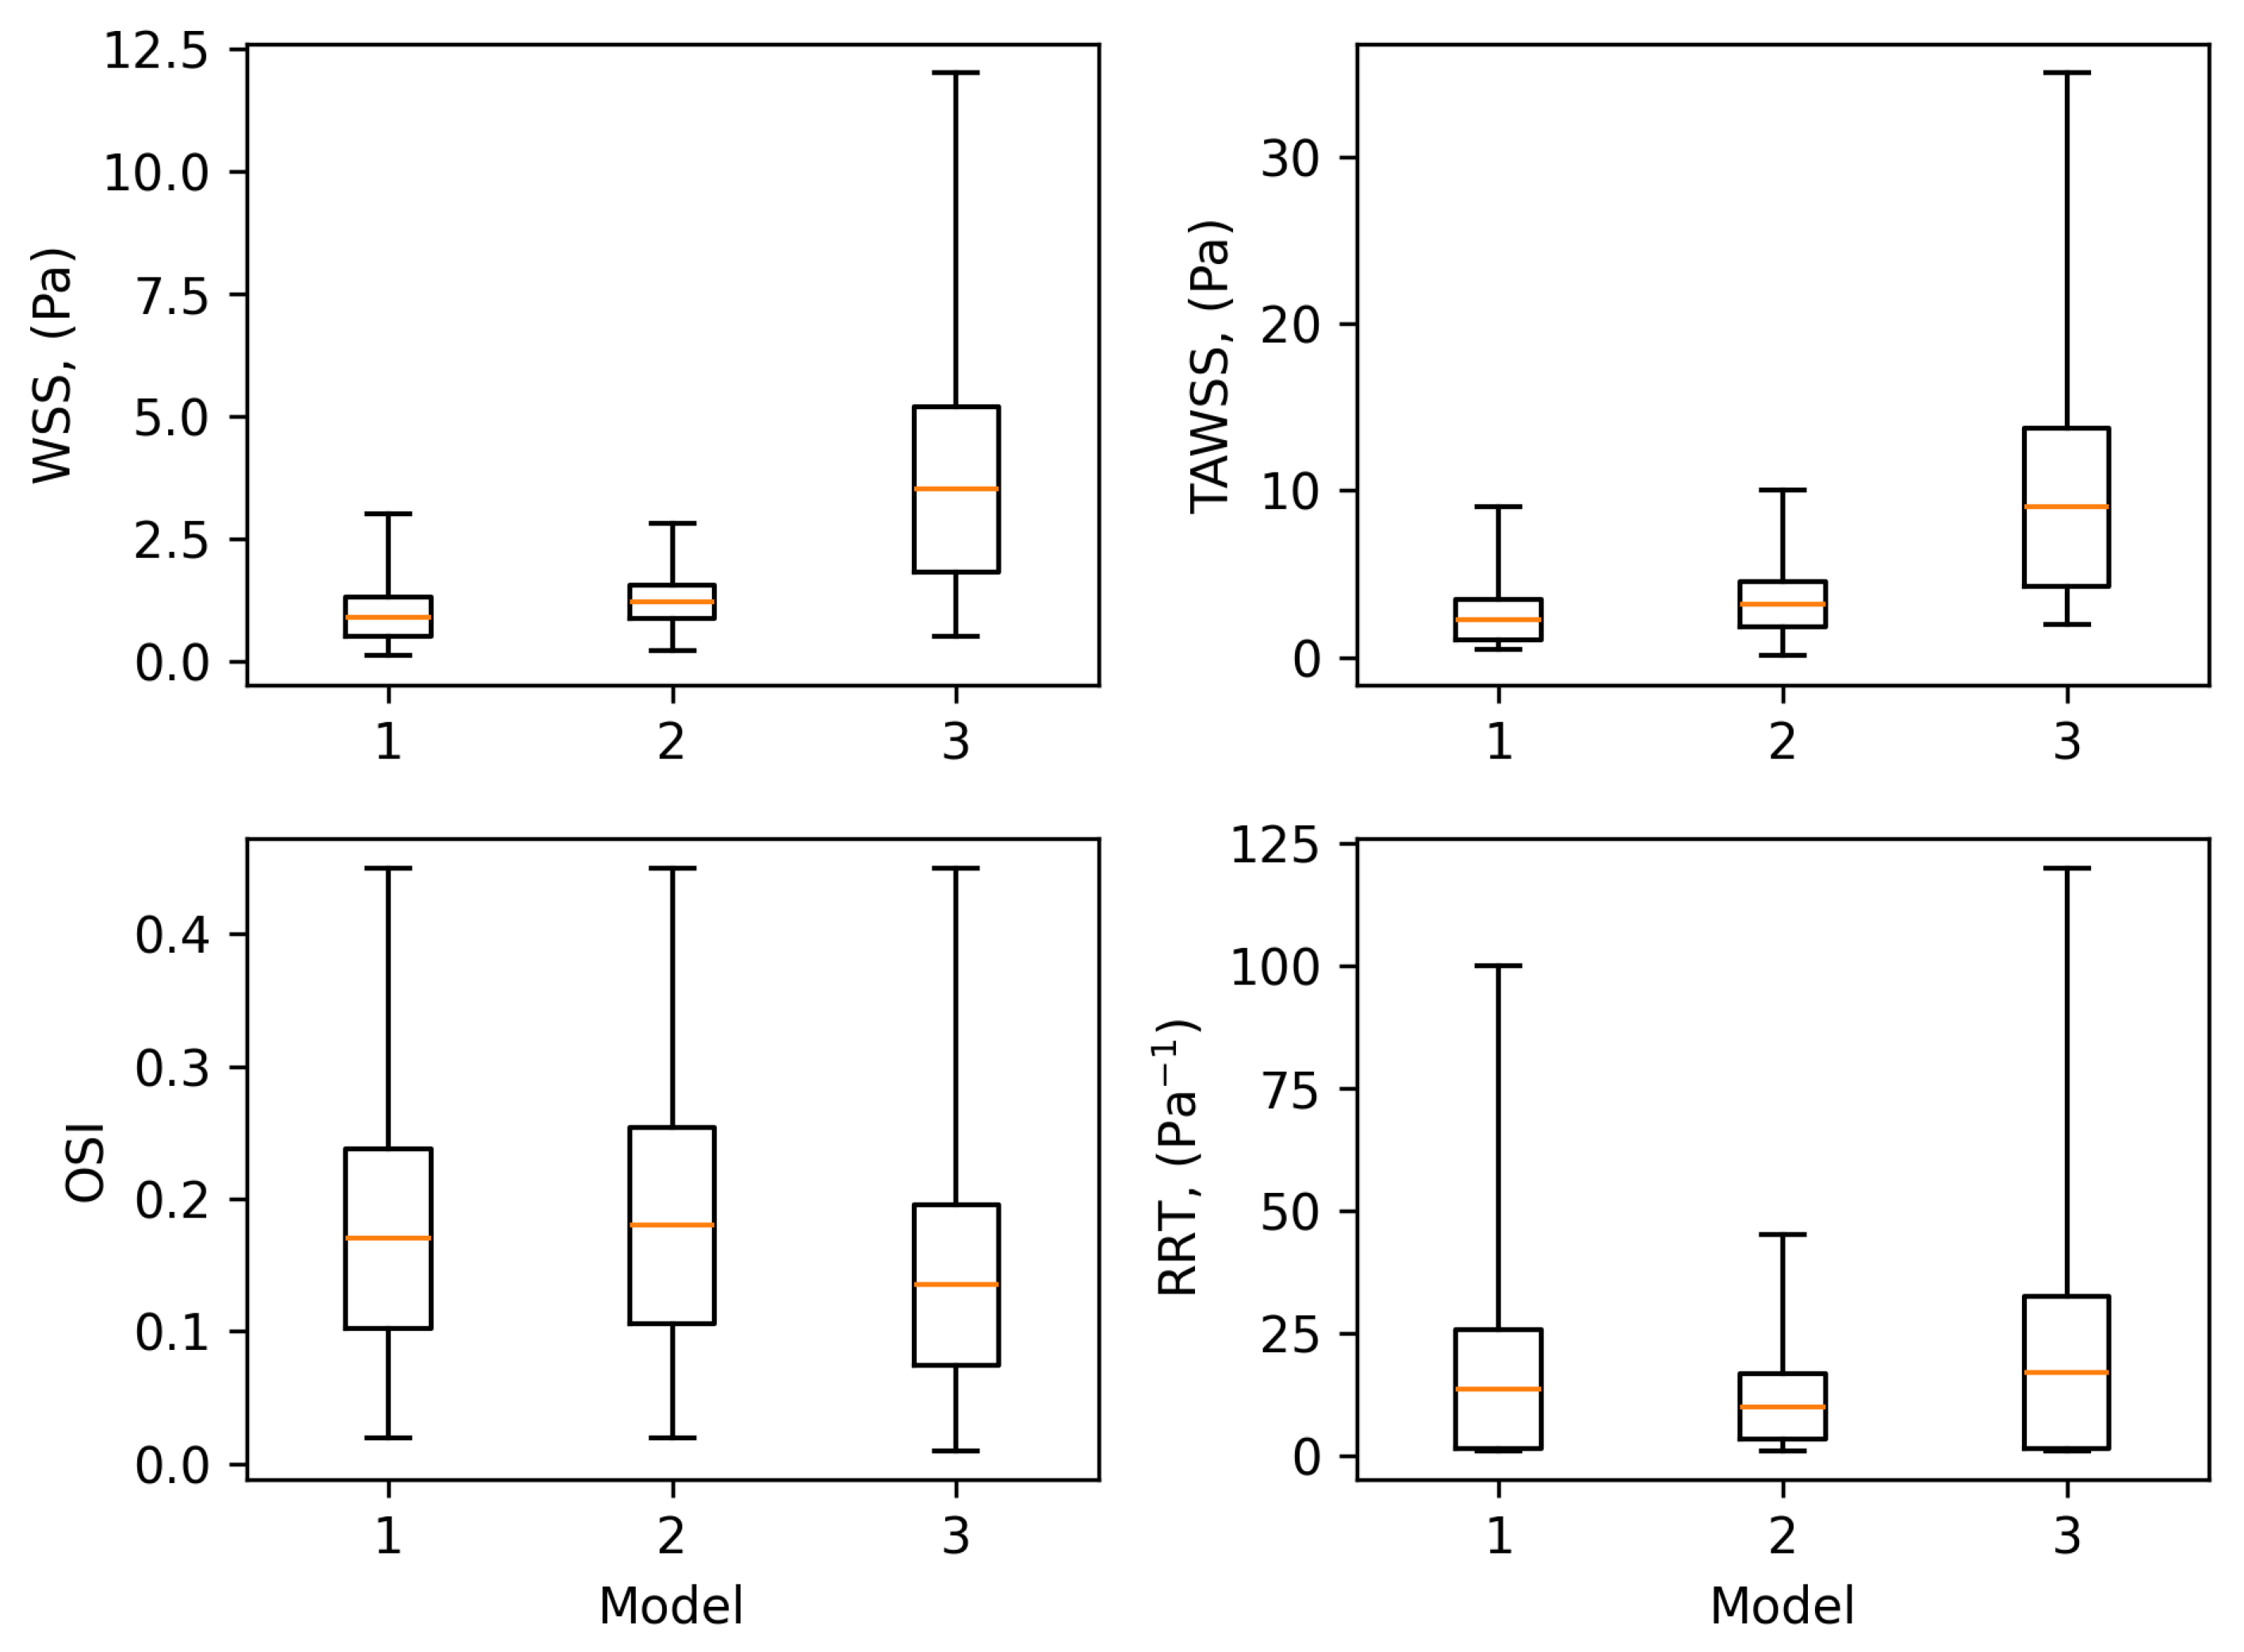
In addition to qualitative visualization, quantitative metrics of hemodynamic parameters were evaluated for each aneurysm model. Table 4 and Figure 11 summarizes the min, max, mean, peak, and standard deviation values of WSS, TAWSS, OSI, and RRT. Although statistical comparisons are not appropriate due to the limited number of models, these metrics provide a comparative overview of the hemodynamic environments present within the analyzed aneurysm geometries.
Quantitative comparison of the hemodynamic parameters indicates that aneurysm Model 1 exhibits the lowest mean wall shear stress (WSS), reflecting a predominantly low-shear environment within the aneurysm sac. Models 1 and 2 show relatively higher oscillatory shear index (OSI) values, suggesting more pronounced oscillatory flow behavior compared with Model 3. In contrast, Model 3 demonstrates the highest peak WSS values, reaching approximately 12 Pa, which are primarily localized near the aneurysm neck and inflow impingement region. These results indicate that variations in aneurysm geometry produce distinct hemodynamic environments, ranging from low-shear recirculating flow conditions to localized high-shear impingement zones.
Current understanding of WSS’s role in aneurysm progression and rupture is shaped by two prevailing hypotheses. One suggests that high WSS is strongly associated with aneurysm rupture, as elevated shear stress on the aneurysmal wall can stimulate abnormal endothelial cell remodeling, leading to aneurysm expansion and ultimately rupture. The other hypothesis proposes that low WSS combined with high OSI may also be linked to increased rupture risk. These regions are typically characterized by slower blood flow, prolonged particle residence near the wall, and potentially accelerated degenerative changes in the vessel wall. Thus, low WSS and TAWSS values within the aneurysmal region may serve as potential indicators of higher rupture risk. Reduced mechanical stimulation (i.e., low shear stress) may cause endothelial dysfunction and contribute to gradual weakening of the vessel wall structure [20,21]. While RRT has not yet been extensively studied, it is increasingly recognized as an important hemodynamic parameter in the evaluation of aneurysmal flow environments. RRT is closely related to two key variables—TAWSS and OSI—and tends to be elevated in regions with low TAWSS and high OSI, indicating areas where blood particles remain longer and flow becomes disrupted [21]. In one of the studies, the researchers aimed to evaluate maximum pressure and WSS at the rupture point of a previously ruptured intracranial aneurysm (IA). These hemodynamic parameters were compared to intraoperative images showing wall thinning regions. The results indicated that areas with elevated pressure corresponded to reduced WSS and thinner vessel walls. Moreover, the aneurysms studied tended to have irregular shapes. In comparison to the results of our study, several regions exhibited low WSS and TAWSS, which may suggest hemodynamic vulnerability [22]. Both high and low WSS can play important but distinct roles at different stages of aneurysm initiation and progression. Therefore, WSS should be interpreted in conjunction with other hemodynamic indicators. The authors emphasize that OSI is one of the most critical hemodynamic parameters in the evaluation of IA dynamics [23]. In an experimental study, compared hemodynamic CFD parameters between rupture sites and the remaining regions of a ruptured aneurysm, researches found that rupture sites were characterized by low TAWSS ( 0.65 Pa), elevated OSI ( 0.09), and increased RRT ( 0.19 Pa−1), with flow velocity around 0.2 m/s [18]. In comparison, our study also showed that regions with low TAWSS coincided with increased OSI and RRT across all three models. However, the observed flow velocities in this study were lower, averaging around 0.1 m/s. In other study it was also found that aneurysm rupture risk is associated with elevated OSI and reduced WSS. The flow velocity in ruptured aneurysms, reaching approximately 0.2 m/s, was observed to be disturbed and non-uniform. In addition to hemodynamic parameters, morphological features were analyzed—specifically neck width, aspect ratio, and the presence of daughter sacs—which were all identified as potential risk factors for aneurysm rupture. Based on these findings, a predictive model for aneurysm rupture was developed [24]. In comparison, our study also considered both hemodynamic parameters (e.g., high OSI, low WSS) and geometric characteristic such as aspect ratio. The results indicate that, based on hemodynamic indicators alone, potential risk regions were observed in all three aneurysm models, whereas only one out of four aneurysms would be classified as high-risk based on geometric criteria alone.
Another study analyzed 48 intracranial aneurysms (10 ruptured and 38 unruptured) and identified aneurysm size as a statistically significant factor in rupture risk. The study also assessed OSI and RRT, reporting elevated values of both parameters in ruptured aneurysms [25]. While our study did not include ruptured aneurysms, the findings are consistent with literature, as regions with increased OSI and RRT were identified across all three patient-specific models. Other scientists in their research investigated the relationship between hemodynamic and morphological parameters by comparing values before and after aneurysm growth. They observed a significant decrease in WSS and an increase in OSI following aneurysm enlargement, particularly in areas where WSS was already low, that may suggest a higher likelihood of rupture after growth [7]. Although our study did not compare pre- and post-growth conditions, the same pattern of low WSS and elevated OSI was observed in specific regions of the aneurysm models.
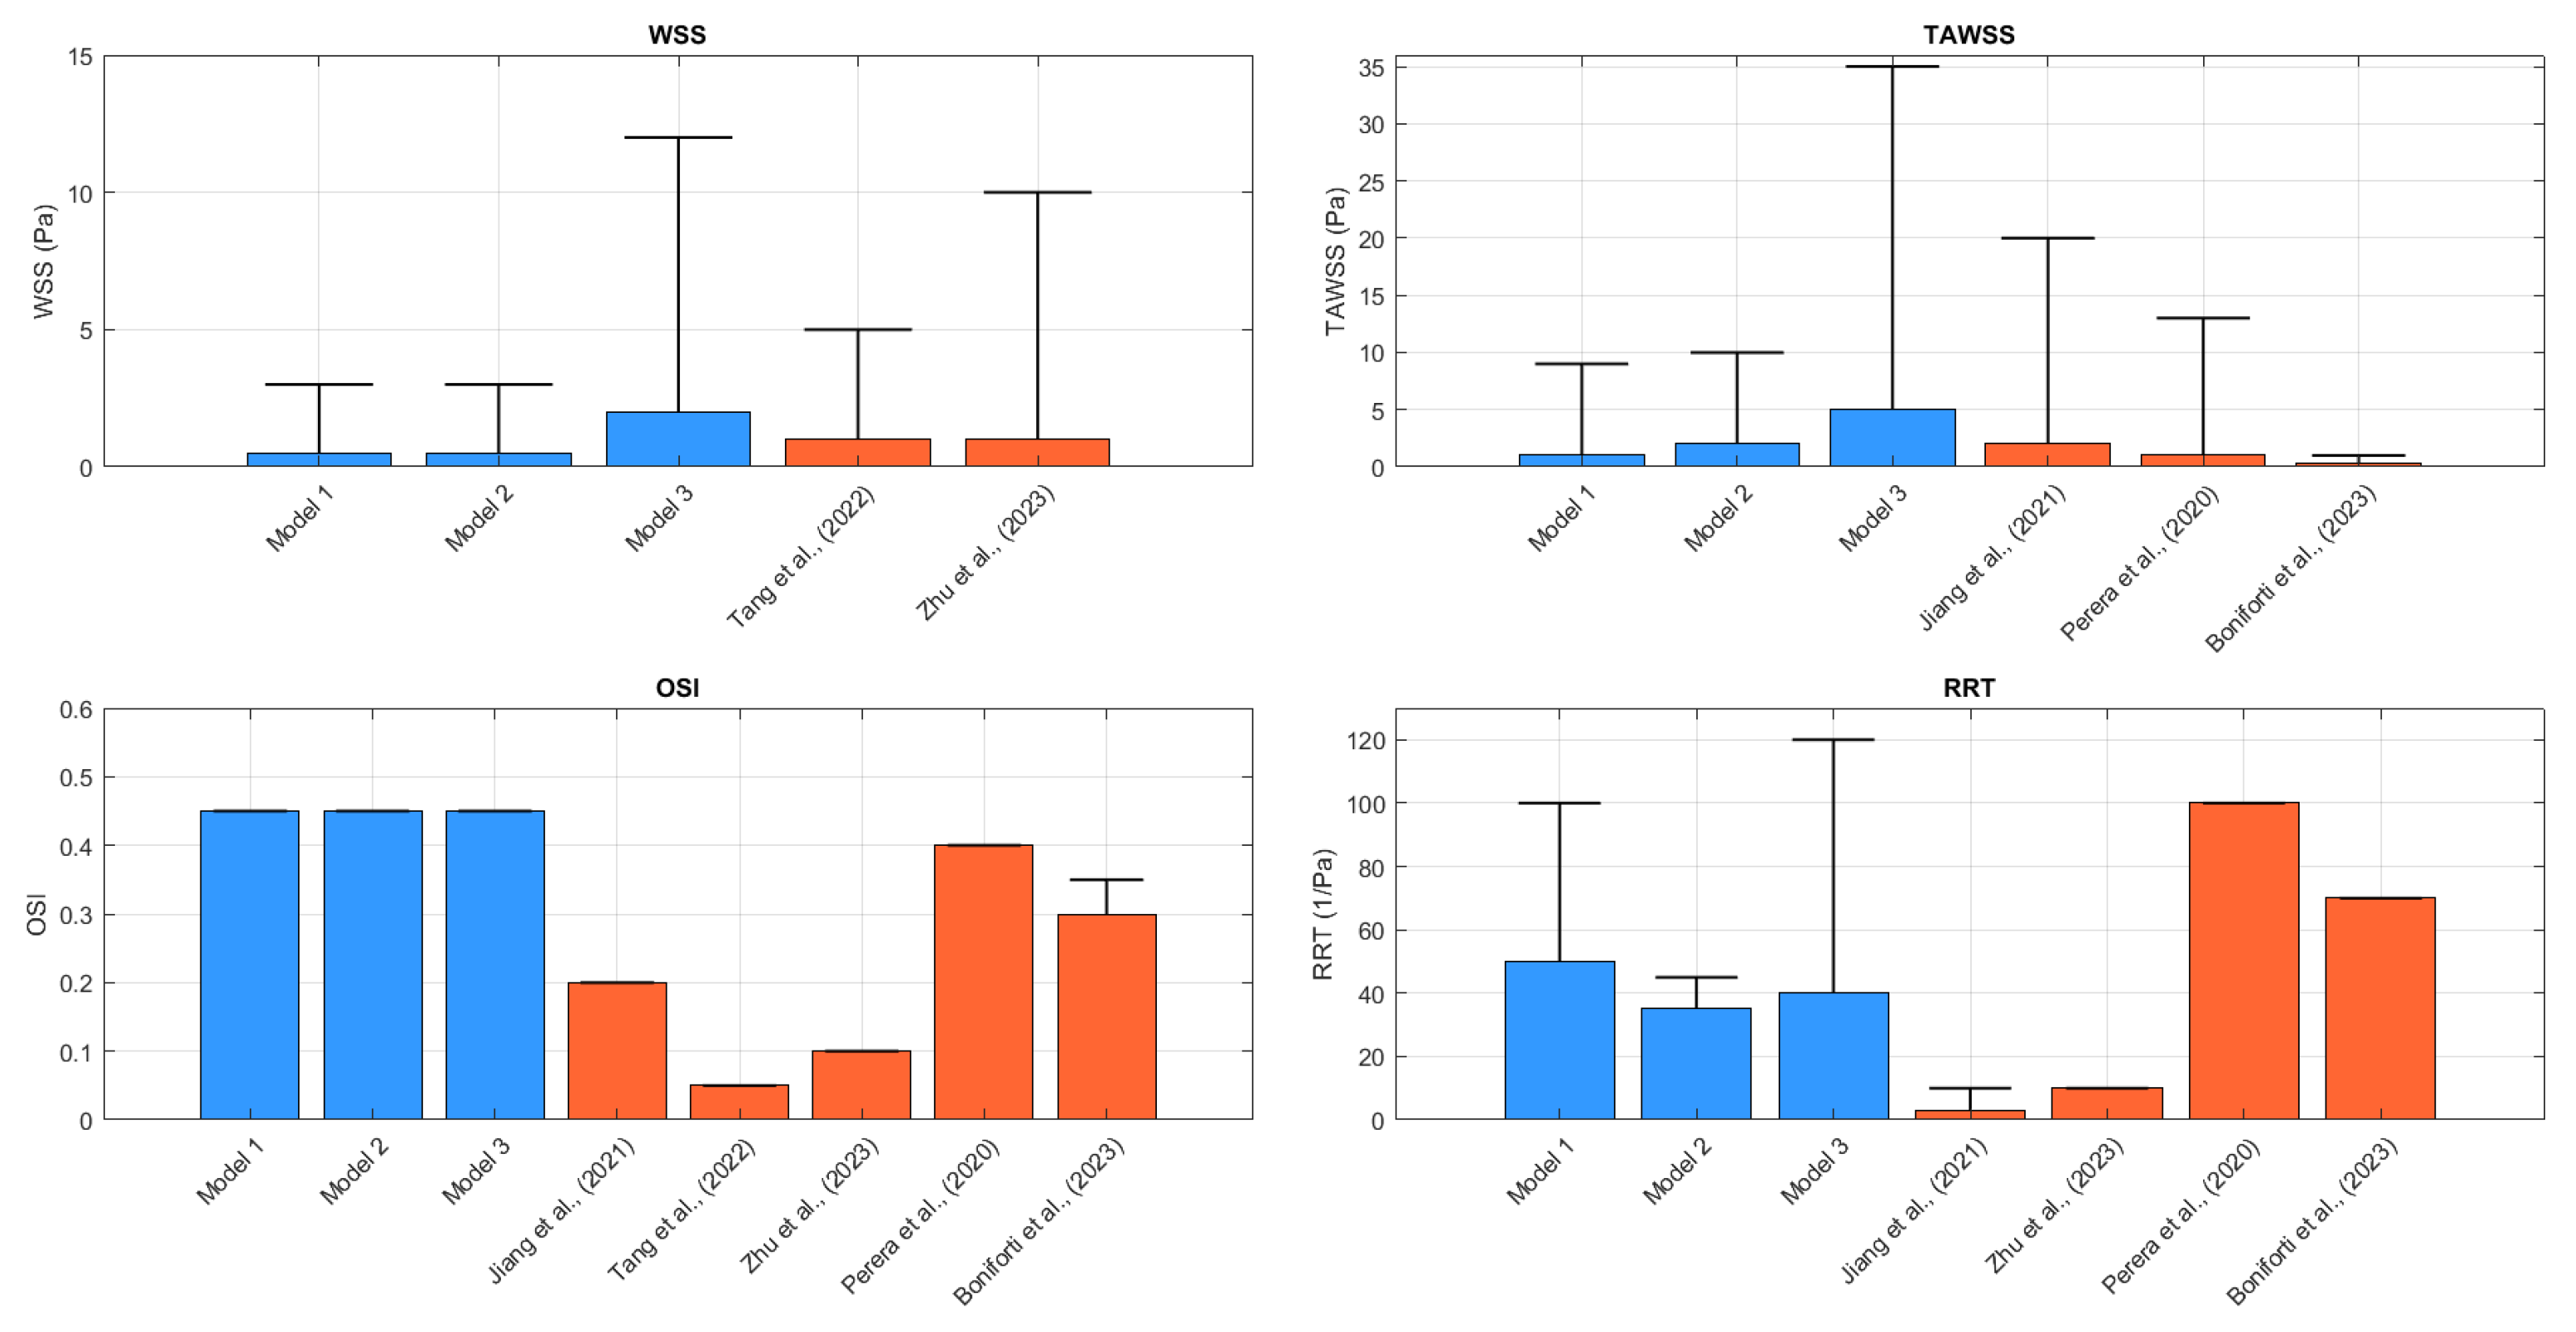
A comparative summary of WSS, TAWSS, OSI, and RRT values in potentially critical regions, based on this study and prior literature, is shown in Figure 12. Across all sources, the predominant trend remains: low TAWSS and WSS, and increased OSI and RRT. When comparing the maximum values of the results with those reported in previous studies, some values appear to be similar, while others show notable differences. These differences are summarized in Table 5. The observed discrepancies may be attributed to variations in boundary conditions, as well as the use of different patient-specific data across studies.
Previous studies have suggested two major hemodynamic pathways associated with intracranial aneurysm initiation, growth, and rupture. The first pathway involves persistently low wall shear stress (WSS) combined with elevated oscillatory shear index (OSI) and prolonged flow residence time, conditions that may promote endothelial dysfunction, inflammatory cell infiltration, and progressive weakening of the vessel wall. This mechanism has been associated with aneurysm growth and rupture in several computational and clinical studies (e.g., [13,27]).
A second pathway involves localized regions of abnormally high WSS, typically occurring near the aneurysm neck or impingement zones where the inflow jet impacts the aneurysm wall. Elevated WSS may lead to endothelial damage, degradation of the internal elastic lamina, and vascular remodeling that contributes to aneurysm initiation and morphological evolution [12,27].
In the present simulations, both hemodynamic patterns were observed depending on aneurysm geometry. Regions of reduced WSS and increased OSI were primarily located within the aneurysm dome where flow recirculation occurred, whereas elevated WSS values appeared near the aneurysm neck in areas of strong inflow impingement. These findings further support the hypothesis that local vascular morphology plays a dominant role in shaping intra-aneurysmal hemodynamic environments.

Limitations

Like any study, this research has certain limitations. The results were obtained using the maximum available computational resources to ensure the highest possible accuracy and realism. To further improve the precision of the simulations for each patient-specific IA model, it would be necessary to obtain individualized blood viscosity, blood flow velocity (measured by Doppler ultrasound) and a more accurate pressure waveform at the outlet. Furthermore, achieving higher fidelity would benefit from an increased number of time steps and cardiac cycles, although this would also require more simulation time and computational power. The fluid–structure interaction (FSI) method, which accounts for the interaction between blood flow and the motion of the arterial wall, could further improve the precision by incorporating wall deformation into the model. It is important to continue developing and expanding the use of CFD-based techniques to make them faster, more accessible, and more practical for clinical application.
Several simplifying physical assumptions were adopted in the present study. Blood was modeled as a Newtonian fluid and the vessel walls were assumed to be rigid. Although these assumptions are commonly used in computational studies of intracranial aneurysms, they may influence the quantitative values of certain hemodynamic parameters. In particular, rigid-wall models neglect vascular compliance, which can dampen pulsatile flow and reduce near-wall velocity gradients. As a result, simulations assuming rigid walls may slightly overestimate wall shear stress (WSS) compared with fluid–structure interaction (FSI) models that account for vessel deformation [28].
The Newtonian approximation may also introduce minor differences, particularly in regions of low shear rate within aneurysm sacs where blood exhibits non-Newtonian behavior. In such regions, shear-thinning properties of blood may affect local viscosity and consequently influence recirculation patterns and WSS magnitude. Nevertheless, previous studies have shown that for large cerebral arteries the Newtonian approximation provides reasonably accurate predictions of the overall flow structure and hemodynamic trends [29].
Another limitation of the present study is the small number of analyzed aneurysm cases (N = 3). While the models were reconstructed from patient-specific imaging data, the limited sample size restricts the possibility of drawing statistically generalizable conclusions regarding aneurysm rupture risk. Therefore, the present work should be interpreted as an exploratory computational analysis aimed at illustrating hemodynamic characteristics that may occur in anatomically realistic aneurysm geometries. Larger cohort studies combining patient-specific imaging, clinical data, and computational modeling would be required to establish statistically robust correlations between hemodynamic parameters and rupture risk.

4. Conclusions

When comparing the hemodynamic parameters obtained, it is evident that potential risk zones can be identified in all the models analyzed. The characteristics of the hemodynamic parameters are consistent with those discussed in the literature: areas with low WSS and TAWSS are typically associated with elevated OSI and RRT. In this study, the WSS values in the potential critical regions (where WSS and TAWSS are low and OSI and RRT are higher) ranged from approximately 0.5 to 2 Pa, TAWSS from 1 to 5 Pa, OSI around 0.45, and RRT between 35 and 50 Pa−1. In comparison, studies by other authors reported WSS around 1 Pa, TAWSS between 0.03 and 2 Pa, OSI values ranging from 0.05 to 0.4, and RRT from 3 to 100 Pa−1 in similar potentially critical areas. Analysis of blood velocity distributions within the aneurysms revealed that Model 3 exhibited slightly higher flow velocities at both the inlet and outlet of the aneurysm. In contrast, the flow velocities in the other models were relatively low. In all cases, the flow within the aneurysmal domes was noticeably slower. The results of the hemodynamic parameters obtained were compared with the geometric parameters available by analyzing the aspect ratio (depth to neck width) of the aneurysms. It was found that, based on geometric parameters alone, one aneurysm falls into the high-risk category, the left ICA aneurysm in Model 2. Its neck is significantly narrower than its depth, resulting in particularly slow blood flow, low wall shear stress, and a higher likelihood of wall degradation. Although the geometric parameters of the other aneurysms do not place them in the high-risk category, when combined with hemodynamic parameters, these aneurysms should still be monitored more frequently, especially the ICA aneurysm in Model 2.
Because only three patient-specific aneurysm models were analyzed, the results should be interpreted as exploratory observations rather than statistically generalizable predictors of aneurysm rupture risk.
Combining clinical data, aneurysm geometry, and hemodynamic characteristics can provide clinicians with valuable additional information to support decision-making in selecting the most appropriate treatment strategy.


Author Contributions

Conceptualization, A.M. and J.M.; methodology, A.M.; software, J.M.; validation, A.M. and J.M.; formal analysis, A.M.; investigation, J.M.; resources, A.M.; data curation, A.M.; writing—original draft preparation, J.M.; writing—review and editing, A.M.; visualization, J.M.; supervision, A.M.; project administration, A.M.; funding acquisition, A.M. All authors have read and agreed to the published version of the manuscript.

Funding

This research received no external funding.

Institutional Review Board Statement

This study was approved by the Vilnius University Hospital Santaros Clinics Biomedical Research Ethics Committee (approval numbers SR-2970, issued on 29 April 2024, and 24VR-3303, issued on 9 April 2024). All imaging data were fully anonymized prior to analysis. The research was conducted in accordance with institutional guidelines and the principles of the Declaration of Helsinki.

Informed Consent Statement

Written informed consent for the use of anonymized medical imaging data for scientific research was obtained from all participating patients.

Data Availability Statement

The data presented in this study are available on request from the corresponding author.

Acknowledgments

The work has been accomplished by using computational resources in VilniusTech cloud.

Conflicts of Interest

The authors declare no potential conflicts of interest.

References

  1. Faluk, M.; Das, J.M.; De Jesus, O. Saccular aneurysm. In StatPearls [Internet]; StatPearls Publishing: Treasure Island, FL, USA, 2024. [Google Scholar]
  2. Zhao, J.; Lin, H.; Summers, R.; Yang, M.; Cousins, B.G.; Tsui, J. Current treatment strategies for intracranial aneurysms: An overview. Angiology 2018, 69, 17–30. [Google Scholar] [CrossRef] [Scilit]
  3. Korja, M.; Kaprio, J. Controversies in epidemiology of intracranial aneurysms and SAH. Nat. Rev. Neurol. 2016, 12, 50–55. [Google Scholar] [CrossRef] [Scilit]
  4. Muhib, F.; Islam, M.D.; Arafat, M.T. A study on the computational hemodynamic and mechanical parameters for understanding intracranial aneurysms of patients with hypertension and atrial fibrillation. Inform. Med. Unlocked 2022, 32, 101031. [Google Scholar] [CrossRef] [Scilit]
  5. Heo, J.; Park, S.J.; Kang, S.H.; Oh, C.W.; Bang, J.S.; Kim, T. Prediction of intracranial aneurysm risk using machine learning. Sci. Rep. 2020, 10, 6921. [Google Scholar] [CrossRef] [Scilit] [PubMed]
  6. Brain Aneurysm. Available online: https://smegenuaneurizma.lt/ (accessed on 1 March 2025).
  7. Cornelissen, B.M.; Leemans, E.L.; Slump, C.H.; van den Berg, R.; Marquering, H.A.; Majoie, C.B. Hemodynamic changes after intracranial aneurysm growth. J. Neurosurg. 2021, 136, 1738–1744. [Google Scholar] [CrossRef] [Scilit]
  8. Cebral, J.R.; Mut, F.; Chung, B.J.; Spelle, L.; Moret, J.; Van Nijnatten, F.; Ruijters, D. Understanding angiography-based aneurysm flow fields through comparison with computational fluid dynamics. Am. J. Neuroradiol. 2017, 38, 1180–1186. [Google Scholar] [CrossRef] [Scilit]
  9. Rayz, V.L.; Cohen-Gadol, A.A. Hemodynamics of cerebral aneurysms: Connecting medical imaging and biomechanical analysis. Annu. Rev. Biomed. Eng. 2020, 22, 231–256. [Google Scholar] [CrossRef] [Scilit]
  10. Kwak, Y.; Son, W.; Kim, Y.S.; Park, J.; Kang, D.H. Discrepancy between MRA and DSA in identifying the shape of small intracranial aneurysms. J. Neurosurg. 2020, 134, 1887–1893. [Google Scholar] [CrossRef] [Scilit] [PubMed]
  11. Steinman, D.; Milner, J.; Norley, C.; Lownie, S.; Holdsworth, D. Image-based computational simulation of flow dynamics in a giant intracranial aneurysm. AJNR Am. J. Neuroradiol. 2003, 24, 559–566. [Google Scholar]
  12. Cebral, J.; Castro, M.; Burgess, J.; Pergolizzi, R.; Sheridan, M.; Putman, C. Characterization of cerebral aneurysms for assessing risk of rupture by using patient-specific computational hemodynamics models. AJNR Am. J. Neuroradiol. 2005, 26, 2550–2559. [Google Scholar]
  13. Xiang, J.; Natarajan, S.; Tremmel, M.; Ma, D.; Mocco, J.; Hopkins, L.; Siddiqui, A.; Levy, E.; Meng, H. Hemodynamic-morphologic discriminants for intracranial aneurysm rupture. Stroke 2011, 42, 144–152. [Google Scholar] [CrossRef] [Scilit] [PubMed]
  14. Saqr, K.M. Computational fluid dynamics simulations of cerebral aneurysm using Newtonian, power-law and quasi-mechanistic blood viscosity models. Proc. Inst. Mech. Eng. Part H J. Eng. Med. 2020, 234, 711–719. [Google Scholar] [CrossRef] [Scilit]
  15. COMSOL AB. COMSOL Multiphysics®, v. 6.3; COMSOL AB.: Stockholm, Sweden, 2024. Available online: https://www.comsol.com/release/6.3 (accessed on 1 March 2025).
  16. Charlton, P.H.; Mariscal Harana, J.; Vennin, S.; Li, Y.; Chowienczyk, P.; Alastruey, J. Modeling arterial pulse waves in healthy aging: A database for in silico evaluation of hemodynamics and pulse wave indexes. Am. J. Physiol.-Heart Circ. Physiol. 2019, 317, H1062–H1085. [Google Scholar]
  17. Wu, X.; Gürzing, S.; Schinkel, C.; Toussaint, M.; Perinajová, R.; Van Ooij, P.; Kenjereš, S. Hemodynamic study of a patient-specific intracranial aneurysm: Comparative assessment of tomographic PIV, stereoscopic PIV, in vivo MRI and computational fluid dynamics. Cardiovasc. Eng. Technol. 2022, 13, 428–442. [Google Scholar] [PubMed]
  18. Jiang, Y.; Lu, G.; Ge, L.; Huang, L.; Wan, H.; Wan, J.; Zhang, X. Rupture point hemodynamics of intracranial aneurysms: Case report and literature review. Ann. Vasc.-Surg.-Brief Rep. Innov. 2021, 1, 100022. [Google Scholar]
  19. Wang, G.X.; Zhang, D.; Wang, Z.P.; Yang, L.Q.; Yang, H.; Li, W. Risk factors for ruptured intracranial aneurysms. Indian J. Med. Res. 2018, 147, 51–57. [Google Scholar] [CrossRef] [Scilit]
  20. Murayama, Y.; Fujimura, S.; Suzuki, T.; Takao, H. Computational fluid dynamics as a risk assessment tool for aneurysm rupture. Neurosurg. Focus 2019, 47, E12. [Google Scholar] [CrossRef] [Scilit]
  21. Riccardello, G.J., Jr.; Shastri, D.N.; Changa, A.R.; Thomas, K.G.; Roman, M.; Prestigiacomo, C.J.; Gandhi, C.D. Influence of relative residence time on side-wall aneurysm inception. Neurosurgery 2018, 83, 574–581. [Google Scholar]
  22. Suzuki, T.; Stapleton, C.J.; Koch, M.J.; Tanaka, K.; Fujimura, S.; Suzuki, T.; Yanagisawa, T.; Yamamoto, M.; Fujii, Y.; Murayama, Y.; et al. Decreased wall shear stress at high-pressure areas predicts the rupture point in ruptured intracranial aneurysms. J. Neurosurg. 2019, 132, 1116–1122. [Google Scholar] [CrossRef] [Scilit]
  23. Zhu, Y.; Zou, R.; Sun, X.; Lei, X.; Xiang, J.; Guo, Z.; Su, H. Assessing the risk of intracranial aneurysm rupture using computational fluid dynamics: A pilot study. Front. Neurol. 2023, 14, 1277278. [Google Scholar] [CrossRef] [Scilit]
  24. Tang, X.; Zhou, L.; Wen, L.; Wu, Q.; Leng, X.; Xiang, J.; Zhang, X. Morphological and hemodynamic characteristics associated with the rupture of multiple intracranial aneurysms. Front. Neurol. 2022, 12, 811281. [Google Scholar] [CrossRef] [Scilit] [PubMed]
  25. Perera, R.; Isoda, H.; Ishiguro, K.; Mizuno, T.; Takehara, Y.; Terada, M.; Tanoi, C.; Naito, T.; Sakahara, H.; Hiramatsu, H.; et al. Assessing the risk of intracranial aneurysm rupture using morphological and hemodynamic biomarkers evaluated from magnetic resonance fluid dynamics and computational fluid dynamics. Magn. Reson. Med. Sci. 2020, 19, 333–344. [Google Scholar] [PubMed]
  26. Boniforti, M.A.; Magini, R.; Orosco Salinas, T. Hemodynamic investigation of the flow diverter treatment of intracranial aneurysm. Fluids 2023, 8, 189. [Google Scholar] [CrossRef] [Scilit]
  27. Meng, H.; Tutino, V.; Xiang, J.; Siddiqui, A. High WSS or Low WSS? Complex Interactions of Hemodynamics with Intracranial Aneurysm Initiation, Growth, and Rupture: Toward a Unifying Hypothesis. Am. J. Neuroradiol. 2014, 35, 1254–1262. [Google Scholar] [CrossRef] [Scilit]
  28. Jodko, D.; Jeckowski, M.; Tyfa, Z. Fluid structure interaction versus rigid-wall approach in the study of the symptomatic stenosed carotid artery: Importance of wall compliance and resilience of loose connective tissue. Int. J. Numer. Methods Biomed. Eng. 2022, 38, 3630. [Google Scholar]
  29. Fisher, C.; Rossmann, J. Effect of non-newtonian behavior on hemodynamics of cerebral aneurysms. J. Biomech. Eng. 2009, 131, 091004. [Google Scholar] [CrossRef] [Scilit] [PubMed]
Figure 1. Computational workflow used in the study.
Applsci 16 03233 g001
Figure 2. Model 1: Intracranial aneurysm located in the right internal carotid artery (ICA). (A) MRI images in axial, sagittal, and coronal anatomical planes with the aneurysmal artery highlighted in light green. (B) Segmented vascular geometry obtained from MRI data using 3D Slicer 5.2 software; non-relevant arterial branches were removed to isolate the vessel segment containing the aneurysm. (C) Surface smoothing and refinement of the segmented geometry performed using Meshmixer. (D) Final volumetric mesh used for computational fluid dynamics simulations.
Applsci 16 03233 g002
Figure 3. Model 2: Intracranial aneurysm located in the right internal carotid artery (ICA). (A) MRI images in axial, sagittal, and coronal anatomical planes with the aneurysmal artery highlighted in light green. (B) Segmented vascular geometry obtained from MRI data using 3D Slicer 5.2 software; non-relevant arterial branches were removed to isolate the vessel segment containing the aneurysm. (C) Surface smoothing and refinement of the segmented geometry performed using Meshmixer. (D) Final volumetric mesh used for computational fluid dynamics simulations.
Applsci 16 03233 g003
Figure 4. Model 3: Intracranial aneurysm located in the right internal carotid artery (ICA). (A) MRI images in axial, sagittal, and coronal anatomical planes with the aneurysmal artery highlighted in light green. (B) Segmented vascular geometry obtained from MRI data using 3D Slicer 5.2 software; non-relevant arterial branches were removed to isolate the vessel segment containing the aneurysm. (C) Surface smoothing and refinement of the segmented geometry performed using Meshmixer. (D) Final volumetric mesh used for computational fluid dynamics simulations.
Applsci 16 03233 g004
Figure 5. Calculation of the aspect ratio.
Applsci 16 03233 g005
Figure 6. IInlet and outlet boundary conditions in the three aneurysm models. The inlet corresponds to the proximal artery segment where a pulsatile velocity profile (m·s−1) was prescribed, while the outlet represents the distal boundary with a time-dependent pressure condition (Pa). Arrows indicate flow direction.
Applsci 16 03233 g006
Figure 7. Inlet pulsatile velocity waveform applied in the simulations. The curve represents the time-dependent velocity profile at the inlet boundary condition over one cardiac cycle. Velocity is expressed in meters per second (m·s−1) and time in seconds (s).
Applsci 16 03233 g007
Figure 8. Outlet pressure waveform used as a boundary condition. Pressure variation over the cardiac cycle is expressed in pascals (Pa) as a function of time (seconds, s).
Applsci 16 03233 g008
Figure 9. Velocity streamlines in the three aneurysm models obtained from transient CFD simulations. The color scale represents flow velocity magnitude in meters per second (m·s−1). Streamlines illustrate the flow structure within the aneurysm sac and parent vessel, highlighting regions of inflow impingement, recirculation, and complex vortex formation.
Applsci 16 03233 g009
Figure 10. Hemodynamic parameters obtained from CFD simulations in the three aneurysm models. (A) Wall shear stress (WSS, Pa), (B) time-averaged wall shear stress (TAWSS, Pa), (C) oscillatory shear index (OSI, dimensionless), and (D) relative residence time (RRT, Pa−1). Color maps indicate the spatial distribution of each parameter on the aneurysm surface, where blue corresponds to lower values and red indicates higher values. Localized high WSS regions are typically associated with inflow impingement zones near the aneurysm neck, while regions of low WSS combined with elevated OSI and RRT may indicate recirculating flow and increased particle residence time within the aneurysm sac.
Applsci 16 03233 g010
Figure 11. Boxplot of hemodynamic parameters calculated in the three aneurysm models.
Applsci 16 03233 g011
Figure 12. Comparison [18,23,24,25,26] of the hemodynamic parameters obtained in the present study with values reported in previous CFD studies of intracranial aneurysms.
Applsci 16 03233 g012
Table 1. Aspect ratios of aneurysms.
AneurysmDepth, h (mm)Neck Width, w (mm)Aspect Ratio
Model 1: ICA8.05.01.60
Model 2: ICA3.31.71.94
Model 2: MCA2.53.00.83
Model 3: ICA3.53.11.13
Table 2. Simulation parameters.
ParameterValue
Blood density, ρ 1060 kg/m3
Dynamic viscosity, μ 3.5 mPa·s
Temperature, K310.15 K (37 °C)
Reference pressure level1 atm (101,325 Pa)
Table 3. Time parameters used in simulation.
Aneurysm T cycle (s) Δ t (s) T total (s)
Model 110.013
Model 20.88240.0088242.6472
Model 30.58250.0058251.7475
Table 4. Summary of hemodynamic parameters calculated in the three aneurysm models. The table presents the minimum, maximum, mean, peak, and standard deviation values of wall shear stress (WSS, Pa), time-averaged wall shear stress (TAWSS, Pa), oscillatory shear index (OSI, dimensionless), and relative residence time (RRT, Pa−1).
ParameterAneurismMinMaxMeanSD
WSS (Pa)Model 10.13.00.90.6
Model 20.22.81.20.5
Model 30.5123.52.5
TAWSS (Pa)Model 10.59.02.31.8
Model 21.0103.22.0
Model 323597
OSIModel 10.020.450.170.1
Model 20.020.450.180.11
Model 30.010.450.1350.09
RRT (1/Pa)Model 1110012.520
Model 21451010
Model 311201625
Table 5. Comparison of maximum hemodynamic parameter values reported in the literature and obtained in the present study.
StudyVelocity,WSS,TAWSS,OSIRRT,
m/sPaPa Pa−1
Suzuki et al. (2019) [22]10
Jiang et al. (2021) [18]200.20100
Tang et al. (2022) [24]0.6250.05
Zhu et al. (2023) [23]0.50100.10100
Cornelissen et al. (2021) [7]0.50
Perera et al. (2020) [25]12–130.2–0.420–100
Murayama et al. (2019) [20]1.1020
Boniforti et al. (2023) [26]0.100.3570
Riccardello et al. (2018) [21]1.500.25
Model 1–30.16–0.33–129–350.4545–120
Disclaimer/Publisher’s Note: The statements, opinions and data contained in all publications are solely those of the individual author(s) and contributor(s) and not of MDPI and/or the editor(s). MDPI and/or the editor(s) disclaim responsibility for any injury to people or property resulting from any ideas, methods, instructions or products referred to in the content.