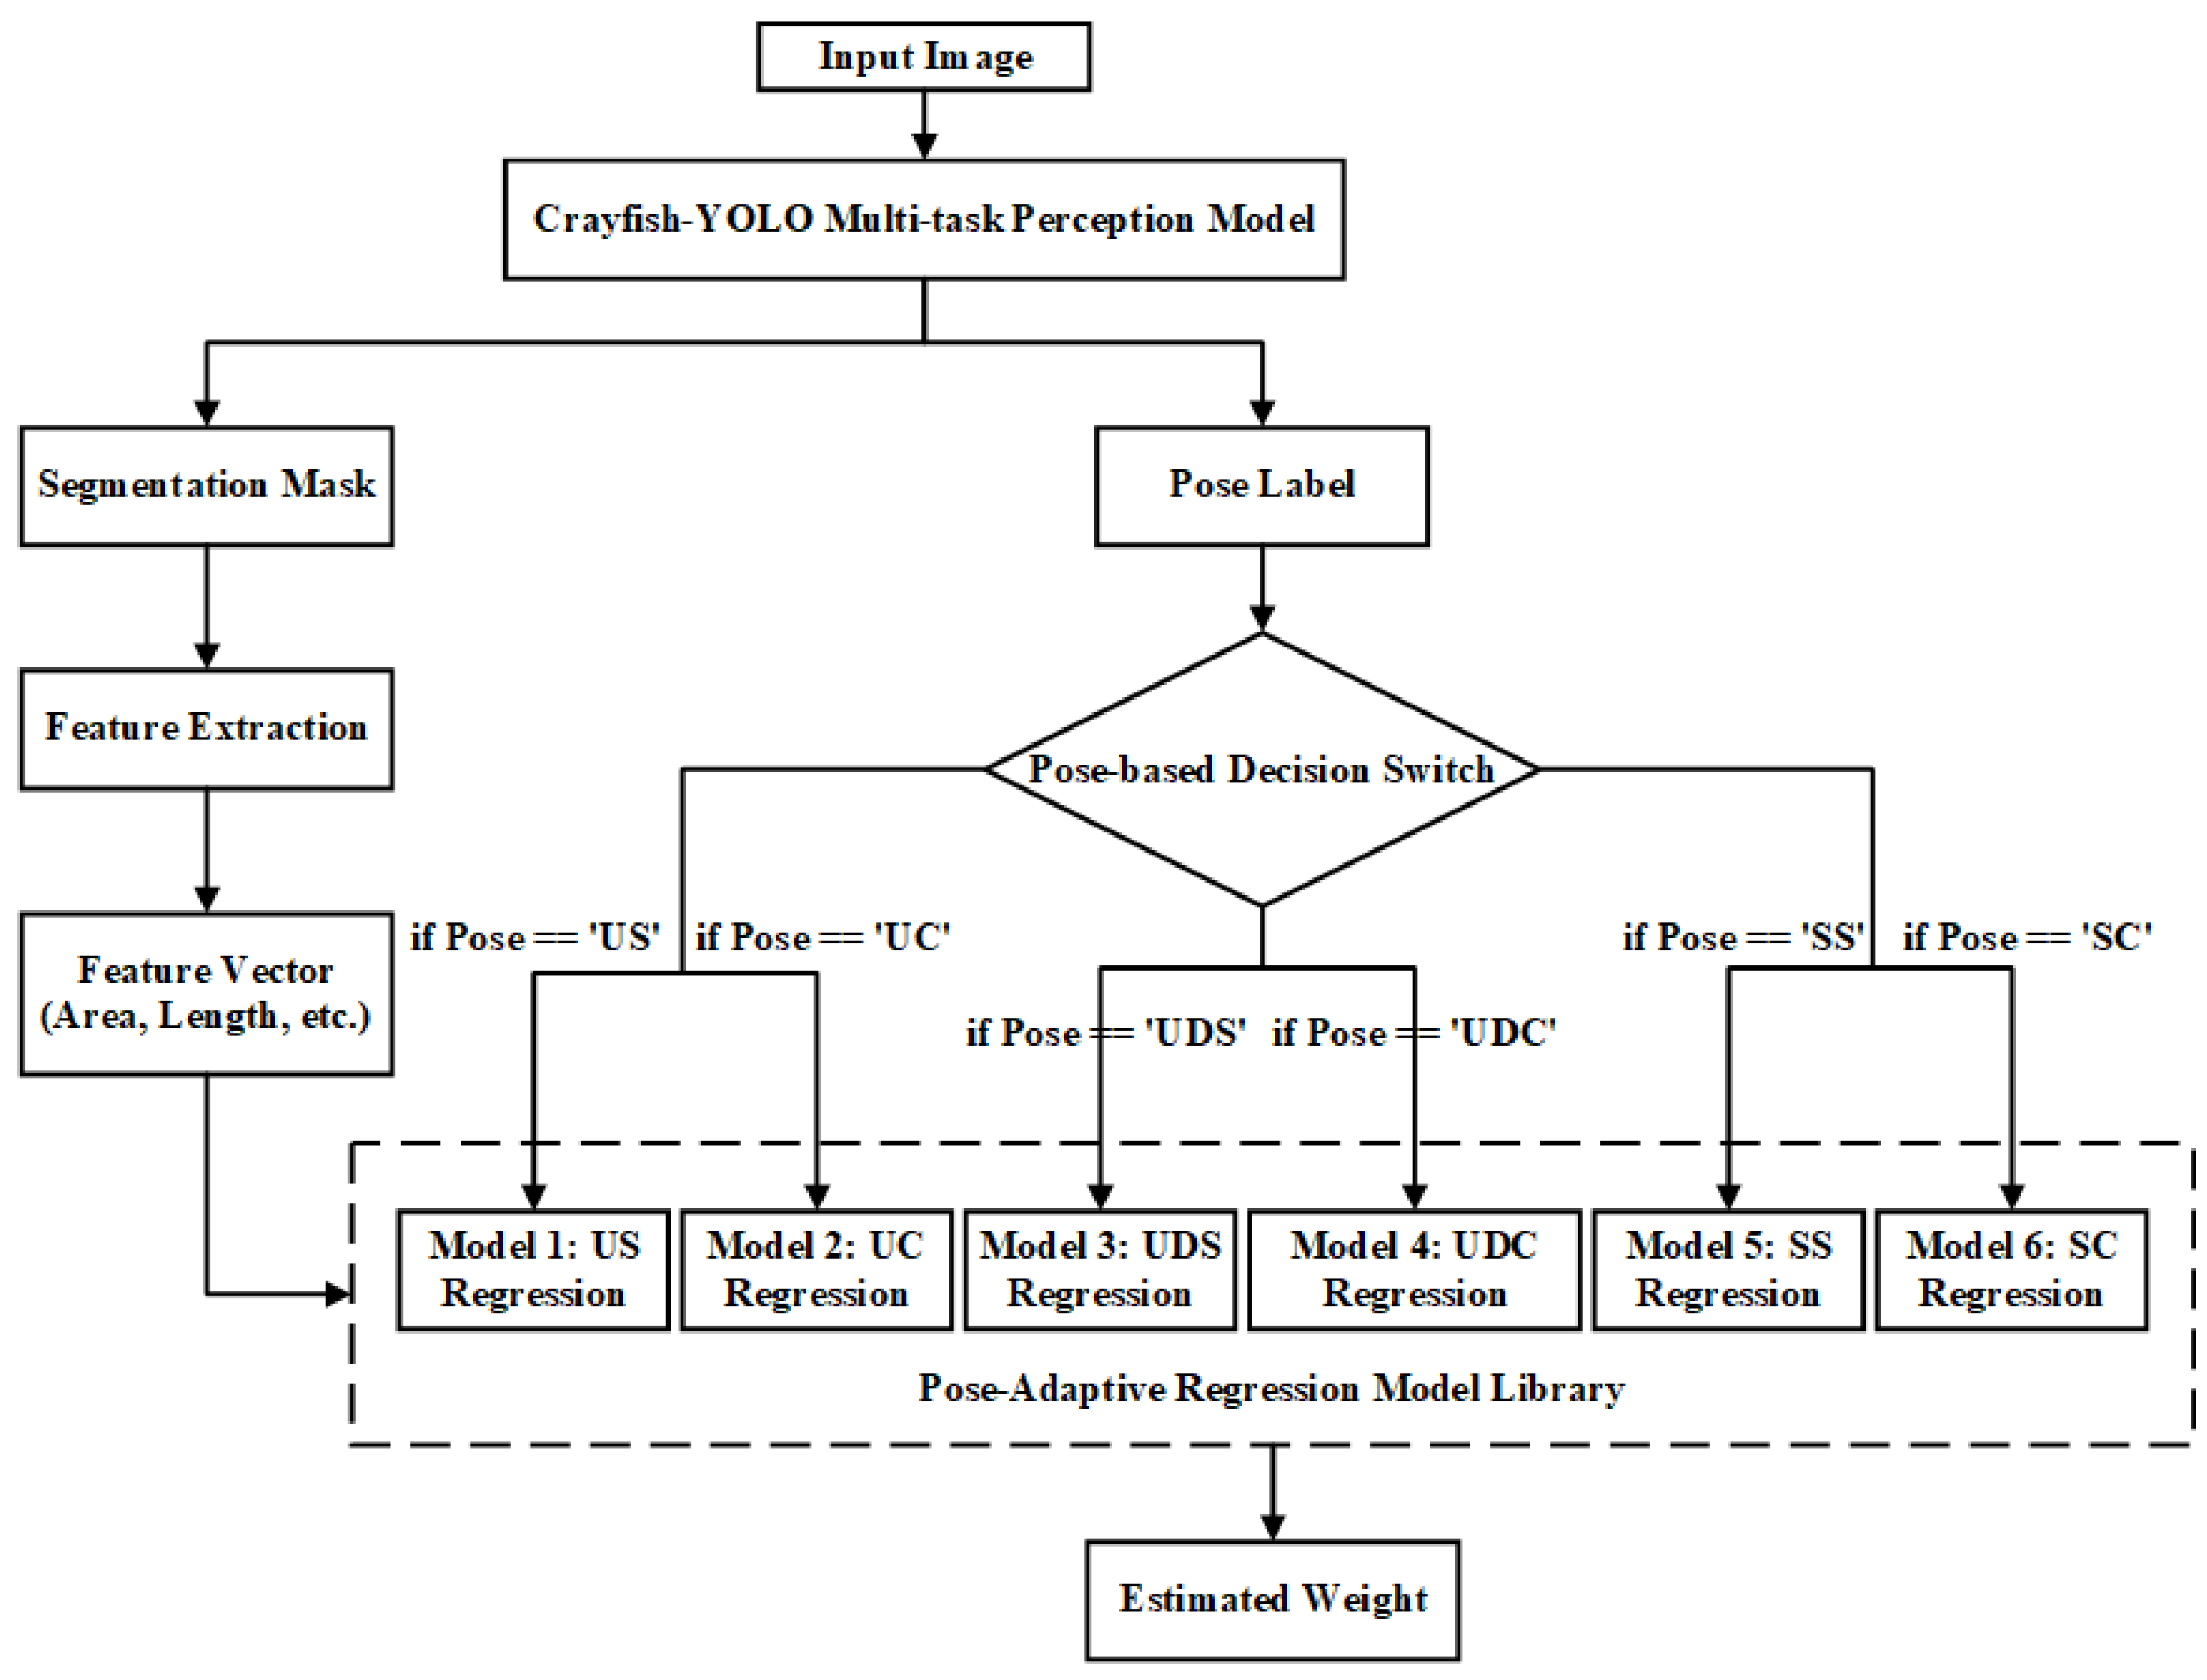
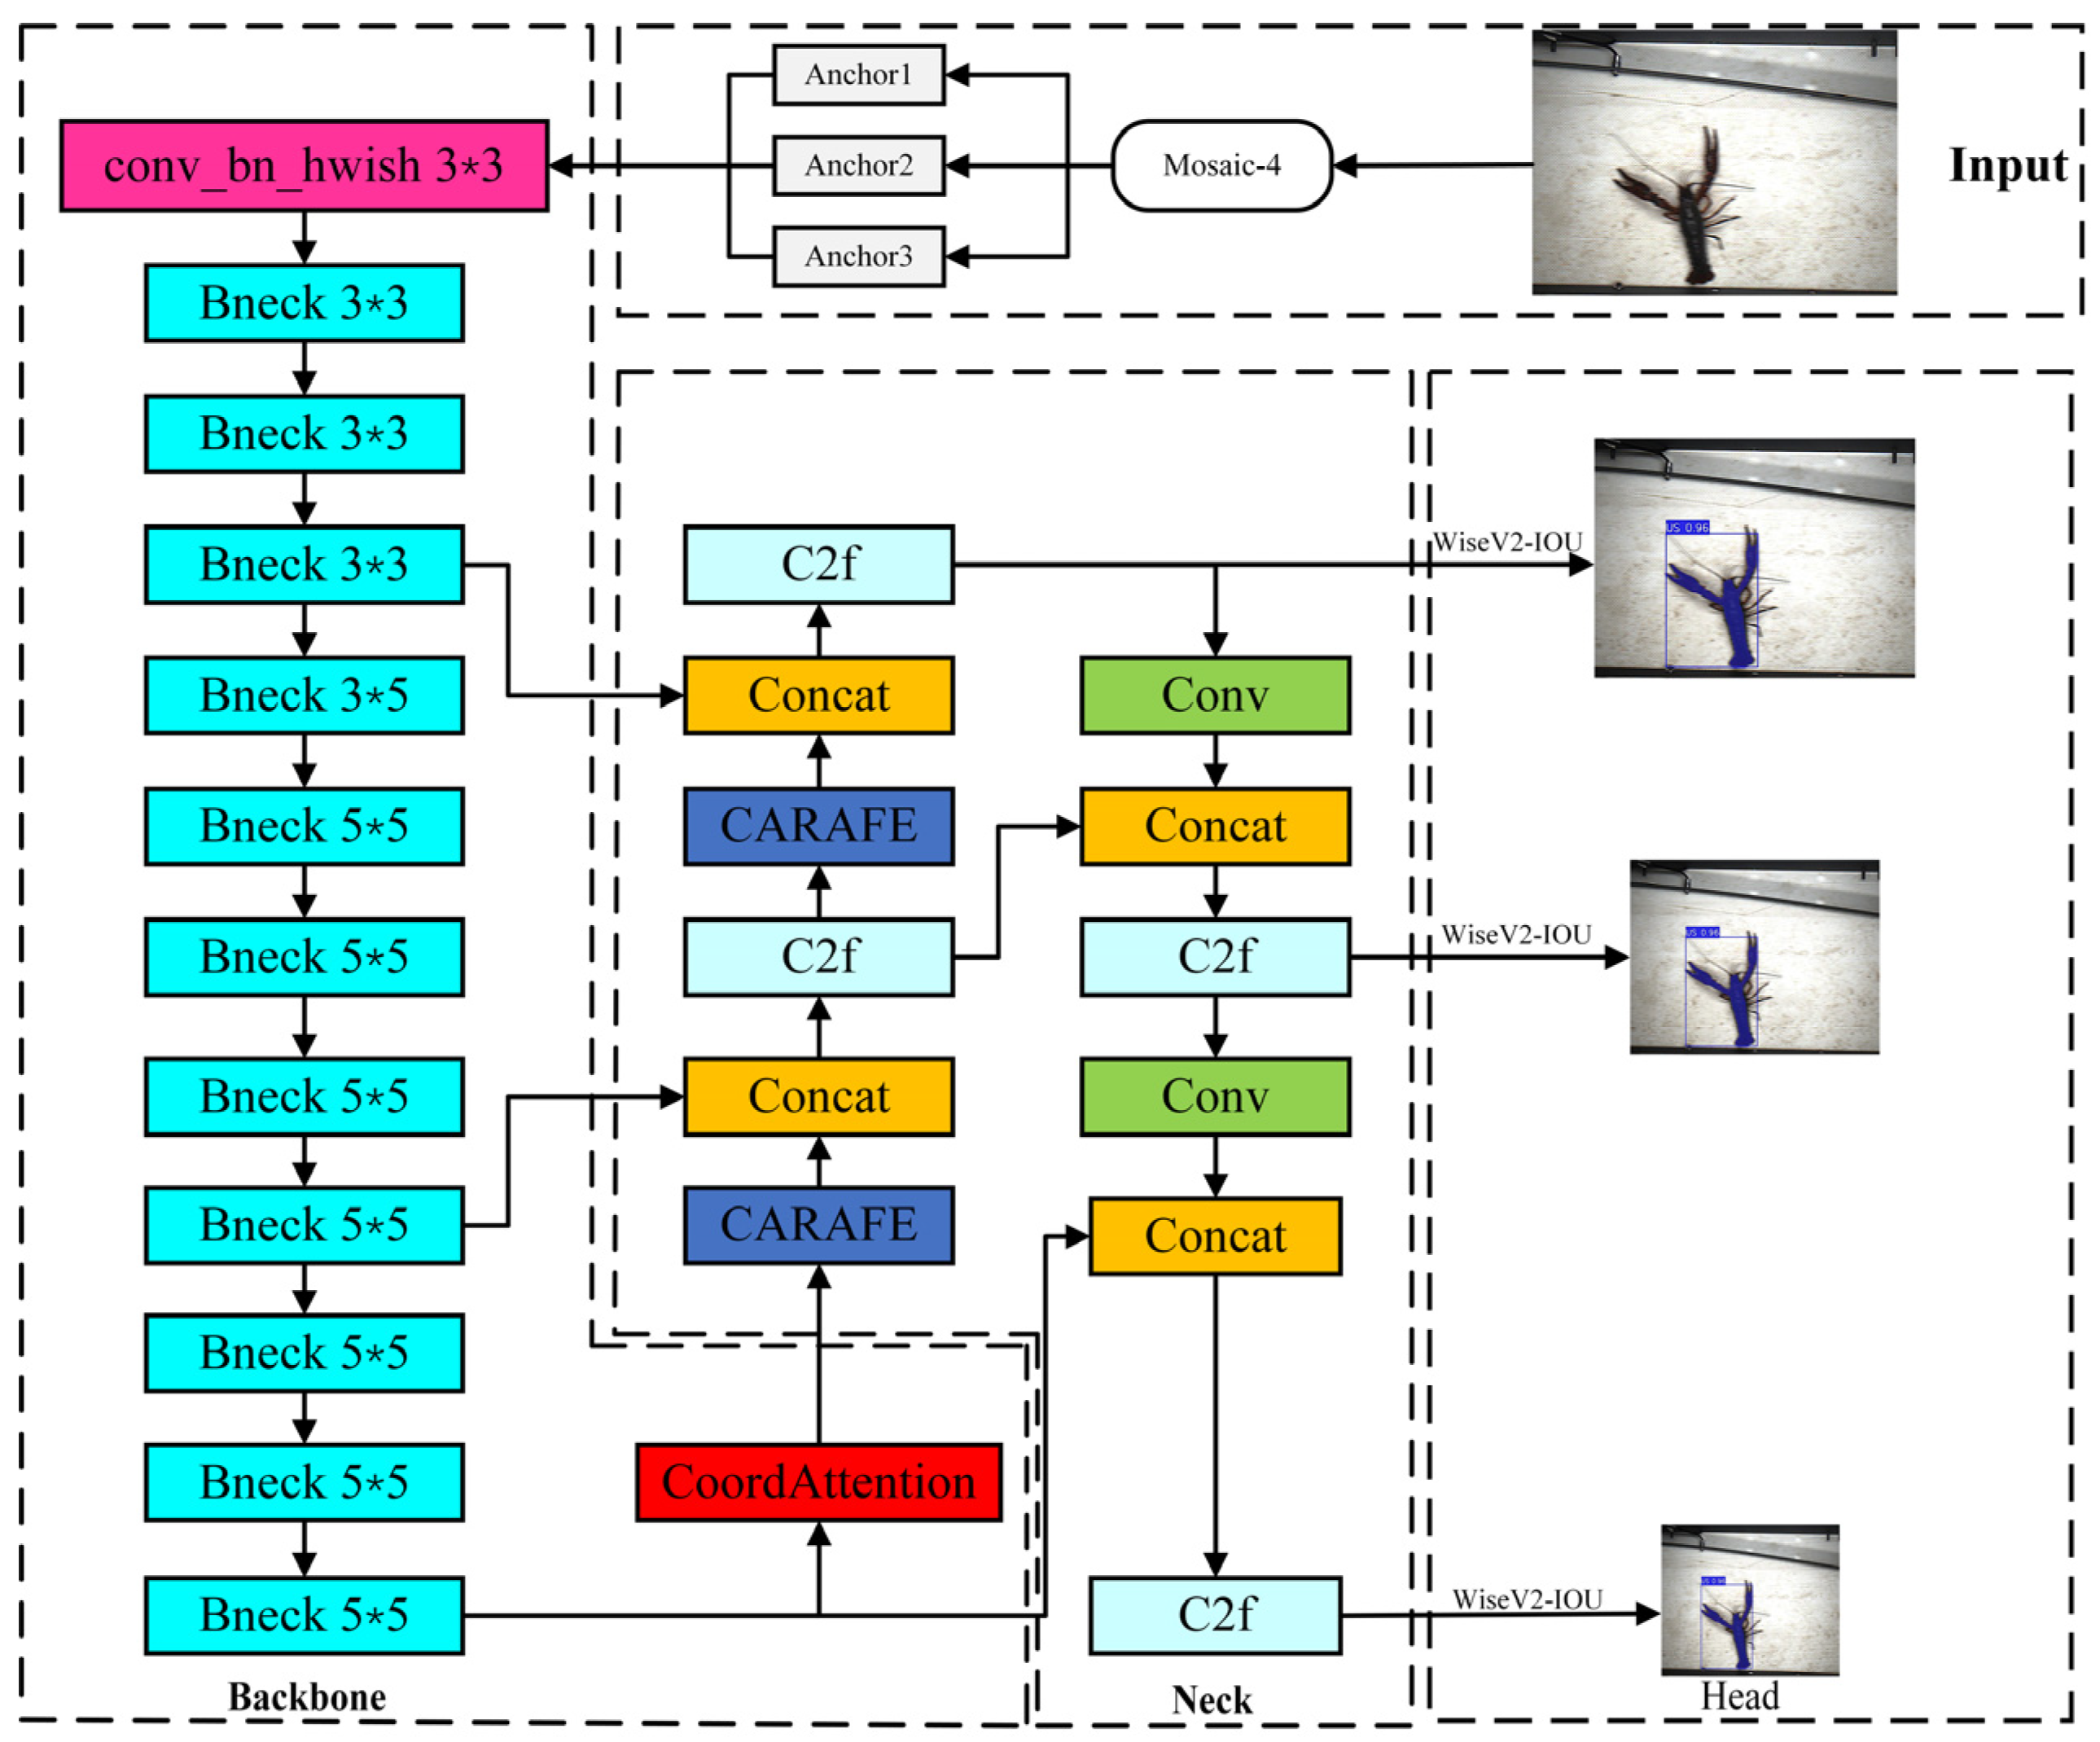
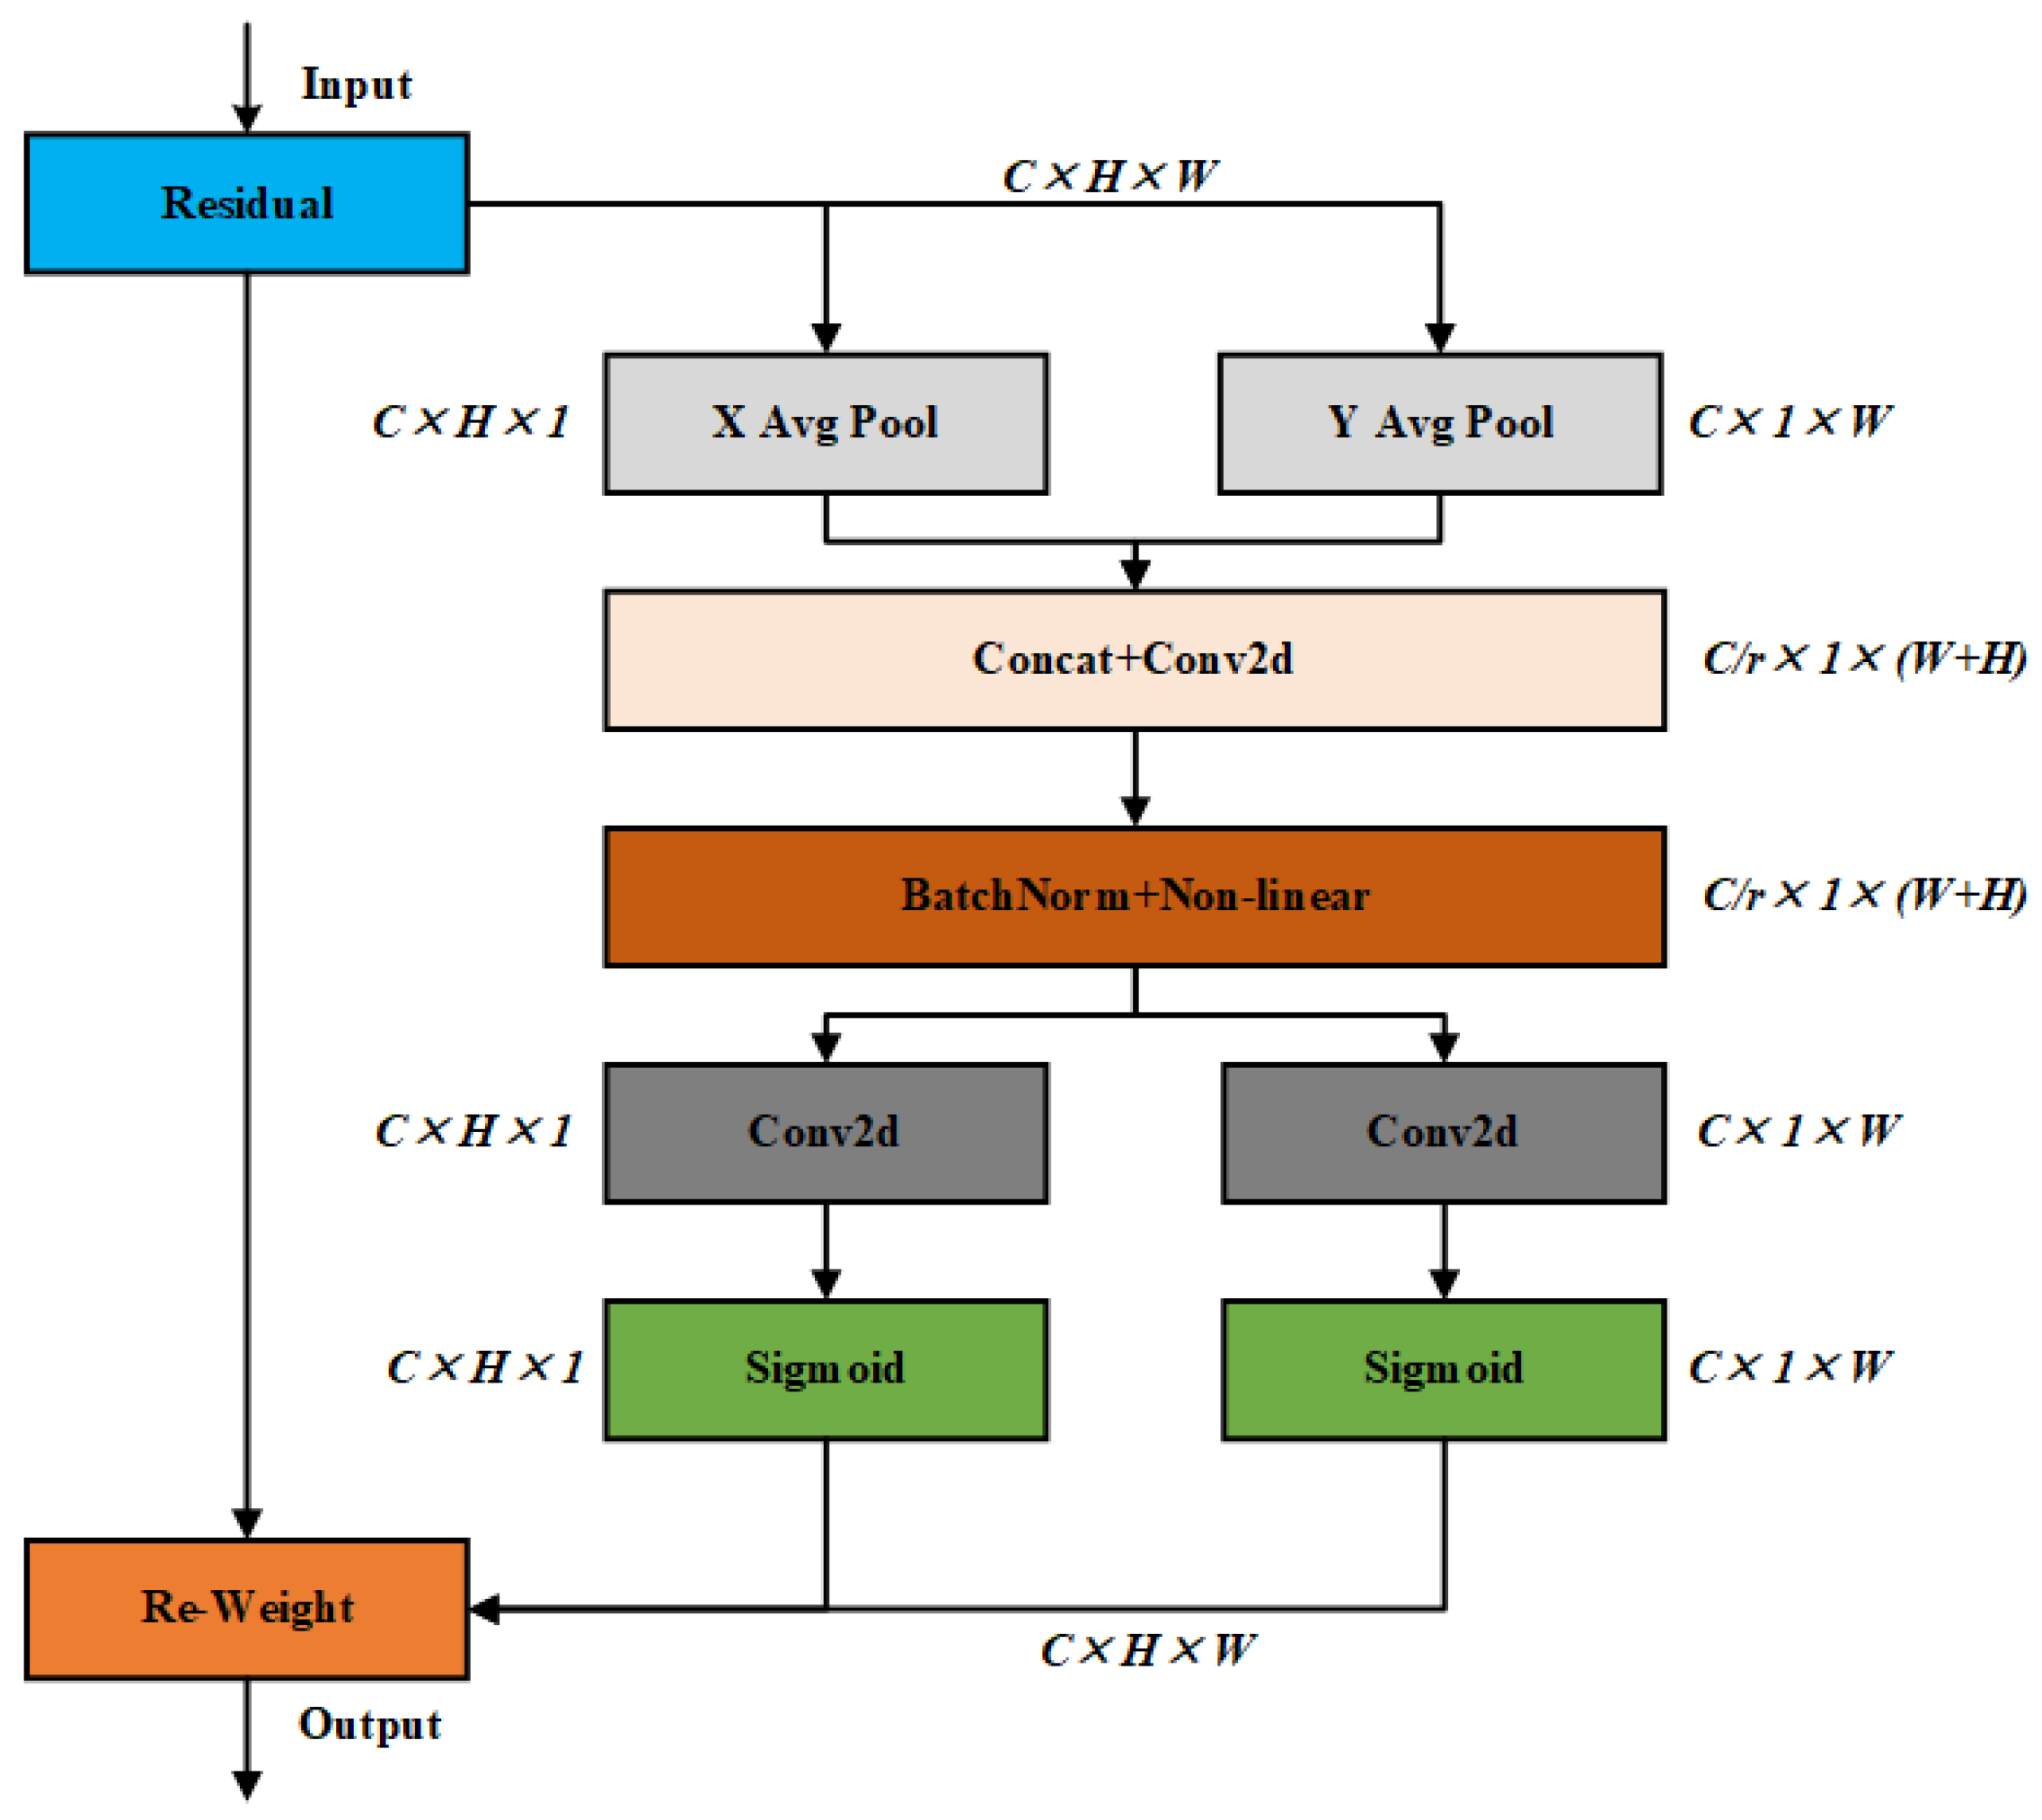
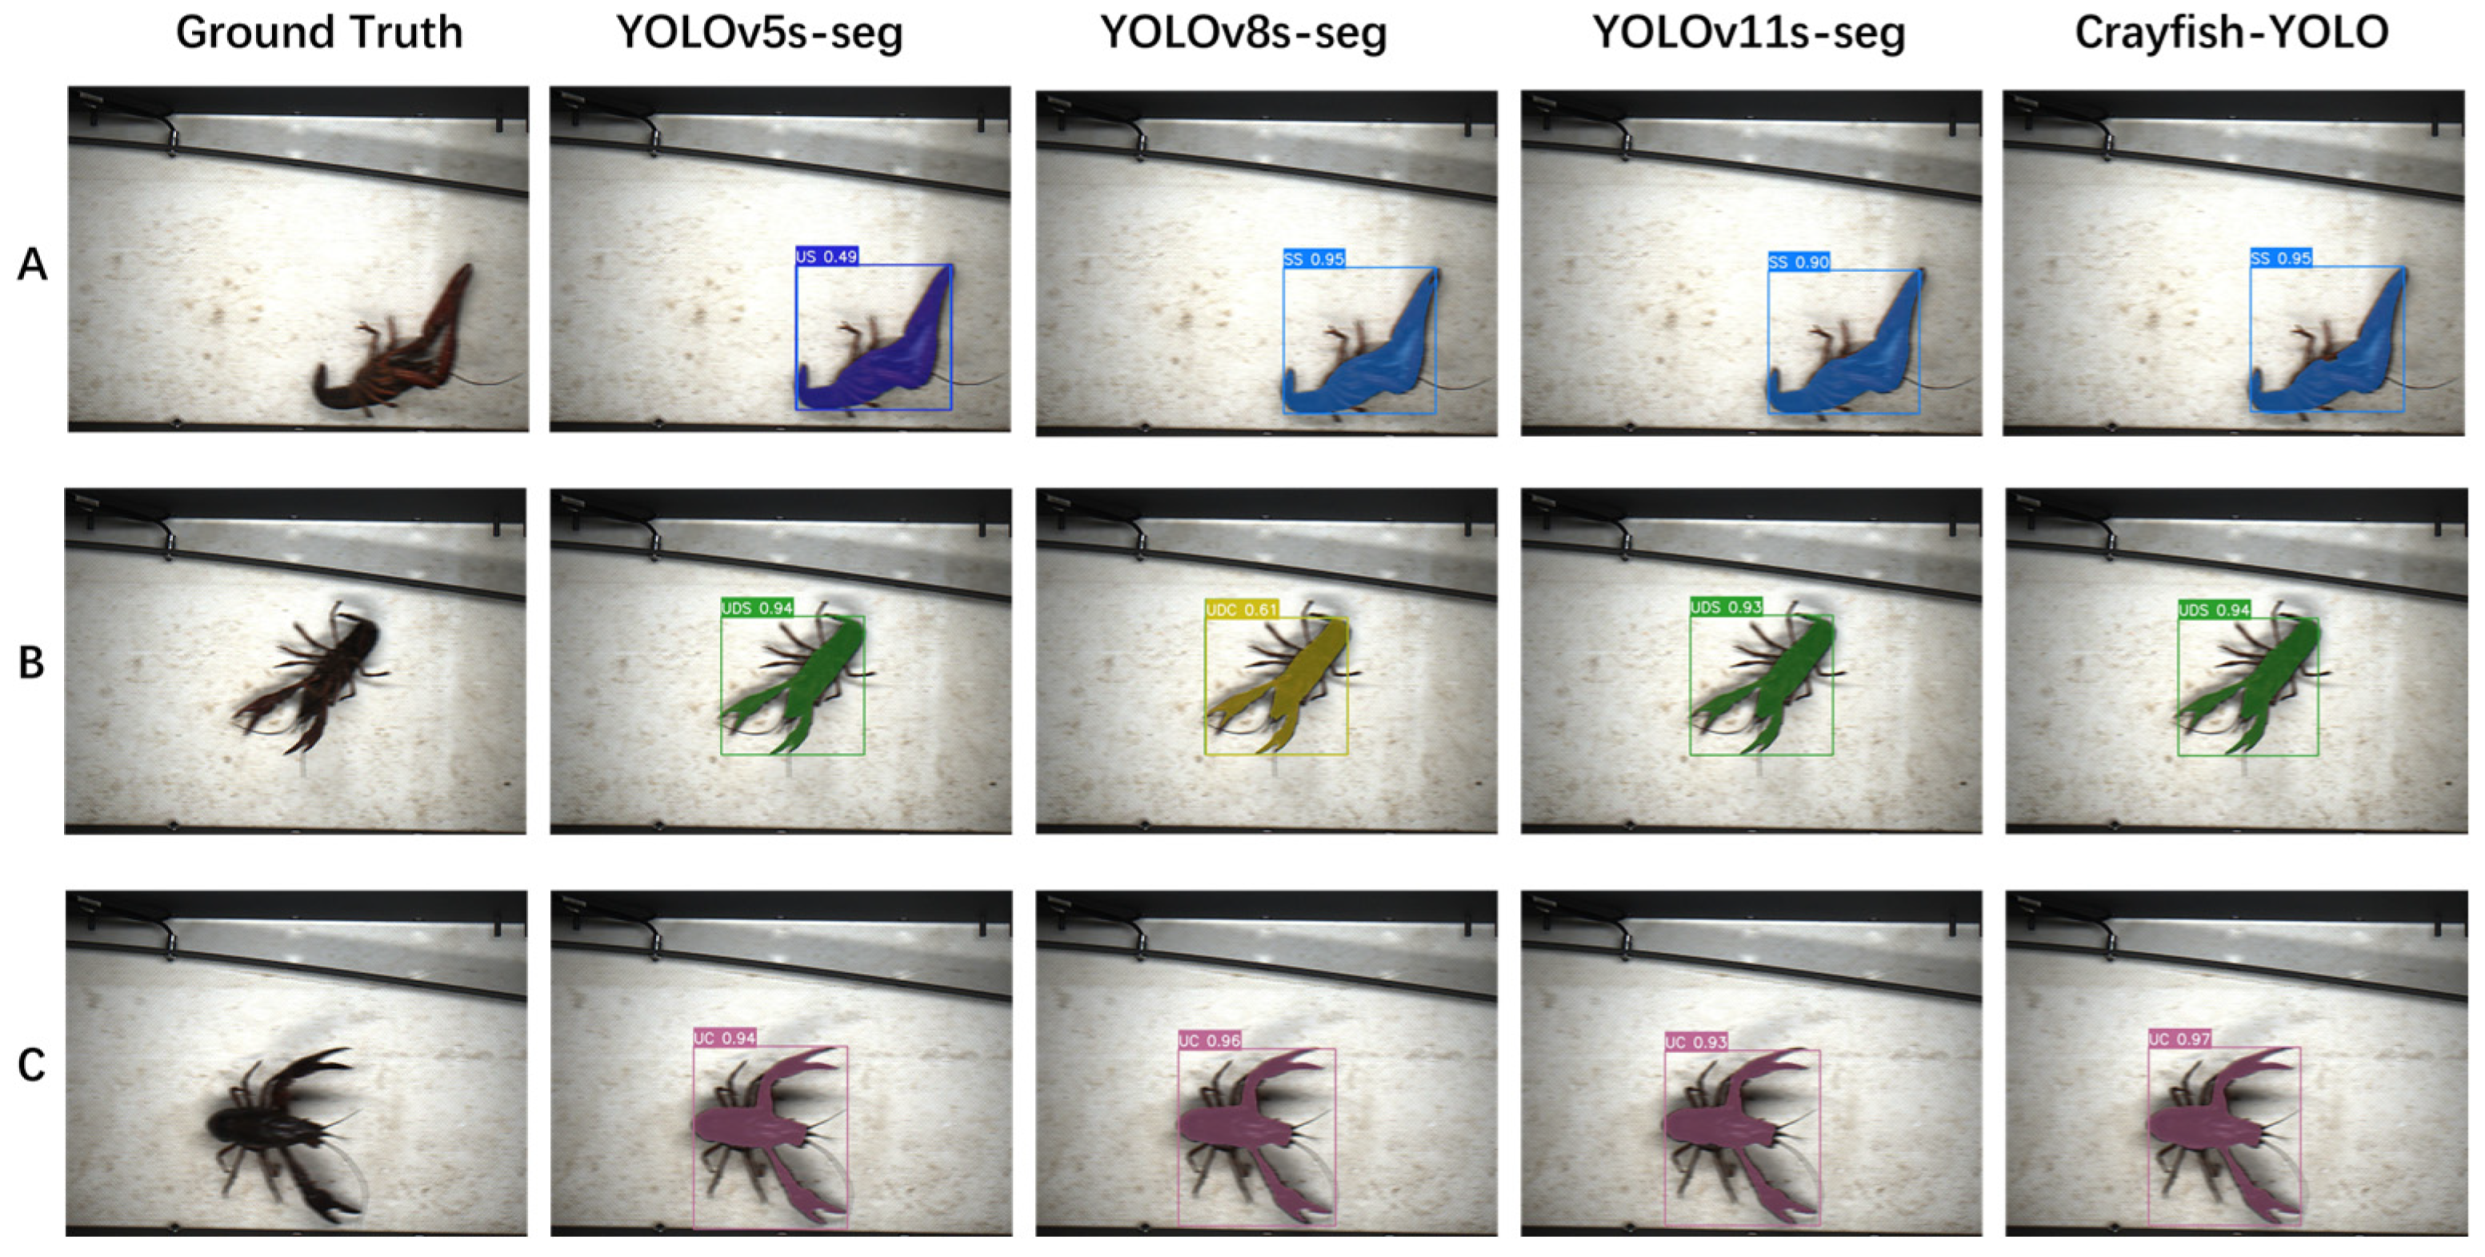
Based on the pose categories and pixel-level contours obtained from the Crayfish-YOLO model (
Section 3.2), the next core task is to construct an estimation framework that can establish a precise mapping relationship with the actual physical weight. To address the measurement challenges caused by the variable postures of non-rigid living organisms, this study proposes a pose-adaptive, multi-feature fusion regression strategy. The construction process of this strategy is as follows: first, exploratory data analysis is conducted to reveal the impact of pose variations on feature effectiveness; second, the optimal feature subset is optimized for each pose; finally, by comparing various regression algorithms, a dedicated regression model is constructed for each pose, ultimately forming a heterogeneous model library.
3.3.1. Analysis of the Effect of Pose on the Validity of Contour Features
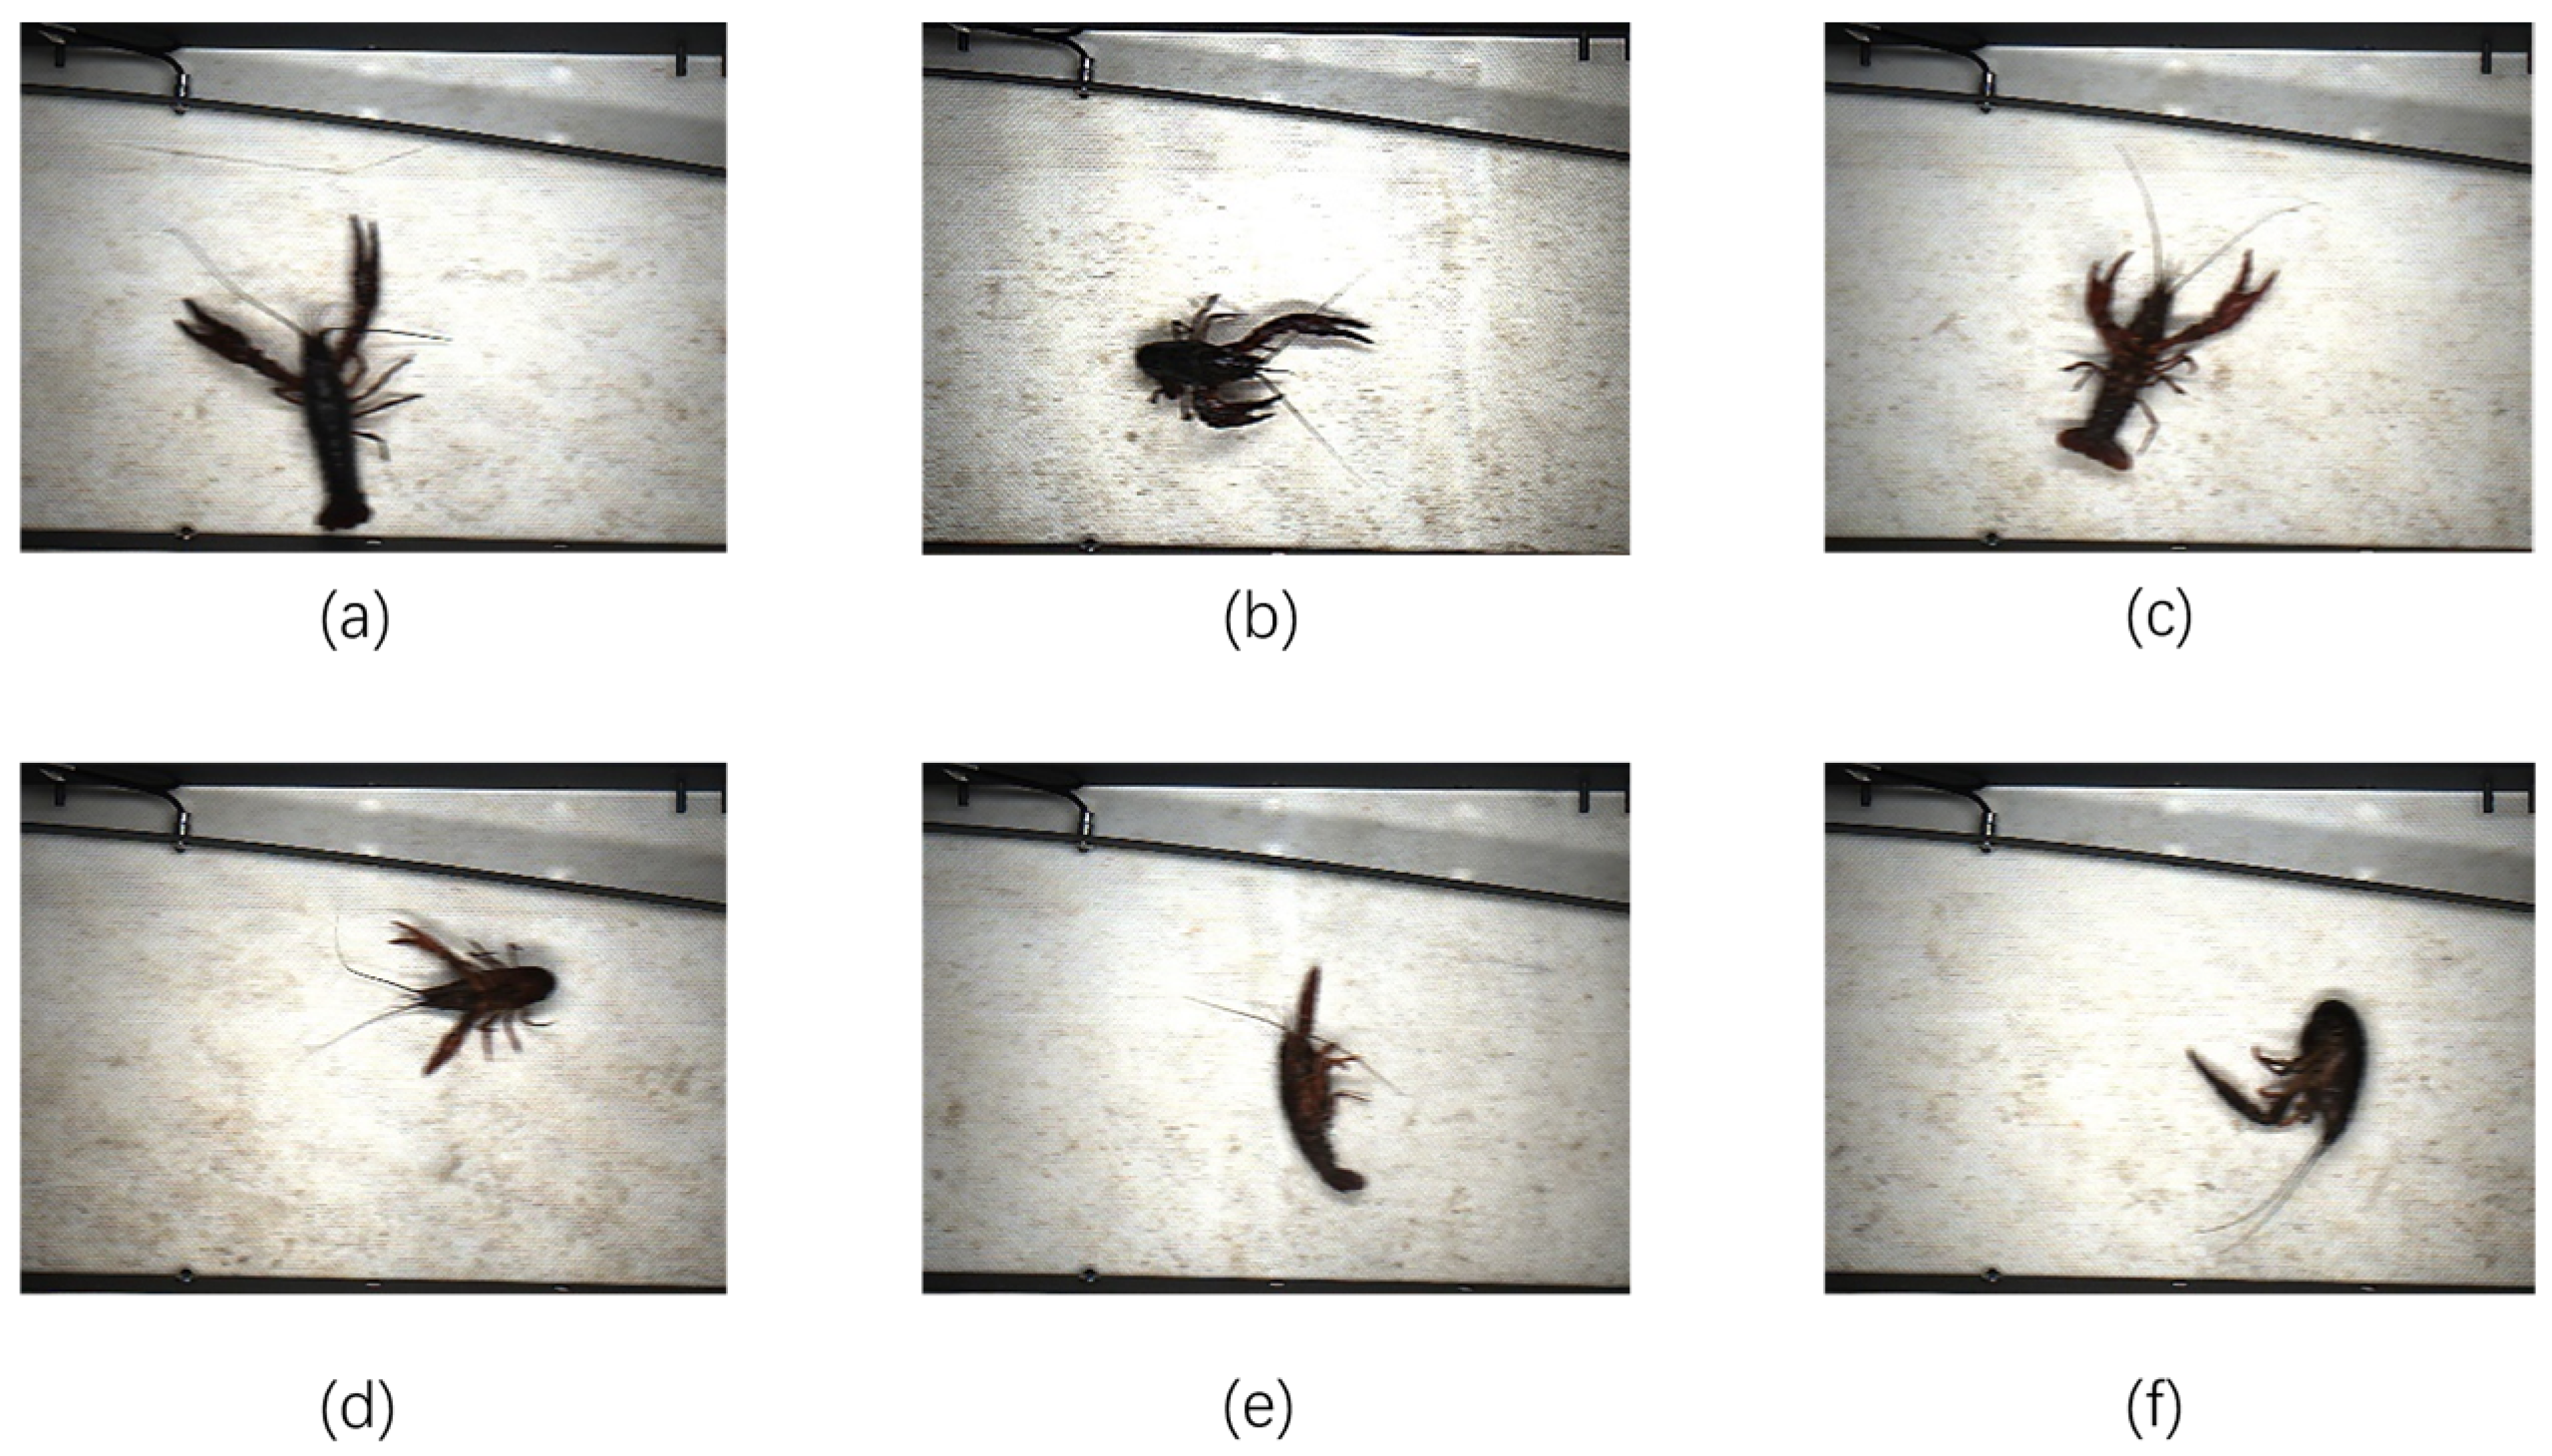
To establish the necessity of a pose-adaptive regression strategy, this study first defines the basis for the analysis. Through observation of numerous actual images, a refined six-pose classification system was established (Upright-Straight, Upright-Curled, Upside-down-Straight, Upside-down-Curled, Side-Straight, and Side-Curled; as illustrated in
Figure 2). Observations and statistics confirm that this system covers over 95% of the common natural postures encountered in a real production environment. Concurrently, for each segmented contour, this study calculated 7 core geometric and morphological features to serve as a candidate variable pool, as defined in
Table 2.
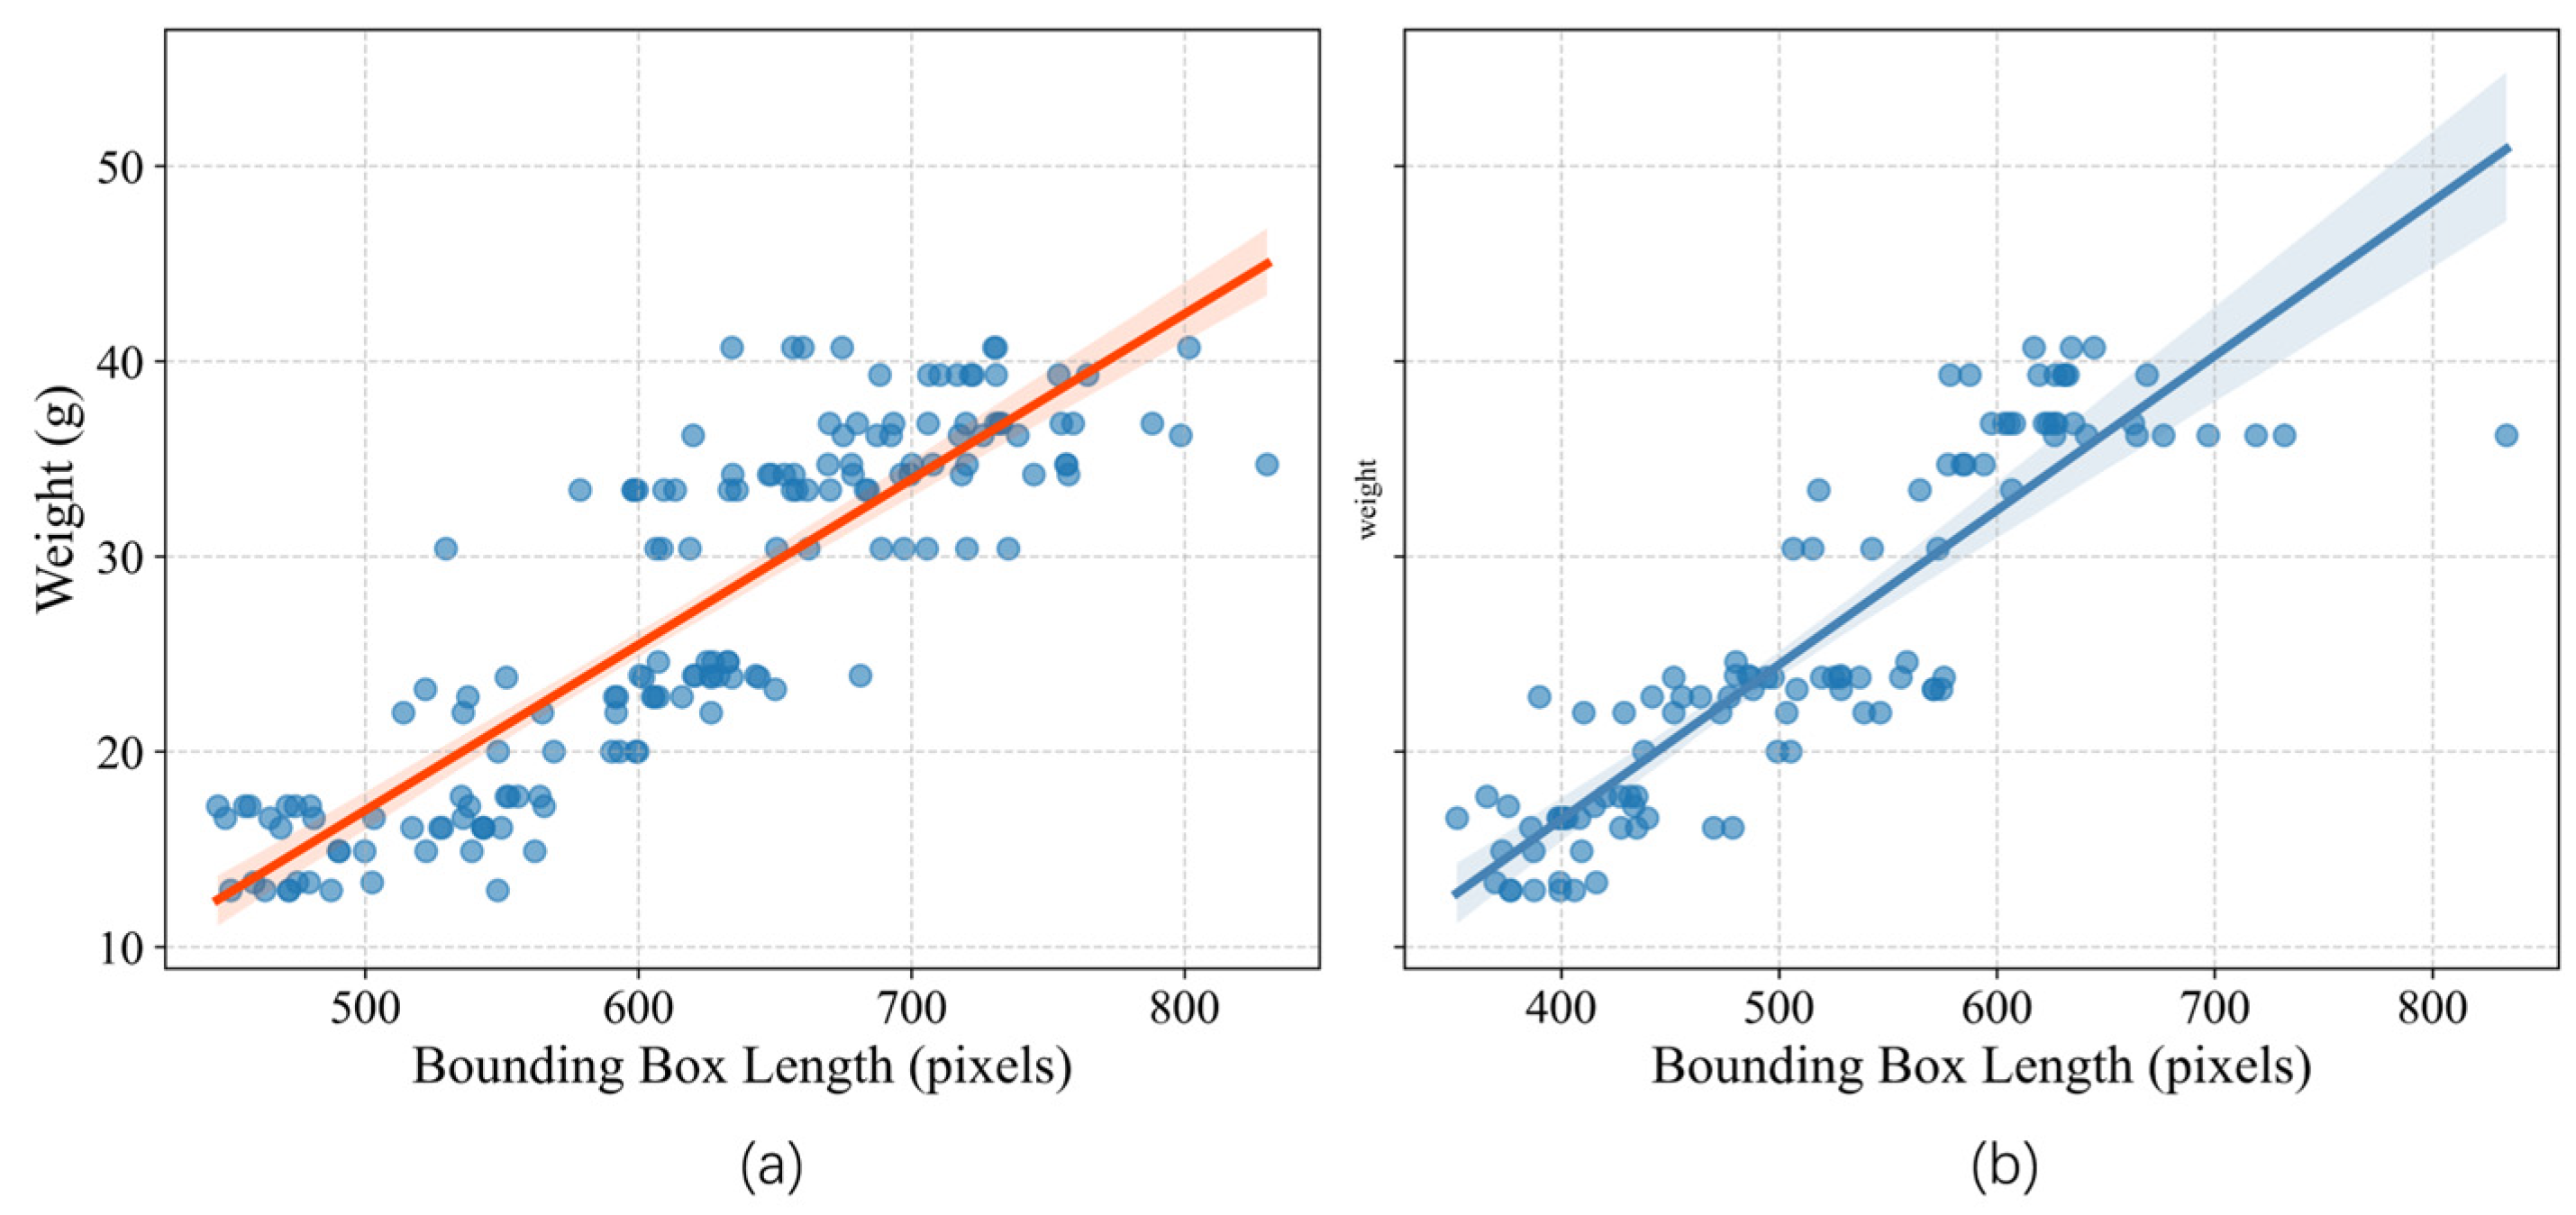
Based on the defined pose categories and candidate features, this study first deeply investigated the predictive limitations of a single feature under different poses. Taking the length of the minimum bounding rectangle as an example,
Figure 9 shows a comparison of its linear regression fit for two typical poses: “Upside-down-Straight” and “Upside-down-Curled”.
Figure 9 clearly reveals that the effectiveness of contour features is highly pose-dependent. In the “Upside-down-Straight” pose, the length feature is significantly positively correlated with weight. However, when the pose changes to “Upside-down-Curled,” the projected length can be reduced by more than 100 pixels, causing the entire numerical range to shift downwards. This distribution shift proves that using a single, global model would inevitably lead to prediction failure. Therefore, to overcome the inherent deficiencies of single features, it is necessary to perform multi-dimensional feature optimization for each pose.
3.3.2. Feature Subset Optimization
To ensure the reliability of the feature subsets and mitigate multicollinearity, we assessed the candidate features using the Variance Inflation Factor (VIF) diagnostics. All selected features in the final subsets maintained VIF values below 5.0, confirming that multicollinearity is within an acceptable range. We prioritized the Forward Stepwise Selection approach over regularization methods (e.g., LASSO or Ridge) due to the low dimensionality of our feature space (d = 7). In this context, stepwise selection offers superior physical interpretability. It enables a transparent mapping between individual morphological traits (e.g., perimeter variations during curling) and weight, which is a primary requirement for industrial grading standards, compared to the “black-box” nature of some regularized estimators.
Based on these diagnostics, this study employed the Forward Stepwise Selection method [
25]. The method uses the Adjusted R-squared (
) as the evaluation criterion to prevent overfitting, as formulated in Equation (4):
where
n is the number of samples,
p is the number of features, and
R2 is the coefficient of determination. For each pose, the optimization process is summarized as follows:
Step 1: Initialization. Set the feature set , the candidate set C = {Area, Perimeter, Length, Width, Aspect Ratio, Compactness, Equivalent Diameter}, and initial score .
Step 2: Iterative Search. For each feature in C, form a temporary model and calculate its .
Step 3: Evaluation and Selection. Identify the feature
that yields the maximum
. If
, update the sets:
Return to Step 2 until no further improvement is achieved.
Step 4: Termination. The output set constitutes the optimal feature subset for the respective pose.
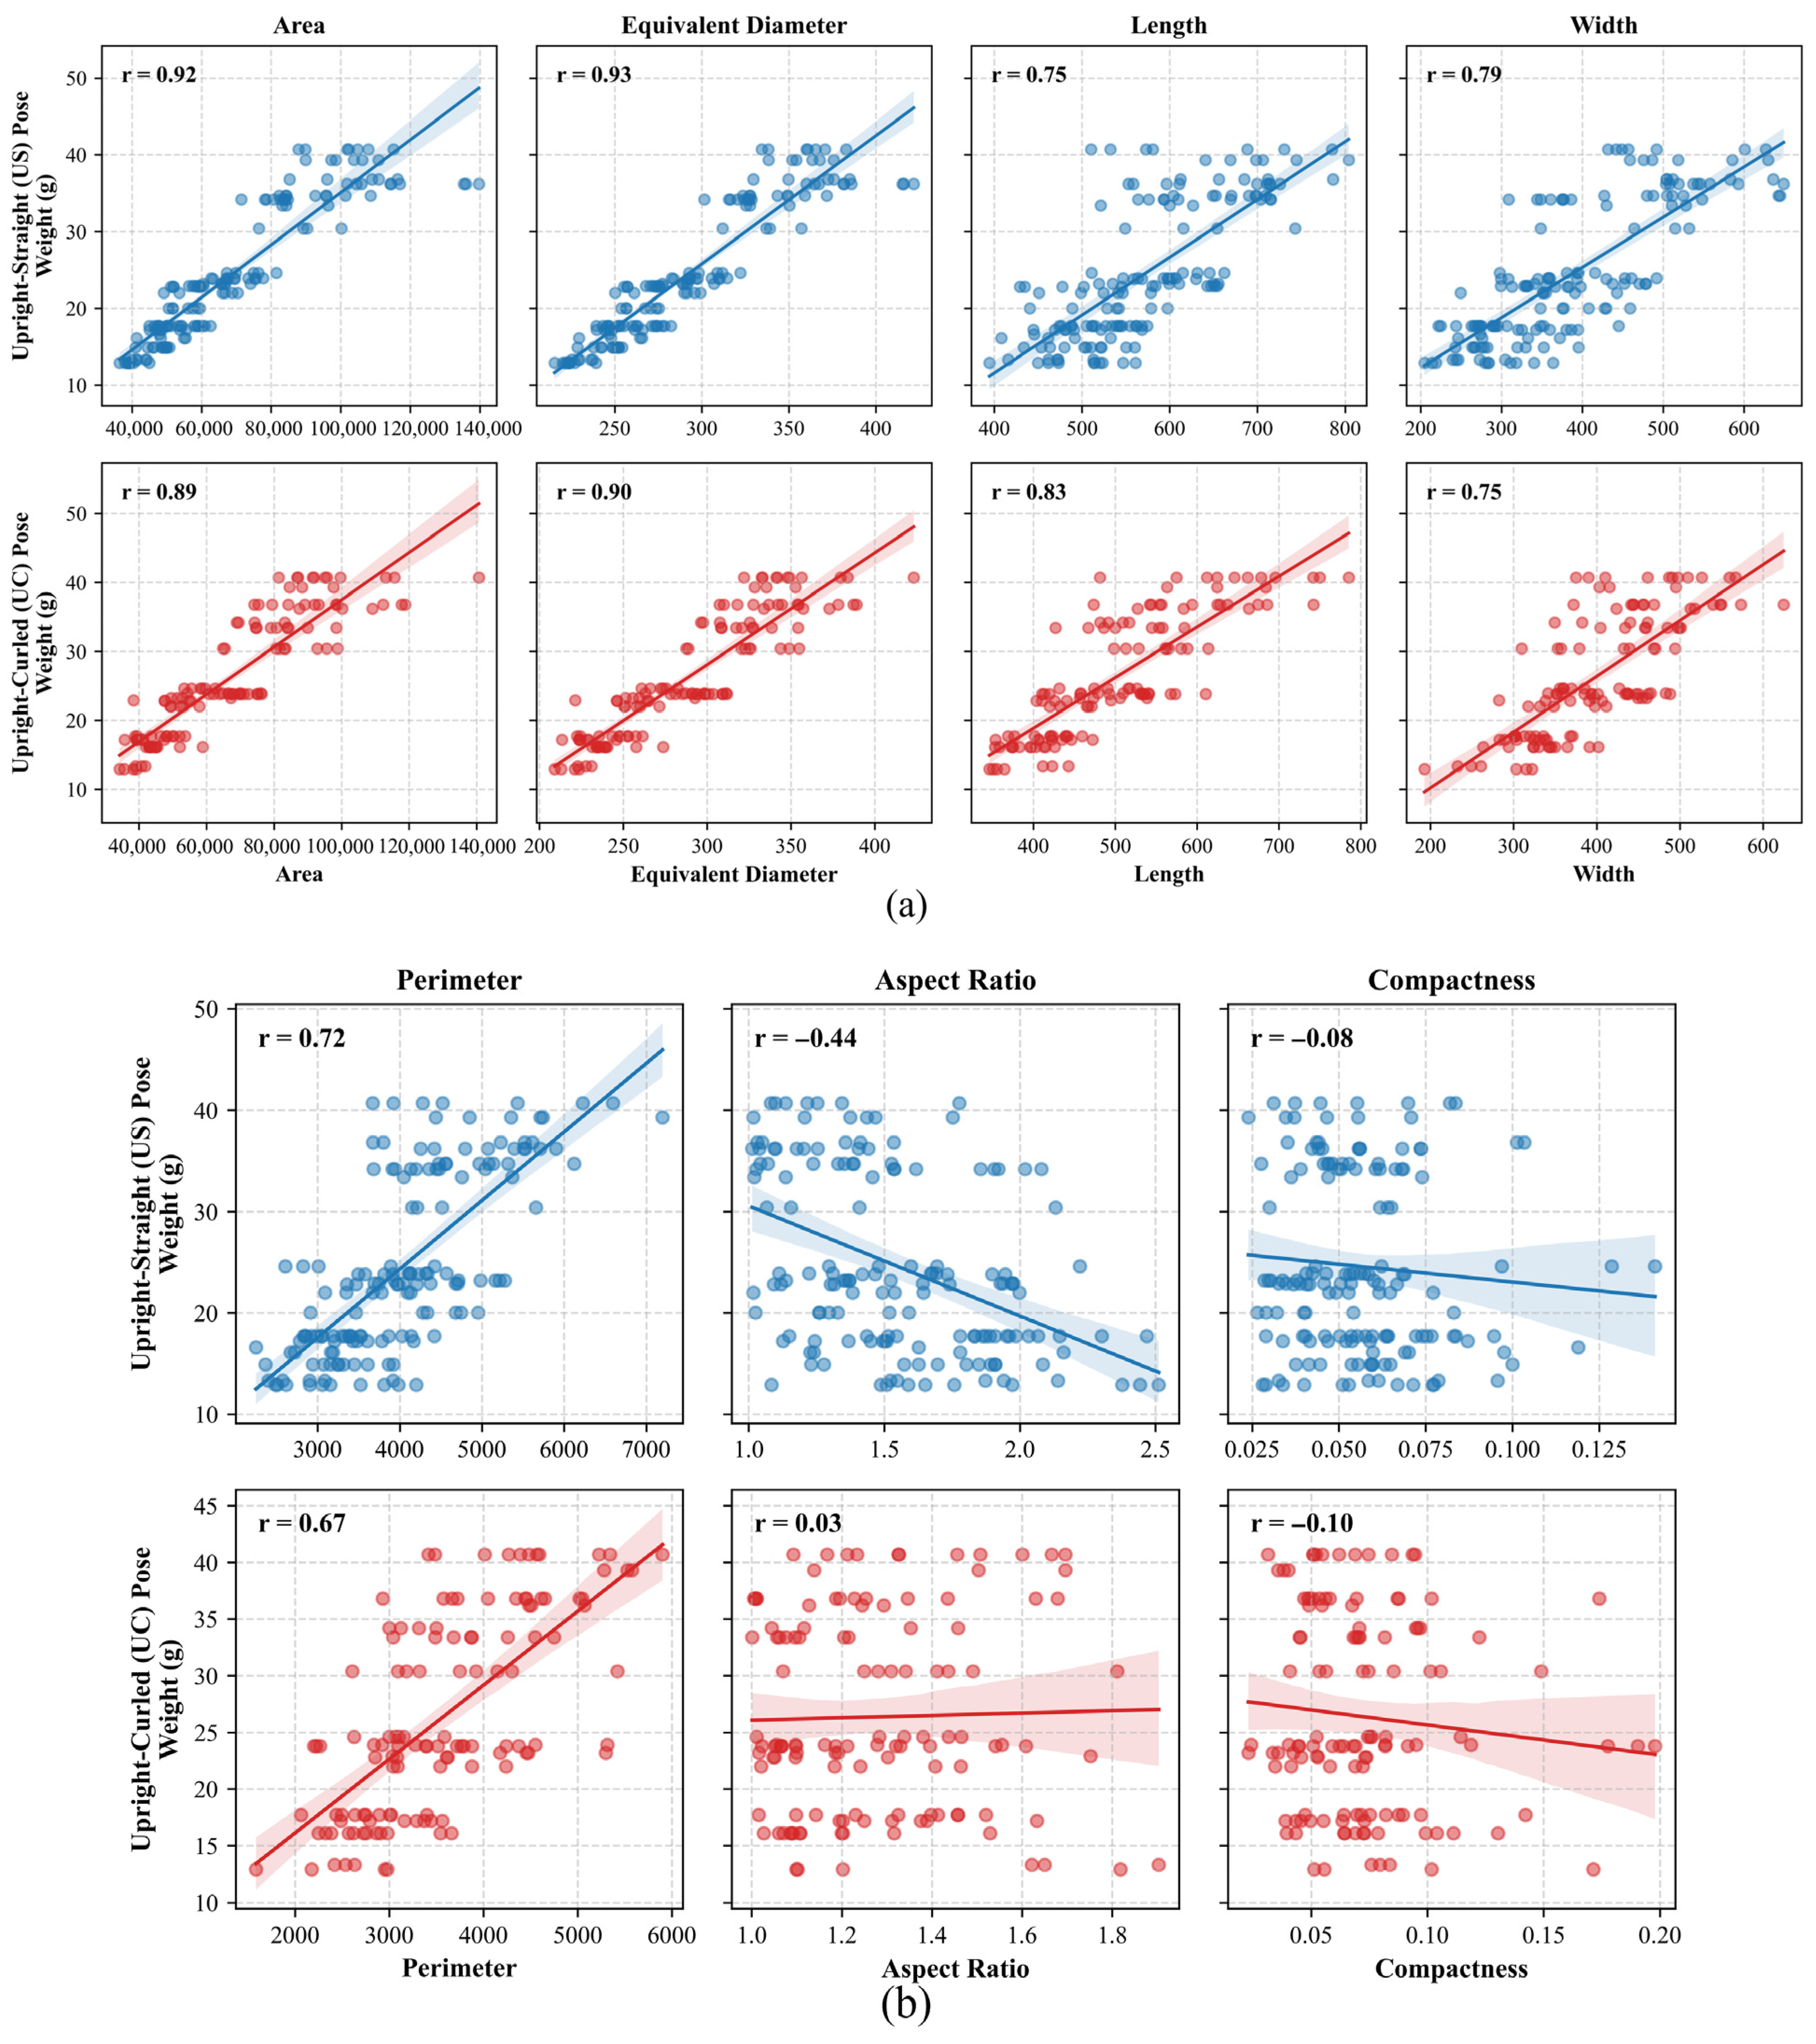
Before presenting the final selection results, to understand the intrinsic correlations between features and the selection mechanism, this study plotted the feature-weight correlation matrices for two typical poses, “Upright-Straight” and “Upright-Curled,” as shown in
Figure 10.
The correlation analysis in
Figure 10 provides clear insight into the underlying decision-making logic of the feature selection algorithm:
First, it eliminates redundant features to address multicollinearity. As shown in
Figure 10a, although Equivalent Diameter exhibits a very high univariate correlation with weight (r > 0.9) across all poses, its physical information is highly redundant with Area. After prioritizing the more direct Area feature, the algorithm automatically discards Equivalent Diameter to reduce model redundancy.
Second, it leverages feature complementarity to construct a 3D representation (using the straight-tail pose as an example). As depicted in
Figure 10a, for the “Upright-Straight” pose, although the univariate correlation of Width (r = 0.79) is slightly higher than that of Length (r = 0.75), the model ultimately selects the latter. This is because Width is too highly correlated with Area, whereas Length provides an independent dimension of information related to the creature’s longitudinal growth, which is distinct from Area. The combination of Area and Length creates a more robust three-dimensional representation of the crayfish’s volume.
Third, it uses boundary information to compensate for the loss of length information (using the curled-tail pose as an example). In the “Upright-Curled” pose, the Length feature becomes ineffective because it degenerates to the diameter of a sphere. At this point, Perimeter, as shown in
Figure 10b, is selected by the model. This occurs because, in a curled state, the perimeter contains arc length information along the body’s outer edge. It acts as an “implicit length metric” and, when combined with the Area feature, effectively compensates for the information loss caused by the failure of direct body length measurement.
Finally, it introduces a non-linear correction factor. Although
Figure 10b shows that Compactness has a very low direct linear correlation with weight (r ≈ −0.10), it is still identified by the model as a key feature. This is because Compactness quantifies the “tightness of the curl” of the body. In multivariate regression, it plays a critical role as a non-linear correction factor, effectively compensating for fluctuations in the area-weight relationship that arise from variations in how tightly or loosely the tail is curled.
Based on the feature interaction logic described above, this study performed an iterative screening process. This process ultimately determined the optimal feature subset for each of the six poses, with the results presented in
Table 3.
The results in
Table 3 confirm that the core feature combinations contributing most to weight prediction vary significantly across different poses. For instance, curled-tail poses incorporate Perimeter and Compactness, whereas straight-tail poses rely on length and width dimensions. This finding further validates the necessity of constructing differentiated feature subsets for different poses to ensure high-precision weight estimation.
3.3.3. Comparison of Regression Models and Final Model Library Construction
After determining the optimal feature subset for each pose category in
Section 3.3.2, the next step is to evaluate and select the most suitable regression algorithm. We introduced three representative machine-learning models—Multiple Linear Regression (MLR), K-Nearest Neighbors (KNN), and Support Vector Regression (SVR)—for a comparative analysis to construct the final heterogeneous model library.
To ensure the statistical robustness of the model library and mitigate selection bias, a 5-fold cross-validation strategy was implemented during the training and hyperparameter tuning phase. For algorithms requiring optimization, such as SVR (penalty parameter
C and kernel coefficient
) and KNN (number of neighbors
k), a Grid Search was conducted within the training folds. The finalized models were subsequently evaluated on an independent, held-out test set to ensure that the reported performance reflects true generalization capability, with the quantitative results detailed in the later section (
Section 4.3).
The mathematical basis for these models is summarized as follows:
MLR: A parametric model seeking an optimal linear hyperplane in the feature space, as expressed in Equation (8):
KNN: An instance-based non-parametric model [
26] where the predicted value
is the weighted average of
K nearest neighbors, defined in Equation (9):
SVR: Maps data into a high-dimensional space [
27] via a Gaussian Radial Basis Function (RBF) kernel to address non-linear distributions, formulated in Equation (10):
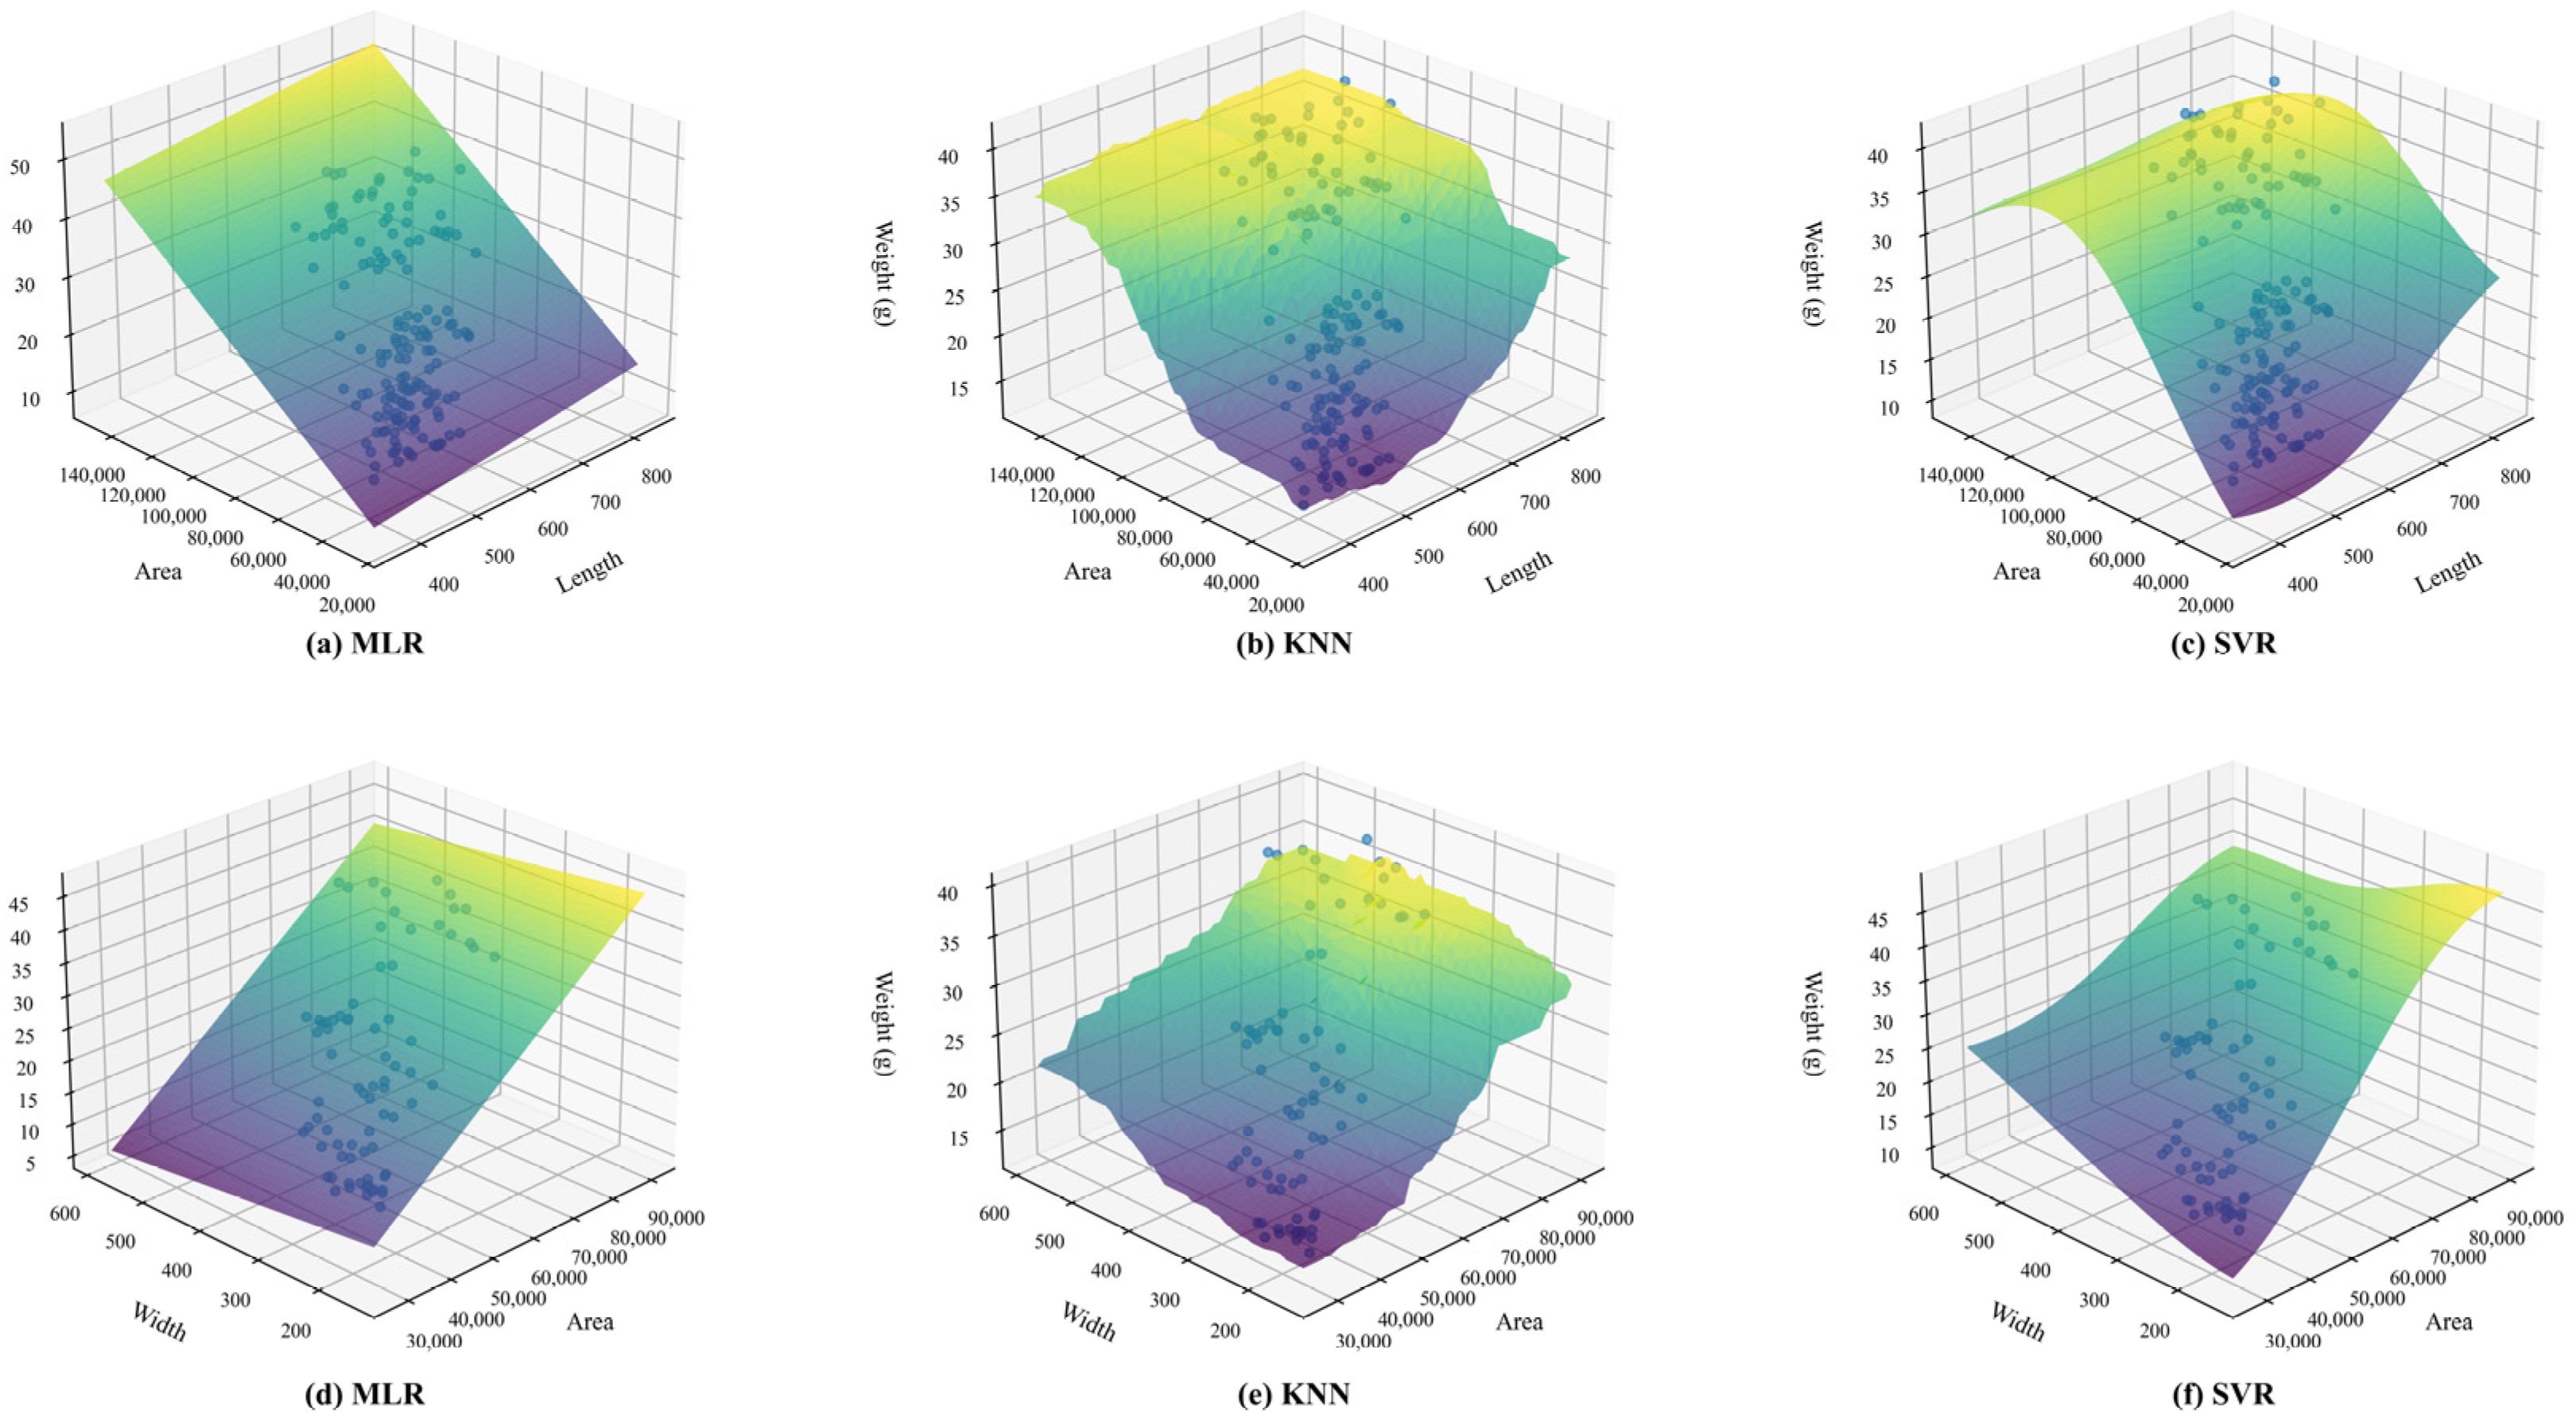
To analyze the intrinsic fitting mechanisms in response to pose variations, we plotted the fitting surfaces for two typical poses (“Upright-Straight” and “Side-Curled”) in
Figure 11.
In the “Upright-Straight” pose (
Figure 11a–c), the features and weight exhibit a strong linear trend. SVR (
Figure 11c) constructs a smooth, flexible hyperplane that fits the data manifold best, achieving the highest mean
R2 of 0.934. In contrast, MLR (
Figure 11a) is limited by its rigid linearity, while KNN (
Figure 11b) appears fragmented and sensitive to noise. However, in the “Side-Curled” pose (
Figure 11d–f), data points are highly scattered. MLR (
Figure 11d) captures the primary linear component more robustly, whereas the complex surfaces of KNN and SVR suffer from local noise, leading to decreased generalization.
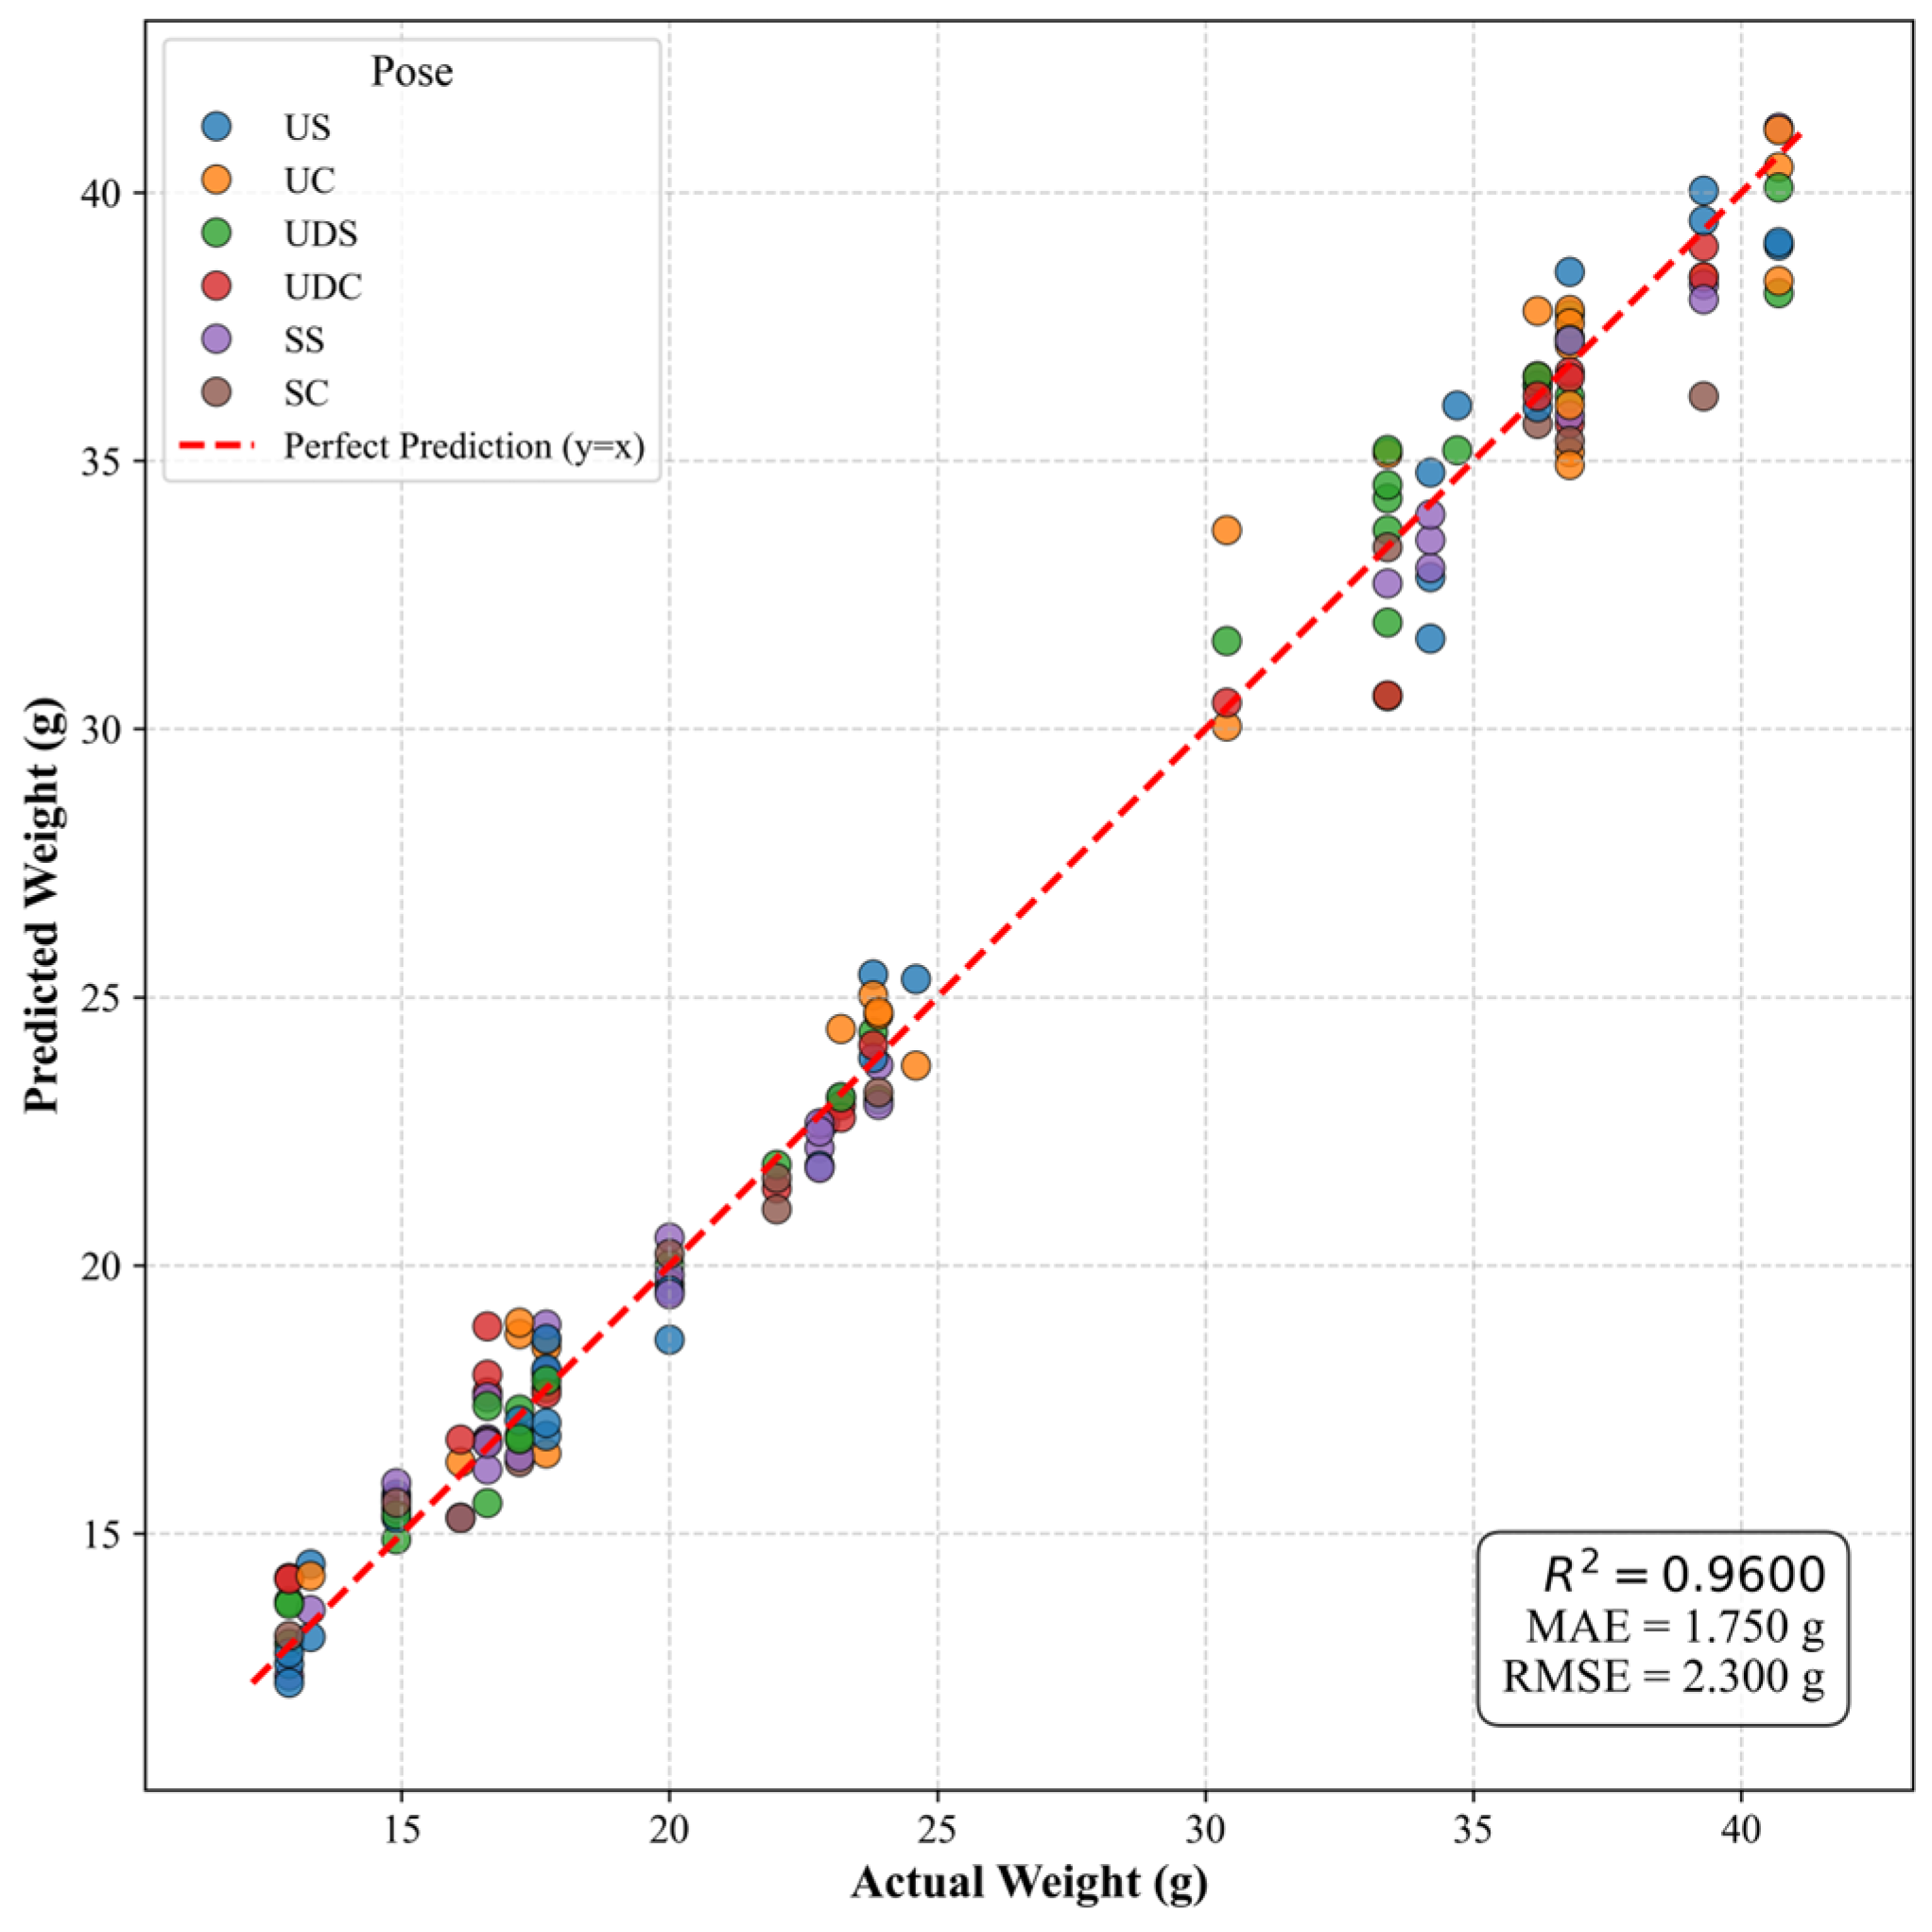
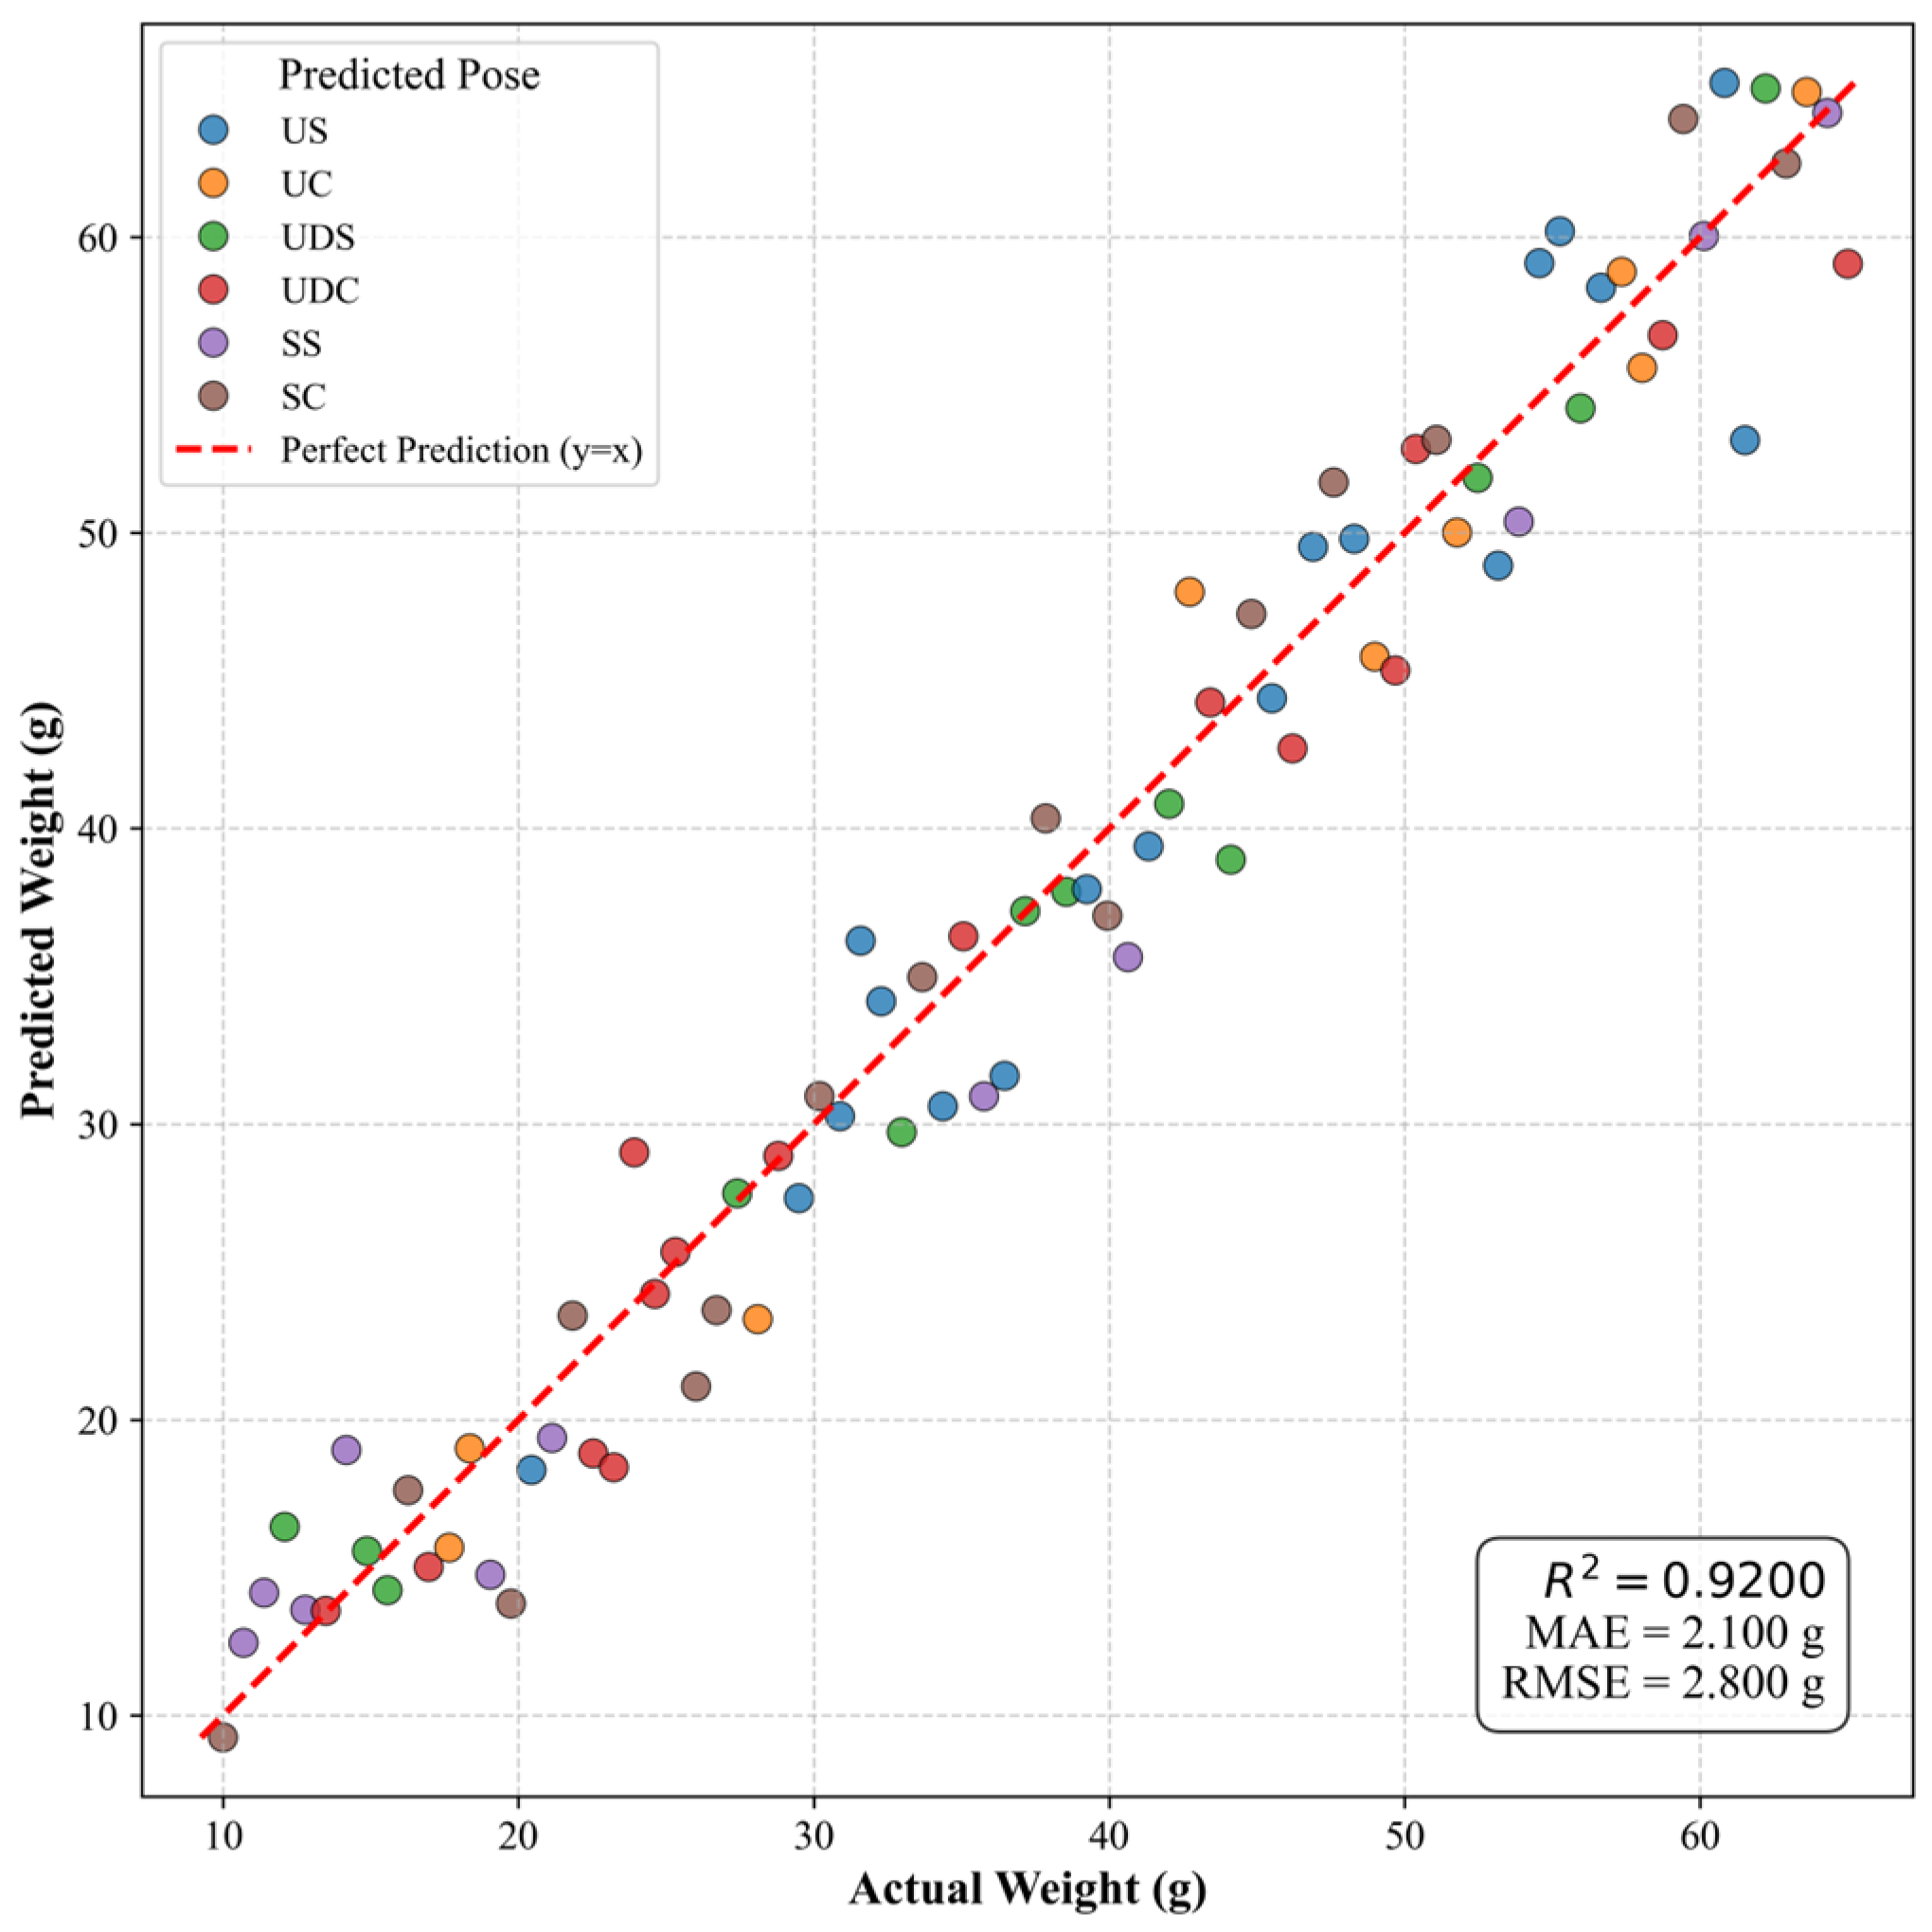
The preceding qualitative analysis is substantiated by the quantitative evaluation on the test set, with detailed results, including the mean coefficient of determination (R
2) and standard deviation (SD) for the three models, presented in
Section 4.3. The data indicate that no single algorithm achieves optimal performance across all categories, which strongly justifies the necessity of the pose-adaptive strategy. Consequently, we constructed a Heterogeneous Regression Model Library, which dynamically assigns the best-performing algorithm to each specific pose, ensuring the system consistently operates in an optimal predictive state for varying crayfish morphologies.