Prediction Factors for Detecting Clinically Significant Prostate Cancer in a PSA Gray Zone (4–10 ng/mL): A Systematic Review


 ,
, 
Abstract
1. Introduction
2. Materials and Methods
2.1. Search Strategy
2.2. Eligibility Criteria
- Evaluation of predictors of clinically significant prostate cancer (csPCa);
- PSA levels between 4 and 10 ng/mL (gray zone);
- Use of multivariable models combining clinical characteristics;
- Application of logistic regression analysis;
- English-language publications;
- Publication period between 2010 and 2025.
2.3. Study Selection
3. Results
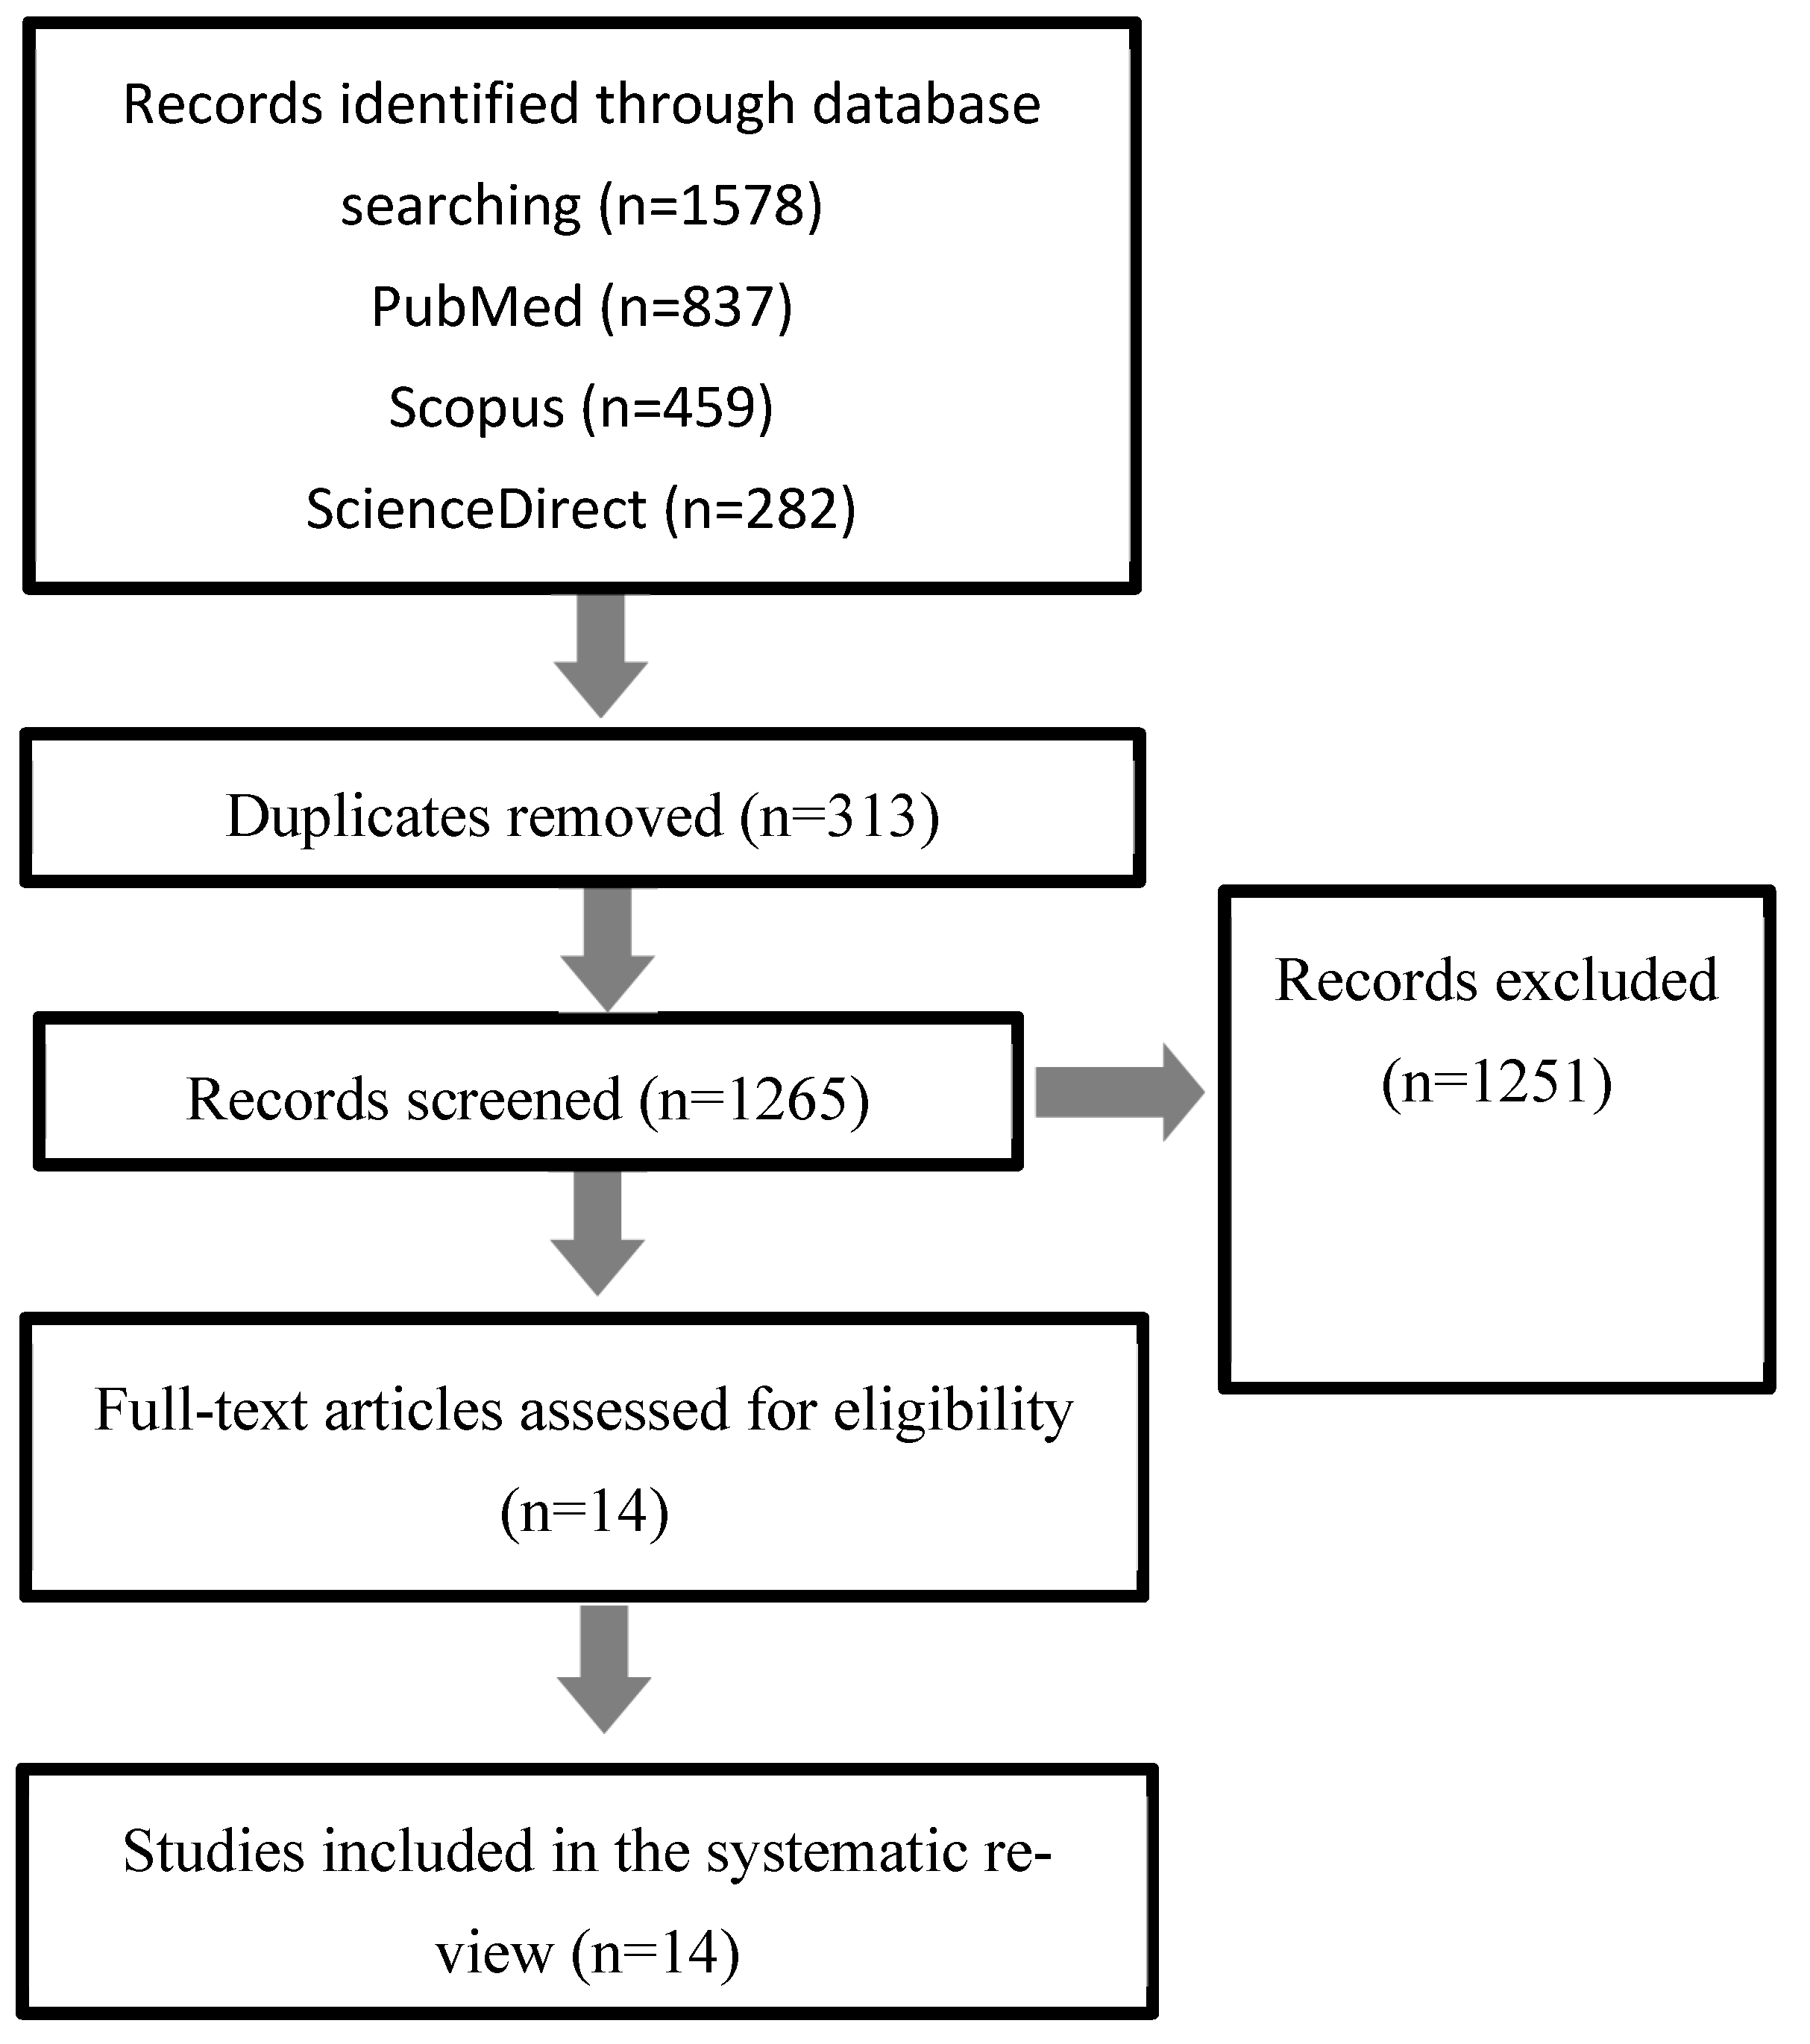
3.1. Results of Study Selection
3.2. Characteristics of the Included Studies
3.3. Performance of Univariate and Multivariate Prediction Models
4. Discussion
5. Conclusions
6. Limitations
Author Contributions
Funding
Institutional Review Board Statement
Informed Consent Statement
Data Availability Statement
Conflicts of Interest
Abbreviations
| %fPSA | Percentage of free prostate-specific antigen |
| ADC | Apparent diffusion coefficient |
| AUC | The area under the curve |
| BPH | Benign prostatic hyperplasia |
| bp-MRI | Biparametric magnetic resonance imaging |
| CART | Classification and regression tree analysis |
| csPCa | Clinically significant prostate cancer |
| DCE | Dynamic contrast-enhanced |
| DRE | Digital rectal examination |
| DWI | Diffusion-weighted imaging |
| DW-MRI | Diffusion-weighted magnetic resonance imaging |
| ERSPC | European Randomized Study of Prostatic Cancer |
| ESUR | European Society of Urogenital Radiology |
| f/tPSA | Free PSA/total PSA |
| fPSA | Free PSA |
| GS | Gleason score |
| LMR | Lymphocyte to monocyte ratio |
| LR | Logistic regression |
| mp-MRI | Multiparametric magnetic resonance imaging |
| MRI | Magnetic resonance imaging |
| MRSI | Magnetic resonance spectroscopic imaging |
| NLR | Neutrophil to lymphocyte ratio |
| PCa | Prostate cancer |
| Phi | The formula that combines total PSA, free PSA, and p2PSA |
| PI-RADS | Prostate Imaging Reporting and Data System |
| PRISMA | Preferred Reporting Items for Systematic Reviews and Meta-Analyses |
| PSA | Prostate specific antigen |
| PSA–AV | PSA age volume |
| PSAD | Prostate specific antigen density |
| PV | Prostate volume |
| ROC | Receiver operating characteristic |
| T2-WI | T2-weighted imaging |
| tPSA | Total prostate specific antigen |
| TRUS | Transrectal Ultrasound Guided Prostatic Biopsy |
References
- Siegel, R.L.; Miller, K.D.; Jemal, A. Cancer statistics, 2017. CA Cancer J. Clin. 2017, 67, 7–30. [Google Scholar] [CrossRef] [Scilit] [PubMed]
- Le, J.D.; Tan, N.; Shkolyar, E.; Lu, D.Y.; Kwan, L.; Marks, L.S.; Huang, J.; Margolis, D.J.; Raman, S.S.; Reiter, R.E. Multifocality and prostate cancer detection by multiparametric magnetic resonance imaging: Correlation with whole-mount histopathology. Eur. Urol. 2015, 67, 569–576. [Google Scholar] [CrossRef] [Scilit] [PubMed]
- Schröder, F.H.; Hugosson, J.; Roobol, M.J.; Tammela, T.L.; Ciatto, S.; Nelen, V.; Kwiatkowski, M.; Lujan, M.; Lilja, H.; Zappa, M.; et al. Prostate-cancer mortality at 11 years of follow-up. N. Engl. J. Med. 2012, 366, 981–990. [Google Scholar] [CrossRef] [Scilit] [PubMed]
- Hugosson, J.; Carlsson, S.; Aus, G.; Bergdahl, S.; Khatami, A.; Lodding, P.; Pihl, C.G.; Stranne, J.; Holmberg, E.; Lilja, H. Mortality results from the Göteborg randomised population-based prostate-cancer screening trial. Lancet Oncol. 2010, 11, 725–732. [Google Scholar] [CrossRef] [Scilit]
- Schröder, F.H.; Hugosson, J.; Roobol, M.J.; Tammela, T.L.; Zappa, M.; Nelen, V.; Kwiatkowski, M.; Lujan, M.; Määttänen, L.; Lilja, H.; et al. Screening and prostate cancer mortality: Results of the European Randomised Study of Screening for Prostate Cancer (ERSPC) at 13 years of follow-up. Lancet 2014, 384, 2027–2035. [Google Scholar] [CrossRef] [Scilit]
- Loeb, S.; Bjurlin, M.A.; Nicholson, J.; Tammela, T.L.; Penson, D.F.; Carter, H.B.; Carroll, P.; Etzioni, R. Overdiagnosis and overtreatment of prostate cancer. Eur. Urol. 2014, 65, 1046–1055. [Google Scholar] [CrossRef] [Scilit]
- Loeb, S.; Dani, H. Whom to biopsy: Prediagnostic risk stratification with biomarkers, nomograms, and risk calculators. Urol. Clin. N. Am. 2017, 44, 517–524. [Google Scholar] [CrossRef] [Scilit]
- Scheenen, T.W.; Rosenkrantz, A.B.; Haider, M.A.; Fütterer, J.J. Multiparametric magnetic resonance imaging in prostate cancer management: Current status and future perspectives. Investig. Radiol. 2015, 50, 594–600. [Google Scholar] [CrossRef] [Scilit]
- Taneja, S.S. Re: Screening and prostate cancer mortality: Results of the European Randomised Study of Screening for Prostate Cancer (ERSPC) at 13 years of follow-up. J. Urol. 2015, 194, 392–394. [Google Scholar] [CrossRef] [Scilit]
- American Urological Association. Medical Student Curriculum: Prostate Cancer Screening and Management; AUA: Linthicum, MD, USA, 2013. [Google Scholar]
- Wei, C.-G.; Chen, T.; Zhang, Y.-Y.; Pan, P.; Dai, G.-C.; Yu, H.-C.; Yang, S.; Jiang, Z.; Tu, J.; Lu, Z.-H.; et al. Biparametric prostate MRI and clinical indicators predict clinically significant prostate cancer in men with “grey zone” PSA levels. Eur. J. Radiol. 2020, 127, 108977. [Google Scholar] [CrossRef] [Scilit]
- Liu, J.; Dong, B.; Qu, W.; Wang, J.; Xu, Y.; Yu, S.; Zhang, X. Using clinical parameters to predict prostate cancer and reduce the unnecessary biopsy among patients with PSA in the gray zone. Sci. Rep. 2020, 10, 5157. [Google Scholar] [CrossRef] [Scilit] [PubMed]
- Han, C.; Liu, S.; Qin, X.-B.; Ma, S.; Zhu, L.-N.; Wang, X.-Y. MRI combined with PSA density in detecting clinically significant prostate cancer in patients with PSA ≤ 4 ng/mL: Biparametric versus multiparametric MRI. Diagn. Interv. Imaging 2020, 101, 235–244. [Google Scholar] [CrossRef] [Scilit] [PubMed]
- Niu, X.-K.; Li, J.; Das, S.K.; Xiong, Y.; Yang, C.-B.; Peng, T. Developing a nomogram based on multiparametric magnetic resonance imaging for predicting high-grade prostate cancer in the prostate-specific antigen gray zone. BMC Med. Imaging 2017, 17, 46. [Google Scholar] [CrossRef] [Scilit] [PubMed]
- Sun, J.; Zhang, Z.; OuYang, J. A novel nomogram combined PI-RADS v2 and neutrophil-to-lymphocyte ratio to predict the risk of clinically significant prostate cancer in men with PSA 4–10 ng/mL at first biopsy. Urol. Oncol. 2020, 38, 401–409. [Google Scholar] [CrossRef] [Scilit]
- Ng, C.F.; Chiu, P.K.F.; Lam, N.Y.; Lam, H.C.; Lee, K.W.; Hou, S.S. The Prostate Health Index in predicting initial prostate biopsy outcomes in Asian men with prostate-specific antigen levels of 4–10 ng/mL. Int. Urol. Nephrol. 2014, 46, 711–717. [Google Scholar] [CrossRef] [Scilit]
- Baruah, S.K.; Das, N.; Baruah, S.J.; Rajeev, T.P.; Bagchi, P.K.; Sharma, D.; Phukan, M. Combining prostate-specific antigen parameters with Prostate Imaging Reporting and Data System version 2 to improve its diagnostic accuracy. World J. Oncol. 2019, 10, 218–225. [Google Scholar] [CrossRef] [Scilit]
- Stojadinovic, M.M.; Stojadinovic, M.; Pantic, D.N. Decision tree analysis for prostate cancer prediction. Srpski Arh. Celok. Lek. 2019, 147, 52–58. [Google Scholar] [CrossRef] [Scilit]
- Dwivedi, D.K.; Kumar, R.; Dwivedi, A.K.; Bora, G.S.; Thulkar, S.; Sharma, S.; Gupta, S.D.; Jagannathan, N.R. Prebiopsy multiparametric MRI-based risk score for predicting prostate cancer in biopsy-naive men with prostate-specific antigen between 4–10 ng/mL. J. Magn. Reson. Imaging 2018, 47, 1227–1236. [Google Scholar] [CrossRef] [Scilit]
- Lu, Y.-F.; Zhang, Q.; Chen, H.-Y.; Chen, J.-Y.; Pan, Y.; Xu, C.-C.; Xu, J.-X.; Yu, R.-S. Improving the detection rate of prostate cancer in the Gray zone of PI-RADS v2 and serum TPSA by using prostate-specific antigen-age volume. Medicine 2019, 98, e16289. [Google Scholar] [CrossRef] [Scilit]
- Qi, Y.; Zhang, S.; Wei, J.; Zhang, G.; Lei, J.; Yan, W.; Xiao, Y.; Yan, S.; Xue, H.; Feng, F.; et al. Multiparametric MRI-based radiomics for prostate cancer screening with PSA in 4–10 ng/mL to reduce unnecessary biopsies. J. Magn. Reson. Imaging 2020, 50, 1809–1818. [Google Scholar] [CrossRef] [Scilit]
- Fang, D.; Ren, D.; Zhao, C.; Li, X.; Yu, W.; Wang, R.; Wang, H.; Xi, C.; He, Q.; Wang, X.; et al. Prevalence and risk factors of prostate cancer in Chinese men with PSA 4–10 ng/mL who underwent TRUS-guided prostate biopsy. Biomed Res. Int. 2015, 2015, 596797. [Google Scholar] [CrossRef] [Scilit] [PubMed]
- Liu, C.; Liu, S.-L.; Wang, Z.-X.; Yu, K.; Feng, C.-X.; Ke, Z.; Wang, L.; Zeng, X.-Y. Using the prostate imaging reporting and data system version 2 (PI-RADS v2) to detect prostate cancer. Asian J. Androl. 2018, 20, 459–464. [Google Scholar] [PubMed]
- Ji, W.-T.; Wang, Y.-K.; Han, Z.-Y.; Wang, S.-Q.; Wang, Y. Establishment and validation of a risk prediction model for clinically significant prostate cancer. Front. Oncol. 2024, 14, 1474891. [Google Scholar] [CrossRef] [Scilit] [PubMed]
- Chai, J.-G.; Li, Y.-H.; Ke, C.-X. Development of novel nomograms for predicting prostate cancer in biopsy-naive patients with PSA < 10 ng/ml and PI-RADS ≤ 3 lesions. Front. Oncol. 2025, 14, 1500010. [Google Scholar]
- Jahn, J.L.; Giovannucci, E.L.; Stampfer, M.J. The high prevalence of undiagnosed prostate cancer at autopsy: Implications for epidemiology and treatment of prostate cancer in the prostate-specific antigen-era. Int. J. Cancer 2015, 137, 2795–2802. [Google Scholar] [CrossRef] [Scilit]
- Ilic, D.; Neuberger, M.M.; Djulbegovic, M.; Dahm, P. Screening for prostate cancer. Cochrane Database Syst. Rev. 2013, 1, CD004720. [Google Scholar] [CrossRef] [Scilit]
- US Preventive Services Task Force; Grossman, D.C.; Curry, S.J.; Owens, D.K.; Bibbins-Domingo, K.; Caughey, A.B.; Davidson, K.W.; Doubeni, C.A.; Ebell, M.; Epling, J.W., Jr.; et al. Screening for prostate cancer: US Preventive Services Task Force recommendation statement. JAMA 2018, 319, 1901–1913. [Google Scholar]
- Purysko, A.S.; Rosenkrantz, A.B.; Barentsz, J.O.; Weinreb, J.C.; Macura, K.J. PI-RADS version 2: A pictorial update. Radiographics 2016, 36, 1354–1372. [Google Scholar] [CrossRef] [Scilit]
- Barentsz, J.O.; Richenberg, J.; Clements, R.; Choyke, P.; Verma, S.; Villeirs, G.; Rouviere, O.; Logager, V.; Fütterer, J.J. ESUR prostate MR guidelines 2012. Eur. Radiol. 2012, 22, 746–757. [Google Scholar] [CrossRef] [Scilit]
- Steiger, P.; Thoeny, H.C. Prostate MRI based on PI-RADS version 2: How we review and report. Cancer Imaging 2016, 16, 9. [Google Scholar] [CrossRef] [Scilit]
- Turkbey, B.; Rosenkrantz, A.B.; Haider, M.A.; Padhani, A.R.; Villeirs, G.; Macura, K.J.; Tempany, C.M.; Choyke, P.L.; Cornud, F.; Margolis, D.J.; et al. Prostate Imaging Reporting and Data System version 2.1: 2019 update of prostate imaging reporting and data system version 2. Eur. Urol. 2019, 76, 340–351. [Google Scholar] [CrossRef] [Scilit] [PubMed]
- Weinreb, J.C.; Barentsz, J.O.; Choyke, P.L.; Cornud, F.; Haider, M.A.; Macura, K.J.; Margolis, D.; Schnall, M.D.; Shtern, F.; Tempany, C.M. PI-RADS prostate imaging reporting and data system: 2015, version 2. Eur. Urol. 2016, 69, 16–40. [Google Scholar] [CrossRef] [Scilit] [PubMed]
- Zhao, C.; Gao, G.; Fang, D.; Li, F.; Yang, X.; Wang, H.; He, Q.; Wang, X. Efficiency of prostate multiparametric magnetic resonance imaging based on PI-RADS V2 in detection of prostate cancer. Clin. Imaging 2016, 40, 885–888. [Google Scholar] [CrossRef] [Scilit] [PubMed]
- Wang, R.; Wang, J.; Gao, G.; Hu, J.; Jiang, Y.; Zhao, Z.; Zhang, X.; Zhang, Y.-D.; Wang, X. Prebiopsy mpMRI can help reduce unnecessary prostate biopsies and detect clinically significant prostate cancer in men with PSA 4–10 ng/mL. Clin. Cancer Res. 2017, 23, 3692–3699. [Google Scholar] [CrossRef] [Scilit]
- Garzotto, M.; Hudson, R.G.; Peters, L.; Hsieh, Y.-C.; Barrera, E.; Mori, M.; Beer, T.M.; Klein, T. Predictive modeling for the presence of prostate carcinoma using clinical, laboratory, and ultrasound parameters in patients with prostate specific antigen levels <10 ng/mL. Cancer 2003, 98, 1417–1422. [Google Scholar] [CrossRef] [Scilit]
- Djavan, B.; Remzi, M.; Zlotta, A.; Seitz, C.; Snow, P.; Marberger, M. Complexed prostate-specific antigen, total prostate-specific antigen and percent free prostate-specific antigen for early detection of prostate cancer: Results of an artificial neural network analysis. J. Clin. Oncol. 2002, 20, 921–929. [Google Scholar] [CrossRef]
- Ankerst, D.P.; Hoefler, J.; Bock, S.; Goodman, P.J.; Vickers, A.; Hernandez, J.; Sokoll, L.J.; Sanda, M.G.; Wei, J.T.; Leach, R.J.; et al. Prostate Cancer Prevention Trial risk calculator 2.0 for the prediction of low- vs high-grade prostate cancer. Urology 2014, 83, 1362–1367. [Google Scholar] [CrossRef] [Scilit]
- Roobol, M.J.; Schröder, F.H.; Hugosson, J.; Jones, J.S.; Kattan, M.W.; Klein, E.A.; Hamdy, F.; Neal, D.; Donovan, J.; Parekh, D.J. Importance of prostate volume in the European Randomised Study of Screening for Prostate Cancer (ERSPC) risk calculators: Results from the prostate biopsy collaborative group. World J. Urol. 2012, 30, 149–155. [Google Scholar] [CrossRef] [Scilit]
- Park, J.Y.; Yoon, S.; Park, M.S.; Choi, H.; Bae, J.H.; Moon, D.G.; Hong, S.K.; Lee, S.E.; Park, C.; Byun, S.-S. Development and validation of a prostate cancer risk calculator in the Korean population. PLoS ONE 2017, 12, e0168917. [Google Scholar]
- Louie, K.S.; Seigneurin, A.; Cathcart, P.; Webster, A.; Brown, C.; Burnett, S.; Neal, D.E.; Donovan, J.L.; Hamdy, F.C.; Martin, R.M.; et al. Do prostate cancer risk models improve the predictive accuracy of prostate cancer detection? A meta-analysis. Ann. Oncol. 2015, 26, 848–856. [Google Scholar] [CrossRef] [Scilit]
- Cornud, F.; Bomers, J.; Fütterer, J.J.; Ghai, S.; Reijnen, J.S.; Tempany, C.M.R. imaging-guided prostate interventions. Diagn. Interv. Imaging 2018, 99, 743–753. [Google Scholar] [CrossRef] [Scilit]
- Vourganti, S.; Rastinehad, A.; Yerram, N.; Nix, J.; Volkin, D.; Hoang, A.; Turkbey, B.; Gupta, G.N.; Kruecker, J.; Linehan, W.M.; et al. Multiparametric magnetic resonance imaging and ultrasound fusion biopsy detect prostate cancer in patients with prior negative TRUS biopsies. J. Urol. 2012, 188, 2152–2157. [Google Scholar] [CrossRef] [Scilit]


| Author (Year) | Inclusion Period | Number of Patients | Purpose | Methods |
|---|---|---|---|---|
| Wei et al., 2020 [11] | January 2015–October 2019 | 364 | To predict clinically significant prostate cancer (csPCa) by combining PI-RADS v2 scores derived from biparametric MRI (bpMRI) with clinical indicators in men with prostate-specific antigen (PSA) levels of 4–10 ng/mL. | Univariate and multivariate logistic regression |
| Han et al., 2020 [13] | June 2010–May 2017 | 123 | To compare the diagnostic performance of bpMRI alone versus bpMRI combined with PSA density (PSAD) in detecting csPCa in patients with PSA levels of 4–10 ng/mL. | Univariate and multivariate logistic regression |
| Liu et al., 2020 [12] | 2014–2018 | 235 | To develop a multivariate model using clinical parameters to predict prostate cancer (PCa) and reduce unnecessary biopsies among patients with PSA in the gray zone. | Univariate and multivariate analysis |
| Sun et al., 2019 [15] | January 2015–July 2019 | 335 | To assess whether PI-RADS v2 and neutrophil-to-lymphocyte ratio (NLR) improve detection of csPCa in men with PSA < 10 ng/mL at first biopsy. | Univariate and multivariate analysis |
| Sasanka et al., 2019 [17] | April 2017–October 2018 | 104 | To evaluate the diagnostic performance of free PSA percentage, PSA density, and PI-RADS v2 score alone and in combination for predicting csPCa in patients with PSA 4–10 ng/mL. | Univariate and multivariate analysis |
| Dwivedi et al., 2017 [19] | 2009–2015 | 137 | To develop an mpMRI-based risk score and statistical equation for predicting the risk of PCa in biopsy-naïve men with serum PSA levels of 4–10 ng/mL. | Risk score development using multivariate logistic regression |
| Lu et al., 2019 [20] | January 2014–December 2017 | 357 | To improve detection of PCa by combining PI-RADS v2 and PSA-adjusted volume, particularly in patients with PI-RADS score 3 or PSA 4–10 ng/mL. | Univariate and multivariate analysis |
| Niu et al., 2017 [14] | January 2014–September 2015 | 225 | To establish a predictive nomogram for high-grade PCa in patients with PSA 4–10 ng/mL based on PI-RADS v2, MRI-derived prostate volume, adjusted PSAD, and clinical parameters. | Univariate and multivariate logistic regression |
| Ng et al., 2013 [16] | April 2008–April 2013 | 230 | To investigate the role of the Prostate Health Index (phi) in PCa detection in patients with PSA levels of 4–10 ng/mL undergoing first prostate biopsy in an Asian population. | Multivariate logistic regression |
| Qi et al., 2019 [21] | December 2015–March 2018 | 199 | To develop and validate a radiomics model based on mpMRI for predicting PCa in patients with PSA levels of 4–10 ng/mL and reducing unnecessary biopsies. | Multivariate logistic regression |
| Fang et al., 2015 [22] | 2011–2013 | 345 | To identify characteristics and risk factors for positive biopsy outcomes and develop a risk stratification score in Chinese patients with PSA 4–10 ng/mL. | Univariate and multivariate analysis |
| Liu et al., 2018 [23] | January 2015–July 2017 | 308 | To predict PCa using clinical parameters and reduce unnecessary biopsies among patients with PSA in the gray zone. | Univariate and multivariate logistic regression |
| Chai et al., 2025 [25] | June 2020–June 2024 | 327 | To develop nomograms for predicting PCa and csPCa in patients with PSA < 10 ng/mL and PI-RADS v2.1 score ≤ 3. | Univariate and multivariate logistic regression |
| Ji et al., 2024 [24] | June 2000–February 2023 | 1196 | To develop a risk prediction model using traditional diagnostic methods (PSA, digital rectal examination, transrectal ultrasound) in Asian patients with PSA levels of 4–10 ng/mL. | Univariate and multivariate logistic regression |
| Predictor Category | Variables Included |
|---|---|
| Demographic variables | Age, body mass index (BMI) |
| Lifestyle factors | Smoking status |
| Clinical variables | Digital rectal examination (DRE) |
| PSA-related variables | PSA/tPSA, %free PSA, PSA density (PSAD), prostate volume (PV) |
| Composite PSA indices | %p2PSA, Prostate Health Index (phi), f/t PSA ratio |
| Inflammatory markers | Neutrophil-to-lymphocyte ratio (NLR), lymphocyte-to-monocyte ratio (LMR) |
| Ultrasound-based features | TRUS findings, hypoechoic area |
| MRI modality | Biparametric MRI (bpMRI), multiparametric MRI (mpMRI) |
| MRI scoring systems | PI-RADS v2/v2.1 |
| MRI-derived lesion characteristics | Lesion location, lesion volume, shape, border |
| Advanced imaging techniques | ADC, DW-MRI, MRSI, metabolite ratio |
| Study (Year) | Best Univariate Predictor (AUC) | Best Multivariate Model (AUC) | Key Variables Included |
|---|---|---|---|
| Wei et al. (2020) [11] | PI-RADS v2 (0.827) | PI-RADS v2 + prostate volume (0.882) | bpMRI, PI-RADS v2, prostate volume |
| Han et al. (2020) [13] | bpMRI (0.884) | bpMRI + PSAD (0.907) | bpMRI, PSA density |
| Liu et al. (2020) [12] | mpMRI (0.79) | mpMRI + PSAD (0.84) | mpMRI, PSA density |
| Sun et al. (2019) [15] | PI-RADS v2 (0.854) | PI-RADS v2 + NLR (0.876) | Age, %fPSA, DRE, NLR, PI-RADS v2 |
| Sasanka et al. (2019) [17] | PSAD (0.968) | PSAD + PI-RADS v2 (0.827) | PSA density, PI-RADS v2 |
| Dwivedi et al. (2017) [19] | MRSI (0.83) | MRI-based risk score (0.89) | MRSI, DW-MRI, PSA |
| Niu et al. (2017) [14] | PSAD (0.74) | Nomogram (0.85) | Age, PSA density, PI-RADS v2 |
| Qi et al. (2019) [21] | mpMRI (0.726) | Radiomics model (0.956) | Multi-imaging fusion, age, PSA density |
| Dong Fang et al. (2015) [22] | mpMRI (0.753) | PAMD score (0.824) | Prostate volume, age, MRI, DRE |
| Chang Liu et al. (2018) [23] | PI-RADS v2 (0.855) | PI-RADS v2 + PSAD (0.93) | PI-RADS v2, PSA density |
Disclaimer/Publisher’s Note: The statements, opinions and data contained in all publications are solely those of the individual author(s) and contributor(s) and not of MDPI and/or the editor(s). MDPI and/or the editor(s) disclaim responsibility for any injury to people or property resulting from any ideas, methods, instructions or products referred to in the content. |
© 2026 by the authors. Licensee MDPI, Basel, Switzerland. This article is an open access article distributed under the terms and conditions of the Creative Commons Attribution (CC BY) license.
Share and Cite
Polihronidou, G.; Kondylakis, H.; Marias, K.; Nikiforaki, K.; Papadakis, N. Prediction Factors for Detecting Clinically Significant Prostate Cancer in a PSA Gray Zone (4–10 ng/mL): A Systematic Review. Appl. Sci. 2026, 16, 2975. https://doi.org/10.3390/app16062975
Polihronidou G, Kondylakis H, Marias K, Nikiforaki K, Papadakis N. Prediction Factors for Detecting Clinically Significant Prostate Cancer in a PSA Gray Zone (4–10 ng/mL): A Systematic Review. Applied Sciences. 2026; 16(6):2975. https://doi.org/10.3390/app16062975
Chicago/Turabian StylePolihronidou, Galini, Haridimos Kondylakis, Kostas Marias, Katerina Nikiforaki, and Nikos Papadakis. 2026. "Prediction Factors for Detecting Clinically Significant Prostate Cancer in a PSA Gray Zone (4–10 ng/mL): A Systematic Review" Applied Sciences 16, no. 6: 2975. https://doi.org/10.3390/app16062975
APA StylePolihronidou, G., Kondylakis, H., Marias, K., Nikiforaki, K., & Papadakis, N. (2026). Prediction Factors for Detecting Clinically Significant Prostate Cancer in a PSA Gray Zone (4–10 ng/mL): A Systematic Review. Applied Sciences, 16(6), 2975. https://doi.org/10.3390/app16062975