Article

The Development and Experimental Evaluation of a Non-Invasive Vein Visualization System Using a Near-Infrared Light Source and a Web Camera to Assist Medical Personnel in Radiology Contrast Administration and Venous Access


by
Suphalak Khamruang Marshall
1,*,
Jongwat Cheewakul
1,
Natee Ina
1,
Thirawut Rojchanaumpawan
1,2 and
Apidet Booranawong
2
1
Department of Radiology, Faculty of Medicine, Prince of Songkla University, Songkhla 90110, Thailand
2
Department of Electrical and Biomedical Engineering, Faculty of Engineering, Prince of Songkla University, Songkhla 90110, Thailand
*
Author to whom correspondence should be addressed.
Appl. Sci. 2026, 16(5), 2578; https://doi.org/10.3390/app16052578
Submission received: 4 February 2026 / Revised: 6 March 2026 / Accepted: 6 March 2026 / Published: 7 March 2026
(This article belongs to the Section Biomedical Engineering)

Abstract

Injection-related errors remain a common clinical issue and can cause patient discomfort, hematoma formation, and procedural inefficiencies. The visualization of subcutaneous veins using near-infrared (NIR) imaging has gained attention as an effective approach to reducing such errors, as blood exhibits a higher absorption of NIR light than surrounding tissue. In this study, a low-cost, non-invasive vein visualization system is presented to support safer and more accurate venous access. The proposed system integrates an NIR illumination source and a modified webcam within a compact equipment enclosure, allowing subjects to be conveniently examined by placing their arm inside the device. Vein images are automatically acquired using a laptop-based platform, followed by digital image processing techniques for vein enhancement and visualization. Laboratory-scale experiments were conducted on healthy volunteers to evaluate system performance under multiple conditions, including different vein locations (upper and lower arm regions), varying distances between the NIR light source and the arm (15 cm and 20 cm), and ambient illumination interference (light sources on and off). The experimental results demonstrate the successful implementation and reliable operation of the proposed system. Effective vein visualization was achieved across all test conditions, as confirmed by qualitative visual assessment and quantitative image quality metrics, including the Peak Signal-to-Noise Ratio (PSNR) and Mean Squared Error (MSE). Overall, the proposed system offers a practical, accessible, and cost-effective solution for vein visualization, showing strong potential for clinical and experimental applications aimed at reducing injection errors and improving venous access reliability.

1. Introduction

The intravenous injection of iodinated contrast media is an indispensable component of contrast-enhanced computed tomography (CT) and other cross-sectional imaging procedures. Accurate peripheral venous access is essential not only for achieving diagnostic image quality but also for preventing complications associated with the delivery of high-flow contrast agents via power injectors. Contrast media extravasation, a frequent adverse event in intravenous contrast administration, occurs when contrast leaks into surrounding tissues and can cause pain, swelling, delayed imaging workflow, and, in rare but severe cases, tissue necrosis or compartment syndrome [1]. A recent study by Liu et al. determined that females, diabetes, venous thrombosis, multi-site angiography, and an injection rate > 3 mL/s are the primary risk factors for contrast media extravasation [2]. Therefore, minimizing the incidence of extravasation is regarded as a significant patient safety objective in contemporary radiology and interventional practice.
Moreover, venipuncture is traditionally performed using palpation and the visual inspection of superficial veins; however, these techniques are inherently operator-dependent and often unreliable in patients with difficult vascular access. Such challenges are commonly observed in elderly individuals with reduced skin turgor, patients with elevated body mass index, pediatric populations, and individuals with fragile or poorly visible veins. These limitations have been widely reported as major contributors to failed cannulation attempts, increased procedure time, patient discomfort, and elevated healthcare costs [3,4]. In response, assistive imaging technologies—particularly near-infrared (NIR) vein visualization systems—have been developed to enhance subcutaneous vein visibility by exploiting the differential absorption of infrared light by hemoglobin relative to surrounding tissue. Clinical trials and experimental studies have demonstrated that NIR-based vein imaging can improve vein localization accuracy and reduce the number of cannulation attempts, especially in patients with difficult venous access [5,6]. More recent investigations further confirm the clinical potential of NIR vein visualization as a non-invasive and user-friendly tool to support venous access procedures across diverse patient populations [7].
Consequently, NIR imaging has emerged as a promising modality for vein visualization. Biological tissues are optically highly scattering media, characterized by a short mean free path between scattering events, typically on the order of sub-millimeter distances in the NIR spectral window (700–1000 nm). Within this wavelength range, photon propagation is dominated by multiple scattering interactions, whereas intrinsic absorption by tissue constituents is comparatively weak. The principal source of optical absorption arises from hemoglobin contained in blood, which occupies approximately 5–10% of the tissue volume under normal physiological conditions [8]. Light penetration is maximized, while hemoglobin, particularly deoxygenated hemoglobin within veins that strongly absorb NIR energy, causes veins to appear as salient low-intensity structures in captured images. As a result, a number of commercial NIR vein finders such as VeinViewer and AccuVein have been developed, illustrating how reflected NIR light can be captured and projected to reveal subsurface vasculature in real time. Furthermore, NIR trials have shown enhanced visualization of valves, bifurcations, and deeper veins up to several millimeters below the skin surface [9,10]. Moreover, such devices have demonstrated improvements in vein identification and may reduce the number of puncture attempts in select clinical contexts. Nonetheless, the high purchase and maintenance costs of these commercial systems remain a barrier to widespread adoption in many practice settings, particularly in low-resource environments where safe vascular access is equally important [11]. To reduce system cost, extensive research has focused on developing low-cost NIR vein visualization systems that combine commercially available imaging hardware with open-source image processing algorithms for real-time superficial vein visualization. The early implementations of such systems have employed complementary metal–oxide–semiconductor (CMOS) sensors or NIR-sensitive camera modules integrated with dedicated NIR LED illumination arrays to enable the real-time visualization of venous structures at a markedly lower cost than commercial vein-finder devices. Notably, validation studies involving diverse subject populations have demonstrated that these low-cost prototypes can provide high-quality visualization of peripheral venous patterns without the need for a tourniquet, emphasizing their potential utility in supporting reliable and efficient venipuncture procedures. This approach has also enabled the development of low-cost platforms for real-time superficial vein visualization, with particular potential to facilitate venous access in settings where commercial vein-finder devices are unavailable or cost-prohibitive [12].
Concurrently, studies have integrated classic image processing techniques—such as Contrast Limited Adaptive Histogram Equalization (CLAHE), median filters, unsharp masking, and morphological segmentation—to enhance vascular contrast in infrared images. These methods improve the signal-to-noise ratio and enable a more robust differentiation of vein structures from surrounding tissue in low-cost imaging modalities. Quantitative metrics including the Peak Signal-to-Noise Ratio (PSNR), Mean Squared Error (MSE), and Structural Similarity Index Measure (SSIM) are increasingly used to benchmark quantitative enhancement performance across processing approaches [13,14,15,16]. Additionally, recent work has further expanded to machine learning-augmented vein segmentation, with deep convolutional networks (e.g., modified U-Net architectures) achieving high precision in detecting antecubital fossa veins, even when deployed on portable embedded platforms such as Raspberry Pi systems [17]. These advances demonstrate that AI-based image interpretation, when coupled with low-cost NIR imaging hardware, can approximate the performance of more expensive clinical systems while maintaining affordability and portability [18]. Such low-cost systems are particularly valuable in populations with difficult venous access, where conventional palpation and visualization frequently fail. Evidence suggests that NIR vein visualization can shorten procedure times, reduce the number of needle insertions, and enhance clinician confidence in challenging cases, a crucial advantage in pediatrics, gerontology, and emergency care where time efficiency and patient comfort are paramount [19,20,21]. In addition to hardware and algorithmic advances, the literature highlights a growing interest in device usability and clinical integration. User-centered prototype studies, such as mobile NIR assistive tools built from standard smartphones, have demonstrated improved acceptance and an enhanced educational value among novice clinicians, thereby reinforcing the potential broad impact that they can make across healthcare settings if practical performance and workflow integration are achieved [22].
However, despite the progress, challenges remain in standardizing low-cost NIR imaging systems for clinical practice. As variability in skin pigmentation, subcutaneous tissue thickness, and illumination conditions can affect imaging quality, the computational limitations of embedded devices can additionally constrain real-time performance. Furthermore, controlled clinical studies directly linking low-cost NIR guidance to reduced contrast media extravasation rates in image-guided procedures are still limited. This represents an important avenue for future research [23,24].
In this context, this study presents the design, implementation, and performance evaluation of a low-cost NIR vein visualization system developed to enhance the visualization of superficial veins in the antecubital region prior to venipuncture. Furthermore, the proposed system comprises a modified commercial webcam integrated with 940 nm NIR LED illumination and incorporates customized image processing algorithms to improve vascular contrast and overall image quality. Experiments were conducted in the laboratory with different test scenarios. To assess the device and system’s performance, several vein sites on participants’ arms (upper and lower arms), distances between the NIR light source and arm position, and interferences from light lamps (on and off) were evaluated. Furthermore, system performance was assessed under controlled experimental conditions using both quantitative image quality metrics, including the PSNR and MSE, and qualitative evaluations of vein visibility. By emphasizing cost efficiency, simplicity, and clinical applicability, the proposed approach aims to facilitate safer and more reliable venous access, thereby contributing to a reduction in the contrast media extravasation risk in diagnostic imaging and other intravenous procedures. The remainder of this paper is organized as follows. Section 2 describes the materials and methods, including the study design, image processing, equipment construction, and graphical user interface (GUI) development. Section 3 presents the experimental results. Section 4 discusses the findings, and Section 5 addresses this study’s limitations. Finally, Section 6 concludes this paper.

2. Materials and Methods

2.1. Study Design

2.1.1. Participates

The proposed system and prototype were evaluated in a cohort of healthy participants. Eight subjects—four men and four women—were recruited, representing a range of ages (20–40 years), heights, weights, and skin tones. The study cohort included individuals of Thai and Thai-Chinese descent. Based on recommendations from medical experts, the participant selection criteria were defined as follows. The inclusion criteria were: age 18 years or older, normal and unrestricted arm mobility, and voluntary agreement to participate as documented by signed informed consent. The exclusion criteria were: inability to move the arm, presence of lesions in the arm region, inflammation or swelling of the arm, and impaired arm flexion. Participants were withdrawn from this study if they requested withdrawal at any time or were subsequently found to meet any of the exclusion criteria during the course of this study.

2.1.2. The Configuration of the NIR Vein Visualization System

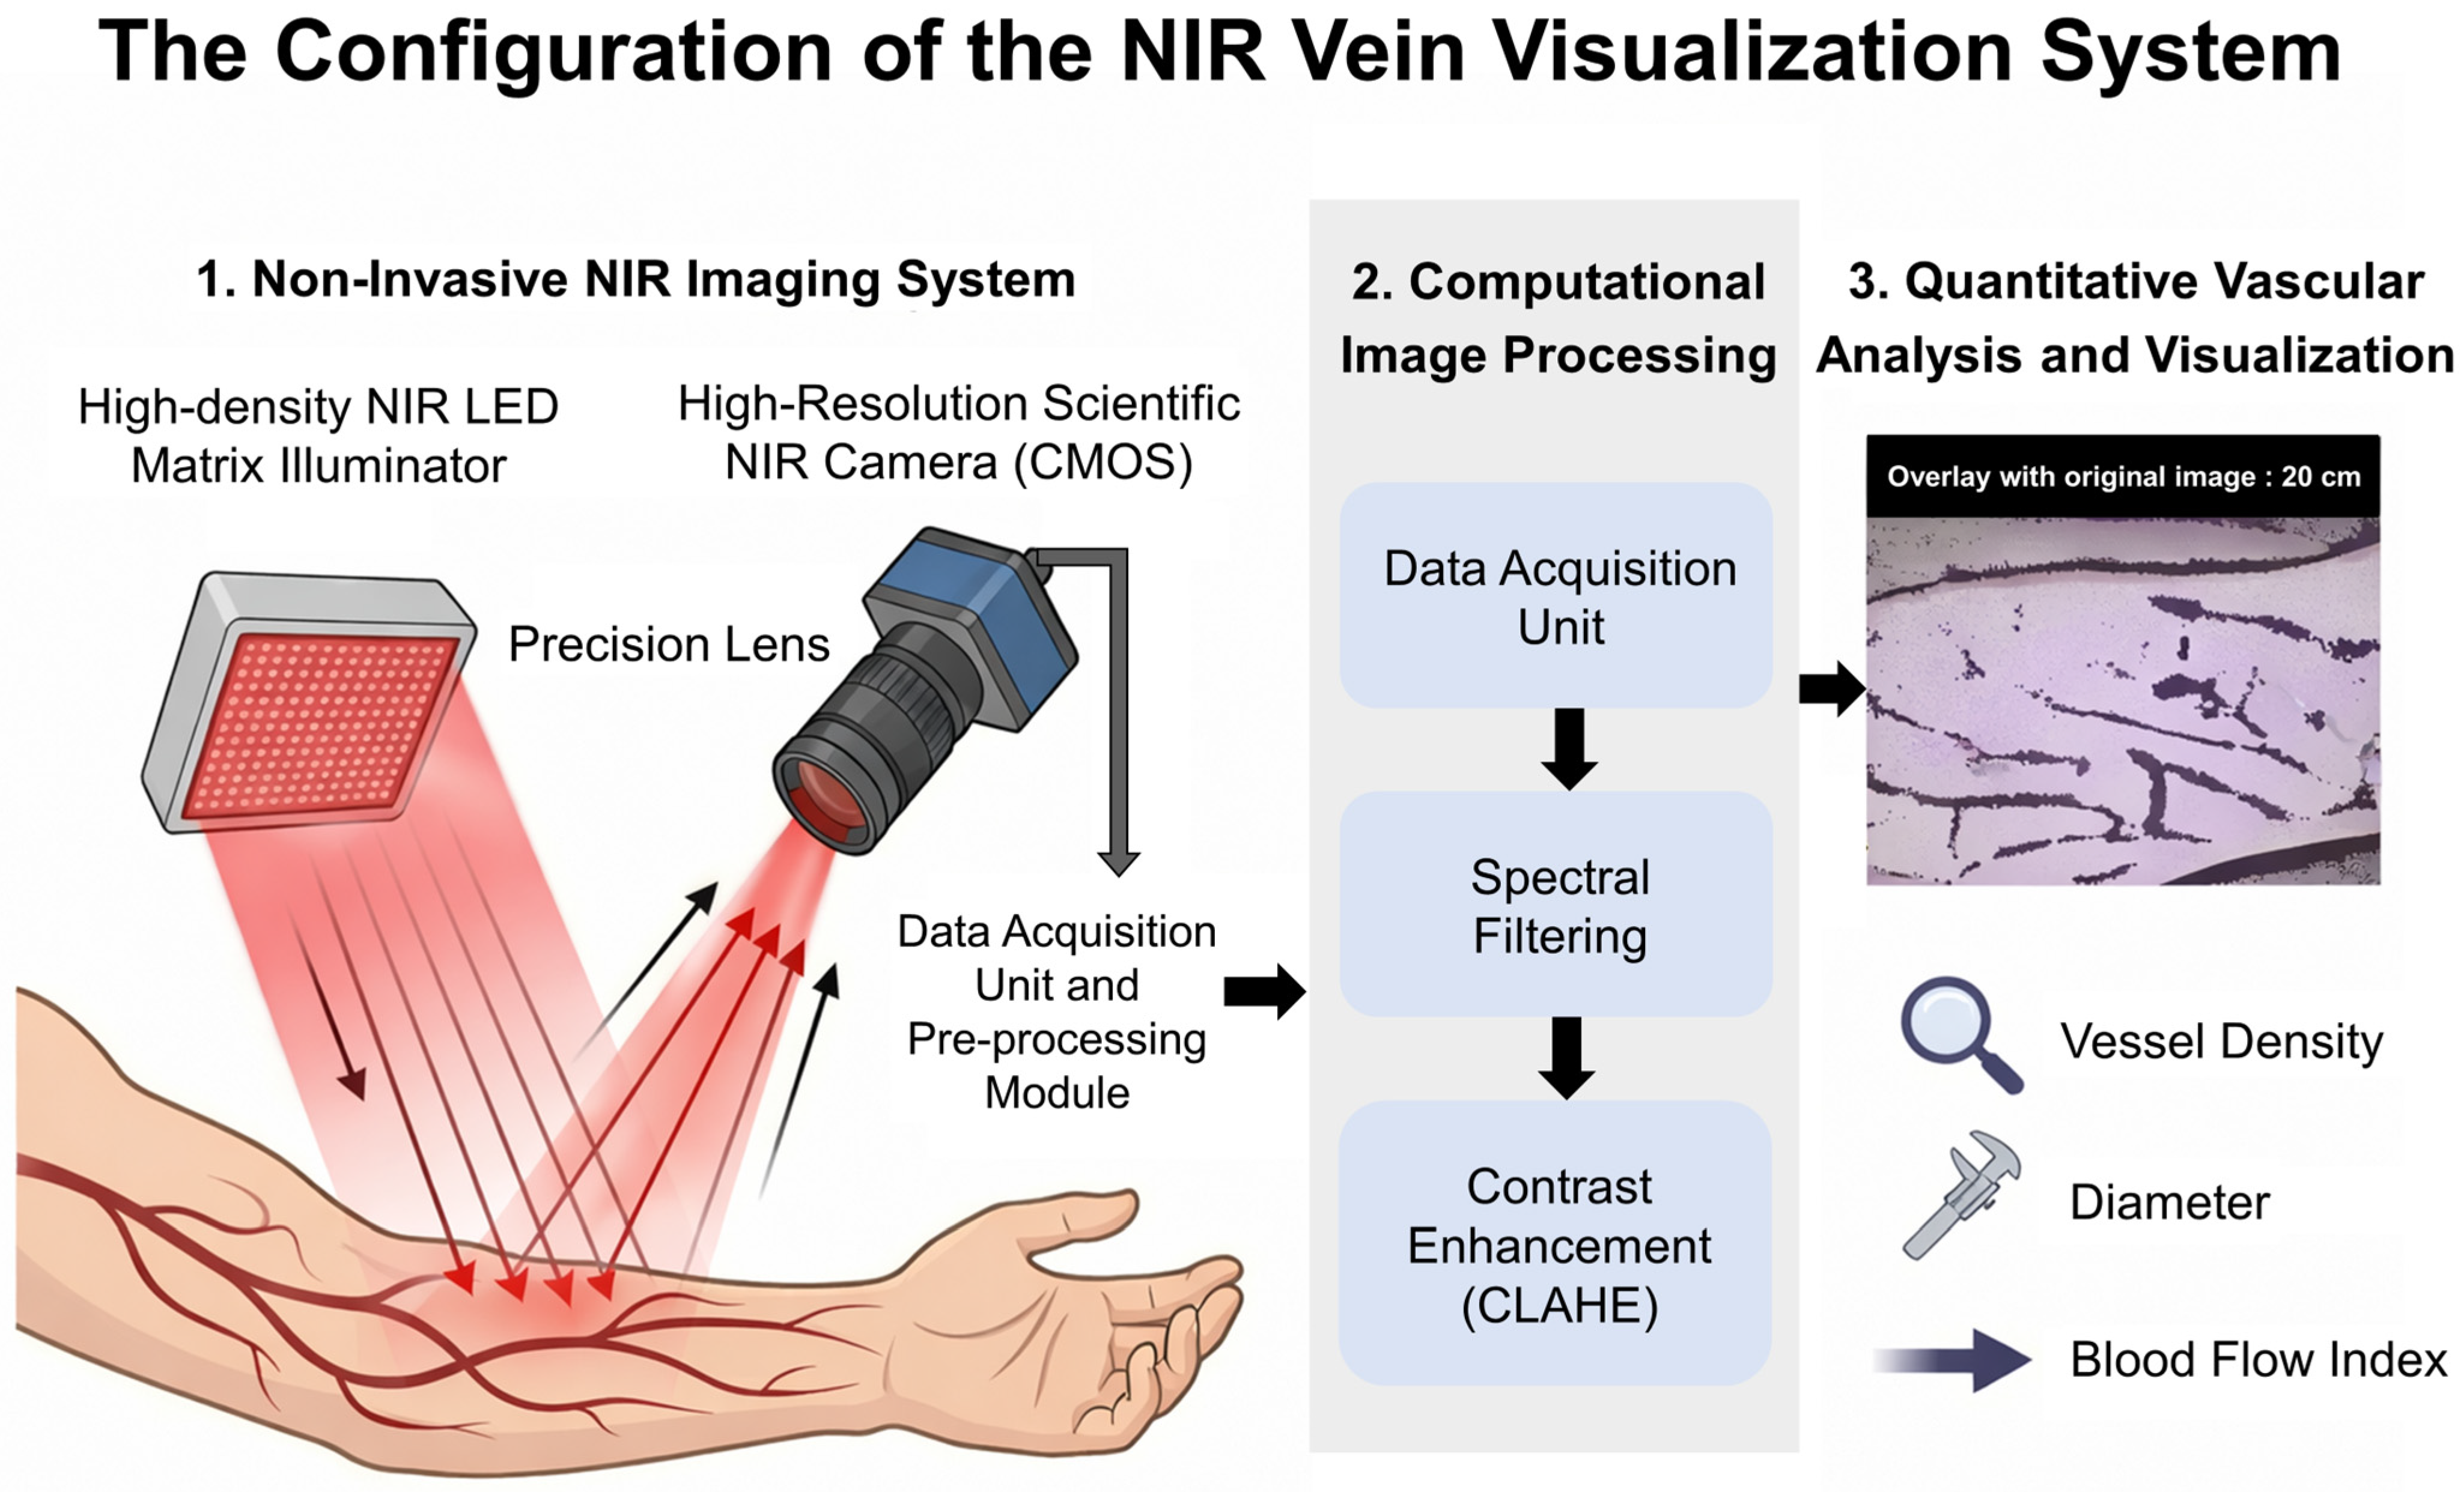
Figure 1 illustrates the overall configuration of the NIR vein visualization system developed in this study. The system consists of a Logitech C270 HD webcam, which was internally modified to remove the built-in infrared blocking filter, thereby allowing the sensor to capture images within the near-infrared spectral range. Illumination was provided by an array of 940 nm NIR LEDs positioned above the imaging region to ensure uniform light distribution across the subject’s forearm. The modified webcam was used to acquire images of the antecubital region, where superficial veins are typically accessed during venipuncture. The captured images were transferred to a personal computer (PC) via a universal serial bus (USB) interface for subsequent image processing. Image acquisition and processing were conducted using MATLAB software version R2024b (MathWorks, Natick, MA, USA). The acquired images underwent a series of digital image processing operations designed to enhance vascular contrast and extract venous structures. The processing pipeline included grayscale conversion, noise reduction using Gaussian filtering, and contrast enhancement through histogram equalization. Subsequently, adaptive thresholding and morphological segmentation techniques were applied to isolate the region of interest (ROI) corresponding to visible vein patterns. This configuration integrates low-cost hardware components with customized image enhancement algorithms to provide a practical and accessible method for visualizing superficial veins prior to venipuncture. The system is intended to support superficial vein visualization for venous access in diagnostic imaging and related clinical applications. However, any potential benefit in improving procedural accuracy or reducing the risk of contrast media extravasation has not been clinically established and therefore requires prospective clinical validation.

2.1.3. Camera System (Webcam Modification)

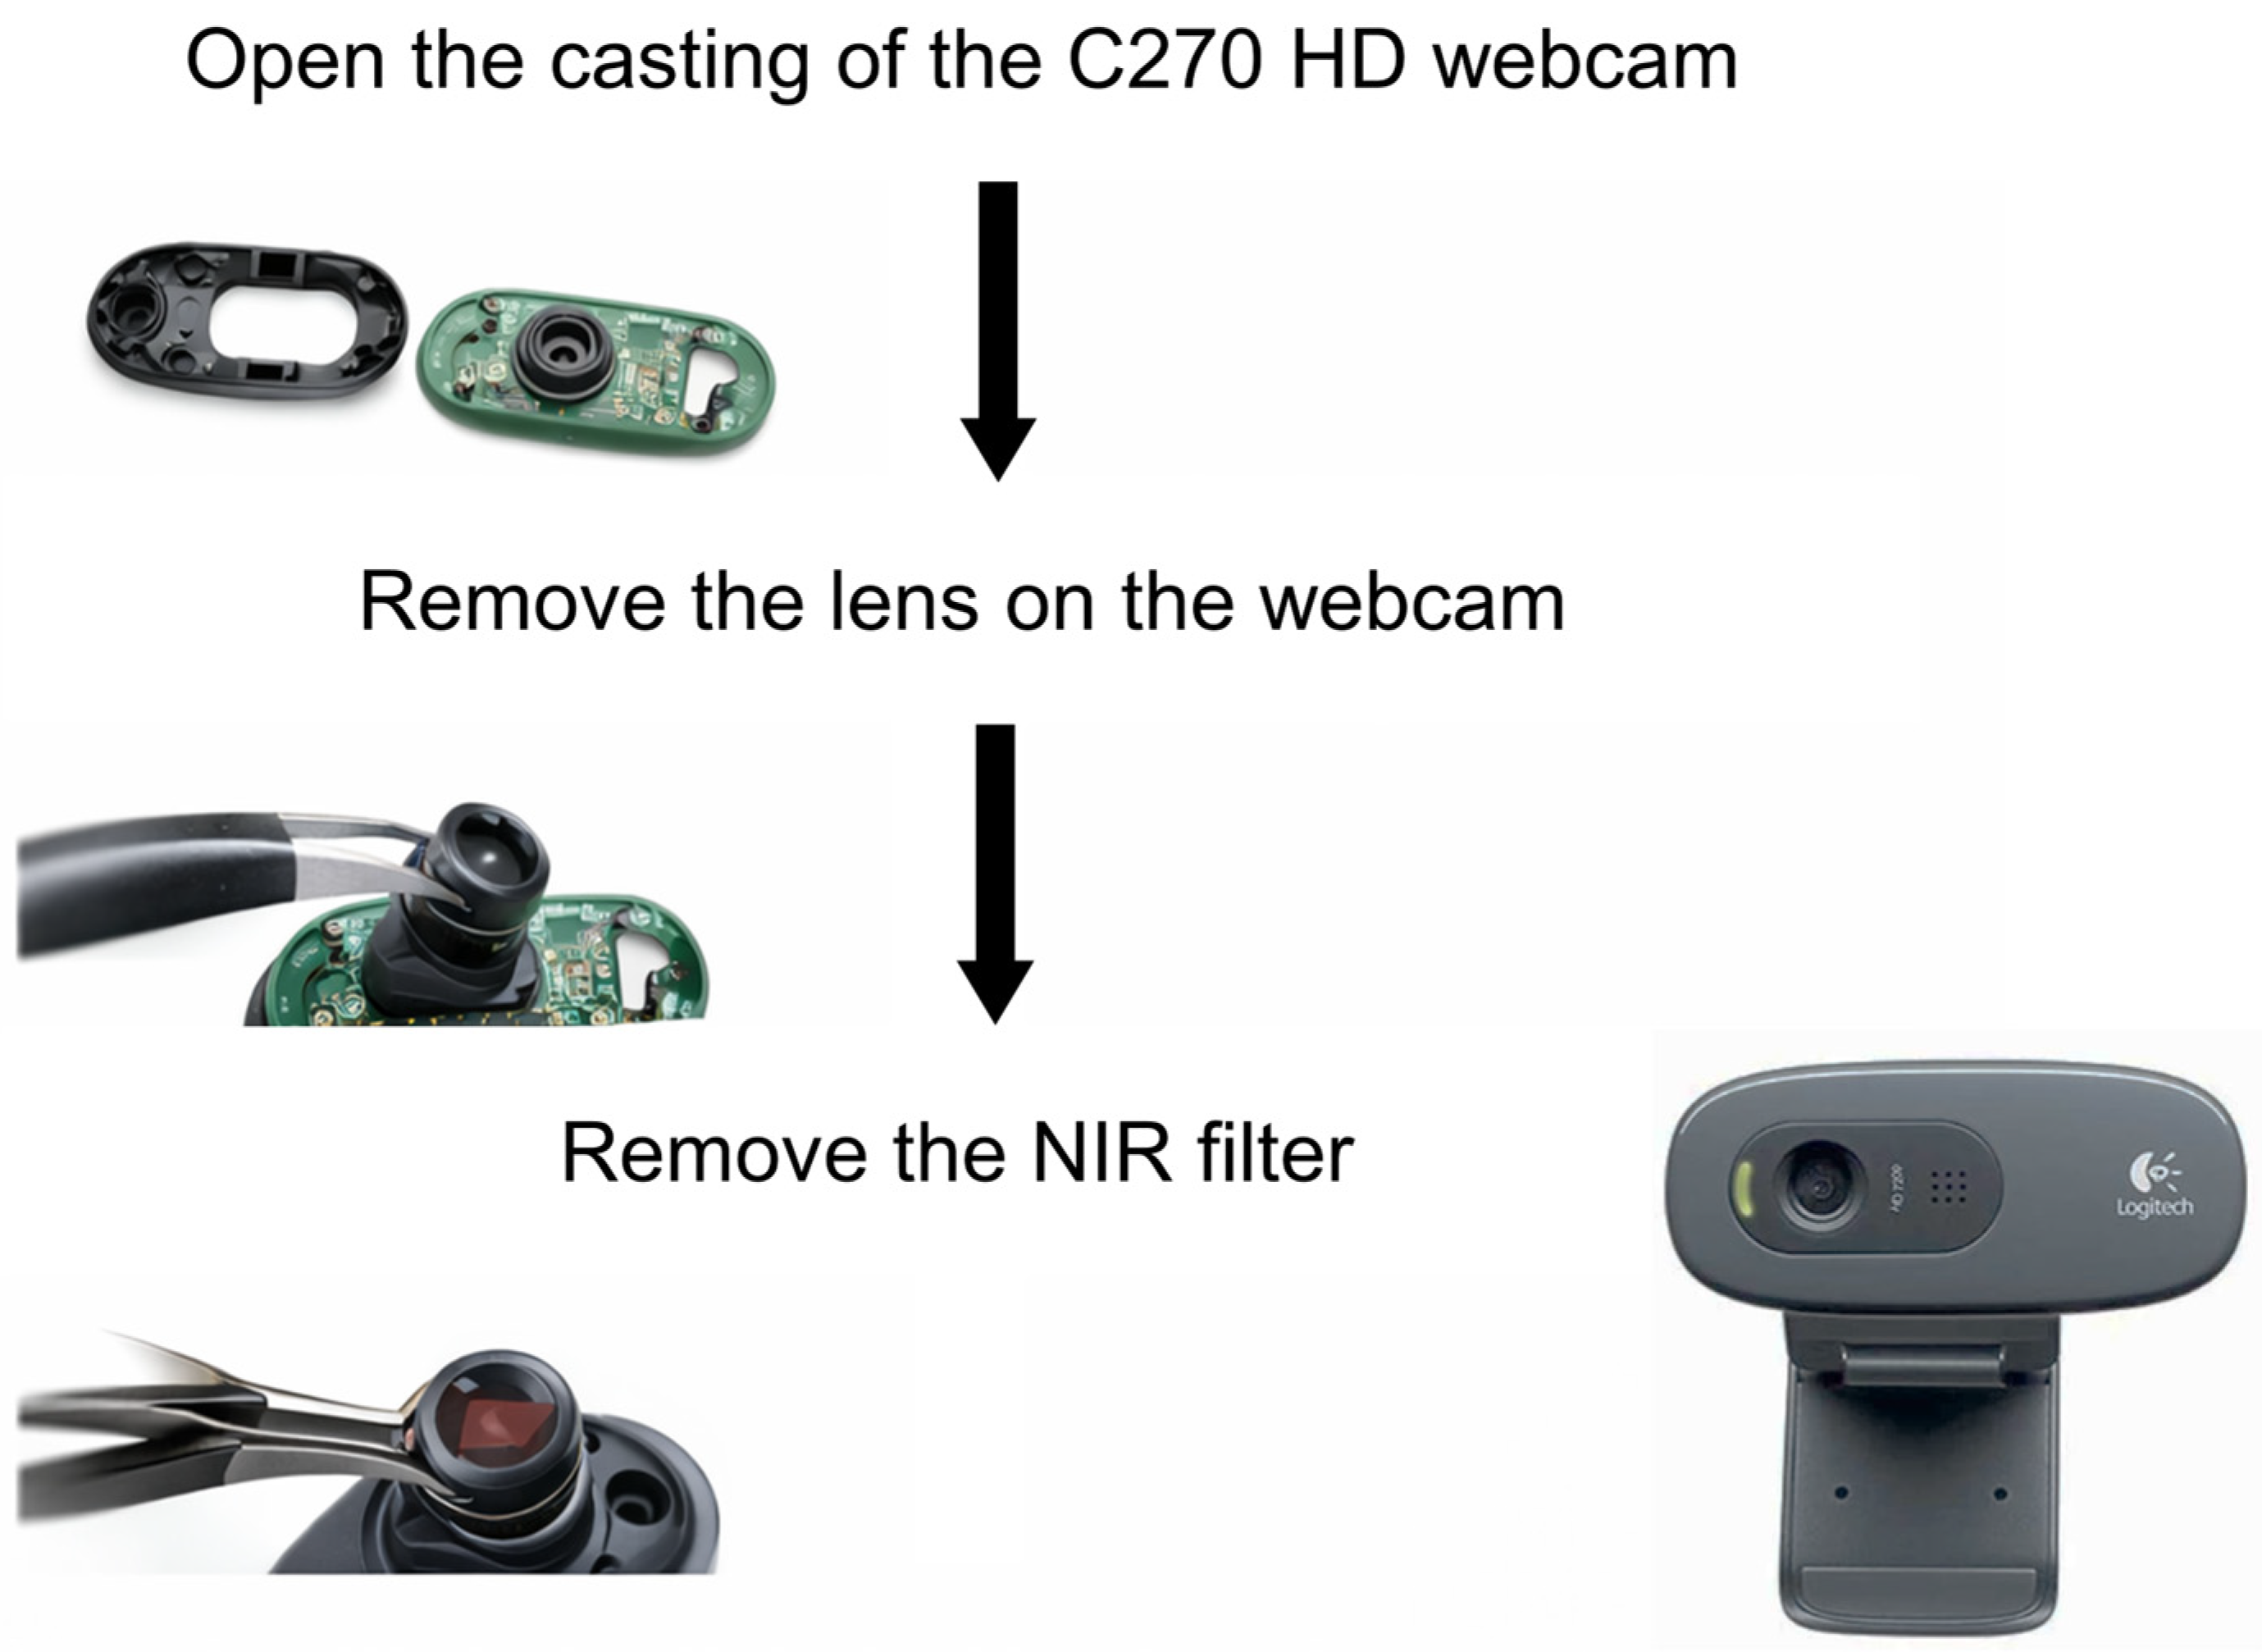
The imaging component used in this study was a Logitech C270 HD webcam (Logitech Europe S.A., Lausanne, Switzerland), selected for its low cost, commercial availability, and suitability for modification to meet the system design requirements. The webcam provides HD image resolution sufficient for reliable digital image processing and analysis. Prior to experimental use, the webcam was internally modified to enable image acquisition in the NIR range by removing the NIR-cut filter positioned in front of the lens. This step was performed carefully to avoid damage to the lens assembly and internal components. In standard webcams, the NIR-cut filter blocks near-infrared wavelengths so that only visible light reaches the sensor, thereby limiting sensitivity to NIR illumination. Because the proposed system operates with a 940 nm NIR LED light source for superficial vein visualization, the removal of the filter was required to allow NIR wavelengths to reach the sensor. The modification procedure is illustrated in Figure 2. The Logitech C270 has a maximum resolution of 720p at 30 fps, fixed focus, and a universal mounting clip.

2.1.4. Lighting System (Near-Infrared Light Source)

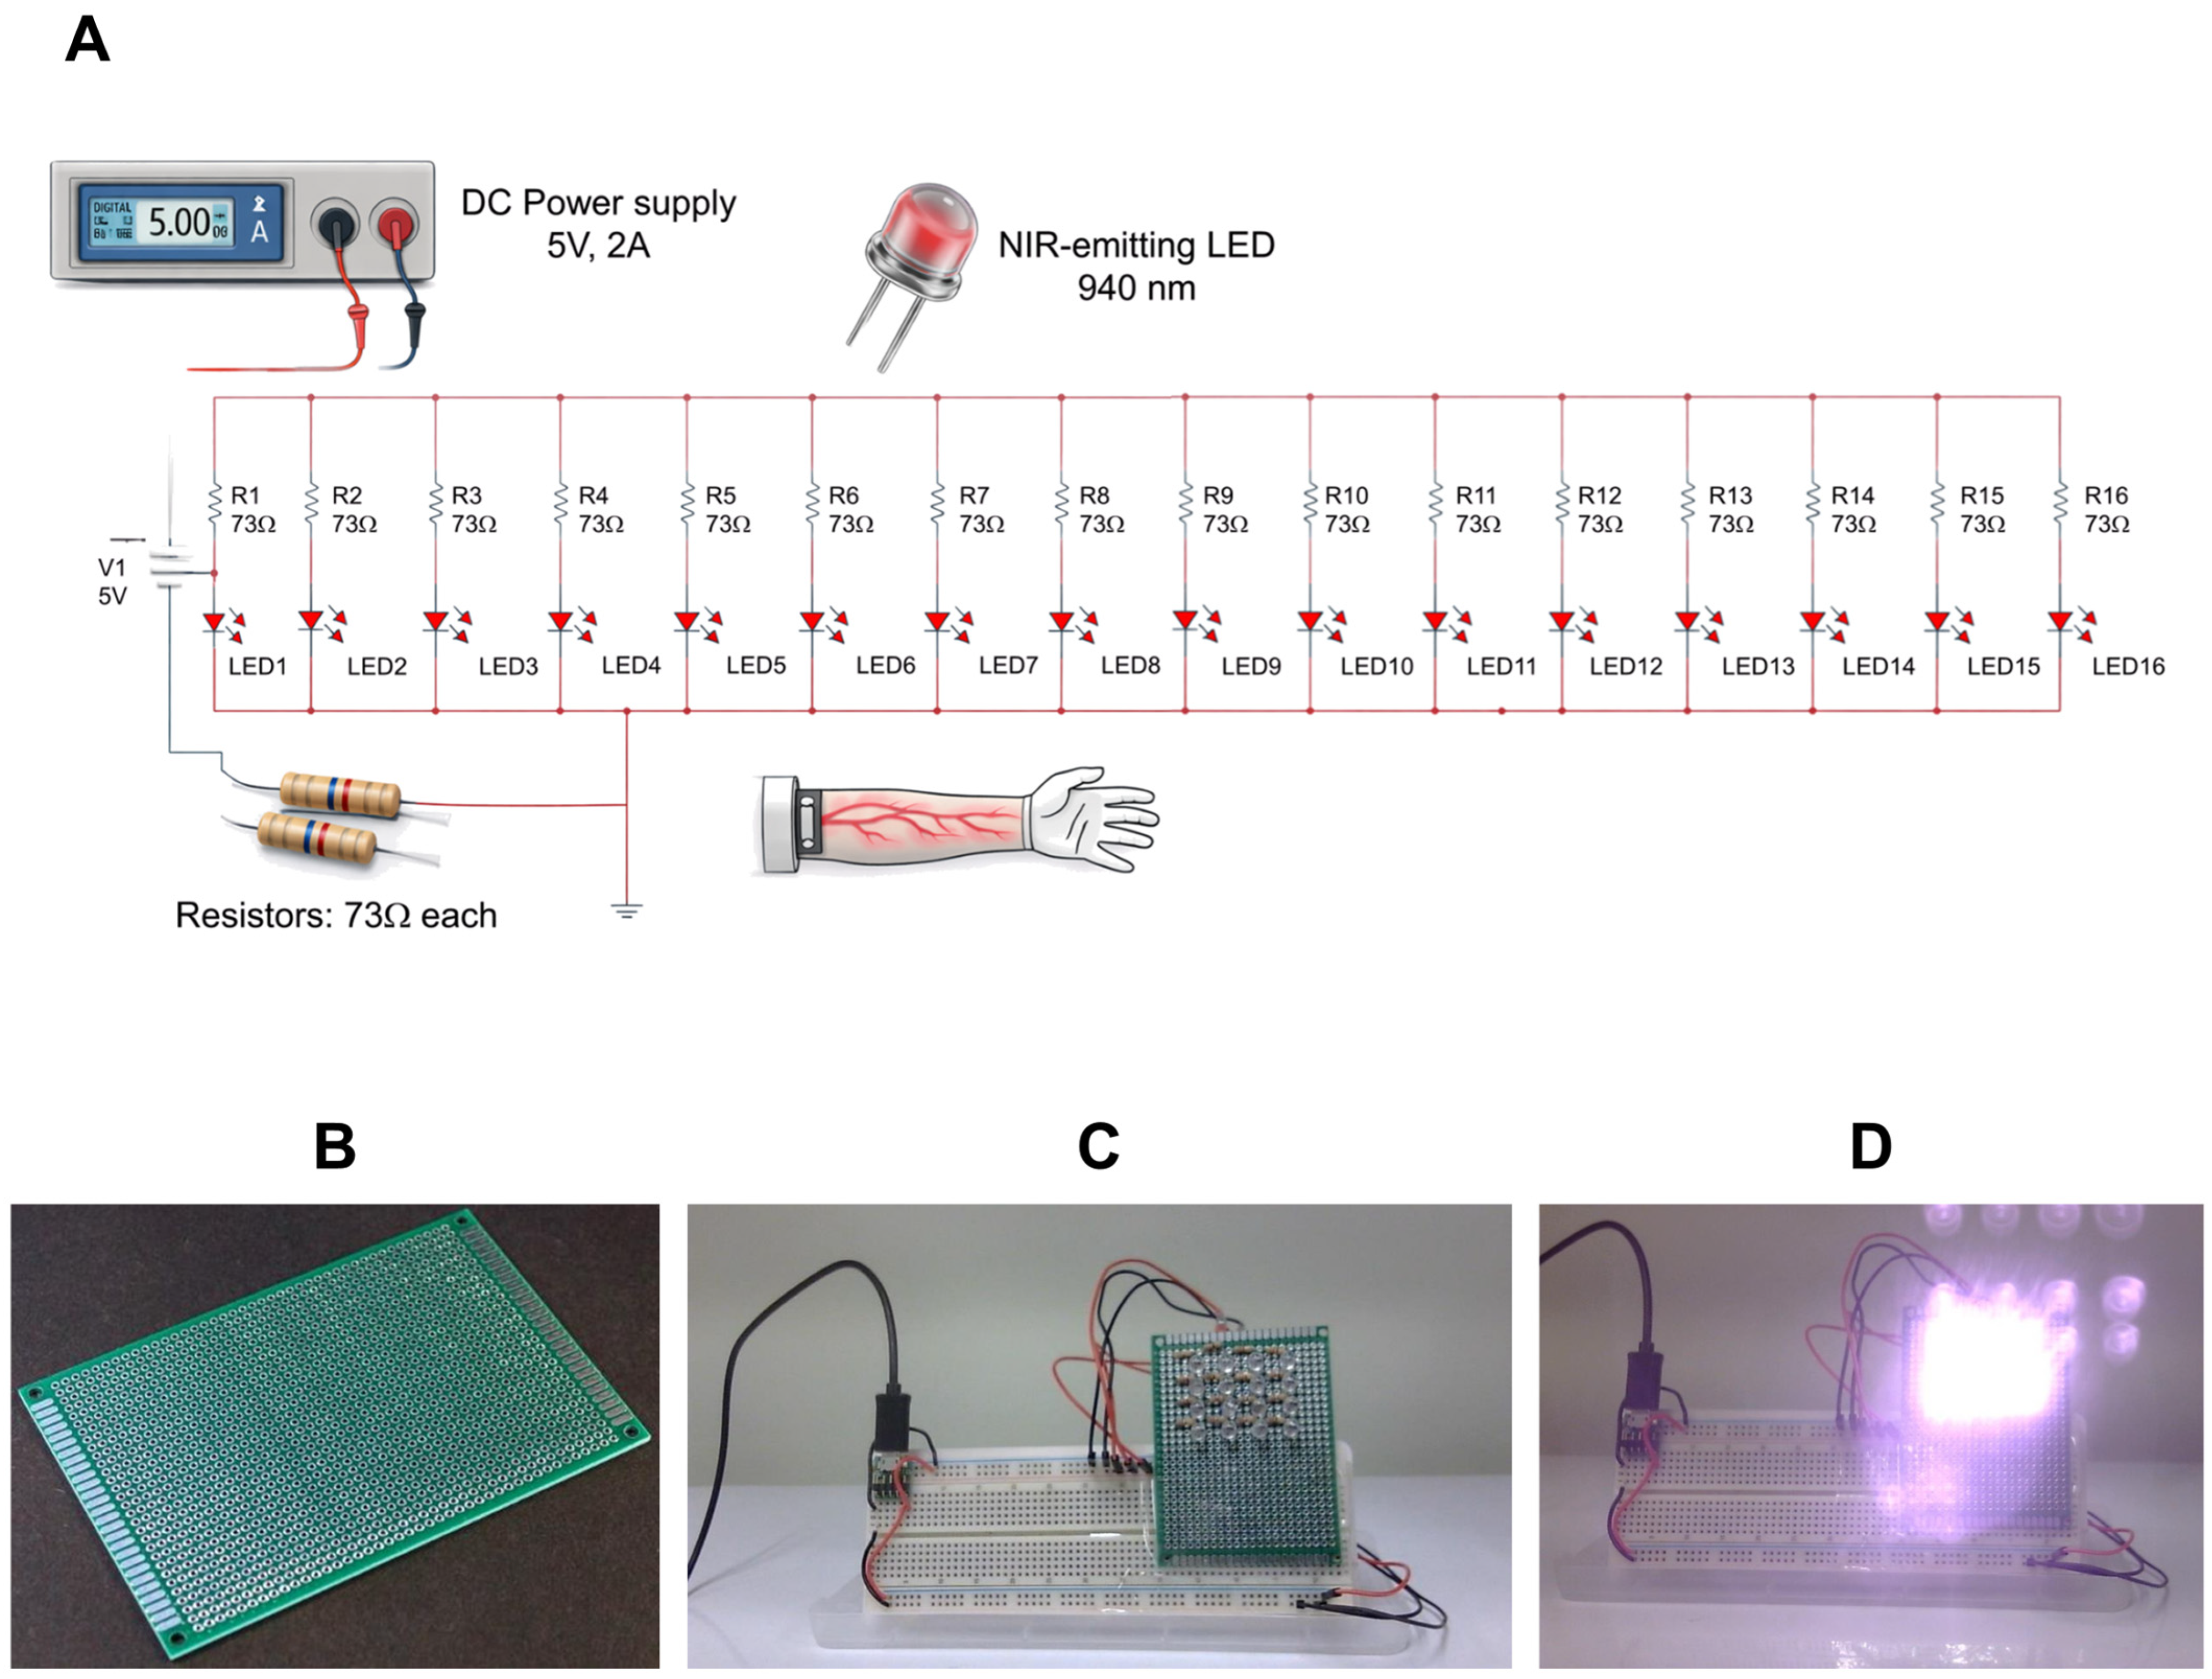
Figure 3 illustrates the design and circuit simulation of the NIR illumination system developed for this study. A wavelength of 940 nm was selected for superficial vein visualization because it provides strong contrast between blood and surrounding tissue due to higher absorption by deoxygenated hemoglobin. The circuit design followed the manufacturer’s datasheet, with forward current (IF) and forward voltage (VF) set to 50 mA and 1.4 V, respectively. The illumination module was powered by a 5 V, 2 A DC supply, and the required series resistance (R) for each LED was calculated using Equation (1) (Ohm’s law). Because a 72 Ω resistor was unavailable, 51 Ω and 22 Ω resistors were connected in series to provide an equivalent resistance slightly above the calculated value, improving operational safety.
R e s i s t o r   V a l u e = [ P o w e r   s u p p l y   v o l t a g e L E D   v o l t a g e   d r o p × n u m b e r   o f   L E D s ] F o r w a r d   c u r r e n t
For the physical illumination array, 16 NIR LEDs were used to achieve uniform illumination across the imaging area. During the design phase, 4, 9, and 16 LED configurations were evaluated, and the final 16 LED configuration (Figure 3A) was selected because it provided more uniform illumination across the target region. The circuit was implemented on a through-hole prototyping PCB (Figure 3B), with all components mounted and soldered according to the finalized schematic. The module was powered by a 5 V, 2 A DC source, and each LED was paired with an appropriate resistor to maintain current within safe operating limits. Testing confirmed uniform emission and stable operation during continuous use. The completed NIR LED array and its illumination characteristics are shown in Figure 3C,D.

2.2. Image Processing

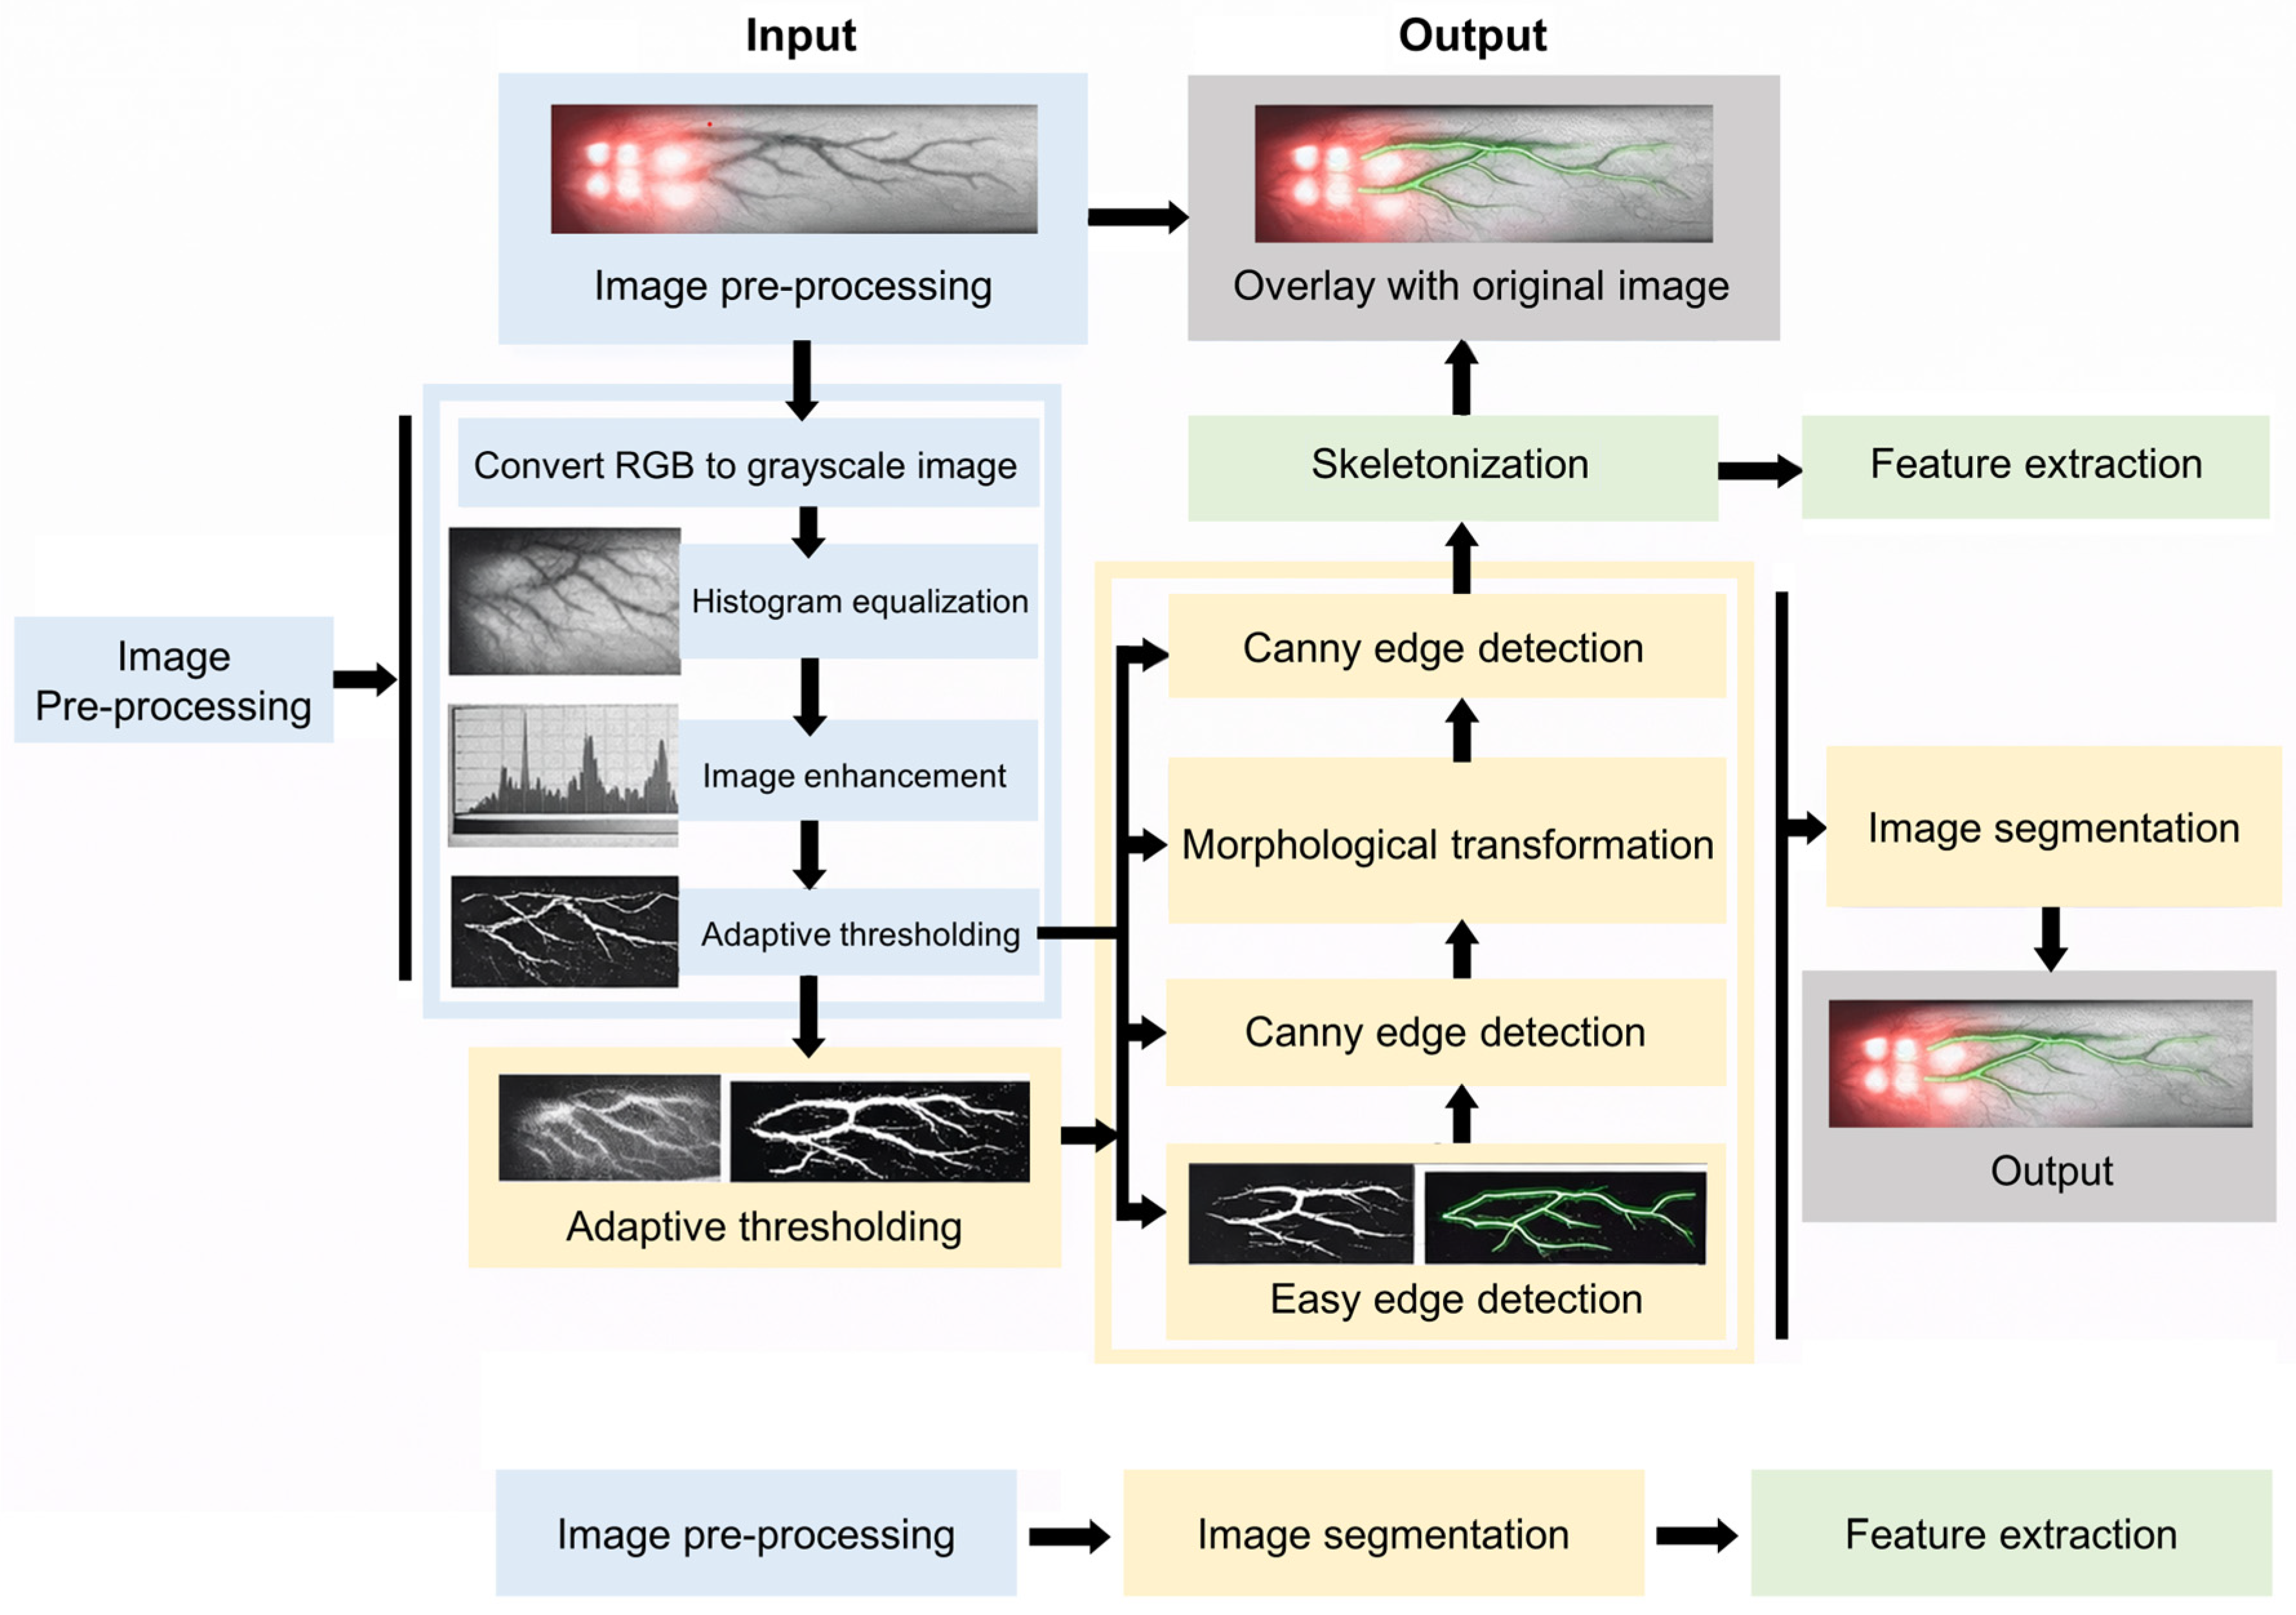
The image processing workflow of the proposed system comprised three stages, image pre-processing, image segmentation, and feature extraction, designed to refine image quality, enhance vascular contrast, and isolate vein structures for visualization (Figure 4; Appendix B). The framework was developed based on previously reported techniques [7,11,19], and detailed mathematical formulation and supporting background are provided in Appendix B to support reproducibility. The system configuration and processing parameters were further optimized in this study to achieve reliable performance consistent with the requirements identified by medical experts.

2.2.1. Image Pre-Processing

Image pre-processing prepared the captured data for analysis. RGB images were converted to grayscale, followed by histogram equalization to improve contrast. Noise was reduced using a 3 × 3 median filter while preserving vessel edges. The image was then enhanced to emphasize vessel-related high-frequency details and improve vessel-to-background separation. Adaptive thresholding generated a binary image using local thresholds to compensate for non-uniform illumination. Finally, the image was cropped to remove background and focus on the ROI (Figure 4).

2.2.2. Image Segmentation

Image segmentation aimed to separate vascular regions from surrounding tissue to improve vein visibility and localization. As shown in Figure 4, segmentation was performed after pre-processing using the enhanced image as input. Histogram equalization and adaptive thresholding were applied to improve contrast and enable robust binarization under non-uniform illumination. Canny edge detection was then used to delineate vessel boundaries, followed by morphological transformations to remove small artifacts and improve the continuity of fragmented vessel structures. This process produced a cleaner segmented vein pattern for subsequent feature extraction.

2.2.3. Feature Extraction

Feature extraction emphasized the structural characteristics of the segmented vasculature to support clear superficial vein visualization. As shown in Figure 4, skeletonization was applied to reduce the segmented vessels to a centerline representation while preserving network topology, including continuity and branching. The resulting vascular pattern was then overlaid on the original image to improve interpretability and visualize superficial veins within their anatomical context.

2.3. Equipment Rack Construction

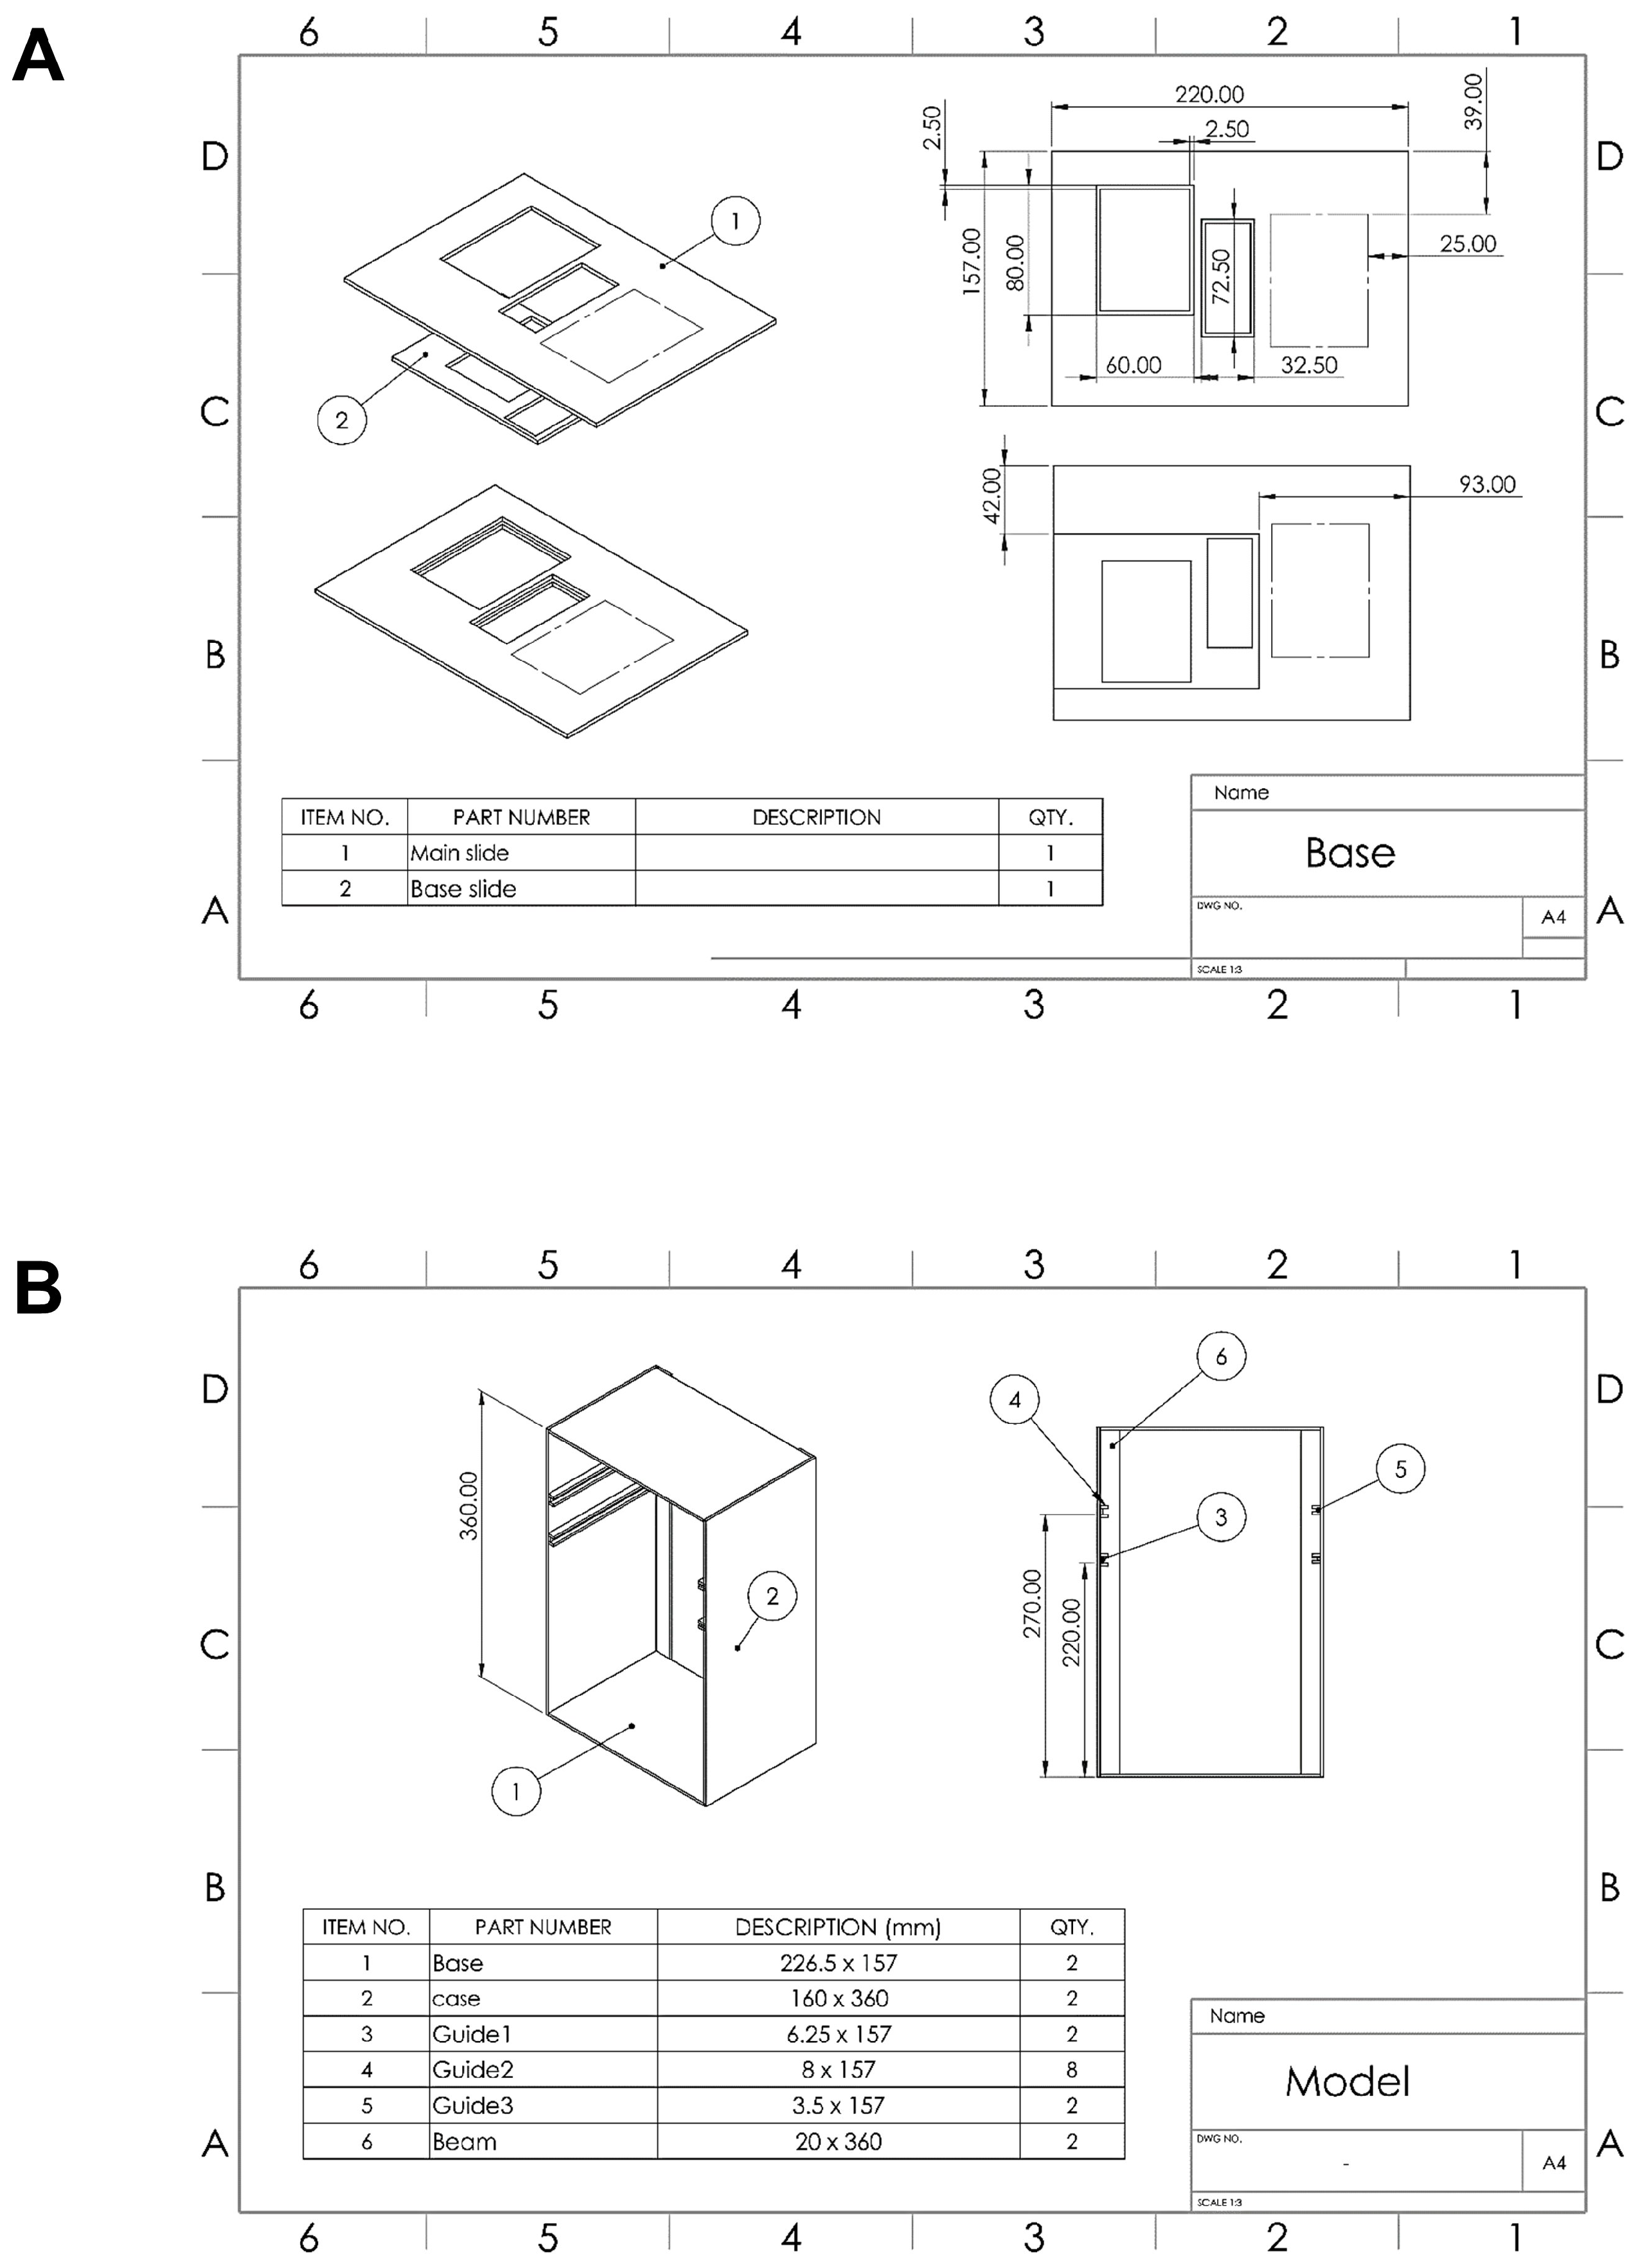
The equipment rack served as the structural framework for mounting and aligning the camera module and NIR light source. The rack was designed in SOLIDWORKS (Dassault Systèmes, Vélizy-Villacoublay, France) and fabricated from acrylic using a laser-cutting workflow (RDWorks), then assembled with acrylic adhesive to ensure rigid and precise component alignment (Figure 5A). As shown in Figure 5A,B, the structure includes a base platform and housing enclosure that maintain consistent alignment between the camera, illumination source, and the subject’s arm within the imaging area. The rack also supports adjustable spacing between components, and two working distances (15 cm and 20 cm) were used to evaluate the effect of source-to-arm distance on image quality and vein visibility.

2.4. Graphical User Interface (GUI) Development Using Python

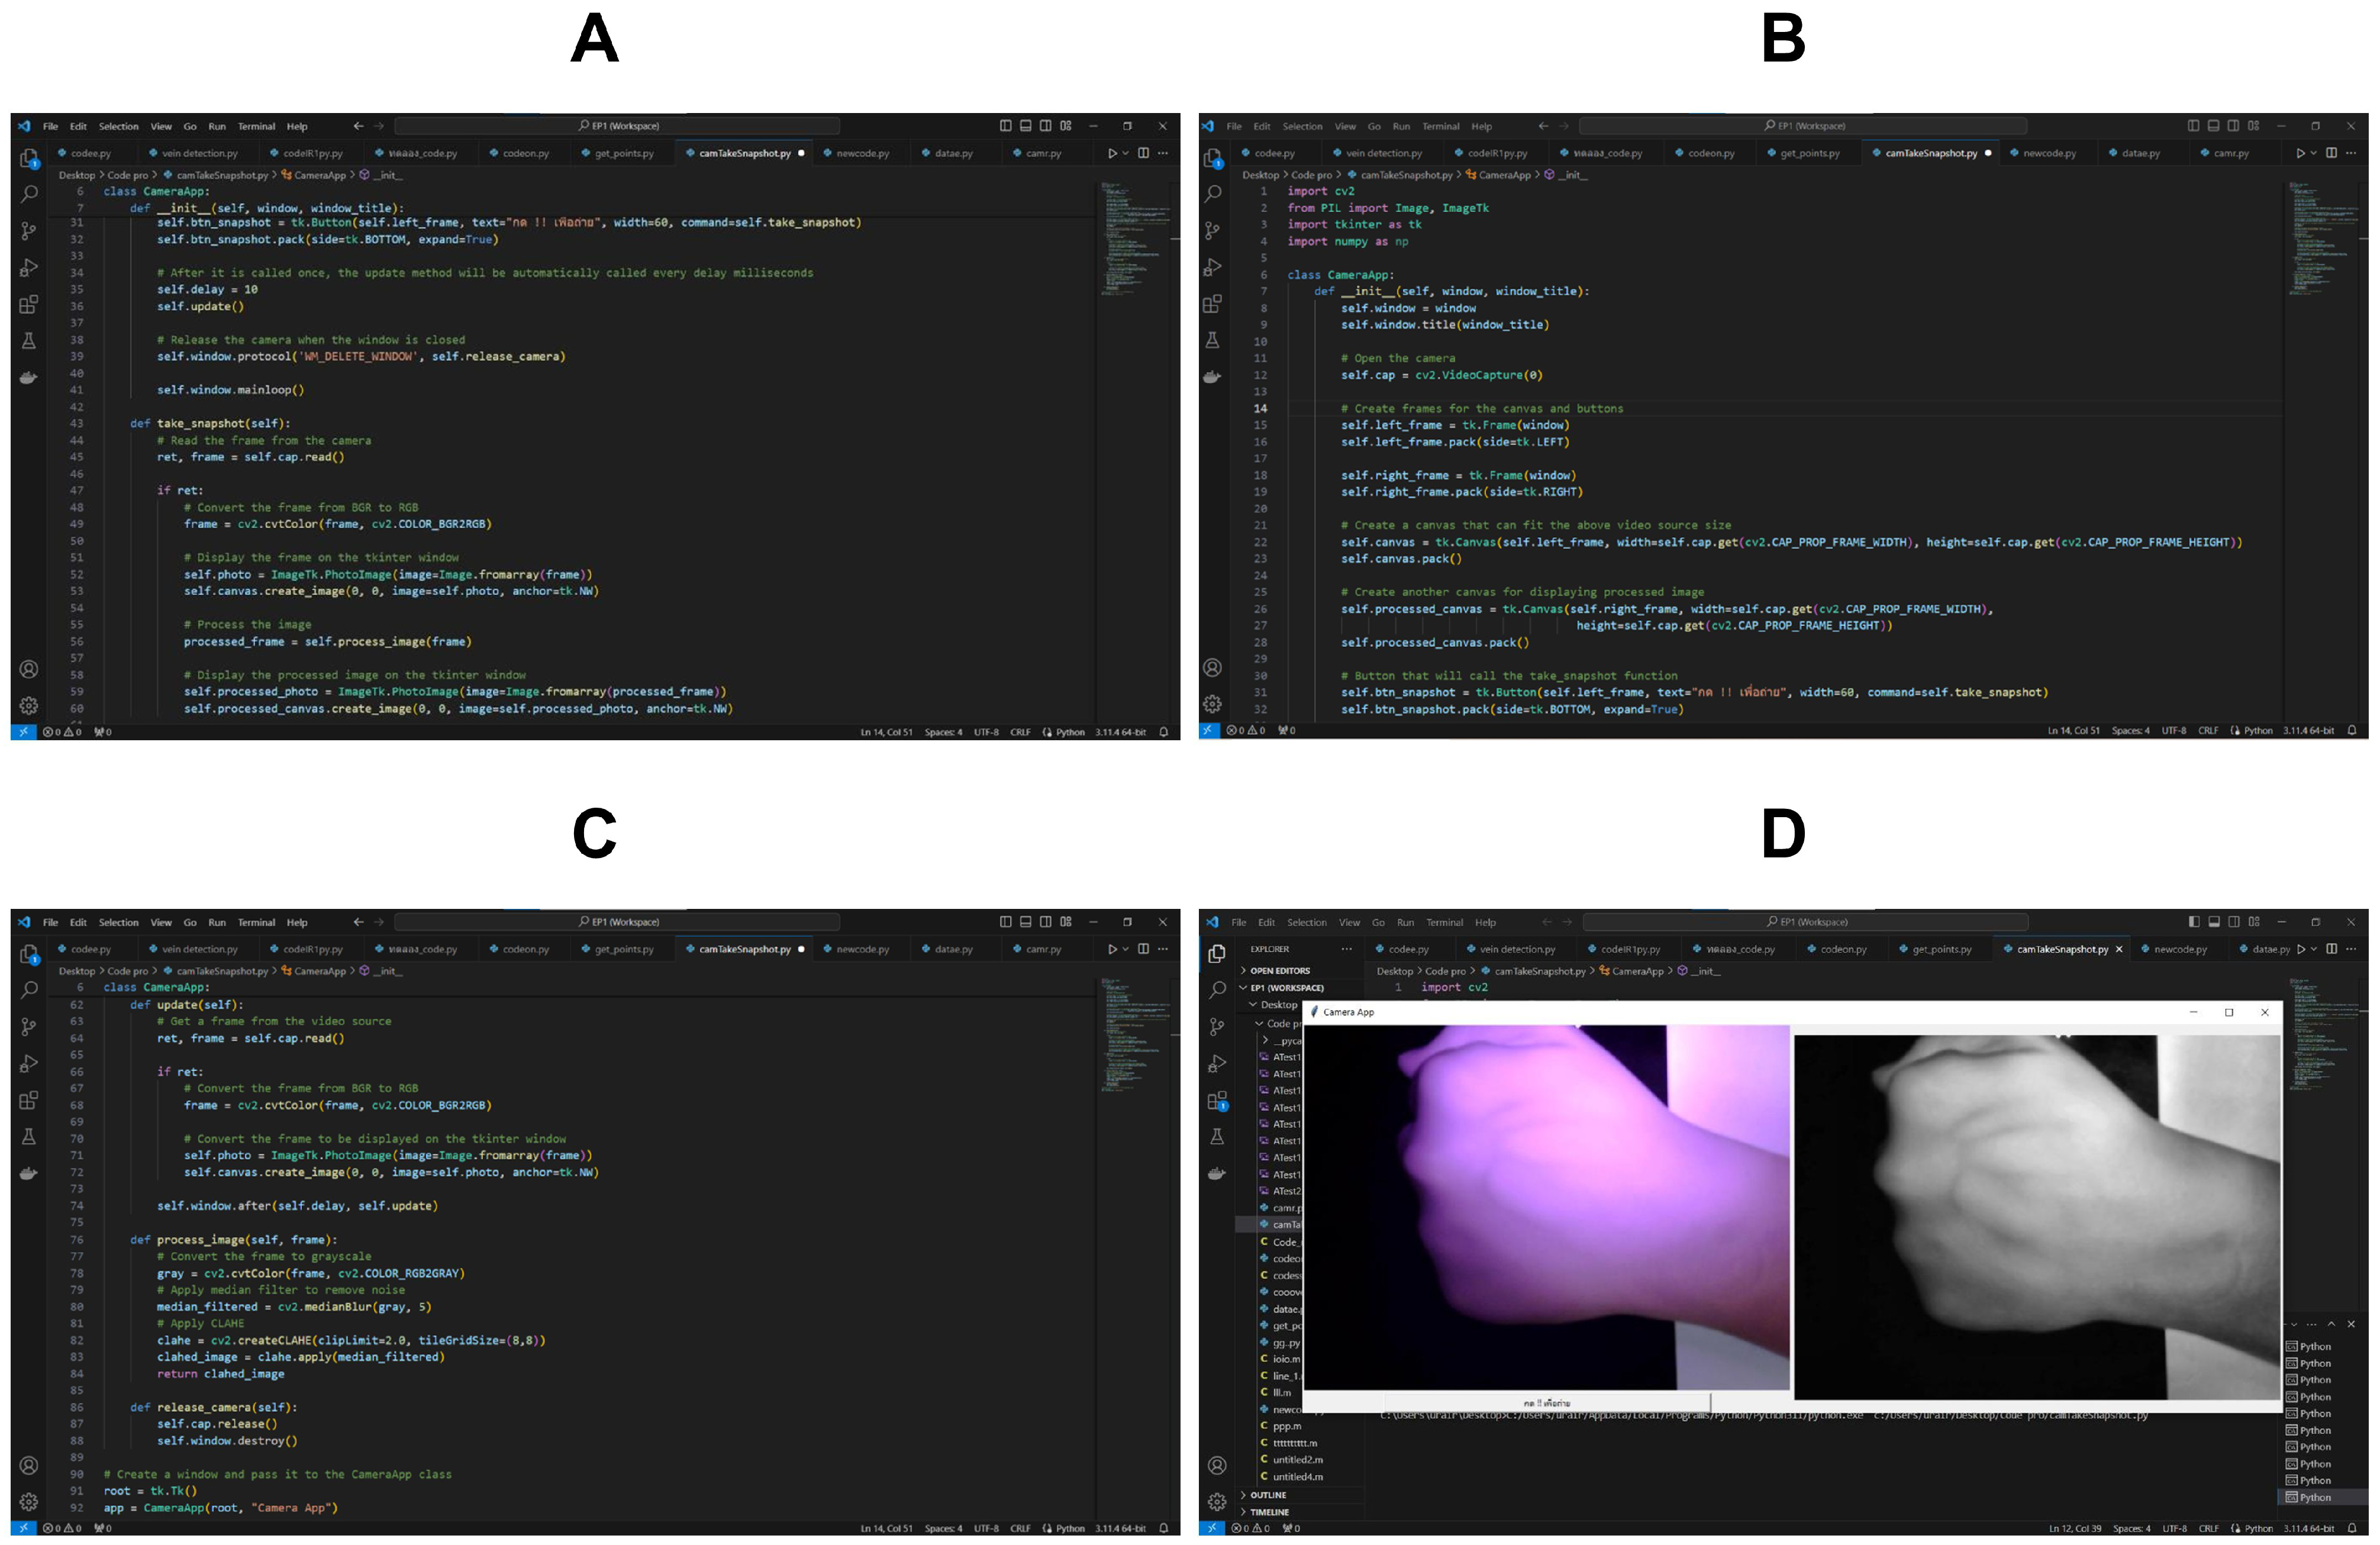
The GUI was developed in Python 3.12.3 (Python Software Foundation, Wilmington, DE, USA) to improve the operational efficiency and usability of the NIR vein visualization system. It was designed to simplify user interaction and integrate image acquisition and processing within a single platform. The GUI replicates the image processing framework originally implemented in MATLAB, preserving the same algorithmic sequence and logic across three stages: image pre-processing, image segmentation, and feature extraction. These stages were adapted and optimized in Python to ensure consistent performance and reproducibility relative to the MATLAB prototype (Figure 6). The GUI provides two core functions: real-time image acquisition from the connected webcam and the execution of the predefined image processing pipeline to enhance vein visibility within the selected ROI. The processing workflow includes grayscale conversion, contrast enhancement, adaptive thresholding, and feature extraction. The interface displays the original and processed images concurrently for direct comparison and allows users to save both outputs for documentation and further analysis. Overall, the GUI provides a stable and user-friendly interface that supports the practical implementation of the proposed low-cost NIR vein visualization system.
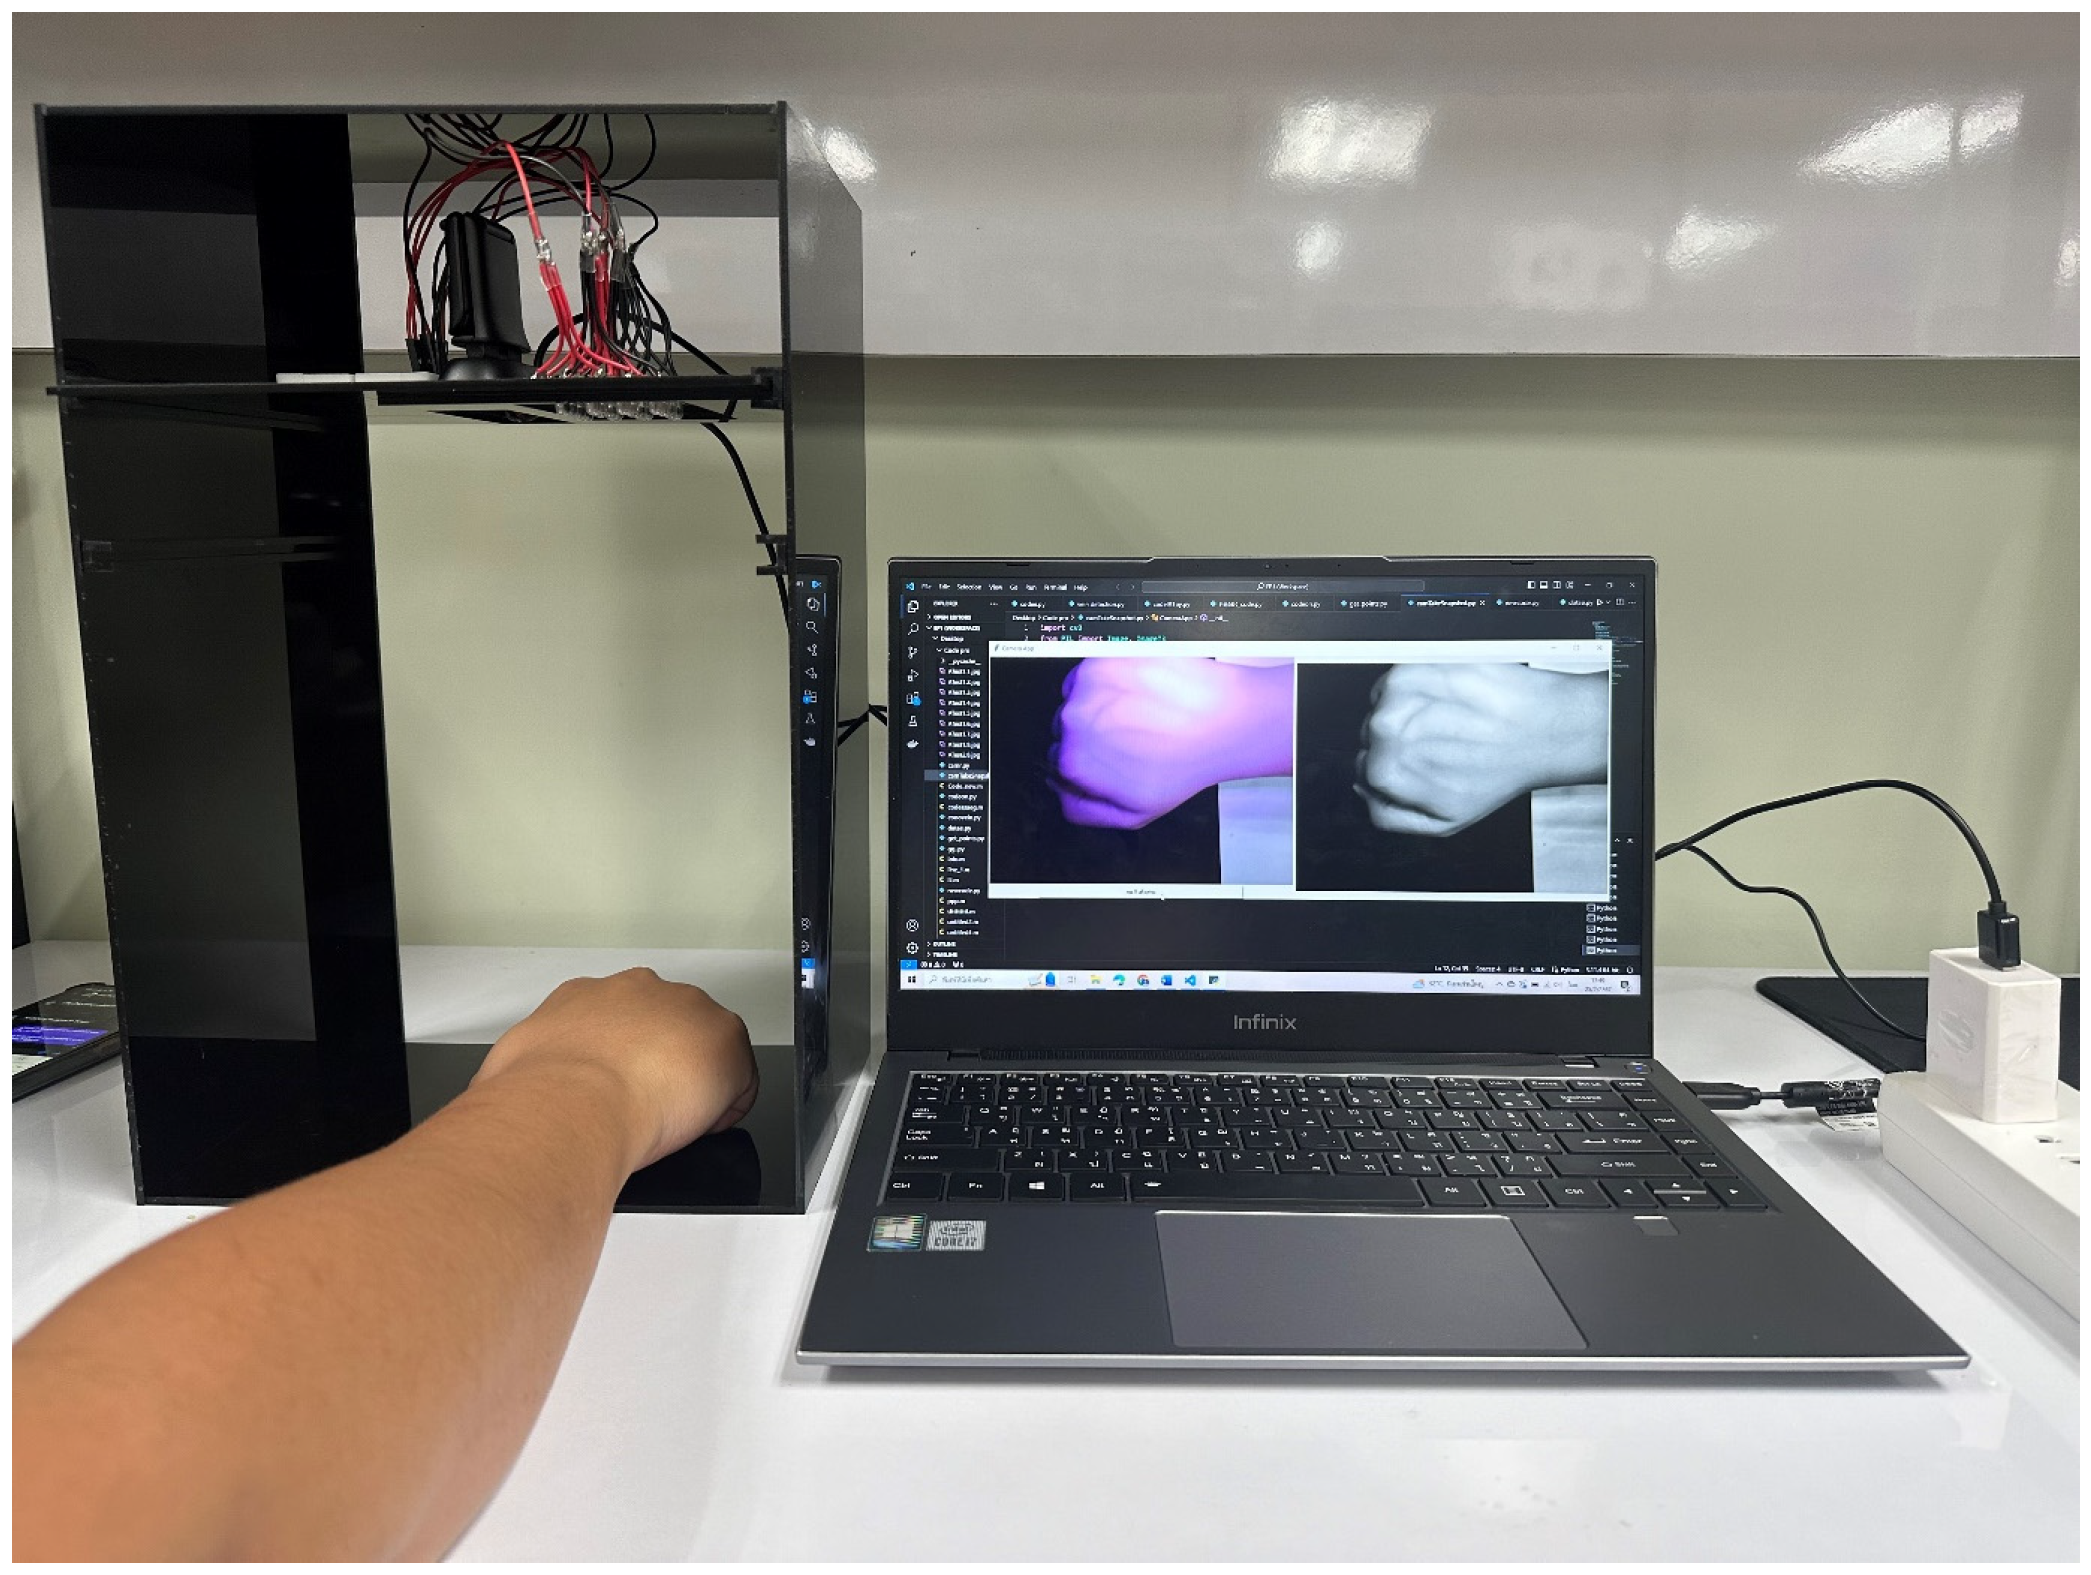
According to the system design and configuration described in Section 2.1 (i.e., webcam modification and NIR light source implementation) and the equipment construction in Section 2.3, a prototype of a low-cost NIR vein visualization system is demonstrated in Figure 7. The image processing algorithm—comprising image pre-processing, image segmentation, and feature extraction, as described in Section 2.2—is implemented on a computer. The prototype, shown in Figure 7, assists patients and medical professionals by displaying and reporting real-time vein visualization results through a GUI (Section 2.4) on PCs during testing. In addition, the prototype is portable and can be easily installed in medical workplaces according to user requirements.

3. Results

In this work, as mentioned in the previous section, experiments were conducted in a laboratory in the daytime at Prince of Songkla University, where healthy subjects were tested. All subjects read and signed a consent form for participating in this research project. Before this experiment, the subjects also practiced the test based on medical expert recommendation. Thus, the subjects were familiarized with the setup and the experiment. To prevent any potentially damaging occurrences or risks to the subjects, we controlled surroundings with safety equipment to support the subjects. Additionally, our team strictly followed ethical principles for medical research involving human subjects. The principles of the WMA Declaration of Helsinki were used as guidelines for this study.
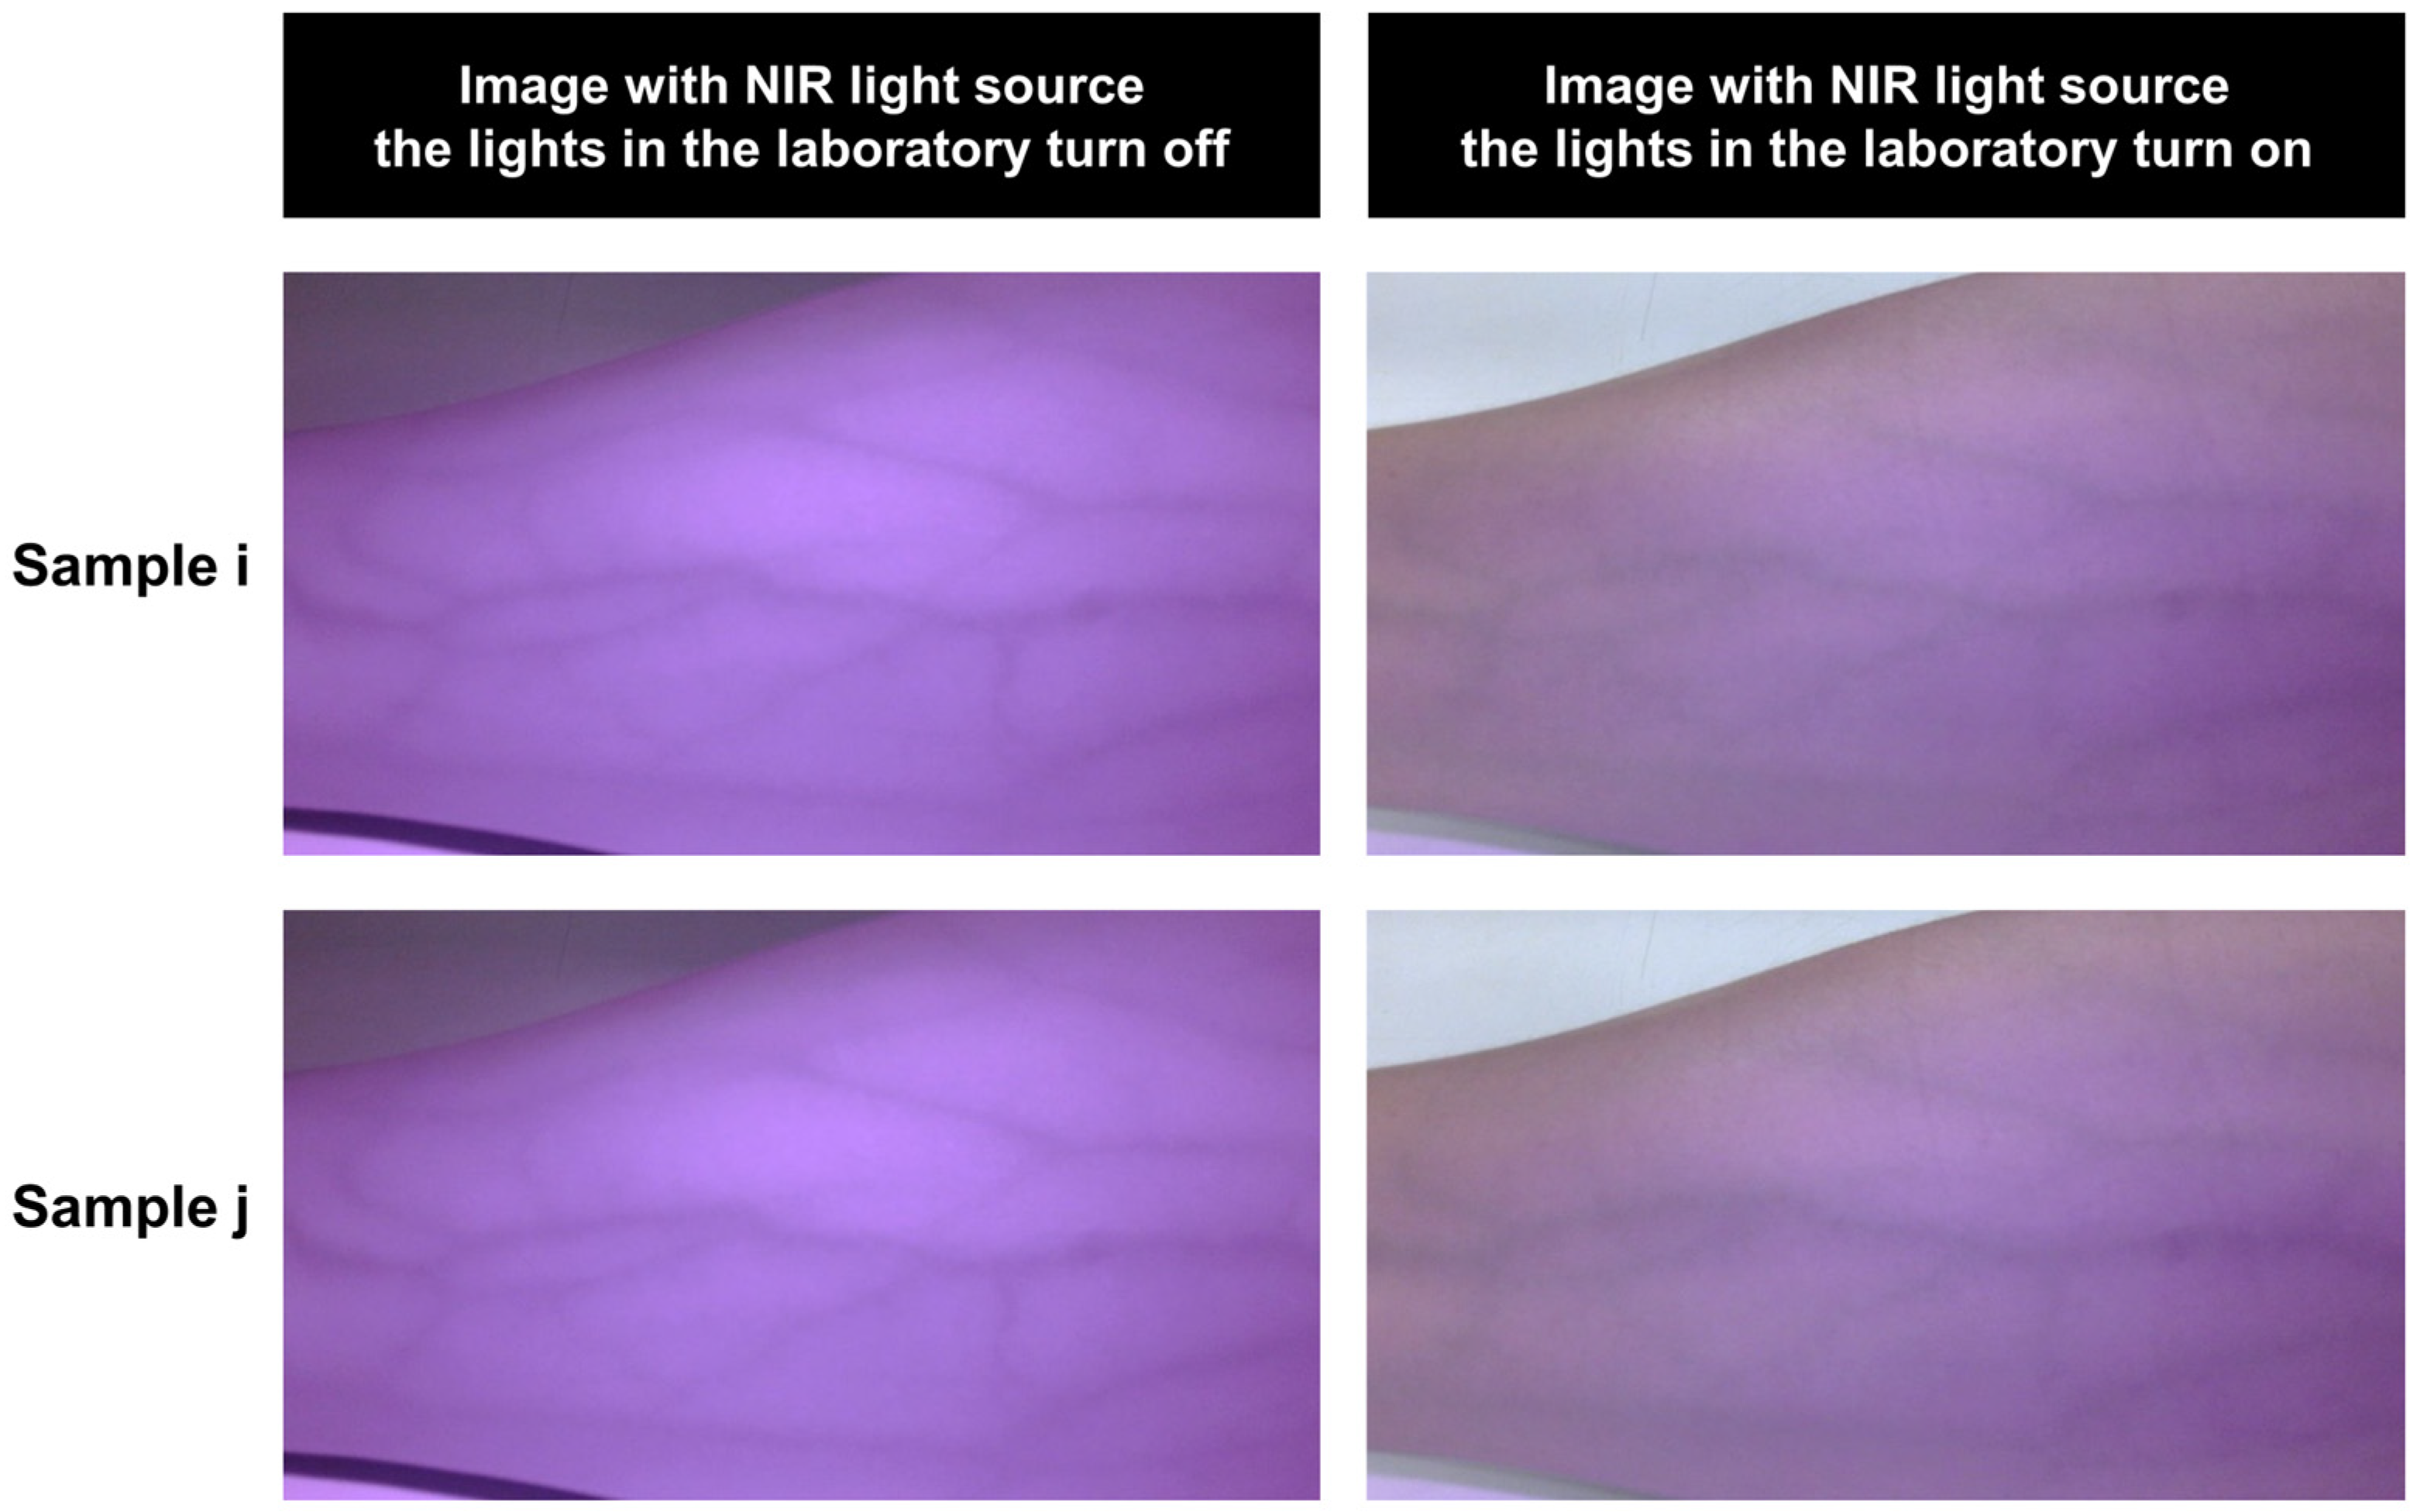
Different vein locations on subjects’ arms (upper and lower arms), distances between the NIR light source and arm location (15 and 20 cm), and illumination interferences from light lamps in the room (on and off) were tested to evaluate system performance. It should be noted that this experiment was conducted during the day in areas with natural light from the outside, such as hospital wards or patient rooms at the medical facility. The experiments were repeated several times; the output image results, MSE and PSNR were then reported.
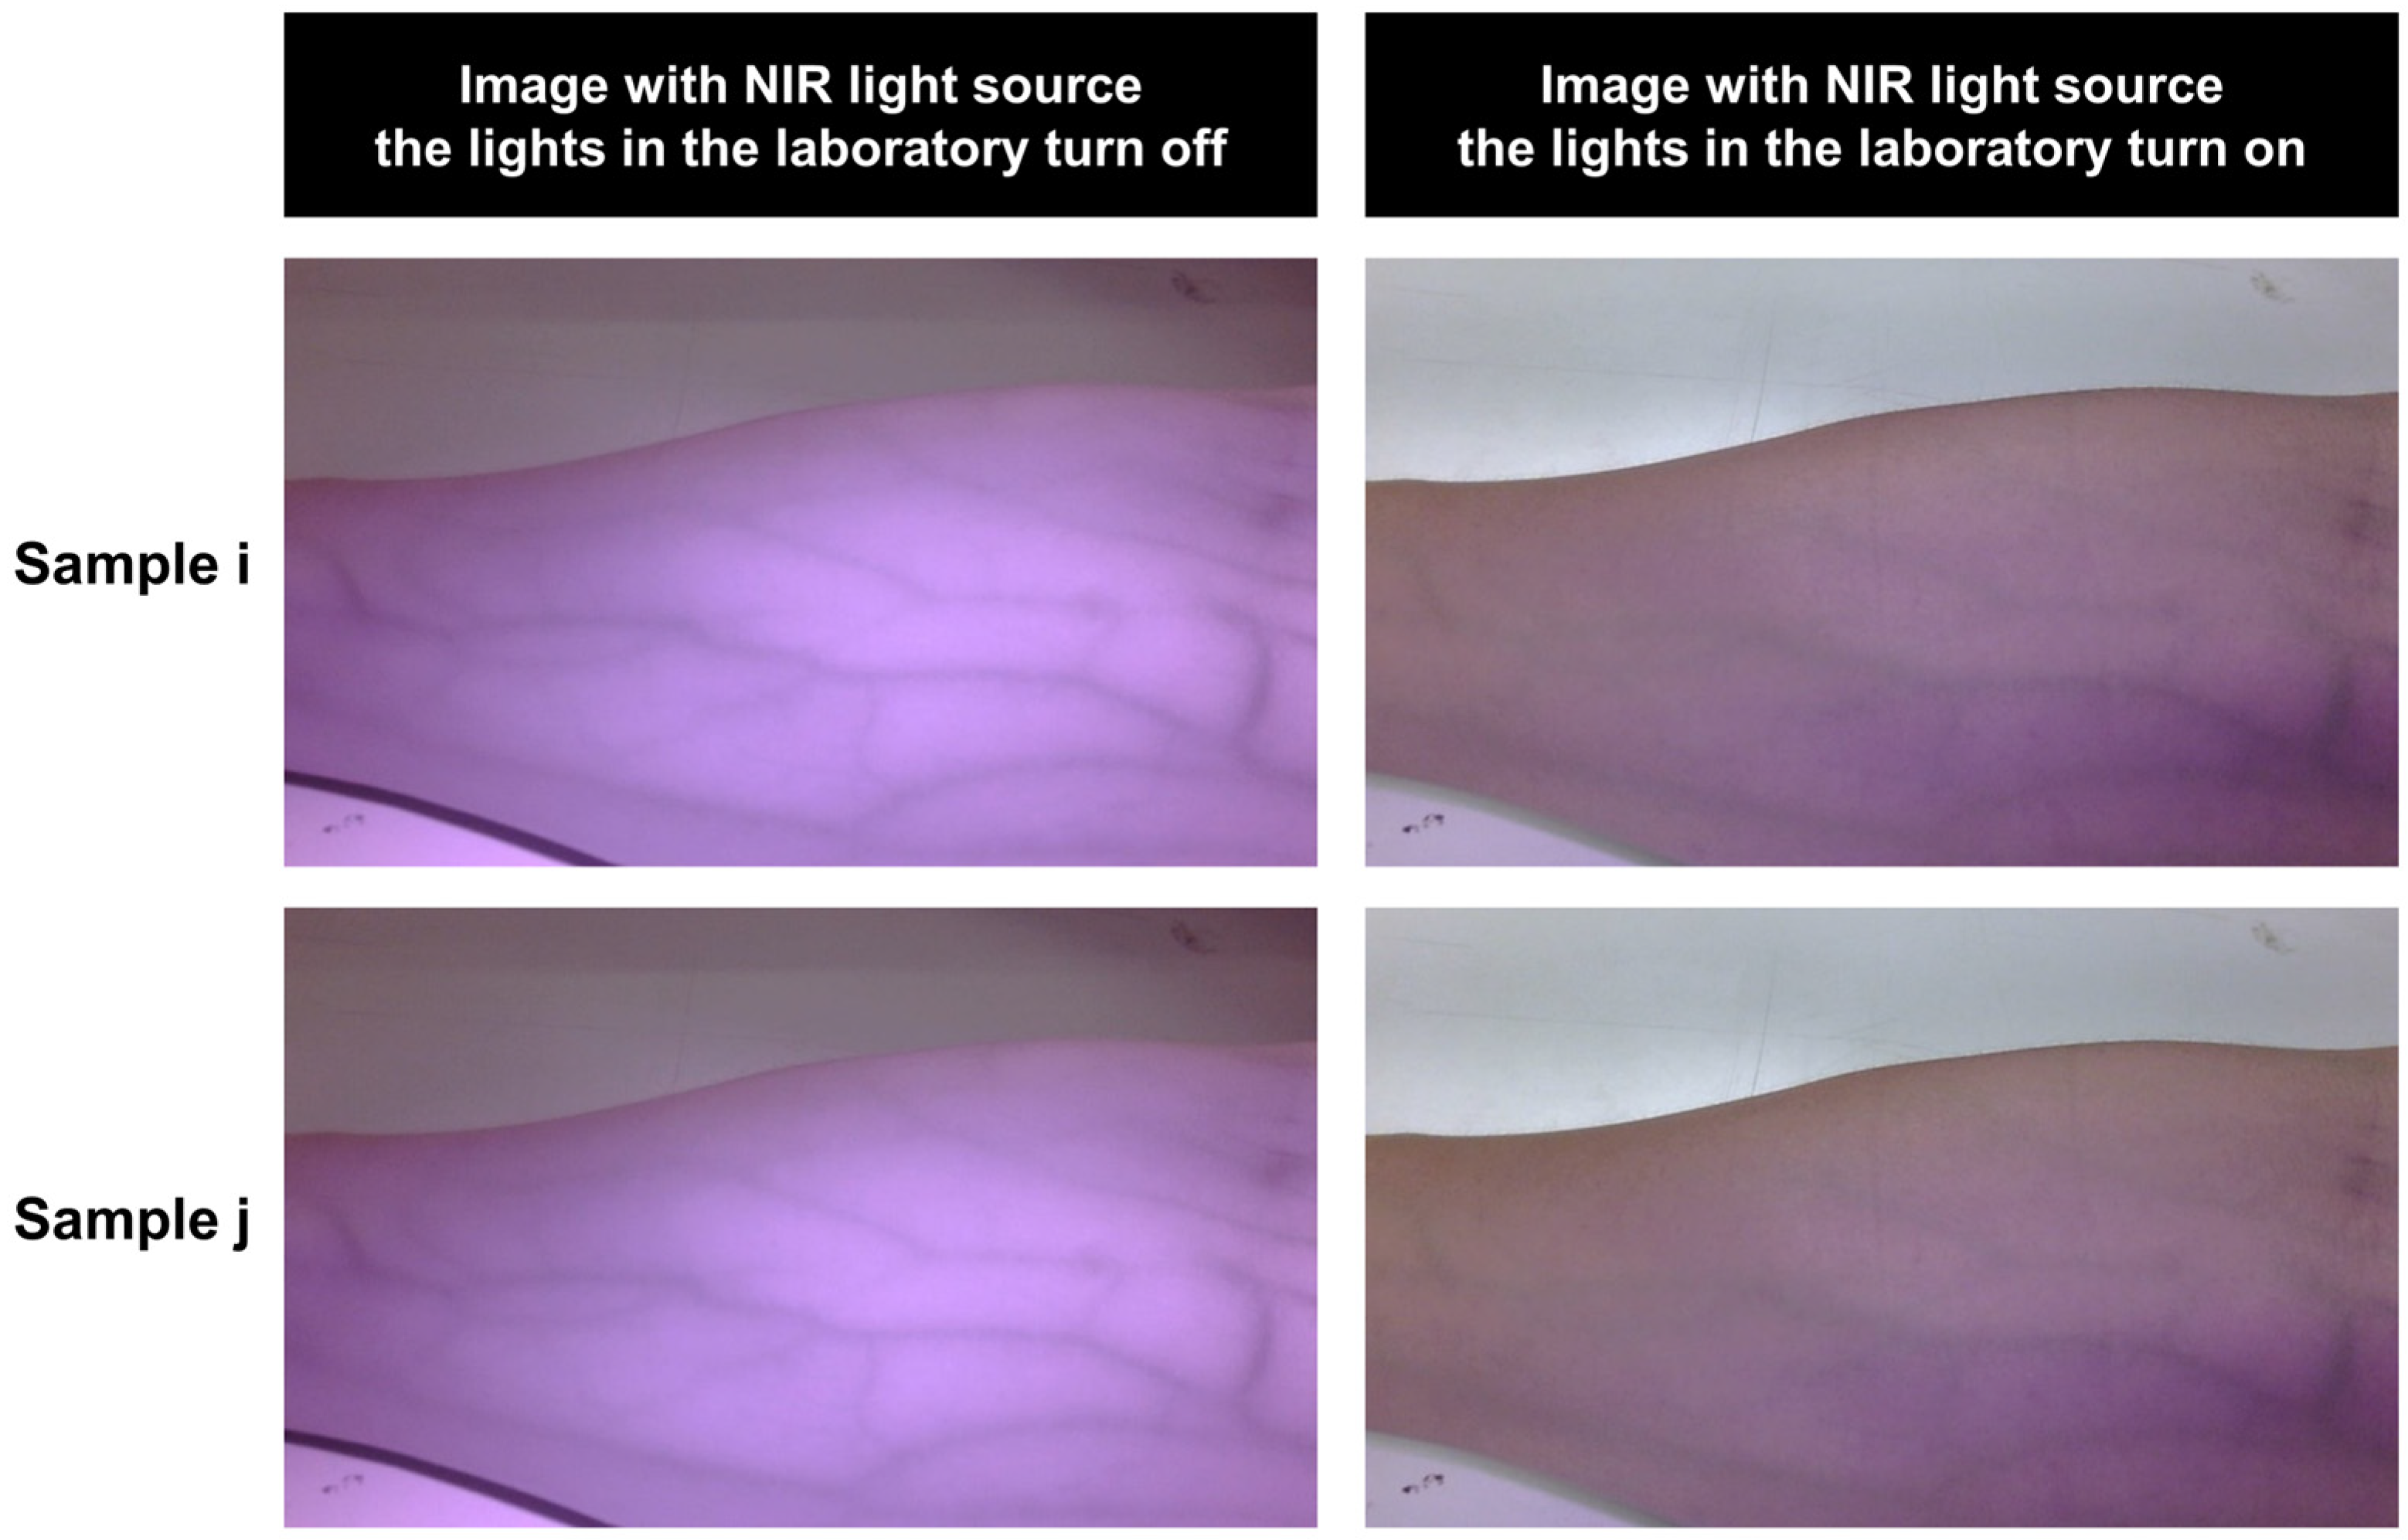
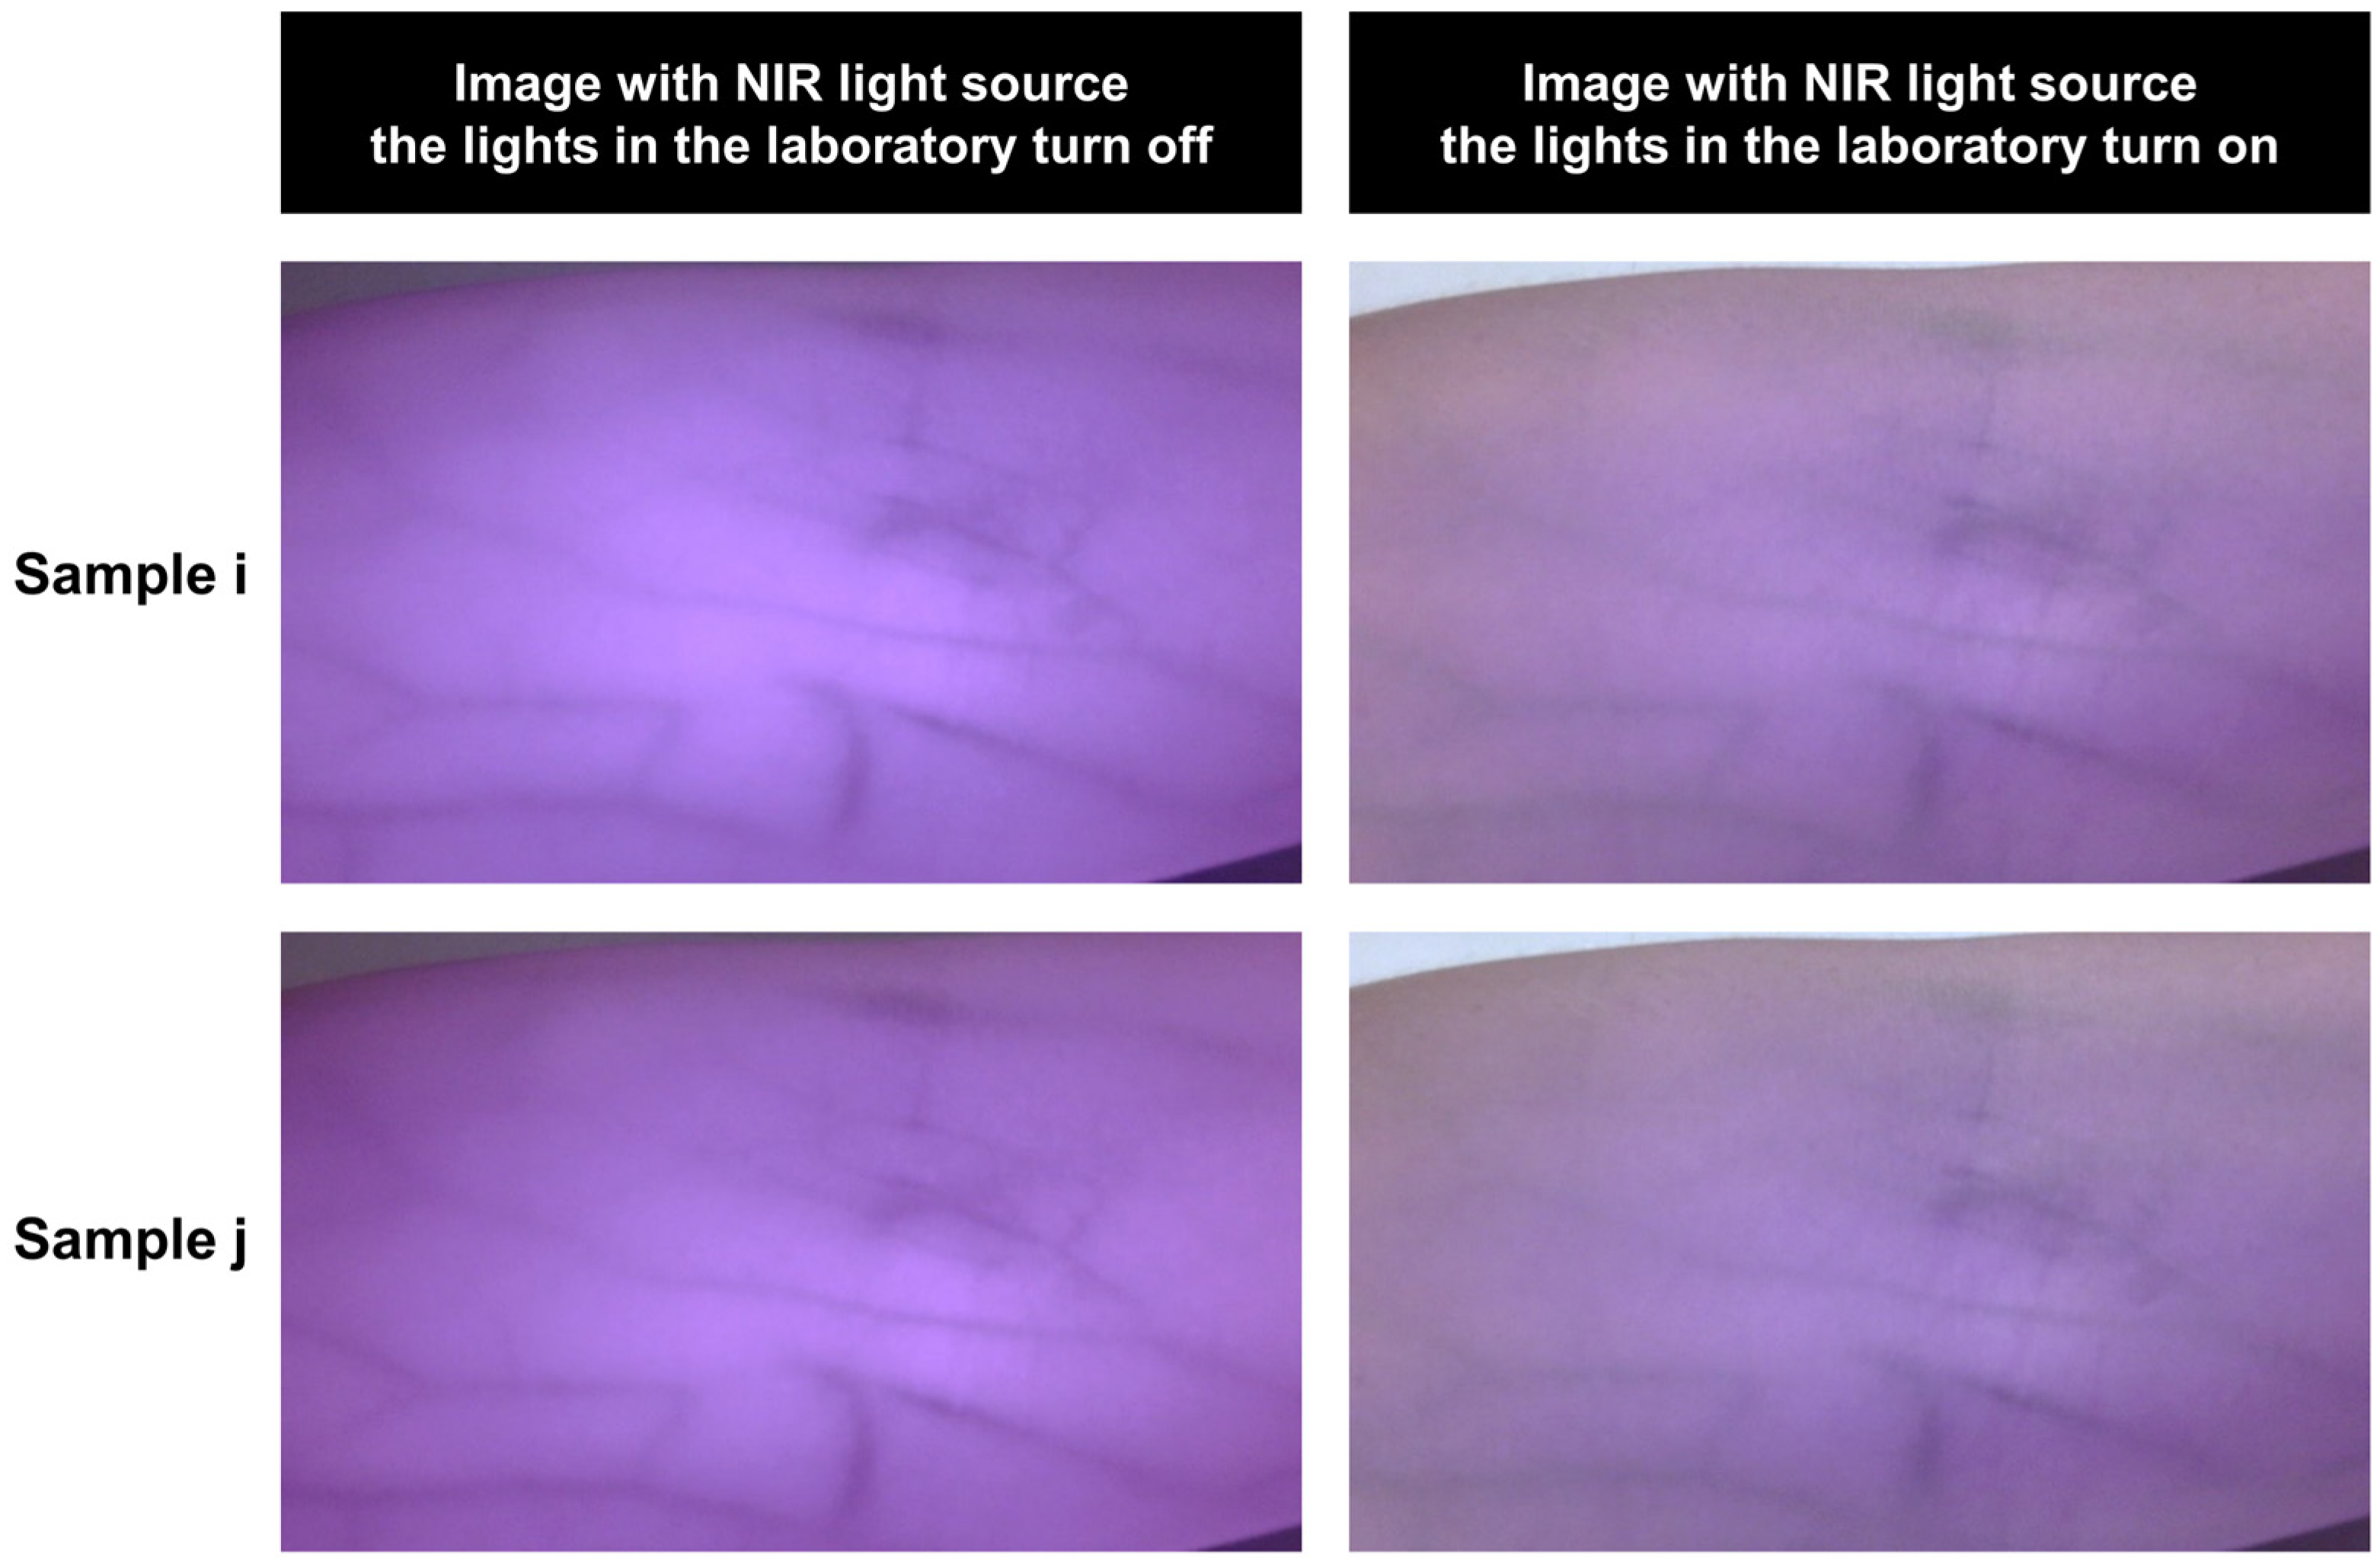
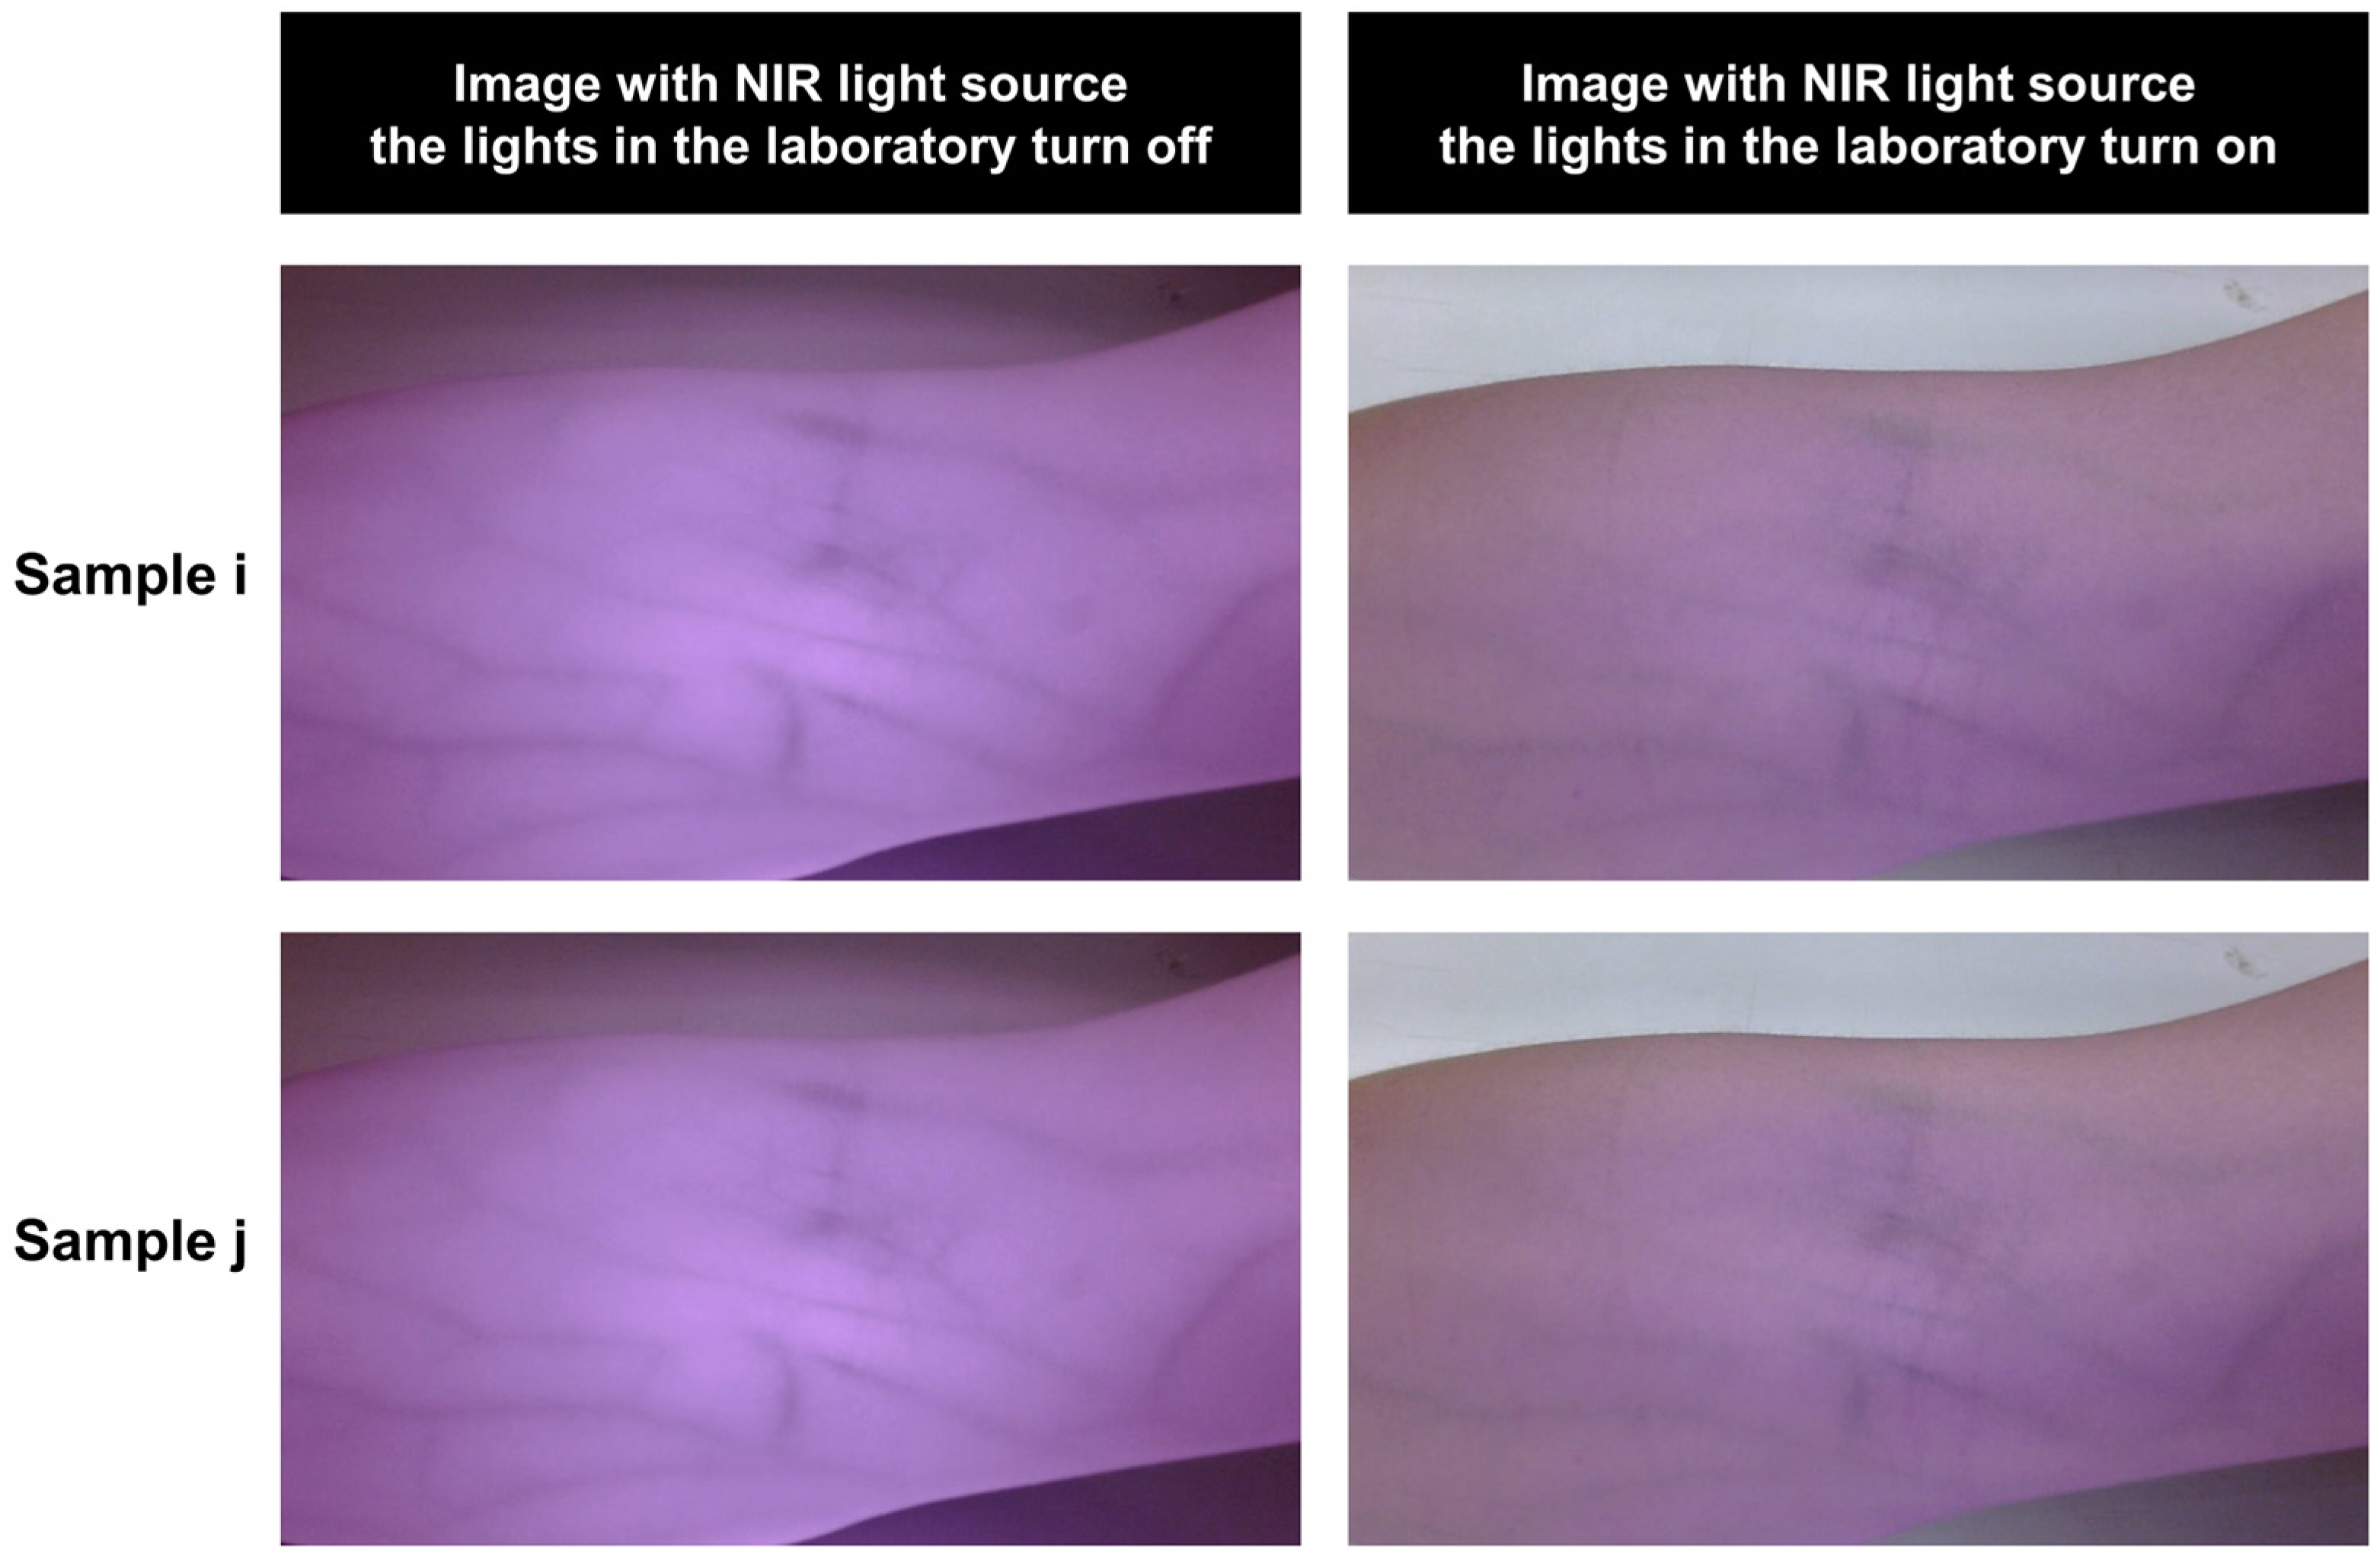
Figure 8 and Figure 9 display output images taken from the lower arm with 15 cm and 20 cm distances between the arm location and the NIR light source, where turning off and turning on the lamps in the laboratory are taken into account. Images taken from the upper arm are also illustrated in Figure 10 and Figure 11. According to the experimental results, the suggested low-cost NIR vein visualization prototype can function at distances of 15 and 20 cm, where the output images can be appropriately measured and collected. From our experiments at the specified distances, 15 cm is an appropriate distance to clearly see the blood vessels in the lower and upper arm without excessive enlargement or dissipation. At 20 cm, the blood vessels are still visible, similarly to 15 cm. However, at this distance, the system can also capture more of the surrounding field, which may introduce additional background interference. Moreover, ambient lamp illumination contributes broadband optical contamination, particularly from the visible spectrum, because the modified camera lacks a visible light rejection or wavelength-selective band-pass filter. As a result, an unwanted background signal is captured together with the intended NIR response, thereby reducing vascular contrast and potentially compromising the accuracy of subsequent image enhancement and segmentation processes.
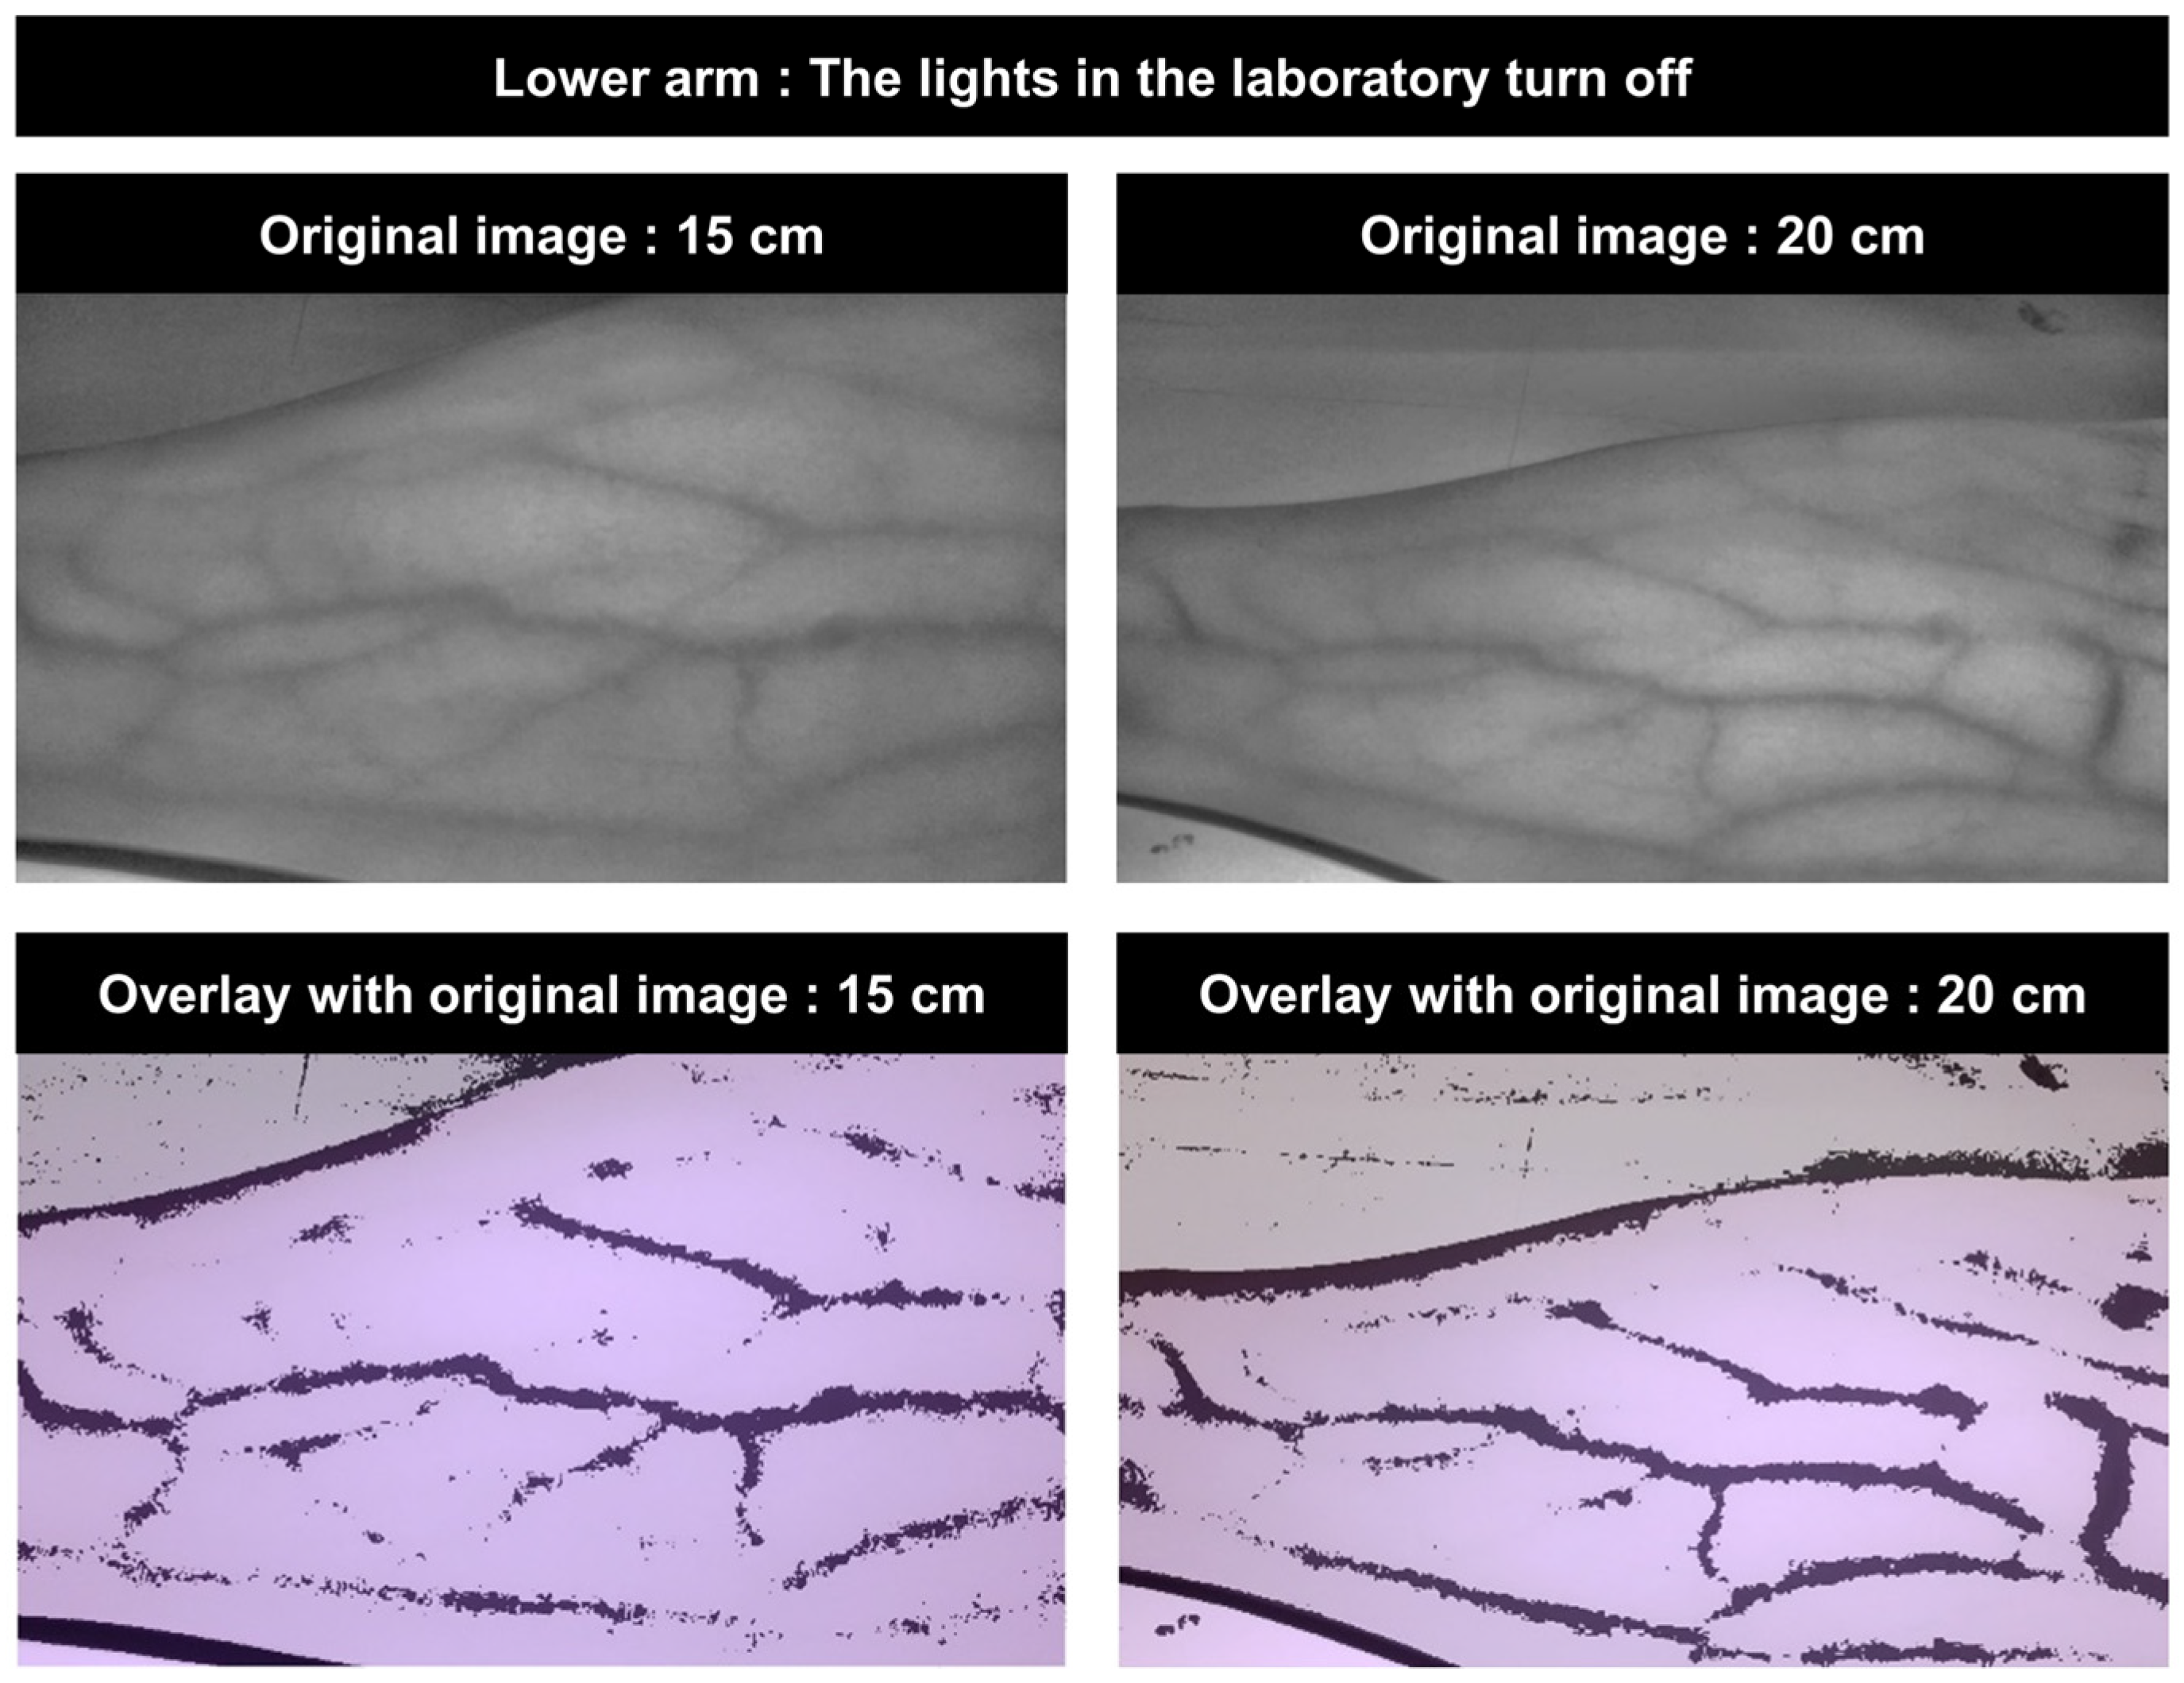
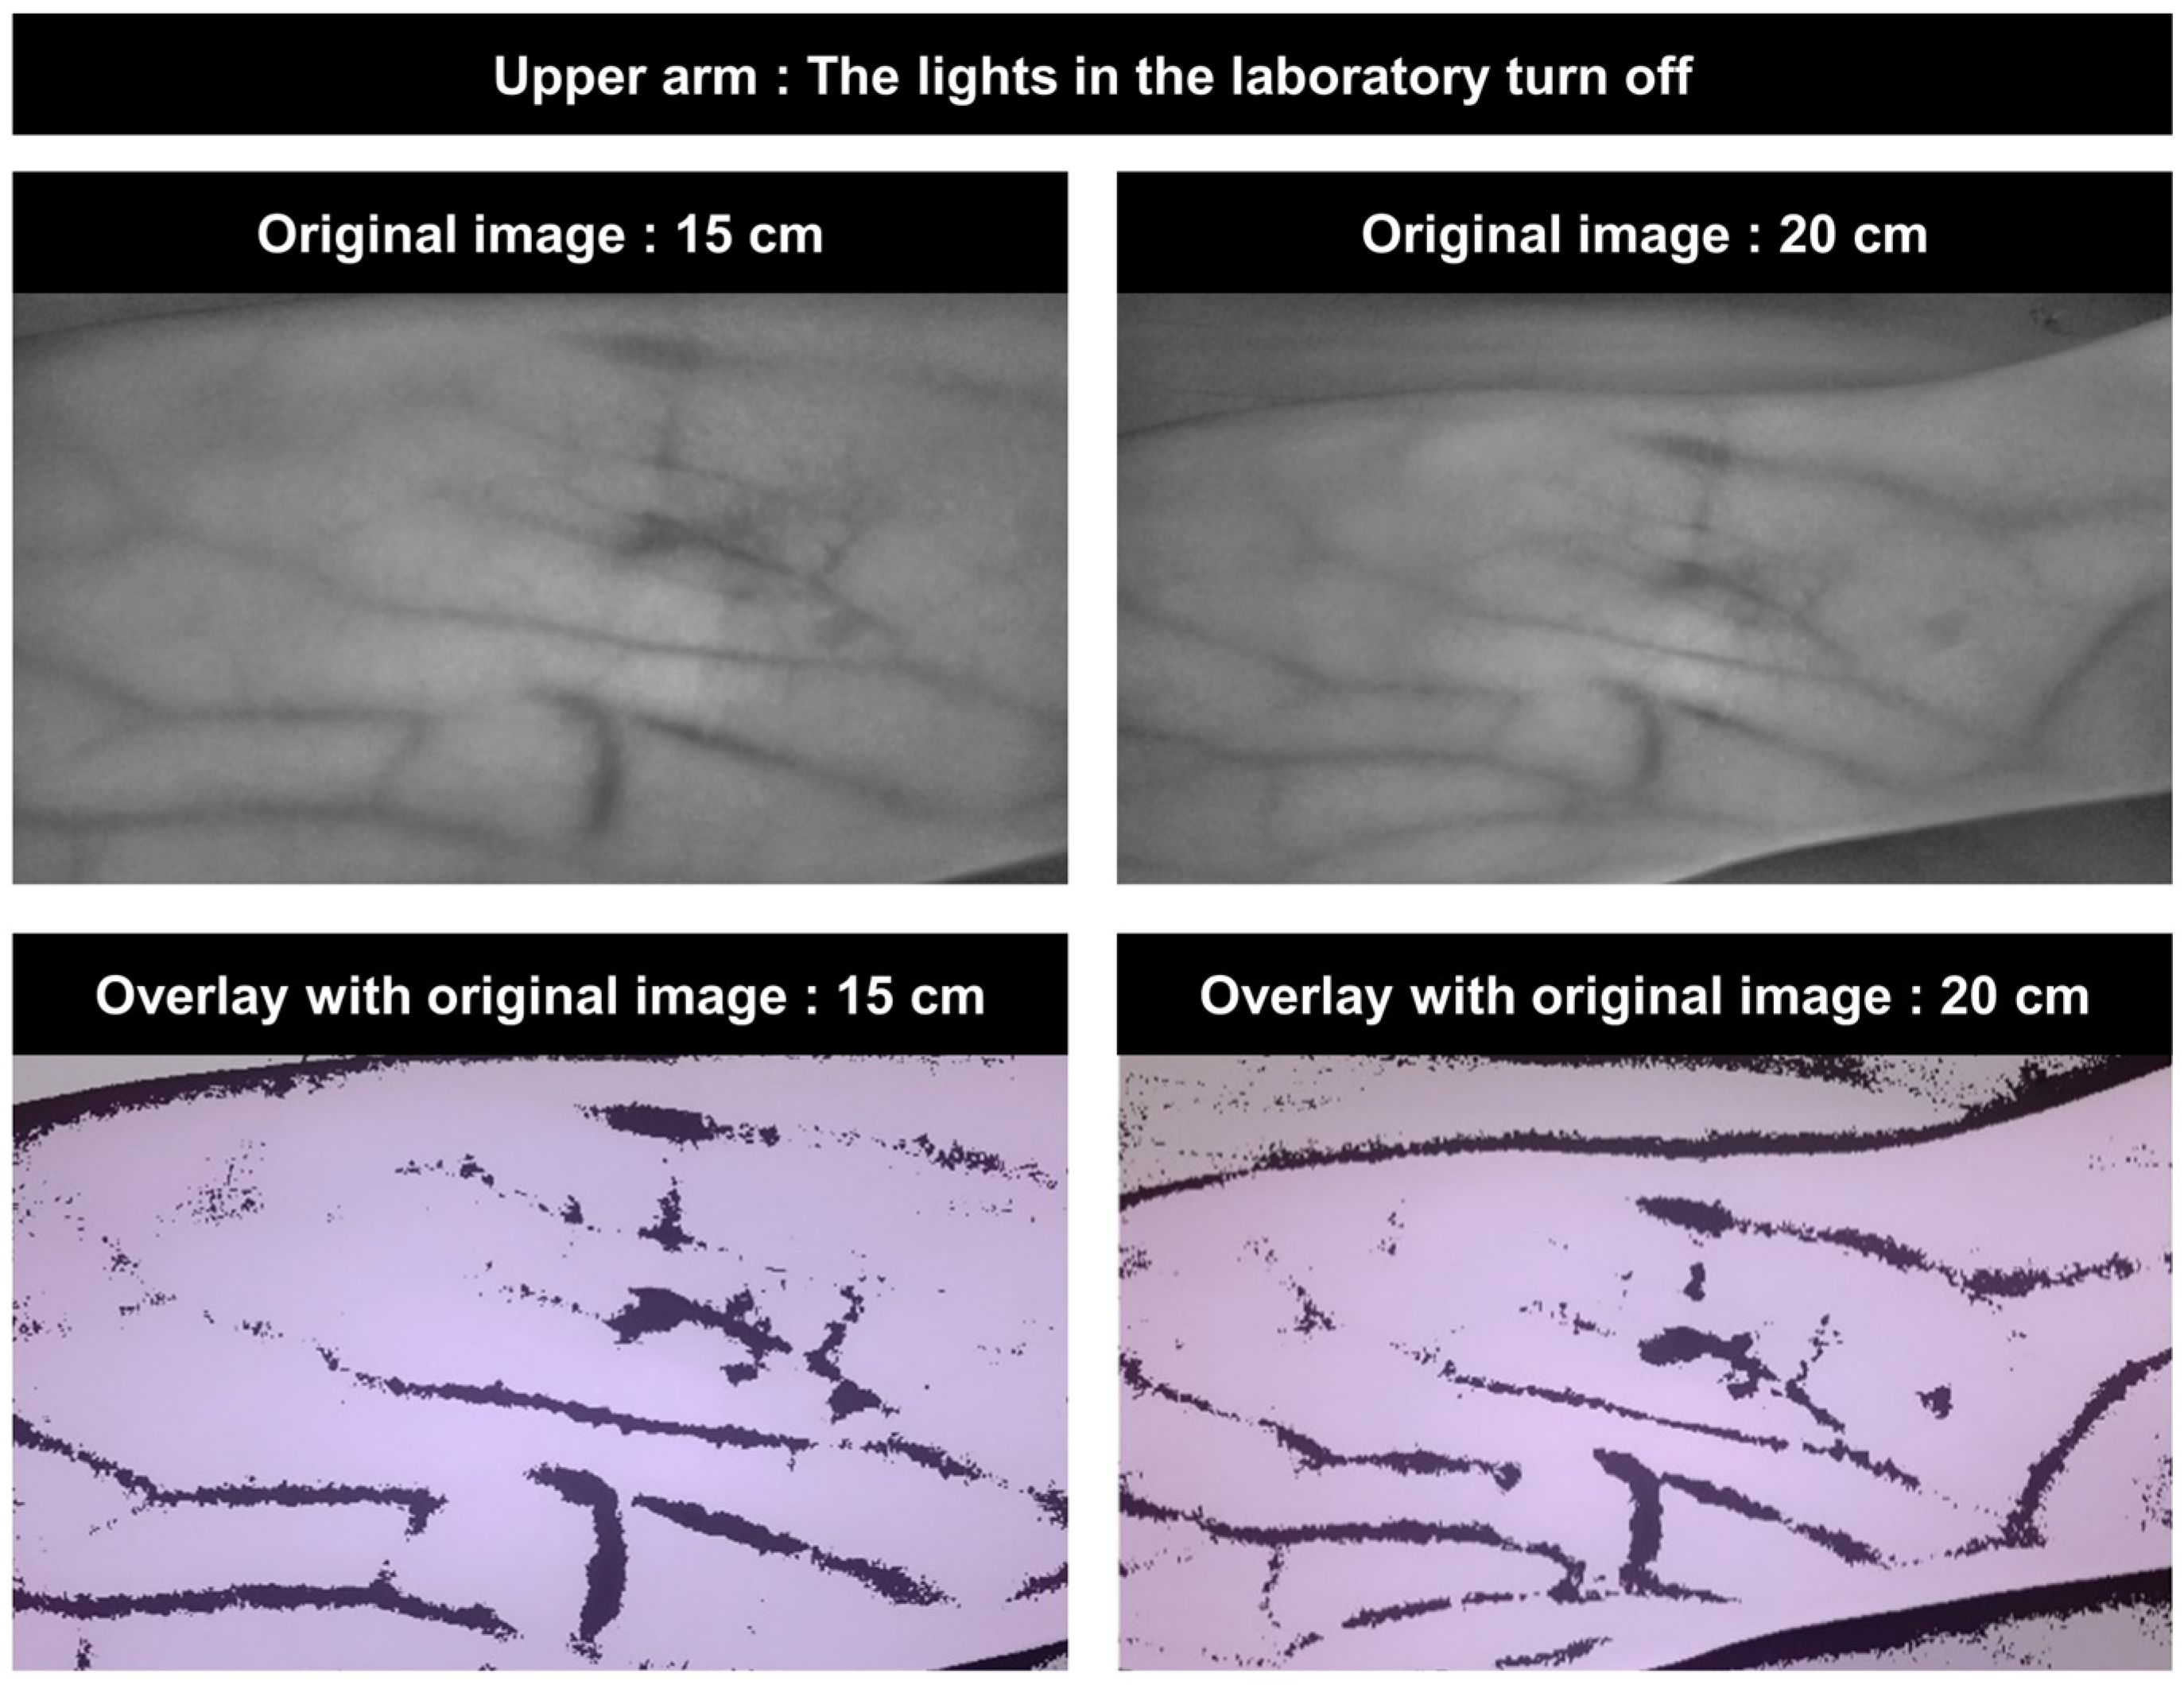
Figure 12 and Figure 13 also show the output images for the upper and lower arms after image processing. As discussed in Section 2.2, using image pre-processing (such as RGB-to-grayscale conversion, histogram equalization, image enhancement, and adaptive thresholding), segmentation (such as Canny edge detection and morphological transformation), and feature extraction (such as skeletonization to highlight vascular patterns) and overlaying the extracted vascular pattern on the original image, the results show that the regions of interest can be more clearly defined and the blood vessels can be more clearly visualized, particularly at a source-to-arm distance of 15 cm when the room lamp is turned off. These findings suggest that the proposed low-cost NIR vein visualization device can improve superficial vein visibility in the antecubital region before venipuncture under the tested experimental conditions. Such improved visualization may support venous access procedures; however, any effect on reducing injection-related errors or improving clinical outcomes remains to be established in future clinical studies.
The MSE and PSNR results obtained from the output images for both cases of the lower arm and the upper arm are presented in Table 1 and Table 2, respectively. The average results with the standard deviation (SD) values are also provided. We note that the details of the MSE and PSNR calculation can be seen in Appendix A. Two common measures used to assess how closely a processed (output) image matches a reference (original) image are the MSE and PSNR. The average square difference between the original and processed (distorted) image’s pixels is measured by the MSE metric. There is less distortion or error between the original and the degraded image when the MSE value is lower, indicating that the image is closer to the original. The PSNR, which is expressed in decibels, or dB, is the ratio of the maximum pixel value to the distortion caused by processing. Thus, better image quality is indicated by a low MSE and high PSNR.
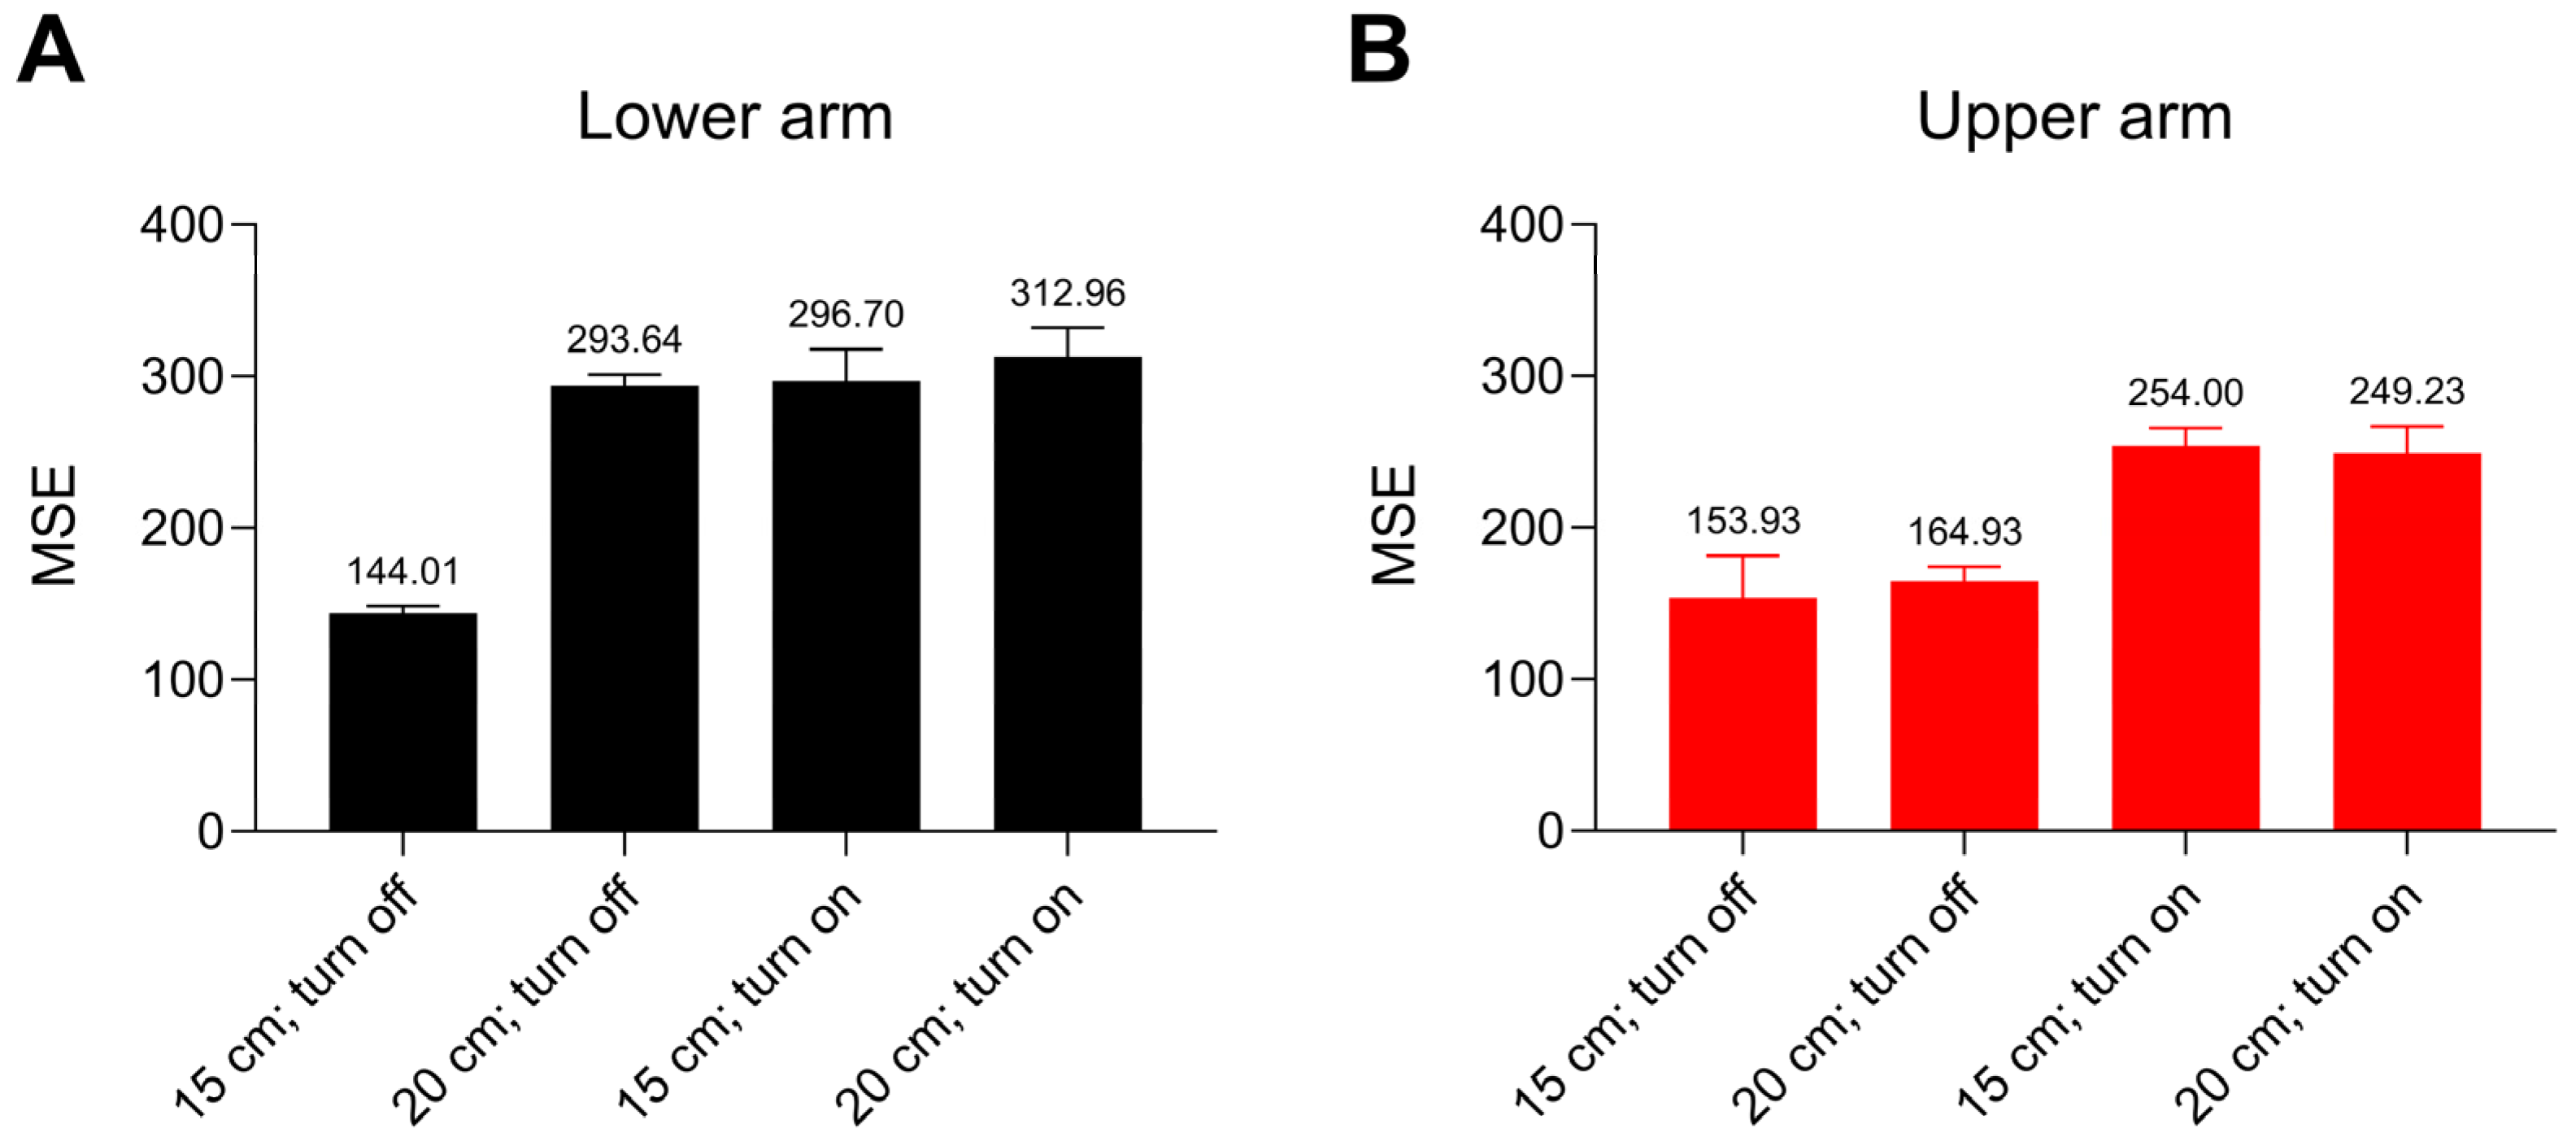
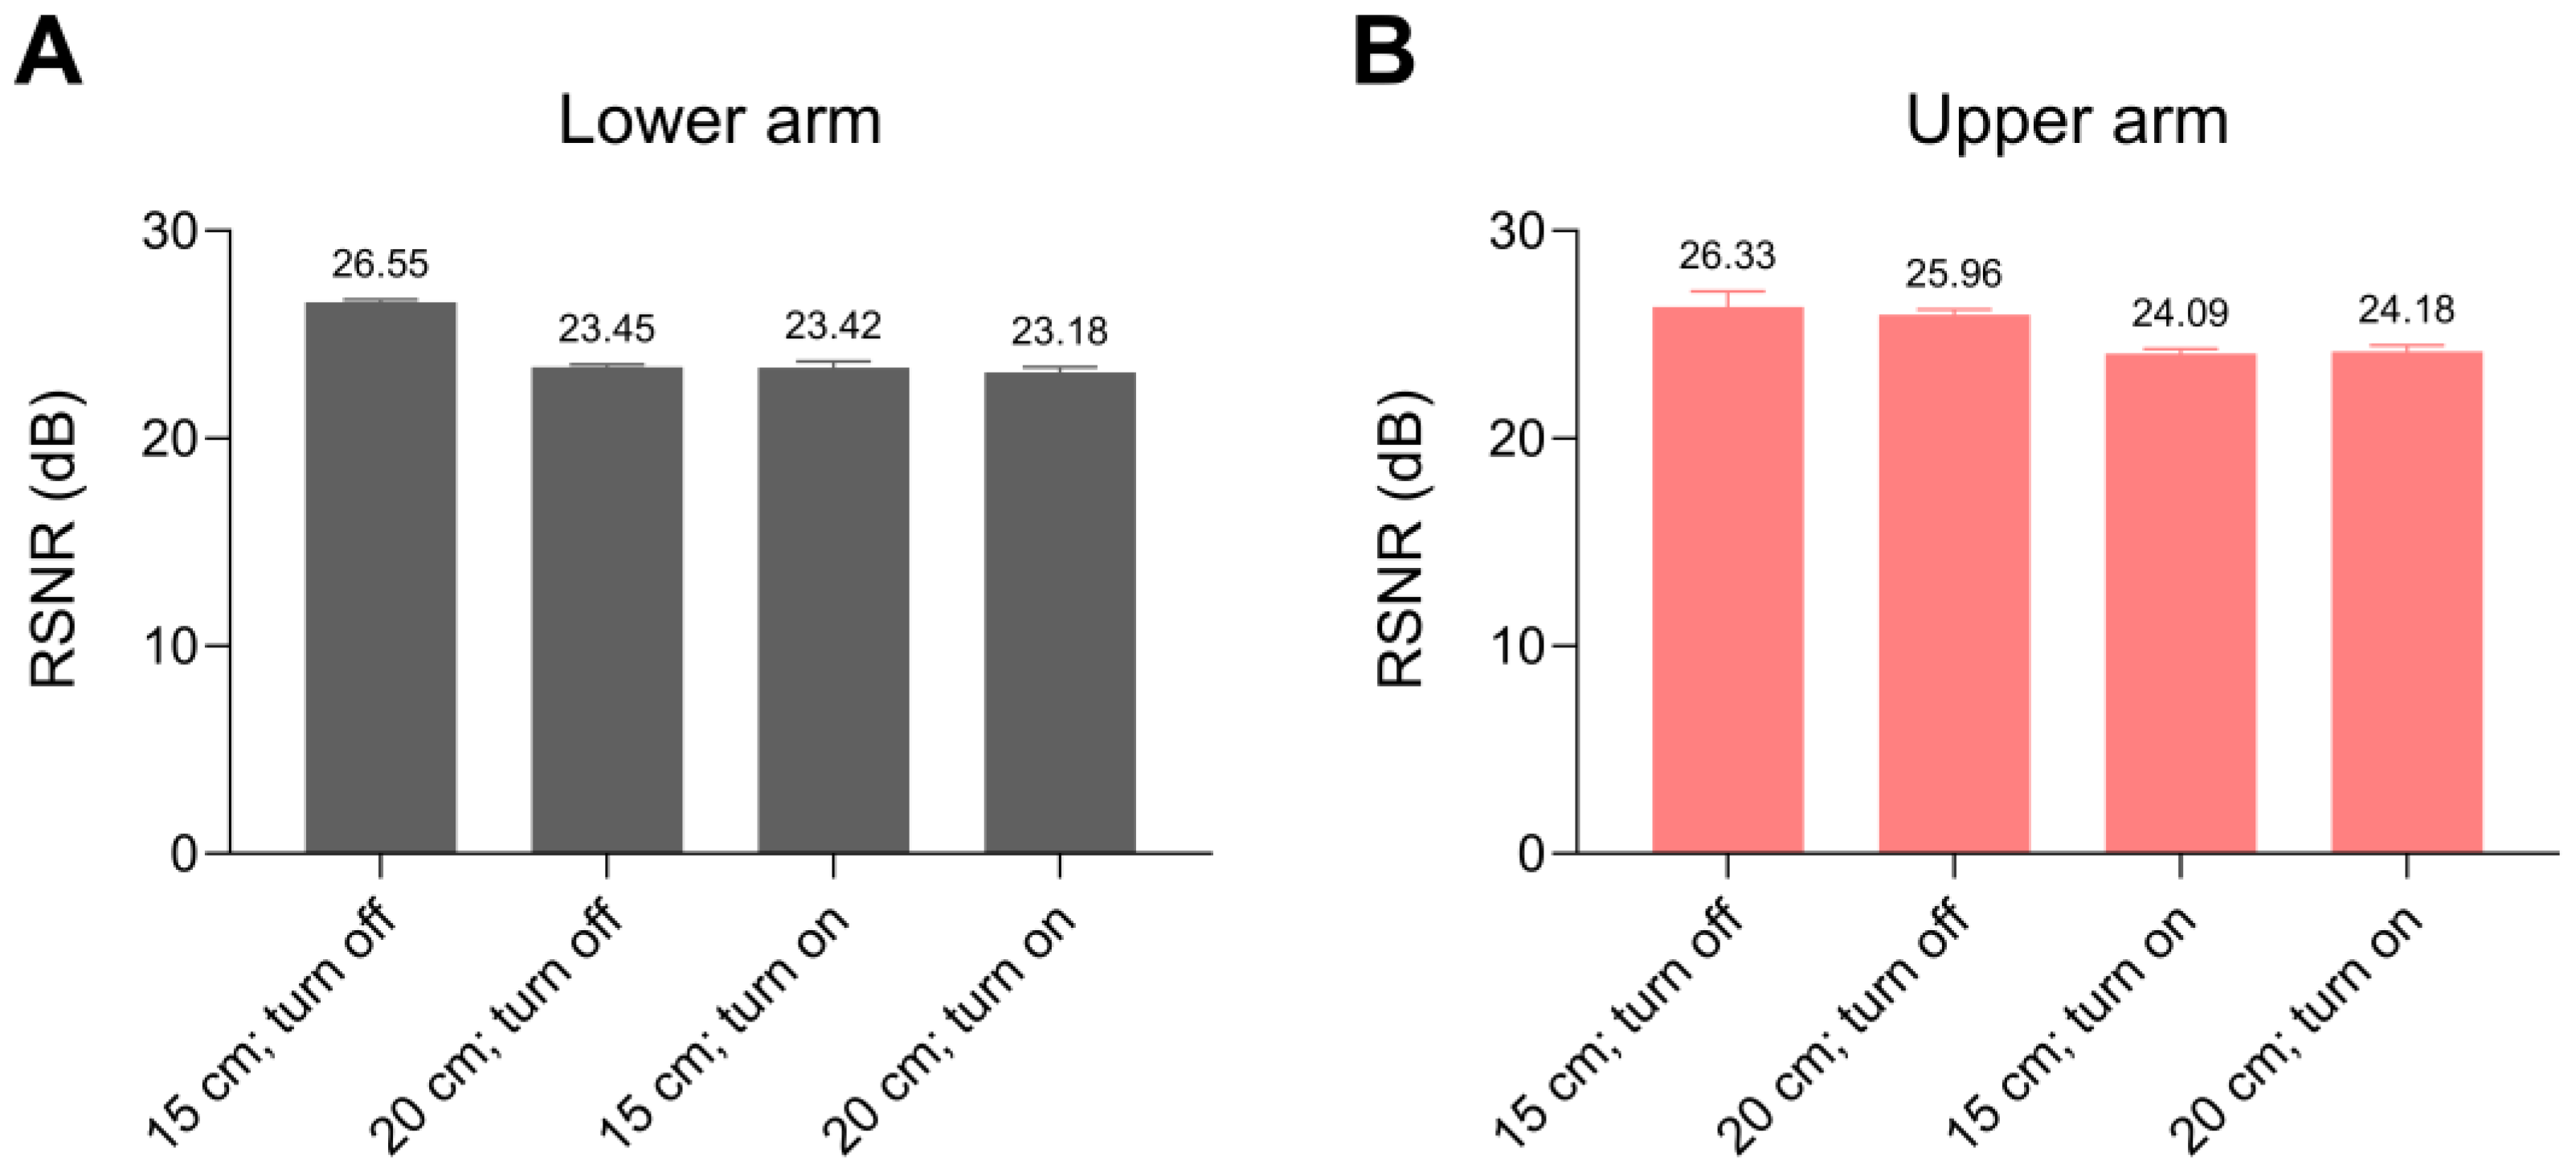
The average MSE and PSNR results are summarized and presented in Figure 14 and Figure 15, respectively. The results indicate that the 15 cm testing condition with the light lamp turned off yields the lowest MSE values for both the lower and upper arms. Similarly, the 20 cm testing condition with the light lamp turned off also demonstrates favorable performance, particularly for the upper arm. These observations are consistent with the PSNR results, where the 15 cm testing condition with the light lamp turned off achieves the highest PSNR values of 26.55 dB for the lower arm and 26.33 dB for the upper arm. Based on these experimental findings, it can be concluded that a distance of 15 cm provides the optimal visibility of blood vessels in both the lower and upper arm.

4. Discussion

The experimental results demonstrate that the proposed low-cost NIR vein visualization system can reliably visualize superficial veins under a range of practical conditions, including variations in arm location, imaging distance, and ambient illumination. The observed superiority of the 15 cm source-to-arm distance with ambient lighting turned off, as reflected by the lowest MSE and highest PSNR values, is consistent with prior studies reporting optimal NIR vein contrast at shorter illumination distances due to reduced scattering and improved signal-to-noise characteristics [11]. Additionally, the influence of imaging distance is particularly evident when comparing the results obtained at 15 cm and 20 cm. While vein structures remain visible at both distances, increasing the distance introduces a wider field of view and additional background content, which can increase noise and reduce contrast, especially in environments with ambient light interference. Similar distance-dependent degradation in vein visibility has been reported in other low-cost NIR systems, where light dispersion and reduced photon density negatively affected image quality metrics [25]. Moreover, ambient illumination was found to significantly affect system performance, particularly when laboratory lights were turned on. Because the modified webcam lacks a white-light rejection filter, visible-spectrum interference contributes to increased noise levels, resulting in higher MSE and lower PSNR values. This limitation is well documented in webcam-based NIR imaging systems, where the absence of optical band-pass filtering makes the system more sensitive to environmental lighting conditions [26]. According to this issue, to mitigate ambient light effects, several improvements can be applied. These include optimizing the hardware configuration, incorporating appropriate optical filtering techniques to suppress ambient light interference, and applying advanced image processing algorithms to enhance contrast and reduce noise. Nonetheless, even under illuminated conditions, the proposed system maintained acceptable vein visibility, demonstrating robustness comparable to other reported low-cost prototypes [27]. In addition, the differences observed between upper and lower arm imaging can be attributed to anatomical factors including vein depth, tissue thickness, and subcutaneous fat distribution. Previous investigations have similarly noted improved vein contrast in regions where veins are closer to the skin surface, particularly in the lower arm, findings that align with the trends observed in the present study [21]. Correspondingly, the output images presented in Figure 12 and Figure 13 further confirm the successful implementation of the image processing pipeline, which comprises image pre-processing, image segmentation, feature extraction, and overlay visualization. This effectively improves vascular contrast and enables the clear identification of vein structures, particularly in the antecubital region prior to venipuncture in both the lower and upper arm regions. The observed improvement in vein contrast, particularly at a source-to-arm distance of 15 cm with ambient lighting turned off, aligns with prior studies demonstrating that a shorter imaging distance increases photon density and minimizes light scattering in NIR imaging systems [11,21]. The image pre-processing techniques adopted in this work, including RGB-to-grayscale conversion, histogram equalization, image enhancement, and adaptive thresholding, play a critical role in suppressing background noise and enhancing contrast between blood vessels and surrounding tissue. These techniques are widely recognized as fundamental steps in NIR vein visualization pipelines, particularly when consumer-grade cameras are employed [25,26]. Subsequent segmentation using Canny edge detection and morphological transformations further enhances vessel boundary delineation, in accordance with previously reported vein extraction frameworks [28,29]. Additionally, skeletonization-based feature extraction was found to be particularly effective for highlighting vein topology and continuity, enabling the clear visualization of vascular paths without introducing excessive computational complexity. Skeleton-based methods have been widely adopted in vein visualization and biometric applications due to their ability to preserve structural information while reducing data dimensionality [30,31,32]. Moreover, overlay visualization further enhances interpretability by allowing clinicians to view extracted vein patterns in relation to the original anatomical context, which is particularly important for venipuncture guidance.
Quantitative evaluation using the MSE and PSNR provides an objective confirmation of the qualitative observations. Lower MSE values indicate reduced distortion between the original and processed images, while higher PSNR values reflect improved signal fidelity and overall image quality. The results summarized in Table 1 and Table 2 and Figure 14 and Figure 15 show that the testing condition with a source-to-arm distance of 15 cm and ambient lighting turned off consistently yields the lowest MSE and highest PSNR values for both the lower and upper arms. The highest PSNR values of 26.55 dB obtained in this study for the lower arm and 26.33 dB for the upper arm are comparable to, and in some cases exceed, those reported in other low-cost NIR vein visualization systems [33]. Although acceptable performance was also achieved at 20 cm, the increased imaging distance resulted in a wider field of view and greater background capture, leading to higher noise levels and slightly degraded image quality. This effect was more pronounced when ambient lighting was enabled. Furthermore, the presence of visible-spectrum illumination introduces additional noise, particularly because the modified webcam lacks an optical band-pass filter to suppress white light. Similar limitations have been reported in webcam-based and mobile NIR imaging systems, where ambient illumination significantly affects image quality [7,26]. The use of the MSE and PSNR as evaluation metrics provides an objective basis for assessing image quality and the effectiveness of image enhancement. These metrics have been widely adopted in vein visualization research and are considered appropriate indicators of contrast preservation and noise suppression in medical imaging applications [28]. Notably, the results obtained in this study are comparable to, and in some cases exceed, the values reported in similar low-cost vein visualization systems [29]. Compared with commercially available vein viewers, the proposed system offers a cost-effective and portable alternative while maintaining sufficient image quality for practical vein localization. Although advanced systems incorporating multispectral imaging or deep learning algorithms can achieve higher accuracy, they typically require more complex hardware and computational resources [18,33]. In contrast, the simplicity of the present design makes it suitable for deployment in resource-limited clinical environments, training facilities, or preliminary venous assessment applications. Therefore, these findings suggest that future improvements could include integrating optical filtering or adaptive illumination control to enhance robustness under variable lighting conditions.
However, the differences observed between the lower and upper arm imaging results can be attributed to anatomical variations such as vein depth, tissue thickness, and subcutaneous fat distribution. Previous studies have shown that veins located closer to the skin surface, as commonly found in the lower arm and antecubital fossa, exhibit stronger NIR contrast and are more easily visualized [11,34,35,36,37]. Despite these anatomical differences, the proposed system demonstrated reliable performance across both regions, confirming its applicability to clinically relevant venipuncture sites. In addition, based on the experimental results presented in this study, the proposed system and the implemented low-cost NIR vein visualization device operate effectively. The system enhances the visibility of superficial veins in the antecubital region prior to venipuncture, enabling medical personnel to identify veins more clearly and thereby reducing the likelihood of injection errors. During our development process, the proposed system was tested on healthy subjects to meet both performance and safety requirements, as previously stated. However, additional data acquisition and analysis are required to further validate the system. To improve its robustness, future evaluations should include a more diverse group of subjects with varying characteristics, such as age, gender, and physical condition, particularly considering the system’s intended use in medical settings. Moreover, experiments and data collection should be conducted under a wider range of environmental conditions. In addition, advanced image processing strategies incorporating artificial intelligence should be investigated to enhance system performance across diverse subjects and variable environmental conditions. Further evaluation in a broader and more diverse study population, together with additional assessment metrics such as SSIM, contrast-to-noise ratio, and clinically relevant performance indicators, will be necessary to provide a more comprehensive validation of the proposed system.

5. Limitations

This study has several important limitations. The system was evaluated only in healthy volunteers under controlled laboratory conditions and therefore does not fully reflect the variability in and procedural complexity of clinical practice. In addition, this study was limited to technical feasibility and imaging performance and did not assess clinical outcomes such as cannulation success, procedure time, injection errors, or extravasation. Although the proposed system was discussed in relation to previously reported low-cost NIR systems and relevant commercial devices, no direct qualitative or quantitative comparison was performed under standardized conditions. Accordingly, the findings should be interpreted as evidence of technical feasibility only, not as proof of clinical effectiveness or comparative superiority. Further prospective clinical studies and direct comparative evaluations are needed to establish the system’s practical clinical utility.

6. Conclusions

This work presents the development of a non-invasive vein visualization system. We implement an equipment box set that includes an NIR source and a webcam, allowing subjects to be easily tested by placing their arm inside the box. On a computer, vein images are automatically captured, and then image processing techniques are employed to identify veins. Healthy participants are used in laboratory-scale experiments. Variable vein sites on the upper and lower arms, variable distances of 15 and 20 cm between the NIR light source and the arm, and the presence or absence of ambient light interference are some of the scenarios in which the system’s performance is assessed. Based on the output images and the MSE and PSNR performance metrics, the results demonstrate that the suggested vein visualization system was successfully implemented and operated. Additionally, this study confirms that the proposed approach achieves an effective balance between performance, simplicity, and cost, making it a practical alternative to more complex and expensive commercial vein visualization devices. By relying on consumer-grade hardware and conventional image processing techniques, the system remains accessible and suitable for deployment in clinical training environments, routine medical practice, and resource-limited healthcare settings. The integration of a GUI further supports usability by enabling real-time visualization and straightforward operation by medical personnel.
Future studies will extend the validation of the proposed system to a broader and more diverse study population, encompassing variation in age, sex, skin characteristics, and physical condition, as well as a wider range of environmental conditions, including different ambient lighting scenarios. Such evaluation will be essential to establish reproducibility, generalizability, and statistical reliability. In addition, advanced image processing and learning-based approaches will be explored to further improve system robustness, automation, and vein visualization performance, thereby strengthening its reliability and practical utility in clinical settings.

Author Contributions

Conceptualization, S.K.M., J.C., N.I., T.R. and A.B.; methodology, J.C., N.I., T.R. and A.B.; software, S.K.M., J.C., N.I., T.R. and A.B.; validation, S.K.M., J.C., N.I., T.R. and A.B.; formal analysis, S.K.M., J.C., N.I., T.R. and A.B.; investigation, S.K.M., J.C., N.I., T.R. and A.B.; resources, S.K.M., J.C., N.I., T.R. and A.B.; data curation, S.K.M., J.C., N.I., T.R. and A.B.; writing—original draft preparation, S.K.M., J.C. and A.B.; writing—review and editing, S.K.M. and A.B.; visualization, S.K.M., J.C., N.I., T.R. and A.B.; supervision, S.K.M. and A.B.; project administration, S.K.M., J.C. and A.B.; funding acquisition, S.K.M. All authors have read and agreed to the published version of the manuscript.

Funding

This research was supported by National Science, Research and Innovation Fund (NSRF) and Prince of Songkla University (Ref. No. MED6801280S).

Institutional Review Board Statement

All procedures in this study were conducted in accordance with the ethical principles of the Declaration of Helsinki and the International Council for Harmonization (ICH) Guidelines for Good Clinical Practice (GCP). The study protocol was approved by the Human Research Ethics Committee, Faculty of Medicine, Prince of Songkla University, Thailand (REC 68-141-7-2; approved on 7 April 2025).

Informed Consent Statement

Written informed consent was obtained from all participants prior to enrollment and before any study-related procedures. Participants were informed that any published data would be anonymized and would not include sensitive information or disclose personal details.

Data Availability Statement

The anonymized dataset supporting the findings of this study is available from the corresponding author upon reasonable request. Access to detailed personal information is restricted due to ethical and legal considerations. Any request for data access is subject to review and approval by the corresponding author and the Office of the Human Research Ethics Committee, Faculty of Medicine, Prince of Songkla University. The original contributions presented in this study are included in the article. Further inquiries may be directed to the corresponding author.

Acknowledgments

The authors acknowledge with sincere appreciation the support of all staff members and thank the radiological technology personnel of the Department of Radiology, Faculty of Medicine, Prince of Songkla University, for their indispensable assistance in the implementation of technical procedures. During the preparation of this manuscript, the authors used artificial intelligence tools (OpenAI, ChatGPT 5.2) exclusively to assist with grammar and language refinement. No generative AI tools were used for data analysis, the interpretation of the results, or the generation of scientific content. The authors reviewed and edited all AI-assisted output and take full responsibility for the accuracy and integrity of the content of this publication.

Conflicts of Interest

The authors declare no conflicts of interest.

Abbreviations

The following abbreviations are used in this manuscript:
2DTwo-Dimensional
3DThree-Dimensional
AIArtificial Intelligence
CCDCharge-Coupled Device
CMOSComplementary Metal–Oxide–Semiconductor
CTComputed Tomography
LEDLight-Emitting Diode
MSEMean Squared Error
NIRNear-Infrared
NIR-LEDNear-Infrared Light-Emitting Diode
PSNRPeak Signal-to-Noise Ratio
ROIRegion of Interest
SNRSignal-to-Noise Ratio
SSIMStructural Similarity Index Measure
UVUltraviolet

Appendix A. MSE and PSNR Calculation

The average squared difference between the matching pixel values of the original and processed images is known as the Mean Squared Error or MSE. The ratio of the maximum pixel value to the processing-induced distortion is known as the PSNR, and it is measured in decibels or dB. The MSE is represented in (A1), where M × N represents the picture dimensions, X i , j is the original image’s pixel value, and Y ( i , j ) is the output image’s pixel value. Additionally, the PSNR is expressed in (A2), where M A X stands for the maximum pixel value (i.e., 255 for 8-bit images and 1 for normalized images). Better image quality is indicated by a lower MSE. The images are similar when the MSE is 0. Better image quality is indicated by a higher PSNR value. As a result, there is an inverse relationship between the MSE and PSNR; when the MSE decreases, the PSNR increases.
M S E = 1 M N i = 1 M j = 1 N X i , j Y ( i , j ) 2
P S N R = 10 · l o g 10 M A X 2 M S E

Appendix B. Mathematical Formulation of Image Processing Pipeline

Appendix B.1. Image Pre-Processing

The image pre-processing stage was performed to reduce computational complexity, improve vessel-to-background contrast, and suppress unwanted background variation before segmentation. As illustrated in Figure 4, this stage included RGB-to-grayscale conversion, histogram equalization, image enhancement, and adaptive thresholding.

Appendix B.1.1. RGB-to-Grayscale Conversion

The acquired image was first converted from the RGB color space to a grayscale image to enable intensity-based analysis. A standard luminance-weighted conversion can be expressed as follows:
I g r a y x , y = 0.299 R x , y + 0.587 G x , y + 0.114 B ( x , y )
where R(x,y), G(x,y), and B(x,y) denote the red, green, and blue channel intensities at pixel (x,y), respectively, and Igray(x,y) is the resulting grayscale intensity. This step reduces computational complexity while preserving the intensity distribution required for contrast enhancement and vessel extraction.

Appendix B.1.2. Histogram Equalization

Histogram equalization is used to redistribute grayscale intensities so that low-contrast vascular structures become more distinguishable. Let rk denote the k-th gray level, nk the number of pixels at that level, and N the total number of pixels. The normalized histogram is as follows:
p r r k =   n k N
The cumulative distribution function (CDF) is then used to map the original intensity to an equalized intensity:
s k   = ( L 1 ) j = 0 k p r ( r j )
where L is the number of gray levels. This transformation expands the dynamic range of pixel intensities and improves contrast in regions containing superficial veins.

Appendix B.1.3. Image Enhancement

Following histogram equalization, an additional enhancement step may be applied to further improve vessel conspicuity. A simple linear contrast adjustment may be expressed as follows:
I e n h x , y   =   α I e q x , y   +   β
where Ieq(x,y) is the equalized image, α controls contrast gain, and β adjusts brightness.
If nonlinear enhancement is used, gamma correction may be written as follows:
I e n h x , y = c I e q ( x , y ) γ
where c is a scaling constant, and γ controls brightness redistribution. This step is intended to improve the visual separation between vascular and nonvascular regions.

Appendix B.1.4. Adaptive Thresholding

Adaptive thresholding was subsequently applied to generate a binary image while accounting for local intensity variation caused by non-uniform illumination and skin surface heterogeneity. In a local adaptive thresholding framework, the threshold at pixel (x,y) may be expressed as follows:
T x , y =   μ Ω x , y C
where µΩ(x,y) is the mean intensity within a local neighborhood Ω centered at (x,y), and C is a constant offset. The binary image B(x,y) is then defined as
B x , y = 1 ,     I e n h ( x , y ) T ( x , y ) 0 ,     I e n h ( x , y ) > T ( x , y )
In this study, the vascular structures were treated as relatively darker regions in the NIR image; therefore, pixels with intensities below the local threshold were classified as candidate vessel regions. This step improved vessel-to-background separation and reduced the effect of low-frequency background variation.

Appendix B.2. Image Segmentation

The segmentation stage was used to isolate superficial vein structures from the surrounding background. As shown in Figure 4, this stage involved Canny edge detection and morphological transformation.

Appendix B.2.1. Canny Edge Detection

Canny edge detection was used to identify vessel boundaries based on image intensity gradients. The method involves noise suppression, gradient estimation, non-maximum suppression, and hysteresis thresholding.
First, the image was smoothed using a Gaussian kernel to reduce high-frequency noise:
I s x , y =   G σ x , y     I e n h ( x , y )
where G σ x , y is a Gaussian function with standard deviation σ, and ∗ denotes convolution.
The horizontal and vertical gradients were then computed as
G x = I s x ,     G y = I s y
The gradient magnitude and gradient direction were calculated as
M x , y = G x 2 + G y 2
θ x , y = t a n 1 G y G x
After non-maximum suppression, hysteresis thresholding was applied using lower and upper thresholds to preserve strong vessel edges and connected weak edges while suppressing noise-induced responses. This operation improved the delineation of the vascular contours prior to subsequent refinement.

Appendix B.2.2. Morphological Transformation

Morphological operations were applied to refine the segmented vessel pattern, suppress isolated artifacts, and improve the continuity of fragmented vein segments. Let A denote the binary image and S the structuring element.
The erosion and dilation operations are defined as
A S = z S z A
A S = z ( Ŝ ) z   A Φ
where Sz is the translation of the structuring element by z, and Ŝ denotes its reflection.
From these basic operations, opening and closing may be expressed as
A S = ( A S ) S
A S = ( A S ) S
Opening was used to remove small, isolated foreground artifacts, whereas closing was used to fill small gaps and connect discontinuous vessel segments. These operations improved the structural coherence of the segmented vascular pattern and reduced false-positive noise regions.

Appendix B.3. Feature Extraction and Visualization

The final stage of the pipeline was used to derive a clearer representation of the vascular pattern for visualization. As illustrated in Figure 4, this stage included skeletonization and the overlay of the extracted pattern on the original image.

Appendix B.3.1. Skeletonization

Skeletonization was applied to reduce the segmented vessel regions to a one-pixel-wide centerline representation while preserving the topological structure of the vascular network. A general set-based representation of skeletonization is given by
S k A = k = 0 k [ A k S A k S S ]
where kS denotes the repeated application of the structuring element, and k is the maximum iteration before the object vanishes. This operation preserves the essential geometry of the vessel network while removing unnecessary thickness information, thereby making the branching and continuity of the superficial vascular pattern easier to interpret.

Appendix B.3.2. Overlay on the Original Image

To improve interpretability, the extracted vessel pattern was overlaid on the original image. Let M(x,y) denote the final binary or skeletonized vessel mask, and let Iorig(x,y) denote the original image. A simple alpha-blending model can be expressed as
I o u t x , y = 1 λ I o r i g x , y + λ C     f o r   M x , y = 1
I o u t x , y = I o r i g x , y   f o r   M x , y = 0
where C is the chosen display color for highlighting the vessel pattern, and λ is the blending coefficient. This visualization step preserves the anatomical context of the original image while enhancing the visibility of superficial veins.

References

  1. Bellin, M.-F.; Jakobsen, J.Å.; Tomassin, I.; Thomsen, H.S.; Morcos, S.K. Contrast Medium Extravasation Injury: Guidelines for Prevention and Management. Eur. Radiol. 2002, 12, 2807–2812. [Google Scholar] [CrossRef]
  2. Liu, W.; Wang, P.; Zhu, H.; Tang, H.; Wang, X.; Guan, H.; Wang, C.; Qiu, Y.; Peng, A.; He, L. Risk Factors for Contrast Media Extravasation in Intravenous Contrast-Enhanced Computed Tomography: An Observational Cohort Study. Acad. Radiol. 2024, 31, 1792–1798. [Google Scholar] [CrossRef]
  3. Lamperti, M.; Pittiruti, M., II. Difficult Peripheral Veins: Turn on the Lights. Br. J. Anaesth. 2013, 110, 888–891. [Google Scholar] [CrossRef]
  4. Fumagalli, S.; Torricelli, G.; Massi, M.; Calvani, S.; Boni, S.; Roberts, A.T.; Accarigi, E.; Manetti, S.; Marchionni, N. Effects of a New Device to Guide Venous Puncture in Elderly Critically Ill Patients: Results of a Pilot Randomized Study. Aging Clin. Exp. Res. 2017, 29, 335–339. [Google Scholar] [CrossRef]
  5. De Graaff, J.C.; Cuper, N.J.; van Dijk, A.T.; Timmers-Raaijmaakers, B.C.; Van Der Werff, D.B.; Kalkman, C.J. Evaluating NIR Vascular Imaging to Support Intravenous Cannulation in Awake Children Difficult to Cannulate; a Randomized Clinical Trial. Pediatr. Anesth. 2014, 24, 1174–1179. [Google Scholar] [CrossRef]
  6. Van Der Woude, O.C.; Cuper, N.J.; Getrouw, C.; Kalkman, C.J.; de Graaff, J.C. The Effectiveness of a Near-Infrared Vascular Imaging Device to Support Intravenous Cannulation in Children with Dark Skin Color: A Cluster Randomized Clinical Trial. Anesth. Analg. 2013, 116, 1266–1271. [Google Scholar] [CrossRef] [PubMed]
  7. Saeed, A.; Chaudhry, M.R.; Khan, M.U.A.; Saeed, M.A.; Ghfar, A.A.; Yasir, M.N.; Ajmal, H.M.S. Simplifying Vein Detection for Intravenous Procedures: A Comparative Assessment through Near-infrared Imaging System. Int. J. Imaging Syst. Technol. 2024, 34, e23068. [Google Scholar] [CrossRef]
  8. Wang, L.V.; Wu, H. Biomedical Optics: Principles and Imaging; John Wiley & Sons: Hoboken, NJ, USA, 2007; ISBN 0-471-74304-6. [Google Scholar]
  9. Miyake, R.K.; Zeman, H.D.; Duarte, F.H.; Kikuchi, R.; Ramacciotti, E.; Lovhoiden, G.; Vrancken, C. Vein Imaging: A New Method of near Infrared Imaging, Where a Processed Image Is Projected onto the Skin for the Enhancement of Vein Treatment. Dermatol. Surg. 2006, 32, 1031–1038. [Google Scholar] [CrossRef] [PubMed]
  10. Zeman, H.D.; Lovhoiden, G.; Vrancken, C.; Danish, R.K. Prototype Vein Contrast Enhancer. Opt. Eng. 2005, 44, 086401. [Google Scholar] [CrossRef]
  11. Francisco, M.D.; Chen, W.-F.; Pan, C.-T.; Lin, M.-C.; Wen, Z.-H.; Liao, C.-F.; Shiue, Y.-L. Competitive Real-Time near Infrared (NIR) Vein Finder Imaging Device to Improve Peripheral Subcutaneous Vein Selection in Venipuncture for Clinical Laboratory Testing. Micromachines 2021, 12, 373. [Google Scholar] [CrossRef]
  12. Vyas, V.; Sharma, A.; Goyal, S.; Kothari, N. Infrared Vein Visualization Devices for Ease of Intravenous Access in Children: Hope versus Hype. Anaesthesiol. Intensive Ther. 2021, 53, 69–78. [Google Scholar] [CrossRef]
  13. Kordell Mitchell Tan, P. Exploration of a Low-Cost Vein Mapping Device Using Nir Wavelengths and the Hessian-Frangi Filter. Biomed. Sci. Instrum. 2025, 61, 153–159. [Google Scholar]
  14. Zeng, M.; Li, Y.; Meng, Q.; Yang, T.; Liu, J. Improving Histogram-Based Image Contrast Enhancement Using Gray-Level Information Histogram with Application to X-Ray Images. Optik 2012, 123, 511–520. [Google Scholar] [CrossRef]
  15. Ahmad, M.S.Z.; Aziz, N.A.A.; Lim, H.S.; Ghazali, A.K.; Latiff, A.A. Impact of Image Enhancement Using Contrast-Limited Adaptive Histogram Equalization (CLAHE), Anisotropic Diffusion, and Histogram Equalization on Spine X-Ray Segmentation with U-Net, Mask R-CNN, and Transfer Learning. Algorithms 2025, 18, 796. [Google Scholar] [CrossRef]
  16. Li, L.; Si, Y.; Jia, Z. Medical Image Enhancement Based on CLAHE and Unsharp Masking in NSCT Domain. J. Med. Imaging Health Inform. 2018, 8, 431–438. [Google Scholar] [CrossRef]
  17. Tashk, A.; Herp, J.; Bjørsum-Meyer, T.; Koulaouzidis, A.; Nadimi, E.S. Aid-u-Net: An Innovative Deep Convolutional Architecture for Semantic Segmentation of Biomedical Images. Diagnostics 2022, 12, 2952. [Google Scholar] [CrossRef]
  18. Salcedo, E.; Peñaloza, P. Edge Ai-Based Vein Detector for Efficient Venipuncture in the Antecubital Fossa; Springer: Berlin/Heidelberg, Germany, 2023; pp. 297–314. [Google Scholar]
  19. Al-Saadi, S.F.; Karimi Moonaghi, H.; Al-Fayyadh, S.; Bakhshi, M. Vein Visualization Using near Infrared (NIR) Vein Finder Technology in Nursing Care: A Review of the Benefits and Shortcomings. Med. Educ. Bull. 2021, 2, 213–220. [Google Scholar]
  20. Anazi, S.K.A.; Woodman, A.; Al Zahrani, W.A.; Alsanad, M.A.; Alzahrani, M.S.; Alanazi, F.R.; Rasheed, M. Literature Review on the Efficacy of Near-Infrared Device in Improving Peripheral Venous Access Time and Number of Attempts in Pediatric Patients. Curr. Med. Res. Opin. 2023, 39, 1013–1019. [Google Scholar] [CrossRef]
  21. Pan, C.-T.; Francisco, M.D.; Yen, C.-K.; Wang, S.-Y.; Shiue, Y.-L. Vein Pattern Locating Technology for Cannulation: A Review of the Low-Cost Vein Finder Prototypes Utilizing near Infrared (NIR) Light to Improve Peripheral Subcutaneous Vein Selection for Phlebotomy. Sensors 2019, 19, 3573. [Google Scholar] [CrossRef]
  22. Juric, S.; Zalik, B. An Innovative Approach to Near-Infrared Spectroscopy Using a Standard Mobile Device and Its Clinical Application in the Real-Time Visualization of Peripheral Veins. BMC Med. Inform. Decis. Mak. 2014, 14, 100. [Google Scholar] [CrossRef]
  23. Farjaminejad, S.; Farjaminejad, R.; Sotoudehbagha, P.; Razavi, M. Non-Invasive Medical Imaging in the Evaluation of Composite Scaffolds in Tissue Engineering: Methods, Challenges, and Future Directions. J. Compos. Sci. 2025, 9, 400. [Google Scholar] [CrossRef]
  24. Cai, S.; Mai, J.; Hong, W.; Fraser, S.E.; Cutrale, F. Rapid Diffused Optical Imaging for Accurate 3D Estimation of Subcutaneous Tissue Features. iScience 2025, 28, 111818. [Google Scholar] [CrossRef]
  25. Alwazzan, M.J. Low Cost Blood Vein Detection System Based on Near-Infrared LEDs and Image-Processing Techniques. Pol. J. Med. Phys. Eng. 2020, 26, 61–67. [Google Scholar] [CrossRef]
  26. Juric, S.; Flis, V.; Debevc, M.; Holzinger, A.; Zalik, B. Towards a Low-Cost Mobile Subcutaneous Vein Detection Solution Using Near-Infrared Spectroscopy. Sci. World J. 2014, 2014, 365902. [Google Scholar] [CrossRef] [PubMed]
  27. Weerasinghe, K.; Tennakoon, S.; Kularatne, K.; Nawinne, I.; Ragel, R.; Jayakody, H. Using Near-Infrared Spectroscopy for Vein Visualization; IEEE: New York, NY, USA, 2021; pp. 363–368. [Google Scholar]
  28. Vt, G. A Novel Design Proposal for Low-Cost Vein-Viewer for Medical and Non-Contact Biometric Applications Using NIR Imaging. J. Med. Eng. Technol. 2021, 45, 303–312. [Google Scholar] [CrossRef]
  29. Bang, S.-H.; Kim, S.-H.; Jeong, J.-H. A Study on Image Processing of Vein Extraction Images According to Development of Vein Detector. Technol. Health Care 2025. epub ahead of printing. [Google Scholar] [CrossRef]
  30. Espinoza-Valdez, A.; Ordaz-Salazar, F.C.; Ugalde, E.; Femat, R. Analysis of a Model for the Morphological Structure of Renal Arterial Tree: Fractal Structure. J. Appl. Math. 2013, 2013, 396486. [Google Scholar] [CrossRef]
  31. Babin, D.; Pižurica, A.; Velicki, L.; Matić, V.; Galić, I.; Leventić, H.; Zlokolica, V.; Philips, W. Skeletonization Method for Vessel Delineation of Arteriovenous Malformation. Comput. Biol. Med. 2018, 93, 93–105. [Google Scholar] [CrossRef]
  32. Yim, P.J.; Choyke, P.L.; Summers, R.M. Gray-Scale Skeletonization of Small Vessels in Magnetic Resonance Angiography. IEEE Trans. Med. Imaging 2002, 19, 568–576. [Google Scholar] [CrossRef]
  33. Ozkan, H.; Aydin, M.; Ozcan, O.; Zengin, Ü. A Portable Multispectral Vein Imaging System. J. Electr. Eng. 2023, 74, 64–69. [Google Scholar] [CrossRef]
  34. Fede, C.; Clair, C.; Pirri, C.; Petrelli, L.; Zhao, X.; Sun, Y.; Macchi, V.; Stecco, C. The Human Superficial Fascia: A Narrative Review. Int. J. Mol. Sci. 2025, 26, 1289. [Google Scholar] [CrossRef] [PubMed]
  35. Simka, M.; Czaja, J.; Kawalec, A. Clinical Anatomy of the Lower Extremity Veins—Topography, Embryology, Anatomical Variability, and Undergraduate Educational Challenges. Anatomia 2024, 3, 136–154. [Google Scholar] [CrossRef]
  36. Matsumoto, M.; Tateishi, A.; Kobayashi, H.; Hashiguchi, N. Vein Depth and Diameter as Predictive Indicators of Visibility and Palpability during Venipuncture in Healthy Volunteers. PLoS ONE 2025, 20, e0323367. [Google Scholar] [CrossRef] [PubMed]
  37. Miharu, M.; Nobuko, H.; Hiromitsu, K. Short-and Long-Term Reproducibility of Peripheral Superficial Vein Depth and Diameter Measurements Using Ultrasound Imaging. BMC Med. Imaging 2022, 22, 212. [Google Scholar] [CrossRef]
Figure 1. A schematic diagram of the proposed NIR vein visualization system. The setup consists of a 940 nm NIR LED illumination source directed toward the subject’s forearm, a modified webcam for image acquisition, and a computer interface for digital image processing. The captured blood vessel image undergoes processing to extract the ROI corresponding to visible superficial veins.
Applsci 16 02578 g001
Figure 2. The procedure for NIR filter removal from the Logitech C270 HD webcam. The process involves three sequential steps: (1) opening the webcam casing, (2) removing the lens assembly, and (3) carefully detaching the NIR filter. This modification enables the webcam sensor to capture images within the NIR spectral range, making it suitable for NIR-based vein visualization applications.
Applsci 16 02578 g002
Figure 3. Design, assembly, and testing of NIR illumination system. (A) Circuit diagram and schematic illustration of 940 nm NIR LED array showing nine LEDs connected in parallel, each paired with 73 Ω resistor and powered by 5 V, 2 A DC source. Illumination is designed to enhance vein visibility through NIR light absorption differences between blood and surrounding tissue. (B) Prototype through-hole universal prototyping PCB board used for circuit assembly. (C) Assembled NIR LED array with connected components and wiring according to designed schematic. (D) Operational test of illumination system showing uniform NIR emission from LED array, confirming proper functionality and even light distribution across target region.
Applsci 16 02578 g003
Figure 4. The workflow of the image processing and analysis stages for vein visualization. The process is divided into three main phases: (1) image pre-processing, including RGB-to-grayscale conversion, histogram equalization, image enhancement, and adaptive thresholding to improve contrast and suppress noise; (2) image segmentation, involving Canny edge detection and morphological transformation to isolate vein structures; and (3) feature extraction, which applies skeletonization to highlight vascular patterns and overlay them on the original image for the enhanced visualization of superficial veins.
Applsci 16 02578 g004
Figure 5. Design schematics and dimensional drawings of the acrylic equipment rack for component assembly. (A) A technical drawing of the base structure, showing the main slide and base slide components designed in SOLIDWORKS and dimensioned for laser cutting. The drawing includes detailed measurements and assembly alignment for component fitting. (B) A three-dimensional model and corresponding technical plan of the rack enclosure, illustrating the overall structural configuration and component dimensions. The model includes the base, case panels, guide rails, and beam supports designed to accommodate the camera module and NIR light source, ensuring proper alignment and mechanical stability during imaging experiments.
Applsci 16 02578 g005
Figure 6. The development and implementation of the GUI for the NIR vein visualization system using Python. (AC) Segments of the Python source code developed in Visual Studio Code version 1.103, illustrating the key modules for GUI construction, camera control, and image processing integration. The code defines the workflow for image acquisition, grayscale conversion, contrast enhancement, adaptive thresholding, and feature extraction within a single interface. (D) The operational view of the implemented GUI showing real-time image acquisition and processing results. The left panel displays the original NIR image, while the right panel presents the processed grayscale image with enhanced vein visibility, demonstrating the system’s functionality and usability for practical venous imaging applications.
Applsci 16 02578 g006
Figure 7. The prototype of the low-cost NIR vein visualization system. The prototype integrates a modified webcam and a 940 nm NIR illumination source housed within a compact equipment enclosure, enabling subjects to place their arm inside the system for vein imaging. Real-time vein images are acquired and processed on a laptop computer using the proposed image processing pipeline, including image pre-processing, image segmentation, and feature extraction. The GUI displays both the original and processed images simultaneously, providing real-time vein visualization to support testing and evaluation. The portable design allows the system to be easily deployed and installed in medical or laboratory environments according to user requirements.
Applsci 16 02578 g007
Figure 8. NIR images of the lower arm acquired at a source-to-arm distance of 15 cm under different ambient lighting conditions. Images captured with the laboratory lights turned off (left) and turned on (right) are shown for two representative samples (Sample i and Sample j), illustrating the effect of ambient illumination on superficial vein visibility.
Applsci 16 02578 g008
Figure 9. NIR images of the lower arm obtained at a source-to-arm distance of 20 cm under varying ambient lighting conditions. Images acquired with the laboratory lights turned off (left) and turned on (right) are shown for two representative samples (Sample i and Sample j), demonstrating the influence of ambient illumination on superficial vein visibility.
Applsci 16 02578 g009
Figure 10. NIR images of the upper arm acquired at a source-to-arm distance of 15 cm under different ambient lighting conditions. Images captured with the laboratory lights turned off (left) and turned on (right) are shown for two representative samples (Sample i and Sample j), illustrating the performance of the proposed vein visualization system and the effect of ambient illumination on superficial vein visibility.
Applsci 16 02578 g010
Figure 11. NIR images of the upper arm obtained at a source-to-arm distance of 20 cm under varying ambient lighting conditions. Images acquired with the laboratory lights turned off (left) and turned on (right) are shown for two representative samples (Sample i and Sample j), demonstrating the performance of the proposed vein visualization system and the influence of ambient illumination on superficial vein visibility.
Applsci 16 02578 g011
Figure 12. Output images of the lower arm after applying the proposed image processing pipeline with the laboratory lights turned off. The top row shows the original NIR images acquired at source-to-arm distances of 15 cm (left) and 20 cm (right). The bottom row presents the corresponding processed results overlaid on the original images, highlighting the extracted vein structures and demonstrating the effect of imaging distance on vein visibility after image processing.
Applsci 16 02578 g012
Figure 13. Output images of the upper arm after applying the proposed image processing pipeline with the laboratory lights turned off. The top row shows the original NIR images acquired at source-to-arm distances of 15 cm (left) and 20 cm (right). The bottom row presents the corresponding processed results overlaid on the original images, highlighting the extracted vein structures and illustrating the effect of imaging distance on vein visibility after image processing.
Applsci 16 02578 g013
Figure 14. Comparison of MSE values under different experimental conditions. (A) Average MSE results for lower arm and (B) average MSE results for upper arm obtained at two source-to-arm distances (15 cm and 20 cm) with ambient light turned off and turned on. Data are given as mean ± standard deviation.
Applsci 16 02578 g014
Figure 15. Comparison of PSNR values under different experimental conditions. (A) Average PSNR results for lower arm and (B) average PSNR results for upper arm obtained at two source-to-arm distances (15 cm and 20 cm) with ambient light turned off and turned on. Data are given as mean ± standard deviation.
Applsci 16 02578 g015
Table 1. A quantitative evaluation of vein visualization performance for the lower arm under different illumination and distance conditions. MSE and PSNR values are reported for eight test trials conducted at two source-to-arm distances (15 cm and 20 cm) with ambient light turned off and turned on. The table presents individual measurements, along with the corresponding average and SD, to assess the effect of distance and ambient illumination on image quality and vein visualization performance.
TestLower Arm; Turned OffTestLower Arm; Turned On
15 cm20 cm15 cm20 cm
MSEPSNR (dB)MSEPSNR (dB)MSEPSNR (dB)MSEPSNR (dB)
1144.6826.53299.3623.371266.1123.88337.8222.84
2148.1126.42288.4623.532344.1022.76298.7323.38
3142.6426.59302.3623.333289.2123.52294.6423.44
4152.6726.29297.1623.404282.5023.62291.9623.48
5144.3126.54283.8823.605295.0323.43307.9823.25
6141.5526.62287.2023.556296.9623.40309.7323.22
7141.9126.61304.2823.307306.9423.26314.8023.15
8136.1726.79286.4023.568292.7923.47348.0322.71
Average144.0126.55293.6423.45Average296.7023.42312.9623.18
SD4.560.147.500.11SD21.110.3018.930.26
Table 2. A quantitative performance evaluation of the proposed vein visualization system for the upper arm under varying illumination and distance conditions. MSE and PSNR values are reported for eight experimental trials conducted at two source-to-arm distances (15 cm and 20 cm) with ambient illumination turned off and turned on. The table summarizes individual measurements, along with the corresponding average and SD, to analyze the influence of arm location, imaging distance, and ambient lighting on vein visualization performance.
TestUpper Arm; Turned OffTestUpper Arm; Turned On
15 cm20 cm15 cm20 cm
MSEPSNR (dB)MSEPSNR (dB)MSEPSNR (dB)MSEPSNR (dB)
1121.5427.28162.0326.031233.2124.45278.8023.68
2158.3126.14163.9925.982251.8324.12254.1824.08
3182.2325.52153.0026.283255.5924.06255.1424.06
4181.0625.55155.7826.214273.2723.76243.1924.27
5129.1827.02182.1425.535265.4223.89235.8924.40
6136.1926.79174.6625.716244.8424.24230.7524.50
7126.4027.11168.8625.867248.1024.18270.5823.81
8196.5325.20158.9726.128259.7423.98225.2824.60
Average153.9326.33164.9325.96Average254.0024.09249.2324.18
SD27.630.779.200.24SD11.690.2117.740.31
Disclaimer/Publisher’s Note: The statements, opinions and data contained in all publications are solely those of the individual author(s) and contributor(s) and not of MDPI and/or the editor(s). MDPI and/or the editor(s) disclaim responsibility for any injury to people or property resulting from any ideas, methods, instructions or products referred to in the content.