Article

Anisotropic Mechanical Parameter Testing of Bedded Shale and Its Influence Mechanisms on Hydraulic Fracture Propagation


1
School of Civil Engineering, Henan Polytechnic University, Jiaozuo 454003, China
2
State Key Laboratory of Geomechanics and Geotechnical Engineering Safety, Institute of Rock and Soil Mechanics, Chinese Academy of Sciences, Wuhan 430071, China
3
College of Transportation Engineering, Dalian Maritime University, Dalian 116026, China
4
CNPC Engineering Technology R&D Co., Ltd., Beijing 102206, China
5
School of Civil Engineering, Architecture and Environment, Hubei University of Technology, Wuhan 430068, China
6
State Key Laboratory of Deep Geothermal Resources, School of Sustainable Energy, China University of Geosciences, Wuhan 430074, China
7
Engineering Research Center of Geothermal Resources Development Technology and Equipment, Ministry of Education, Jilin University, Changchun 130026, China
*
Author to whom correspondence should be addressed.
Appl. Sci. 2026, 16(5), 2534; https://doi.org/10.3390/app16052534
Submission received: 26 December 2025 / Revised: 9 February 2026 / Accepted: 13 February 2026 / Published: 6 March 2026

Abstract

The development and utilization of unconventional shale oil and gas have enhanced the resilience of global energy security. Hydraulic fracturing is the primary method for enhancing unconventional shale oil and gas extraction. Previous studies have predominantly employed homogenized geomechanical models to simulate fracture propagation in rock masses. However, bedding planes and inhomogeneous mineral distributions introduce mechanical anisotropy in shale, rendering conventional homogenized models insufficient for accurately representing hydraulic fracturing in real reservoirs. For this, millimeter-scale indentation testing was employed to systematically quantify the depth-dependent distribution of mechanical parameters across varying bedding orientations, using fragmented shale samples obtained from the Qingshankou Formation of the Songliao Basin, northern China. Then, hydraulic fracturing simulations were performed using the mechanical properties derived from the indentation tests. The key findings include: (1) The elastic modulus of the Qingshankou Formation shale reservoir exhibits significant anisotropic properties in both the depth and bedding orientations. The elastic modulus measured parallel to bedding (10.23–65.08 GPa) is 28% higher than that measured perpendicular to bedding (9.60–47.24 GPa) due to shale bedding anisotropy. The mineralogical composition predominantly governs the depth-dependent anisotropy, with an elevated brittle mineral content increasing the elastic modulus and a higher clay content reducing it. (2) The simulation results reveal that the depth-dependent anisotropy of elastic modulus induces asymmetric hydraulic fracture propagation, with the fractures preferentially extending along the orientations exhibiting a higher elastic modulus. This behavior arises due to the enhanced brittleness and reduced deformation resistance of high-modulus rocks, facilitating fracture advancement. The study offers critical insights for hydraulic fracturing design and operational implementation in bedded shale reservoirs.

1. Introduction

The success of the U.S. “Shale Revolution” has captured the attention of global energy investors, developers, and researchers. Unconventional shale oil and gas development has significantly enhanced global energy security by diversifying supply sources and reducing geopolitical risks. Hydraulic fracturing is a critical technology for extracting unconventional energy resources, such as shale oil and gas [1,2,3,4,5,6,7,8]. The efficiency of resource extraction depends fundamentally on the hydraulic fracture propagation dynamics and their governing mechanisms. However, the developed bedding and pronounced anisotropy of shale reservoirs introduce strong anisotropy into their mechanical properties [9], leading to complex and often unpredictable fracture behavior [10,11,12,13,14]. This anisotropy directly challenges the conventional homogenization assumptions of the geomechanical models used for hydraulic fracturing simulations. To address this gap, it is imperative to characterize the distribution of anisotropic mechanical properties in bedded shale reservoirs and elucidate their mechanistic control of fracture propagation dynamics.
In recent years, the acquisition and characterization of shale mechanical parameters have been the focus of extensive international research. Conventional rock mechanics tests, including triaxial compression, uniaxial compression, and three-point bending tests [15,16,17,18,19,20,21,22,23,24,25,26], have been widely used to determine the shale strength, elastic properties, and fracture behavior. These studies have further revealed depth-dependent anisotropy trends, showing that deep shale reservoirs exhibit significantly lower mechanical anisotropy compared to shallow reservoirs [27]. Additionally, the bedding orientation strongly influences shale’s mechanical properties [28]. For example, the compressive strength and elastic modulus display non-monotonic trends (initial increase followed by decrease) with varying bedding angles, underscoring the pronounced anisotropy of bedded shale. However, a critical limitation persists: most laboratory tests require intact core samples. Given shale’s inherent brittleness and bedded structure, it frequently fragments during coring [29], often preventing the preparation of standard-sized plugs (e.g., φ25 × 50 mm or φ50 × 100 mm). While abundant shale fragments remain available, traditional mechanical testing methods, designed for standardized samples, face practical constraints in evaluating bedded shale.
The mechanical anisotropy inherent to bedded shale reservoirs presents significant challenges for accurately modeling hydraulic fracture propagation. The current methodologies for incorporating this anisotropy parameter into numerical simulations can be broadly categorized into two approaches: statistical distribution models and discrete element methods. A Weibull distribution has been extensively employed to statistically represent rock anisotropy in computational models [30,31,32,33]. Comparative analyses of homogeneous models and Weibull-distributed elastic modulus configurations have demonstrated that a material’s anisotropy exerts substantial influence on fracture development. Specifically, heterogeneous elastic modulus distributions induce asymmetric fracture propagation patterns and modify the fracture displacement characteristics [34]. The degree of this effect correlates directly with the magnitude of rock’s anisotropy. Discrete element method (DEM) simulations have offered a particle-scale approach to anisotropy representation [35], where the individual grain properties are assigned distinct mechanical parameters. This methodology requires careful calibration against experimental triaxial compression data to ensure model fidelity [36]. DEM simulations have revealed fundamentally different fracture patterns compared to homogeneous models [37], generating complex fracture networks characterized by distributed microcrack initiation and subsequent coalescence. These patterns more accurately replicate observed field-scale fracture morphologies. However, the current approaches exhibit notable limitations. A Weibull distribution’s idealized statistical framework often inadequately captures the true mechanical parameter distributions in geological reservoirs. Similarly, DEM microparameter assignment frequently relies on empirical approximations rather than mineralogical data, potentially compromising model accuracy. These constraints highlight the need for improved anisotropy characterization methods grounded in direct geological measurements.
This study utilizes fragmented bedded shale samples obtained from drilling cores to address the aforementioned challenges. Utilizing millimeter-scale indentation technology, high-precision continuous mechanical characterization of shale reservoirs is performed to quantify the mechanical parameter distributions along the depth gradients across varying bedding orientations. Building upon these experimentally derived mechanical parameters, we develop a high-fidelity geomechanical model of shale reservoirs. Through numerical simulations of hydraulic fracture propagation in bedded shale reservoirs, we rigorously examine how the actual mechanical parameter distributions influence the fracture network development. The study provides mechanistic insights into the relationship between the measured anisotropy and observed fracture propagation behavior.

2. Sample Collection and Equipment Description

2.1. Sample Collection

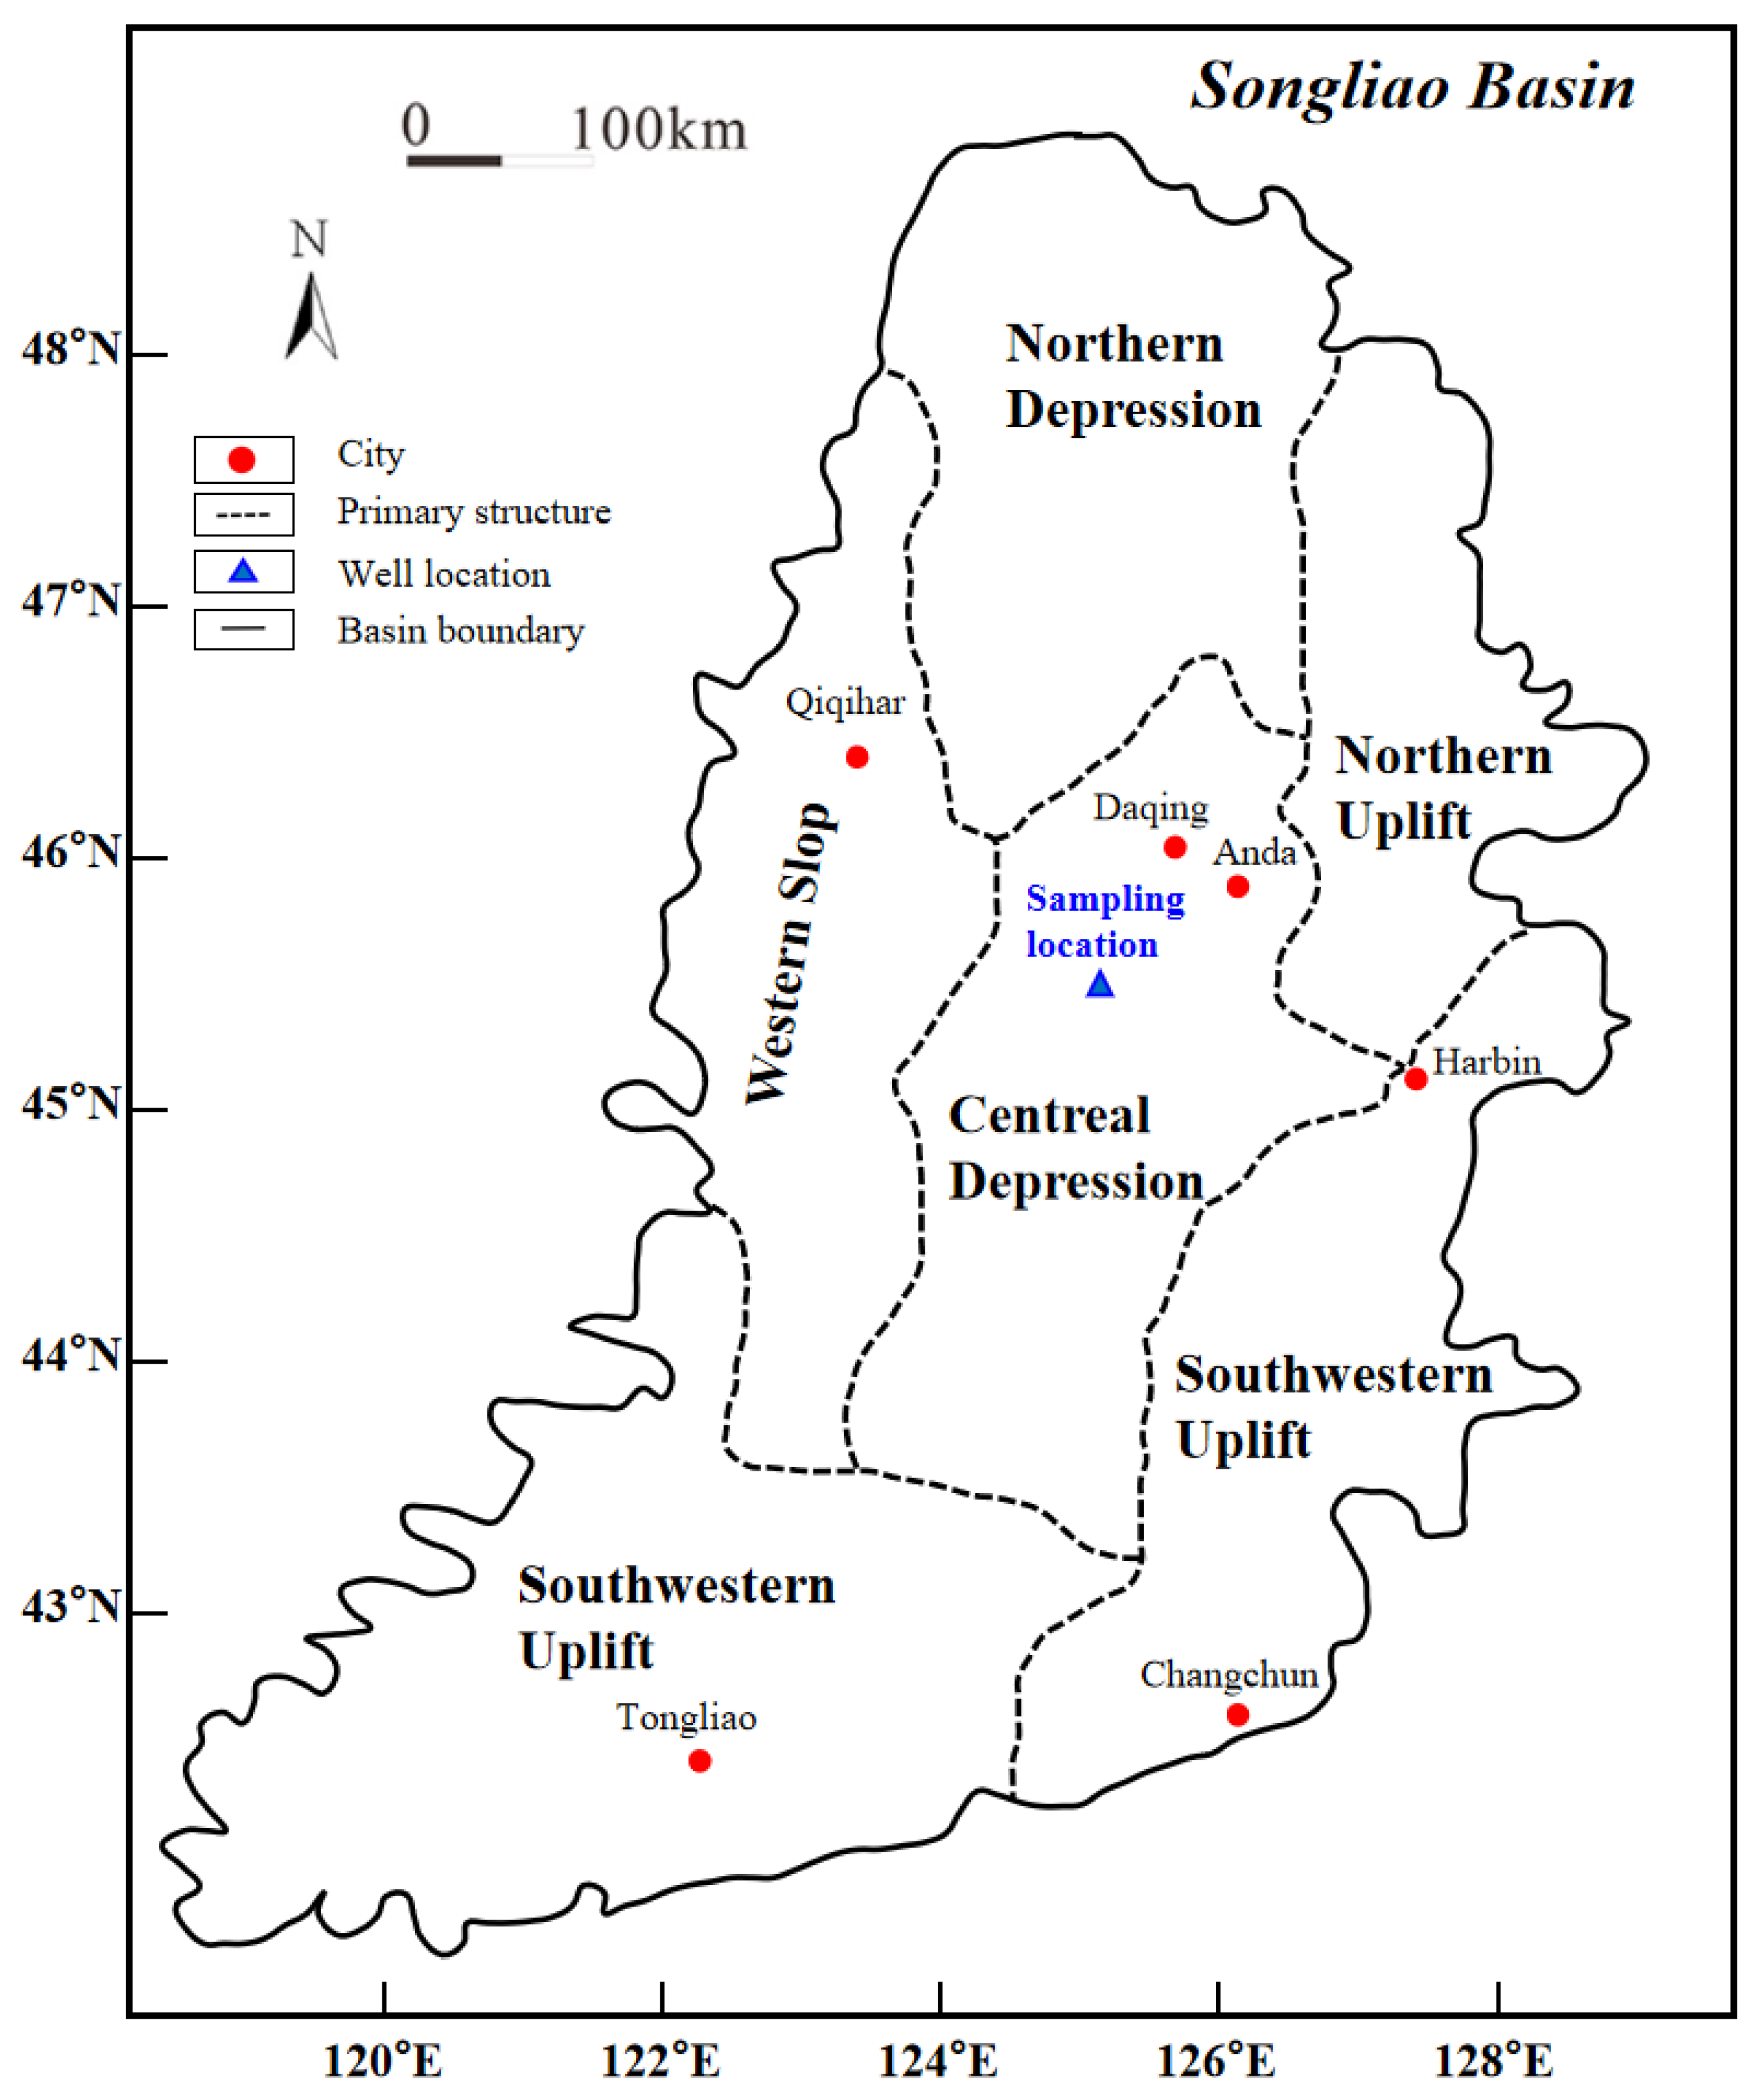
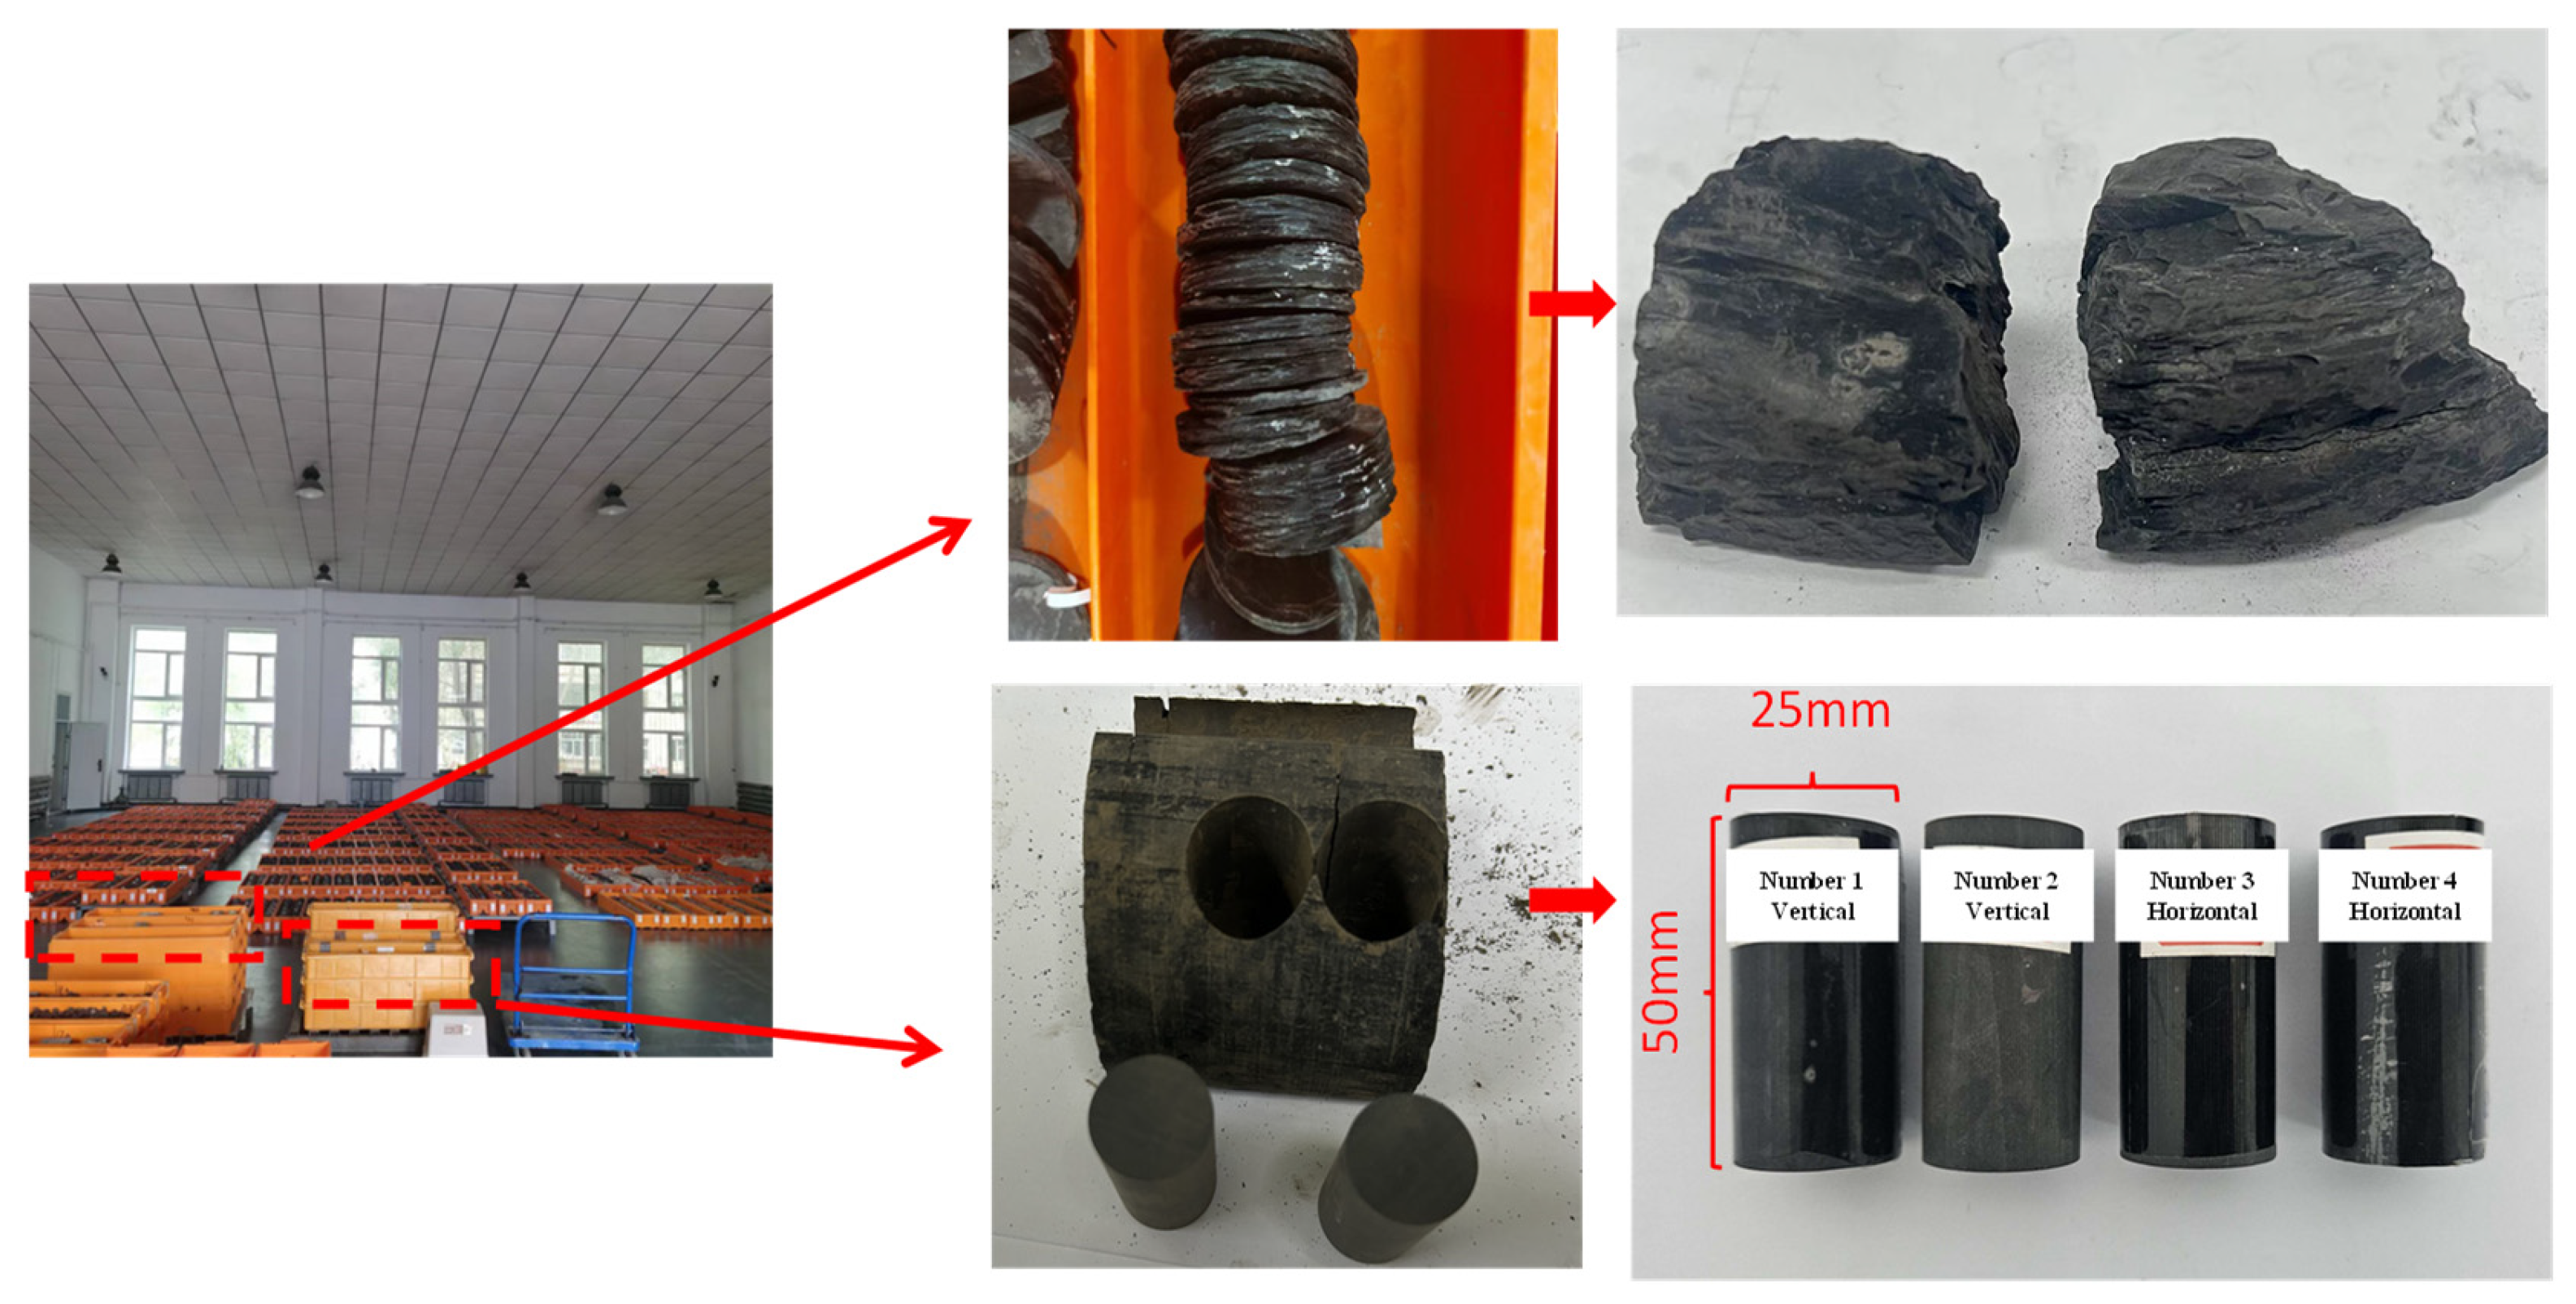
The experimental samples were obtained from the Qingshankou Formation of the Songliao Basin (45°30′–46°10′ N, 124°00′–125°30′ E, as shown in Figure 1), northern China, with a depth interval of 2325–2341 m. As one of the most prolific continental sandstone basins globally, the Songliao Basin hosts organic-rich deposits, with the Lower Cretaceous Qingshankou Formation representing peak lacustrine transgression. This interval was characterized by the extensive deposition of dark, organic-rich mud shale. These shales exhibit elevated organic content and intricate bedding architectures. The Qingshankou Formation mud shale in the Gulong area displays fissile, layered, and massive structural configurations, with the bedded and fissile textures being the most prevalent. The variations in the mineral composition of laminae result in divergent mechanical properties, promoting interfacial delamination. Consequently, interlaminar and fissile fractures are common, leading to core fragmentation during extraction. As a result, intact cylindrical samples (φ25 × 50 mm) were limited in availability, with the majority of recovered material consisting of fragmented shale pieces (Figure 2).

2.2. Sample Processing

The experimental protocol involved subjecting the collected rock specimens to four analytical procedures: millimeter-scale indentation testing, uniaxial compression analysis, X-ray diffraction (XRD) mineralogical characterization, and computed tomography (CT) scanning. Sample preparation was required for the indentation testing.
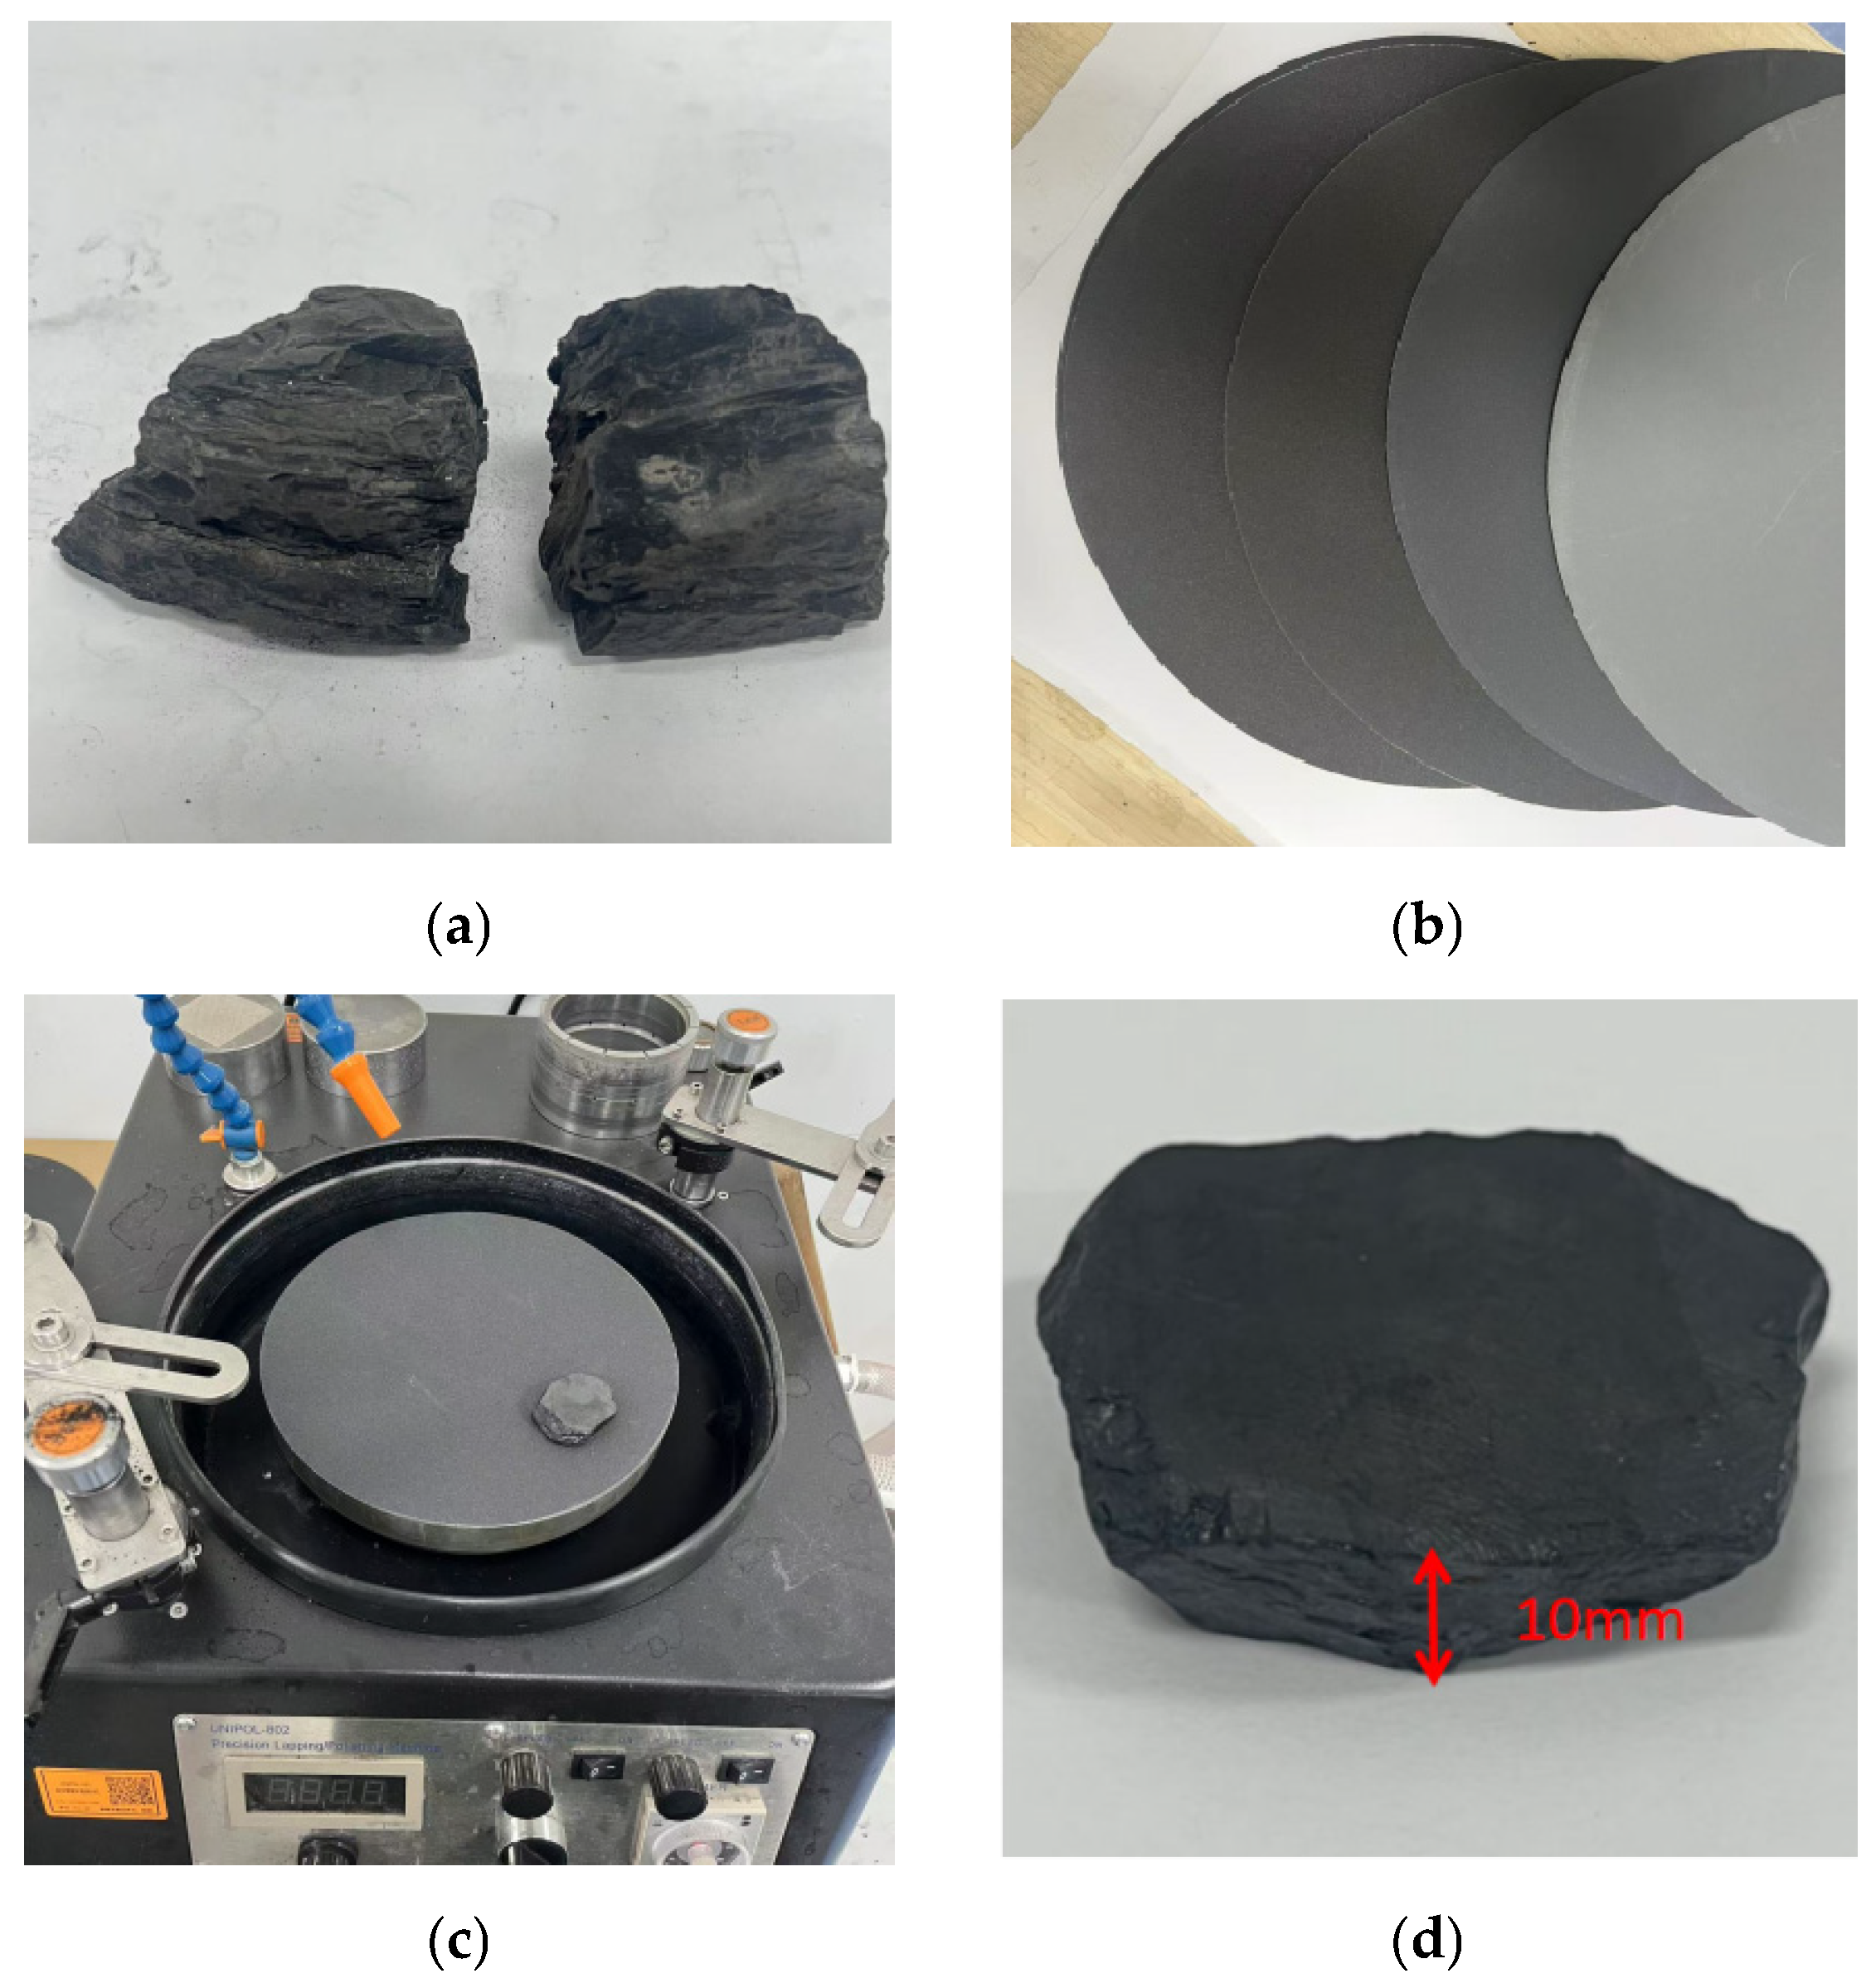
The surface preparation for the indentation testing involved sequential grinding and polishing using a BUEHLER MetaServ 250 metallographic polishing system, produced by Buehler, Lake Bluff, IL, USA. The polishing sequence employed progressively finer abrasives (300-, 500-, 800-, and ultimately 1500-grit silicon carbide papers), with each polishing stage maintained for a minimum duration of 5 min (Figure 3). To ensure that surface roughness-induced uncertainty in the indentation depth remains below 5%, the indentation depth must exceed 20 times the surface roughness. For the processed rock specimens, the minimum indentation depth was 20 μm. The surface roughness after polishing was approximately Ra ≈ 0.5 μm. This treatment satisfied the experimental requirements for surface roughness.
Subsequently, upon completion of millimeter-scale indentation testing, the shale samples were ground into powder using a grinding mill and sieved through a 200-mesh standard sieve to obtain the shale powder specimens. These powder specimens were utilized for the subsequent XRD mineralogical analysis.

2.3. Equipment Introduction

2.3.1. Millimeter Indentation Test Equipment

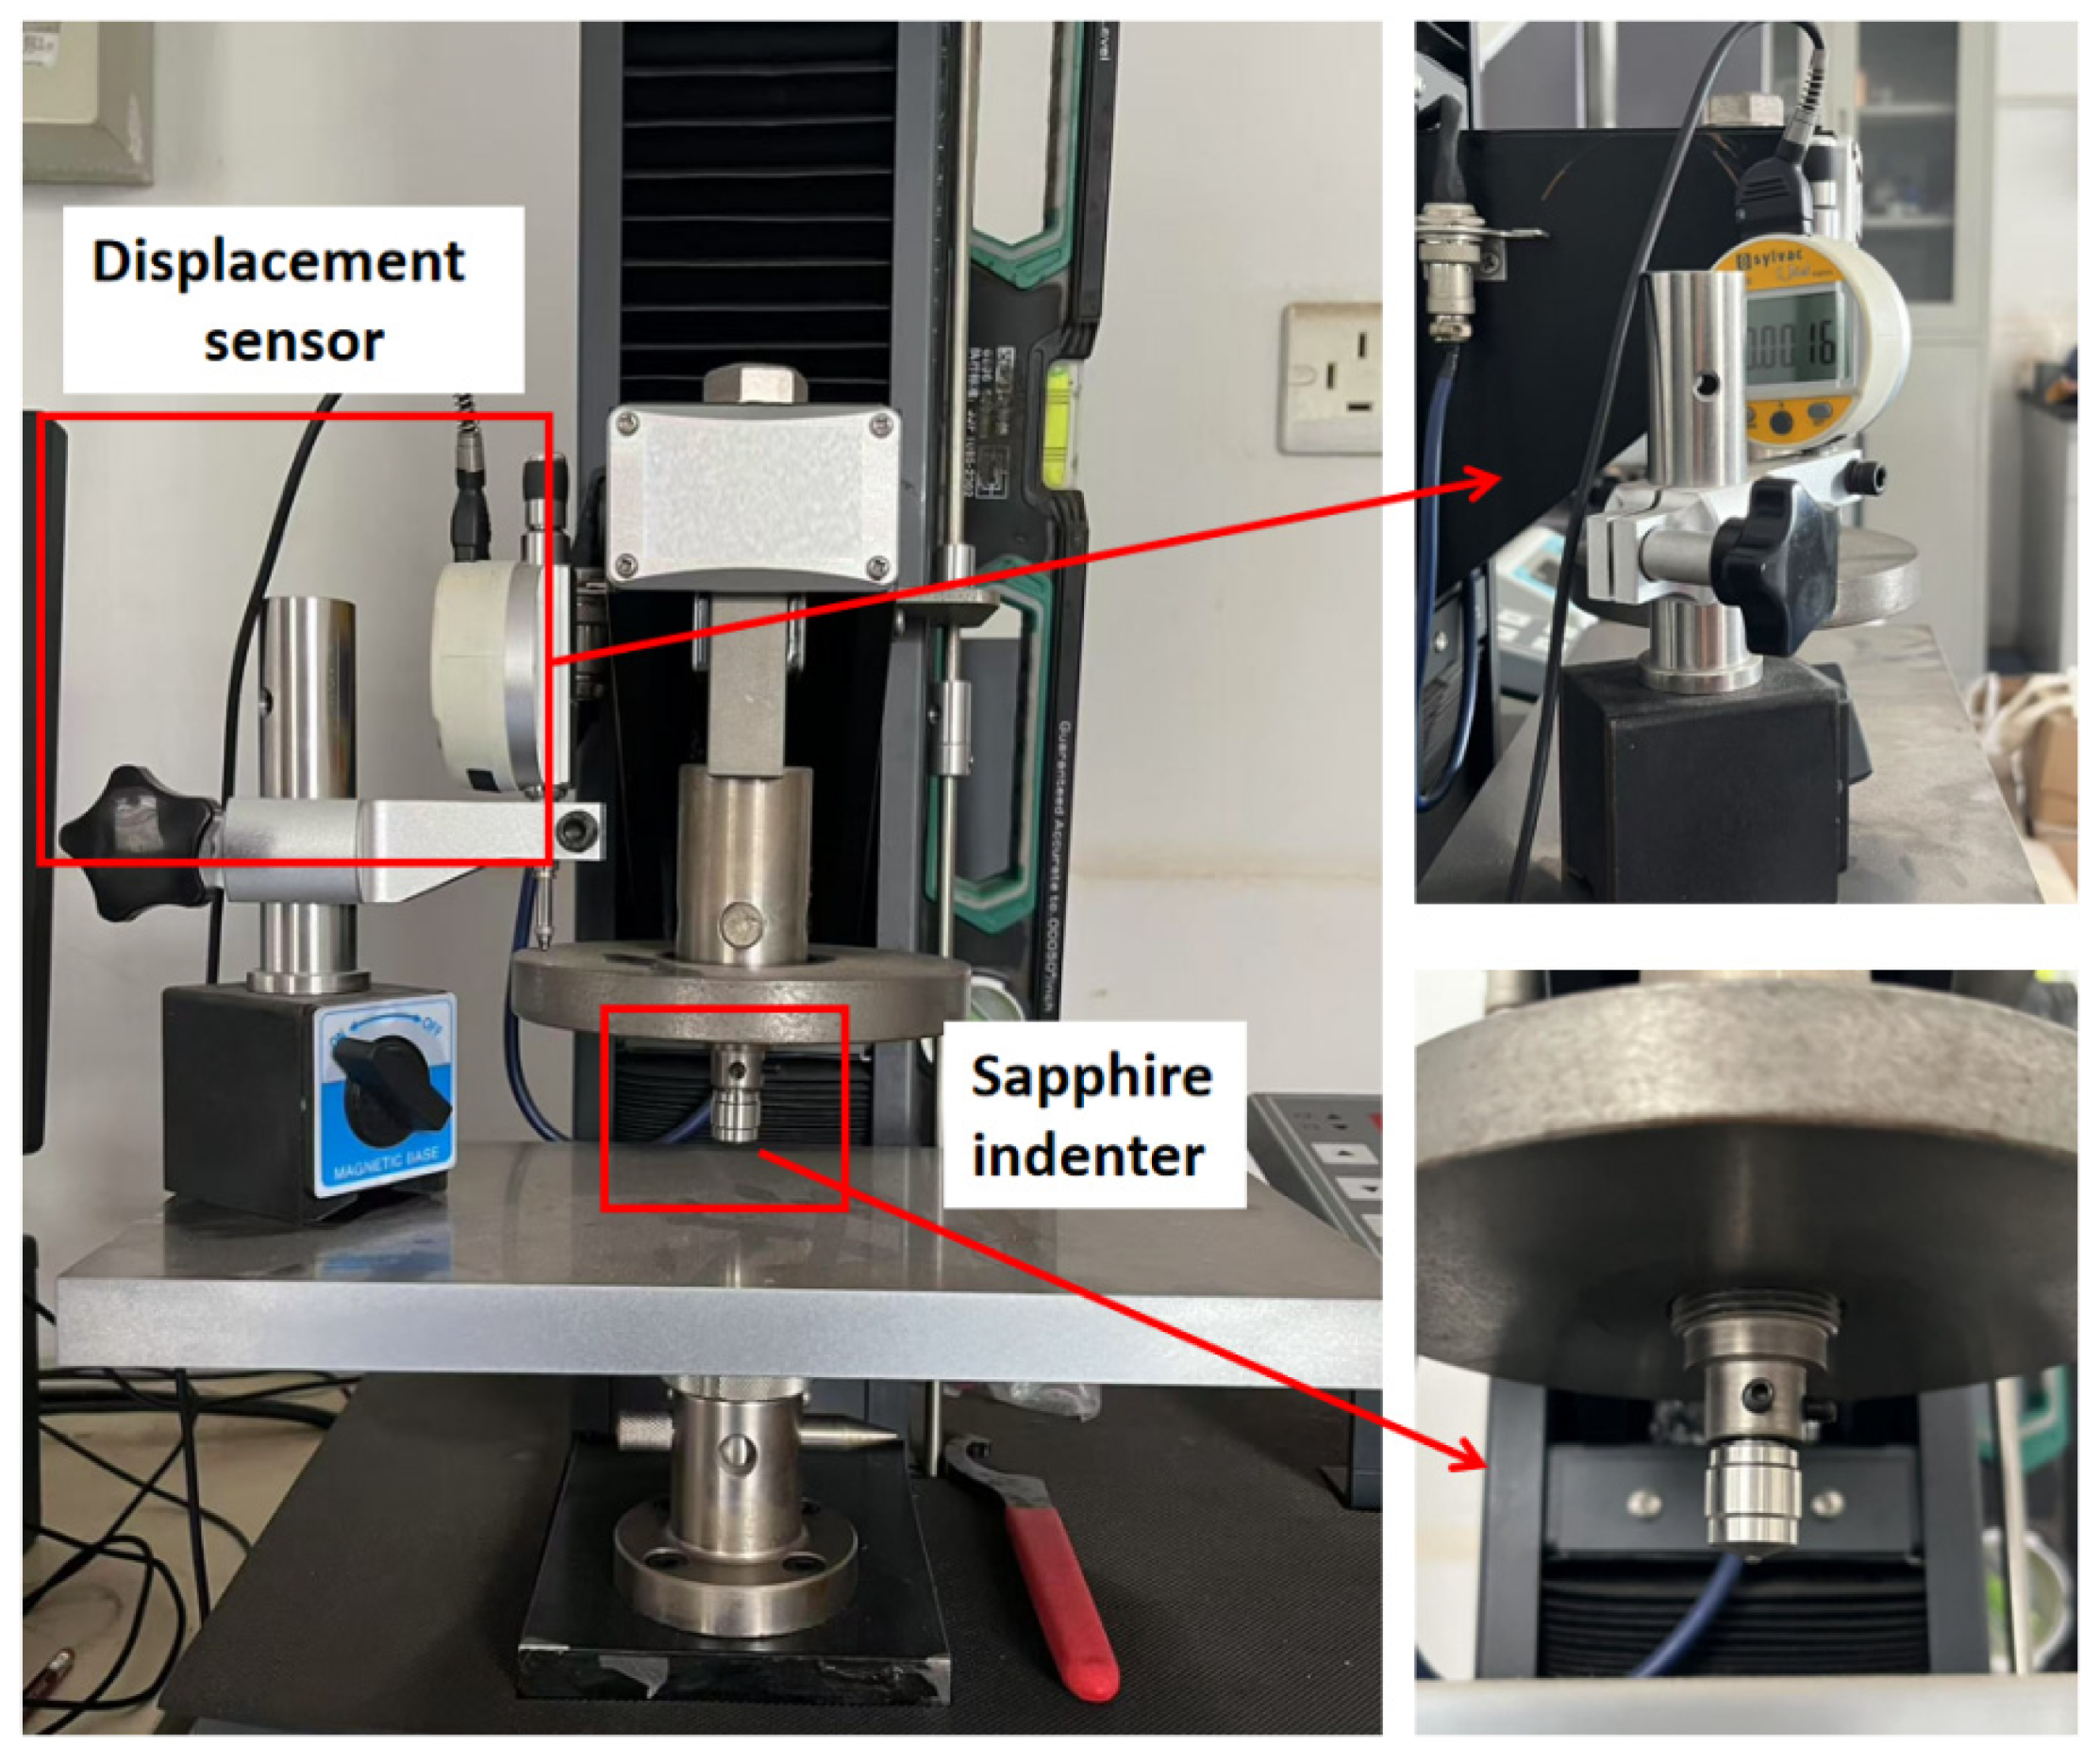
The millimeter-scale indentation testing system employed in this study was developed by the Wuhan Institute of Rock and Soil Mechanics, Chinese Academy of Sciences (Figure 4). This testing system operates at millimeter scales, continuously recording the load applied to the sample and the depth of indentation into the sample surface, thereby obtaining the hardness and modulus of the indented material. Additionally, it features a small load range and high precision, with the device parameters as follows: maximum indentation load of 500 N (precision: 1 mN) and maximum displacement of 5 cm (precision: 0.1 μm). These capabilities allow for the accurate mechanical characterization of materials at fine scales.

2.3.2. Uniaxial Compression Testing

The uniaxial compression tests were conducted using an RMT-150C servo-controlled testing system developed by the Wuhan Institute of Rock and Soil Mechanics, Chinese Academy of Sciences (Wuhan, Hubei, China), capable of applying a maximum axial load of 1500 kN. The system permits precise control of loading rates (0.01~90 kN/s) and deformation rates (0.0001~1.00 mm/s). The specimens were loaded at a constant displacement rate of 0.10 mm/min until failure, with the continuous acquisition of axial load, axial displacement, and circumferential displacement. These measurements facilitated determination of the shale’s macroscopic elastic modulus, which served as a reference for the subsequent indentation test calibrations.

2.3.3. X-Ray Diffraction Analysis

The mineralogical characterization was performed using a BRUKER-D8 ADVANCE X-ray, produced by Bruker, Karlsruhe, Germany, diffractometer equipped with a Cu-target X-ray tube (maximum current: 80 mA). The high-precision goniometer (angular precision: 0.0001°) and semiconductor array detector enabled a quantitative phase analysis. The system operates across a temperature range from ambient conditions to 1600 °C, permitting comprehensive mineralogical assessment under varying thermal conditions.

2.3.4. X-Ray Computed Tomography

The microstructural analysis was performed using a Geoscan 200 full-diameter, produced by TJQNJM Equipment Co., Ltd., Tianjin, China, Core X-ray computed tomography system. To minimize motion artifacts, the shale samples were stabilized with thin foam padding prior to scanning. The acquisition parameters included a tungsten target X-ray source operating at 180 kV maximum voltage and 0.5 mA tube current, with a detector exposure time of 500 ms and sensitivity setting of 4000. Each scan, comprising 1200 projections, was completed in 45 min at a spatial precision of 5.0 um, enabling the high-fidelity three-dimensional reconstruction of the shale microstructure.

3. Test Principle and Test Method

3.1. Test Principle

The Principle of the Millimeter Indentation Test

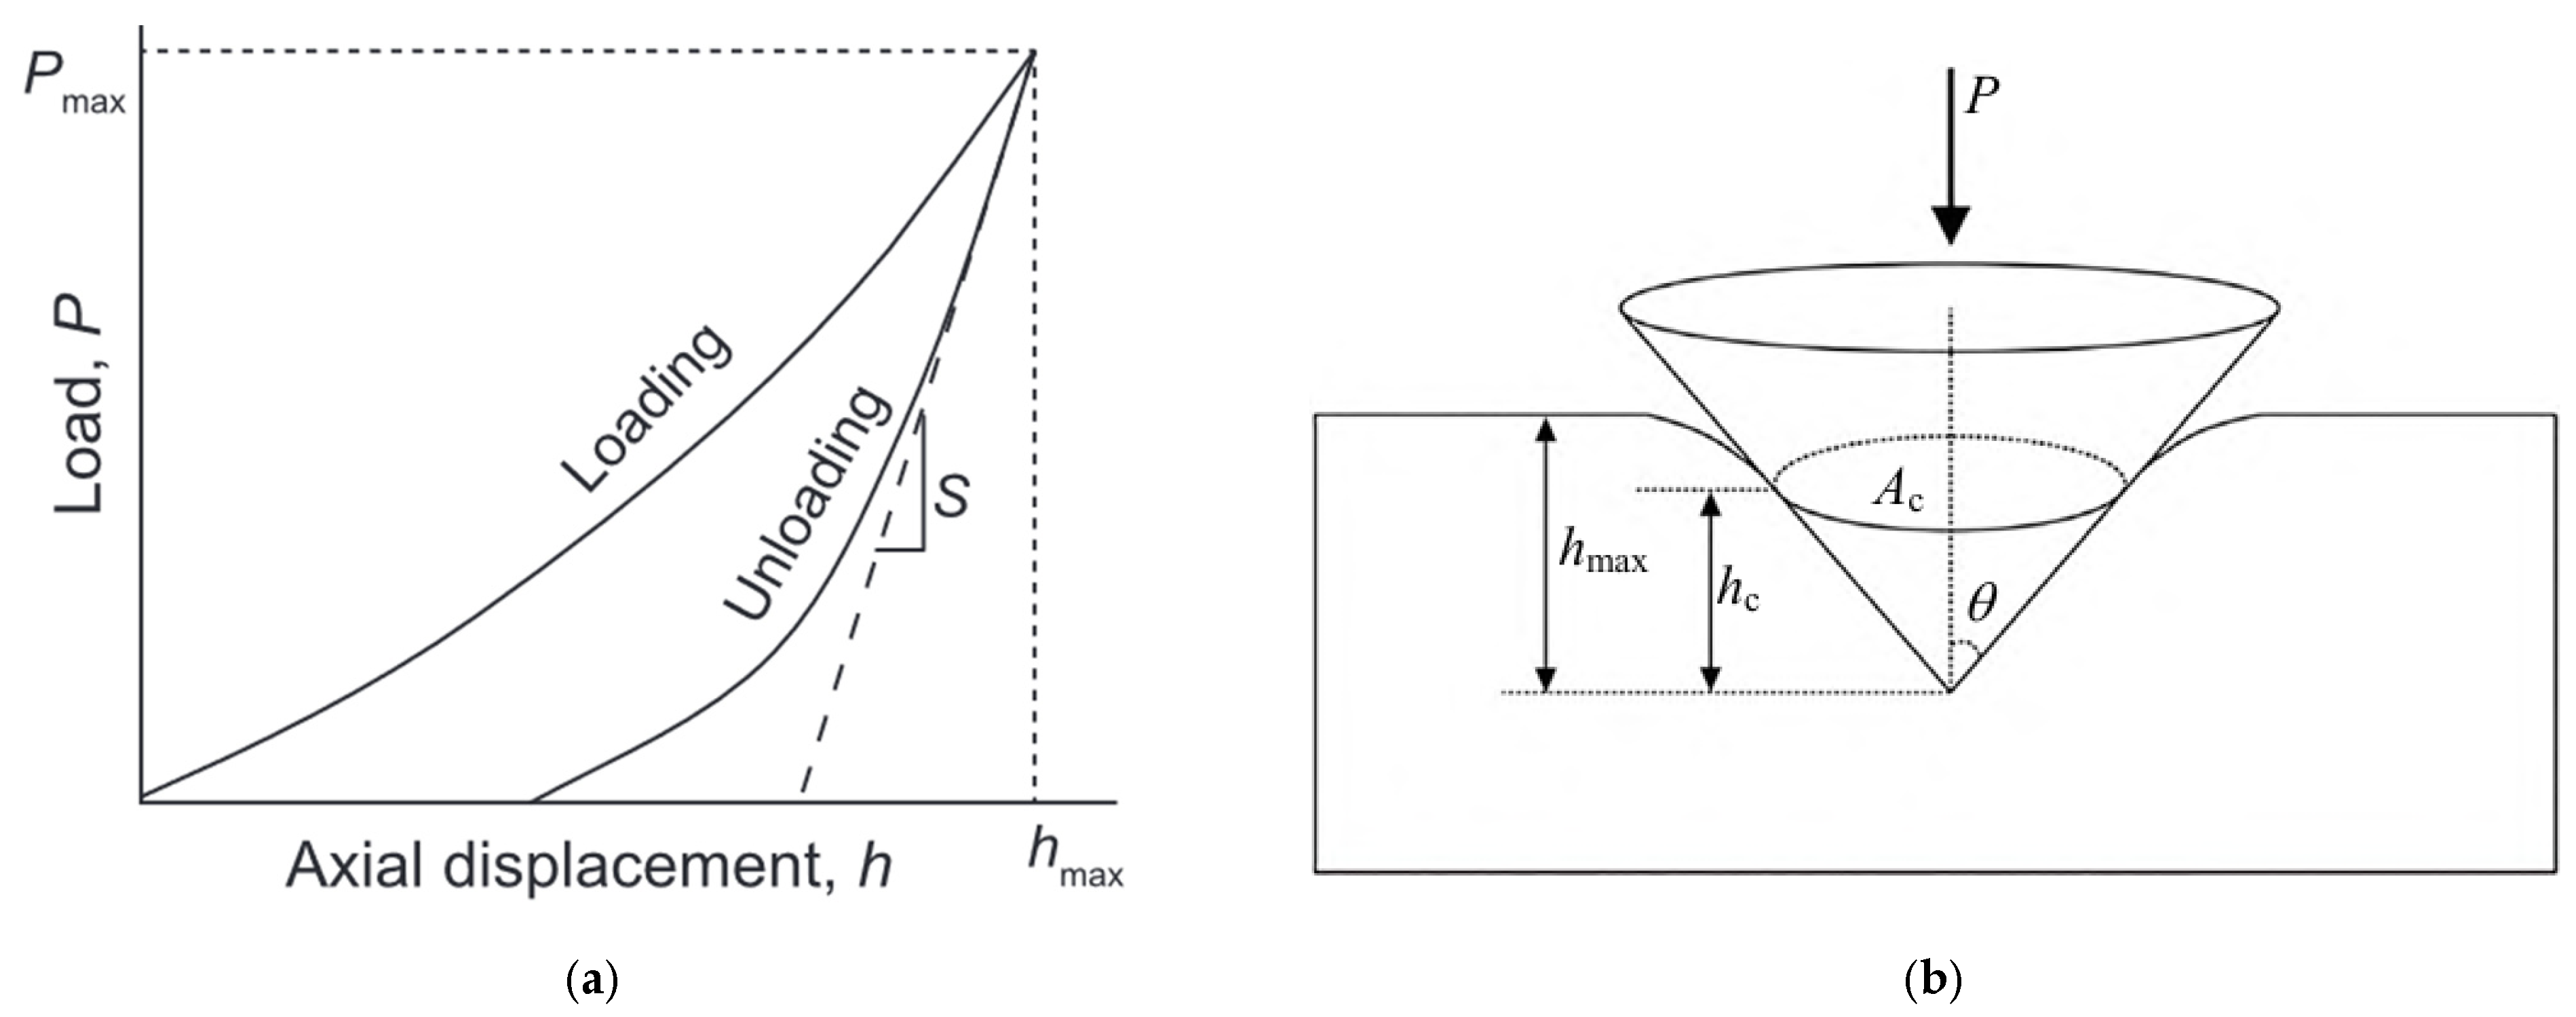
The mechanical properties of shale samples were characterized using millimeter-scale indentation testing, which operates on the principle of recording high-precision load–displacement data during controlled indenter penetration and withdrawal. As illustrated in Figure 5, the resulting load–displacement (P-h) curve enables derivation of key mechanical parameters through analysis of the unloading segment. In Equation (1), S represents the elastic contact stiffness, determined from the initial slope of the unloading curve; h m a x denotes the maximum penetration depth; and h f corresponds to the residual depth after complete unloading. h c indicates the contact depth, calculated via Equation (2). The method provides quantitative evaluation of material properties, including the elastic modulus and hardness, through an Oliver–Pharr analysis of the unloading curve’s elastic segment. Figure 6 simultaneously displays a characteristic P-h curve with labeled parameters and a schematic of the indentation test configuration.
S = d P d h h = h m a x
h c = h P m a x S m a x
In the formula, ε is a geometric constant dependent on the indenter tip morphology. For the standard Berkovich indenter, ε assumes a value of 0.75 [38].
In 1992, Oliver and Pharr [39] established a seminal analytical framework for determining the mesomechanical properties (elastic modulus and hardness) of materials, which remains the foundational computational methodology employed by commercial micro-indentation testing systems and continues to see widespread application. Utilizing a continuum-scale mechanical model and adhering to the classical elastoplastic deformation theory definitions of hardness and elastic modulus, the indentation hardness H and reduced elastic modulus E r (or indentation modulus) can be derived from the load–displacement P–h curve [39]. The governing equations are expressed as
H = P m a x A c
E r = π 2 β S A c
where H is the indentation hardness (GPa); P m a x is the maximum indentation load (mN); A is the projected area of the contact region ( μ m 2); E r is the reduced elastic modulus (GPa); β is the indenter correction coefficient, generally taken as 1.034; and S is the elastic contact stiffness (mN/ μ m ). During the test, the indenter contact depth h and the projected area of the contact region A c have the following corresponding relationship:
A c = 3 3 tan 2 θ h c 2
From the above formula, A c can be estimated as A c = 24.56 hc2; θ is the angle between the flank of the indenter and the direction of the applied load; and hc is the contact depth. Moreover, for isotropic homogeneous materials, the reduced elastic modulus E r and the elastic modulus E are related as follows:
1 E r = 1 v 2 E + 1 v i 2 E i
where v is the Poisson’s ratio of the tested material; E i is the elastic modulus of the diamond indenter, generally taken as 1140 GPa; and v i is the Poisson’s ratio of the diamond indenter, generally taken as 0.07.
From Equation (6), it can be observed that within the typical range of Poisson’s ratio v , the variation in the calculated elastic modulus due to different v values is relatively small. For most engineering materials, ( v ) falls within the range of 0.15 < v < 0.35, meaning that when ( v = 0.25 pm 0.1), the resulting uncertainty in the elastic modulus calculation E is only about 5.3% [40]. Therefore, an appropriate Poisson’s ratio can be selected based on the material’s properties without significantly affecting the accuracy. Additionally, the elastic modulus calculated using E i = 1140 GPa differs by only ~1.6% compared to the case where E i = ∞ [41]. Hence, for non-high-precision calculations, the influence of the diamond indenter’s stiffness can be neglected, allowing for a simplified calculation using Equation (7):
E = E r ( 1 v 2 )
Figure 5. Schematic of indentation loading–unloading and indenter penetration [39]: (a) load–unload diagram; (b) indenter penetration schematic.
Applsci 16 02534 g005
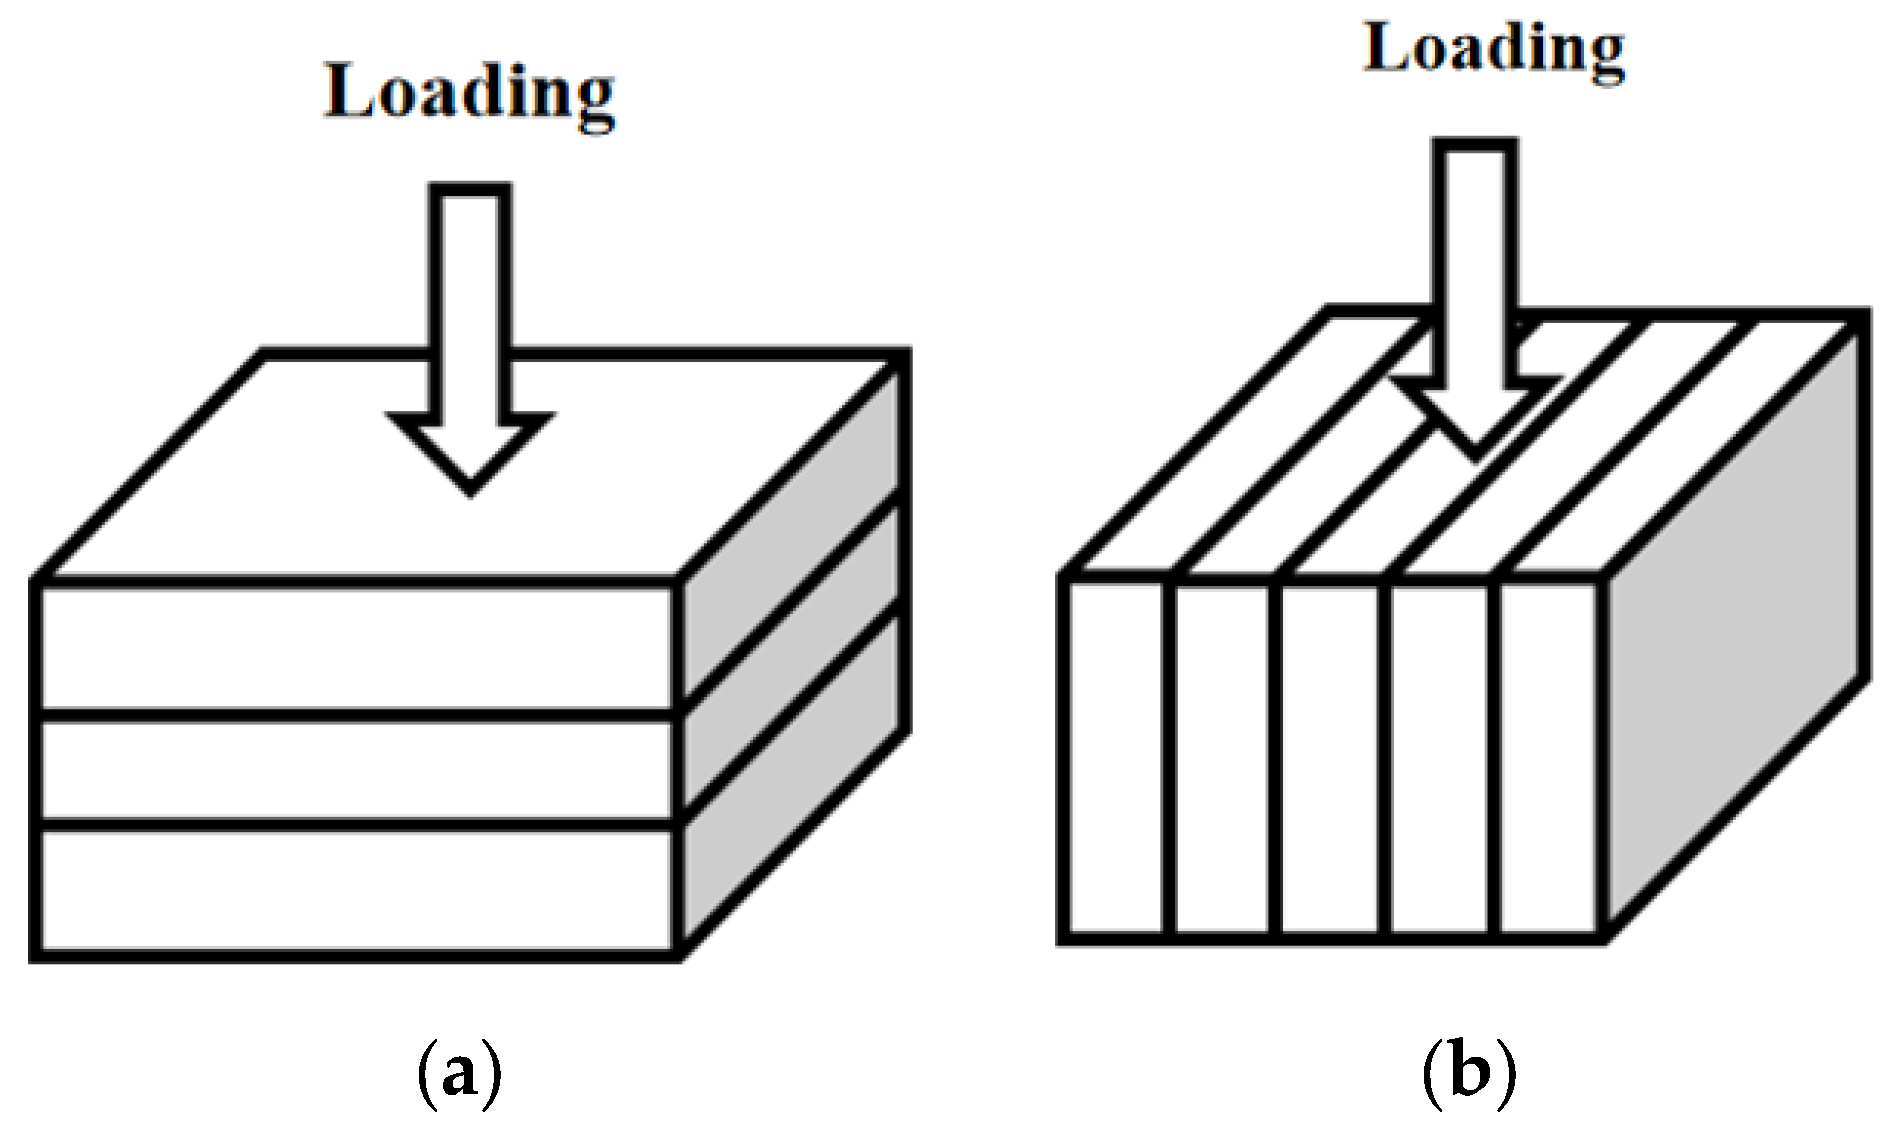
Figure 6. Schematic diagram of shale indentation test: (a) vertical bedding direction; (b) parallel bedding direction.
Applsci 16 02534 g006

3.2. Test Protocol

In this study, a millimeter-scale indentation testing methodology was implemented utilizing a 2.5 mm spherical tungsten carbide indenter under displacement-controlled conditions. A constant loading rate was maintained until reaching the peak load, while the displacement rate remained fixed throughout the experiment. Prior to formal testing, preliminary investigations involving both uniaxial compression experiments and variable-load indentation tests were conducted to optimize the experimental parameters and validate the measurement accuracy.
The uniaxial compression tests performed on standard rock specimens using an RMT rock mechanics testing system yielded a reference elastic modulus of 24.43 GPa. Concurrent millimeter-scale indentation tests at three distinct loads (75, 100, and 125 N) produced an elastic modulus of 20.81, 24.32, and 26.67 GPa, respectively. The 100 N indentation load demonstrated the closest agreement (24.32 GPa) with the uniaxial compression results (24.43 GPa), thus establishing this load as the optimal parameter for subsequent testing.
Following load calibration, the mechanical characterization of the fragmented shale samples with respect to the bedding plane orientation was performed. The elastic modulus was measured both perpendicular and parallel to the bedding planes (Figure 6) using a multi-point averaging approach. At each depth, five spatially distributed indentation measurements were acquired, with the mean value representing the characteristic modulus. A total of 800 indentation tests were conducted across a 16 m test section at 2 cm precision.
To investigate the microstructure–property relationships, representative samples exhibiting extreme modulus values were selected for the XRD mineralogical analysis. This supplementary characterization aimed to correlate the mechanical behavior with the microstructural variations in the shale specimens.

4. Experimental Results

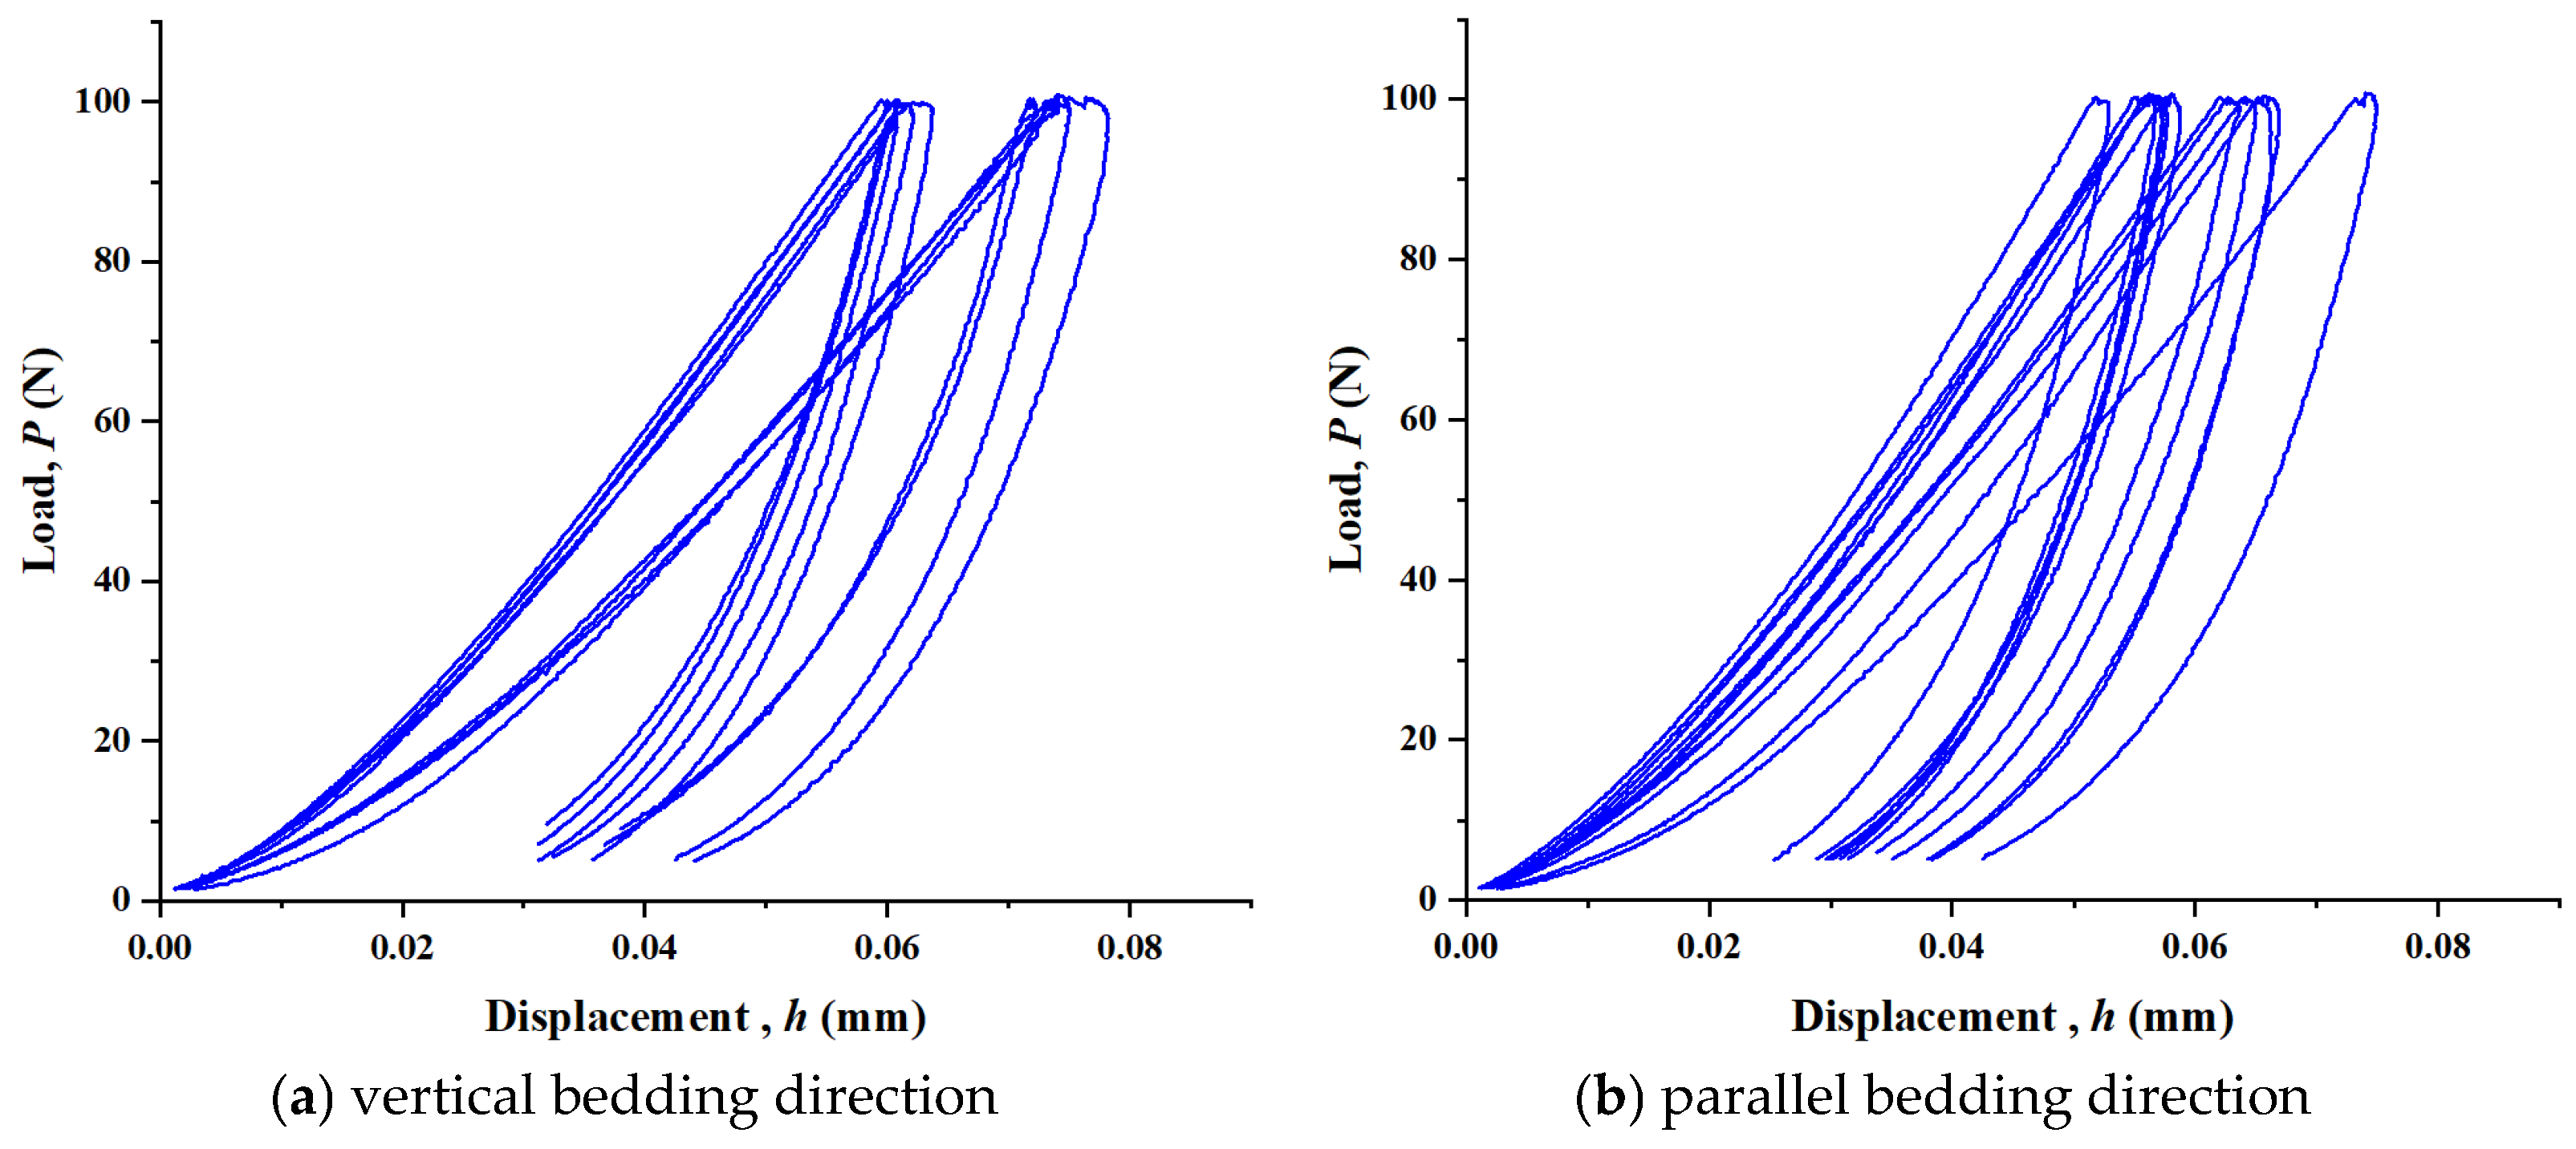
The indentation displacement–load curve for the shale perpendicular to bedding (Figure 7) demonstrates typical indentation behavior comprising three distinct phases: loading, holding, and unloading. The loading phase exhibits nonlinear load (P)–displacement (h) behavior, initially displaying a lower slope corresponding to the contact stiffness, followed by a steeper slope dominated by bulk elastic deformation. During the holding phase at peak load (Pmax), continued displacement accumulation occurs at a reduced rate, indicative of time-dependent creep deformation. The unloading phase shows partial displacement recovery, with residual displacement exceeding the initial position. Following data acquisition, the unloading segment was analyzed through a nonlinear regression using the functional form specified in Equation (1) (Section 3.1). The contact stiffness (S) was derived from the first derivative of the fitted function evaluated at the maximum indentation depth (hmax), enabling the subsequent calculation of the shale’s elastic modulus. This analytical approach provided a quantitative characterization of the material’s mechanical properties while accounting for the instrumented indentation artifacts.
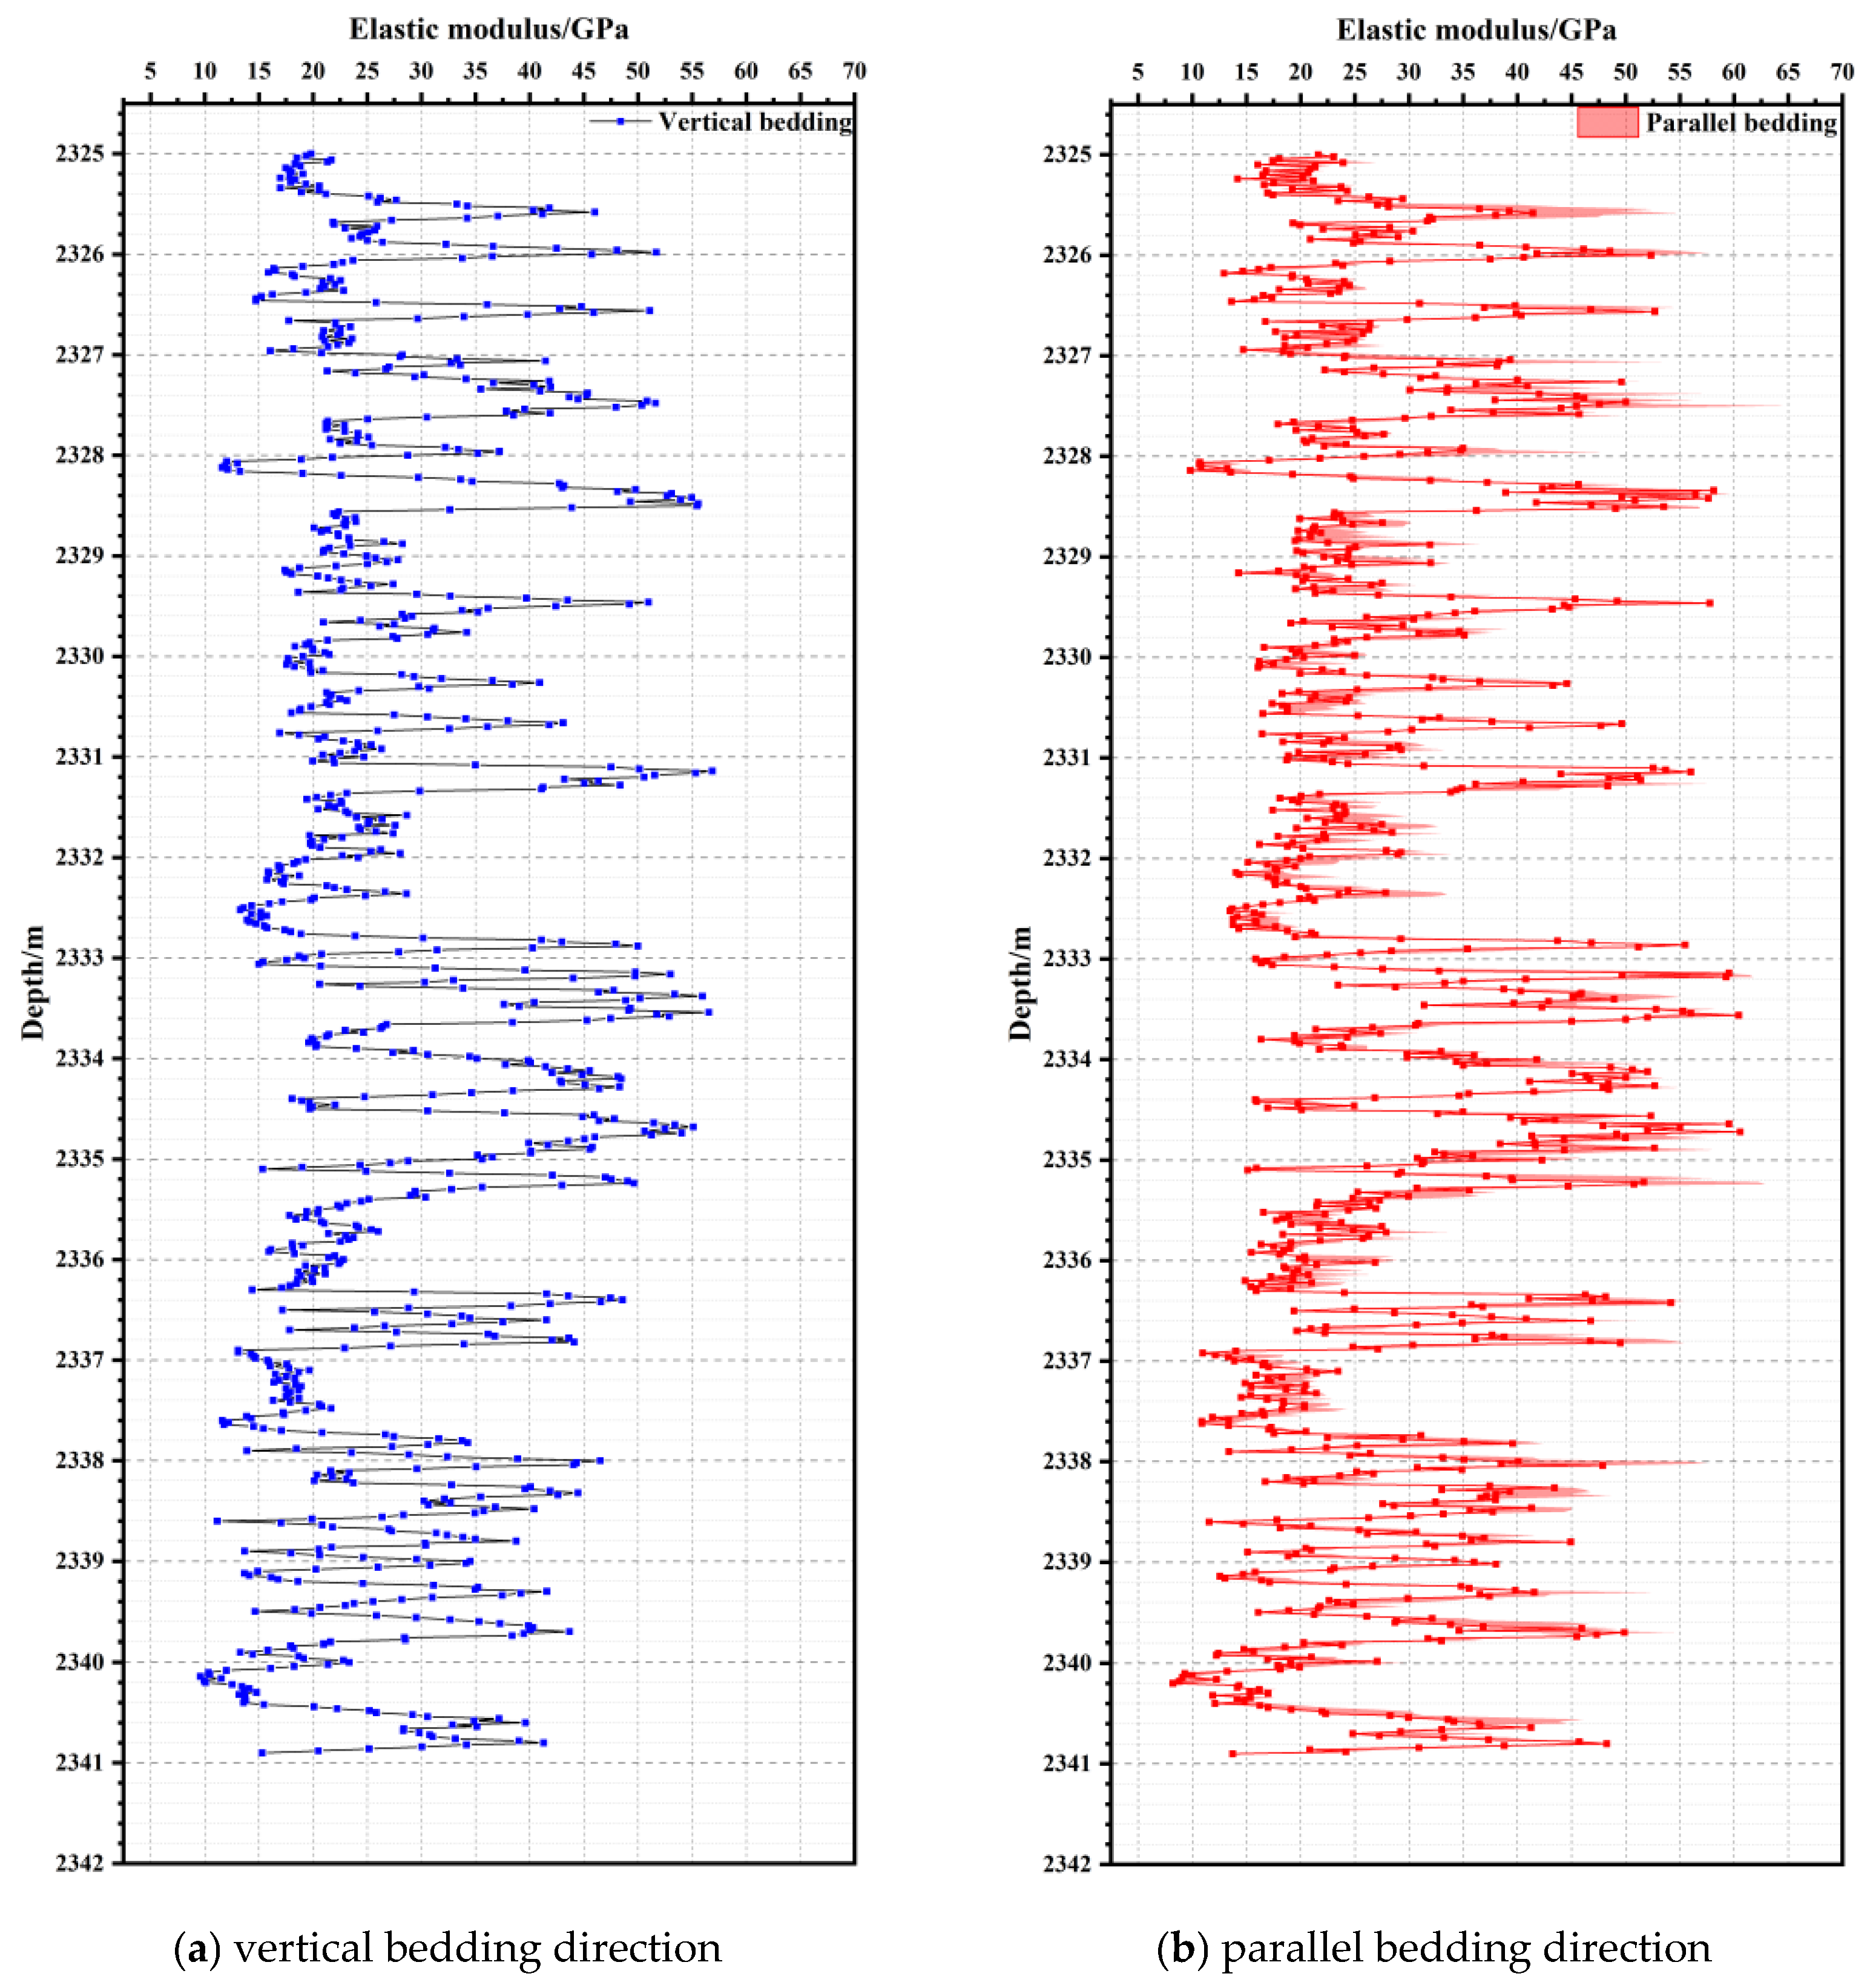
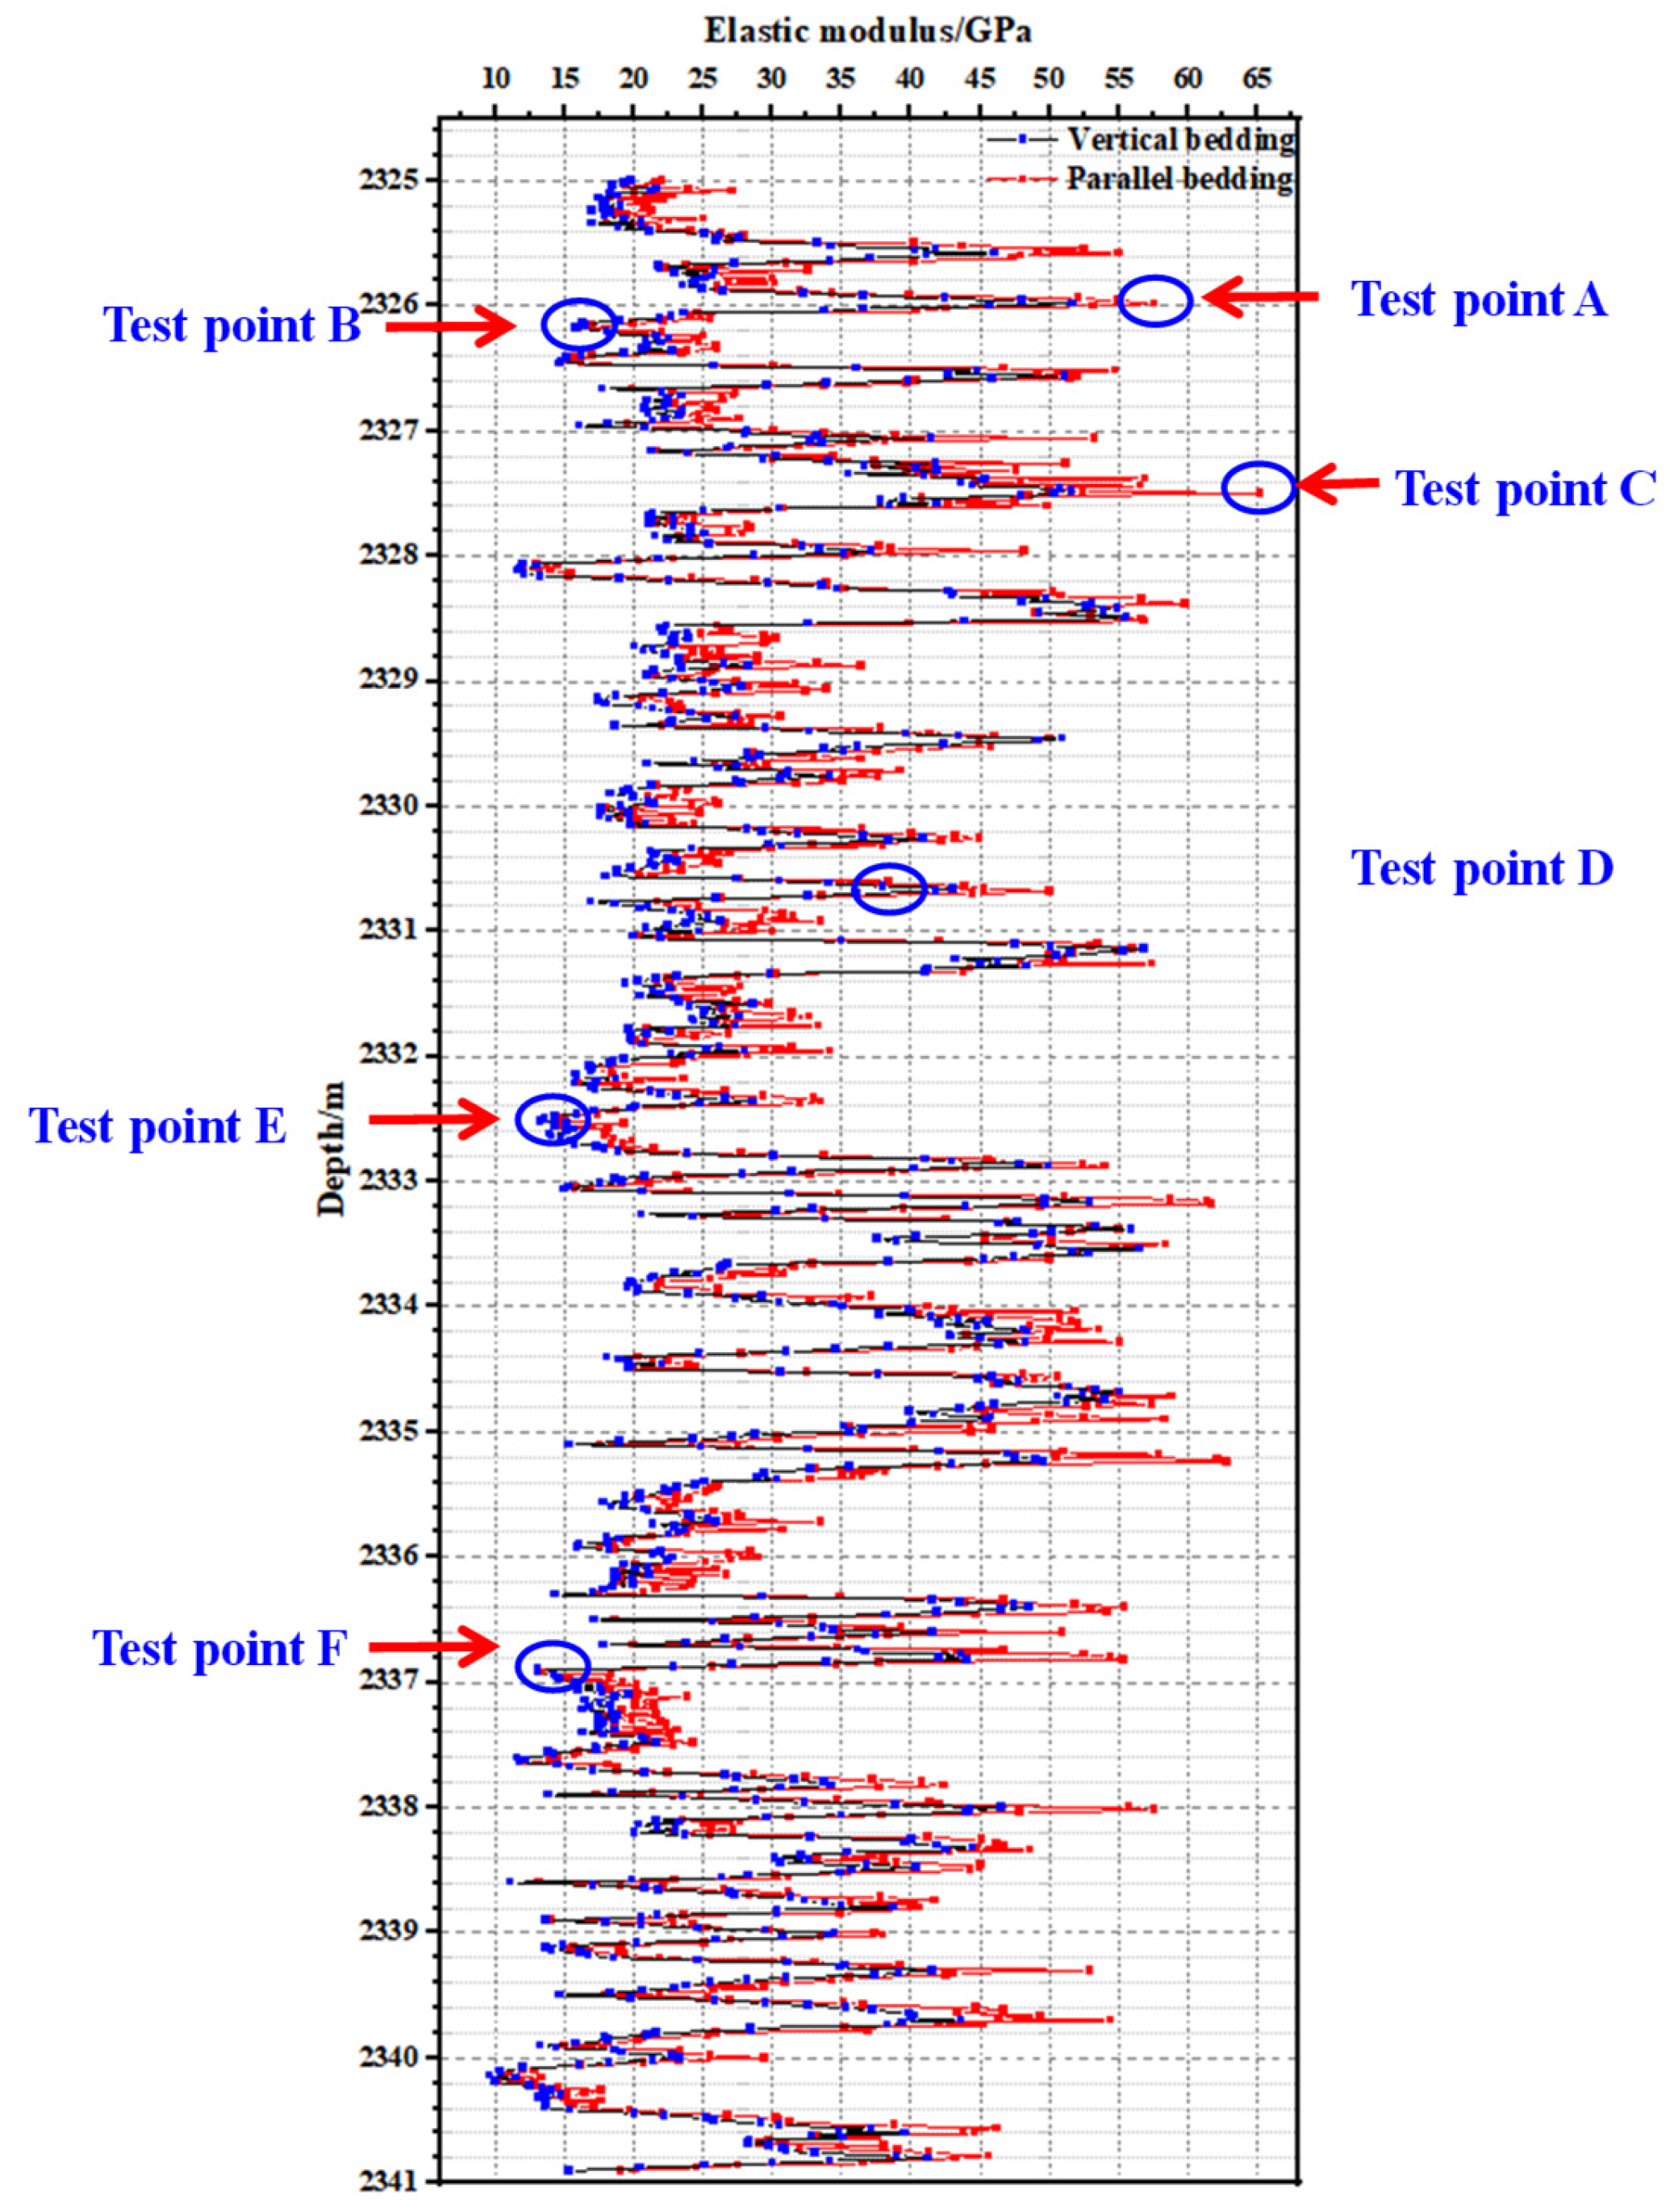
The indentation curves in Figure 7a demonstrate pronounced morphological variations across the horizontal measurement points at identical depths under perpendicular bedding conditions, reflecting substantial anisotropy in the mechanical parameters within the same depth interval. Furthermore, depth-dependent mechanical property variations are evident in the shale reservoir, as shown by distinct differences in the indentation curves. Figure 8a presents the depth profile of elastic modulus for the shale samples oriented perpendicular to bedding. An analysis of the Qingshankou Formation shale reservoir (2325–2341 m depth interval) reveals extreme elastic modulus values ranging from 9.60 GPa to 56.84 GPa, with a mean of 24.09 GPa and a remarkable 47.24 GPa variation range. This mechanical parameter variability significantly exceeds that observed in homogeneous lithologies (e.g., granite’s typical 5–10 GPa range) [42], underscoring the anisotropic nature characteristic of layered sedimentary rocks like shale. Notably, while depth-depended variations in the elastic modulus are apparent, they exhibit only a weak linear dependence on the burial depth.
Figure 7b presents the displacement–load curve obtained from the indentation testing of shale specimens oriented parallel to the bedding planes, exhibiting characteristic indentation curve features comprising three distinct phases: loading, holding, and unloading. The data further demonstrate substantial morphological variation among the horizontal measurement points at equivalent depths under parallel bedding conditions. The depth-dependent mechanical property variations are quantified in Figure 8b, which displays the elastic modulus profile for the parallel-to-bedding shale samples. Within the studied interval (2325–2341 m depth) of the Qingshankou Formation shale reservoir, the elastic modulus values range dramatically, from 10.23 GPa to 65.08 GPa, with a mean value of 30.85 GPa and a total variation span of 54.85 GPa. These observations confirm that the mechanical parameters exhibit pronounced spatial variability even within parallel bedding orientations, further substantiating the significant anisotropy inherent to shale reservoirs. Notably, the distribution data obtained from the millimeter-scale indentation testing follows a Weibull distribution.

5. Analysis

Section 4 summarizes the distribution patterns of shale mechanical parameters under different bedding orientations. The millimeter-scale indentation test results demonstrate that shale exhibits significant variability in its mechanical properties across different horizontal measurement points at the same depth, different bedding orientations, and different depths. To investigate the underlying causes of these differences, this section provides a detailed analysis of the three key aspects mentioned above.

5.1. Different Measurement Points at the Same Depth

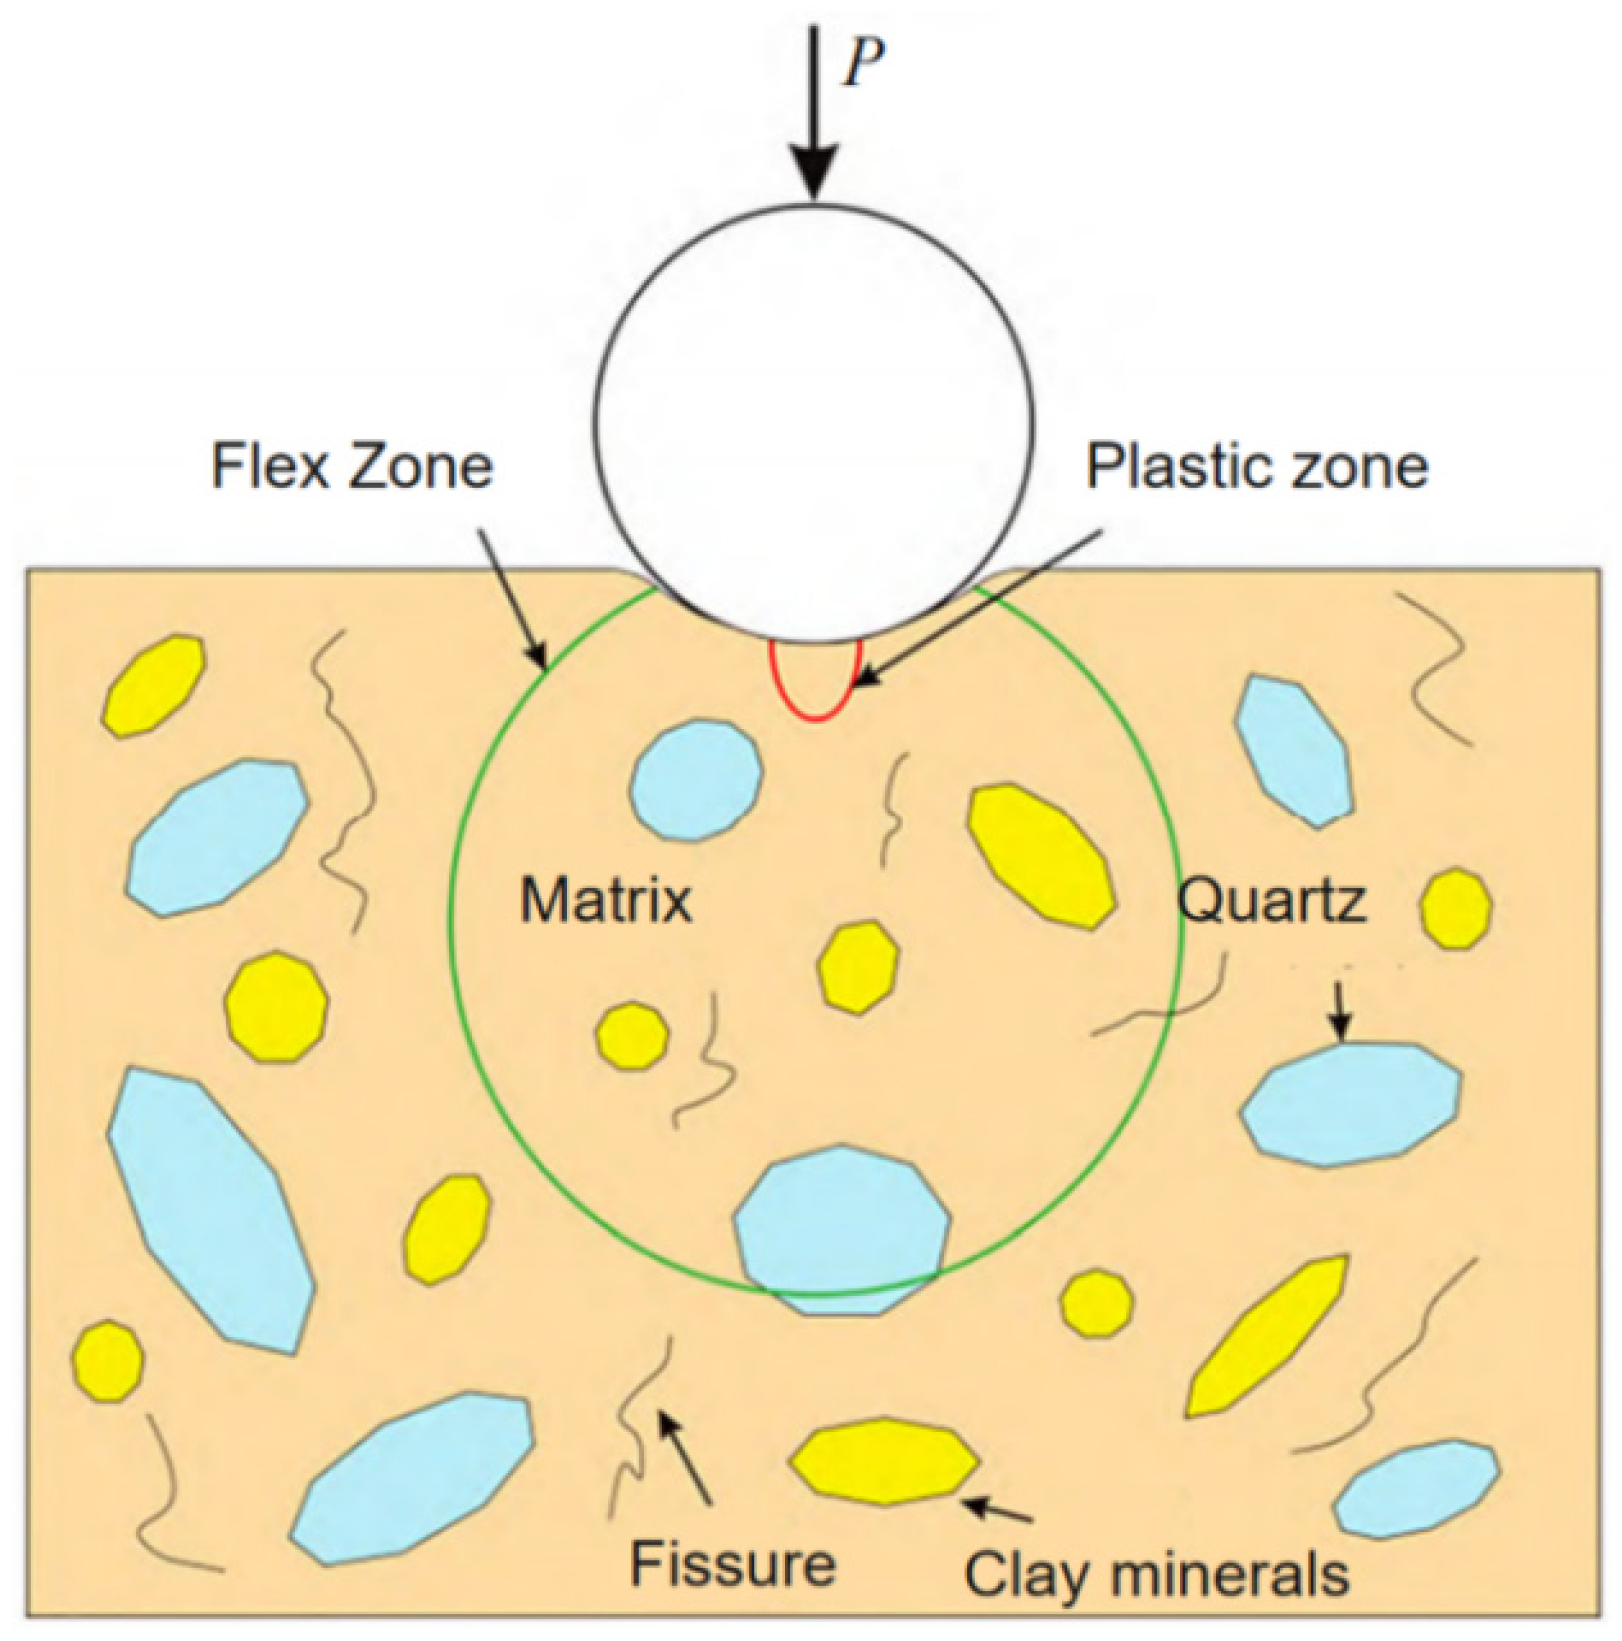
The observed differences in the indentation curves at different measurement points within the same depth interval are attributed to horizontal anisotropy of shale. As illustrated in Figure 9, the mineral composition of shale on the horizontal plane exhibits a microscopically heterogeneous distribution [43]. This non-uniform distribution of minerals (e.g., quartz, clay, and organic matter) leads to localized variations in the hardness and stiffness, resulting in distinct indentation responses at different measurement points despite being at the same depth.

5.2. Differences in Mechanical Parameters Under Different Bedding Directions

A comparative analysis of mechanical parameters under parallel and perpendicular bedding orientations reveals that the elastic modulus measured parallel to bedding (10.23–65.08 GPa; the average value is 30.85 Gpa) is 28% higher than that measured perpendicular to bedding (9.60–47.24 Gpa; the average value is 24.09 Gpa). This discrepancy is primarily due to shale bedding anisotropy. When a load is applied perpendicular to bedding, the weaker mechanical properties of the interbedded layers (e.g., clay-rich laminae) facilitate greater deformation, leading to a lower measured stiffness. Conversely, parallel loading follows the stronger, more continuous mineral framework along the bedding planes, resulting in higher modulus values. These findings align with previous studies on shale anisotropy, confirming that the bedding plane orientation significantly influences the mechanical behavior [44].

5.3. Differences in Mechanical Parameters at Different Depths

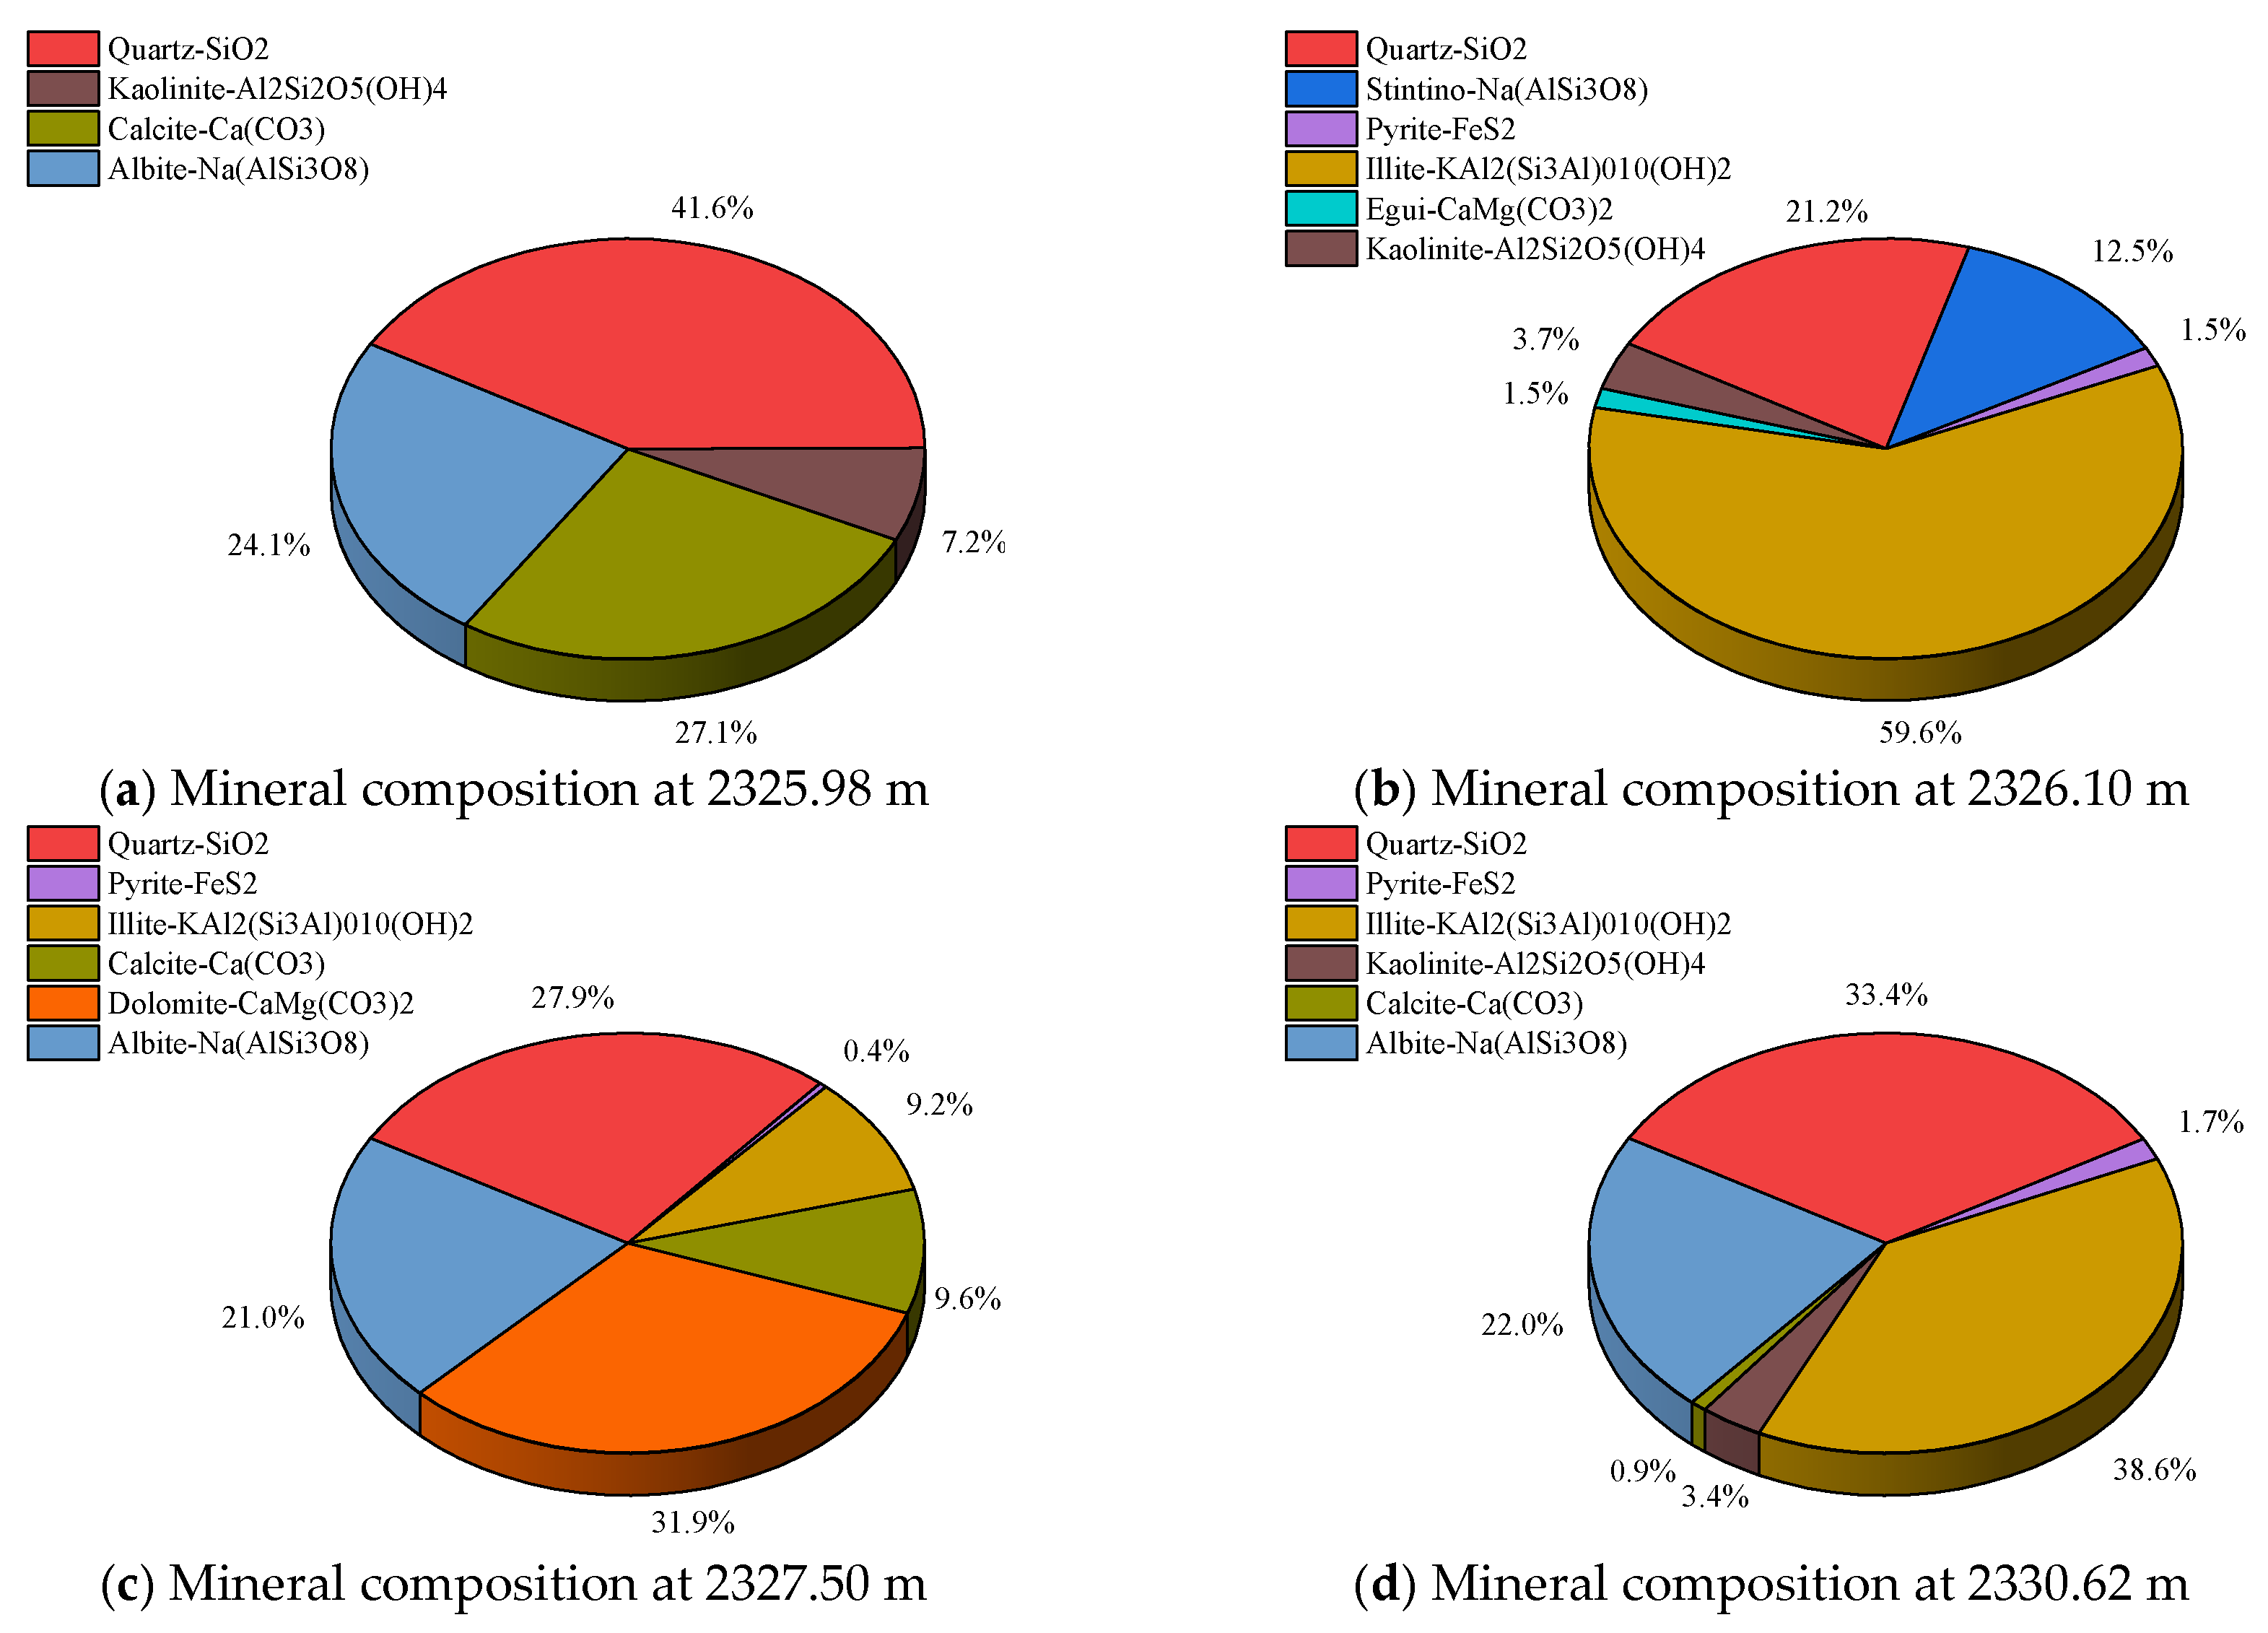
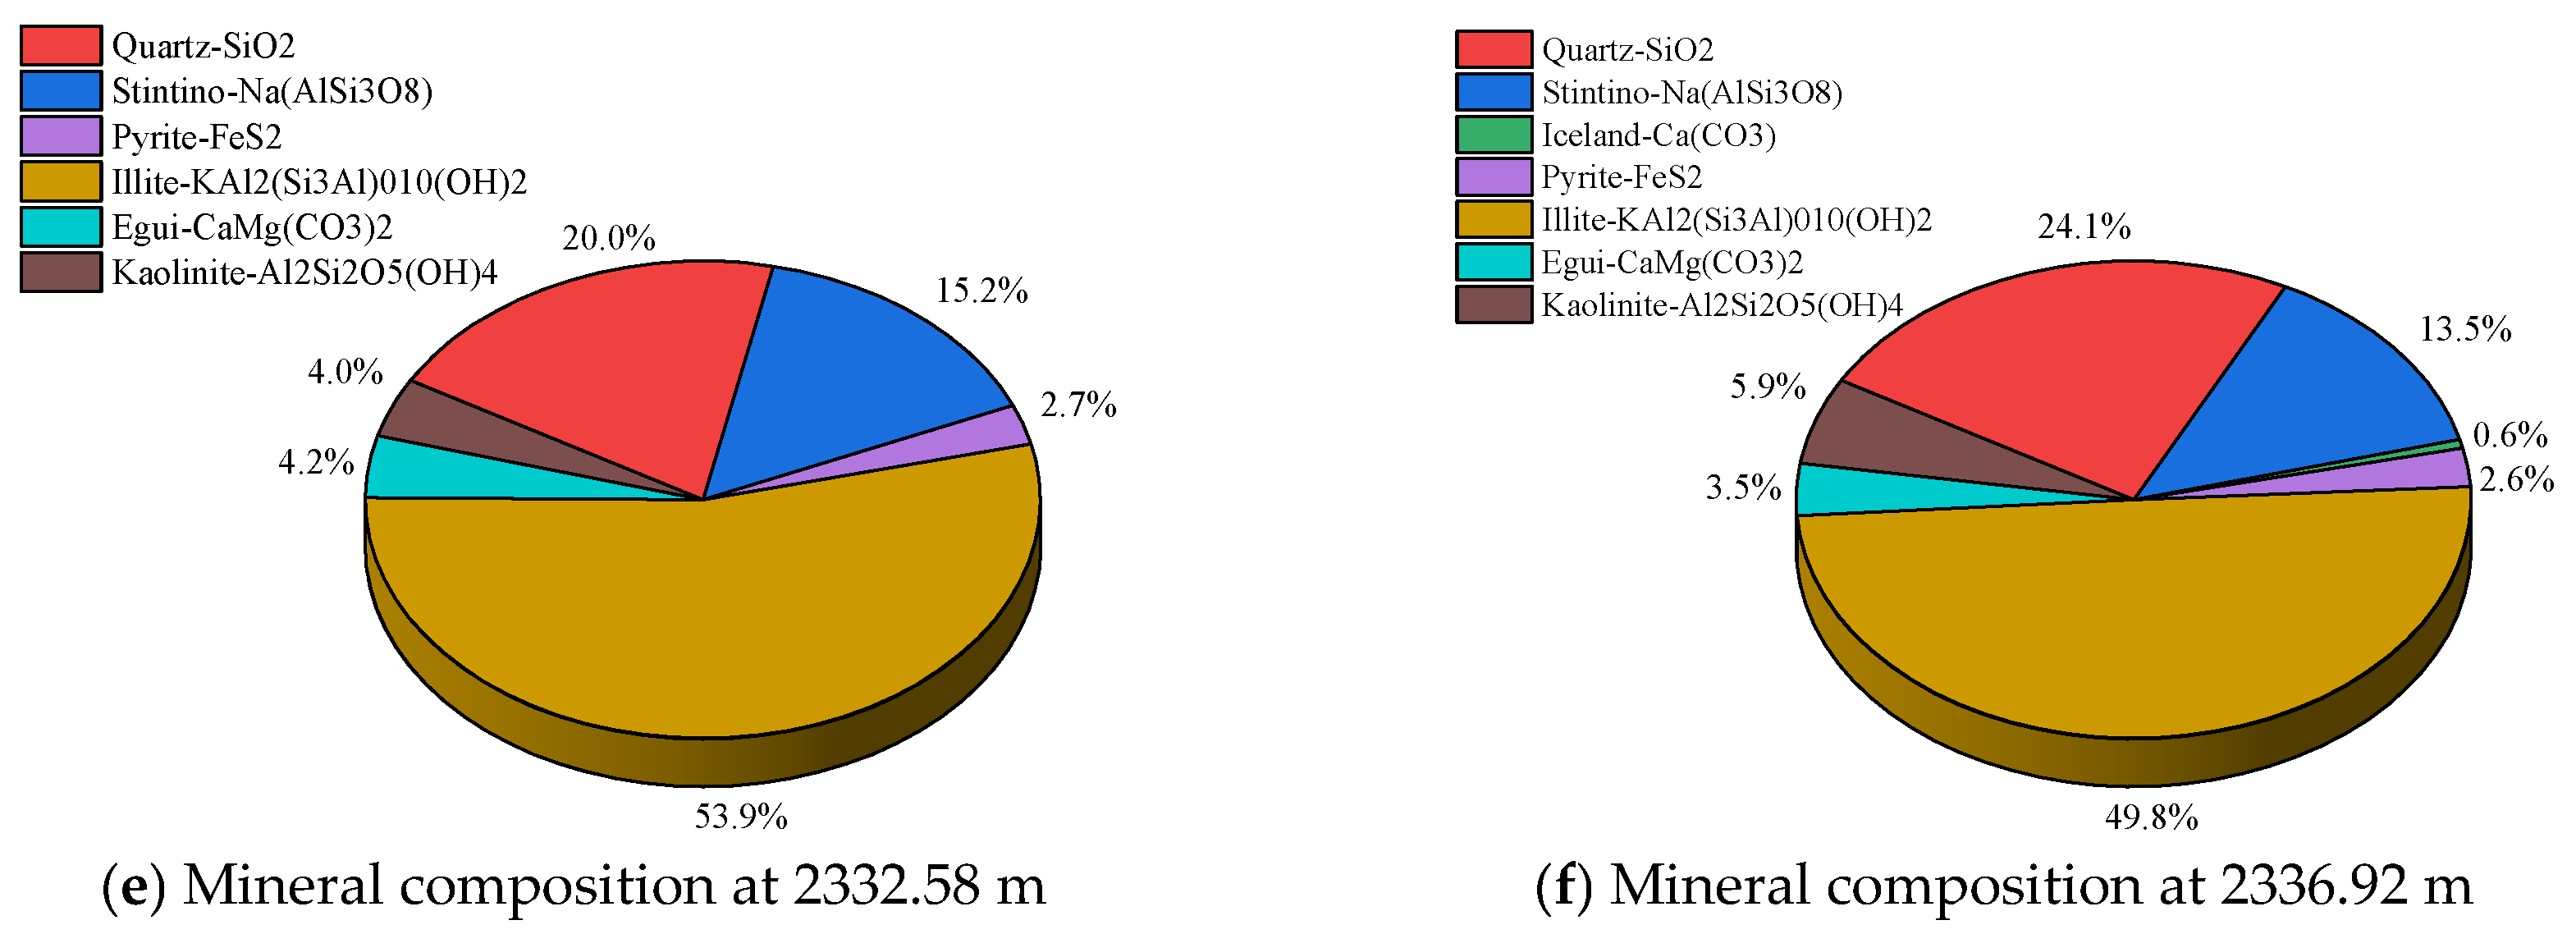
As demonstrated in Figure 10, the elastic modulus of shale exhibits significant depth-dependent anisotropy. To investigate the mechanistic basis of these variations, an X-ray diffraction (XRD) mineralogical analysis was performed. Six representative samples were selected based on the nanoindentation test results: three from high-modulus intervals (2325.98 m, 2327.50 m, 2330.62 m) and three from low-modulus intervals (2326.10 m, 2332.58 m, 2336.92 m). The XRD analysis (Figure 11) reveals a mineral assemblage dominated by quartz, albite, dolomite, calcite, illite, pyrite, and kaolinite. Previous studies [45,46,47,48,49] have established that brittle minerals (quartz, feldspar, dolomite, and pyrite) enhance the elastic modulus and brittleness, while clay minerals (illite, kaolinite) reduce stiffness and promote ductile behavior.
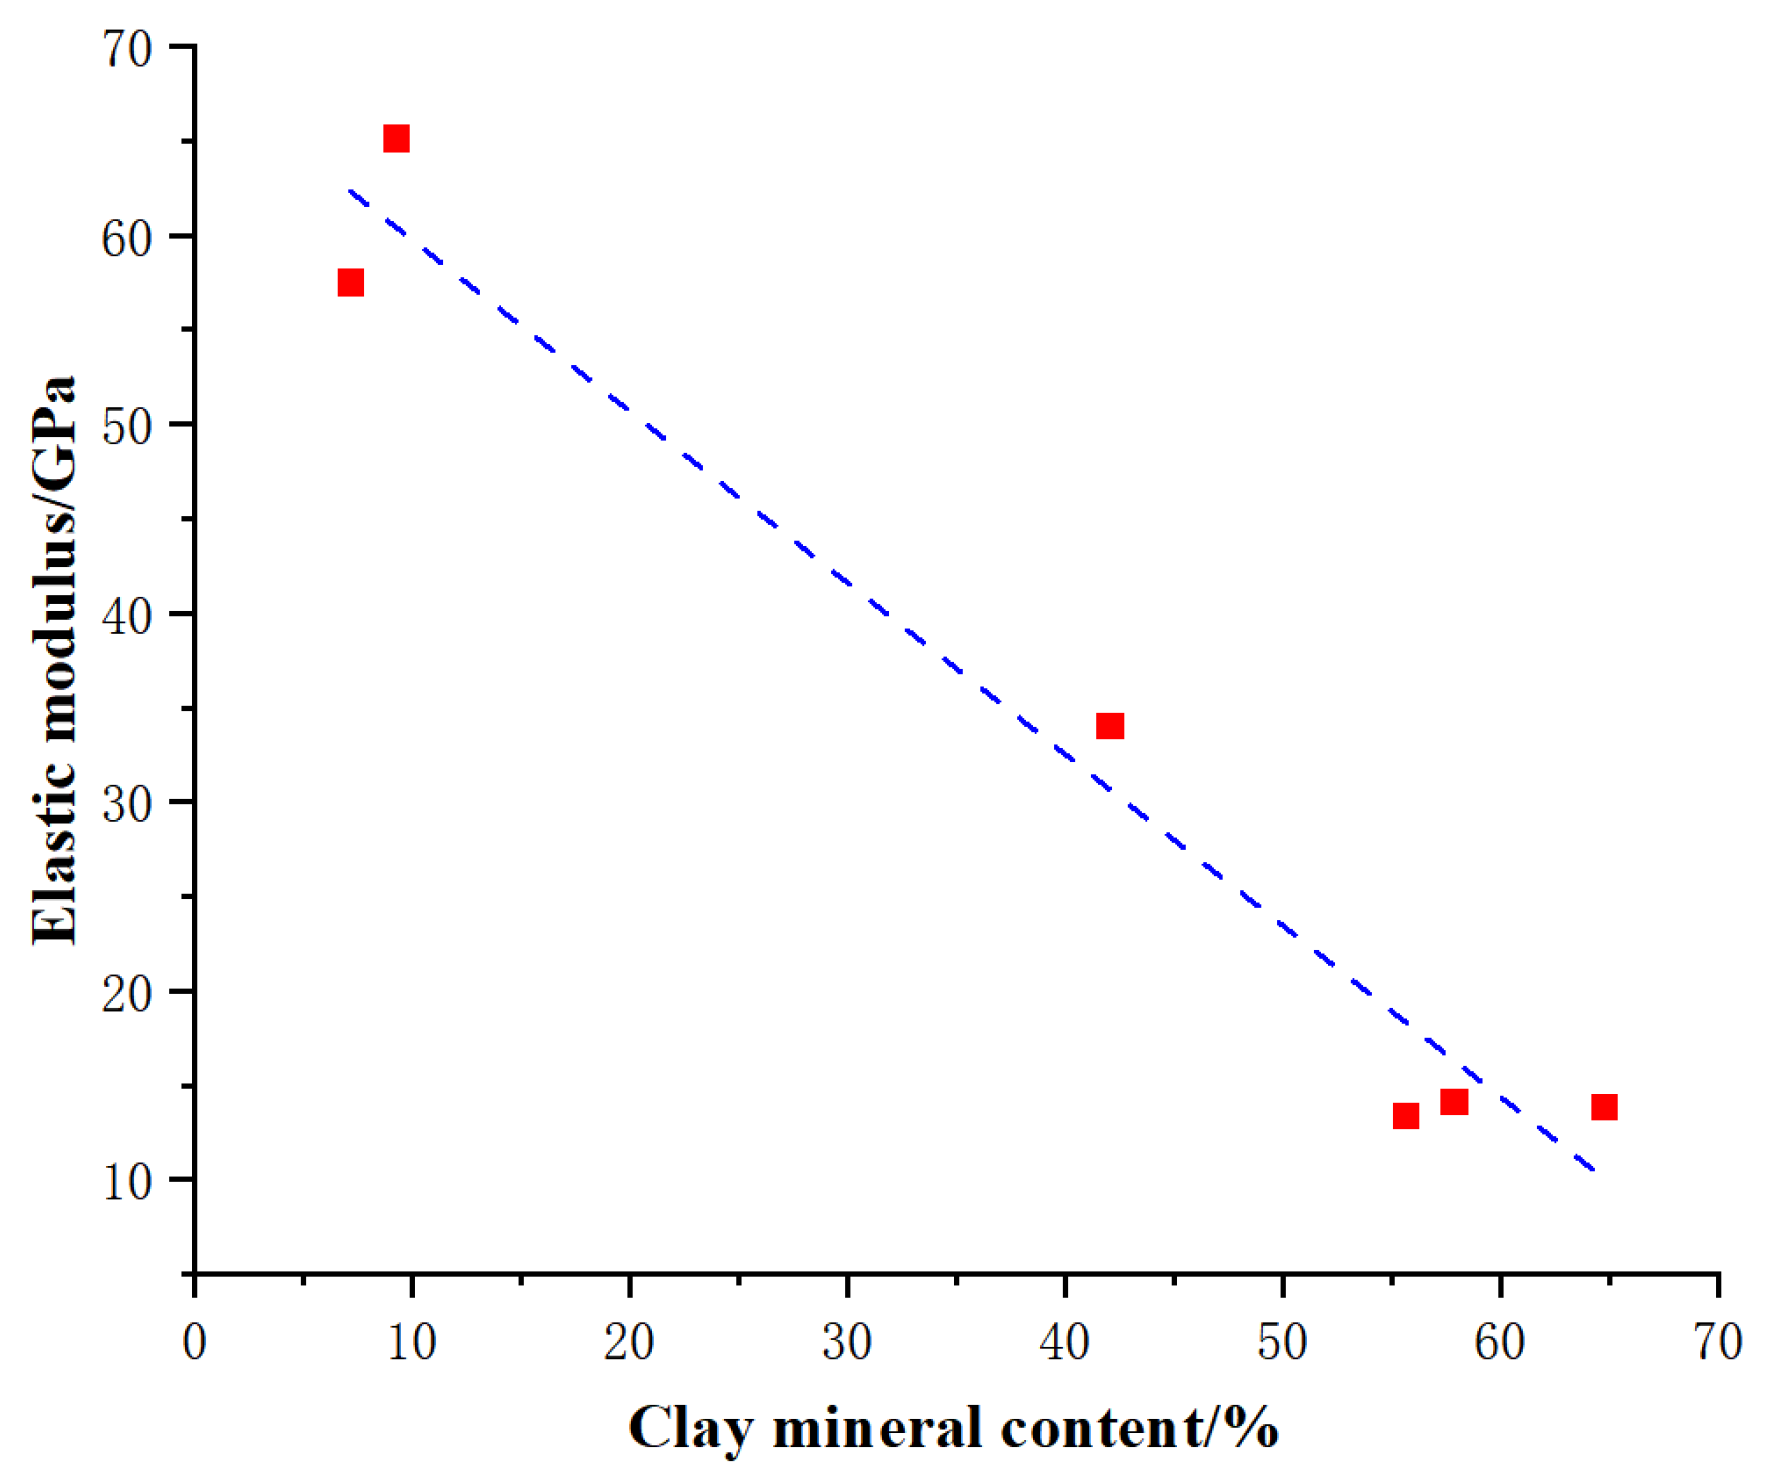
The quantitative mineralogical analysis (Figure 11 and Figure 12, Table 1) demonstrates a strong positive correlation between the brittle mineral content and elastic modulus. The 2327.50 m sample, exhibiting the maximum modulus (65.08 Gpa), contains 81.2% brittle minerals with only 7.2% clay content (Figure 11c). In contrast, the 2330.62 m sample shows reduced stiffness (34.01 Gpa), corresponding to 57% brittle and 42.1% clay mineral fractions (Figure 11d). These findings establish that the observed depth-dependent mechanical variations primarily result from mineralogical anisotropy. The elastic modulus exhibits direct proportionality to the brittle mineral content and inverse proportionality to phyllosilicate abundance, confirming mineral composition as the dominant control on mechanical stratigraphy in shale reservoirs. Under actual reservoir conditions, the presence of pore fluids and pore pressure will diminish the effective stiffness of rocks. This effect requires future correction in accordance with the effective stress theory.

6. Hydraulic Fracturing Simulation

To investigate the influence of anisotropic distribution of mechanical parameters in shale reservoirs on hydraulic fracture propagation, this study conducts numerical simulations of hydraulic fracture growth in laminated shale based on realistic vertical mechanical parameter distributions. First, a refined geomechanical model with vertical heterogeneity is constructed using the shale elastic modulus data obtained from the millimeter-scale indentation tests. Subsequently, numerical simulations of hydraulic fracturing are performed using COMSOL Multiphysics 6.0 numerical simulation software and compared with the results from homogeneous geomechanical models. Through this research, the mechanisms governing how anisotropic distributions of mechanical parameters affect hydraulic fracture propagation are systematically revealed.

6.1. Governing Equations

To investigate how this mechanical anisotropy affects hydraulic fracture propagation, the subsequent simulations compare fracture development under two conditions: (1) homogenized elastic modulus; (2) realistic depth-dependent elastic modulus distribution (anisotropic model). The study analyzes the differences in fracture propagation behavior between these models, providing insights into the influence of mechanical anisotropy on hydraulic fracture propagation in shale reservoirs. The model is primarily based on the following assumptions [50,51,52]: (1) The shale reservoir is treated as a porous medium, where fluid flow obeys the control equations for fluid flow in reservoirs. (2) Hydro-mechanical coupling is characterized by variations in porosity and permeability. (3) Fracture propagation is defined by rock damage evolution.
Therefore, a multi-field coupling model for hydraulic fracture propagation is established. The relevant theoretical models have been published [50,51,52], demonstrating both the validity of the model and its appropriateness for characterizing hydraulic fracture propagation in laminated shale formations.
(1) Control equations for fluid flow in reservoirs
The governing equation for fluid flow through a porous rock formation is [53]
S p t + u = α ε v t + Q f
where S represents the storage coefficient of the rock, u denotes the velocity of water, and Q f stands for the source term.
(2) Fluid–solid coupling control equations
Modeling shale as a porous continuum medium, the stress equilibrium equation under hydro-mechanical coupling conditions can be derived from Biot’s poroelasticity theory [54]:
σ i j = 2 G ε i j + 2 G v 1 2 v ε v α p δ i j
where σ i j represents the stress tensor, G denotes the shear modulus of the rock, and v is Poisson’s ratio. The strain tensor is designated as ε i j , α is the Biot coefficient, and ε v represents the volumetric strain of the rock matrix.
(3) Control equations for fracture initiation and propagation
Hydraulic fracturing is predominantly characterized by tensile fracture, although it may be accompanied by shear failure. The fracture initiation of the rock is evaluated based on the maximum tensile stress criterion and the Mohr–Coulomb criterion [55]. To ensure model integrity, criteria F 1 and F 2 are introduced for failure mode discrimination. Specifically, tensile failure occurs when F 1 0 , while shear failure occurs when F 2 0 , with shear failure being the predominant mode. The expressions for F 1 and   F 2 are as follows:
F 1 = σ 1 f t     F 2 = σ 3 f t + 1 + sin θ 1 sin θ σ 1
where f t represents the uniaxial tensile strength of the rock, f c represents the uniaxial compressive strength of the rock, φ represents the internal friction angle of the rock, and   σ 1 and σ 3 represent the first and third principal stresses, respectively.
Fracture propagation is characterized by the rock damage evolution [52,56], where the damage variable (D) of a material element is related to the strain as follows:
D = { 0 F 1 < 0 , F 2 < 0 1 | ε t 0 ε 3 | 2 F 1 = 0 , d F 1 > 0 1 | ε c 0 ε 1 | n F 2 = 0 , d F 2 > 0
where ε t 0 and ε c 0 represent the maximum tensile strain and maximum compressive strain in the elastic phase, respectively, and ε 1 and ε 3 represent the first and third principal strains, respectively.
(4) Influence of damage on physical field parameters
Following fracture initiation in the reservoir, a damage evolution zone develops, during which the rock damage induces progressive changes in the permeability, porosity, and elastic modulus. Within the framework of elastic damage mechanics, the elastic modulus of a material element degrades gradually with accumulating damage. According to the strain equivalence hypothesis, the effective elastic modulus of a damaged element is given by [57]
E = ( 1 D ) E 0
where E 0 and   E represent the elastic modulus of the rock unit before and after damage, respectively.
Under hydro-mechanical coupling, the stress borne by the rock affects its porosity, which can be expressed as [58]
ϕ = ( ϕ 0 ϕ r ) e x p ( α r σ ν ) + ϕ r
where ϕ 0 represents the initial porosity of the rock, ϕ r represents the residual porosity of the rock, and   σ v represents the average effective stress.
Additionally, the occurrence of rock damage affects its permeability, which can be expressed as [53]
κ = κ 0 ( ϕ / ϕ 0 ) exp ( α κ D )
where   k 0 represents the initial permeability of the rock, and   α k represents the coefficient of the influence of damage on the rock’s permeability.

6.2. Simulation Model

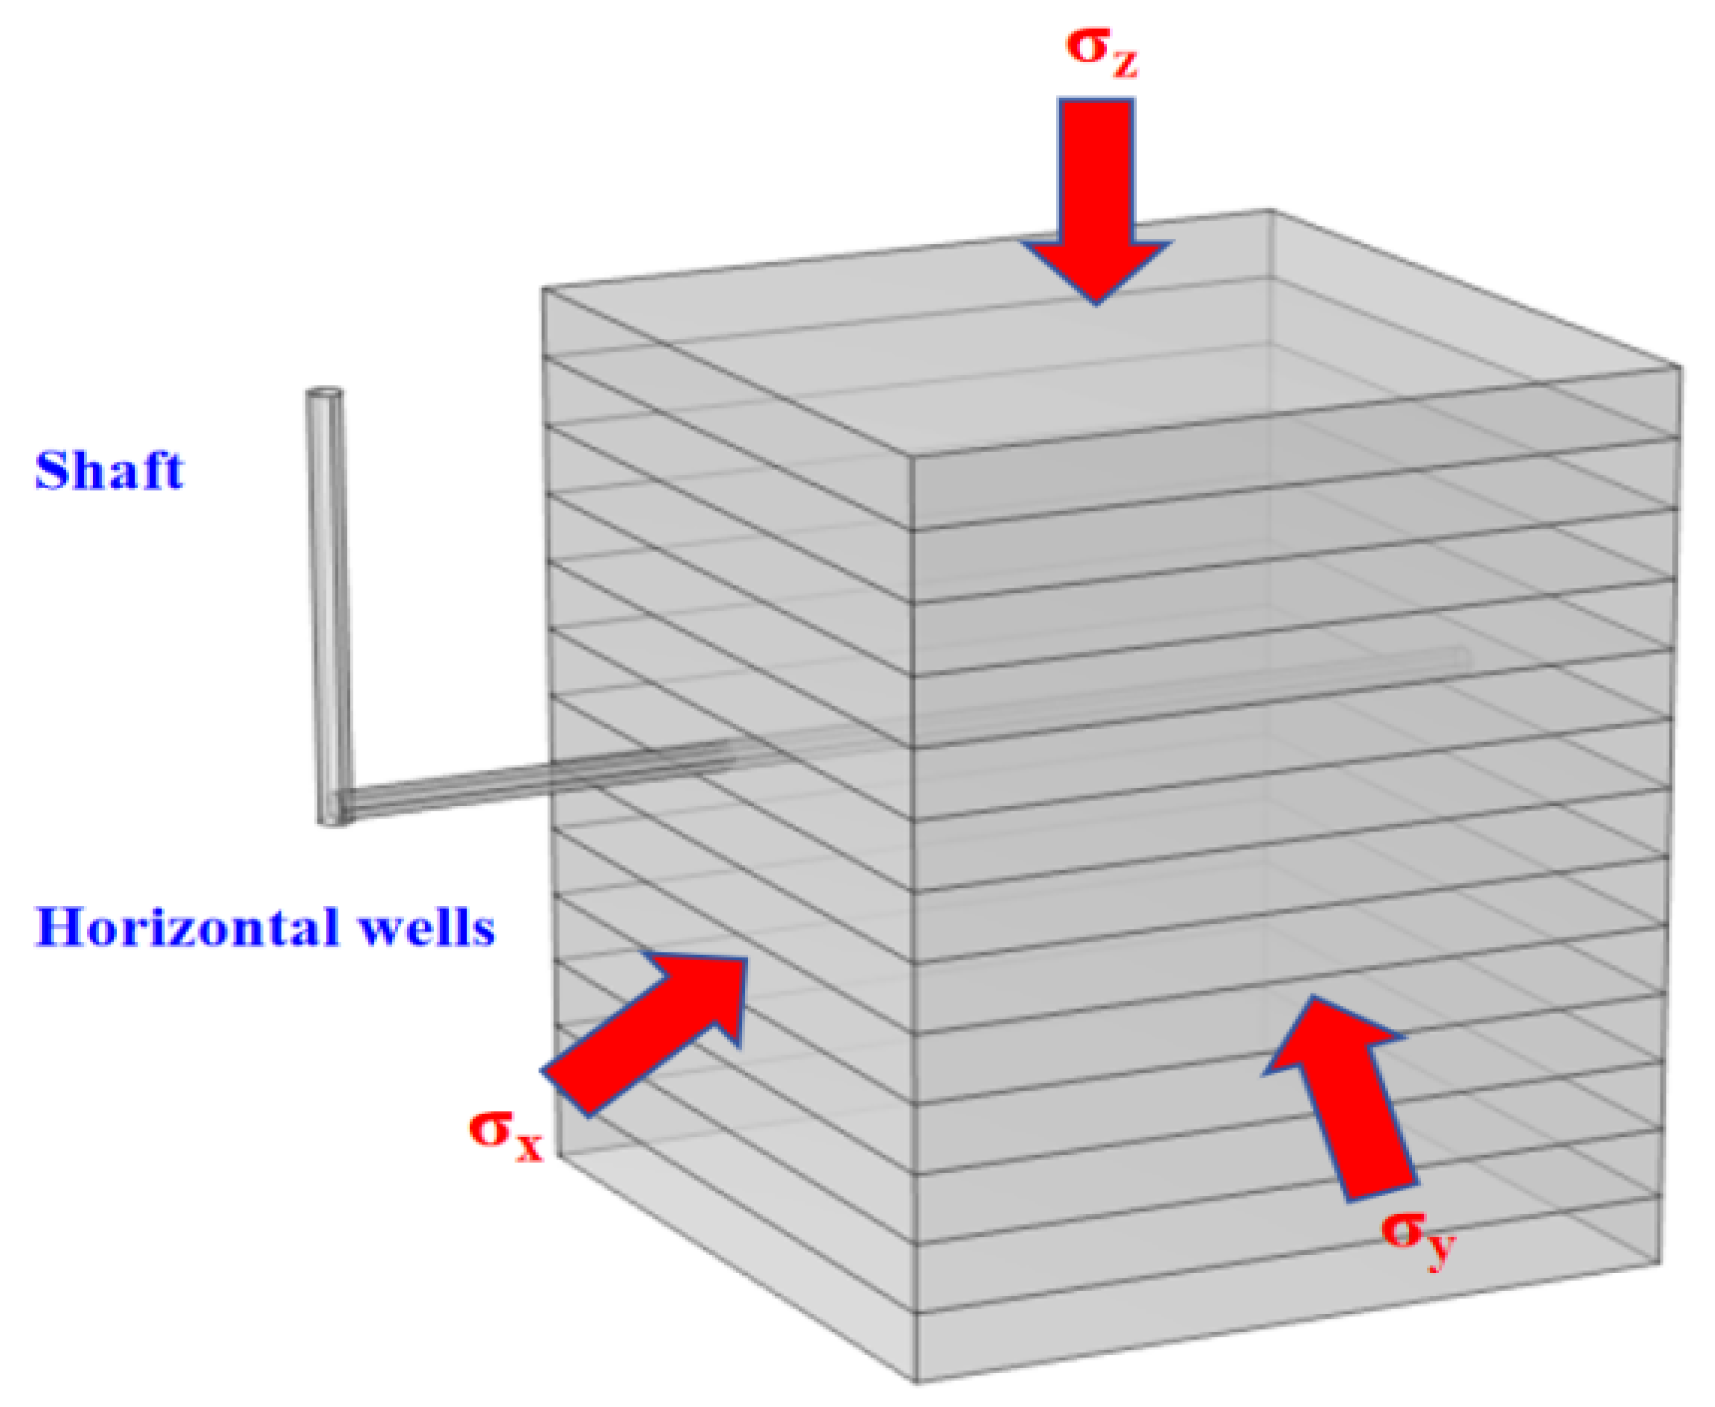
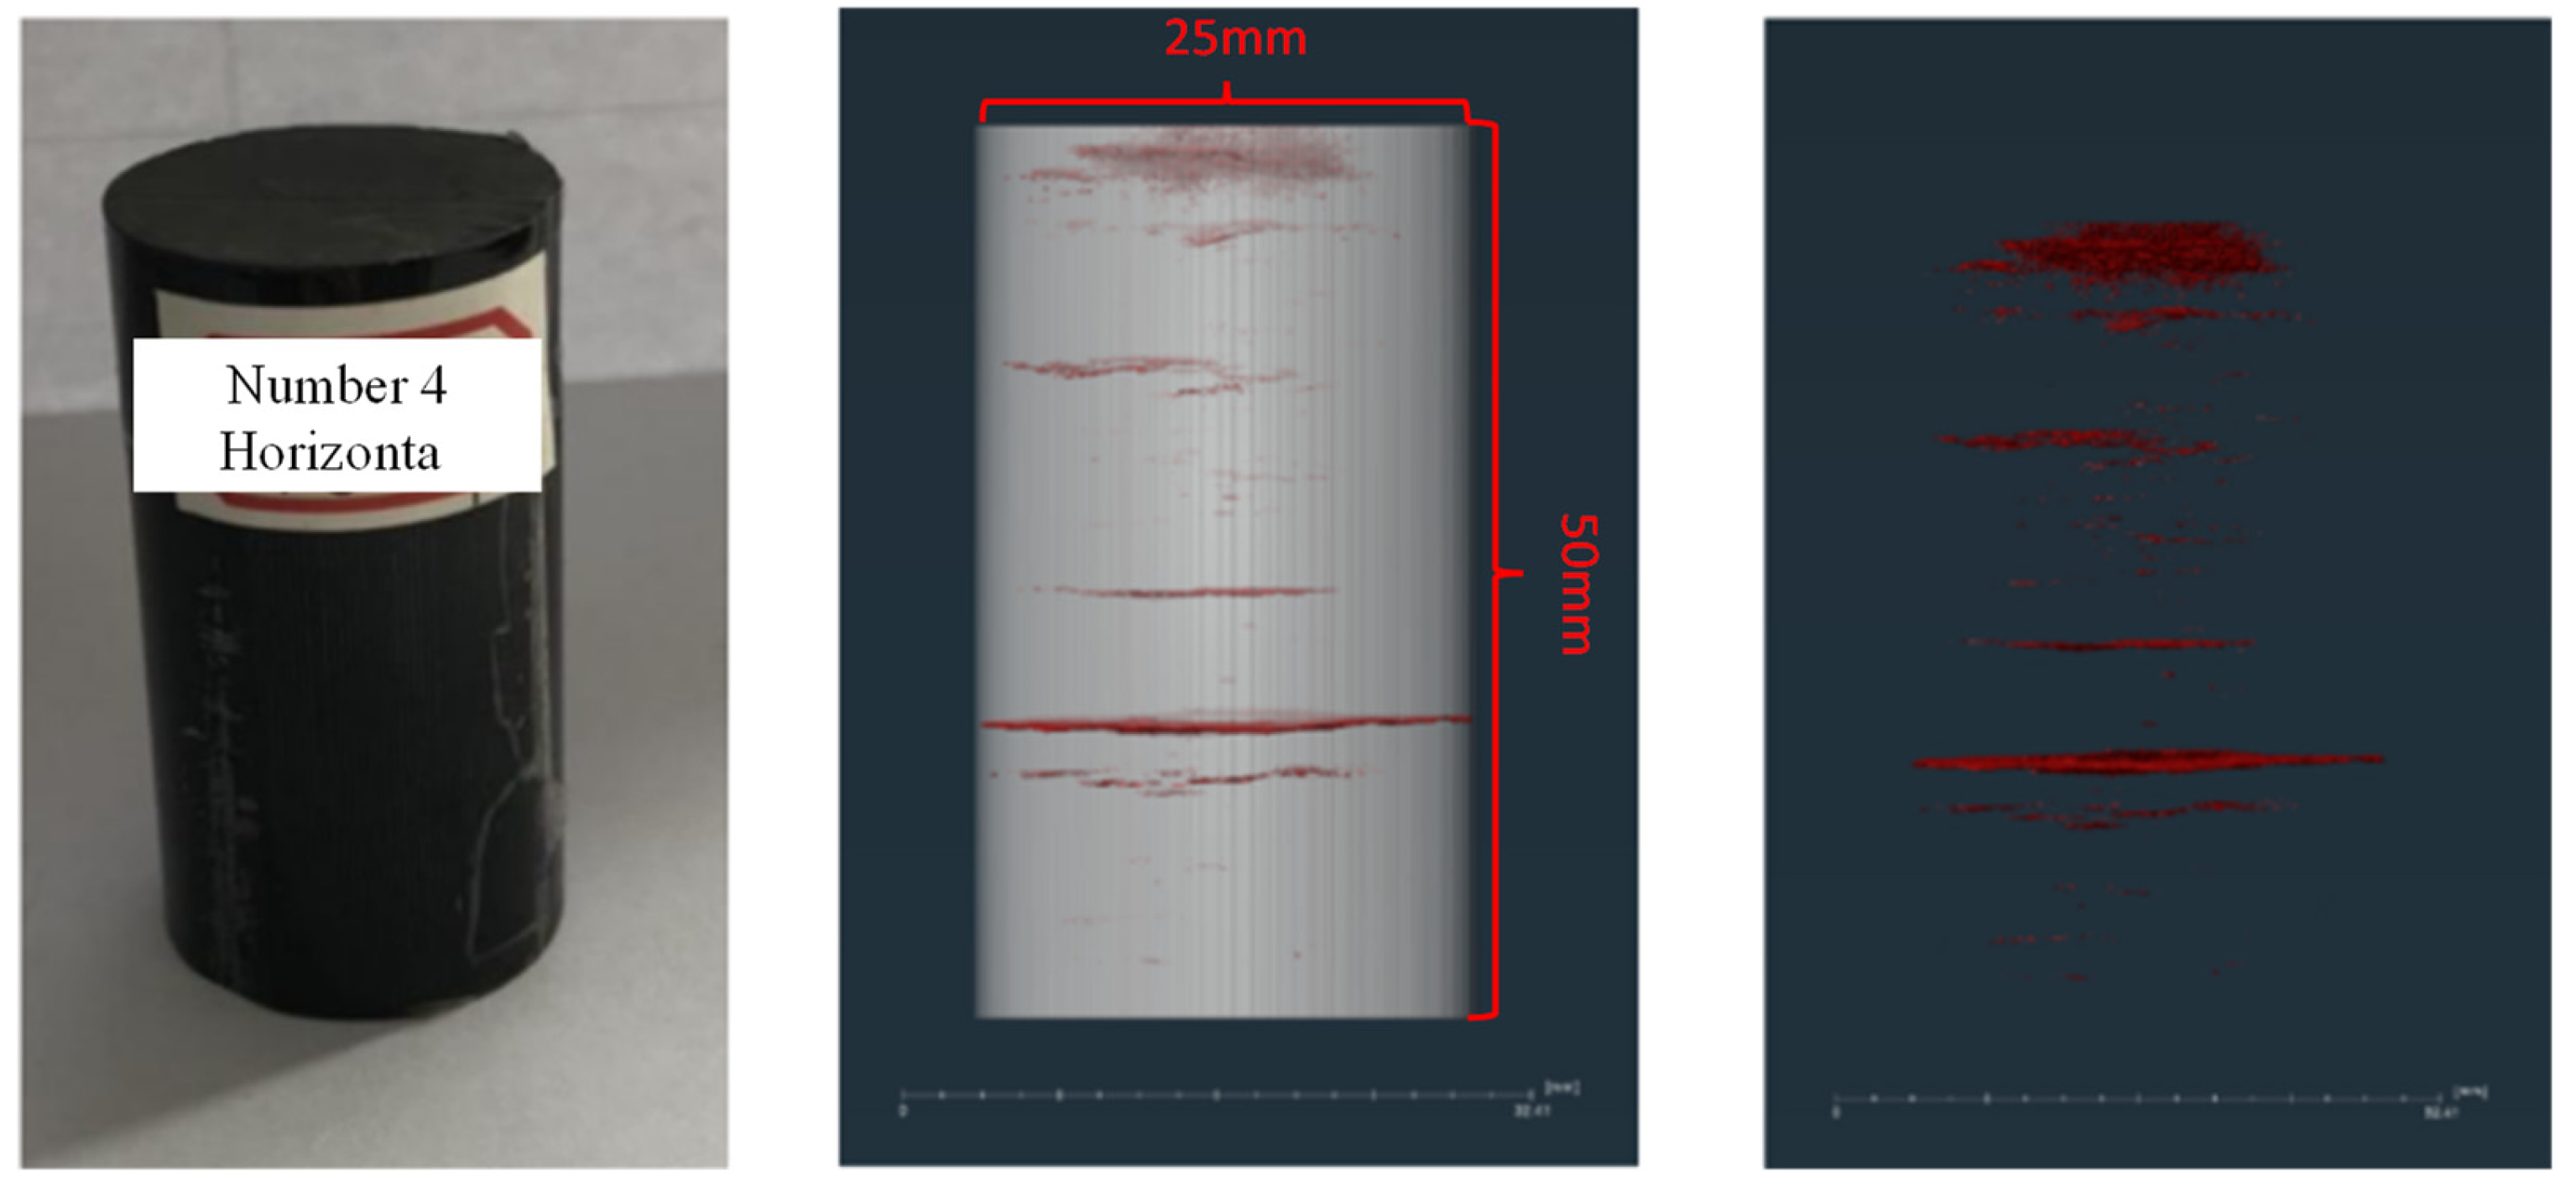
The study employed a finite element analysis to investigate the hydraulic fracture propagation mechanisms in horizontally drilled bedded shale reservoirs. A representative conceptual model is presented in Figure 13. To construct a geologically accurate shale reservoir model, field-acquired shale samples underwent computed tomography (CT) scanning to quantify the lamination geometry. The CT images (Figure 14) demonstrated that a cylindrical specimen (φ25 × 50 mm) contained an average of six distinct beddings. Extrapolating these measurements to the Qingshankou Formation (a depth of 2325–2341 m) yielded an average bedding density of 120 layers per meter, with a mean interlamination spacing of 8 mm and a characteristic lamination thickness of 0.5 mm.

6.2.1. Mesh Generation

For computational efficiency, a two-dimensional reservoir model was constructed utilizing the CT-derived lamination parameters. The model implemented a geometrically scaled reservoir representation with 12 laminations per meter, incorporating a 10× magnification factor (80 mm spacing, 5 mm thickness) to enhance fracture propagation visualization. The final 1000 × 1000 mm domain was parameterized with experimentally validated mechanical properties. This computational framework enabled efficient numerical simulation while maintaining high-resolution observation of hydraulic fracture trajectory development.
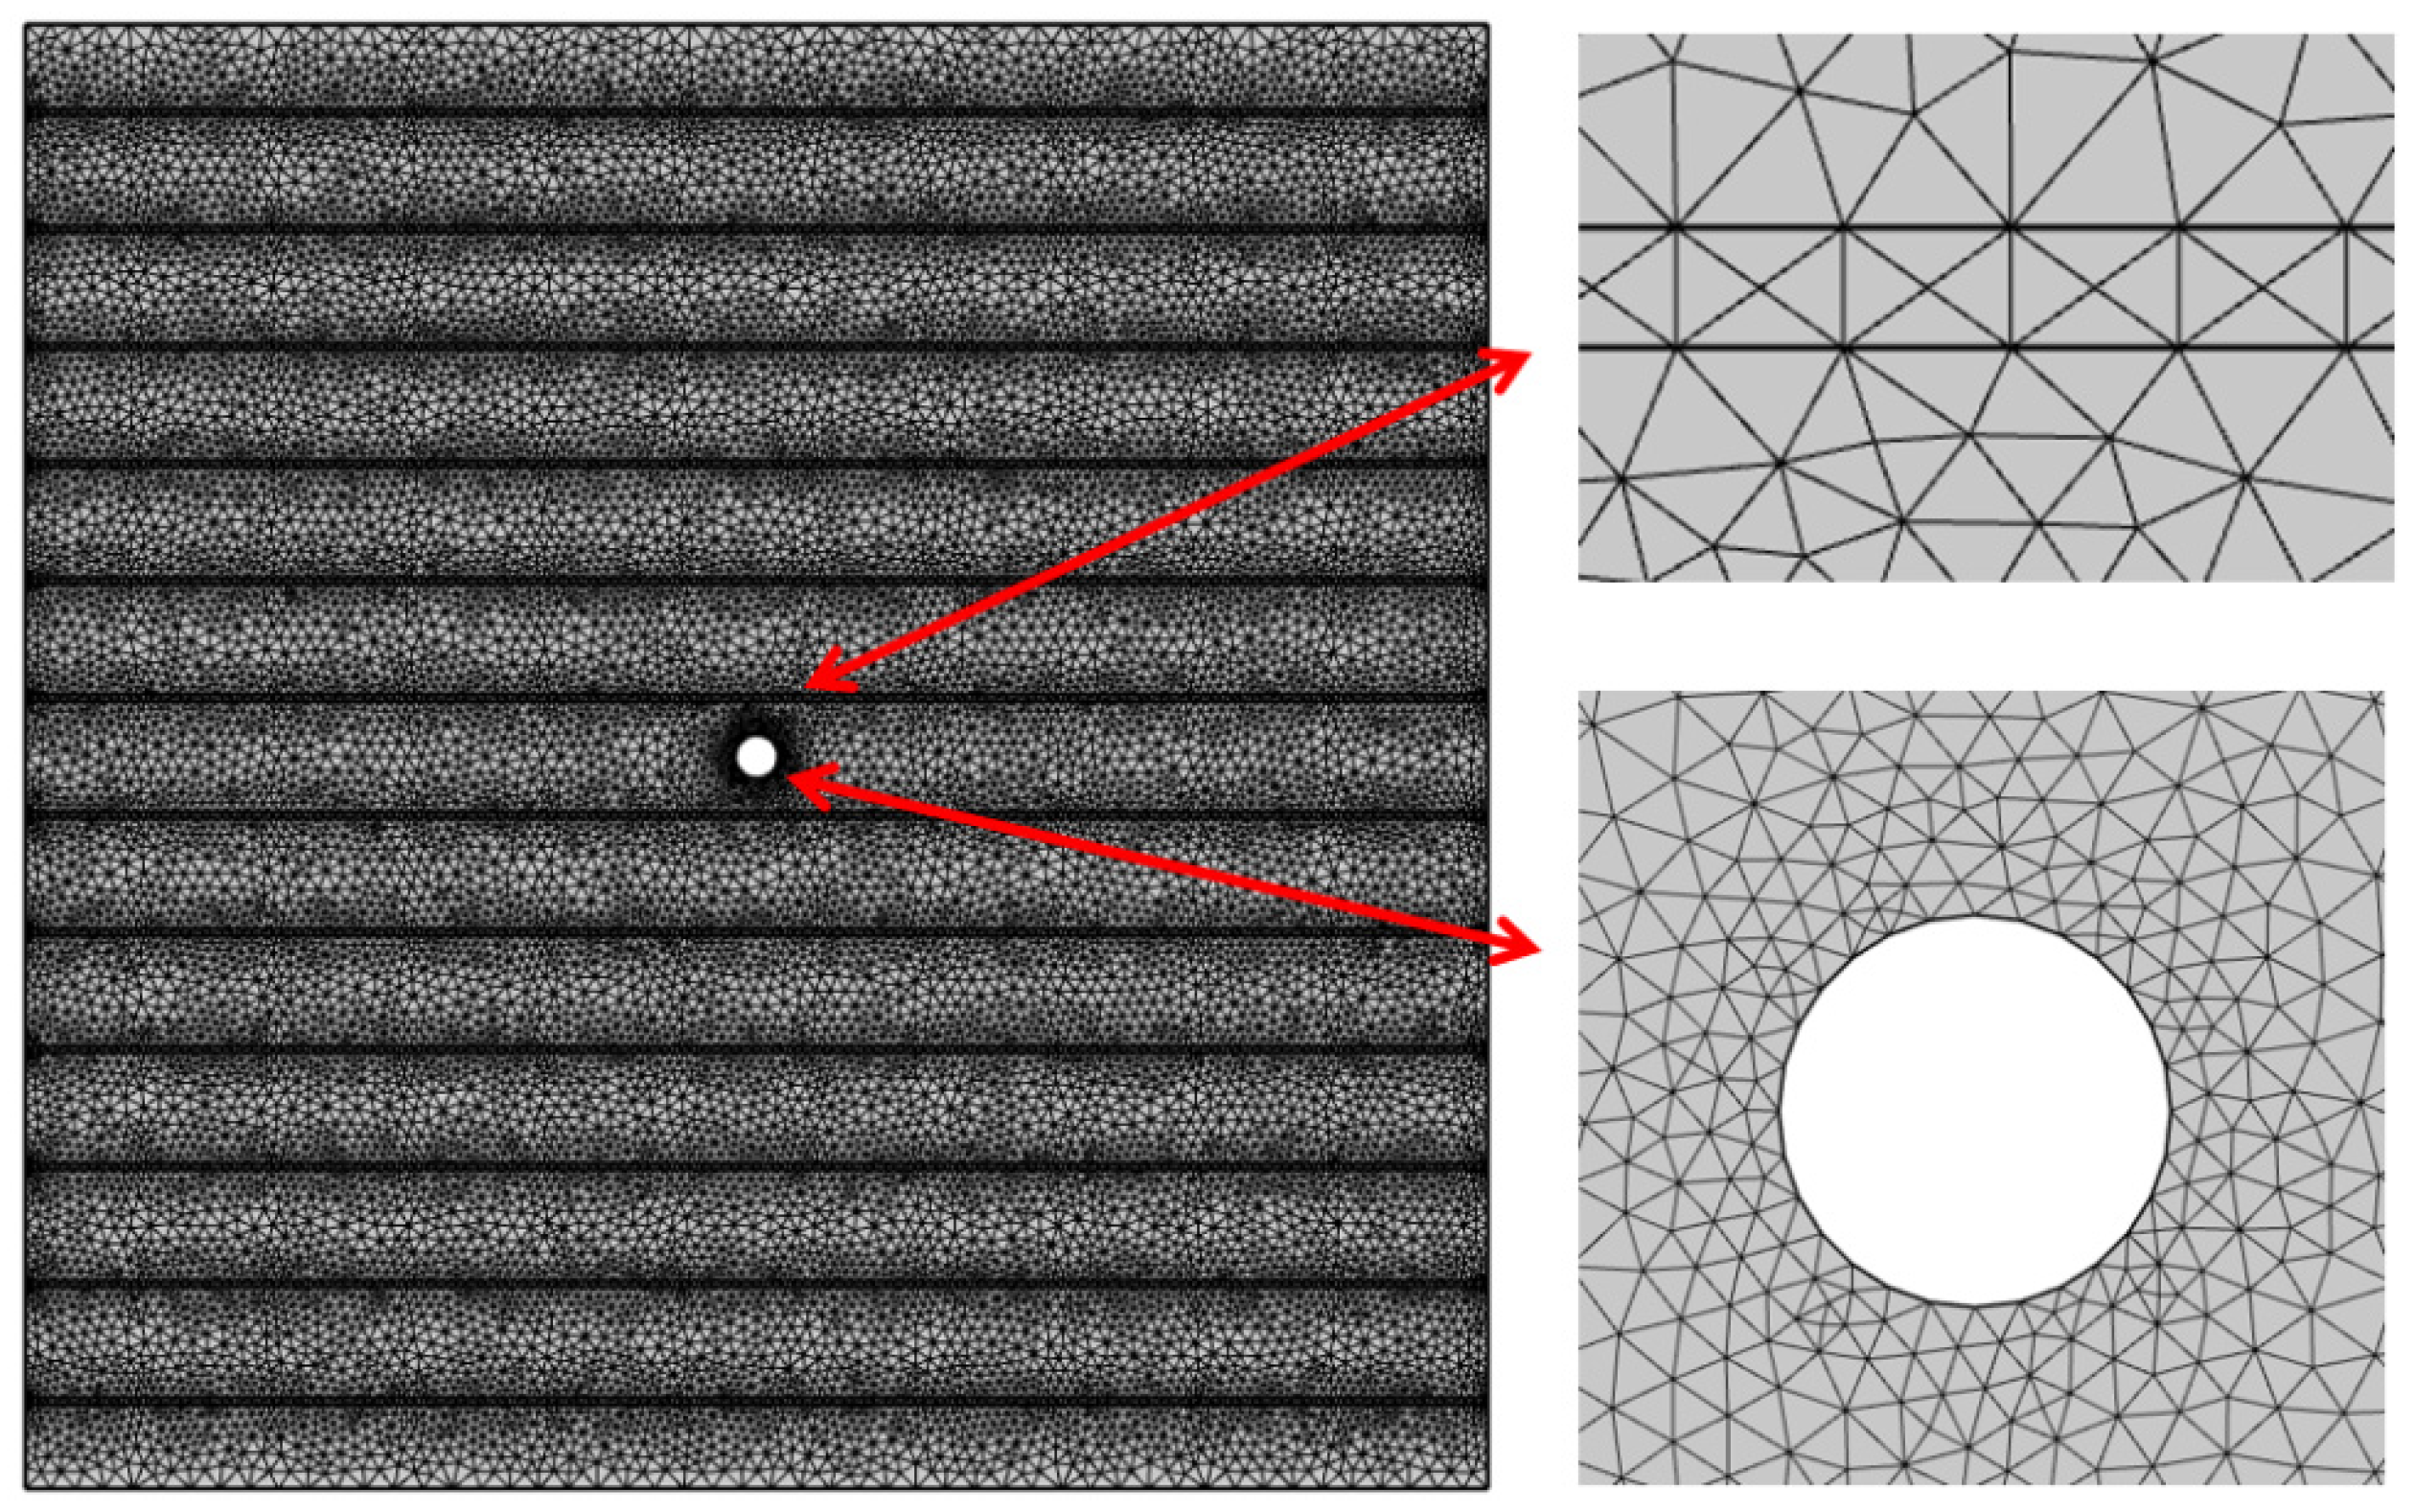
A 2D reservoir model (1000 mm × 1000 mm) was constructed using finite element software, discretized with triangular elements shown in Figure 15. To accurately resolve the fracture-tip mechanics and stress concentrations, the mesh was refined with a maximum element size of 20 mm and a minimum size of 0.075 mm. The mesh transitions were controlled by a growth rate of 1.2, while a curvature factor of 0.25 and narrow region resolution of 1 ensured the precise representation of bedding planes.
Local refinement was applied at the shale matrix–bedding interfaces and the horizontal wellbore to capture the fracture–bedding interactions and near-wellbore stress complexity. The final mesh contained 44,232 elements, including 3858 boundary elements and 56 vertex elements, with a minimum element quality of 0.4546, meeting the computational stability requirements. This strategy balanced accuracy and efficiency, providing a robust framework for simulating hydraulic fracture propagation in shale reservoirs.

6.2.2. Boundary Conditions

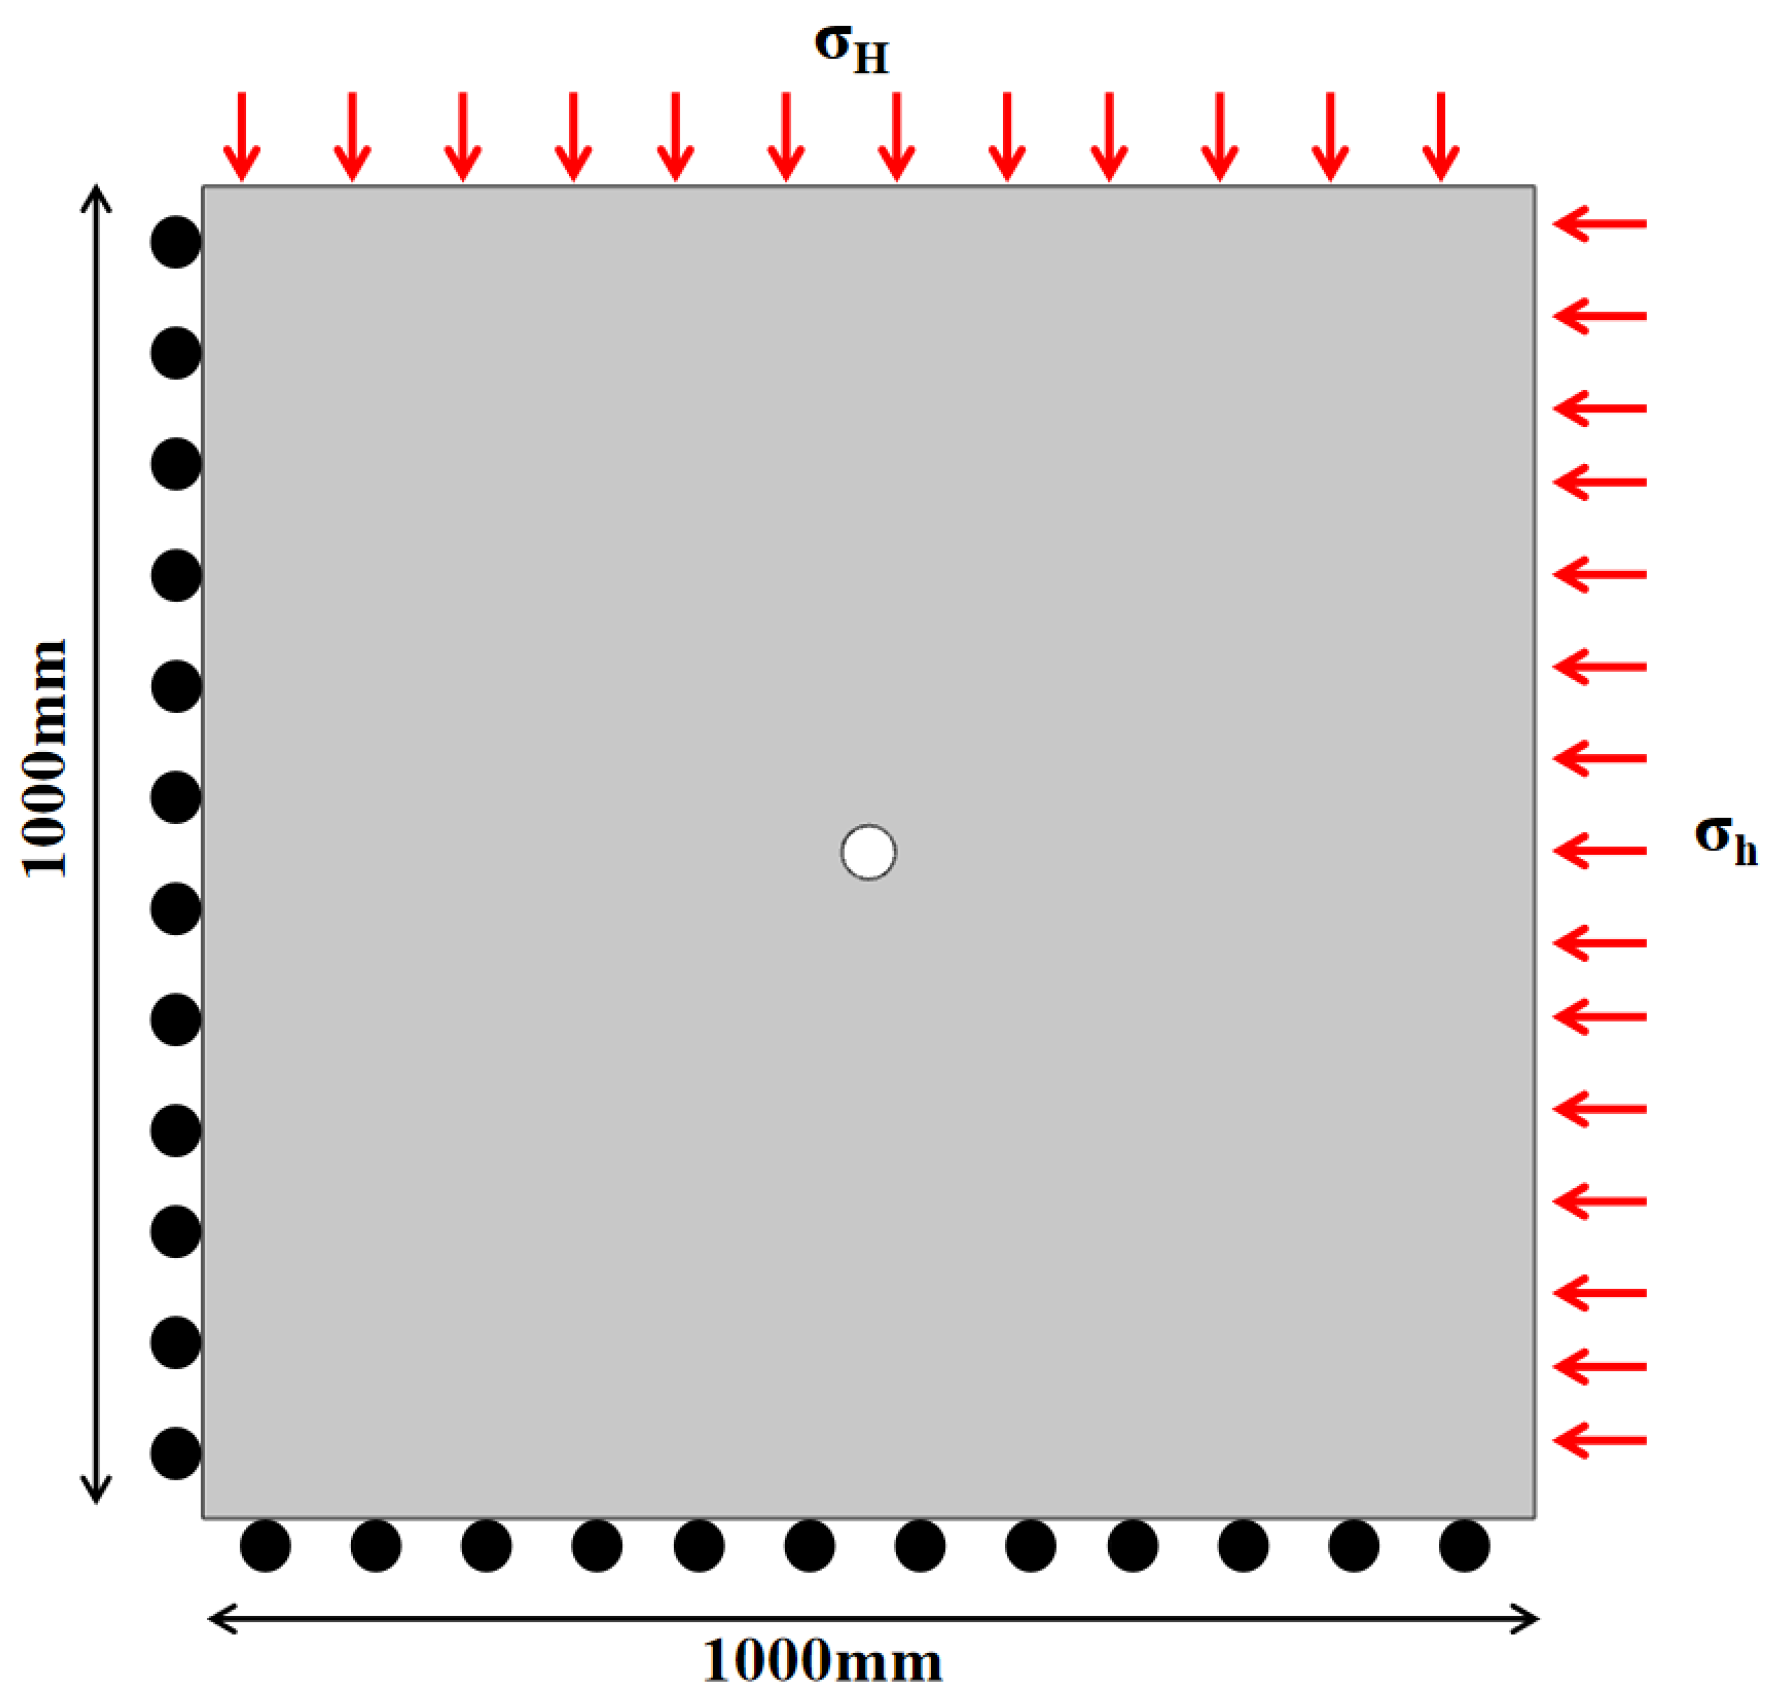
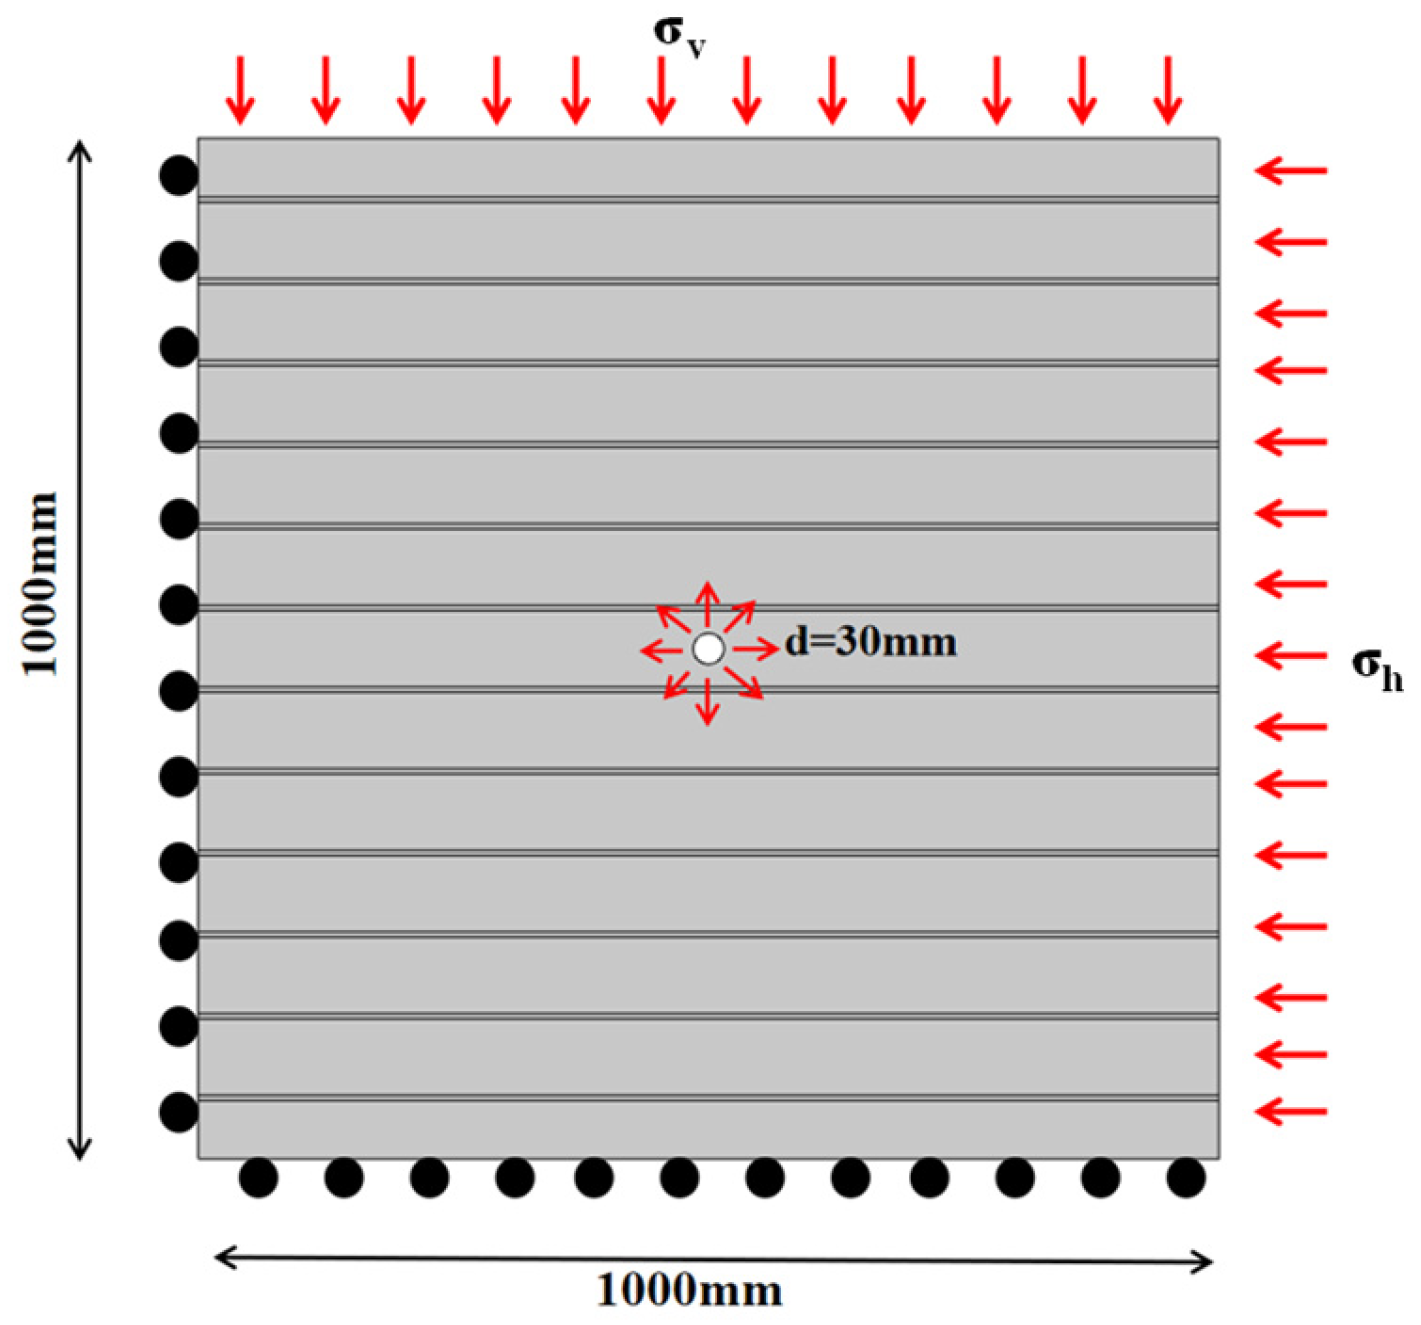
The in situ stress conditions for the extracted shale cores were derived from geological exploration data [59], with the vertical stress (σv) measuring 54 MPa, maximum horizontal principal stress (σH) at 49 MPa, and minimum horizontal principal stress (σh) at 46 MPa. For the two-dimensional simulations conducted in the yz-plane, a constant in situ stress differential of 5 MPa was maintained.
A plane strain model was implemented, with vertical stress applied to the upper boundary and horizontal stress to the right boundary. The lower and left boundaries were assigned fixed constraints. Boundary conditions were implemented as follows: a constant vertical stress (σv) of 54 MPa was applied to the top boundary, while a horizontal stress (σh) of 46 MPa was imposed on the right boundary. The left and bottom boundaries were configured with roller supports to enforce the displacement constraints, as shown in Figure 16.

6.2.3. Initial Parameter Definitions

To evaluate the effect of elastic modulus magnitude on hydraulic fracture propagation, we conducted a comparative analysis using two simulation cases. The first case assigned elastic modulus values based on actual reservoir measurements, while the second employed a uniform distribution. This approach effectively isolated the influence of elastic modulus heterogeneity on fracture behavior.
Case 1—Discretized elastic modulus distribution
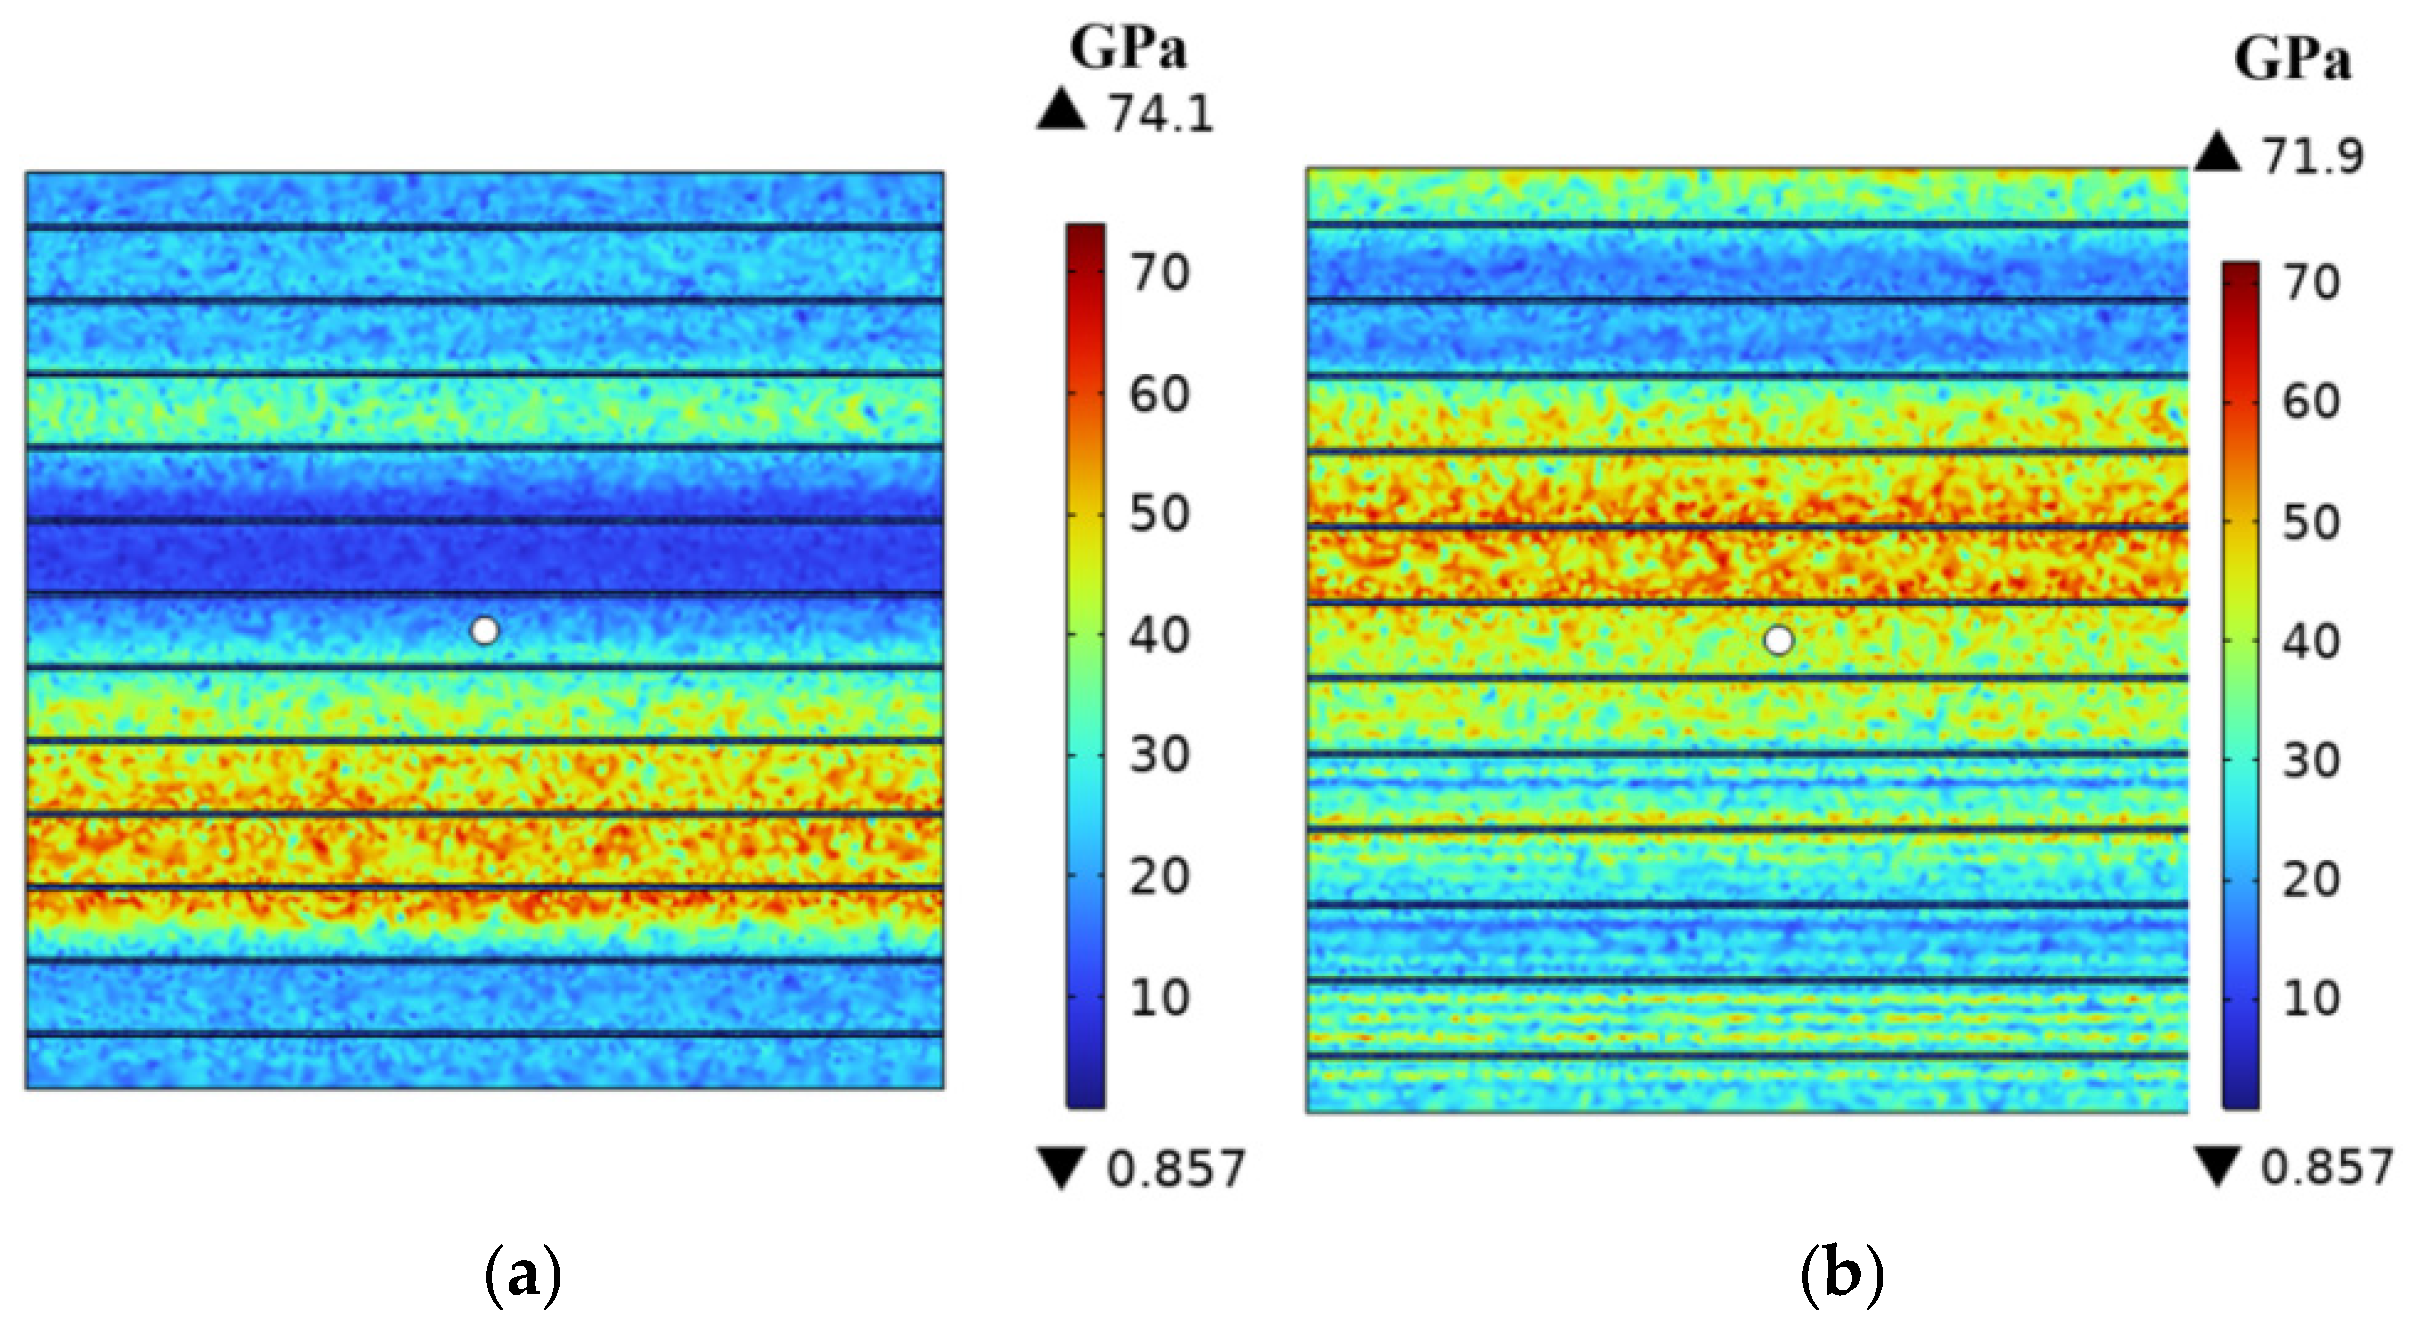
The reservoir model incorporates depth-dependent elastic modulus values derived from the millimeter-scale indentation tests. To preclude contingent outcomes, this study designates two discrete reservoir intervals and incorporates their respective elastic moduli into the model: (1) Model A: 2327.8~2328.8 m depth interval (E = 9.82~58.11 GPa); (2) Model B: 2333.7~2334.7 m depth interval (E = 15.35~55.10 GPa). Within these intervals, the reservoir’s elastic modulus demonstrates substantial heterogeneity, better suited for evaluating its impact on the fracturing behavior. Bedding planes are assigned a constant elastic modulus of 15 GPa following a Weibull statistical distribution. The spatial variation in the mechanical properties is illustrated in Figure 17, with additional simulation parameters provided in Table 2.
Case 2—Homogenized elastic modulus distribution
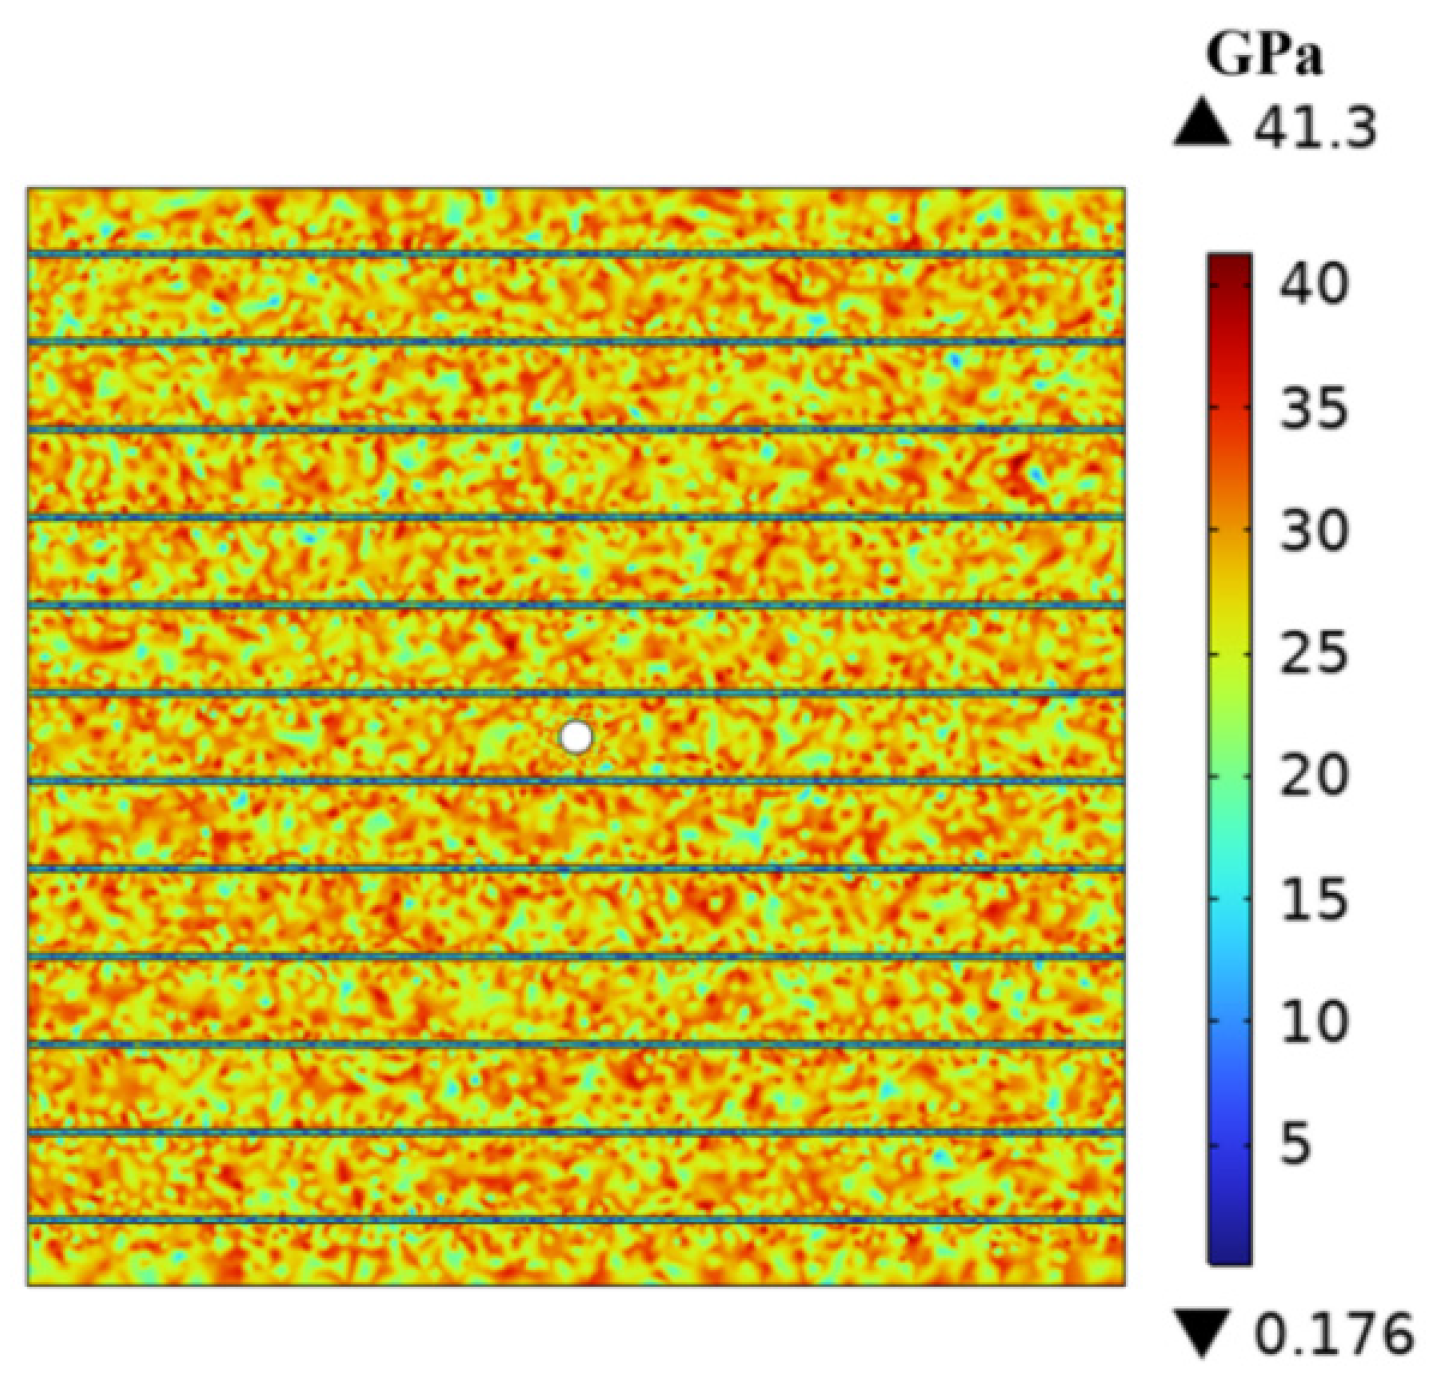
The control case employed a uniform matrix elastic modulus of 29.2 GPa (mean value) with Weibull-distributed randomness, while maintaining the bedding plane properties identical to Case 1 (Figure 18). All other parameters remained consistent between the cases (Table 2).
The comparative study maintained identical boundary conditions and fracturing parameters across both scenarios, including the fluid injection rate (5.0 × 10⁻⁵ m3/s) and viscosity (10 mPa·s) [60,61,62], to isolate the effects of elastic modulus distribution on fracture propagation behavior.

6.2.4. Convergence Criteria

This study utilized the built-in transient solver in the finite element software to perform fully coupled simulations of hydraulic fracturing, solving the damage–fluid–solid coupling equations. The solver settings were optimized to ensure convergence and numerical stability.
Convergence criteria: A relative tolerance of 0.001 and an absolute tolerance of 0.1 were imposed on the key dependent variables (damage variable D, fluid pressure p, and displacement u).
Convergence validation: A timestep was deemed converged when:
(1) The residual norm of discretized equations fell below the tolerance-based threshold.
(2) Relative changes in the solution vectors met nonlinear iteration requirements.
This approach maintained robust numerical stability while efficiently resolving coupled multiphysics interactions during fracture propagation.

6.3. Method Validation

Hubbert and Willis (1957) [63] established a theoretical solution for rock fracture pressure neglecting the fracturing fluid infiltration:
P H W = σ t + 3 σ 3 σ 1 p 0
where P H W represents the fracture pressure in the Hubbert–Willis (H-W) solution; σ t is the rock tensile strength;   σ 1 and σ 3 correspond to the minimum and maximum principal stresses, respectively; and p 0 denotes the initial pore pressure.
Haimson and Fairhurst (1967) [64] developed a modified theoretical solution incorporating the fracturing fluid infiltration:
P H F = σ t + 3 σ 3 σ 1 p 0 2 α ( 1 2 v ) / ( 1 v ) p 0
where PHW indicates the fracture pressure in the Haimson–Fairhurst (H-F) solution; α represents the Biot coefficient; and ν is the rock’s Poisson’s ratio.
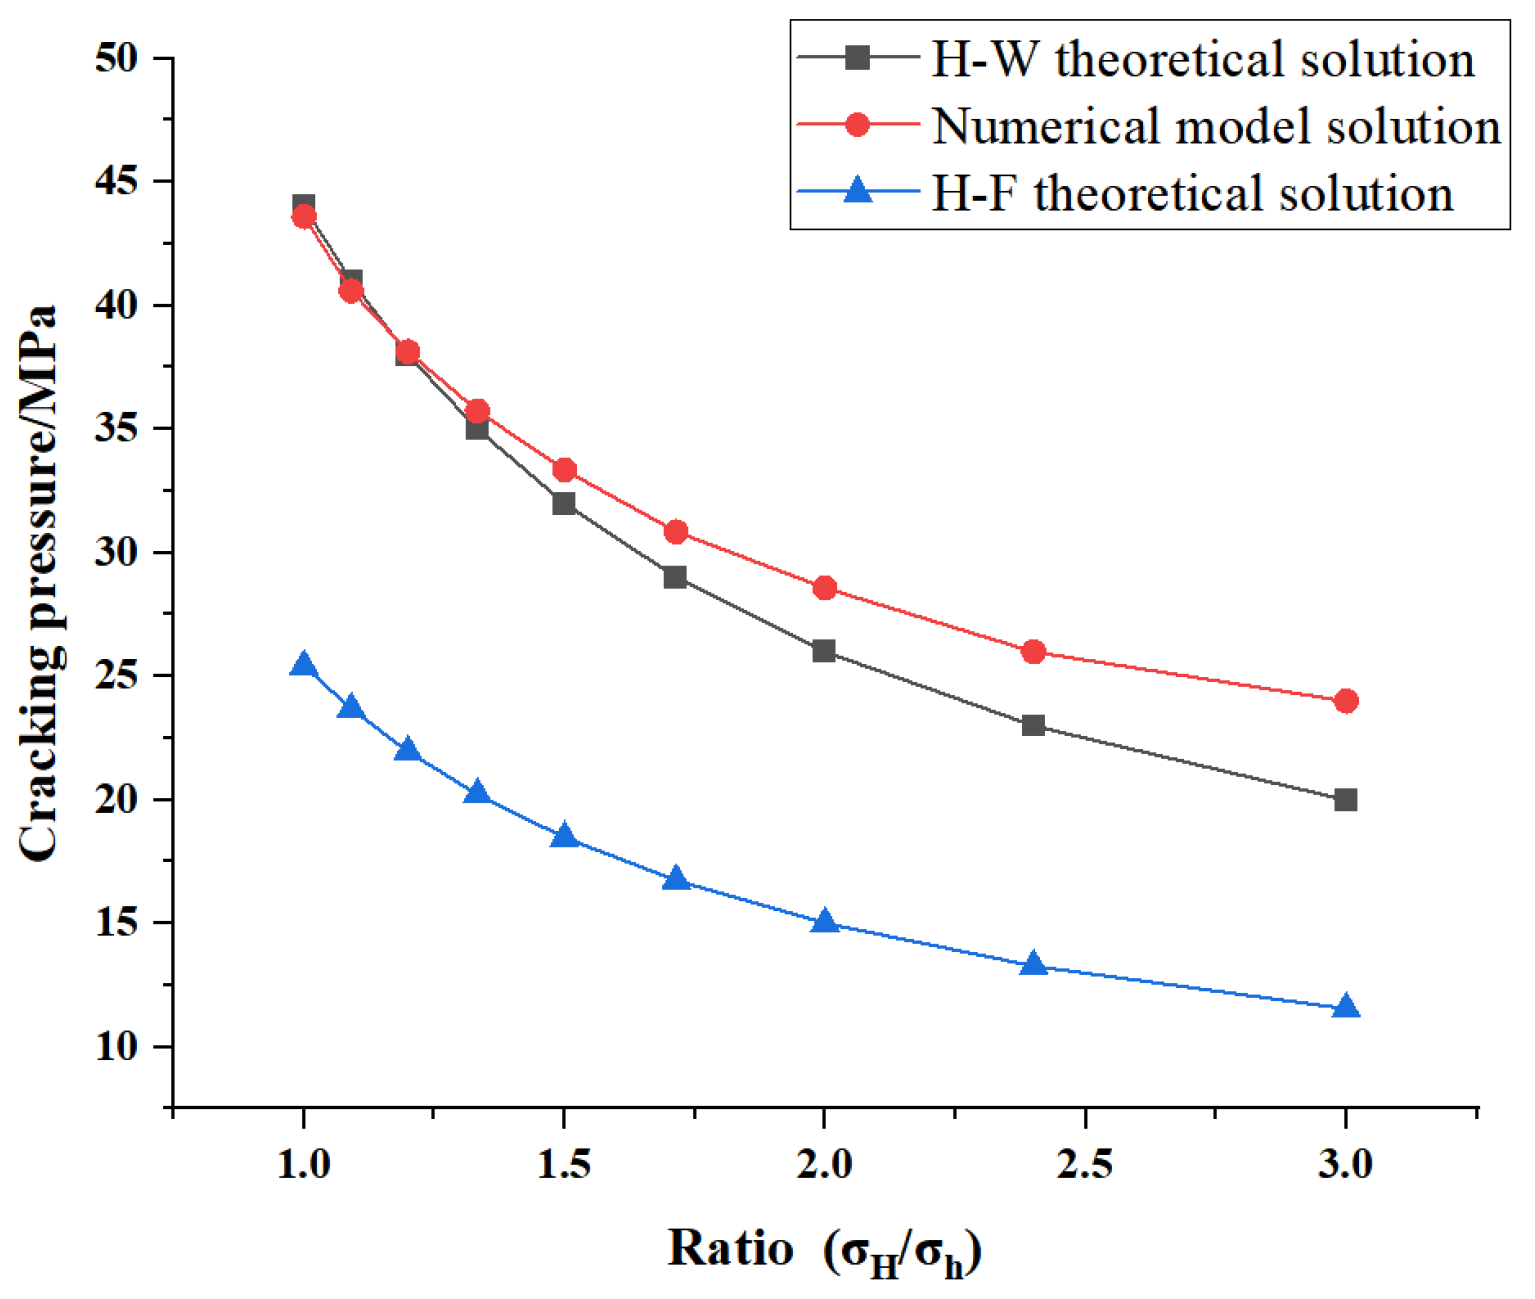
To verify the reliability of the fluid flow–stress damage-coupled model and its finite element implementation, numerical simulations of hydraulic fracturing were performed. The computational domain consisted of a 1000 mm × 1000 mm square plate containing a central 20 mm radius borehole. The model applies σ H and σ h stress boundary conditions on the top and right edges, with roller supports constraining the bottom and left edges. The fluid injection rate was incrementally increased by 5.0 × 10⁻⁵ m3/s until specimen failure, as shown in Figure 19. The material parameters are detailed in Table 3.
The validation process focused exclusively on the magnitude of rock cracking pressure under varying stress ratio conditions. The maximum horizontal principal stress ( σ H ) was maintained at a constant value of 12 MPa, while the minimum horizontal principal stress ( P H W ) ranged from 4 MPa to 12 MPa.
Figure 20 presents the cracking pressures derived from the numerical simulations, the Hubbert–Willis (H-W) theoretical solution, and the Haimson–Fairhurst (H-F) theoretical solution under different stress ratios. As illustrated, the numerical simulation results are bounded by the H-W and H-F theoretical solutions. This discrepancy arises because the H-W theory presumes impermeable rock conditions, whereas the H-F theory assumes high rock permeability. The simulated rock permeability in this study is 0.01 m·d−1, characteristic of a low-permeability formation, which explains the closer agreement with the H-W theoretical solution. These findings exhibit consistency with the results reported by Liu et al. [65] and Zhang et al. [66].

6.4. Simulation Results

This study establishes two hydraulic fracturing models with distinct elastic modulus distributions. A comparative analysis of fracture initiation behavior and propagation dynamics within these models elucidates the impact of mechanical anisotropy on hydraulic fracture development.

6.4.1. Fracture Initiation Laws in Shale Reservoirs Under Different Elastic Modulus Distributions

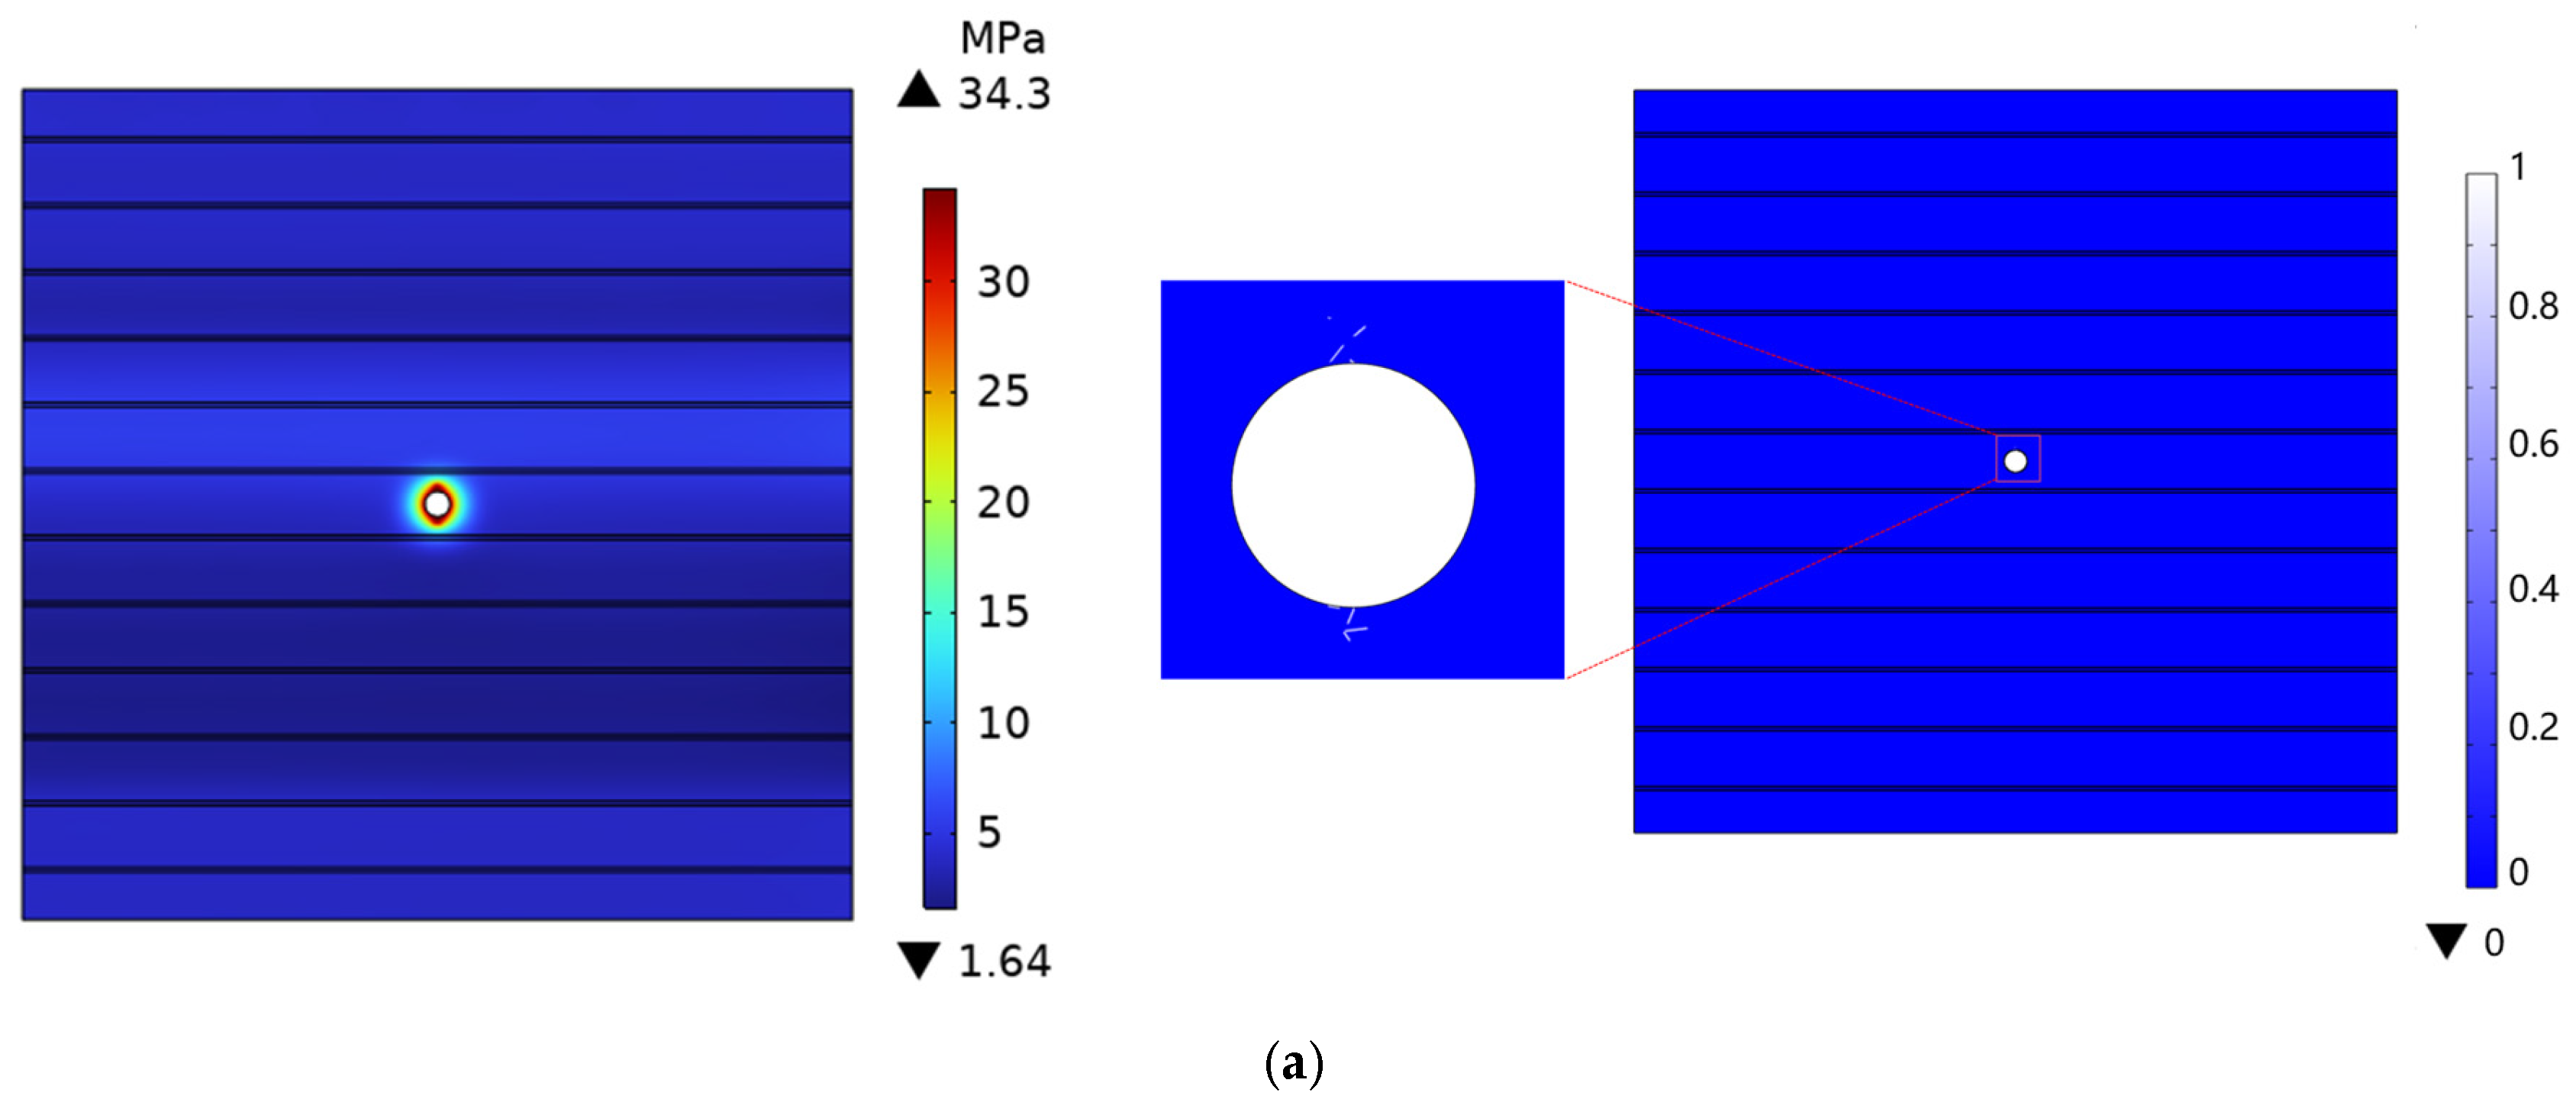
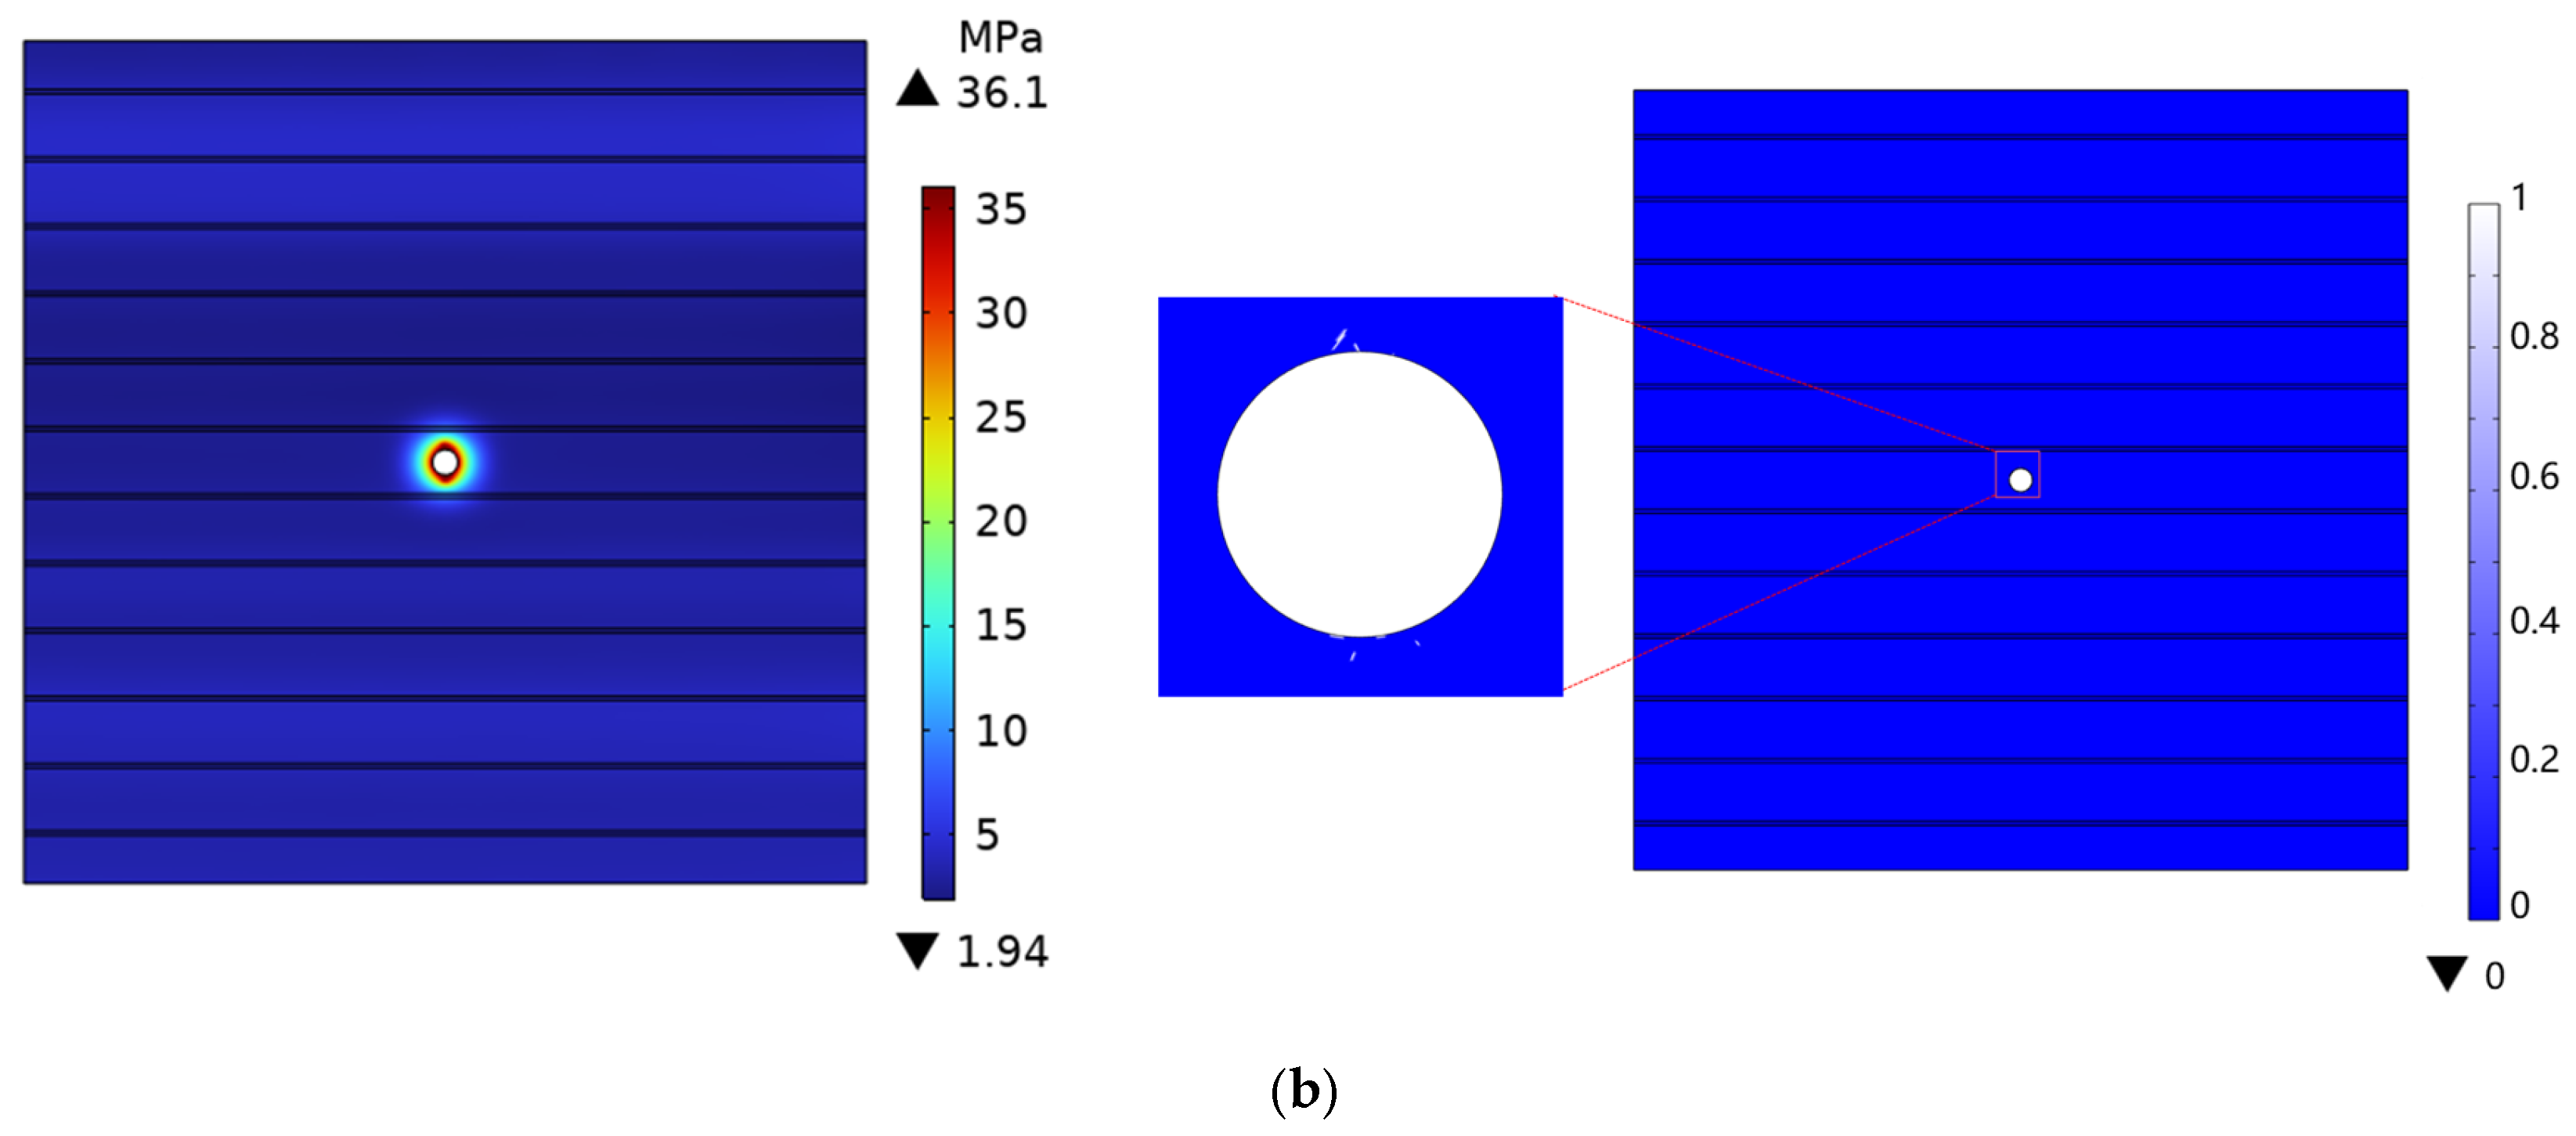
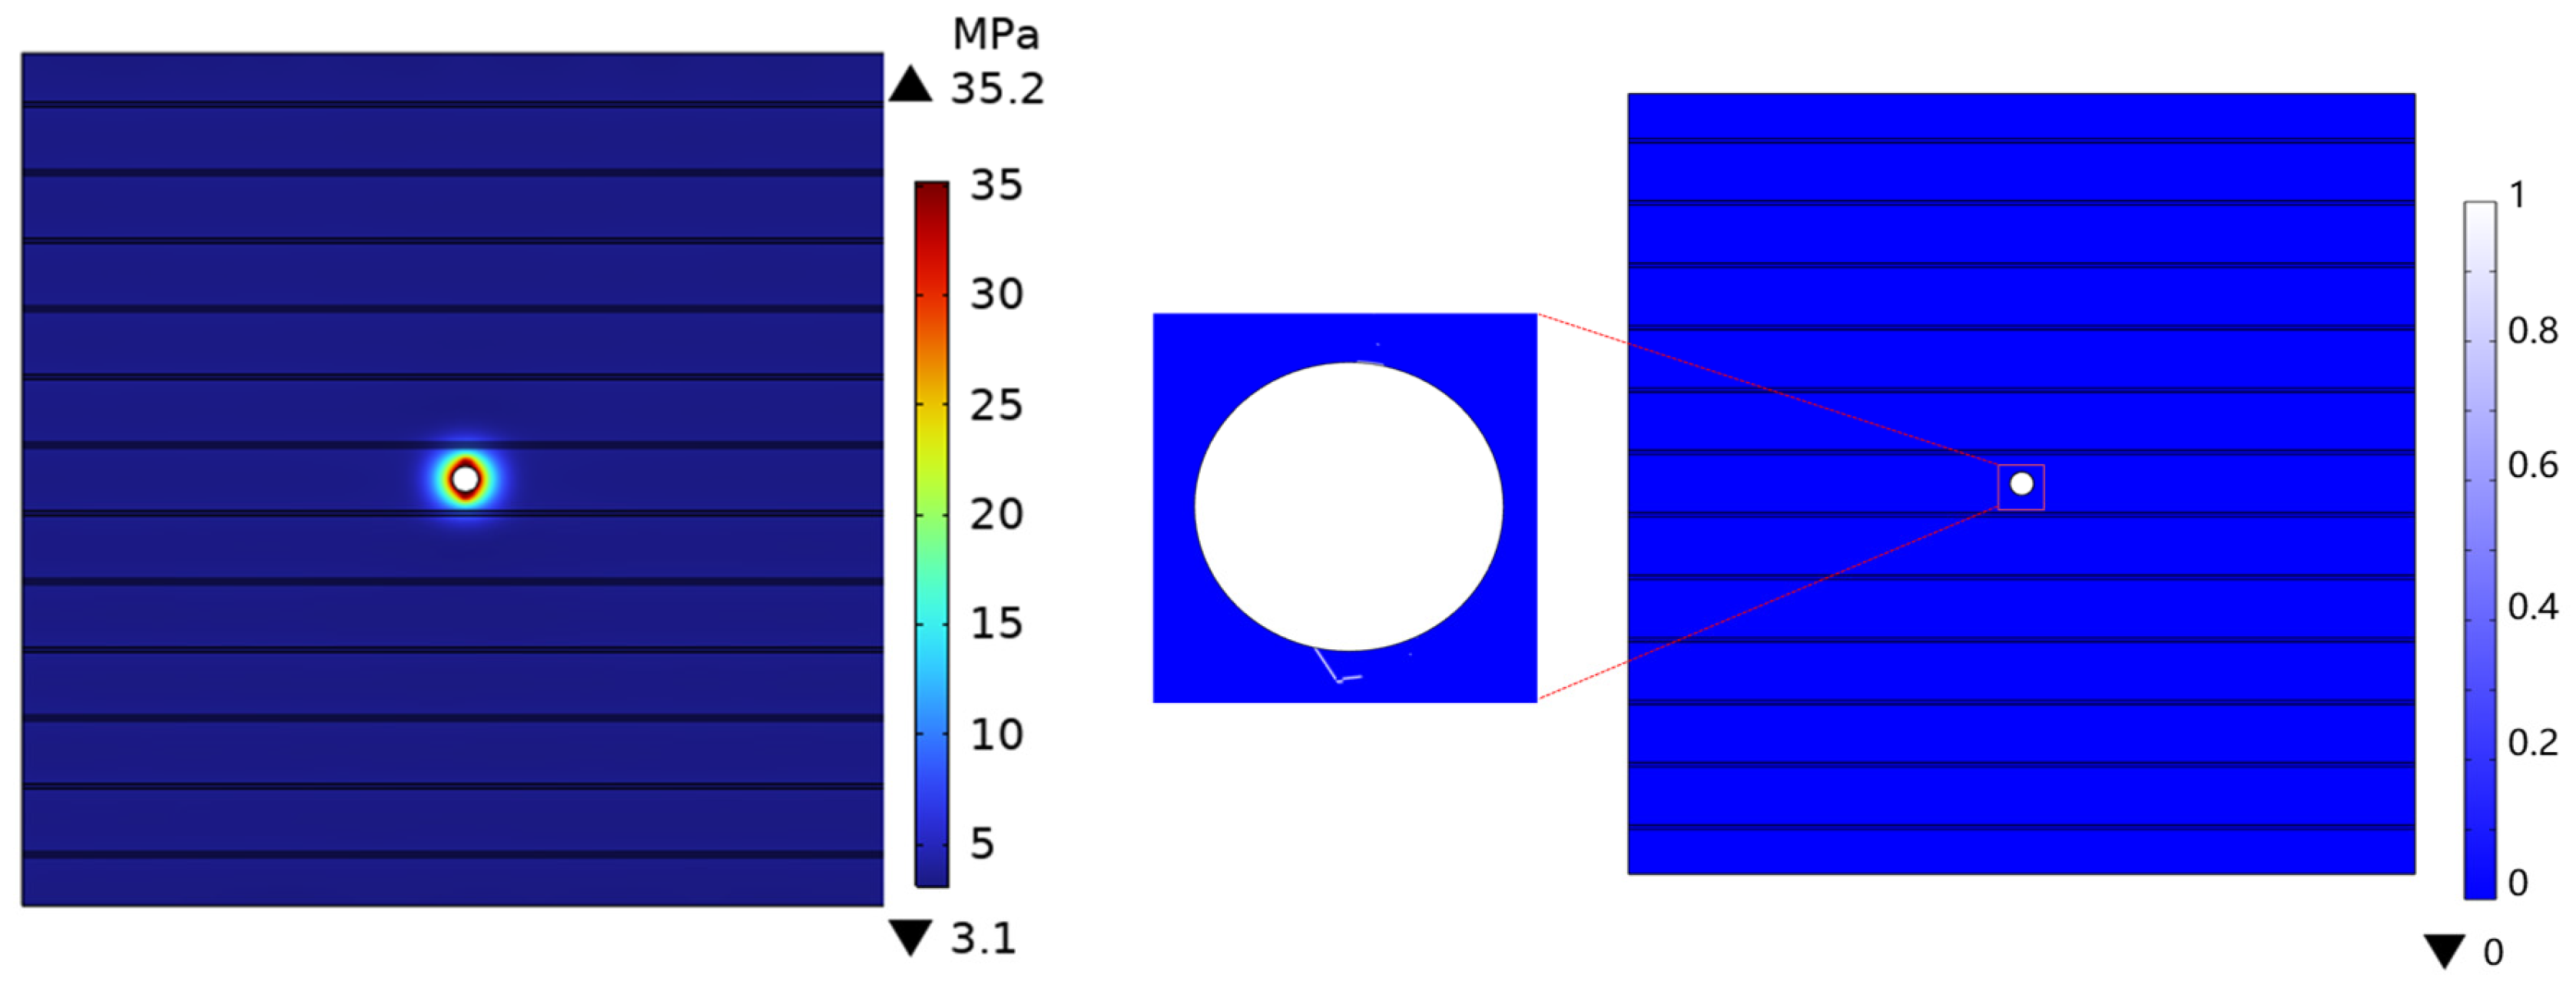
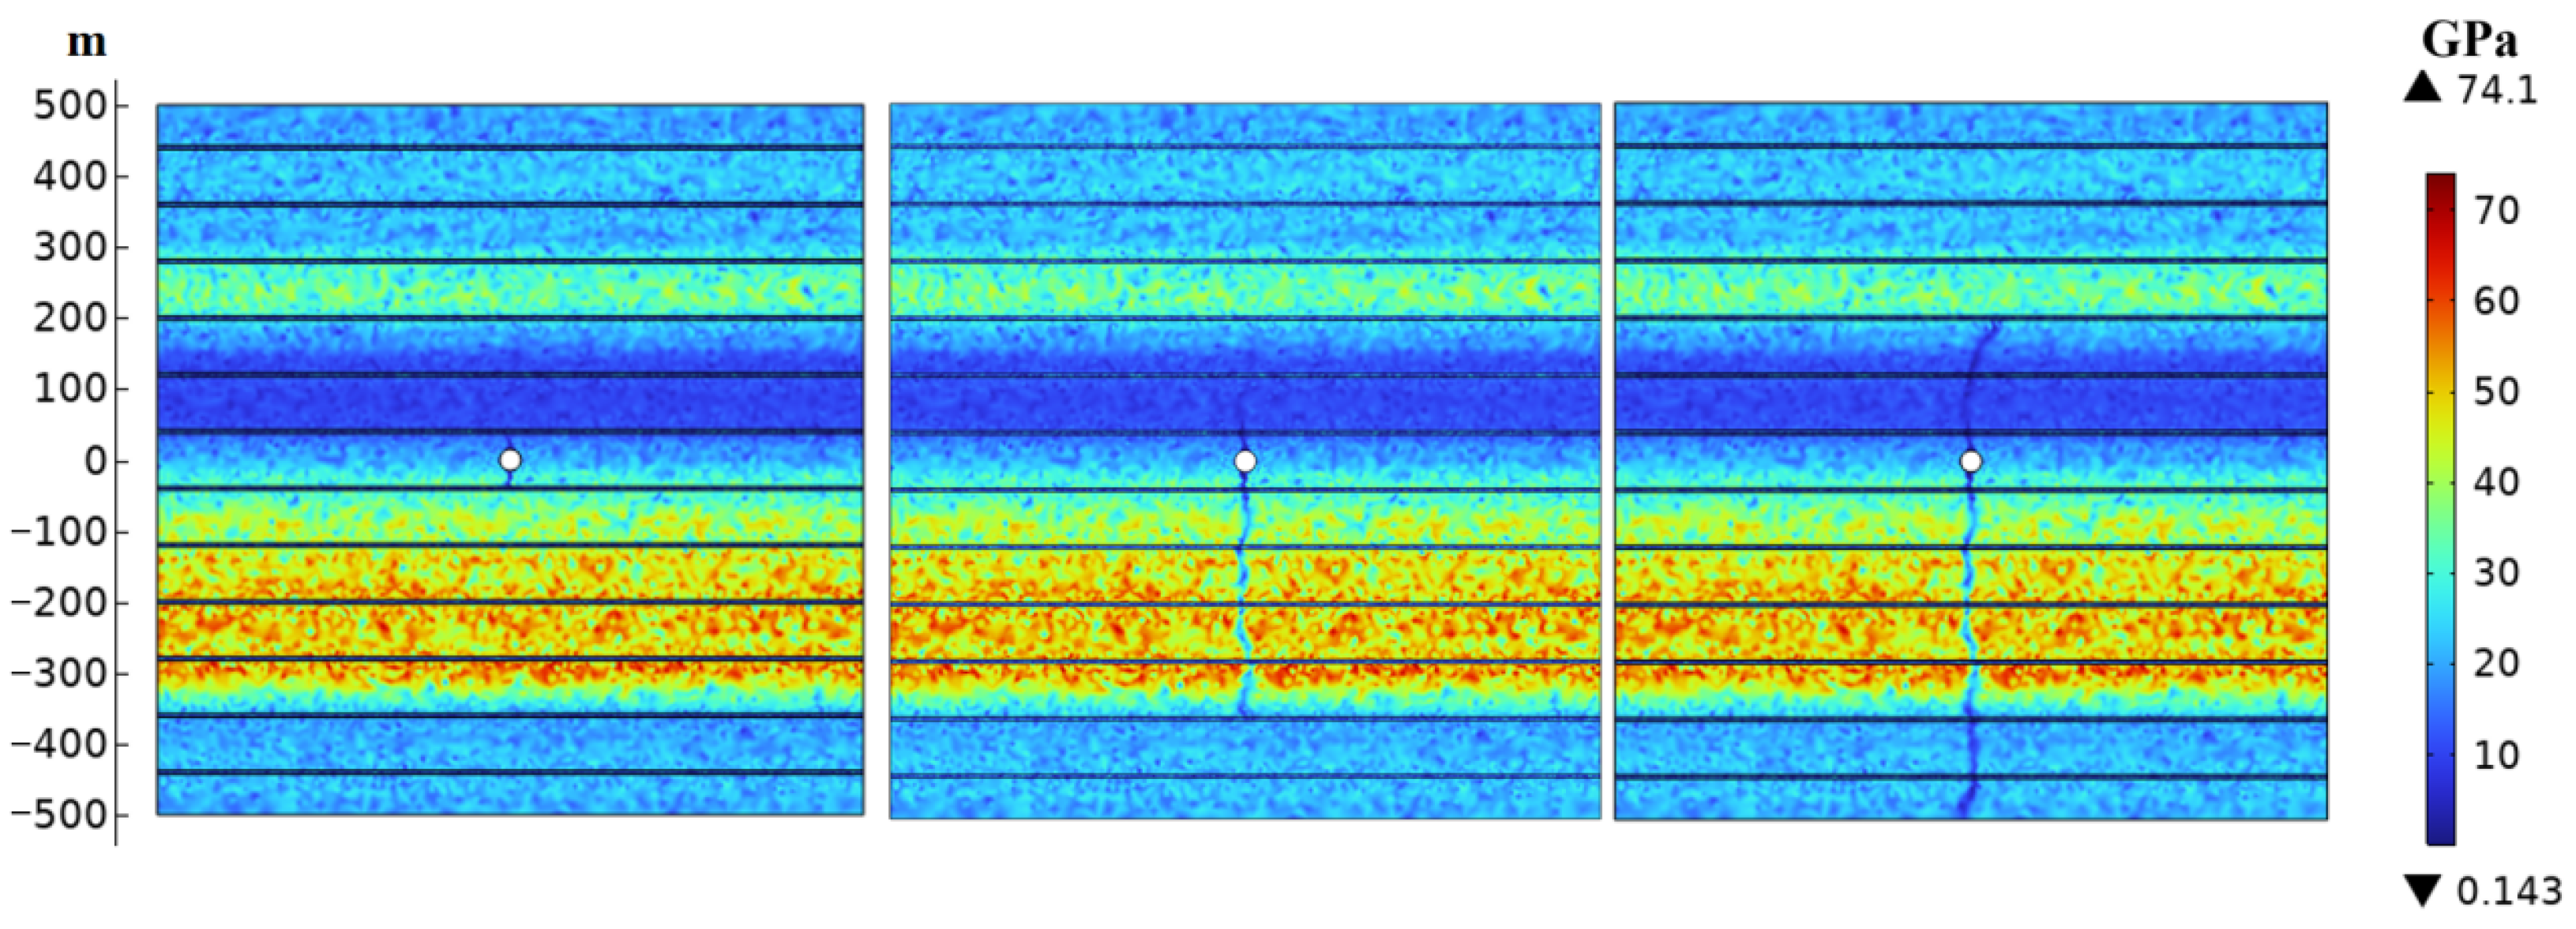
Figure 21 and Figure 22 present the fracture initiation patterns for shale reservoirs under discretized and homogenized elastic modulus distributions, respectively. As illustrated in Figure 21a,b, despite the differences in the elastic modulus distributions, the bedding-parallel fractures initiate at the horizontal wellbore and propagate along the direction of maximum principal stress in both cases [67]. For Case 1 (discretized elastic modulus distribution), the fracture initiation pressures for the two shale reservoir models are 34.3 MPa and 36.1 MPa, respectively. In Case 2 (homogenized elastic modulus with Weibull random distribution), the initiation pressure is 35.2 MPa (Figure 22). The simulation results demonstrate that the fracture initiation pressures remain comparable across conditions, with no statistically significant variation observed.

6.4.2. Hydraulic Fracture Propagation Under Discretized Elastic Modulus Distribution

(1)
Model A
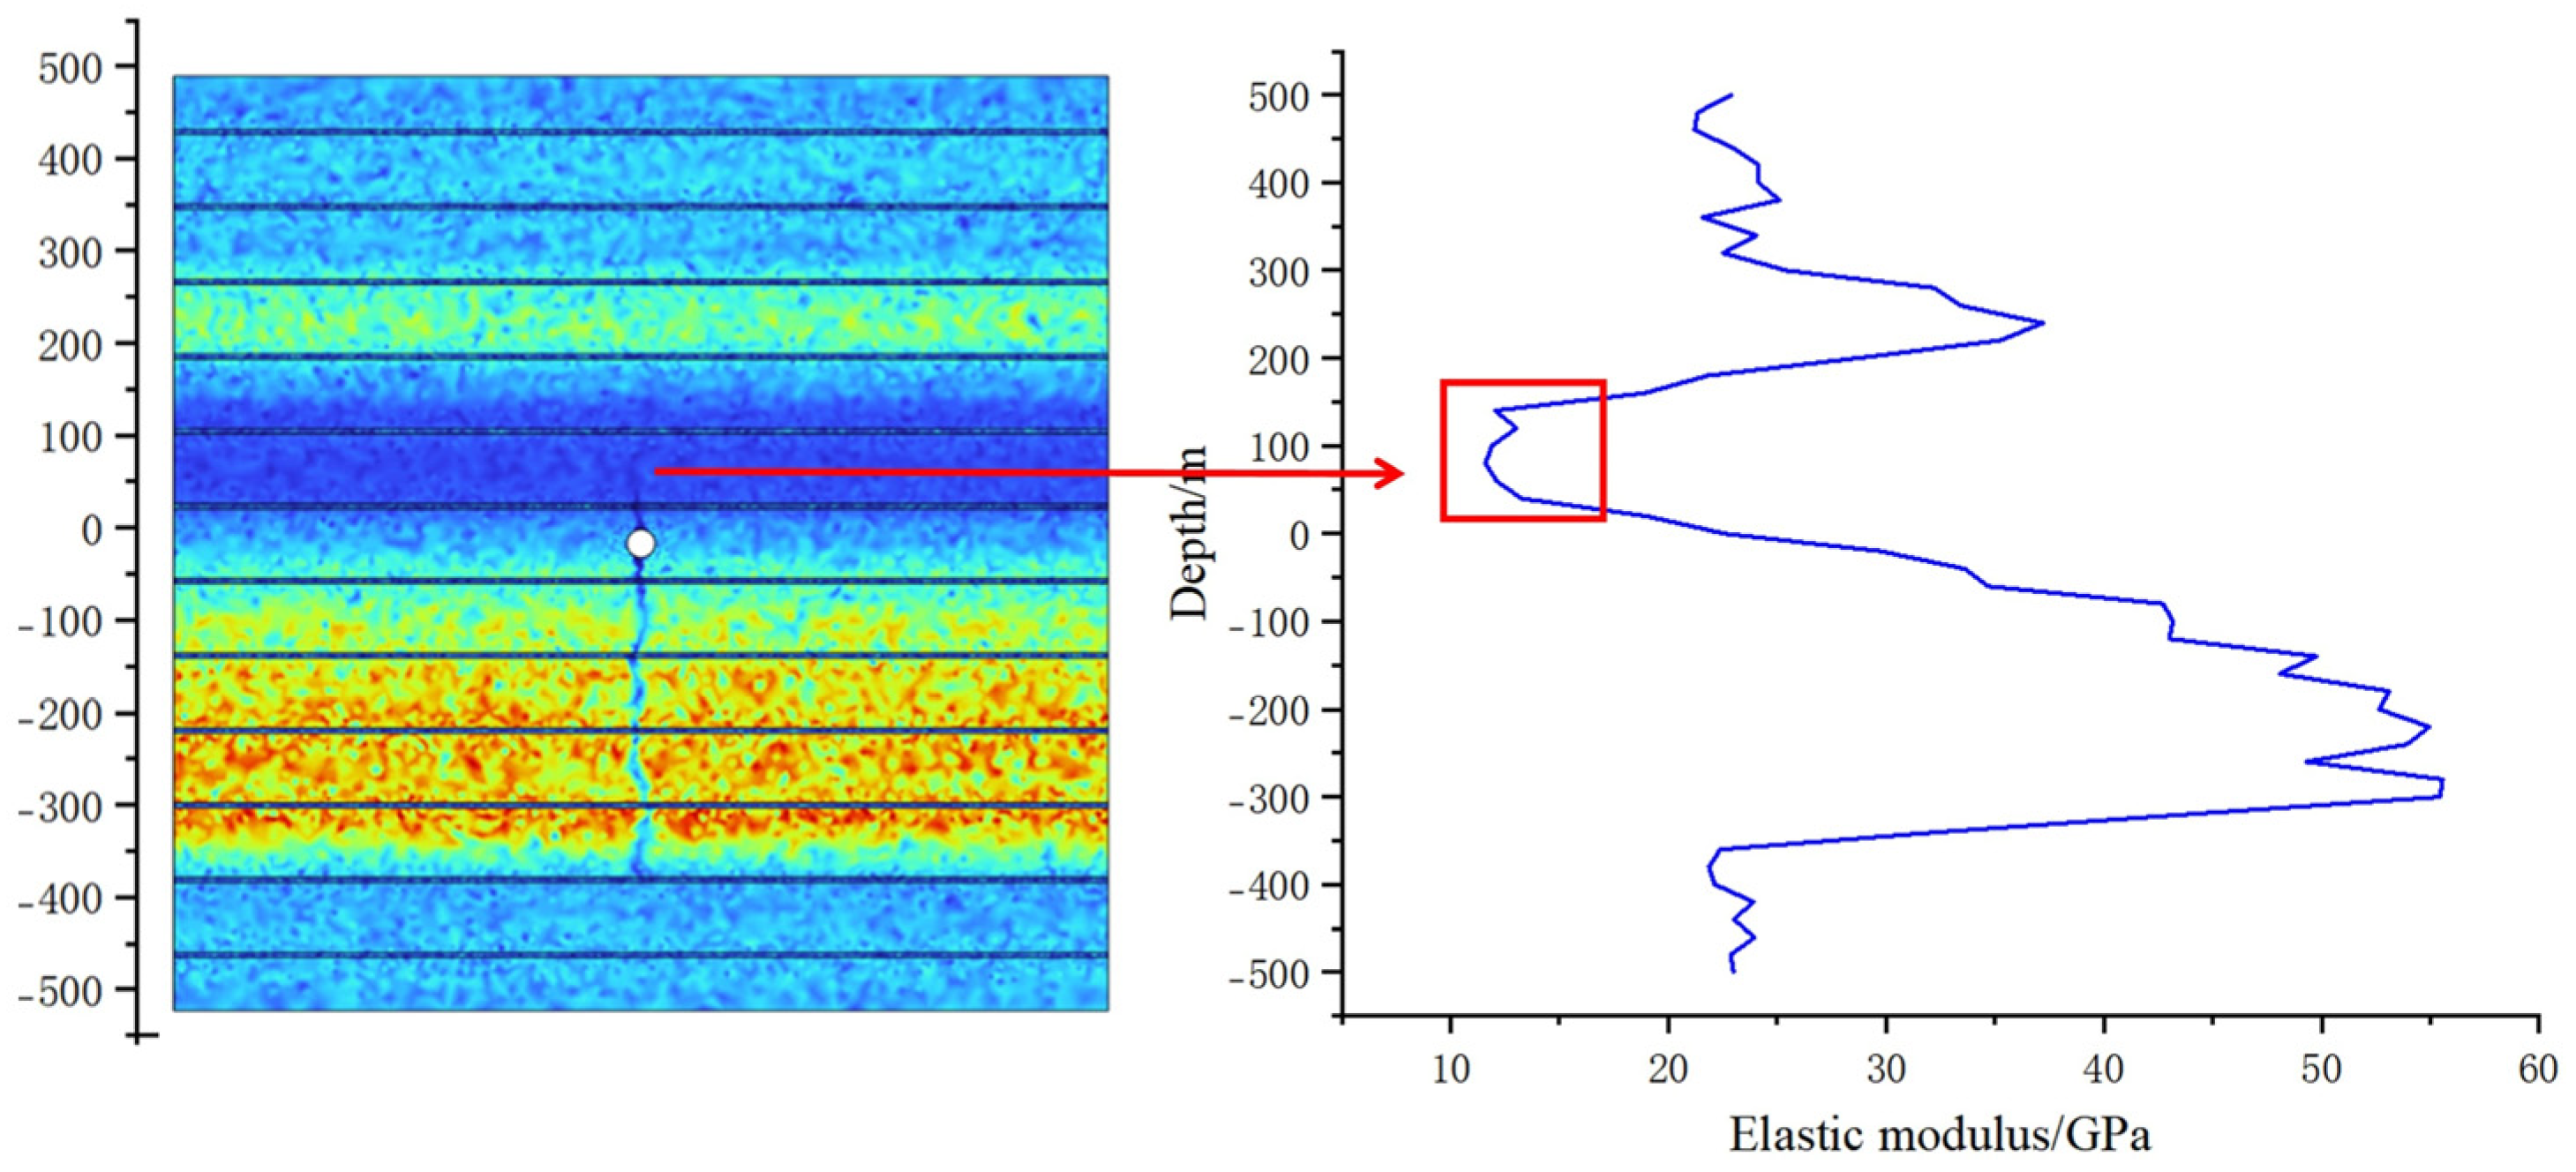
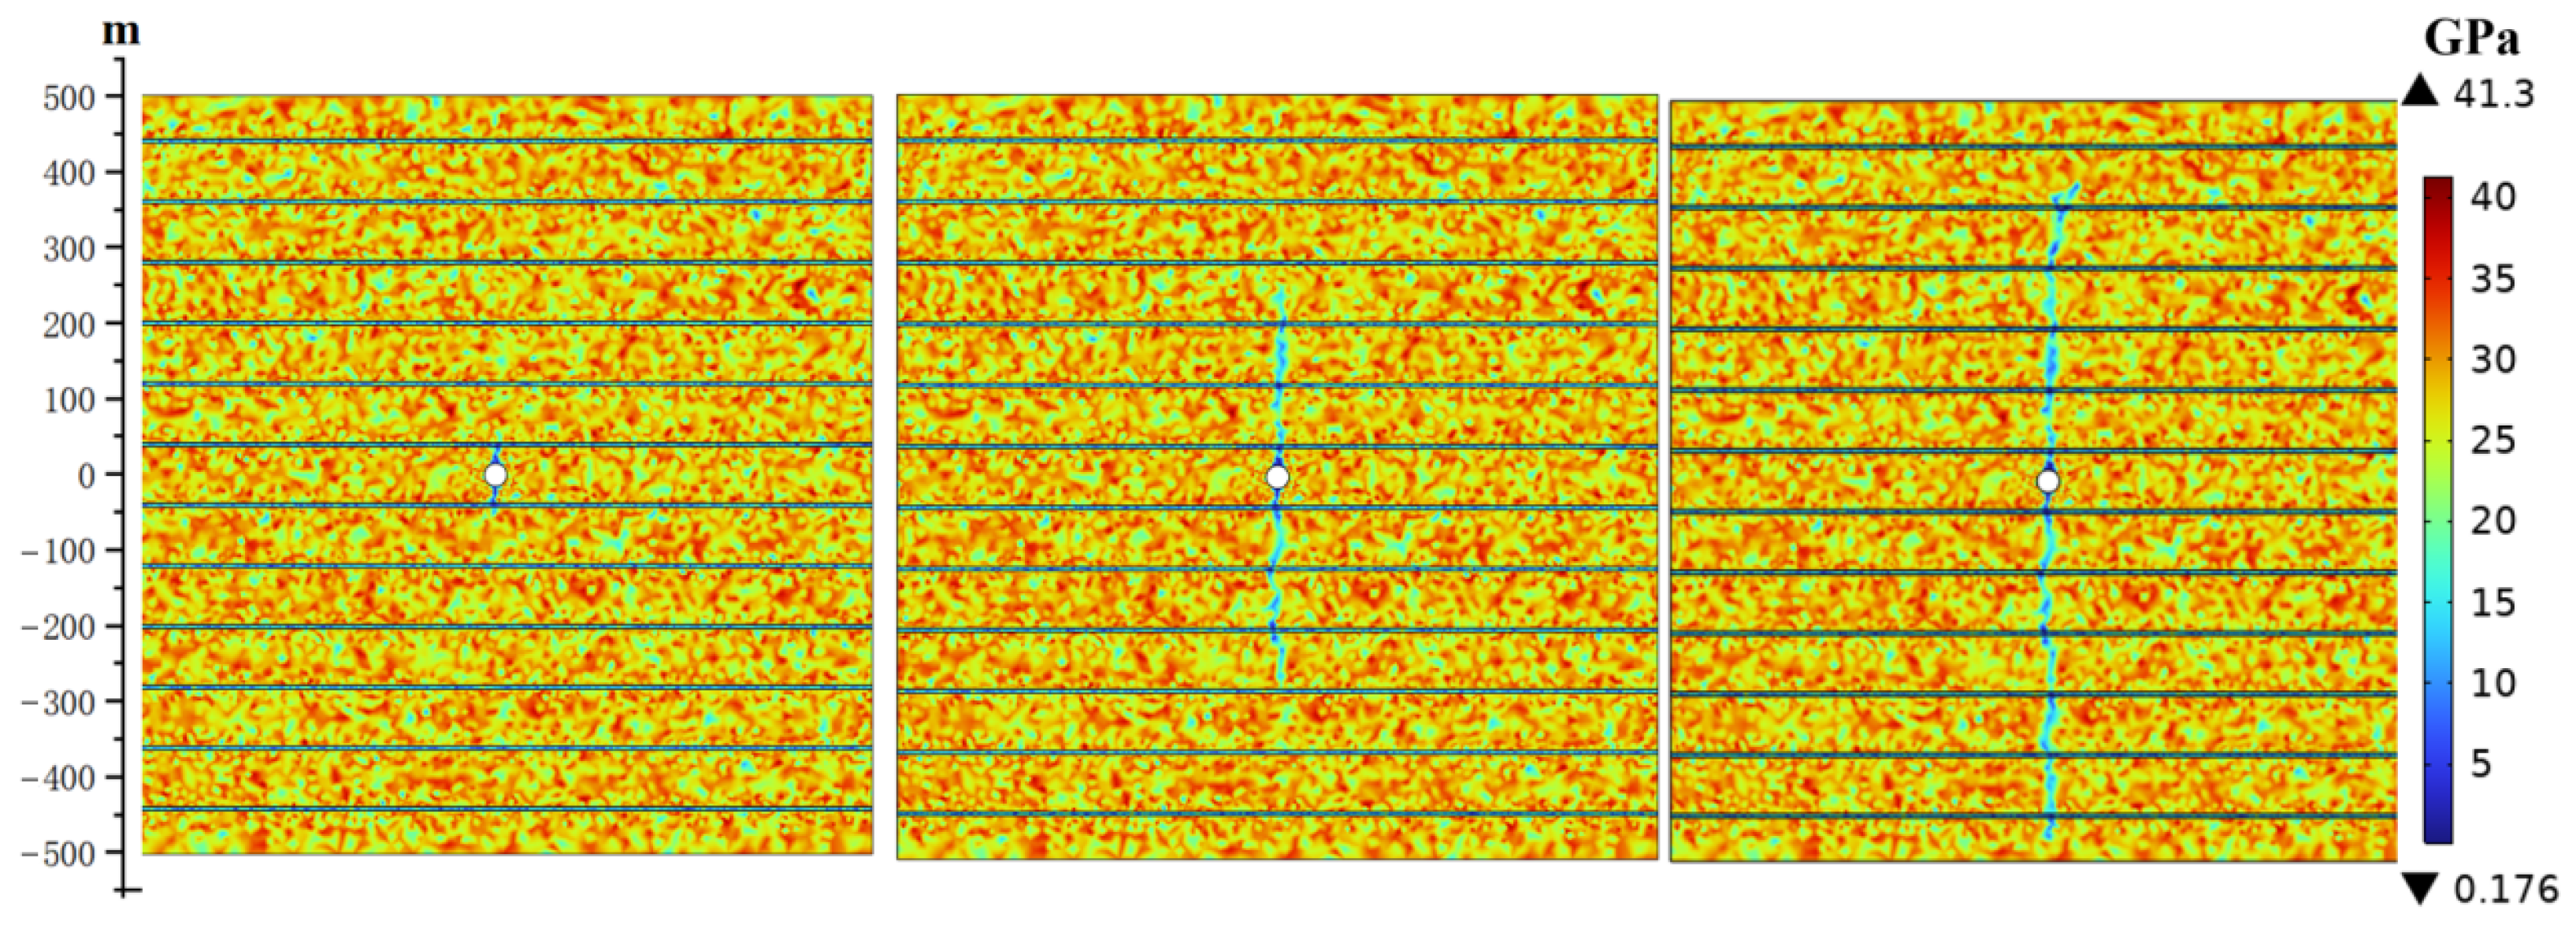
Figure 23 illustrates the elastic modulus distribution and fracture propagation within the reservoir plane of Model A. Initially, hydraulic fractures propagate symmetrically from the horizontal wellbore, following the orientation of the maximum principal stress (vertical direction). Upon encountering the first bedding layer, the fracture exhibits preferential propagation toward the lower region, where the elastic modulus is comparatively higher, resulting in accelerated fracture advancement. The fracture rapidly extends to the fourth bedding layer below the wellbore before entering the low elastic modulus zone (−350 mm to −500 mm, Figure 24). Within this region, both the upper and lower fracture branches decelerate due to the reduced elastic modulus. Subsequently, the lower fracture completes fracturing first, while the upper fracture continues propagation, ultimately reaching the third bedding layer before fully extending through the upper reservoir.
(2)
Model B
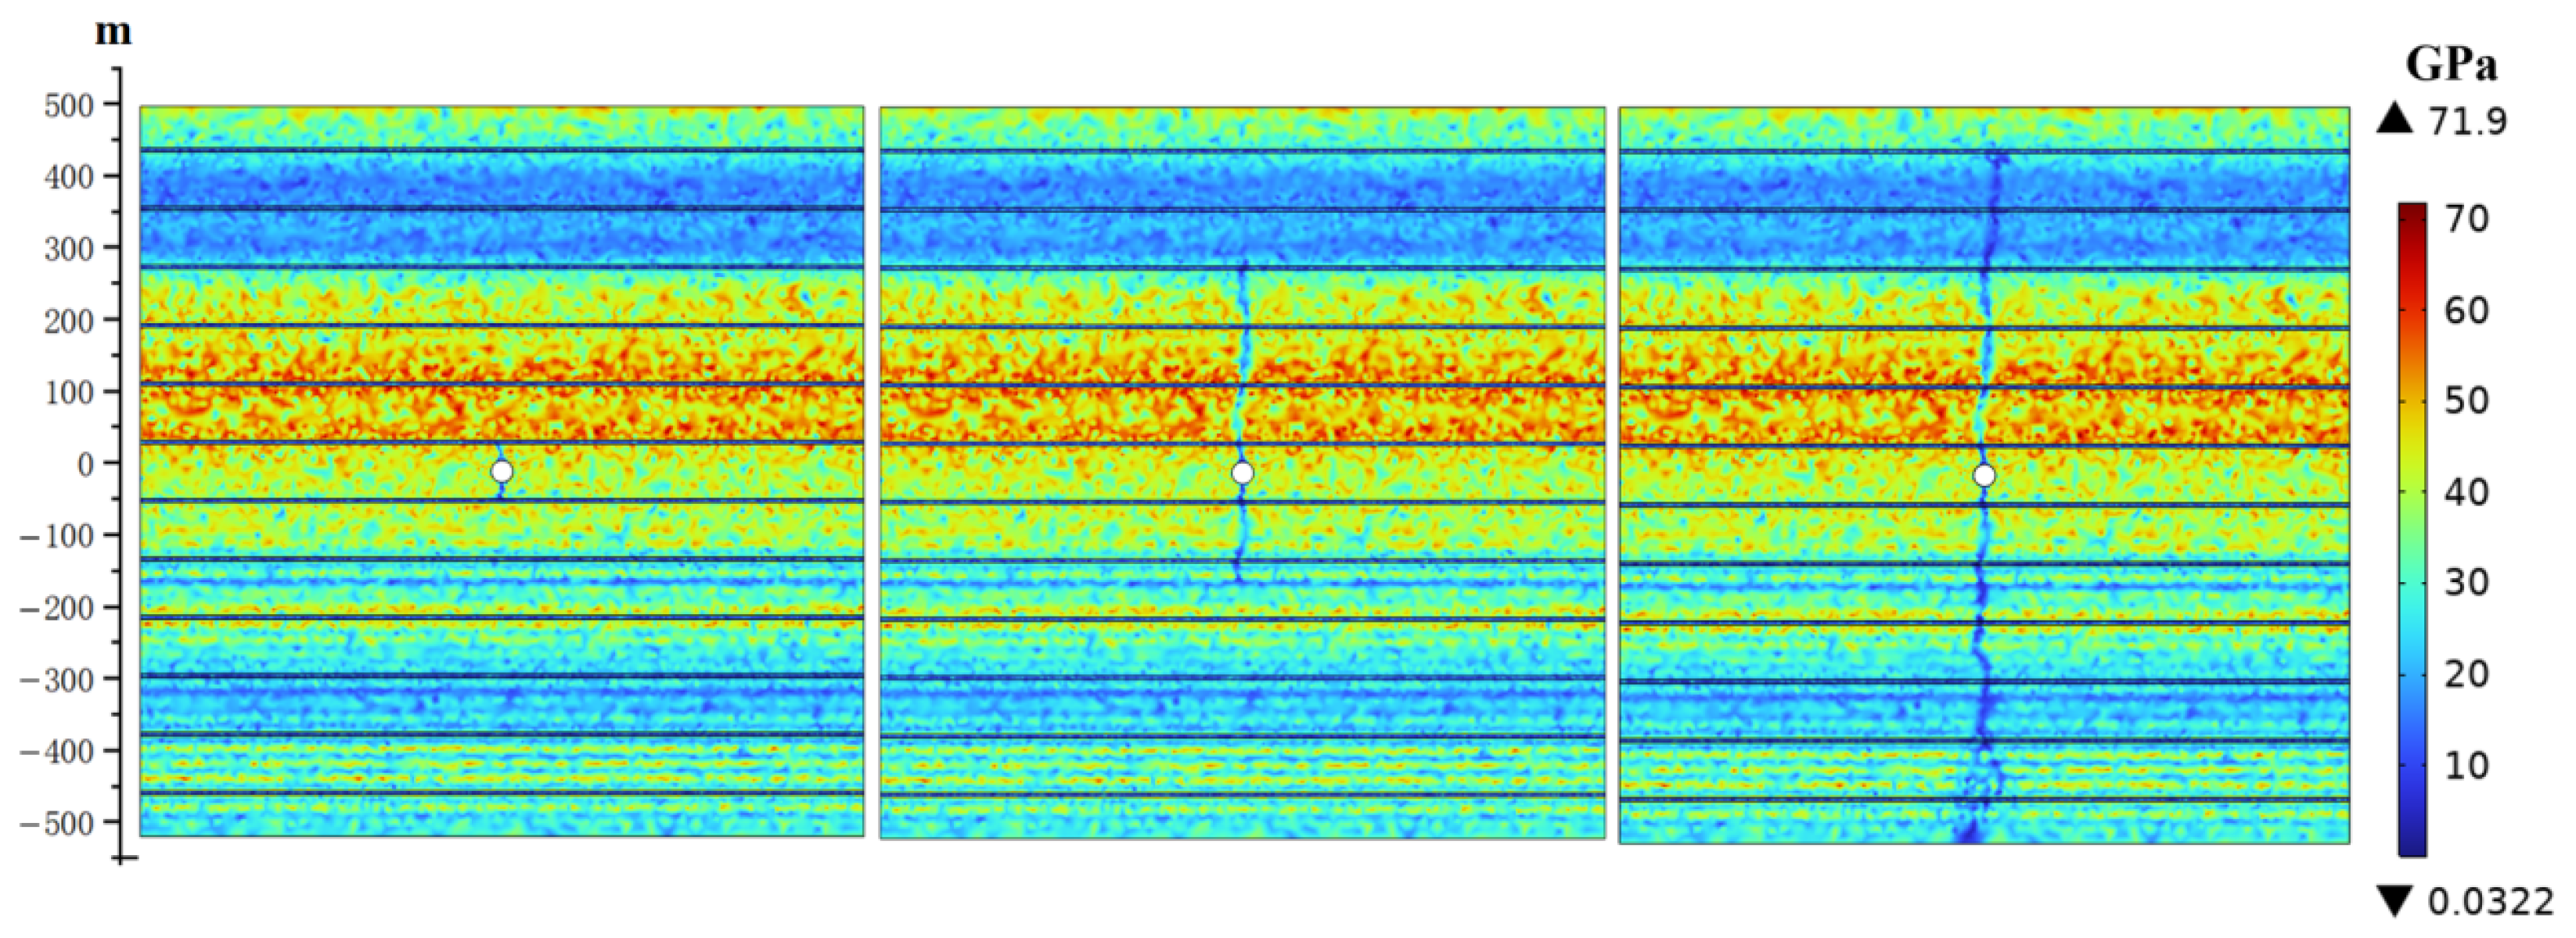
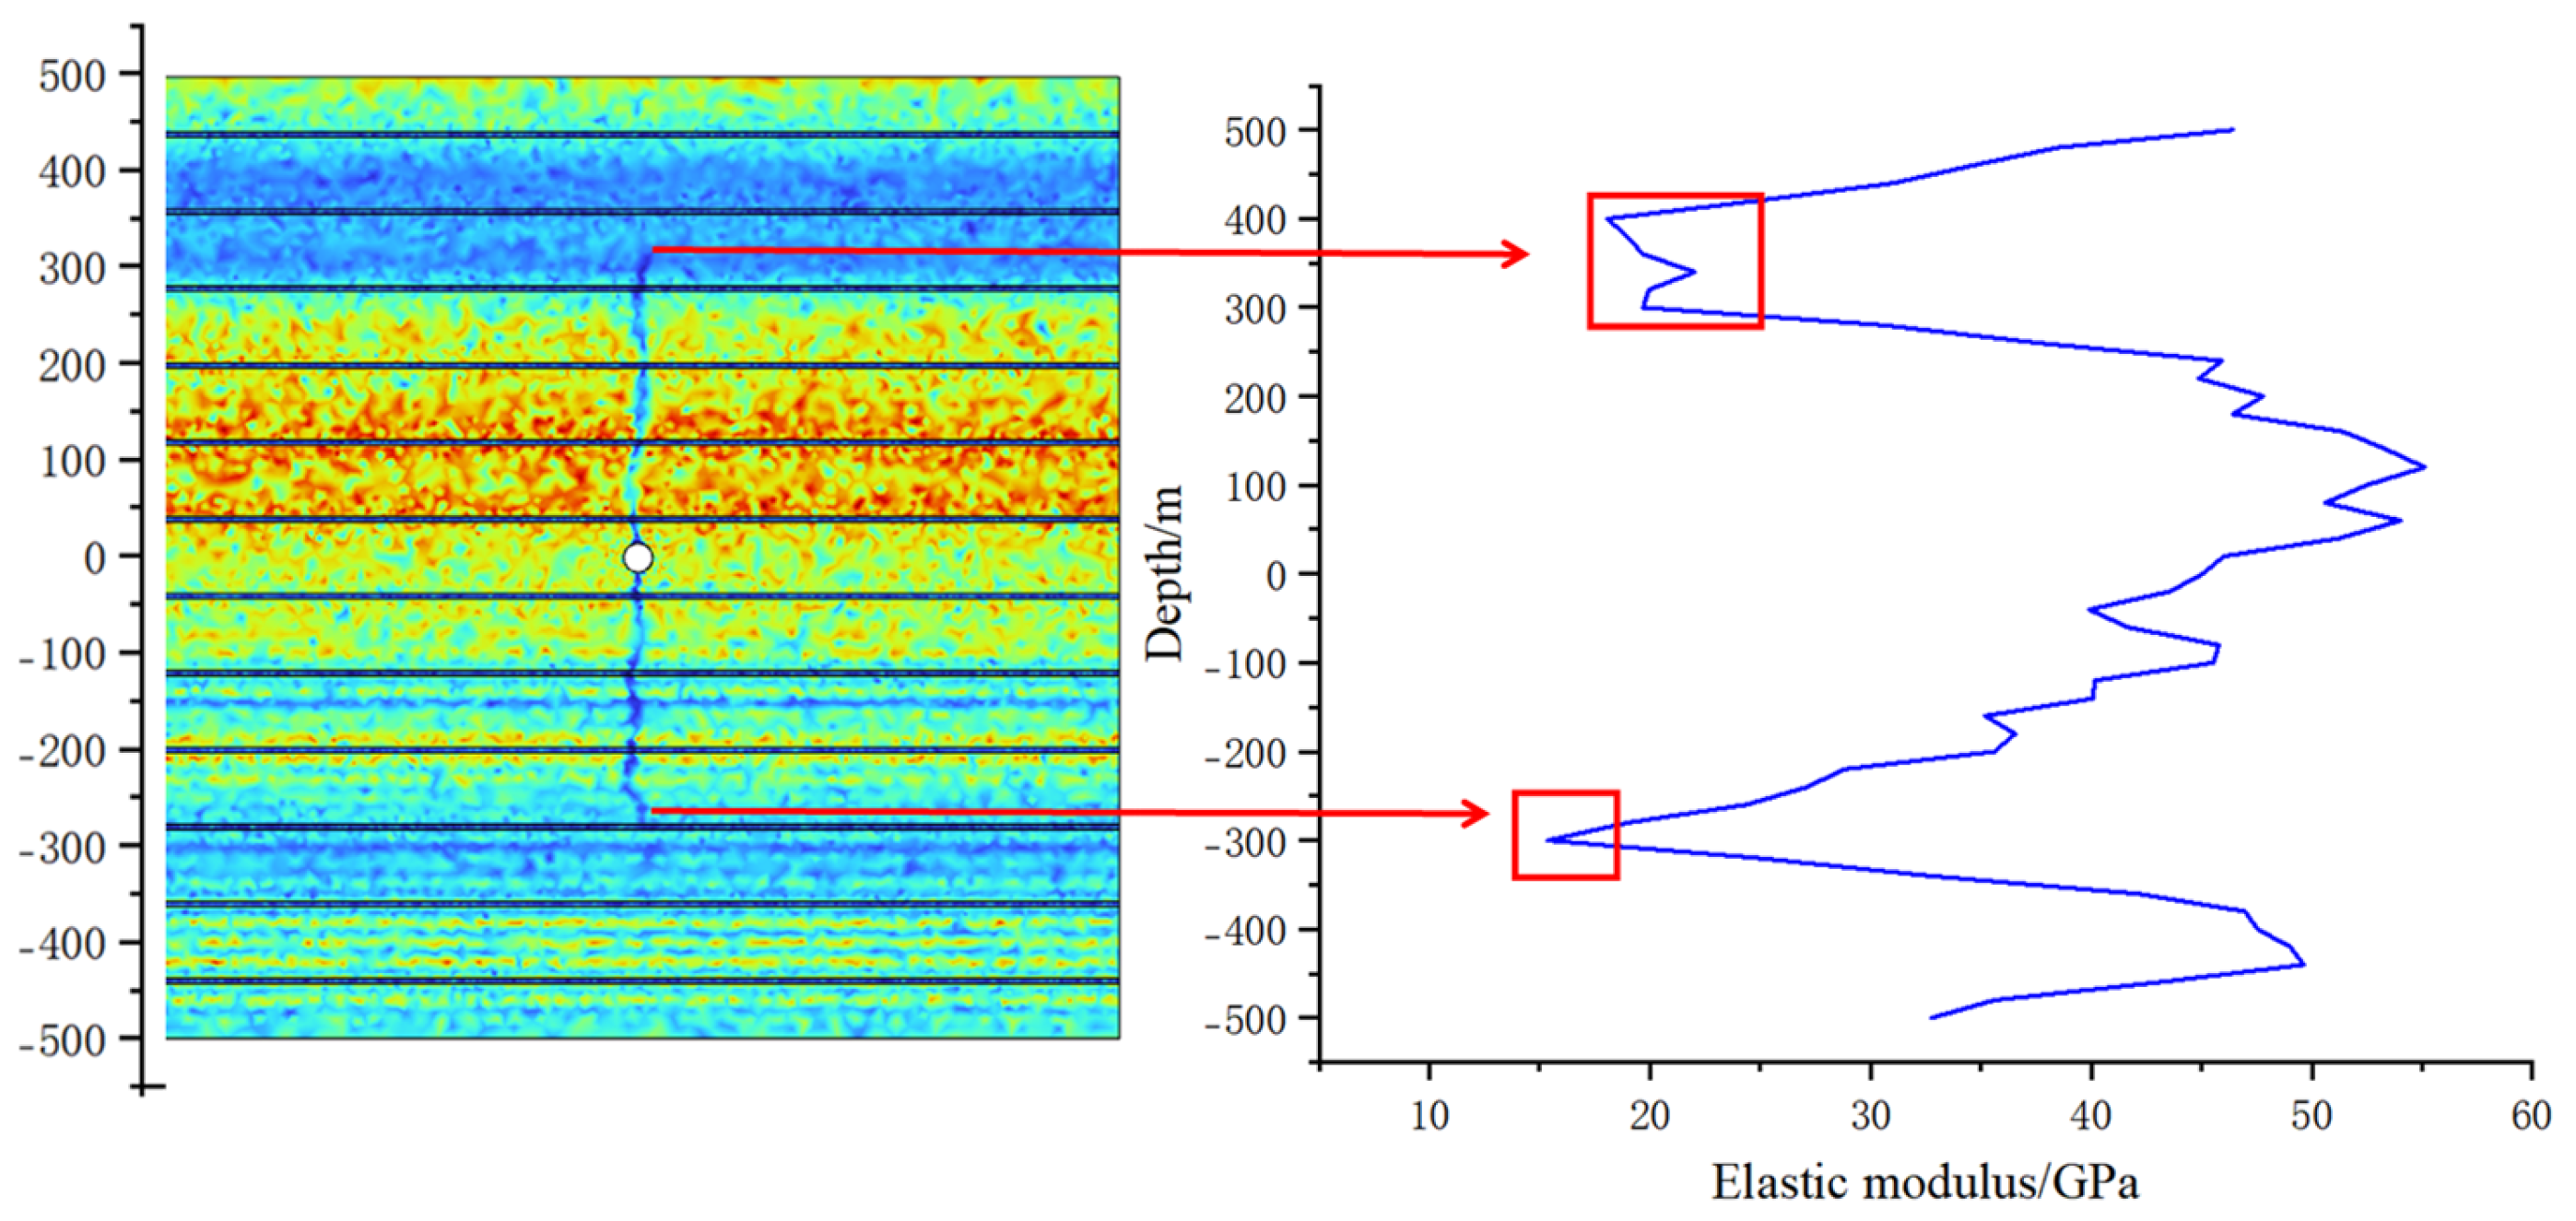
As illustrated in Figure 25, Model B exhibits the spatial distribution of elastic modulus within the reservoir and the corresponding fracture propagation pattern. During the initial hydraulic fracturing phase, fractures initiate from the horizontal wellbore and propagate symmetrically along the maximum principal stress direction (vertically oriented), manifesting bidirectional upward and downward extension. Upon intersecting the first bedding interface, the upper fracture enters a high elastic modulus zone (approximately 50 mm to 250 mm from the wellbore, Figure 26), where the propagation velocity increases significantly, enabling rapid penetration of this region. Subsequently, the fracture reaches a low elastic modulus zone in the upper reservoir (located 270 mm to 420 mm above the wellbore; Figure 26). Within this domain, the propagation rate decreases markedly, followed by sustained extension until hydraulic fracturing concludes in the upper reservoir section.
The propagation behavior of the lower hydraulic fracture differs from that of the upper fracture. After penetrating the first bedding interface, the lower fracture maintains a moderate propagation rate, corresponding to a medium-range elastic modulus zone within Model B. Subsequently, when the fracture extends to approximately −300 mm below the horizontal wellbore, it encounters the lowest elastic modulus region in the lower reservoir, resulting in a noticeable reduction in propagation speed. Following a sustained period of decelerated growth, the lower hydraulic fracture eventually completes its propagation.
Comparing the fracture propagation behavior of the upper and lower sections of the horizontal wellbore, it can be seen that the fracture propagation velocities are comparable during the initial stage. However, upon encountering zones of elevated elastic modulus, the fractures exhibit substantial acceleration in their propagation. Conversely, regions of reduced elastic modulus lead to decelerated fracture extension. Ultimately, fracturing completion occurs earlier in the lower reservoir, with the upper reservoir following shortly thereafter.

6.4.3. Hydraulic Fracture Propagation Under Homogenized Elastic Modulus Distribution

Figure 27 demonstrates that in a homogeneous elastic modulus distribution, hydraulic fractures propagate vertically and synchronously from the horizontal wellhead along the maximum principal stress direction, exhibiting symmetrical growth in both the upward and downward directions. Throughout the propagation process, the fracture velocities above and below the wellbore remain equal, maintaining vertical symmetry until the near-simultaneous completion of reservoir fracturing on both sides.
The comparative analysis reveals distinct fracture propagation behaviors under varying elastic modulus distributions. During the initial fracture initiation, all three models exhibit similar behavior, with simultaneous bidirectional expansion along the maximum stress direction. However, in the homogeneous model, the fracture propagation velocities remain consistent between the upper and lower segments, preserving symmetrical growth. In contrast, the models with heterogeneous elastic modulus distributions display divergent propagation patterns: the fractures decelerate in the low-elastic-modulus matrix layers while accelerating in the high elastic modulus regions, resulting in pronounced asymmetric growth dynamics. This demonstrates the significant influence of mechanical anisotropy on fracture propagation kinematics in shale reservoirs.

6.5. Hydraulic Fracture Propagation Mechanism

The simulation results demonstrate that hydraulic fracture propagation in shale reservoirs is influenced by the spatial distribution of elastic modulus. To elucidate the underlying mechanisms, this study investigates the relationship between the fracture behavior and elastic modulus anisotropy.

6.5.1. Discretized Elastic Modulus Distribution

In Case 1, where the elastic modulus was discretized, the fractures initiated from the horizontal wellbore and propagated vertically, aligned with the maximum principal stress direction. During the initial stage, the fractures exhibited symmetric extension in both the upper and lower regions due to the minimal variation in the elastic modulus near the wellbore. However, as propagation progressed, the increasing anisotropy in the elastic modulus led to asymmetric fracture growth. Specifically, the regions with a higher elastic modulus facilitated accelerated fracture propagation, whereas lower elastic modulus zones retarded fracture advancement.
This behavior can be attributed to mineralogical differences, as supported by the XRD analysis (Section 5). An elevated elastic modulus correlates with higher brittle mineral content (e.g., quartz, carbonates), reducing fracture resistance and promoting rapid crack propagation through brittle failure mechanisms [68,69,70,71]. Conversely, regions with a lower elastic modulus exhibit greater clay content, enhancing rock ductility. The resulting energy dissipation through plastic deformation inhibits fracture growth [72,73], explaining the slower propagation rates observed in these zones [3]. Consequently, under discretized elastic modulus conditions, hydraulic fractures develop asymmetrically due to the interplay between the lithological anisotropy and mechanical response.

6.5.2. Homogenized Elastic Modulus Distribution

In the homogenized elastic modulus model (i.e., Case 2), the hydraulic fractures initiated from the horizontal wellbore and propagated vertically, aligned with the maximum principal stress orientation. Due to the uniform mechanical properties of the reservoir, the fracture growth exhibited symmetric extension on both the upper and lower sides at comparable rates, with negligible deflection or branching. The absence of significant anisotropy allowed far-field stresses to dominate fracture propagation, resulting in a highly predictable and geometrically regular fracture geometry.
By contrast, heterogeneous shale reservoirs exhibit non-uniform elastic modulus distributions, leading to asymmetric hydraulic fracture propagation. Regions with an elevated elastic modulus, characterized by brittle mechanical behavior, facilitate fracture propagation due to efficient stress transfer. Conversely, zones with a reduced elastic modulus demonstrate ductile deformation tendencies, dissipating energy through plastic deformation and thereby retarding fracture advancement. This differential response underscores the influence of mechanical anisotropy on fracture network development in unconventional reservoirs.

6.5.3. Application and Generalization of Research Findings

Based on the refined testing and simulation of the Qingshankou Formation shale, this study confirms that the longitudinal mechanical heterogeneity serves as a controlling intrinsic factor for asymmetric fracture propagation. This mechanistic understanding can be extended to other shale reservoirs characterized by pronounced bedding development and mineralogical heterogeneity. In practical applications, the key lies in evaluating the anisotropic strength of the elastic modulus of the target interval—using cuttings or well-logging data—and comparing it with regional differences in the geostress. Where significant mechanical heterogeneity exists, the conclusions drawn from this study can provide direct reference for hydraulic fracturing design. The simulation outcomes presented herein are derived from prescribed in situ stress configurations and assumed interfacial strength parameters. Should the subsurface conditions involve markedly reduced bedding plane strength or a prevailing shear stress regime, fracture propagation would be more prone to diversion along the bedding planes. Such conditions could substantially modify or invalidate the vertically asymmetric fracture patterns predicted by the current model.

7. Conclusions

This study employed millimeter-scale indentation testing to characterize the anisotropy distribution of mechanical parameters using fragmented shale samples obtained from coring in Songliao Basin, Northern China. A high-resolution geomechanical model was developed using the mechanical properties derived from the indentation tests, assessing the impact of mechanical anisotropy on hydraulic fracture propagation. The key findings are as follows:
(1)
The elastic modulus of the Qingshankou Formation shale reservoir exhibits significant anisotropic properties in both the depth and bedding orientations. The elastic modulus measured parallel to bedding (10.23–65.08 Gpa; the average value is 30.85 GPa) is 28% higher than that measured perpendicular to bedding (9.60–47.24 GPa; the average value is 24.09 GPa) due to shale bedding anisotropy. The mineralogical composition predominantly governs the depth-dependent anisotropy, with an elevated brittle mineral content increasing the elastic modulus and higher clay content reducing it.
(2)
In contrast to the symmetric fracture growth predicted by conventional homogeneous elastic modulus models, the depth-dependent anisotropy of elastic modulus induces asymmetric hydraulic fracture propagation, with fractures preferentially extending along the orientations exhibiting a higher elastic modulus. This behavior arises due to the enhanced brittleness and reduced deformation resistance of high-modulus rocks, facilitating fracture advancement. Conversely, reservoirs with a lower elastic modulus display increased ductility, dissipating energy through plastic deformation and consequently inhibiting fracture propagation.
The assumption of homogeneous elastic modulus distribution in shale reservoirs, prevalent in prior studies, represents an oversimplification that fails to capture the inherent mechanical anisotropy of shale reservoirs. To address this discrepancy, advanced characterization methods must be employed to accurately quantify the anisotropy of mechanical properties. Reservoir stimulation strategies should account for the observed anisotropy, as elastic modulus variations directly influence the fracture propagation dynamics. Specifically, regions with an elevated elastic modulus exhibit preferential fracture extension due to reduced energy dissipation, whereas low-modulus zones impede fracture growth through enhanced plastic deformation. This mechanistic understanding challenges conventional fracture models predicated on uniform mechanical properties, providing a foundation for optimized fracturing design. In practical applications, perforation placement should target high-modulus intervals to facilitate fracture initiation, while low-modulus regions require tailored interventions, such as increased injection rates or viscous fracturing fluids, to mitigate the ductile suppression of fracture propagation. These insights underscore the necessity of integrating geomechanical anisotropy into hydraulic fracture modeling to enhance the stimulation efficacy and hydrocarbon recovery.
This study underscores the pivotal role of petrological heterogeneity, while noting that its relative significance is context-dependent and varies with the geological setting. The development of universally applicable predictive models for shale fracturing necessitates the integration of mineralogical models with in situ stress fields, diagenetic history, and natural fracture data. Moreover, net pressure fluctuations can introduce operational complexities; specifically, fracture-width narrowing at clay-rich ductile barriers, combined with potentially inadequate net pressure, elevates the risk of proppant bridging. Consequently, future research should couple heterogeneous fracture propagation models with multiphase flow simulations and rock creep models to quantitatively assess the long-term conductivity and drainage area of asymmetric fractures. Such an integrated approach would offer a more robust foundation for optimizing fracture design and production management strategies.

Author Contributions

Conceptualization, F.Y., J.S. and L.S.; methodology, Z.Z., Y.L. and M.L.; software, Z.Z., J.S., Y.L., L.S. and M.L.; investigation, L.S. and Z.Z.; writing—original draft preparation, Z.Z. and F.Y.; writing—review and editing, F.Y. and D.H.; validation, F.Y.; project administration, J.S., L.S. and D.H.; funding acquisition, F.Y. and J.S. All authors have read and agreed to the published version of the manuscript.

Funding

This work was supported by a Deep Earth Probe and Mineral Resources Exploration—National Science and Technology Major Project (No. 2025ZD1010200); the Engineering Research Center of Geothermal Resources Development Technology and Equipment, Ministry of Education, Jilin University; and the National Natural Science Foundation of China (Nos. 52309147 and 52179114).

Institutional Review Board Statement

Not applicable.

Informed Consent Statement

Not applicable.

Data Availability Statement

The original contributions presented in this study are included in the article; further inquiries regarding any progress can be directed to the corresponding author.

Conflicts of Interest

Author Litao Shang was employed by the company CNPC Engineering Technology R&D Co., Ltd. The remaining authors declare that the research was conducted in the absence of any commercial or financial relationships that could be construed as a potential conflict of interest.

References

  1. Sun, L.; Zou, C.; Jia, A.; Wei, Y.; Zhu, R.; Wu, S.; Guo, Z. Development characteristics and orientation of tight oil and gas in China. Pet. Explor. Dev. 2019, 46, 1015–1026. [Google Scholar] [CrossRef]
  2. Barati, R.; Liang, J.-T. A Review of Fracturing Fluid Systems Used for Hydraulic Fracturing of Oil and Gas Wells. J. Appl. Polym. Sci. 2014, 131, 40735. [Google Scholar] [CrossRef]
  3. Zhu, D.W.; Han, G.F.; Zou, H.L.; Cui, M.Y.; Liang, C.; Yao, F. A Review of the Hydraulic Fracturing in Ductile Reservoirs: Theory, Simulation, and Experiment. Processes 2022, 10, 2022. [Google Scholar]
  4. Ji, W.; Wan, J.; Li, J.; Chen, S.; Ma, H.; Yu, H. Integration of large-scale underground energy storage technologies and renewable energy sources. Adv. Geo-Energy Res. 2024, 14, 81–85. [Google Scholar] [CrossRef]
  5. Upton, G.B.; Yu, H. Labor demand shocks and earnings and employment differentials: Evidence from the U.S. shale oil & gas boom. Energy Econ. 2021, 102, 105462. [Google Scholar] [CrossRef]
  6. McMahon, T.P.; Larson, T.E.; Zhang, T.; Shuster, M. Geologic characteristics, exploration and production progress of shale oil and gas in the United States: An overview. Pet. Explor. Dev. 2024, 51, 925–948. [Google Scholar] [CrossRef]
  7. Soeder, D.J.; Borglum, S.J. 3—The revolutionary U.S. shale plays. In The Fossil Fuel Revolution: Shale Gas and Tight Oil; Soeder, D.J., Borglum, S.J., Eds.; Elsevier: Amsterdam, The Netherlands, 2019; pp. 63–107. [Google Scholar]
  8. Jew, A.D.; Druhan, J.L.; Ihme, M.; Kovscek, A.R.; Battiato, I.; Kaszuba, J.P.; Bargar, J.R.; Brown, G.E. Chemical and Reactive Transport Processes Associated with Hydraulic Fracturing of Unconventional Oil/Gas Shales. Chem. Rev. 2022, 122, 9198–9263. [Google Scholar] [CrossRef]
  9. Wang, Q.; Wang, P.; Xiang, D.; Feng, Y. Anisotropic property of mechanical parameters of shales. Nat. Gas Ind. 2012, 32, 62–65. [Google Scholar]
  10. Lin, C.; He, J.M.; Li, X.; Wan, X.L.; Zheng, B. An Experimental Investigation into the Effects of the Anisotropy of Shale on Hydraulic Fracture Propagation. Rock Mech. Rock Eng. 2017, 50, 543–554. [Google Scholar] [CrossRef]
  11. Heng, S.; Li, X.; Liu, X.; Chen, Y. Experimental study on the mechanical properties of bedding planes in shale. J. Nat. Gas Sci. Eng. 2020, 76, 103161. [Google Scholar] [CrossRef]
  12. Heng, S.; Yang, C.; Guo, Y.; Wang, C.; Wang, L. Influence of bedding planes on hydraulic fracture propagation in shale formations. Chin. J. Rock Mech. Eng. 2015, 34, 228–237. [Google Scholar]
  13. Wei, H. Research progress on fracture propagation patterns of hydraulic fracturing in heterogeneous shale. Pet. Geol. Recovery Effic. 2023, 30, 156–166. [Google Scholar]
  14. Eshkalak, M.O.; Al-Shalabi, E.W.; Sanaei, A.; Aybar, U.; Sepehrnoori, K. Simulation study on the CO2-driven enhanced gas recovery with sequestration versus the re-fracturing treatment of horizontal wells in the U.S. unconventional shale reservoirs. J. Nat. Gas Sci. Eng. 2014, 21, 1015–1024. [Google Scholar] [CrossRef]
  15. Alsuwaidi, E.S.; Xi, G.F.; Zimmerman, R.W. Mechanical characterization of Laffan and Nahr Umr anisotropic shales. J. Pet. Sci. Eng. 2021, 200, 108195. [Google Scholar] [CrossRef]
  16. Xie, J.; Lu, H.; Chen, L.; Jin, X.; Wang, D.; Fu, G. Micro scopic heterogeneity and mechanical anisotropy of the laminated shale in Longmaxi Formation. Bull. Geol. Sci. Technol. 2021, 40, 67–77. [Google Scholar]
  17. Dong, Q.; Kang, J.; Sun, J.S.; Li, J.J.; Zhang, Z. Experimental Study on Anisotropic Mechanical Characteristics of Shale under Triaxial Loading. Appl. Sci. 2024, 14, 3849. [Google Scholar] [CrossRef]
  18. Wang, P.T.; Cai, M.F.; Ren, F.H.; Li, C.H.; Yang, T.H. Theoretical investigation of deformation characteristics of stratified rocks considering geometric and mechanical variability. Geosci. J. 2017, 21, 213–222. [Google Scholar] [CrossRef]
  19. Li, Y.J.; Wang, S.T.; Zheng, L.G.; Zhao, S.K.; Zuo, J.P. Evaluation of the fracture mechanisms and criteria of bedding shale based on three-point bending experiment. Eng. Fract. Mech. 2021, 255, 107913. [Google Scholar] [CrossRef]
  20. Lin, R.; Peng, S.; Zhao, J.; Jiang, H.; Ren, L.; Zhou, B.; Wu, J.; Song, Y.; Shen, C. Deep/ultra-deep shale strength criterion: A case study of southern Sichuan Basin shale. Geoenergy Sci. Eng. 2024, 239, 212918. [Google Scholar] [CrossRef]
  21. Yan, D.; Zhao, L.; Wang, Y.; Zhang, Y.; Cai, Z.; Song, X.; Zhang, F.; Geng, J. Heterogeneity indexes of unconventional reservoir shales: Quantitatively characterizing mechanical properties and failure behaviors. Int. J. Rock Mech. Min. Sci. 2023, 171, 105577. [Google Scholar] [CrossRef]
  22. Yang, H.; Liu, Y.; Zhang, Q.; Xiong, D. Calculation method for geometric parameters of hydraulic fracture considering shear slip of shale bedding. Rock Soil Mech. 2023, 44, 461–472. [Google Scholar]
  23. Xiong, D.; Ma, X.F.; Yang, H.Q.; Liu, Y.; Zhang, Q.Q. Experimental and Numerical Simulation of Interlayer Propagation Path of Vertical Fractures in Shale. Front. Energy Res. 2021, 9, e797105. [Google Scholar] [CrossRef]
  24. Liu, Y.; Yang, H.; Zhang, Q.; Xiong, D. Properties of a shale bedding plane and its influence on the geometric parameters of fracture propagation in volume fracturing. Eng. Fract. Mech. 2022, 266, 108413. [Google Scholar] [CrossRef]
  25. Suo, Y.; Dong, M.; Fu, X.; He, W.; Pan, Z. Experimental and numerical simulation research on hot dry rock wellbore stability under different cooling methods. Geothermics 2024, 119, 102977. [Google Scholar] [CrossRef]
  26. Shan, L.; Liu, Y.; Du, K.; Paul, S.; Zhang, X.; Hei, X. Drilling rock image segmentation and analysis using segment anything model. Adv. Geo-Energy Res. 2024, 12, 89–101. [Google Scholar] [CrossRef]
  27. Zhao, G.; Guo, Y.; Yang, C.; Wang, L.; Guo, W.; Yang, H.; Wu, X.; Liu, H. Anisotropic mechanical behavior of ultra-deep shale under high in-situ stress, a case study in the Luzhou block of the southern Sichuan Basin, China. Int. J. Rock Mech. Min. Sci. 2023, 170, 105536. [Google Scholar] [CrossRef]
  28. Zhao, P.; Fan, X.; Wang, X.; Wang, X.; Zhou, X.; Zhang, Q.; Chen, Y. Geomechanical properties of laminated shale and bedding shale after water absorption: A case study of the Chang 7 shale in Ordos basin, China. Int. J. Rock Mech. Min. Sci. 2024, 180, 105798. [Google Scholar] [CrossRef]
  29. Iferobia, C.C.; Ahmad, M. A review on the experimental techniques and applications in the geomechanical evaluation of shale gas reservoirs. J. Nat. Gas Sci. Eng. 2020, 74, 103090. [Google Scholar] [CrossRef]
  30. Liu, H.Y.; Roquete, M.; Kou, S.Q.; Lindqvist, P.A. Characterization of rock heterogeneity and numerical verification. Eng. Geol. 2004, 72, 89–119. [Google Scholar] [CrossRef]
  31. Lei, Q.; Gao, K. A numerical study of stress variability in heterogeneous fractured rocks. Int. J. Rock Mech. Min. Sci. 2019, 113, 121–133. [Google Scholar] [CrossRef]
  32. Yin, Y.C.; Tan, Y.L.; Guo, W.Y.; Zhang, M.L. Research Advances of Heterogeneity Representation Methods for Rocks; Taishan Academic Forum—Project on Mine Disaster Prevention and Control; Education Deptartment Shandong Province: Qingdao, China, 2014; pp. 327–332. [Google Scholar]
  33. Wang, M.M.; Shao, X.Z.; Pan, X.H. Effect of bedding dip angle and dynamic load on spatial variation of microscopic failure stress of shale. Sci. Rep. 2023, 13, 3885. [Google Scholar] [CrossRef]
  34. Wu, M.; Gao, K.; Liu, J.; Song, Z.; Huang, X. Influence of rock heterogeneity on hydraulic fracturing: A parametric study using the combined finite-discrete element method. Int. J. Solids Struct. 2022, 234–235, 111293. [Google Scholar] [CrossRef]
  35. Huang, L.; Liu, J.; Zhang, F.; Dontsov, E.; Damjanac, B. Exploring the influence of rock inherent heterogeneity and grain size on hydraulic fracturing using discrete element modeling. Int. J. Solids Struct. 2019, 176–177, 207–220. [Google Scholar] [CrossRef]
  36. Lin, R.; Ren, L.; Zhao, J.; Tan, X.; Rasouli, V.; Wang, X.; Wu, J.; Song, Y.; Shen, C. Stress and pressure dependent permeability of shale rock: Discrete element method (DEM) simulation on digital core. J. Pet. Sci. Eng. 2022, 208, 109797. [Google Scholar] [CrossRef]
  37. Ju, Y.; Liu, P.; Chen, J.; Yang, Y.; Ranjith, P.G. CDEM-based analysis of the 3D initiation and propagation of hydrofracturing cracks in heterogeneous glutenites. J. Nat. Gas Sci. Eng. 2016, 35, 614–623. [Google Scholar] [CrossRef]
  38. Chunyu, Z.; Yulong, Z.; Youbin, C.; Nanfeng, C.; Lei, C. Understanding indentation-induced elastic modulus degradation of ductile metallic materials. Mater. Sci. Eng. A 2017, 696, 445–452. [Google Scholar] [CrossRef]
  39. Oliver, W.C.; Pharr, G.M. An improved technique for determining hardness and elastic-modulus using load and displacement sensing indentation experiments. J. Mater. Res. 1992, 7, 1564–1583. [Google Scholar] [CrossRef]
  40. Fan, Z.; Wei, H.; HANqun, G.; Dawei, H.; Qian, S.; Jianfu, S. Nanoindentation tests on granite after heat treatment. Rock Soil Mech. 2018, 39, 235–243. [Google Scholar]
  41. Magnenet, V.; Auvray, C.; Francius, G.; Giraud, A. Determination of the matrix indentation modulus of Meuse/Haute-Marne argillite. Appl. Clay Sci. 2011, 52, 266–269. [Google Scholar] [CrossRef]
  42. Villeneuve, M.C.; Heap, M.J.; Kushnir, A.R.L.; Qin, T.; Baud, P.; Zhou, G.L.; Xu, T. Estimating in situ rock mass strength and elastic modulus of granite from the Soultz-sous-Forts geothermal reservoir (France). Geotherm. Energy 2018, 6, 11. [Google Scholar] [CrossRef]
  43. Luo, Y.; Zhang, Y.; Liu, R.; Hu, D.; Zhou, H.; Xiao, H. Study of obtaining elastic modulus of tight sandstone based on mm-indentation test. Rock Soil Mech. 2023, 44, 1089. [Google Scholar]
  44. Liu, H.; Meng, S.; Wang, S.; Dong, K.; Yang, L.; Tao, J.; Liang, L. Mechanical characteristics and fracture propagation mechanisms of the Gulong shale. Oil Gas Geol. 2023, 44, 820–828. [Google Scholar]
  45. Cao, D.; Han, J.; Xiao, J.F.; Liu, Q.; Fu, F.; Liu, D. Method for evaluating the brittleness of shale minerals under the constraints of elastic characteristics. Chin. J. Geophys. 2023, 66, 4781–4791. [Google Scholar]
  46. Wei, Z. Nanoidentation Behavior of Clay Minerals and Clay-Based Nonstructured Multilayers. Ph.D. Thesis, Louisiana State University and Mechanical College, Baton Rouge, LA, USA, 2009. [Google Scholar]
  47. Tuzingila, R.M.; Kong, L.; Koy Kasongo, R. A review on experimental techniques and their applications in the effects of mineral content on geomechanical properties of reservoir shale rock. Rock Mech. Bull. 2024, 3, 100110. [Google Scholar] [CrossRef]
  48. Liu, L.; Ge, Z.; Zhou, Z.; Li, Z.; Deng, Q. Mineral composition, pore structure and mechanical properties of coal measure strata rocks: A case study of Pingdingshan Coalfield. Sci. Total Environ. 2024, 952, 175944. [Google Scholar] [CrossRef]
  49. Suo, Y.; Su, X.; He, W.; Fu, X.; Pan, Z. Fracability evaluation of sandstone-shale interbedded reservoir in Daqingzijing area, Songliao Basin. Chin. J. Rock Mech. Eng. 2024, 43, 2140–2151. [Google Scholar]
  50. Li, T.; Li, L.; Tang, C.A.; Zhang, Z.; Li, M.; Zhang, L.; Li, A. A coupled hydraulic-mechanical-damage geotechnical model for simulation of fracture propagation in geological media during hydraulic fracturing. J. Pet. Sci. Eng. 2019, 173, 1390–1416. [Google Scholar] [CrossRef]
  51. Xia, Y.; Yao, M.; Li, T.; Yang, H.; Tang, C. Numerical analysis of hydraulic fracture propagation in deep shale reservoir with different injection strategies. J. Rock Mech. Geotech. Eng. 2024, 16, 3558–3574. [Google Scholar] [CrossRef]
  52. Zhang, Y.; Li, Y.; Zheng, H.; Fan, B. A novel fully coupled thermo-hydro-mechanical-damage model for hydraulic fracture propagation in fractured geothermal reservoirs. Comput. Geotech. 2025, 185, 107364. [Google Scholar] [CrossRef]
  53. Li, L.C.; Tang, C.A.; Wang, S.Y.; Yu, J. A coupled thermo-hydrologic-mechanical damage model and associated application in a stability analysis on a rock pillar. Tunn. Undergr. Space Technol. 2013, 34, 38–53. [Google Scholar] [CrossRef]
  54. Carcione, J.M. Chapter 7—Biot theory for porous media. In Wave Fields in Real Media, 4th ed.; Carcione, J.M., Ed.; Elsevier: Amsterdam, The Netherlands, 2022; pp. 329–511. [Google Scholar]
  55. Yazdani Bejarbaneh, B.; Jahed Armaghani, D.; Mohd Amin, M.F. Strength characterisation of shale using Mohr–Coulomb and Hoek–Brown criteria. Measurement 2015, 63, 269–281. [Google Scholar] [CrossRef]
  56. Xue, Y.; Liu, S.; Chai, J.; Liu, J.; Ranjith, P.G.; Cai, C.; Gao, F.; Bai, X. Effect of water-cooling shock on fracture initiation and morphology of high-temperature granite: Application of hydraulic fracturing to enhanced geothermal systems. Appl. Energy 2023, 337, 120858. [Google Scholar] [CrossRef]
  57. Zhu, W.C.; Wei, J.; Zhao, J.; Niu, L.L. 2D numerical simulation on excavation damaged zone induced by dynamic stress redistribution. Tunn. Undergr. Space Technol. 2014, 43, 315–326. [Google Scholar] [CrossRef]
  58. Rutqvist, J.; Tsang, C.-F. A study of caprock hydromechanical changes associated with CO2-injection into a brine formation. Environ. Geol. 2002, 42, 296–305. [Google Scholar] [CrossRef]
  59. Huang, T.; Liu, Y.; He, J.; Ye, T.; Deng, H.; Li, R.; Li, K.; Zhang, J. Evaluation method and engineering application of in-situ stress of deep tight sandstone reservoir in the second member of Xujiahe Formation in Xiaoquan-Fenggu area, western Sichuan. Geol. China 2024, 51, 89–104. [Google Scholar]
  60. Suo, Y.; Li, Z.H.; Fu, X.F.; Zhang, C.C.; Jia, Z.J.; Peng, D.Z.; He, W.Y.; Pan, Z.J. Comprehensive study of hydraulic fracturing in shale oil reservoirs comprising shale-sandstone transitions. Phys. Fluids 2024, 36, 077161. [Google Scholar] [CrossRef]
  61. Shen, M.; Zhang, C.; Yan, X.; Wang, L.; Wu, Y.; Jin, X. Research progress and prospects of utilizing carbon-based nanomaterials in enhanced oil recovery. Adv. Geo-Energy Res. 2024, 14, 201–214. [Google Scholar] [CrossRef]
  62. You, J.; Lee, K.J. Experimental Characterization and Pore-Scale Modeling of Iron Precipitation in Shale Reservoirs by Interacting with Hydraulic Fracturing Fluid. Energy Fuels 2022, 36, 12997–13006. [Google Scholar] [CrossRef]
  63. Hubbert, M.K.; Willis, D.G. Mechanics of Hydraulic Fracturing. Trans. AIME 1957, 210, 153–168. [Google Scholar] [CrossRef]
  64. Haimson, B.; Fairhurst, C. Initiation and Extension of Hydraulic Fractures in Rocks. Soc. Pet. Eng. J. 1967, 7, 310–318. [Google Scholar] [CrossRef]
  65. Liu, X.; Qian, L.; Li, M.; Pan, Y.; Su, R. Study on the complexity of hydraulic fracture network in shale reservoirs considering the bedding planes encoutering the natural fractures. J. Eng. Geol. 2024, 32, 1309–1321. [Google Scholar]
  66. Zhang, X.; Wang, J.G.; Gao, F.; Ju, Y.; Liu, J. Impact of water and nitrogen fracturing fluids on fracturing initiation pressure and flow pattern in anisotropic shale reservoirs. Comput. Geotech. 2017, 81, 59–76. [Google Scholar] [CrossRef]
  67. Liu, Q.; Liang, B.; Sun, W.J.; Zhao, H.; Hao, J.F.; Hou, M.R. Experimental Study on Hydraulic Fracturing of Bedding Shale Considering Anisotropy Effects. Acs Omega 2022, 7, 22698–22713. [Google Scholar] [CrossRef] [PubMed]
  68. Huang, H.; Lu, S.; Zhang, P.; Zhi, Q.; Wang, J.; Lin, Z. Evaluation of Lacustrine Shale Brittleness and Its Controlling Factors: A Case Study from the Jurassic Lianggaoshan Formation, Sichuan Basin. Processes 2023, 11, 493. [Google Scholar] [CrossRef]
  69. Yang, Z.Q.; Lu, H.J.; Zhang, R.; Zhang, Z.T.; Ren, L.; Zhang, L.B.; Zhang, A.L. Triaxial high temperature mechanical properties of longmaxi shale at different depths. Therm. Sci. 2023, 27, 3817–3822. [Google Scholar] [CrossRef]
  70. Hou, B.; Chen, M.; Li, Z.; Wang, Y.; Diao, C. Propagation area evaluation of hydraulic fracture networks in shale gas reservoirs. Pet. Explor. Dev. 2014, 41, 833–838. [Google Scholar] [CrossRef]
  71. Miao, F.; Peng, Z.; Wang, C.; Yue, Y.; Wang, Z. Gas-Bearing Capacity and Controlling Factors of Niutitang Formation Shale in Well XZD-1, Western Margin of Xuefeng Uplift. Earth Sci. 2019, 44, 3662–3677. [Google Scholar]
  72. Yan, D.; Zhao, L.; Song, X.; Tang, J.; Zhang, F. Fracability evaluation model for unconventional reservoirs: From the perspective of hydraulic fracturing performance. Int. J. Rock Mech. Min. Sci. 2024, 183, 105912. [Google Scholar] [CrossRef]
  73. Can, S.; Botao, L. Principles and influencing factors for shale formations. Pet. Sci. Bull. 2021, 6, 92–113. [Google Scholar]
Figure 1. Rock samples were taken from the Qingshankou Formation in the northern part of the Songliao Basin.
Applsci 16 02534 g001
Figure 2. Schematic diagram of fragmented and plug sample preparation.
Applsci 16 02534 g002
Figure 3. Preparation process of shale samples for millimeter-scale indentation testing: (a) shale fragments; (b) polishing sandpaper; (c) dry-polished shale; (d) processed sample.
Applsci 16 02534 g003
Figure 4. Millimeter indentation test system.
Applsci 16 02534 g004
Figure 7. Typical displacement–load curves of vertical and parallel bedding indentation experiments. (a) typical displacement-load curve of vertical bedding direction. (b) typical displacement-load curve of parallel bedding direction.
Applsci 16 02534 g007
Figure 8. Variation curve of shale elastic modulus with depth in vertical and parallel bedding directions. (a) shale elastic modulus with depth in vertical bedding direction. (b) shale elastic modulus with depth in parallel bedding direction.
Applsci 16 02534 g008
Figure 9. Schematic diagram of millimeter indentation test [43].
Applsci 16 02534 g009
Figure 10. Elastic modulus curves of shale with different beddings.
Applsci 16 02534 g010
Figure 11. Mineral composition of shale at different depths. (a) Mineral composition at 2325.98 m; (b) Mineral composition at 2326.10 m; (c) Mineral composition at 2327.50 m; (d) Mineral composition at 2330.62 m; (e) Mineral composition at 2332.58 m; (f) Mineral composition at 2336.92 m.
Applsci 16 02534 g011aApplsci 16 02534 g011b
Figure 12. Relationship between clay mineral content and elastic modulus.
Applsci 16 02534 g012
Figure 13. Conceptual model of hydraulic fracturing in bedding shale.
Applsci 16 02534 g013
Figure 14. CT scan images of shale.
Applsci 16 02534 g014
Figure 15. Mesh generation.
Applsci 16 02534 g015
Figure 16. Model geometry and boundary conditions.
Applsci 16 02534 g016
Figure 17. Assignment of discretized reservoir elastic modulus: (a) Model A; (b) Model B.
Applsci 16 02534 g017
Figure 18. Homogenized elastic modulus reservoir model (Weibull random distribution).
Applsci 16 02534 g018
Figure 19. Geometry and boundary conditions of the model.
Applsci 16 02534 g019
Figure 20. Comparison of model crack initiation pressure results.
Applsci 16 02534 g020
Figure 21. Fracture initiation patterns in discretized elastic modulus distribution reservoir: (a) Model A; (b) Model B.
Applsci 16 02534 g021aApplsci 16 02534 g021b
Figure 22. Fracture initiation pattern in homogenized elastic modulus distribution reservoir.
Applsci 16 02534 g022
Figure 23. Fracture propagation in discretized elastic modulus distribution Model A.
Applsci 16 02534 g023
Figure 24. Slower propagation speed in low elastic modulus regions of Model A.
Applsci 16 02534 g024
Figure 25. Fracture propagation in discretized elastic modulus distribution Model B.
Applsci 16 02534 g025
Figure 26. Slower propagation speed in low elastic modulus regions of Model B.
Applsci 16 02534 g026
Figure 27. Homogenized elastic modulus distribution and fracture propagation in reservoir.
Applsci 16 02534 g027
Table 1. Mineral composition table.
LocationBrittle Mineral Content (%)Clay Mineral Content (%)Elastic Modulus/GPa
(Parallel to Bedding)
2325.98 m65.77.257.46
2326.10 m35.264.813.85
2327.50 m81.29.365.26
2330.62 m5742.134.01
2332.58 m42.157.914.11
2336.92 m43.955.713.37
Table 2. Calculation parameters for shale hydraulic fracturing.
ParametersBeddingRock Matrix
Case 1: Discretized Elastic Modulus/GPa15 (Weibull random distribution)Discretized based on experimental data
Case 2: Homogenized Elastic Modulus/GPa15 (Weibull random distribution)29.20 (Weibull random distribution)
Poisson’s Ratio0.250.18
Density/kg/m316002600
Friction Angle/°1518
Tensile Strength/MPa1020
Compressive Strength/MPa100200
Initial Permeability/mD0.10.01
Initial Porosity0.050.013
Biot’s Coefficient/(−)0.50.5
Table 3. Parameter settings in the validated model.
ParametersValue
Elastic Modulus/GPa29.2
Poisson’s Ratio0.25
Density/kg/m32600
Friction Angle/°18
Tensile Strength/MPa20
Compressive Strength/MPa200
Initial Permeability/mD0.01
Initial Porosity0.013
Biot’s Coefficient/(−)0.1
Disclaimer/Publisher’s Note: The statements, opinions and data contained in all publications are solely those of the individual author(s) and contributor(s) and not of MDPI and/or the editor(s). MDPI and/or the editor(s) disclaim responsibility for any injury to people or property resulting from any ideas, methods, instructions or products referred to in the content.