Article

Long-Term Performance Trends and Benchmark Progression in Elite Men’s Swimming Across Five Olympic Cycles (2008–2028)


1
Doctoral School of Health Sciences, Faculty of Health Sciences, University of Pécs, 7621 Pécs, Hungary
2
Heart and Vascular Centre, Semmelweis University, 1085 Budapest, Hungary
3
Department of Sports Medicine, Semmelweis University, 1085 Budapest, Hungary
4
Institute of Physiotherapy and Sport Science, Faculty of Health Sciences, University of Pécs, 7621 Pécs, Hungary
5
Sports and Recreation Centre, Széchenyi István University, 9026 Győr, Hungary
6
Physical Activity Research Group, Szentágothai Research Center, University of Pécs, 7624 Pécs, Hungary
*
Author to whom correspondence should be addressed.
Appl. Sci. 2026, 16(5), 2341; https://doi.org/10.3390/app16052341
Submission received: 12 February 2026 / Revised: 25 February 2026 / Accepted: 26 February 2026 / Published: 28 February 2026
(This article belongs to the Special Issue Physical Activity and Optimization of Physical Function)

Abstract

Over the past two decades, Olympic swimming performance has improved. However, less attention has been given to the evolution of Olympic Qualification Time (OQT) standards. This retrospective observational study analyzed event-specific qualification standards for all male pool swimming events. Data were extracted from publicly available documents and competition reports. Descriptive statistics, percentage change calculations, Pearson correlation analysis, and paired-sample t-tests between Olympic cycles from 2008 to 2028 were performed. For 2028, the OQTs were defined as the 14th fastest entry time from the 2024 Olympic Games. Across all events, the mean cumulative reduction in OQTs between Beijing 2008 and Los Angeles 2028 was 2.86 ± 0.54%, corresponding to an average proportional decrease of 0.6% per Olympic cycle, with trend analysis confirming statistical significance (p < 0.001). Event-level analysis revealed the greatest tightening in the 100 m breaststroke (−3.74%) and 100 m butterfly (−3.25%). When grouped by distance, sprint events (50–100 m) showed the strongest overall tightening (−3.57%), followed by middle-distance (200–400 m, −2.08%) and long-distance (800–1500 m, −2.45%). When grouped by stroke, butterfly (−3.28%) and freestyle (−3.20%) showed the largest decrease, whereas individual medley (−2.29%) demonstrated the smallest decrease. A strong positive correlation was observed between OQT tightening and Olympic performance improvement across events (r = 0.74). These findings indicate that OQTs have become demanding and broadly aligned with elite performance progression, providing applied benchmarks for coaches and performance staff.

1. Introduction

Swimming is one of the core sports of the Olympic Games and is characterized by global participation, high visibility, and continuous scientific interest in elite performance. Access to Olympic competition is regulated through Olympic Qualification Time (OQT) standards, which define the minimum performance required for participation and strongly influence both the competitive field and national representation. As performance levels increase over time, qualification standards play an increasingly important role in shaping who can compete at the Olympic Games [1,2,3,4].
Previous research has consistently shown that elite swimming performances have improved across Olympic cycles, and that gender-related performance differences have also evolved over time [5]. Longitudinal analyses of race results demonstrate steady reductions in race times at the international level, although the rate of improvement appears to be slowing in recent decades, suggesting that physiological and technical limits may be approaching [1,2,3]. Trend analyses and forecasting studies further support the presence of long-term performance progression, particularly in sprint and middle-distance events, while improvements in longer distances tend to be smaller and more variable [4].
Beyond performance progression itself, several studies have emphasized the importance of qualification and competition structure. Analyses of elite competitions show that race outcomes and performance distributions differ between qualification rounds and finals, highlighting that entry standards do not always reflect typical final-level performance [6,7]. These findings suggest that qualification benchmarks and competitive performance may evolve at different rates.
Across recent Olympic cycles, Olympic Qualification Time standards have been derived from performances at the preceding Olympic Games. For the Beijing 2008, London 2012, and Rio de Janeiro 2016 Olympic Games, qualification standards were primarily based on the 16th-place finishing time achieved in the preliminary heats of each event. For the Tokyo 2021 Olympic Games, Olympic Qualification Time standards were tightened by adopting the 14th-place preliminary time. For the Paris 2024 Olympic Games, qualification standards were set using the 14th-place preliminary time from the Tokyo 2021 Olympic Games. A major change in Olympic qualification policy has been introduced for the Los Angeles 2028 Olympic Games. For the first time, World Aquatics defined Olympic Qualification Time standards as the 14th fastest entry time achieved at the Paris Olympic Games. This approach directly links qualification standards to recent Olympic performance levels and marks a clear change from earlier qualification standards. From a performance perspective, this approach provides a unique opportunity to examine how qualification benchmarks align with recent elite performance density.
The present study focuses on all individual male Olympic pool swimming events. All distances (50–1500 m) and all disciplines (freestyle, backstroke, breaststroke, butterfly, and individual medley) are covered. These events represent a broad spectrum of physiological and metabolic demands, ranging from predominantly anaerobic, high-power sprint performances (50 m) to mixed aerobic–anaerobic middle-distance efforts (200–400 m) and predominantly aerobic endurance performances (1500 m). Sprint events are characterized by high neuromuscular power output, anaerobic glycolytic contribution, and maximal velocity maintenance, whereas longer-distance events rely more heavily on aerobic capacity, efficiency, and pacing strategy. By including the full range of Olympic pool events, the present analysis captures qualification standards across distinct athlete profiles [8].
Recent work has documented long-term performance progression and competition-level trends in elite swimming using longitudinal race datasets, including analyses across Olympic cycles and performance tiers [9]. Other studies have highlighted that performances achieved at major championships may differ systematically from season-best or qualification-phase performances, suggesting that competition context and selection systems can influence observed performance distributions [6]. However, despite the central role of Olympic Qualification Time standards in regulating access to the Olympic Games, the long-term evolution of these standards themselves has received comparatively limited quantitative attention relative to race result analyses. By quantifying event-, distance-, and stroke-specific tightening of Olympic Qualification Time standards across five Olympic cycles and relating these changes to elite Olympic performance benchmarks, the present study extends the literature by providing an applied, policy-relevant view of how qualification thresholds track elite performance development. The aim of this study was to analyze changes in Olympic Qualification Time standards in swimming from the Beijing 2008 Olympic Games to the Los Angeles 2028 Olympic Games and quantify the rate at which qualification standards have tightened across Olympic cycles. It was hypothesized that Olympic Qualification Time standards would demonstrate a systematic proportional decrease across Olympic cycles, reflecting long-term improvements in elite swimming performance. It was further expected that the decrease would be more pronounced in sprint events (50–100 m), characterized by high anaerobic power output, compared with middle- and long-distance events, which rely more heavily on aerobic metabolism [8]. Additionally, we hypothesized that qualification standards would closely track changes in Olympic final performance density across events. By examining event-specific, distance-based, and stroke-based patterns, this study provides insight into how closely qualification standards track performance development. Addressing these standards is important for understanding whether Olympic qualification benchmarks accurately reflect the evolution of world-class swimming performance and for evaluating their broader implications for athletes, coaches, national federations, and global Olympic participation. Over recent decades, the international swimming calendar has also become increasingly dense, with expanded World Championship programs and continental competitions. This intensified competition schedule may influence athlete preparation cycles, peak performance timing, and potentially career longevity. Although the present study does not directly examine career duration, understanding how qualification standards evolve within an increasingly demanding competitive environment provides additional context for long-term athlete development planning. Understanding the trajectory of qualification standards is essential for national federations and coaches to align long-term development models with evolving international benchmarks.

2. Materials and Methods

This study was designed as a retrospective observational analysis of publicly available Olympic Qualification Time standards and elite Olympic performance data across five Olympic cycles.

2.1. Data Sources

OQTs were collected for all men’s swimming events from the Beijing 2008 Olympic Games through the Los Angeles 2028 Olympic Games. Qualification standards for the 2008–2024 Olympic cycles were obtained from official publications of FINA, World Aquatics, or International Olympic Committee qualification system documents [10,11,12,13,14,15]. For the Los Angeles 2028 Olympic Games, qualification standards were derived from official World Aquatics documentation, in which OQTs are defined as the 14th fastest entry time achieved at the Paris 2024 Olympic Games. This approach directly links qualification benchmarks to recent elite performance density at the Olympic level. Performance data were obtained from Olympic semifinals and finals between Beijing 2008 and Paris 2024, using the 6th-place performance as a representative benchmark of final-level competition. Changes in performance times were calculated across cycles and compared with corresponding changes in OQTs by event, distance category, and stroke.
The dataset comprised official Olympic competition performance times for all individual male Olympic pool swimming events (50–1500 m, freestyle, backstroke, breaststroke, butterfly, and individual medley). The athlete population represented elite international swimmers competing at the Olympic level. For each event and Olympic cycle, the following variables were extracted: official OQTs, sixth-place final performance times, event distance, stroke category, and Olympic cycle year. All data were recorded in seconds and organized at the event level for comparative and longitudinal analysis.
Inclusion criteria comprised all individual male Olympic pool swimming events that were part of the official Olympic program between Beijing 2008 and Los Angeles 2028 and for which official OQTs were published. Events introduced in later cycles (e.g., 800 m freestyle) were included in event-specific analyses but excluded from full-period (2008–2028) cumulative calculations where historical data were not available. Open-water events, relay events, and female events were excluded from the present analysis to maintain methodological consistency and comparability across Olympic cycles. In total, 13 individual male pool swimming events were included in the main longitudinal analysis.
All data used in this study were obtained from publicly available sources; therefore, ethical approval was not required.

2.2. Performance Comparison

To evaluate whether changes in OQTs reflect actual performance development, OQT tightening was compared with improvements in elite Olympic performance.

2.3. Statistical Analysis

All Olympic swimming events were included. Events introduced in later Olympic cycles were excluded from long-term averages but analyzed separately where appropriate.
For each event, percentage changes in OQTs were calculated between consecutive Olympic cycles. Total percentage changes between Beijing 2008 and Los Angeles 2028 were also computed. Events were grouped by distance category (sprint: 50–100 m, middle-distance: 200–400 m, and long-distance: 800–1500 m) and by stroke (freestyle, backstroke, breaststroke, butterfly, and individual medley).
Descriptive statistics were used to summarize OQTs and elite Olympic performance times across Olympic cycles. For each event, percentage changes in OQTs were calculated between consecutive Olympic Games and across the full study period (Beijing 2008 to Los Angeles 2028). Percentage changes were computed using relative differences between cycles to allow standardized comparison across events with different race distances.
Event-level analyses were performed for all Olympic swimming events. In addition, events were grouped by distance category (sprint: 50–100 m; middle-distance: 200–400 m; long-distance: 800–1500 m) and by stroke (freestyle, backstroke, breaststroke, butterfly, and individual medley) to examine broader performance patterns. Aggregated percentage changes were calculated within each group to assess systematic differences in qualification tightening across event categories.
To examine the relationship between changes in OQTs and changes in elite Olympic performance, Pearson product–moment correlation analysis was conducted at the event level. For this analysis, OQT tightening from Beijing 2008 to Paris 2024 was compared with corresponding changes in elite Olympic performance over the same period. Elite performance was represented by sixth-place finishing times from Olympic semifinals and finals, as this position reflects a stable benchmark of final-level competitive performance.
To account for differences in race distance and time scale across events, long-term trends in OQTs were evaluated using two complementary approaches. First, qualification times were log-transformed prior to linear regression analysis, allowing trends to be interpreted as proportional changes across Olympic cycles. Second, event-level percentage changes relative to Beijing 2008 were calculated and analyzed across cycles. In both approaches, the Olympic cycle was treated as a continuous predictor variable. The regression slope coefficient was interpreted as the average proportional change per Olympic cycle.
Statistical significance was set at p < 0.05. Correlation strength was interpreted using conventional thresholds (small: r = 0.10–0.29; moderate: r = 0.30–0.49; large: r ≥ 0.50). Continuous variables (qualification times and performance times) are presented as absolute values in seconds. Percentage changes between Olympic cycles are reported as relative differences (%). Aggregated event-level changes are presented as means ± standard deviations, and ranges are provided where appropriate. Given the aggregated event-level nature of the dataset and the small sample size (n = 13 events), the correlation results were interpreted descriptively. All data processing, percentage calculations, and statistical analyses were performed using Microsoft Excel (Version 16.83,Microsoft Corporation, Redmond, WA, USA). Given the use of publicly available aggregated data, no assumptions regarding normality or homogeneity of variance were violated.
It should be noted that national federations may apply additional or more stringent qualification criteria beyond the official OQTs defined by World Aquatics and the IOC. The present analysis focuses exclusively on the international OQTs to ensure comparability across Olympic cycles.
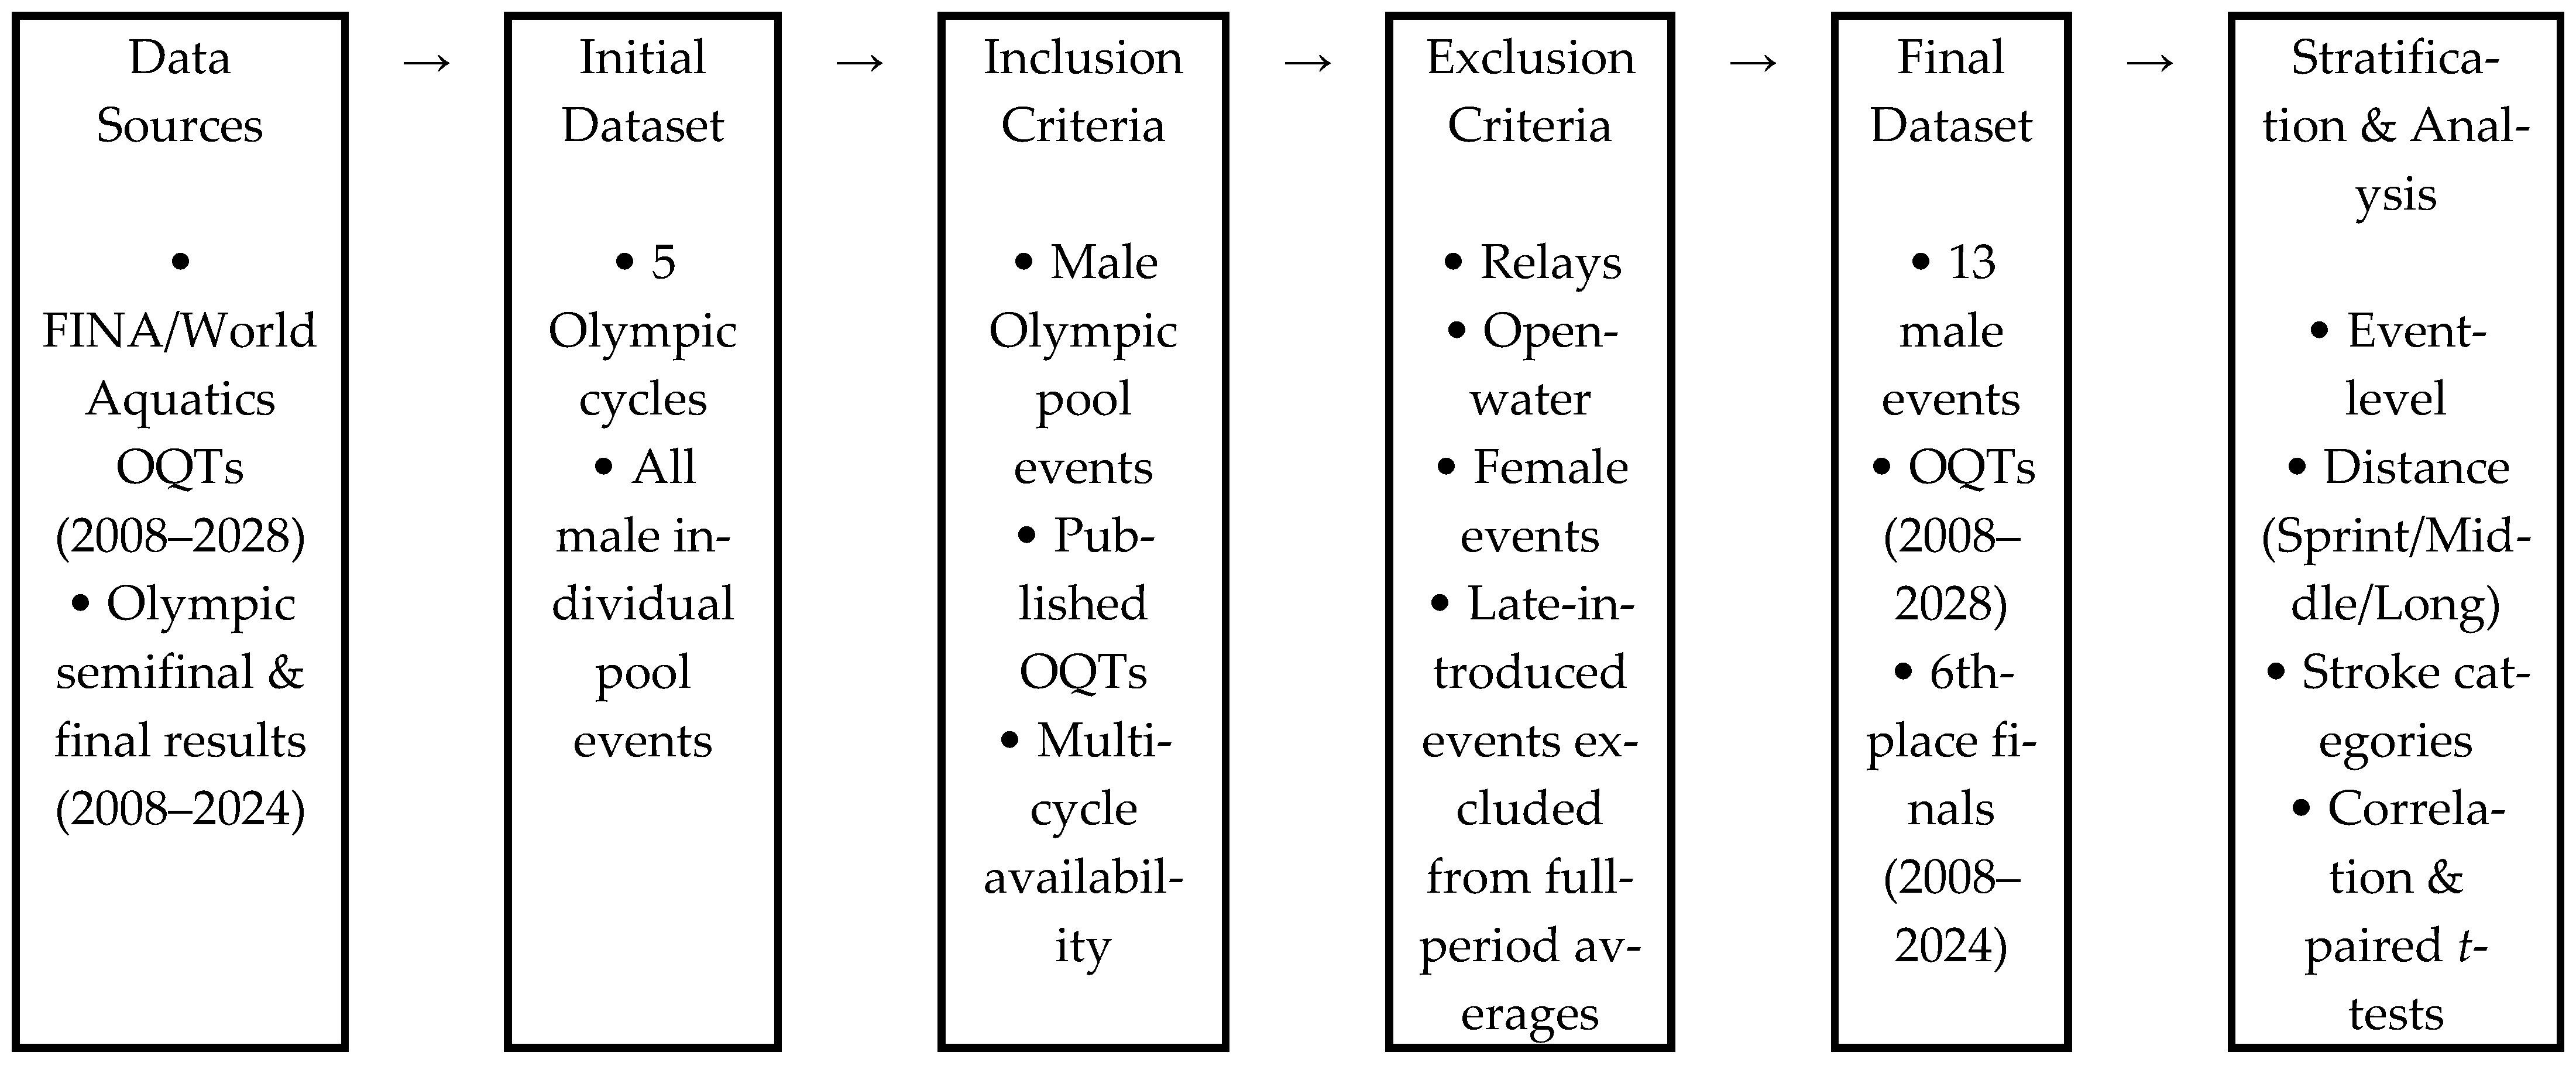
A graphical summary of the study design and data stratification process is presented in Figure 1.

3. Results

3.1. Event-Level Changes in Olympic Qualification Time Standards (2008–2028)

This subsection examines event-specific changes in Olympic Qualification Time (OQT) standards across Olympic cycles from Beijing 2008 to Los Angeles 2028. Percentage changes were calculated between consecutive cycles and cumulatively across the full study period to quantify qualification tightening at the event level. OQT values became progressively faster from Beijing 2008 to Los Angeles 2028 across all men’s events (Table 1). The total decrease in qualifying time between Beijing and Los Angeles (Beijing → Los Angeles) ranged from −1.95% (400 m freestyle) to −3.74% (100 m backstroke and 100 m breaststroke). Other large total reductions were observed in the 100 m butterfly (−3.25%), 200 m backstroke (−3.07%), and 200 m individual medley (−3.18%). The Paris → Los Angeles tightening varied by event (Table 2). The largest Paris → Los Angeles changes occurred in the 200 m backstroke (−1.23%), 100 m backstroke (−1.23%), 50 m freestyle (−1.09%), and 100 m butterfly (−1.03%). Smaller Paris → Los Angeles changes were observed in the 200 m breaststroke (−0.25%), 400 m individual medley (−0.29%), and 200 m individual medley (−0.34%) (Table 2). Overall, these findings demonstrate a consistent and event-specific decrease in OQTs across Olympic cycles, with particularly pronounced reductions in 100 m events. Across all 13 events, the mean cumulative reduction in OQTs between Beijing 2008 and Los Angeles 2028 was 2.86 ± 0.54%.
Paired-sample t-tests revealed statistically significant reductions in OQTs between Beijing and London (p < 0.001) and between Tokyo and Paris (p = 0.031). Other consecutive cycle comparisons did not reach statistical significance (p > 0.05), although Rio to Tokyo (p = 0.088) and Paris to Los Angeles (p = 0.075) showed near-significant trends.

3.2. Distance-Based Changes in Olympic Qualification Time Standards (2008–2028)

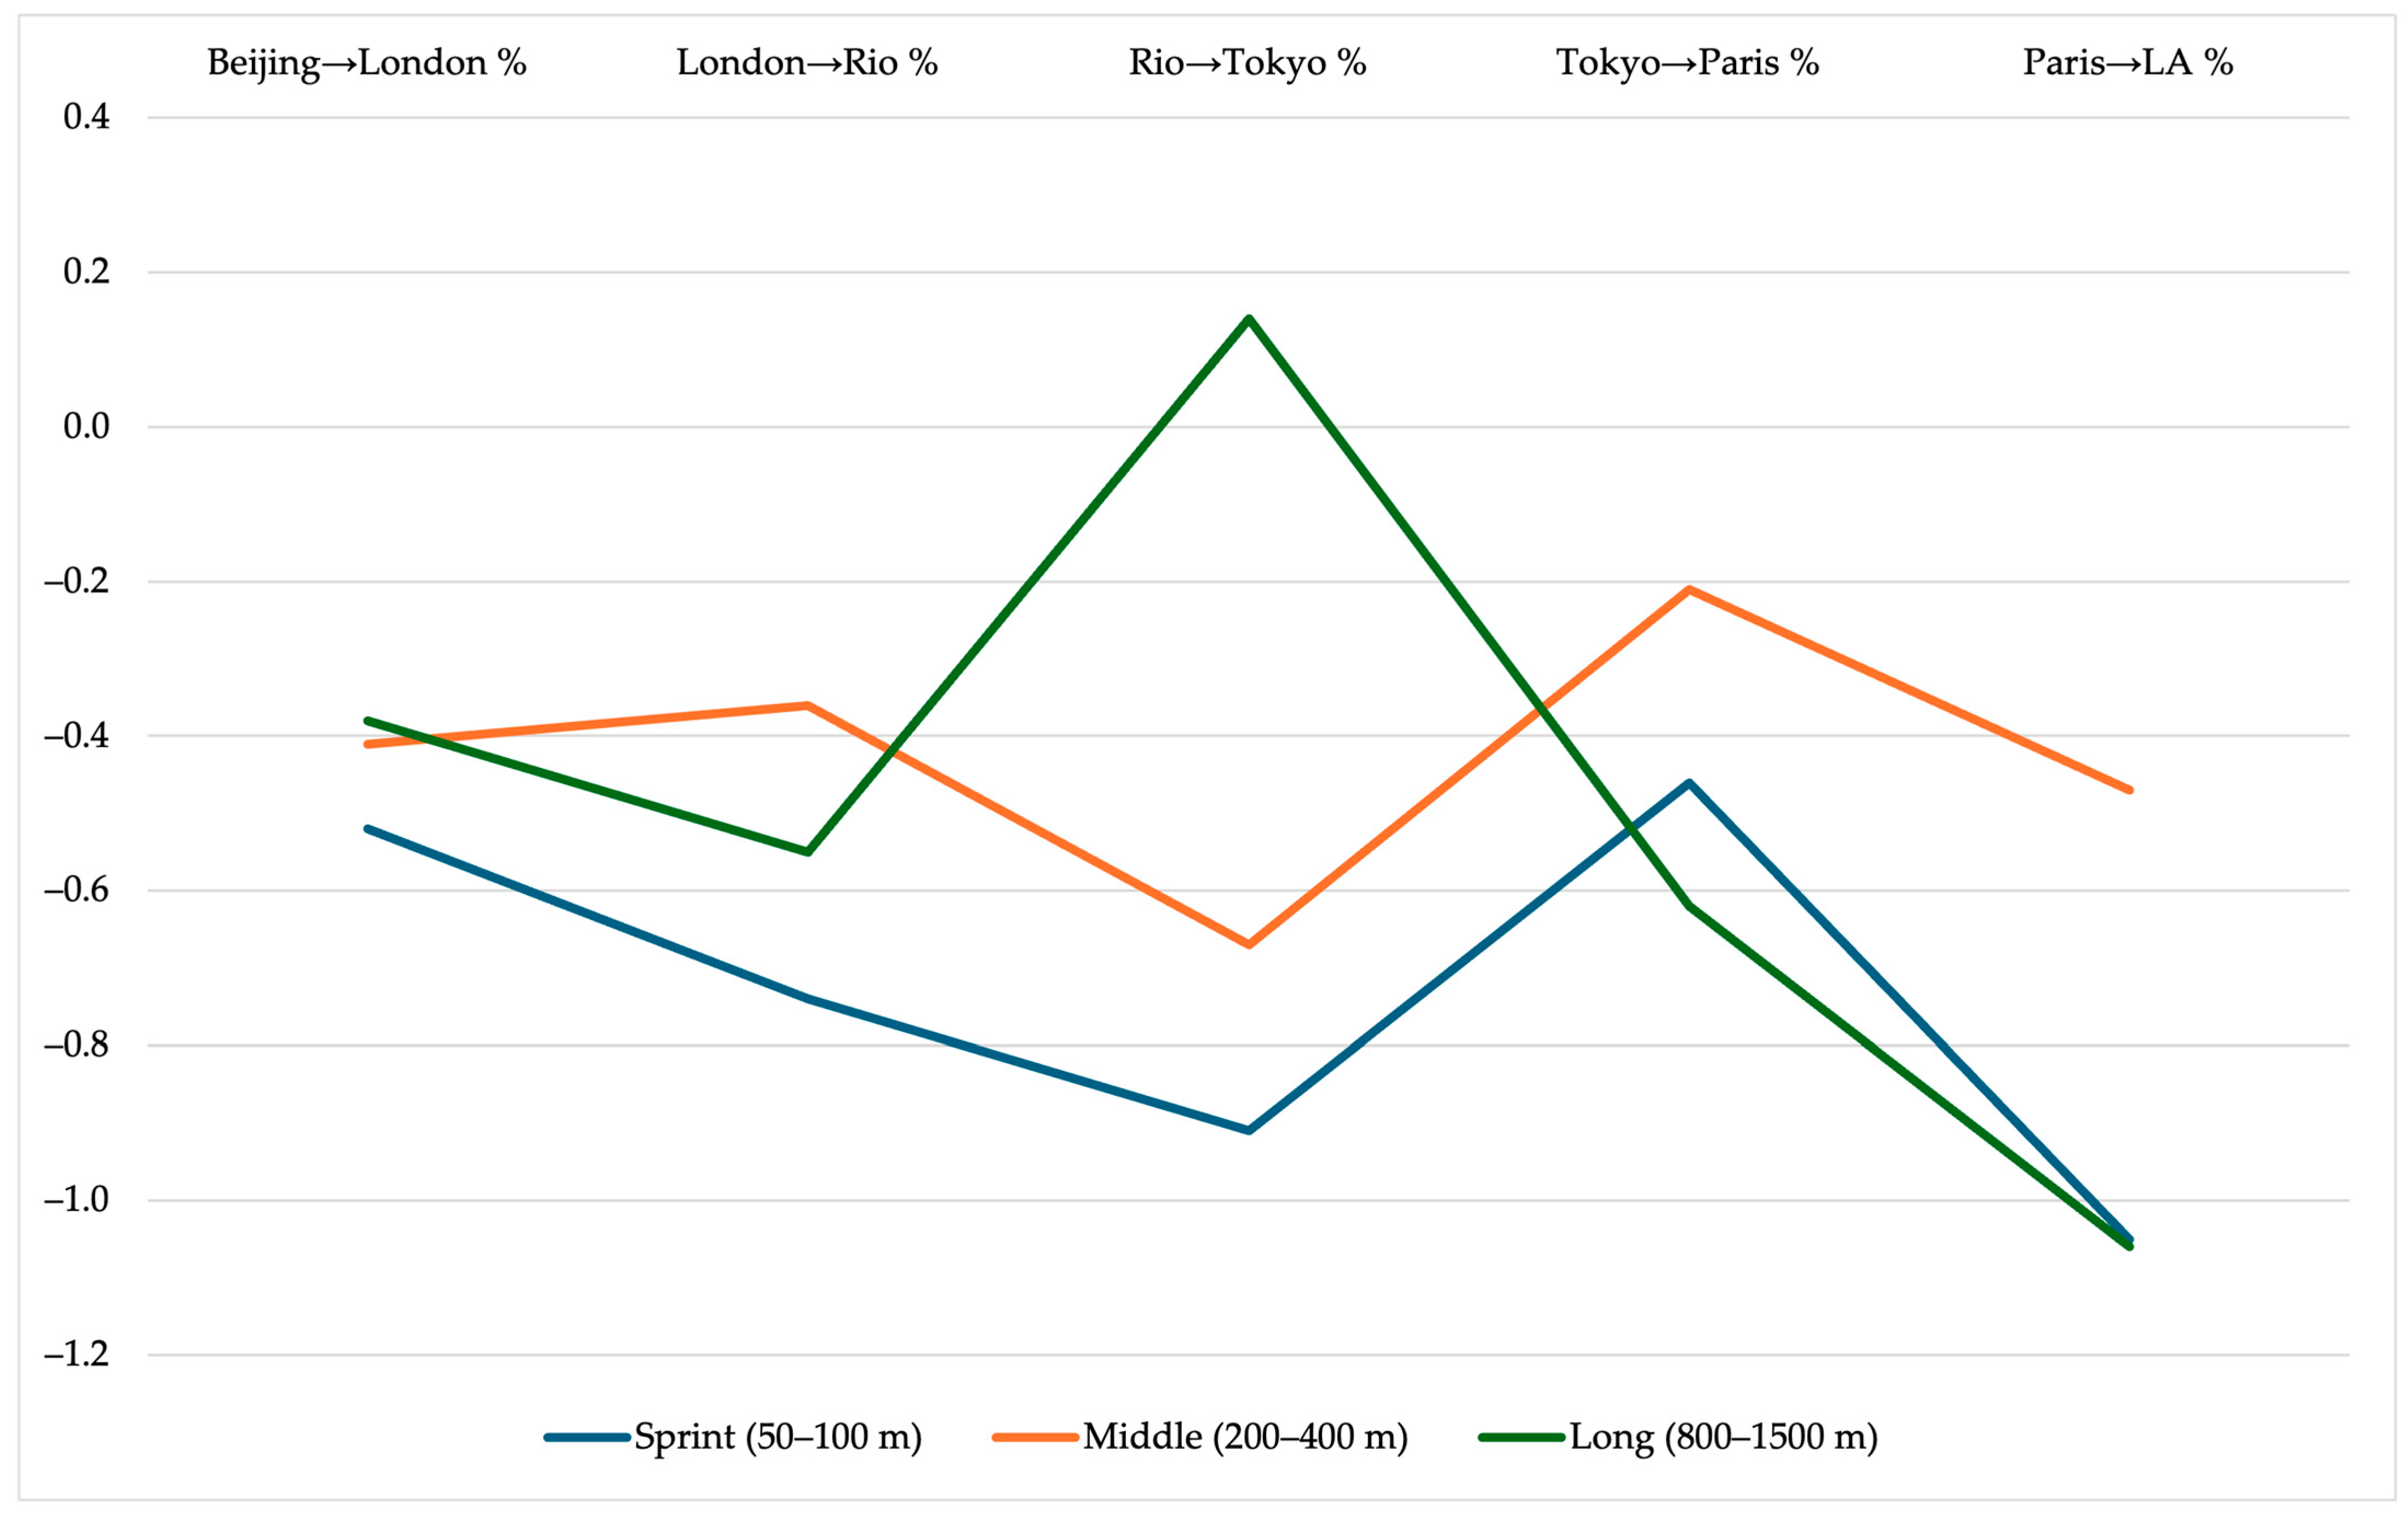
When grouped by distance category, sprint events (50–100 m) showed the largest total tightening (Table 3). The total change was −3.57% for sprint events (Beijing → Los Angeles), compared with −2.08% for middle-distance events (200–400 m) and −2.45% for long-distance events (800–1500 m). The Paris → Los Angeles tightening was −1.05% for sprint, −0.47% for middle-distance, and −1.06% for long-distance events (Table 3, Figure 2).
Paired-sample t-tests at the distance-category level demonstrated statistically significant tightening in sprint events between Beijing and London (p = 0.006), Rio and Tokyo (p = 0.002), Tokyo and Paris (p = 0.031), and Paris and Los Angeles (p = 0.008).
For middle-distance events, significant reductions were observed between Beijing and London (p < 0.001), Rio and Tokyo (p = 0.026), and Paris and Los Angeles (p = 0.003).
For the full 2008–2028 series, statistical testing was not applicable for the long-distance category because only the 1500 m freestyle was available across all cycles; the 800 m freestyle was introduced later and was therefore analyzed descriptively.
These findings indicate that qualification tightening was most consistent within sprint and middle-distance categories across Olympic cycles.

3.3. Stroke-Based Changes in Olympic Qualification Time Standards

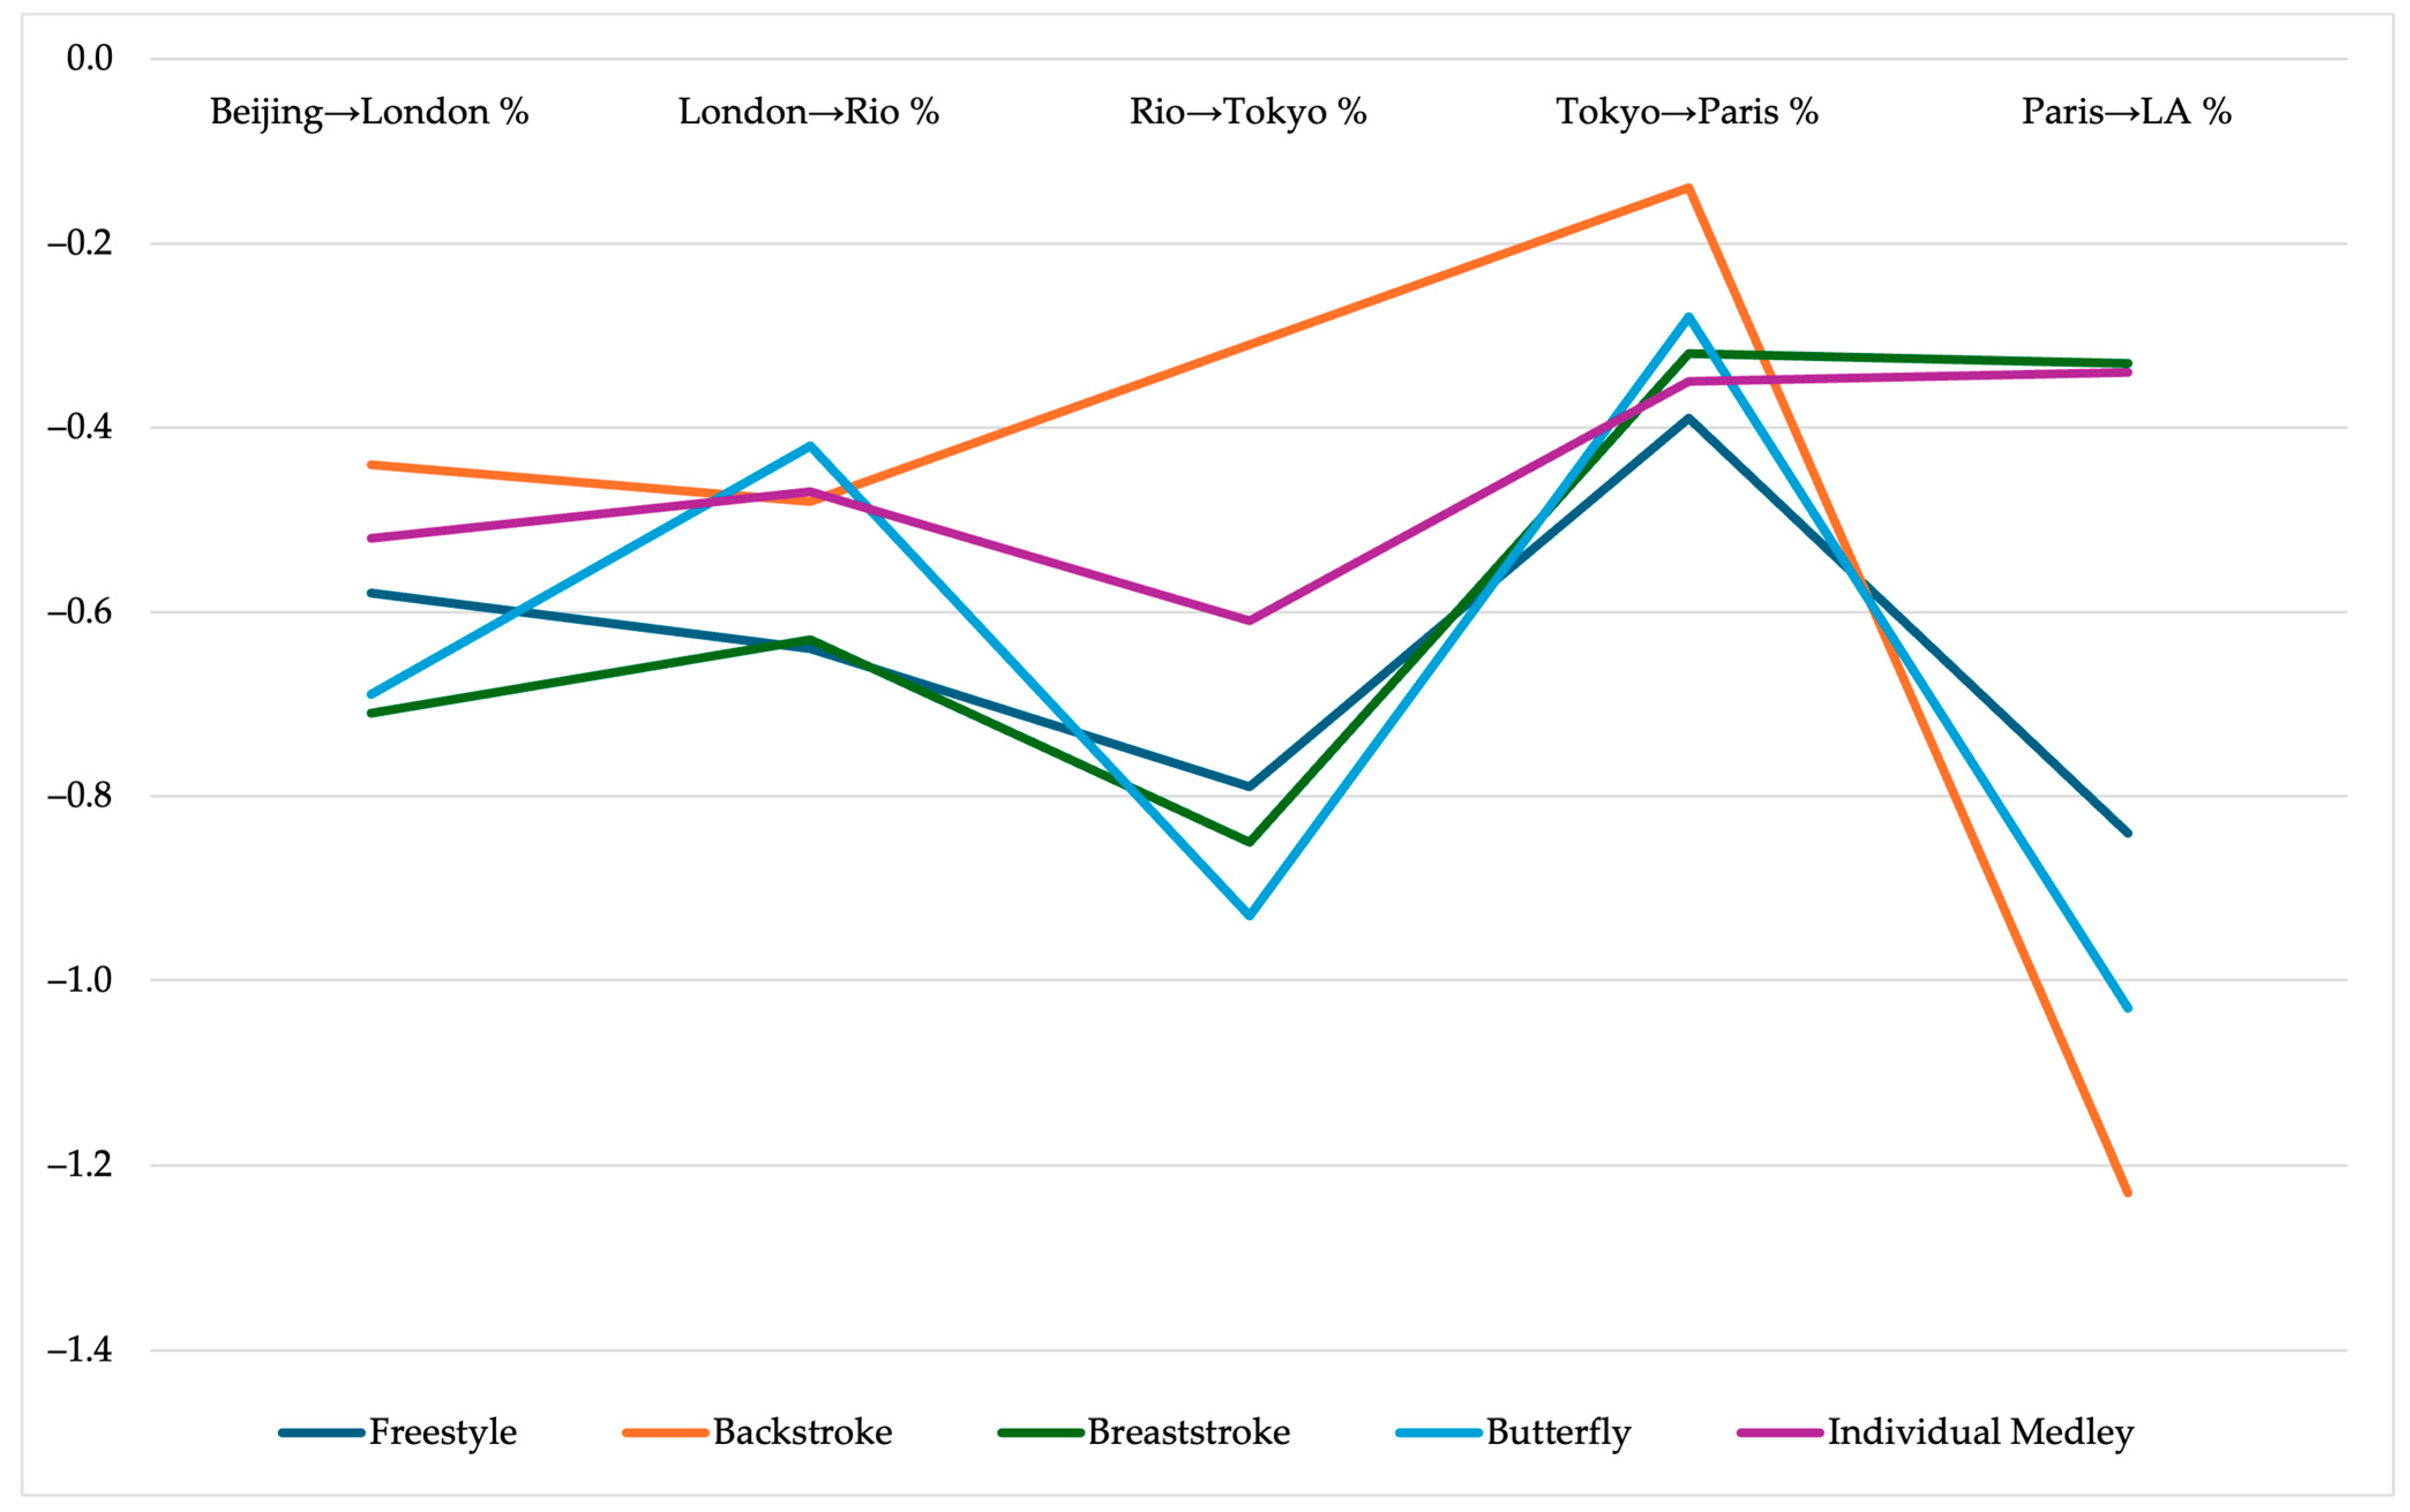
When grouped by stroke, the largest total tightening between Beijing and Los Angeles was observed in butterfly (−3.28%) and freestyle (−3.20%), followed by backstroke (−2.58%), breaststroke (−2.80%), and individual medley (−2.29%) (Table 4). Paris → Los Angeles tightening was largest in backstroke (−1.23%) and butterfly (−1.03%) and smaller in breaststroke (−0.33%) and individual medley (−0.34%) (Figure 3).
Paired-sample t-tests at the stroke level demonstrated a statistically significant reduction in freestyle events between Beijing and London (p = 0.018). No other stroke category showed statistically significant differences between consecutive Olympic cycles (p > 0.05). The limited number of events per stroke category (n = 2–5) likely reduced statistical power, and results should therefore be interpreted cautiously.

3.4. Changes in Elite Olympic Performance

This subsection presents changes in elite Olympic performance between Beijing 2008 and Paris 2024 to contextualize the subsequent correlation analysis with the OQTs. Percentage changes in sixth-place finishing times were calculated at the event level using relative differences between Olympic Games. The sixth-place final performance was selected as a stable benchmark of elite competitive level. Unlike medal positions, which may be influenced by exceptional individual performances, sixth place reflects the depth and density of world-class finalists and provides a consistent representation of high-level Olympic performance across events and Olympic cycles. The eighth-place position was not used because Olympic finals may include disqualifications, which can affect the comparability of last-place results across cycles. In contrast, the sixth-place ranking remained consistently available across all analyzed Olympic Games and was not influenced by disqualification cases or tie-related ranking adjustments. Therefore, sixth place represents a stable indicator of elite performance density. Across events, elite Olympic performance generally improved between Beijing and Paris, although the magnitude of improvement varied considerably by event (Table 4). Total percentage changes ranged from a slight increase of +0.18% in the 400 m freestyle to a substantial improvement of −2.03% in the 200 m individual medley. The largest performance improvements were observed in the 200 m individual medley (−2.03%), 200 m freestyle (−1.39%), 100 m butterfly (−1.30%), and 100 m backstroke (−1.23%). In contrast, smaller improvements or near-stable performances were observed in the 50 m freestyle (−0.18%), 200 m butterfly (−0.38%), and 400 m freestyle (+0.18%).
Overall, these findings indicate that elite Olympic performance improved across most events between 2008 and 2024, but the magnitude of progression differed by event and distance category, providing a basis for evaluating whether qualification standards have tightened proportionally to actual performance development.

3.5. Relationship Between OQT Tightening and Olympic Performance Improvement (Beijing–Paris)

To quantify the relationship between changes in OQTs and changes in elite Olympic performance, a Pearson correlation analysis was performed at the event level. Across men’s events, the correlation between OQT tightening (Beijing → Paris) and Olympic performance improvement (Beijing → Paris) was strong and positive (r = 0.74, n = 13 events), indicating that events with greater qualification tightening also showed larger performance improvements. In the event-level comparison (Table 5), the difference between OQT tightening and performance improvement (OQT−performance) ranged from −0.79 to −2.14 percentage points. The largest gaps were observed in the 200 m breaststroke (−2.14), 100 m butterfly (−1.76), 100 m breaststroke (−1.70), and 200 m individual medley (−1.65), indicating that qualification standards decreased more rapidly than performance improved in these events.
When grouped by distance category (Table 5), OQT tightening exceeded performance improvement in all categories. The sprint category showed the largest difference (−1.38 percentage points) compared with middle-distance (−0.64) and long-distance (−0.69). When grouped by stroke (Table 5), the largest differences were observed in breaststroke (−1.51), butterfly (−1.30), and freestyle (−1.28), while smaller differences were found in individual medley (−0.93) and backstroke (−0.52).
Overall, these findings indicate that although qualification standards broadly tracked elite performance progression, OQT tightening generally exceeded the magnitude of actual Olympic performance improvement across events, particularly in sprint and breaststroke disciplines.

3.6. Long-Term Trends in Olympic Qualification Time Standards (2008–2028)

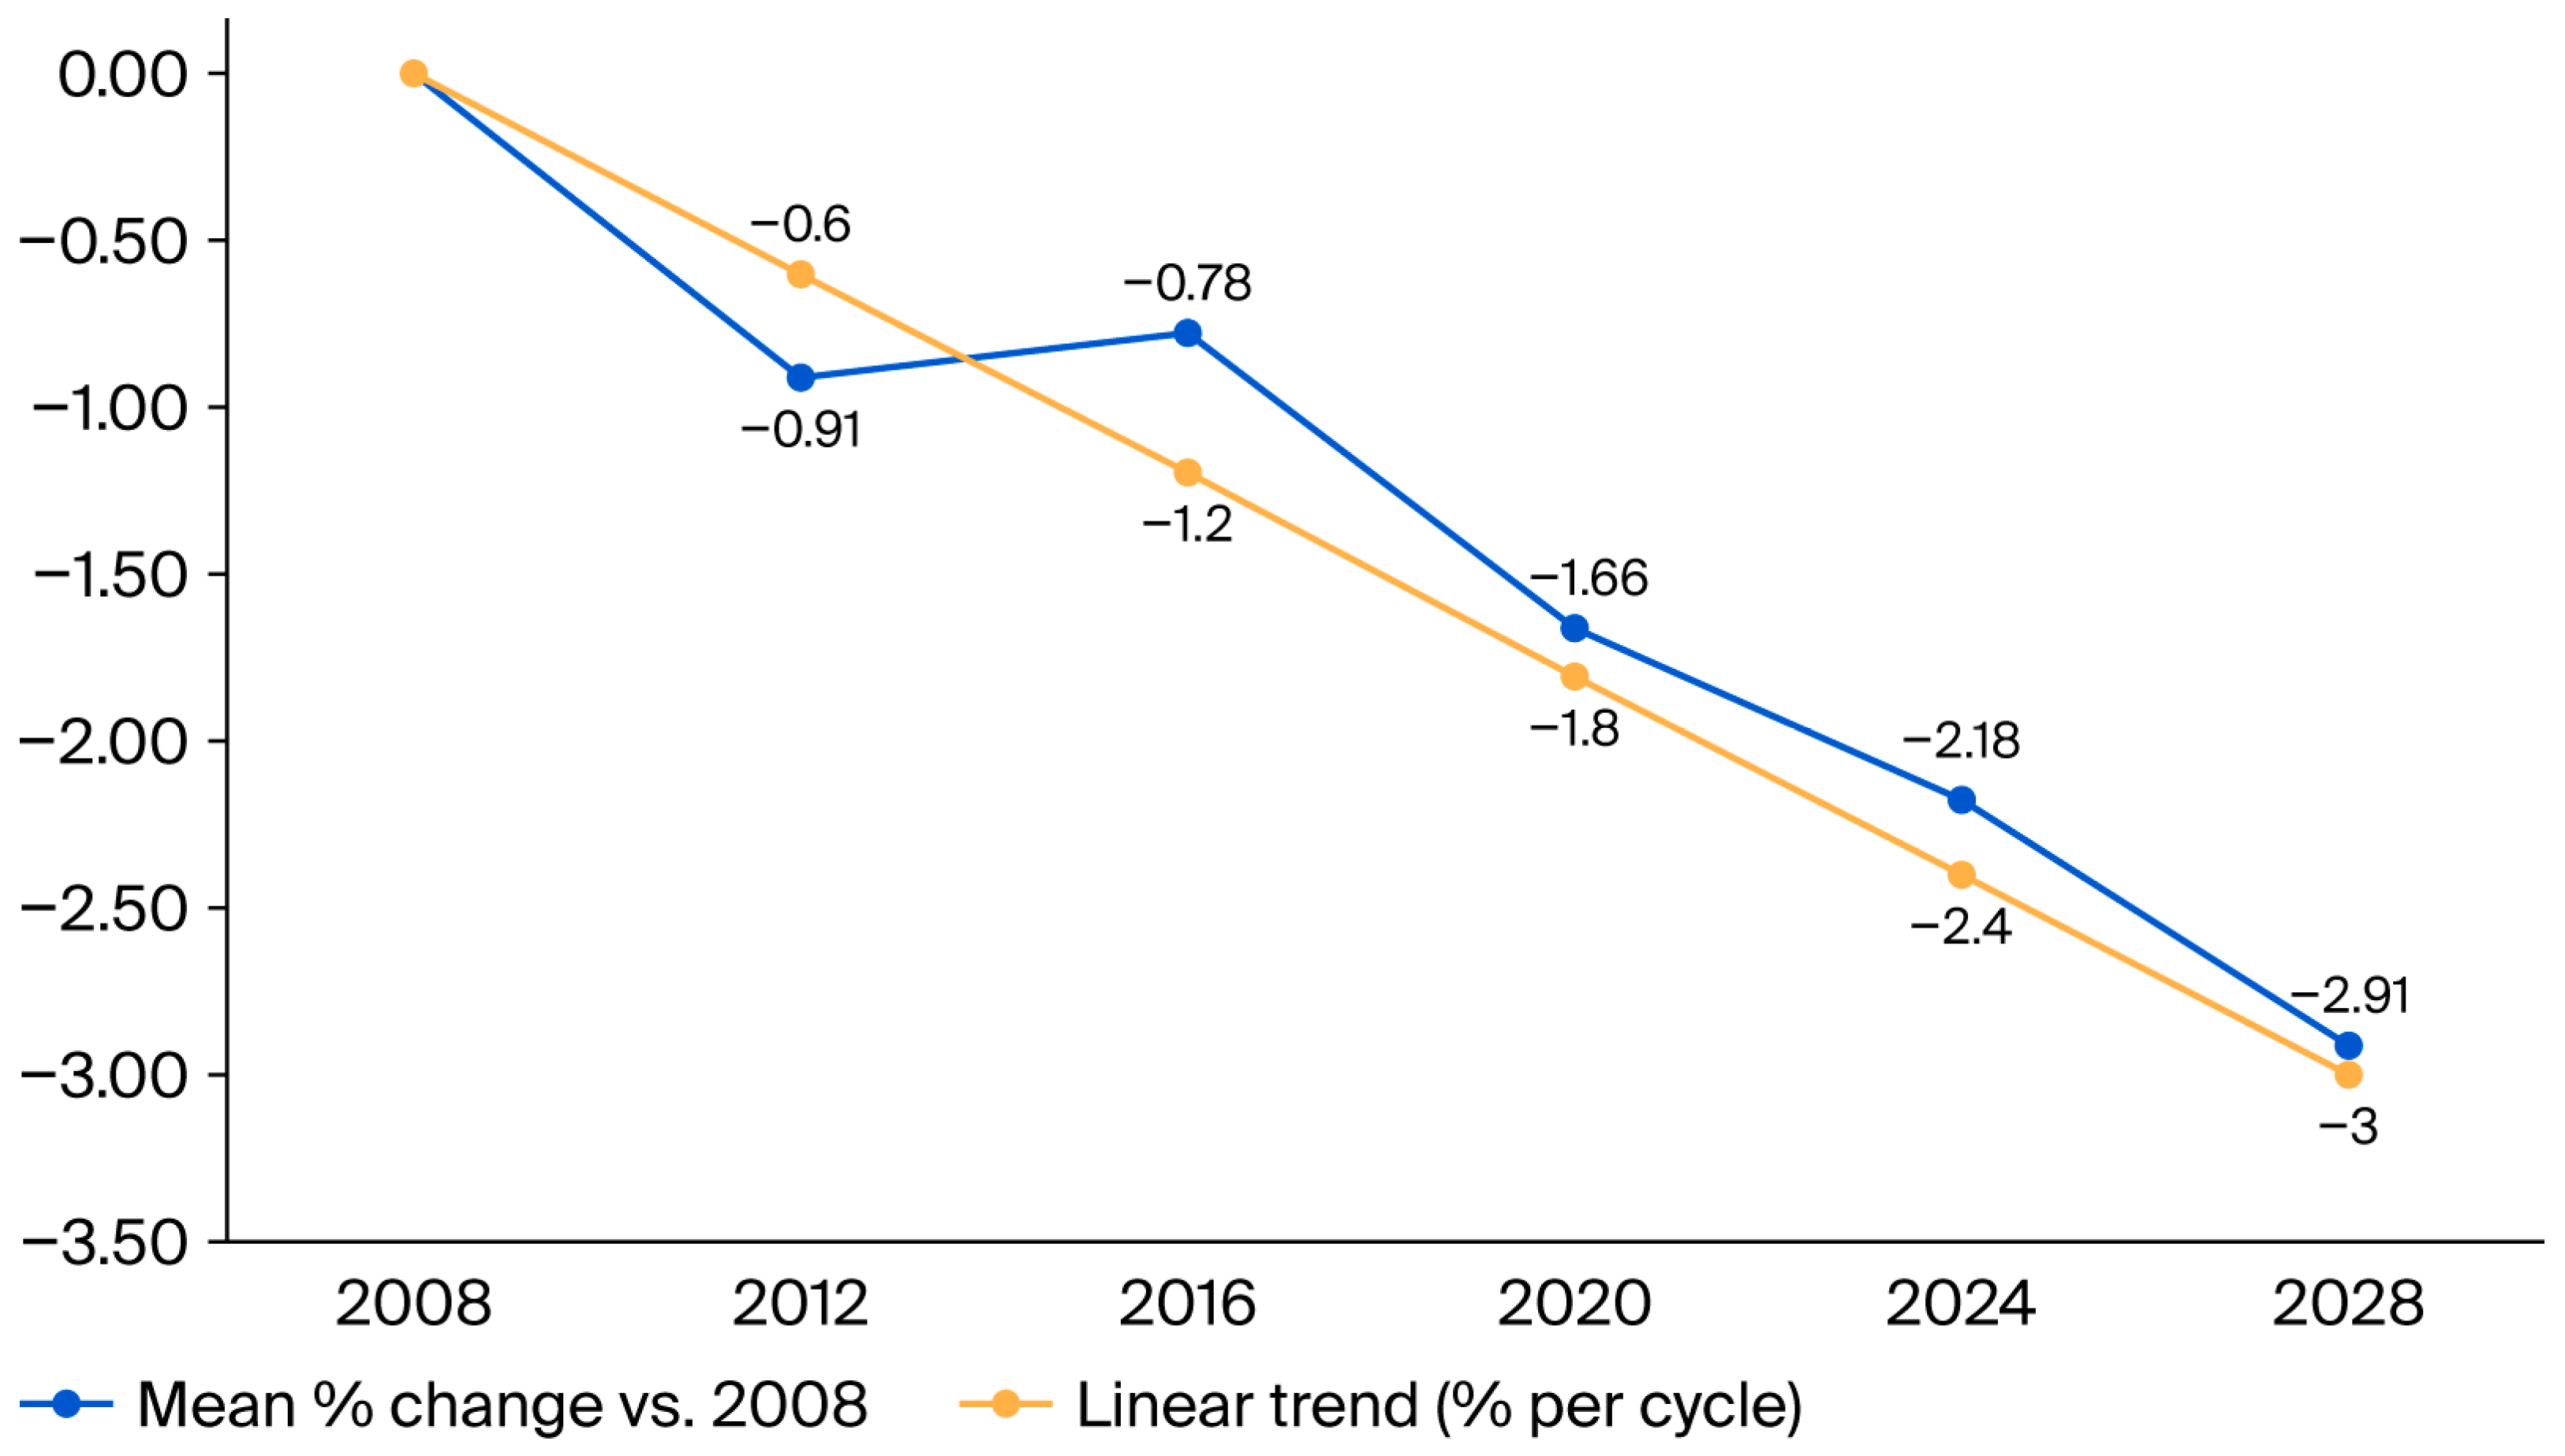
Trend analysis based on log-transformed OQTs revealed a significant proportional tightening across Olympic cycles (p < 0.001). Consistent results were observed when trends were evaluated using event-level percentage changes, demonstrating an average tightening of approximately 0.6% per Olympic cycle (p < 0.001) (Figure 4).

4. Discussion

This study demonstrates that Olympic Qualification Times standards in men’s swimming have tightened progressively and significantly between the Beijing 2008 and Los Angeles 2028 Olympic Games. Across events, qualification standards showed cumulative reductions of approximately 2–4%, corresponding to an average proportional decrease of about 0.6% per Olympic cycle. Although the decrease in Olympic Qualification Times was strongly associated with improvements in elite Olympic performance (r = 0.74), qualification standards generally decreased to a greater extent than actual performance progression, resulting in systematic gaps across events. These findings indicate that Olympic qualification benchmarks have become increasingly demanding and, in several disciplines, have outpaced the rate of elite performance improvement. Previous research has shown that championship performance is influenced by contextual and psychological factors and does not always mirror qualification-level results [6]. As such, increasingly strict entry standards may place additional pressure on athletes and national programs [6,7].
Qualification systems have previously been reported to have a similar effect on competitive depth and national representation [16,17].
At the event level, qualification tightening was not uniform across the Olympic swimming program. Sprint and medley events showed the largest reductions, particularly in the 100 m breaststroke and 100 m butterfly. Stroke-specific differences may also be partially explained by biomechanical and morphophysiological characteristics of the respective swimming techniques [18]. Breaststroke is mechanically distinct due to its discontinuous propulsion pattern and higher drag profile, making performance highly sensitive to technical precision and strength coordination [19]. Butterfly relies heavily on upper-body power production and trunk coordination, which may respond rapidly to advances in strength and conditioning methodologies [18,20]. In contrast, backstroke and individual medley events require greater technical consistency and versatility across race phases, integrating multiple stroke-specific demands within a single event [21]. This pattern is consistent with longitudinal evidence indicating that short-distance events benefit most from technical refinements, start efficiency, and race-specific optimization [4,9]. In contrast, long-distance events showed smaller relative improvements, supporting the view that endurance performance may be closer to physiological limits [1]. From a metabolic perspective, sprint swimming events (50–100 m) are characterized by high neuromuscular power output, rapid force production, and substantial anaerobic glycolytic contribution [8]. Performance in these events is strongly influenced by start reaction time, underwater efficiency, stroke rate optimization, and maximal velocity maintenance [22,23,24]. Even small improvements in technical execution or power output can therefore produce measurable reductions in race time, which may partly explain the pronounced qualification tightening observed in sprint disciplines [25,26].
Middle-distance events (200–400 m) require an integration of anaerobic capacity and aerobic power, with substantial reliance on lactate tolerance and pacing strategy [8]. These events represent a transitional metabolic domain in which performance depends on both technical efficiency and physiological endurance capacity. The moderate but consistent tightening observed in these events may reflect long-term refinements in training periodization, race modeling, and energy system optimization [3].
Long-distance events (800–1500 m) are predominantly aerobic and heavily dependent on maximal oxygen uptake, movement economy, and metabolic efficiency [1,27]. Improvements in these disciplines typically occur more gradually, as they are closely linked to physiological ceilings and endurance adaptations developed over extended training periods [1,27]. The smaller relative qualification tightening in long-distance events may therefore reflect proximity to aerobic performance limits [28].
The progressive tightening of OQTs should also be interpreted in the context of advances in training methodology, technology, and athlete preparation over the past two decades [3,9]. Modern swimming training has increasingly integrated evidence-based periodization models, high-intensity interval protocols, race-pace specificity, and individualized load monitoring [8,29,30,31]. The systematic use of lactate profiling, heart-rate variability tracking, and biomechanical video analysis has likely contributed to more precise performance optimization across Olympic cycles [32,33,34].
Technological developments have also played a role in performance evolution. Improvements in starting block design, underwater filming systems, strength and conditioning equipment, and data-driven race analysis have enhanced technical efficiency and power production [22,34,35,36,37]. Although the high-tech swimsuit era was regulated after 2009, subsequent performance gains appear to reflect training and biomechanical refinement rather than equipment-driven jumps [1,38,39]. Anthropometric and morphological factors may further contribute to the progressive elevation of elite performance standards [2,16]. Selection processes at the international level increasingly favor athletes with advantageous anthropometric characteristics, such as greater limb length, optimized body composition, and favorable muscle characteristics [2,18,40]. While genetic predisposition alone does not determine success, the interaction between innate characteristics and advanced training systems may amplify competitive differentiation at the highest level [9,16]. Nutritional strategies have likewise evolved substantially [41,42]. Periodized carbohydrate availability, optimized protein timing, and evidence-based supplementation protocols are widely recommended in elite sport nutrition frameworks, although real-world adherence in swimmers can be variable, particularly during heavy training [43]. Improved recovery nutrition and hydration management may support higher training loads and enhanced physiological adaptation, indirectly contributing to incremental improvements in race performance [41,42,44]. Collectively, these multidimensional advances likely underpin the steady performance progression observed across Olympic cycles and help explain the sustained tightening of qualification benchmarks [4,9].
Importantly, the comparison between qualification standards and performance trends indicates that, in several events, qualification times often exceed long-term performance improvements. Previous studies have shown that swimmers do not always reproduce qualification-level performances at major championships due to competition stress and contextual factors [6]. These findings extend current understanding of Olympic qualification policy by demonstrating a measurable divergence between entry thresholds and finalist-level outcomes. Future research should examine whether this divergence affects competitive balance, athlete progression pathways, or representation across national federations.
From a practical perspective, these findings have clear implications for athletes, coaches, and national federations. While established swimming nations may adapt through greater depth and targeted preparation, smaller or emerging programs may face reduced Olympic representation. From a policy perspective, the observed alignment between qualification tightening and performance progression in men’s events suggests that the Los Angeles 2028 qualification system reflects competitive depth; However, continued monitoring is needed to ensure that accessibility is not disproportionately reduced for smaller federations.

Study Limitations

The analysis was based on publicly available aggregated data and did not include individual-level physiological, anthropometric, or training variables. Therefore, direct causal relationships between qualification tightening and underlying performance determinants cannot be established.
Stroke- and distance-level statistical analyses were conducted on a limited number of events within each category (n = 2–7), which may have reduced statistical power and limited the detection of smaller effect sizes. Results at the subgroup level should therefore be interpreted cautiously.
Elite performance was presented by sixth-place Olympic final times, which, although selected as a stable and methodologically consistent benchmark, may not fully capture the complete distribution of finalist performances. Alternative approaches, such as mean finalist times or percentile-based analyses, could provide complementary insights. Finally, the present study focused exclusively on men’s Olympic pool swimming events. Future research should examine whether similar patterns of qualification tightening and performance progression are observed in women’s events.

5. Conclusions

This study quantified long-term changes in Olympic Qualification Time (OQT) standards in men’s swimming between the Beijing 2008 and Los Angeles 2028 Olympic Games. OQTs demonstrated a systematic and statistically significant tightening across Olympic cycles, with a mean cumulative reduction of 2–4% across events and an average proportional decrease of approximately 0.6% per cycle.
Qualification tightening was pronounced in sprint and selected medley events, whereas long-distance events showed smaller relative changes. Although OQT progression was strongly associated with improvements in elite Olympic performance (r = 0.74), qualification standards generally decreased to a greater extent than actual finalist-level performance improvements.
These findings indicate that Olympic qualification benchmarks have evolved proportionally to long-term performance development but have, in several disciplines, become progressively more demanding than observed performance gains. Future research should extend this analysis to women’s events and examine the long-term impact of qualification policy changes on competitive representation and performance density.

Author Contributions

Conceptualization, I.P. and P.Á.; methodology, C.M.; software, Á.P.; validation, P.Á., C.M., and I.B.; formal analysis, Z.A.; investigation, I.P.; resources, I.P.; data curation, P.Á.; writing—original draft preparation, I.P.; writing—review and editing, P.Á.; visualization, Á.P.; supervision, P.Á.; project administration, C.M.; funding acquisition, Á.P. All authors have read and agreed to the published version of the manuscript.

Funding

This research received no external funding.

Institutional Review Board Statement

Ethical review and approval were waived for this study because all data were obtained from publicly available official competition results and qualification documents, and no individual-level or identifiable human data were collected.

Informed Consent Statement

Not applicable.

Data Availability Statement

The raw data supporting the conclusions of this article will be made available by the authors upon request.

Conflicts of Interest

The authors declare no conflicts of interest.

References

  1. Berthelot, G.; Thibault, V.; Tafflet, M.; Escolano, S.; El Helou, N.; Jouven, X.; Hermine, O.; Toussaint, J.F. The citius end: World records progression announces the completion of a brief ultra-physiological quest. PLoS ONE 2008, 3, e1552. [Google Scholar] [CrossRef] [Scilit]
  2. Costa, M.J.; Marinho, D.A.; Reis, V.M.; Silva, A.J.; Marques, M.C.; Bragada, J.A.; Barbosa, T.M. Tracking the performance of world-ranked swimmers. J. Sports Sci. Med. 2010, 9, 411–417. [Google Scholar] [PubMed]
  3. Crowley, E.; Ng, K.; Mujika, I.; Powell, C. Speeding up or slowing down? Analysis of race results in elite-level swimming from 2011–2019 to predict future Olympic Games performances. Meas. Phys. Educ. Exerc. Sci. 2021, 26, 130–140. [Google Scholar] [CrossRef] [Scilit]
  4. Veiga, S.; Grenouillat, A.; Rodríguez-Adalia, L.; Zarzosa-Alonso, F.; Pla, R. Ten-year evolution of world swimming trends for different performance clusters: A Gaussian model. Int. J. Sports Physiol. Perform. 2024, 19, 1391–1399. [Google Scholar] [CrossRef] [Scilit] [PubMed]
  5. Seiler, S.; De Koning, J.J.; Foster, C. The fall and rise of the gender difference in elite anaerobic performance 1952–2006. Med. Sci. Sports Exerc. 2007, 39, 534–540. [Google Scholar] [CrossRef] [Scilit]
  6. Mujika, I.; Villanueva, L.; Welvaert, M.; Pyne, D.B. Swimming fast when it counts: A 7-year analysis of Olympic and World Championships performance. Int. J. Sports Physiol. Perform. 2019, 14, 1132–1139. [Google Scholar] [CrossRef] [Scilit]
  7. Santos, C.C.; Fernandes, R.J.; Marinho, D.A.; Costa, M.J. From entry to finals: Progression and variability of swimming performance at the 2022 FINA World Championships. J. Sports Sci. Med. 2023, 22, 417–424. [Google Scholar] [CrossRef] [Scilit]
  8. Fernandes, R.J.; Carvalho, D.D.; Figueiredo, P. Training zones in competitive swimming: A biophysical approach. Front. Sports Atc. Living 2024, 6, 1363730. [Google Scholar] [CrossRef] [Scilit]
  9. Born, D.-P.; Schönfelder, M.; Logan, O.; Olstad, B.H.; Romann, M. Performance development of European swimmers across the Olympic cycle. Front. Sports Act. Living 2022, 4, 894066. [Google Scholar] [CrossRef] [Scilit]
  10. FINA. Qualifying Procedures—Swimming—Games of the XXIX Olympiad Beijing 2008; Fédération Internationale de Natation: Lausanne, Switzerland, 2007; Available online: https://web.archive.org/web/20070320075225/ (accessed on 11 February 2026).
  11. FINA. Qualifying Procedures—Swimming—Games of the XXX Olympiad London 2012; Fédération Internationale de Natation: Lausanne, Switzerland, 2011; Available online: https://web.archive.org/web/20110726002300/ (accessed on 11 February 2026).
  12. FINA. Qualification System—Games of the XXXI Olympiad Rio 2016—Swimming; Fédération Internationale de Natation: Lausanne, Switzerland, 2016; Available online: https://web.archive.org/web/20151227061057/ (accessed on 11 February 2026).
  13. FINA. Tokyo 2020 Olympic Games—Swimming—Qualification Time Standards; Fédération Internationale de Natation: Lausanne, Switzerland, 2021; Available online: https://resources.fina.org/fina/document/2021/01/21/3726e45a-7e5d-42bd-8e0a-7d3201f8f69f/tokyo_2020_-_og_qual_events_-_qualifying_time_standards_0.pdf (accessed on 11 February 2026).
  14. World Aquatics. Qualification System—Games of the XXXIII Olympiad Paris 2024—Swimming; World Aquatics: Lausanne, Switzerland, 2022. [Google Scholar]
  15. International Olympic Committee. Qualification System—Games of the XXXIV Olympiad Los Angeles 2028—Swimming; IOC: Lausanne, Switzerland, 2024; Available online: https://stillmed.olympics.com/media/Documents/Olympic-Games/LA28/SWM-LA28-Qualification-System.pdf (accessed on 11 February 2026).
  16. Allen, S.V.; Vandenbogaerde, T.J.; Hopkins, W.G. Career performance trajectories of Olympic swimmers: Benchmarks for talent development. Eur. J. Sport Sci. 2014, 14, 643–651. [Google Scholar] [CrossRef] [Scilit]
  17. Allen, S.V.; Vandenbogaerde, T.J.; Pyne, D.B.; Hopkins, W.G. Predicting a nation’s Olympic-qualifying swimmers. Int. J. Sports Physiol. Perform. 2015, 10, 431–435. [Google Scholar] [CrossRef] [Scilit]
  18. Barbosa, T.M.; Bragada, J.A.; Reis, V.M.; Marinho, D.A.; Carvalho, C.; Silva, A.J. Energetics and biomechanics as determining factors of swimming performance: Updating the state of the art. J. Sci. Med. Sport. 2010, 13, 262–269. [Google Scholar] [CrossRef] [Scilit] [PubMed]
  19. Barbosa, T.M.; Keskinen, K.L.; Fernandes, R.; Colaço, P.; Lima, A.B.; Vilas-Boas, J.P. Energy cost and intracyclic variation of the velocity of the centre of mass in butterfly stroke. Eur. J. Appl. Physiol. 2005, 93, 519–523. [Google Scholar] [CrossRef] [Scilit] [PubMed]
  20. Carvalho, D.D.; Monteiro, A.S.; Fonseca, P.; Silva, A.J.; Vilas-Boas, J.P.; Pyne, D.B.; Fernandes, R.J. Swimming sprint performance depends on upper/lower limbs strength and swimmers level. J. Sports Sci. 2023, 41, 747–757. [Google Scholar] [CrossRef] [Scilit] [PubMed]
  21. Seifert, L.; Chollet, D.; Rouard, A. Swimming constraints and arm coordination. Hum. Mov. Sci. 2007, 26, 68–86. [Google Scholar] [CrossRef] [Scilit] [PubMed]
  22. Tor, E.; Pease, D.L.; Ball, K.A. Key parameters of the swimming start and their relationship to start performance. J. Sports Sci. 2015, 33, 1313–1321. [Google Scholar] [CrossRef] [Scilit] [PubMed]
  23. Ruiz-Navarro, J.; Santos, C.; Born, D.-P.; López-Belmonte, Ó.; Cuenca-Fernández, F.; Sanders, R.; Arellano, R. Factors Relating to Sprint Swimming Performance: A Systematic Review. Sports Med. 2025, 55, 899–922. [Google Scholar] [CrossRef] [Scilit] [PubMed]
  24. Gonjo, T.; Eriksrud, O.; Papoutsis, F.; Olstad, B.H. Relationships between a Load-velocity Profile and Sprint Performance in Butterfly Swimming. Int. J. Sports Med. 2020, 41, 461–467. [Google Scholar] [CrossRef] [Scilit] [PubMed]
  25. Arellano, R.; Ruiz-Navarro, J.J.; Barbosa, T.M.; López-Contreras, G.; Morales-Ortíz, E.; Gay, A.; López-Belmonte, Ó.; González-Ponce, Á.; Cuenca-Fernández, F. Are the 50 m Race Segments Changed From Heats to Finals at the 2021 European Swimming Championships? Front. Physiol. 2022, 13, 797367. [Google Scholar] [CrossRef] [Scilit] [PubMed] [PubMed Central]
  26. Keiner, M.; Wirth, K.; Fuhrmann, S.; Kunz, M.; Hartmann, H.; Haff, G.G. The Influence of Upper- and Lower-Body Maximum Strength on Swim Block Start, Turn, and Overall Swim Performance in Sprint Swimming. J. Strength Cond. Res. 2021, 35, 2839–2845. [Google Scholar] [CrossRef] [Scilit] [PubMed]
  27. Bassett, D.R., Jr.; Howley, E.T. Limiting factors for maximum oxygen uptake and determinants of endurance performance. Med. Sci. Sports Exerc. 2000, 32, 70–84. [Google Scholar] [CrossRef] [Scilit] [PubMed]
  28. Nevill, A.M.; Whyte, G. Are there limits to running world records? Med. Sci. Sports Exerc. 2005, 37, 1785–1788. [Google Scholar] [CrossRef] [Scilit]
  29. Crowley, E.; Harrison, A.J.; Lyons, M. The Impact of Resistance Training on Swimming Performance: A Systematic Review. Sports Med. 2017, 47, 2285–2307. [Google Scholar] [CrossRef] [Scilit] [PubMed]
  30. Hellard, P.; Avalos, M.; Lacoste, L.; Barale, F.; Chatard, J.C.; Millet, G.P. Assessing the limitations of the Banister model in monitoring training. J. Sports Sci. 2006, 24, 509–520. [Google Scholar] [CrossRef] [Scilit] [PubMed] [PubMed Central]
  31. Jin, G.; Jin, Y.; Zhang, H.; Fu, X.; Yang, Y.; Lin, S.C. The methodology of resistance training is crucial for improving short-medium distance front crawl performance in competitive swimmers: A systematic review and meta-analysis. Front. Physiol. 2024, 15, 1406518. [Google Scholar] [CrossRef] [Scilit] [PubMed] [PubMed Central]
  32. Pyne, D.B.; Sharp, R.L. Physical and energy requirements of competitive swimming events. Int. J. Sport. Nutr. Exerc. Metab. 2014, 24, 351–359. [Google Scholar] [CrossRef] [Scilit] [PubMed]
  33. Plews, D.J.; Laursen, P.B.; Stanley, J.; Kilding, A.E.; Buchheit, M. Training adaptation and heart rate variability in elite endurance athletes: Opening the door to effective monitoring. Sports Med. 2013, 43, 773–781. [Google Scholar] [CrossRef] [Scilit] [PubMed]
  34. Veiga, S.; Roig, A. Underwater and surface strategies of 200 m world level swimmers. J. Sports Sci. 2016, 34, 766–771. [Google Scholar] [CrossRef] [Scilit] [PubMed]
  35. Yu Kwok, W.; So, B.C.L.; Tse, D.H.T.; Ng, S.S.M. A Systematic Review and Meta-Analysis: Biomechanical Evaluation of the Effectiveness of Strength and Conditioning Training Programs on Front Crawl Swimming Performance. J. Sports Sci. Med. 2021, 20, 564–585. [Google Scholar] [CrossRef] [Scilit] [PubMed] [PubMed Central]
  36. Muniz-Pardos, B.; Gomez-Bruton, A.; Matute-Llorente, A.; Gonzalez-Aguero, A.; Gomez-Cabello, A.; Gonzalo-Skok, O.; Casajus, J.A.; Vicente-Rodriguez, G. Swim-Specific Resistance Training: A Systematic Review. J. Strength Cond. Res. 2019, 33, 2875–2881. [Google Scholar] [CrossRef] [Scilit] [PubMed]
  37. Wirth, K.; Keiner, M.; Fuhrmann, S.; Nimmerichter, A.; Haff, G.G. Strength Training in Swimming. Int. J. Environ. Res. Public. Health 2022, 19, 5369. [Google Scholar] [CrossRef] [Scilit] [PubMed] [PubMed Central]
  38. Nevill, A.M.; Whyte, G.P.; Holder, R.L.; Peyrebrune, M. Are there limits to swimming world records? Int. J. Sports Med. 2007, 28, 1012–1017. [Google Scholar] [CrossRef] [Scilit] [PubMed]
  39. Chatard, J.C.; Wilson, B. Effect of fastskin suits on performance, drag, and energy cost of swimming. Med. Sci. Sports Exerc. 2008, 40, 1149–1154. [Google Scholar] [CrossRef] [Scilit] [PubMed]
  40. Pyne, D.; Trewin, C.; Hopkins, W. Progression and variability of competitive performance of Olympic swimmers. J. Sports Sci. 2004, 22, 613–620. [Google Scholar] [CrossRef] [Scilit] [PubMed]
  41. Thomas, D.T.; Erdman, K.A.; Burke, L.M. Position of the Academy of Nutrition and Dietetics, Dietitians of Canada, and the American College of Sports Medicine: Nutrition and Athletic Performance. J. Acad. Nutr. Diet. 2016, 116, 501–528, Erratum in J. Acad. Nutr. Diet. 2017, 117, 146. https://doi.org/10.1016/j.jand.2016.11.008. [Google Scholar] [CrossRef] [Scilit] [PubMed]
  42. Burke, L.M.; Mujika, I. Nutrition for Recovery in Aquatic Sports. Int. J. Sport Nutr. Exerc. Metab. 2014, 24, 425–436. [Google Scholar] [CrossRef] [Scilit] [PubMed]
  43. Lundstrom, E.A.; De Souza, M.J.; Khen, K.M.; Williams, N.I. Elite collegiate swimmers do not meet sport nutrition recommendations during heavy training: Effects of sex and within-day nutrient timing. J. Int. Soc. Sports Nutr. 2025, 22, 2494846. [Google Scholar] [CrossRef] [Scilit] [PubMed]
  44. Morton, J.; Hearris, M.; Fell, M.; Owens, D.; Halson, S.; Trommelen, J. UCI Sports Nutrition Project: Nutritional Periodization: Strategies to Enhance Training Adaptation and Recovery. Int. J. Sport Nutr. Exerc. Metab. 2025; advance online publication. [CrossRef] [Scilit]
Figure 1. Study design flow diagram.
Applsci 16 02341 g001
Figure 2. Percentage changes in Olympic Qualification Time standards by distance category (2008–2028).
Applsci 16 02341 g002
Figure 3. Percentage changes in Olympic Qualification Time standards by stroke (2008–2028).
Applsci 16 02341 g003
Figure 4. Summary of trend analyses of Olympic Qualification Time standards.
Applsci 16 02341 g004
Table 1. Olympic qualification times expressed in seconds (2008–2028).
EventBeijing 2008London 2012Rio de Janeiro 2016Tokyo 2021Paris 2024Los Angeles 2028
100 m backstroke55.1454.454.3653.8553.7453.08
100 m breaststroke61.5760.7960.5759.9359.4959.27
100 m butterfly52.8652.3652.3651.9651.6751.14
100 m freestyle49.2348.8248.9948.5748.3447.86
1500 m freestyle913.16911.83914.77900.99900.99891.62
200 m backstroke119.72118.48118.22117.5117.5116.05
200 m breaststroke133.7131.74131.66130.35129.68129.35
200 m butterfly117.67116.86116.97116.48115.78114.69
200 m freestyle108.72107.82107.97107.02106.26105.83
200 m individual medley121.4120.17120.28119.67117.94117.54
400 m freestyle229.95228.92230.44226.78226.78225.46
400 m individual medley258.4256.46256.71255.84252.5251.78
50 m freestyle22.3522.1122.2722.0121.9621.72
800 m freestyle---474.31471.65466.55
Table 2. Cycle-to-cycle percentage changes in Olympic Qualification Time standards by event (2008–2028).
EventBeijing → London %London → Rio de Janeiro %Rio de Janeiro→ Tokyo %Tokyo → Paris %Paris → Los Angeles %Beijing → Los Angeles %
100 m backstroke−1.34−0.07−0.94−0.20−1.23−3.74
100 m breaststroke−1.27−0.36−1.06−0.73−0.37−3.74
100 m butterfly−0.950−0.76−0.56−1.03−3.25
100 m freestyle−0.830.35−0.86−0.48−0.99−2.78
1500 m freestyle−0.150.32−1.510−1.04−2.36
200 m backstroke−1.04−0.22−0.610−1.23−3.07
200 m breaststroke−1.47−0.06−0.99−0.51−0.25−3.25
200 m butterfly−0.690.09−0.42−0.60−0.94−2.53
200 m freestyle−0.820.14−0.88−0.71−0.40−2.66
200 m individual medley−1.010.09−0.51−1.45−0.34−3.18
400 m freestyle−0.450.66−1.590−0.58−1.95
400 m individual medley−0.750.10−0.34−1.31−0.29−2.56
50 m freestyle−1.070.72−1.17−0.23−1.09−2.82
800 m freestyle −0.56−1.08
Table 3. Percentage changes in Olympic Qualification Time standards by distance category (2008–2028).
Distance CategoryBeijing →
London %
London → Rio de Janeiro %Rio de Janeiro → Tokyo %Tokyo → Paris %Paris → Los Angeles %Beijing → Paris %Beijing → Los Angeles %
Sprint (50–100 m)−0.52−0.74−0.91−0.46−1.05−2.55−3.57
Middle (200–400 m)−0.41−0.36−0.67−0.21−0.47−1.62−2.08
Long (800–1500 m)−0.38−0.550.14−0.62−1.06−1.41−2.45
Table 4. Changes in sixth-place final times between the Beijing 2008 and Paris 2024 Olympic Games.
EventBeijing 2008
(6th Final)
Paris 2024
(6th Final)
% Change
(Beijing → Paris)
50 m Freestyle21.6521.61−0.18%
100 m Freestyle48.0447.80−0.50%
200 m Freestyle106.95105.46−1.39%
400 m Freestyle223.84224.24+0.18%
1500 m Freestyle892.11883.35−0.98%
100 m Backstroke53.3952.73−1.23%
200 m Backstroke116.39115.47−0.79%
100 m Breaststroke59.8759.32−0.92%
200 m Breaststroke129.76128.83−0.72%
100 m Butterfly51.5050.83−1.30%
200 m Butterfly114.60114.17−0.38%
200 m Individual Medley119.24116.82−2.03%
400 m Individual Medley252.84250.44−0.94%
Table 5. Comparison of Olympic Qualification Time tightening and Olympic performance improvement by event, distance category, and stroke (Beijing 2008–Paris 2024).
EventOQTs Change %
(Beijing–Paris)
Performance Change %
(Beijing–Paris)
Difference
(Percentage Points)
50 m freestyle−1.74−0.95−0.79
100 m freestyle−2.78−1.26−1.52
200 m freestyle−2.66−1.04−1.62
400 m freestyle−1.38−0.13−1.25
1500 m freestyle−1.33−0.35−0.98
100 m backstroke−2.54−1.48−1.06
200 m backstroke−2.27−1.42−0.85
100 m breaststroke−2.87−1.17−1.70
200 m breaststroke−3.01−0.87−2.14
100 m butterfly−3.07−1.31−1.76
200 m butterfly−2.53−0.94−1.59
200 m individual medley−2.87−1.22−1.65
400 m individual medley−2.25−0.96−1.29
Distance
Sprint−2.55−1.17−1.38
Middle−1.62−0.98−0.64
Long−1.41−0.72−0.69
Stroke
Freestyle−2.38−1.10−1.28
Backstroke−1.37−0.85−0.52
Breaststroke−2.47−0.96−1.51
Butterfly−2.29−0.99−1.30
Individual Medley−1.95−1.02−0.93
Disclaimer/Publisher’s Note: The statements, opinions and data contained in all publications are solely those of the individual author(s) and contributor(s) and not of MDPI and/or the editor(s). MDPI and/or the editor(s) disclaim responsibility for any injury to people or property resulting from any ideas, methods, instructions or products referred to in the content.