1. Introduction
Water contamination resulting from emerging organic micropollutants (MPs) discharged by diverse agricultural, urban, and industrial activities has become a major global concern. These compounds, including pharmaceuticals, personal care products, and pesticides, persist in aquatic environments and pose significant ecological and human health risks due to their biological activity, persistence, and resistance to conventional treatment technologies. MPs are commonly detected in aquatic systems at trace concentrations ranging from ng/L to μg/L and are linked to adverse human health effects, including genotoxicity, carcinogenicity, and neurotoxicity [
1].
Among MPs, carbamazepine (CBZ) has become a priority contaminant of concern. CBZ is one of the most widely prescribed antiepileptic drugs, also used for trigeminal neuralgia and psychiatric disorders, with an estimated global market volume of 1.3 kt in 2024 [
2]. Due to extensive medical use and incomplete metabolic excretion, CBZ is continuously discharged into municipal wastewater treatment plants (WWTPs). CBZ is highly recalcitrant to biological degradation and photolysis, leading to low removal efficiencies during conventional secondary wastewater treatment [
3]. Recent surveys of European WWTPs reported effluent CBZ levels of 114.5 ng/L in Austria, 0.4 µg/L in Germany, and up to 16.5 µg/L in the Netherlands [
4]. CBZ is also frequently detected in the environment, including 1.5–98.2 ng/L in urban groundwater in Milan, Italy [
3], and up to 3.8 mg/L in river water in Southern Africa [
5], highlighting its global prevalence.
To address CBZ and other persistent MPs, advanced oxidation processes (AOPs) have emerged as effective polishing steps following secondary wastewater treatment. AOPs such as ozonation (80–100% CBZ removal), Fenton and Fenton-like processes (70–99%), TiO
2 photocatalysis (57–99%), and sulfate-radical based AOPs have demonstrated strong CBZ degradation efficiency [
6]. Concurrently, electrochemical oxidation and electro-Fenton (EF) systems have attracted growing interest as promising and more sustainable processes, utilizing in situ oxidant generation to enable effective MP degradation [
7].
The EF process generates hydrogen peroxide (H
2O
2) in situ at the cathode and utilizes Fe
2+ to produce hydroxyl radicals (•OH), enabling the non-selective oxidation of a wide range of organic compounds. Along with the •OH oxidation, MP degradation in EF systems may occur through multiple pathways, including direct and indirect anodic oxidation, adsorption and electro-adsorption on electrode surfaces, and chemical oxidation by reactive oxygen species (ROS). These pathways are strongly influenced by cell configuration, membrane and electrode materials, electrolyte composition, pollutant chemistry, and operating parameters. EF offers several advantages, including electron-driven oxidant production, prevention of hazardous oxidant storage, and mild, ambient operating conditions [
8].
Charged (ionizable) MPs can interact with the electric field and the interfacial double layer, which may influence their transport and reactivity. Depending on ionic strength and surface chemistry, these interactions may enhance migration and accumulation at reactive interfaces, thereby facilitating interfacial reaction pathways. However, under electrolyte conditions typical of electrochemical advanced oxidation processes (EAOPs), bulk transport is primarily governed by diffusion and convection [
9], while electrostatic repulsion may hinder access when surface charge is unfavorable. By contrast, uncharged MPs, such as CBZ, do not undergo electromigration. Their approach to reactive zones is governed by diffusion and hydrodynamics, with non-electrostatic interactions (hydrophobicity, π–π) controlling interfacial enrichment, especially on carbonaceous materials [
10]. As a result, direct electron-transfer is often limited, and removal relies predominantly on indirect oxidation by electro-generated oxidants [
11].
In EF, hydroxyl radicals generated in situ via Fenton chemistry (Fe
2+/H
2O
2) are the primary oxidants. However, solution pH plays a significant role for both charged and uncharged MPs, not through pollutant ionization alone, but via effects on oxidant generation and scavenging, iron speciation/complexation, H
2O
2 stability, and electrode surface properties, all of which modulate radical availability and reaction rates in EAOP systems. Likewise, the supporting electrolyte influences performance by screening electrostatics (reducing migration contributions), competing for interfacial sites, and, when halides are present, shifting oxidant speciation toward active chlorine, which may alter selectivity and kinetics [
8]. Compared with charged MPs, uncharged MPs typically demand designs that maximize radical production and contact (i.e., optimized Fe
2+/H
2O
2 dosing, hydrodynamics/residence time, minimized radical scavengers) and that leverage non-electrostatic adsorption without relying on field-driven transport advantages [
11,
12].
Electro-Fenton systems have demonstrated compelling performance at laboratory and pilot scales, offering high contaminant removal efficiency, in situ oxidant generation, and minimized chemical addition relative to conventional Fenton processes. However, the transition from proof-of-concept to full-scale deployment requires a rigorous understanding of the economic trade-offs and engineering constraints that govern technology feasibility [
8].
As energy input directly controls electrochemical reaction rates, mass-transfer limitations, and oxidant flux, energy-based metrics (i.e., kWh/m
3 treated, kWh/kg H
2O
2) constitute the primary design and comparison framework for EF systems. Electrochemical AOPs introduce distinct energy demands associated with electrode operation, cell voltage losses, power electronics, and reactor hydraulics, along with monitoring and auxiliary treatment needs [
7]. Accordingly, evaluation of EF performance based on specific energy consumption emphasizes electricity input normalized to oxidant production or pollutant removal, operating regime (batch, continuous, recirculating), and water-matrix effects [
7,
8,
13]. Overall, the process energy demand is dominated by the electrical power input to the electrochemical cell, with secondary contributions from ancillary pumping, aeration, and chemical dosing. Accordingly, the total energy demand is governed by residence time, applied current density, and the required removal efficiency [
7].
In EF systems, energy demand is further influenced by iron dosing strategies and iron management. Nonetheless, in situ H
2O
2 production and continuous electrochemical regeneration of Fe
2+ can reduce the external energy burden associated with off-site oxidant production and excess sludge handling, relative to Fenton processes [
8,
13]. Energy-based benchmarking against alternative advanced oxidation processes, such as UV/H
2O
2 and ozone-based oxidation, is therefore essential to identify operating domains in which EF provides lower or comparable energy demand per unit treatment, particularly for decentralized systems, low chemical footprint systems, and waters with low natural organic matter [
14]. These potential energy advantages must be weighed against increased electrical demand at higher throughputs, electrode-related voltage losses, and mass-transfer limitations, which can constrain energy efficiency in large-scale or high-flow applications [
8,
13].
Because CBZ is predominantly neutral and exhibits limited susceptibility to direct electrochemical transformation, it serves as a conservative, energy-based benchmark compound for evaluating EF systems. Its removal is primarily governed by in situ H2O2 generation and subsequent homogeneous •OH oxidation, making CBZ degradation directly reflective of EF energy input. In contrast, charged or more reactive MPs may undergo additional transport or degradation pathways, leading to different apparent removal efficiencies and energy demands under otherwise comparable conditions. However, most existing EF studies on CBZ have been conducted in laboratory-scale batch reactors using synthetic or simplified matrices, providing limited insight into continuous-flow operation, system-intrinsic non-EF removal mechanisms, and quantitative energy benchmarking under realistic wastewater treatment conditions. As a result, the process-level performance and energy demand of EF under application-relevant conditions remain insufficiently characterized.
This study quantified the effects of current density, residence time (RT), Reynolds number (Re), pH, and temperature on H2O2 electro-production, current efficiency (CE), and specific energy consumption (SEC; kWh/kg H2O2); evaluated CBZ removal as a model neutral micropollutant by characterizing system intrinsic non-EF removal pathways in the divided electrolytic cell, including adsorption, electro-adsorption, and electrically driven ion-exchange membrane (IEM) uptake; investigated CBZ degradation by EF at varying H2O2:Fe2+ molar ratio, current density, and RT under conditions of CE ≥ 50%; assessed flow-configuration strategies to enhance oxidation and water recovery; and compared the electrical energy per order (EEO) based energy demand of EF and Fenton treatment in real WWTP secondary effluent. Together, these elements advance EF research beyond reaction-level performance by providing new insight into the coupled effects of hydrodynamics, non-EF transport phenomena, and energy demand under conditions relevant to practical wastewater treatment.
2. Materials and Methods
2.1. Materials
Analytical grade chemicals were used as received, without further purification, including sulfuric acid (98% H2SO4; Gadot, Haifa, Israel), HPLC-grade water (Avantor Performance Materials, Gliwice, Poland), acetonitrile (ACN; J.T. Baker, Phillipsburg, NJ, USA), carbamazepine (CBZ; Sigma, Shanghai, China), sodium sulfate and sodium hydroxide (Na2SO4, NaOH; Bio-Lab Ltd., Jerusalem, Israel), and graphite fiber felt (GF; Hebei Jingtan Technology Co., Ltd., Shijiazhuang, China).
2.2. Modification of GF Electrodes
Graphite fiber felt sheets were oxidized in 6 M H
2SO
4 (1.2 L) at room temperature (23 ± 1 °C) for 2 h under stirring (1000 rpm). This treatment concentration and duration were selected based on prior optimization [
15]. Following oxidation, the GF electrodes were rinsed with 400 mL of deionized water (DI) until neutral pH was achieved and then dried overnight at 40 °C.
2.3. Electrochemical System
The electrochemical production of H2O2 and Electro-Fenton oxidation experiments were performed using a modified GF cathode (400 × 50 × 3 mm, L × W × T) and a dimensionally stable anode (DSA, Ti/RuO2/IrO2; Whizzo S&T, Hangzhou, China), with dimensions of 400 × 50 × 1.6 mm (L × W × T), in a 300 mL divided electrolytic cell. The cell was separated into anodic and cathodic compartments by a cation-exchange membrane (Nafion N-424, Ion Power Inc., New Castle, DE, USA). The membrane was employed to prevent anodic decomposition of electrogenerated H2O2 and to avoid Fe2+/Fe3+ crossover, thereby maintaining controlled EF conditions in the cathodic compartment. It enabled ionic charge transport while minimizing bulk mixing between the two compartments. The electrodes were positioned with an inter-electrode distance of 7.8 mm. A constant direct current was supplied using a DC power source (0–5 A, 0–30 V).
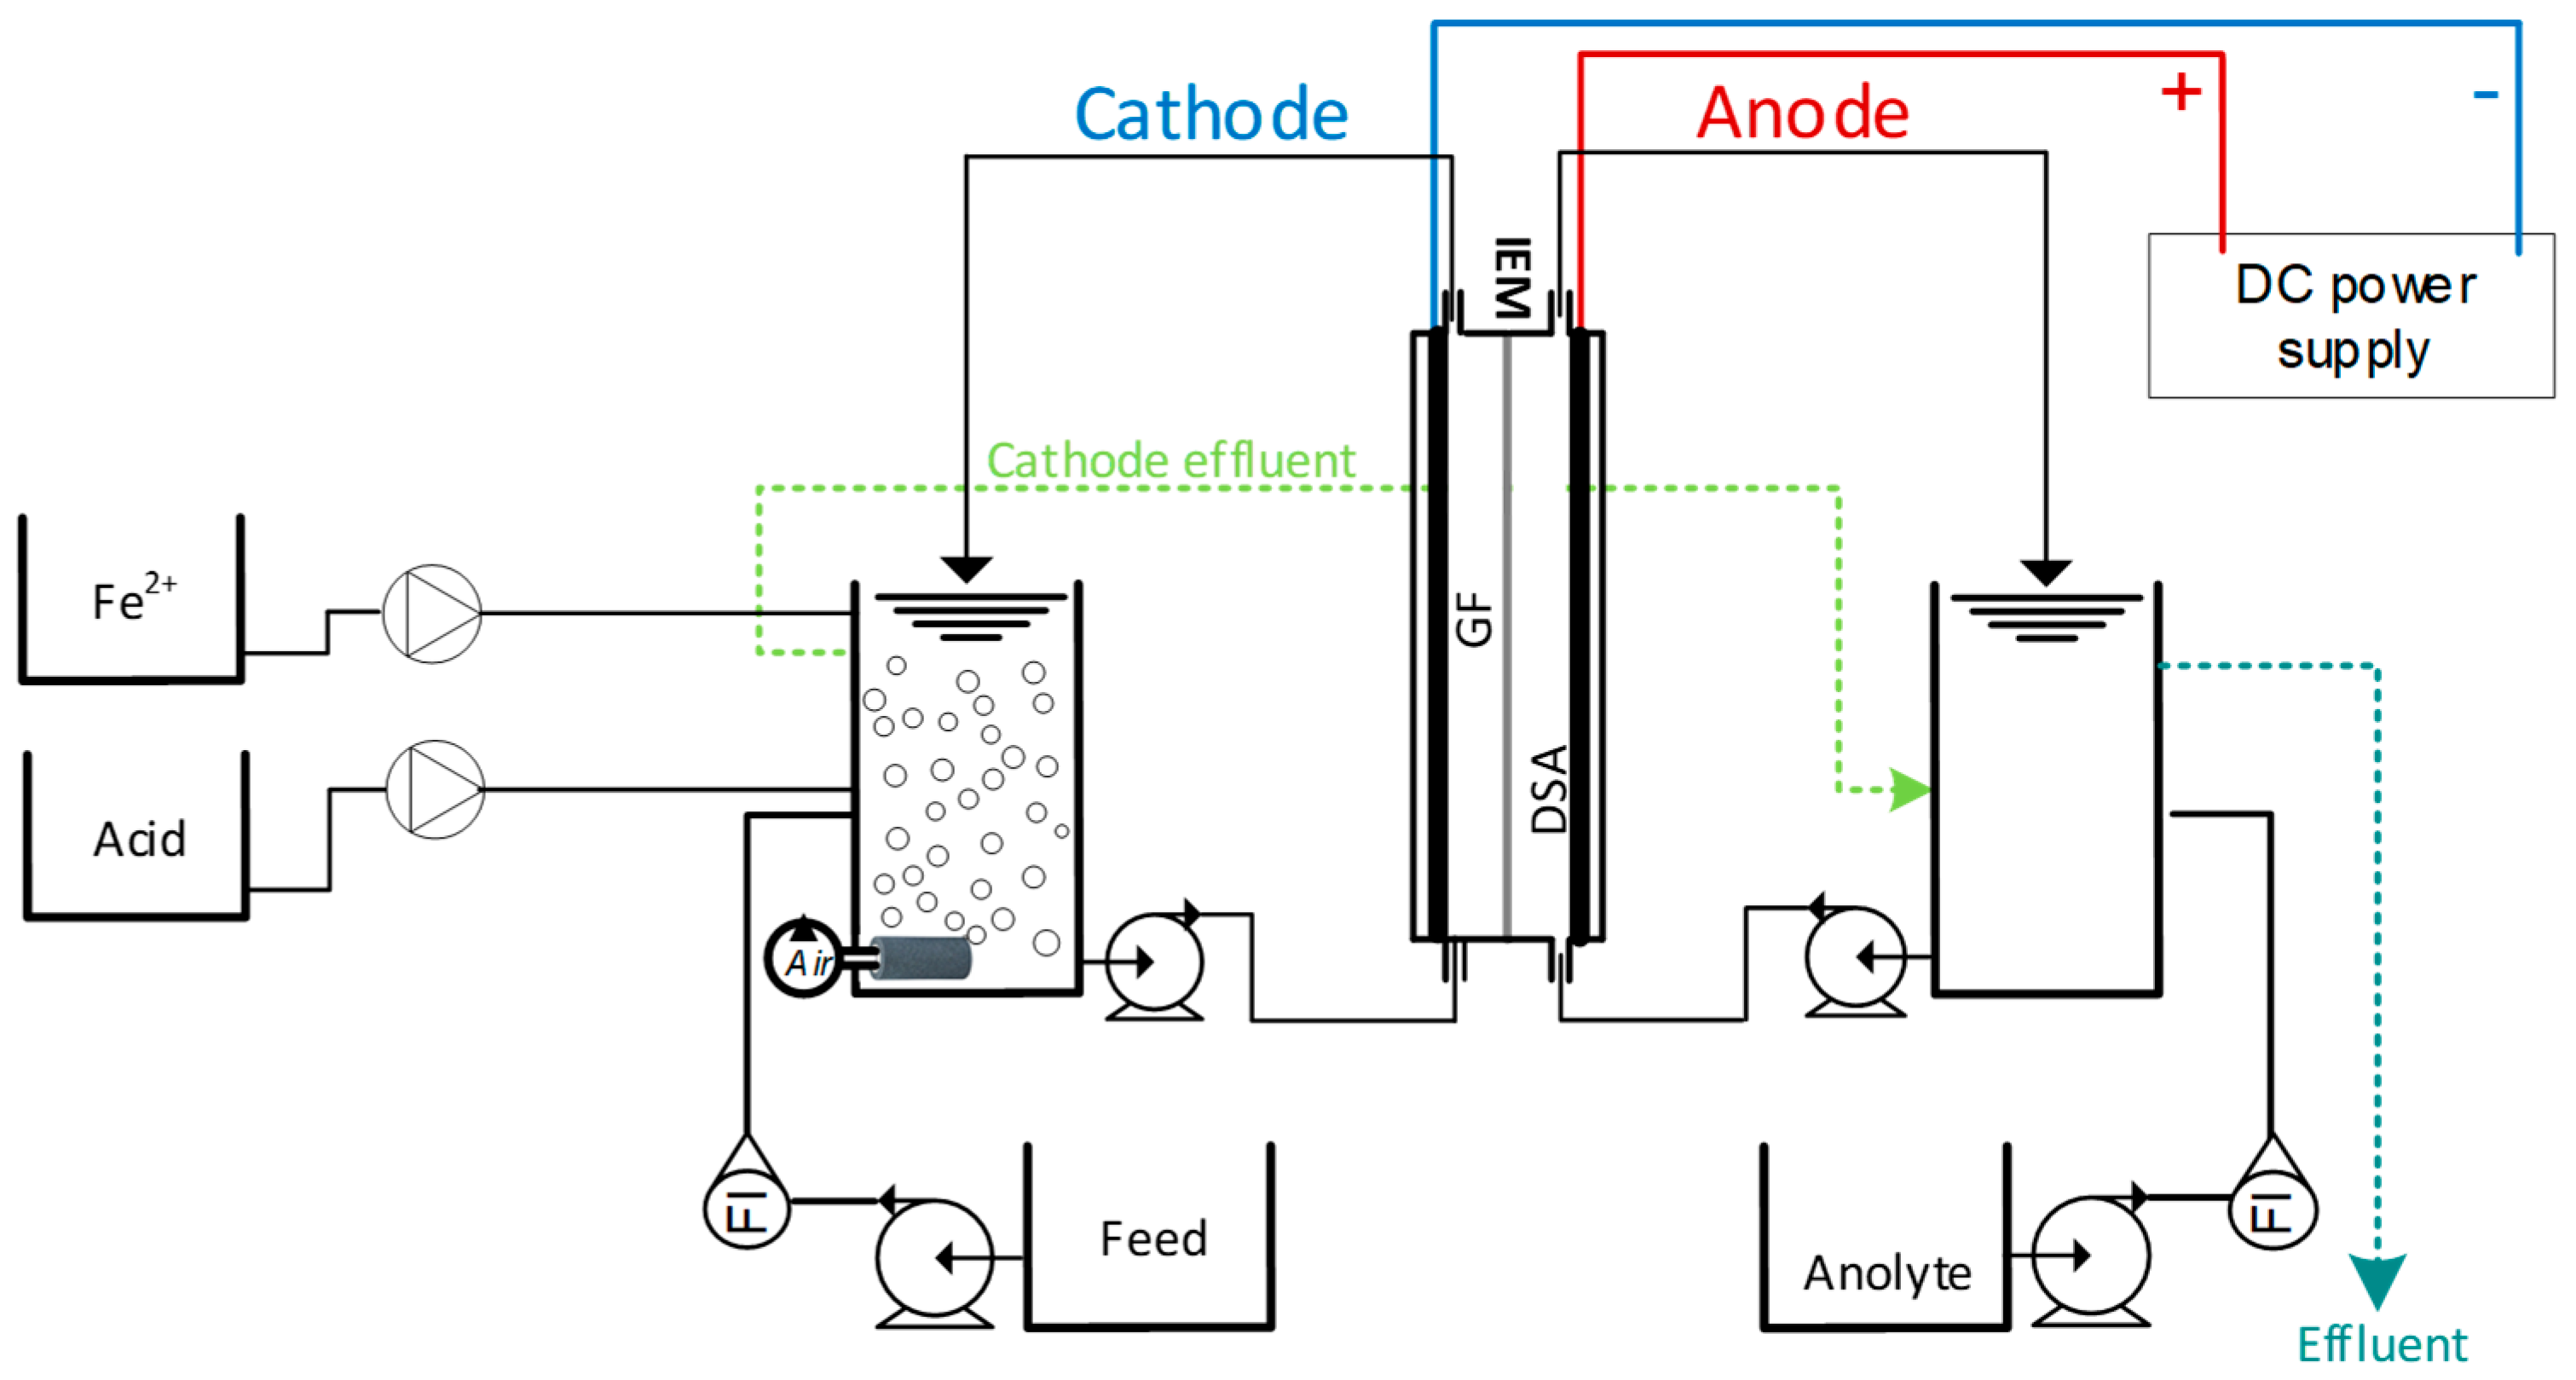
The electrolytic cell was integrated into a recirculating (closed-loop) system, schematically displayed in
Figure 1. Anolyte and catholyte reservoirs supplied the respective compartments, and the solutions (550 mL in each vessel) were continuously circulated by peristaltic pumps, establishing a working volume of 700 mL per compartment. Experiments were also conducted using a modified closed-loop configuration in which the cathodic effluent was directed from the cathode compartment to the anode compartment, as indicated by the green dashed line in
Figure 1.
Experiments were conducted by dosing fresh electrolyte (Na2SO4 or real effluent) at controlled flow rates, while simultaneously withdrawing an equal volume of effluent to maintain constant volume. Recirculation in both compartments ensured steady hydrodynamic conditions, allowing RT to be adjusted independently of the influent and effluent flow rates without altering the internal flow regime. The cathodic compartment was continuously aerated at a flow rate of 1.5 L/min, to maintain a constant dissolved oxygen concentration. An acid-dosing pump was used to maintain the desired pH in the EF experiments, and an additional dosing pump was used to supply Fe2+ to the cathodic compartment. Each experiment was conducted in duplicate, and average values with standard deviations are reported.
2.4. Electro-Production of H2O2
Experiments to determine the electro-production of H2O2 were carried out in a 0.1 M Na2SO4 electrolyte at a temperature of 23 ± 1 °C. Operating conditions were systematically varied, including current densities between 0.5 and 2.0 mA/cm2, obtained at applied currents of 100–400 mA and voltages of 1.4–2.8 V, circulation Re numbers of 406–1342 (corresponding flow rates of 0.7–2.5 L/min), residence times ranging from 2.6 to 82.4 min (corresponding flow rates of 250–8.5 mL/min), pH 2, 3, and 4, and temperature 9.1 ± 0.5, 23.0 ± 1, and 44.5 ± 1.5 °C.
2.5. Non-EF Removal Mechanisms
Experiments conducted to determine the adsorption and electro-adsorption of CBZ were carried out in the absence of Fe2+. Initially, batch experiments were carried out using 5 cm2 of GF or IEM with 1 mg/L of CBZ dissolved in 0.1 M Na2SO4 at pH 3 for 24 h. Further experiments were conducted to analyze the adsorption kinetics and isotherm characteristics of the IEM at CBZ concentrations ranging from 2 mg/L to 9 mg/L and an IEM active area of 5 cm2.
Adsorption onto the GF and IEM was performed at an RT of 5 min (corresponding to a flowrate of 138 mL/min) under circulation at Re of 1082, 1 mg/L CBZ without applying current. For GF adsorption tests, the IEM was removed. Electro-adsorption experiments were conducted at a CBZ concentration of 1.0 mg/L, a current density of 0.5, 1.5, and 2.0 mA/cm2 after the IEM was pre-saturated with CBZ at RTs of 5, 10, 23, and 60 min (corresponding to a flowrate of 12–138 mL/min), in 0.1 M Na2SO4.
The IEM was pre-saturated prior to all EF experiments to avoid adsorption-related effects. This was achieved by soaking the membrane in 1.4 L of 8 mg/L CBZ prepared in 0.1 M Na2SO4 at pH 3 for 94 h.
2.6. Electro-Fenton Experiments
All EF experiments were conducted using the divided cell configuration, as described in
Section 2.4, with a pre-saturated IEM. Although the membrane exhibited CBZ adsorption, its use during EF operation was essential to prevent anodic H
2O
2 loss and maintain process selectivity; these adsorption effects were quantified separately and accounted for in the analysis. Unless otherwise specified, the catholyte and anolyte had identical electrolyte compositions (0.1 M Na
2SO
4, adjusted to pH 3), ensuring comparable ionic strength and conductivity in both compartments. The two solutions were circulated through separate hydraulic loops, with independent recirculation tanks supplied from a common electrolyte reservoir.
The effect of the following parameters was investigated in a 0.1 M Na2SO4 electrolyte at 23 ± 1 °C and a pH of 3.0. The effect of H2O2 to Fe2+ molar ratio was tested at a current density of 1.5 mA/cm2 and RT of 5 min, as these conditions yielded the highest H2O2 concentration (0.30 mM) while maintaining CE ≥ 50%. The catholyte baseline flow rate was 138 mL/min (corresponding to RT of 5 min based on the cathodic compartment volume), unless otherwise stated. Voltage was applied only after the system reached membrane-to-bulk equilibrium (4 RTs), after which Fe2+ was added to initiate the electro-Fenton reaction. Fe2+ was supplied from an FeSO4·7H2O salt solution to obtain the desired molar ratios. Concentrations of 0.30, 0.15, 0.03, 0.012, and 0.006 mM Fe2+ were tested, corresponding to H2O2 to Fe2+ molar ratios of 1:1, 2:1, 10:1, 25:1, and 50:1, respectively, with ratios calculated on a molar basis, while H2O2 and CBZ concentrations are reported in mg/L throughout the manuscript.
The effect of current density was evaluated at RT of 5 min and a fixed H2O2 to Fe2+ ratio of 25:1 by applying 100, 200, and 300 mA, resulting in j = 0.5, 1.0, and 1.5 mA/cm2, based on the geometric cathode area (200 cm2). Higher current densities yielded CE < 50%. Residence times of 5.0 min and 2.6 min were studied at a H2O2 to Fe2+ molar ratio of 25:1 and j = 1.5 mA/cm2. These RTs were chosen as higher RTs resulted in CE < 50%.
The influence of anolyte flow rate on CBZ removal in the cathodic compartment was evaluated under asymmetric flow conditions. The catholyte flow rate was maintained constant at 138 mL/min (corresponding to RT of 5 min), while the anolyte flow rate was varied to 12, 30, 70, and 138 mL/min (corresponding to RTs of 58, 23, 10 and 5 min). At these flow rates, cathode to anode flow rate ratios of 10:1, 5:1, 2:1, and 1:1 were achieved. These experiments were conducted at a molar ratio of H2O2 to Fe2+ 25:1 and j = 1.5 mA/cm2.
To evaluate the effect of recirculating the catholyte through the anodic compartment on CBZ removal and system efficiency, experiments were performed in a modified closed-loop configuration in which the stream exiting the cathode compartment was directed into the anode compartment. In this setup, treated catholyte served as the anode feed stream. The experiments were carried out in a 0.1 M Na2SO4 electrolyte, 23 ± 1 °C, pH 3, molar ratio of 25:1 H2O2 to Fe2+, j = 1.5 mA/cm2, and RT of 5 min.
2.7. Fenton Reactions
Removal of CBZ by Fenton reactions was conducted in a 1.5 L polycarbonate cylindrical stirred-tank reactor (reaction volume of 700 mL) at pH 3.0, 23 ± 1 °C, and an RT of 5 min. Experiments were carried out at molar ratios of 1:1, 2:1, 10:1, 25:1 H2O2:Fe2+, using hydrogen peroxide concentrations of 11.1 mg/L (corresponding to the H2O2 concentration generated at j = 1.5 mA/cm2) and 20.2 mg/L chosen to achieve CBZ removal comparable to that obtained under EF conditions. Reactants were continuously dosed under an overflow configuration (i.e., inlet and outlet flow rates were equal) to maintain a constant working volume. The total inlet flow rate was 140 mL/min, consisting of 70 mL/min CBZ feed solution, 35 mL/min H2O2 solution, and 35 mL/min Fe2+ solution. Feed concentrations of CBZ, H2O2, and Fe2+ were adjusted to achieve the specified H2O2 concentration and corresponding Fe2+ level, maintaining the H2O2:Fe2+ molar ratio (25:1) and ensuring direct comparability with EF conditions. Acid (1.0 M H2SO4) was dosed using an additional peristaltic pump at a flow rate of 0.5 mL/min to maintain the pH at 3.0. Mixing was provided by an overhead mechanical stirrer operated at 200 rpm.
2.8. Secondary Effluent
Secondary effluent was obtained from the Haifa WWTP (Israel). The WWTP receives wastewater from households supplied with desalinated water (conductivity of 0.3 mS/cm). The effluent quality is listed in
Table 1. EF and Fenton oxidation experiments were conducted at RT of 5 min, pH 3, room temperature, and molar ratios of 25:1, 10:1, 2:1, and 1:1 H
2O
2 to Fe
2+. The EF experiments were conducted at a current density of 1.5 mA/cm
2, with the treated effluent exiting the cathode compartment directed into the anode compartment.
2.9. Analytical Methods
The concentration of CBZ was measured using an Agilent 1260 Infinity LC (Agilent, Santa Clara, CA, USA) with a Zorbax Eclipse XDB-C18 column. The flow rate was 0.3 mL/min, and the eluent consisted of HPLC-grade acetonitrile and HPLC-grade water at a ratio of 60:40 (
v/
v). The injection volume was 10 µL, and the analysis was performed at a wavelength of 220 nm at a column oven temperature of 25 °C. Hydrogen peroxide concentration was determined using the Ghormley method [
16]. Iron concentration was determined using Hach method 8008 (FerroVer
® Iron Reagent Powder Pillows) with a DR 2800 spectrophotometer (Hach, Düsseldorf, Germany).
3. Results
3.1. H2O2 Electro-Production
H
2O
2 electro-production was evaluated as a function of five operating parameters: current density, residence time, Re number, temperature, and pH. The results are summarized in
Table 2, which also reports CE (Equation (1)), and SEC (Equation (2)), expressed as the electrical energy required to produce 1 kg H
2O
2.
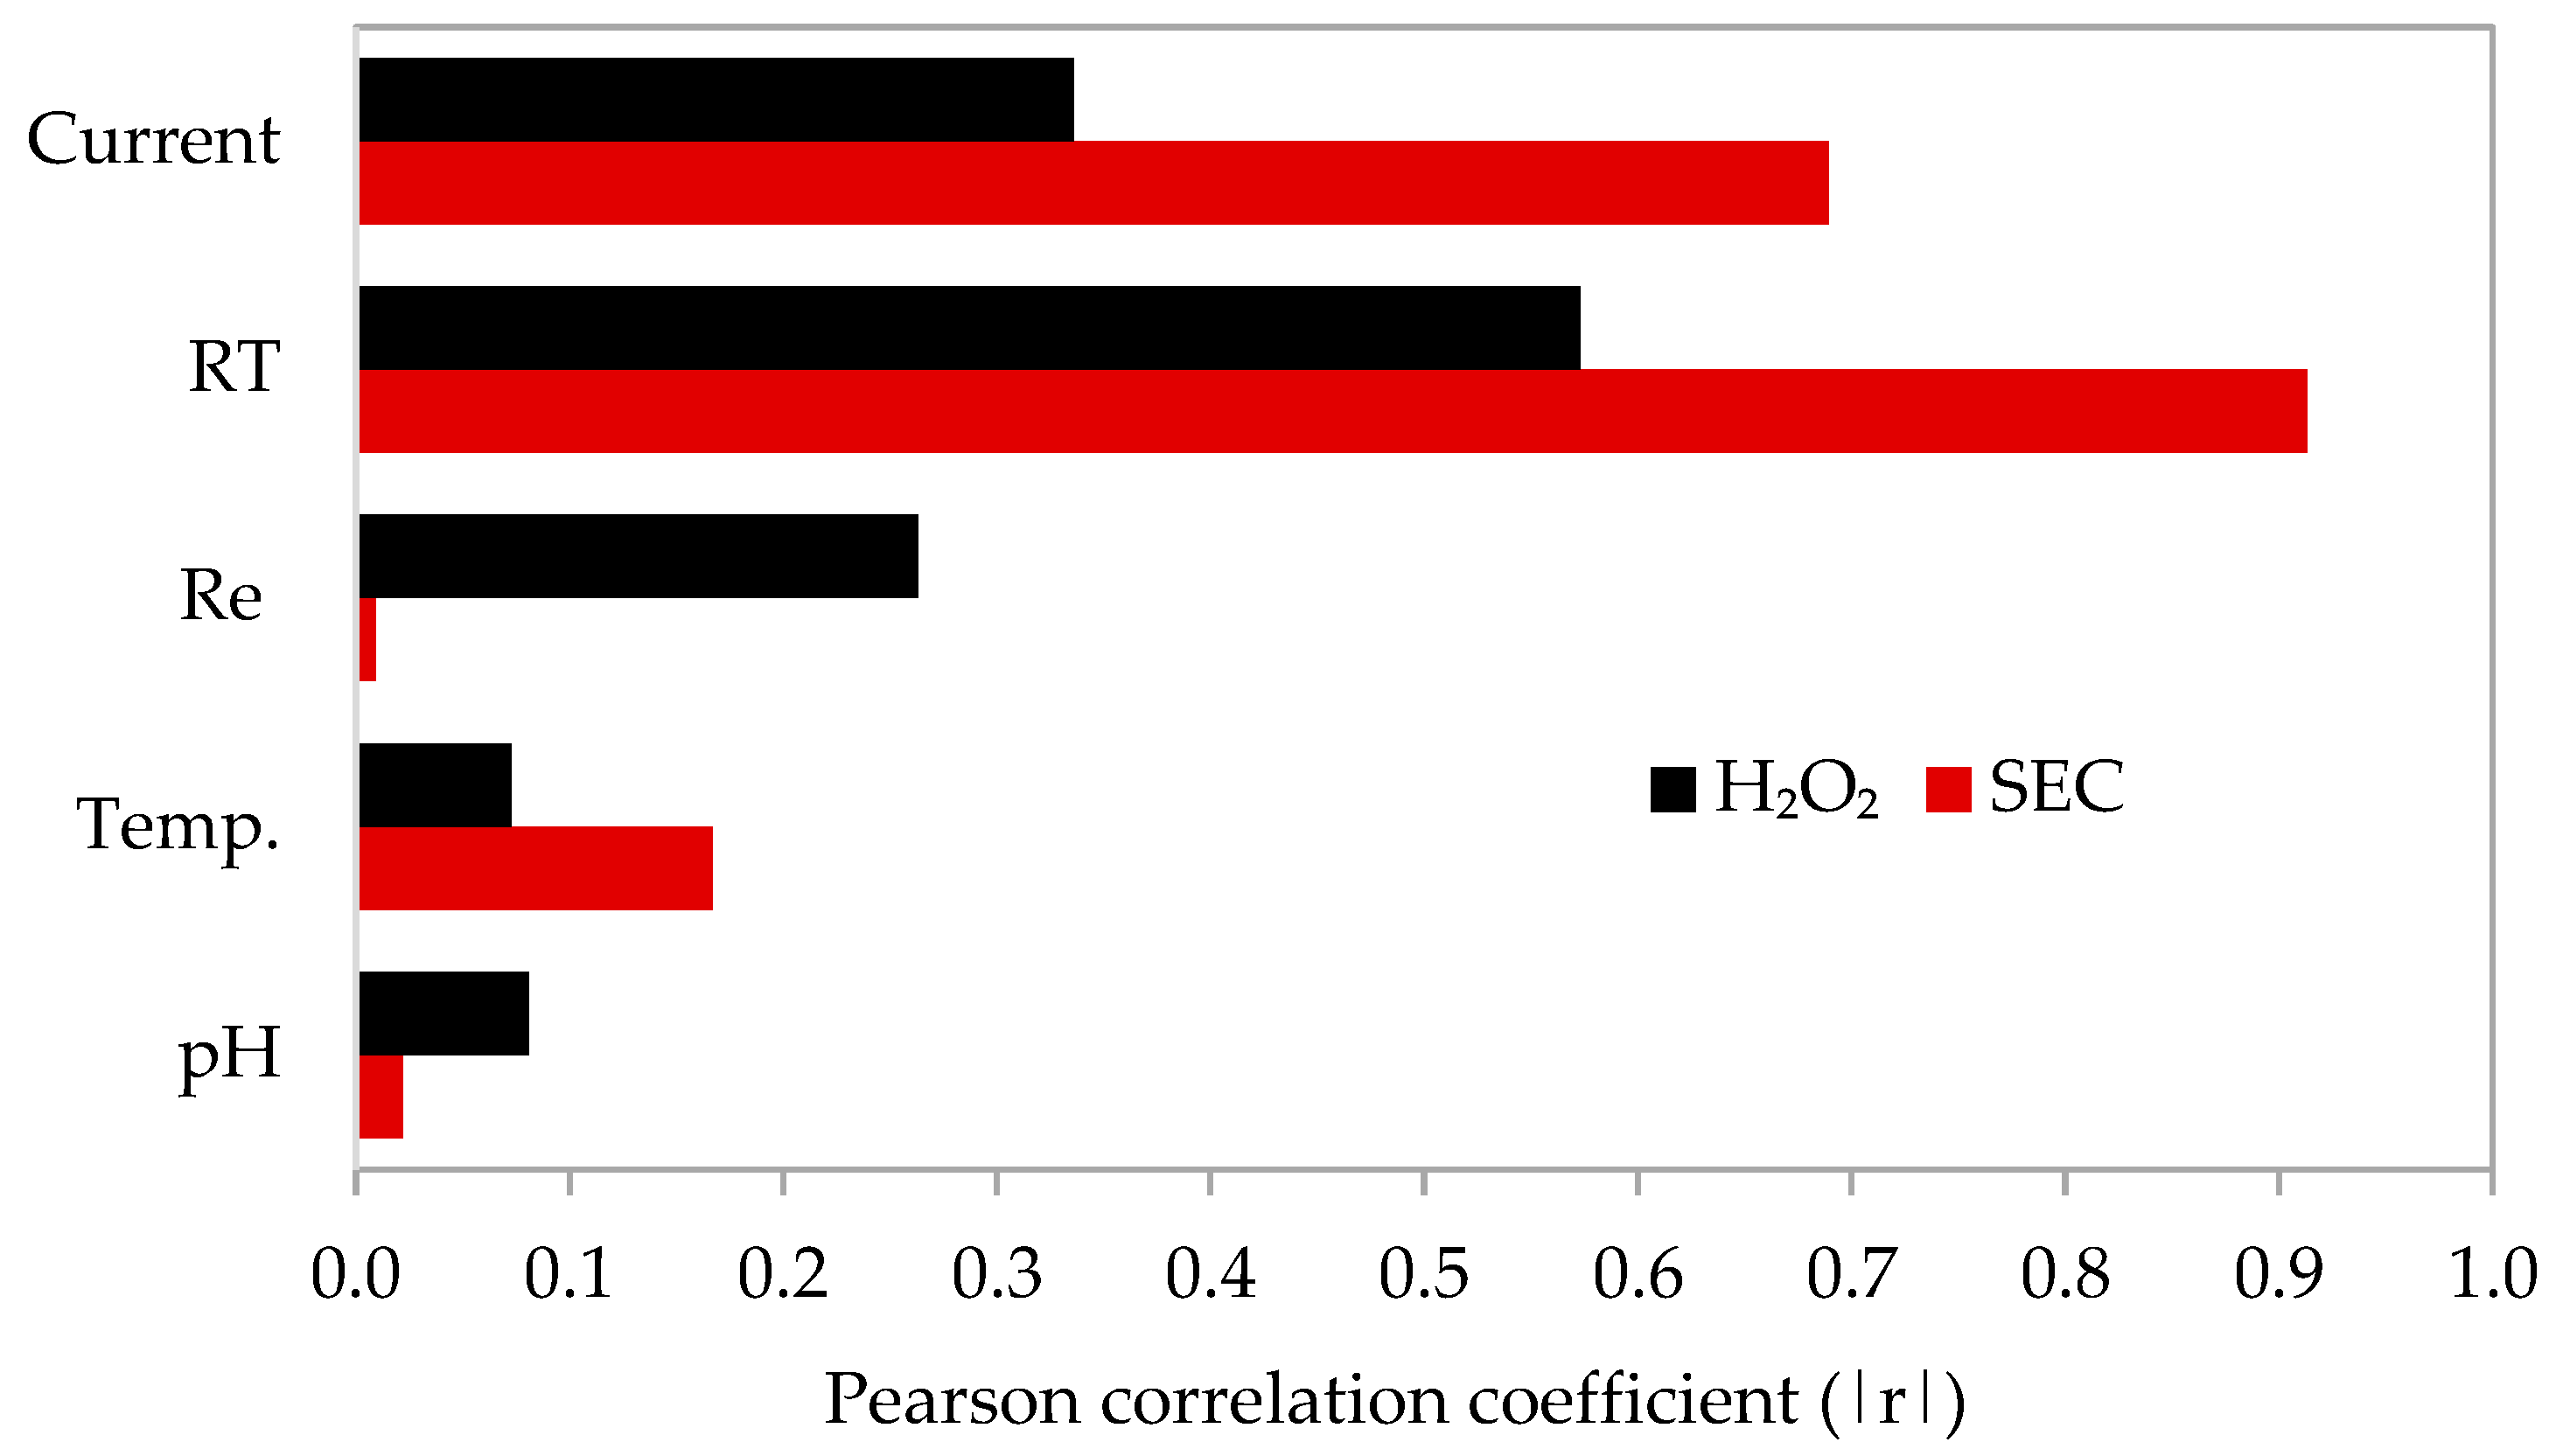
To identify the parameters governing H
2O
2 production and energy demand, Pearson correlation coefficients (r) were calculated between each operating parameter and both H
2O
2 concentration and SEC using Equation (3). The results are displayed in
Figure 2. Since H
2O
2 concentration and current efficiency are directly and mathematically linked under fixed operating conditions (V, I, and t; Equation (1)), CE was not treated as an independent response variable in the Pearson correlation analysis. Accordingly, only H
2O
2 concentration was retained as the response variable to avoid redundancy. Absolute correlation coefficients (|r|) are presented to allow for direct comparison of the relative influence of each parameter.
As shown in
Figure 2, residence time and current density exhibit the strongest correlations with both responses, whereas Re number shows a moderate correlation with H
2O
2 concentration but a negligible correlation with SEC. Temperature and pH display weak correlations with both metrics within the investigated ranges. These results indicate that SEC is dominated by residence time and current density, which directly control electrical power input and operating time. The near-zero correlation between Re number and SEC indicates that, beyond a minimum mixing threshold (Re ≈ 1082), increased circulation primarily influences mass transfer and leads to only minor increases in H
2O
2 yield, rather than affecting the electrical energy requirement. Similarly, operation under acidic conditions ensured favorable 2e
−-ORR kinetics; therefore, moderate pH variations had little impact on cell voltage or current efficiency. Temperature variations within the studied range exhibited only a minor influence on electrolyte conductivity and electrode overpotentials, resulting in marginal changes in SEC.
where
n is the number of electrons per O
2 reduced to H
2O
2,
F is the Faraday constant (C/mol),
C is the concentration of H
2O
2 (mol/L),
V is the bulk volume (L),
I is the current (A), and
t is the time (s).
where
U is the applied cell voltage (V), and
is the mass of H
2O
2 produced (kg)
As summarized in
Table 2, the CE values ranged from 4.8% to 66.9%, while SEC values varied between 4.0 and 68.7 kWh/kg H
2O
2. Based on the correlation analysis, operating conditions for further experiments were selected, using CE as the primary criterion. A CE threshold of ≥50% (highlighted in
Table 2), corresponding to SEC values of 4.0–6.9 kWh/kg H
2O
2, was adopted to define the energy-efficient operating regime. Although higher H
2O
2 concentrations can be achieved at lower CE, these conditions are associated with disproportionately high SEC, resulting in energetically unfavorable operation for practical H
2O
2 electro-production. At the process level, because H
2O
2 is generated in situ via electrochemical oxygen reduction, the efficiency of its electro-production is a key determinant of overall energy demand. More broadly, in H
2O
2-based advanced oxidation processes such as Fenton oxidation, the efficiency of H
2O
2 generation, delivery, and utilization largely governs process energy demand and sustainability, since H
2O
2 is the primary precursor for hydroxyl radical formation.
Although RT of 2.6 min yielded higher CE and lower SEC, RT of 5 min was selected as the standard operating condition for EF experiments because it provided more stable hydrodynamics, reduced sensitivity to pump pulsation, improved measurement accuracy, and provided a more operationally robust basis for scale-up, consistent with practical hydraulic RT of 3–10 min. Accordingly, benchmark operating conditions were defined as RT of 5 min, a current density of 1.5 mA/cm2, a Re number of 1082, pH 3, and room temperature (23 ± 1 °C), representing an effective balance between H2O2 yield and energy efficiency.
3.2. Non-EF Removal Mechanisms of CBZ
3.2.1. Batch Adsorption
Batch experiments were conducted to evaluate the adsorption of CBZ onto the GF and the Nafion IEM over 24 h at an initial CBZ concentration of 1 mg/L. No adsorption was observed on the GF, whereas the IEM adsorbed approximately 32 ± 1.5% of CBZ. The observed uptake is consistent with the known affinity of neutral MPs for Nafion’s microphase-separated structure, where the hydrophobic PTFE matrix and sulfonic acid hydration domains facilitate non-electrostatic interactions such as hydrophobic partitioning, π–π interactions, and hydrogen bonding [
10,
17,
18]. CBZ adsorption onto Nafion was well described by both Langmuir and Freundlich models, indicating finite sorption capacity and heterogeneous binding sites. Based on these results, the IEM was pre-saturated prior to EF experiments to eliminate adsorption effects.
3.2.2. Flow Through Adsorption and Electro-Adsorption
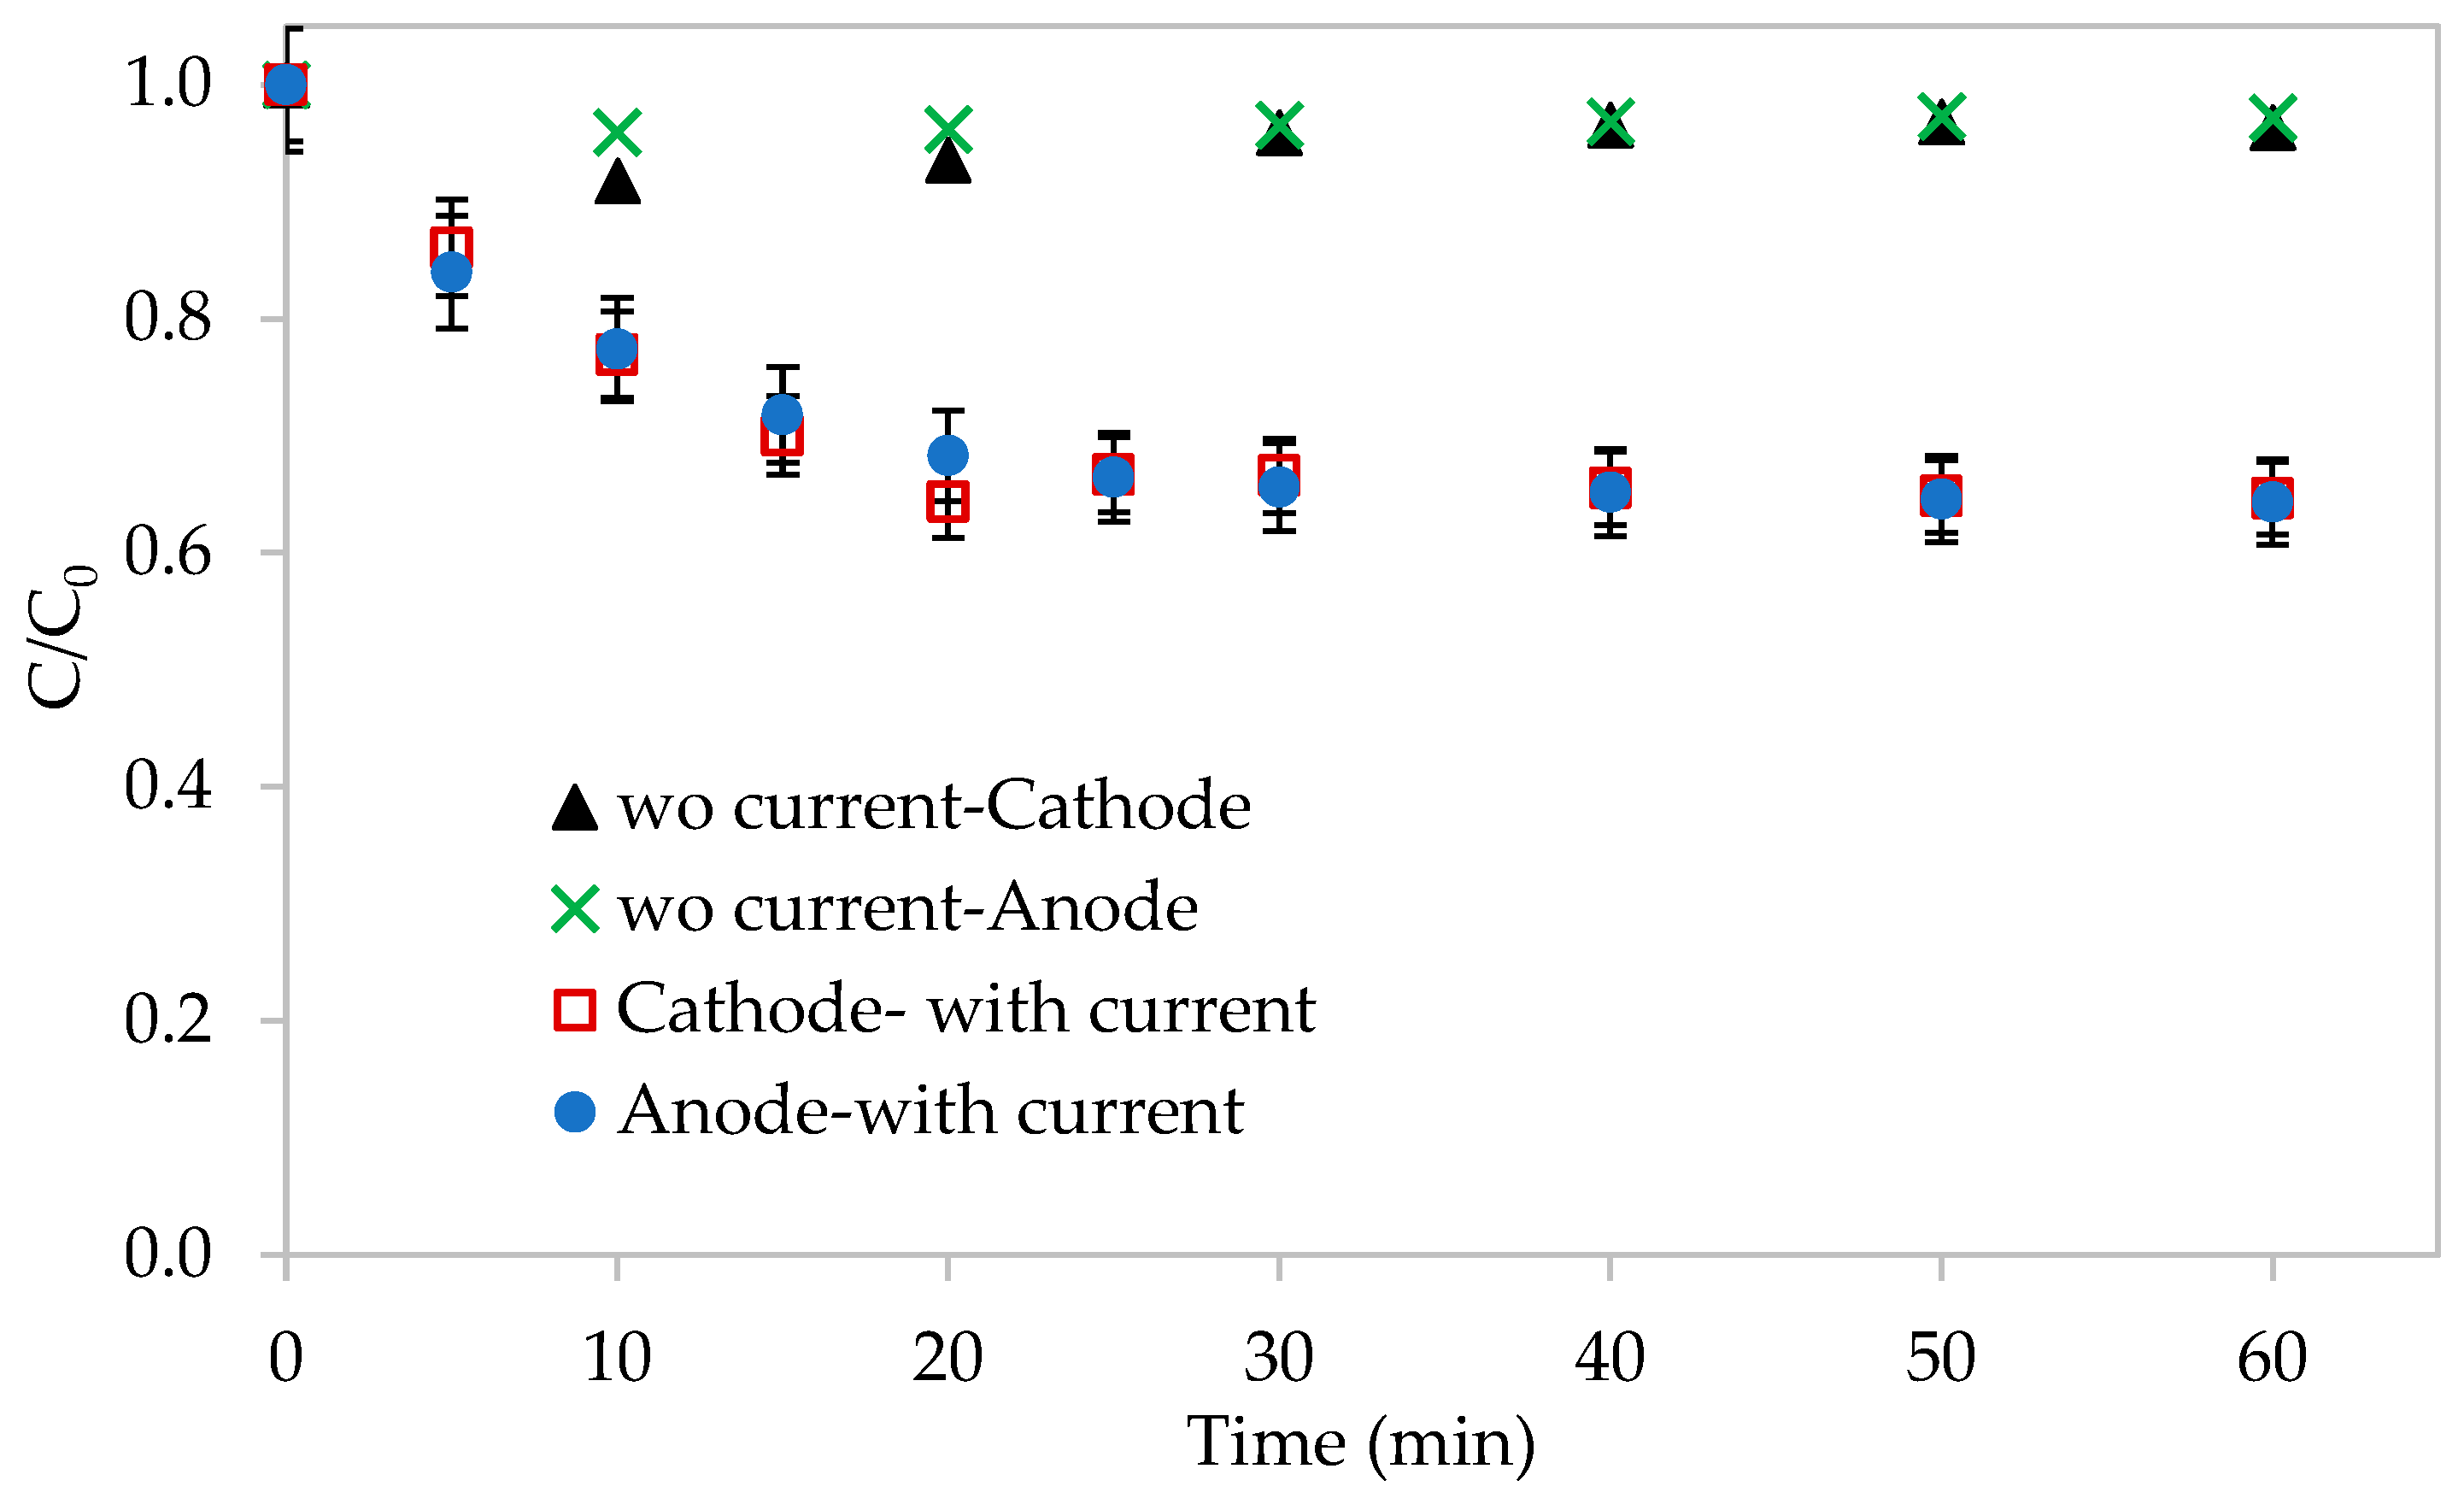
Without applying current, CBZ at an initial concentration of 1 mg/L was not removed by the GF or the pre-saturated IEM during the 60 min experiment (12 RTs), as inlet and outlet CBZ concentrations remained essentially unchanged (C/C
0 ≈ 0.97;
Figure 3), indicating only minor (~3%) variation within experimental uncertainty. When current was applied to the electrolytic cell with a pre-saturated IEM, CBZ concentration decreased rapidly and reached 0.66 ± 0.05 mg/L after 20 min (4 RTs) on both anodic and cathodic compartments, corresponding to approximately 35% being independent of the applied current (100–300 mA). The symmetric removal observed in both compartments excludes electro-adsorption onto the GF, as the DSA anode is non-adsorptive, and rules out anodic oxidation or cathodic H
2O
2-mediated degradation, given the high oxidation potential of CBZ and its stability toward H
2O
2 in the absence of Fe
2+.
The observed symmetric ~35% CBZ uptake under the applied currents is therefore attributed to electrically driven transport and redistribution within and across the IEM, rather than additional adsorption onto vacant sites. Application of an electric field induces electro-osmotic drag, which convects hydration water and entrained neutral solutes [
18,
19,
20]; field-dependent partitioning that alters the distribution of CBZ between membrane domains and the bulk solution [
18]; and interfacial electrokinetic gradients (i.e., concentration polarization and crowding) that enhance directional uptake and release at the membrane surface [
21,
22]. Together, these processes enable non-equilibrium accumulation and redistribution of uncharged CBZ within the membrane without chemical transformation.
At short RTs of 5–10 min, electrically driven transport contributes significantly to CBZ uptake, accounting for approximately 35% of total CBZ uptake. Increasing the RT to 23 and 58 min resulted in 64.1% and 80.5% uptake, respectively, reflecting the increasing contribution of time-dependent uptake processes as solute–membrane contact is prolonged [
12,
23]. With increasing RT, the system shifts from a kinetically controlled regime to transport increasingly governed by slower internal diffusion processes within the membrane structure, allowing CBZ to progressively access internal sorption sites within the Nafion matrix [
17,
23]. This time-dependent accumulation is consistent with the strong affinity of neutral CBZ for Nafion, and the nano-phase-separated structure of perfluorinated membranes, in which penetration of organic solutes into internal polymer domains is inherently slow [
17,
19]. Accordingly, the system was allowed to reach membrane-solution equilibrium prior to Fe
2+ addition, corresponding to four residence times (4 RTs).
3.3. EF Removal of CBZ
Electrochemical benchmark conditions to test the effect of H
2O
2 to Fe
2+ molar ratio (ranging from 2:1 to 50:1) were established at
j = 1.5 mA/cm
2 and RT of 5 min, as they yielded the highest H
2O
2 concentration (0.3 mM) while maintaining CE of 50.4 ± 1.0% (
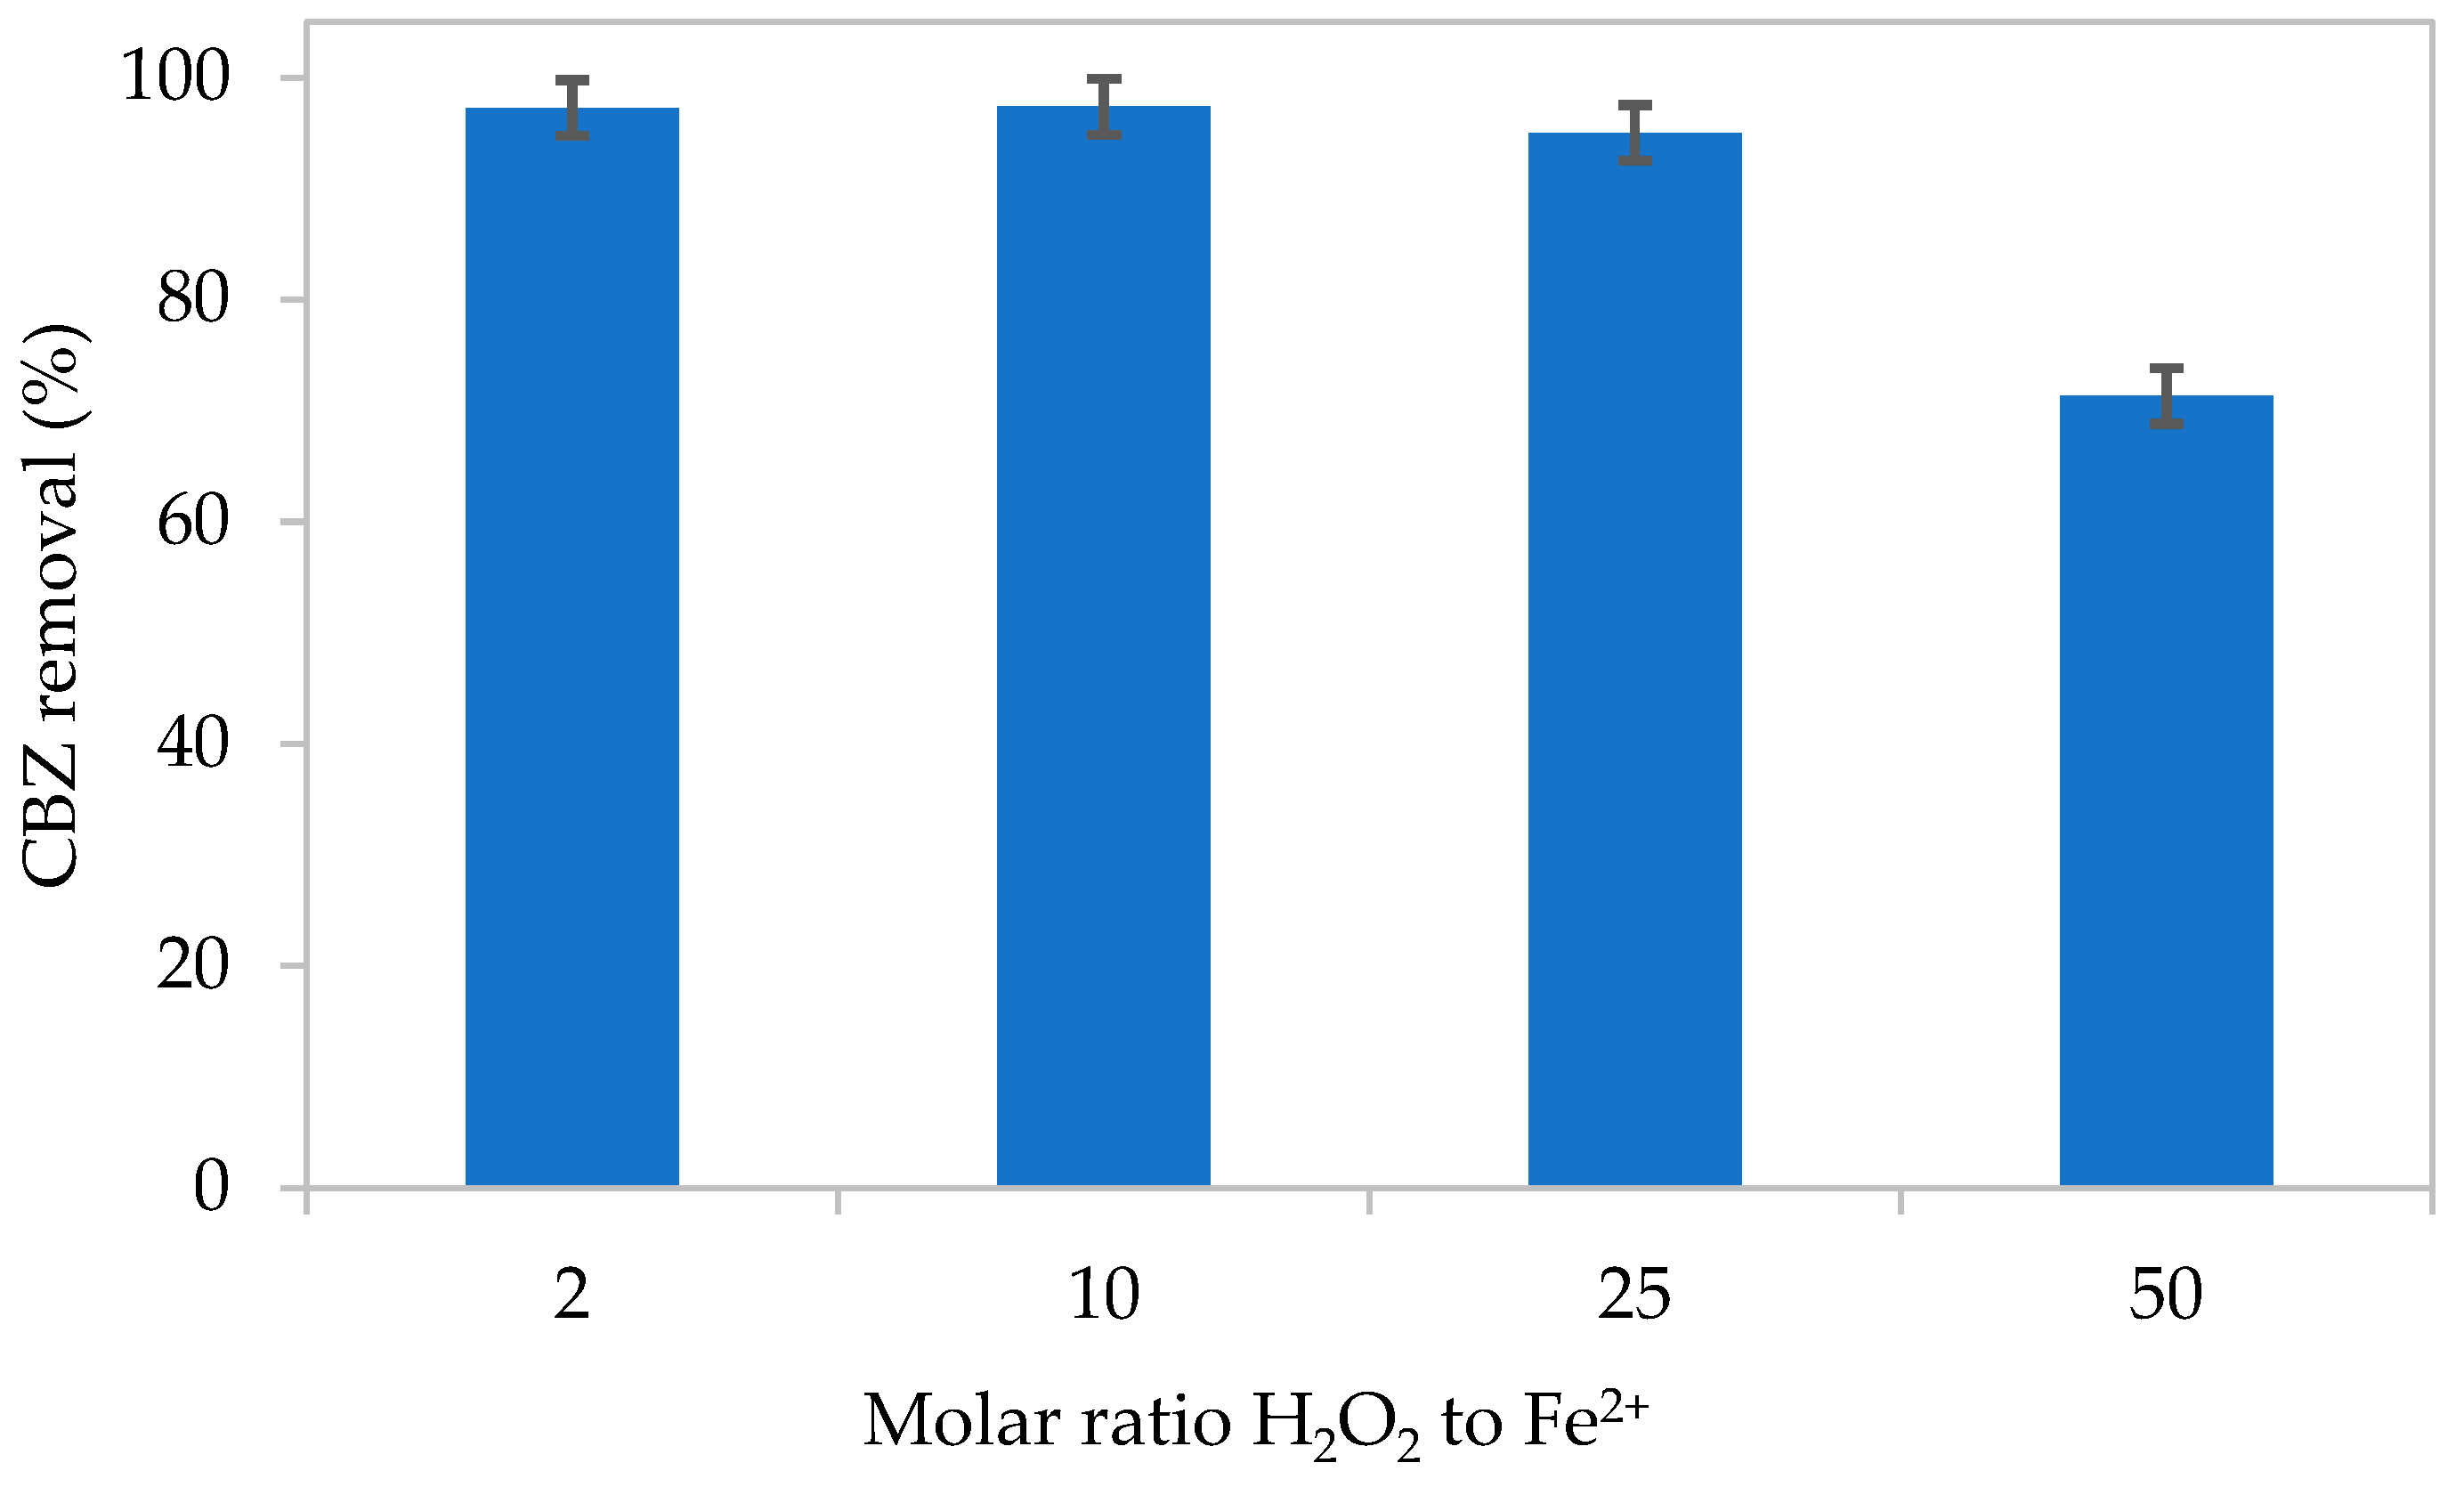
Table 3). As seen in
Figure 4, CBZ removal at molar ratios of 2:1 and 10:1 (H
2O
2:Fe
2+) averaged 97.3 ± 1.5%, while 25:1 yielded a comparable value of 95.0 ± 2.5%. In contrast, removal decreased to 71.3 ± 1.1% was obtained at 50:1. The reduced performance at the higher ratio is attributed to lower Fe
2+ concentrations, which limit hydroxyl radical production [
13] and thereby hinder CBZ degradation. A 25:1 molar ratio was therefore chosen for further experiments, as it maintained high CBZ removal efficiency, while reducing Fe
2+ consumption by approximately 2.5-fold compared with the 10:1 ratio. This reduced iron dosage is advantageous from a sustainability perspective, as it is expected to lower operational costs, minimize sludge generation, and mitigate iron release to the environment.
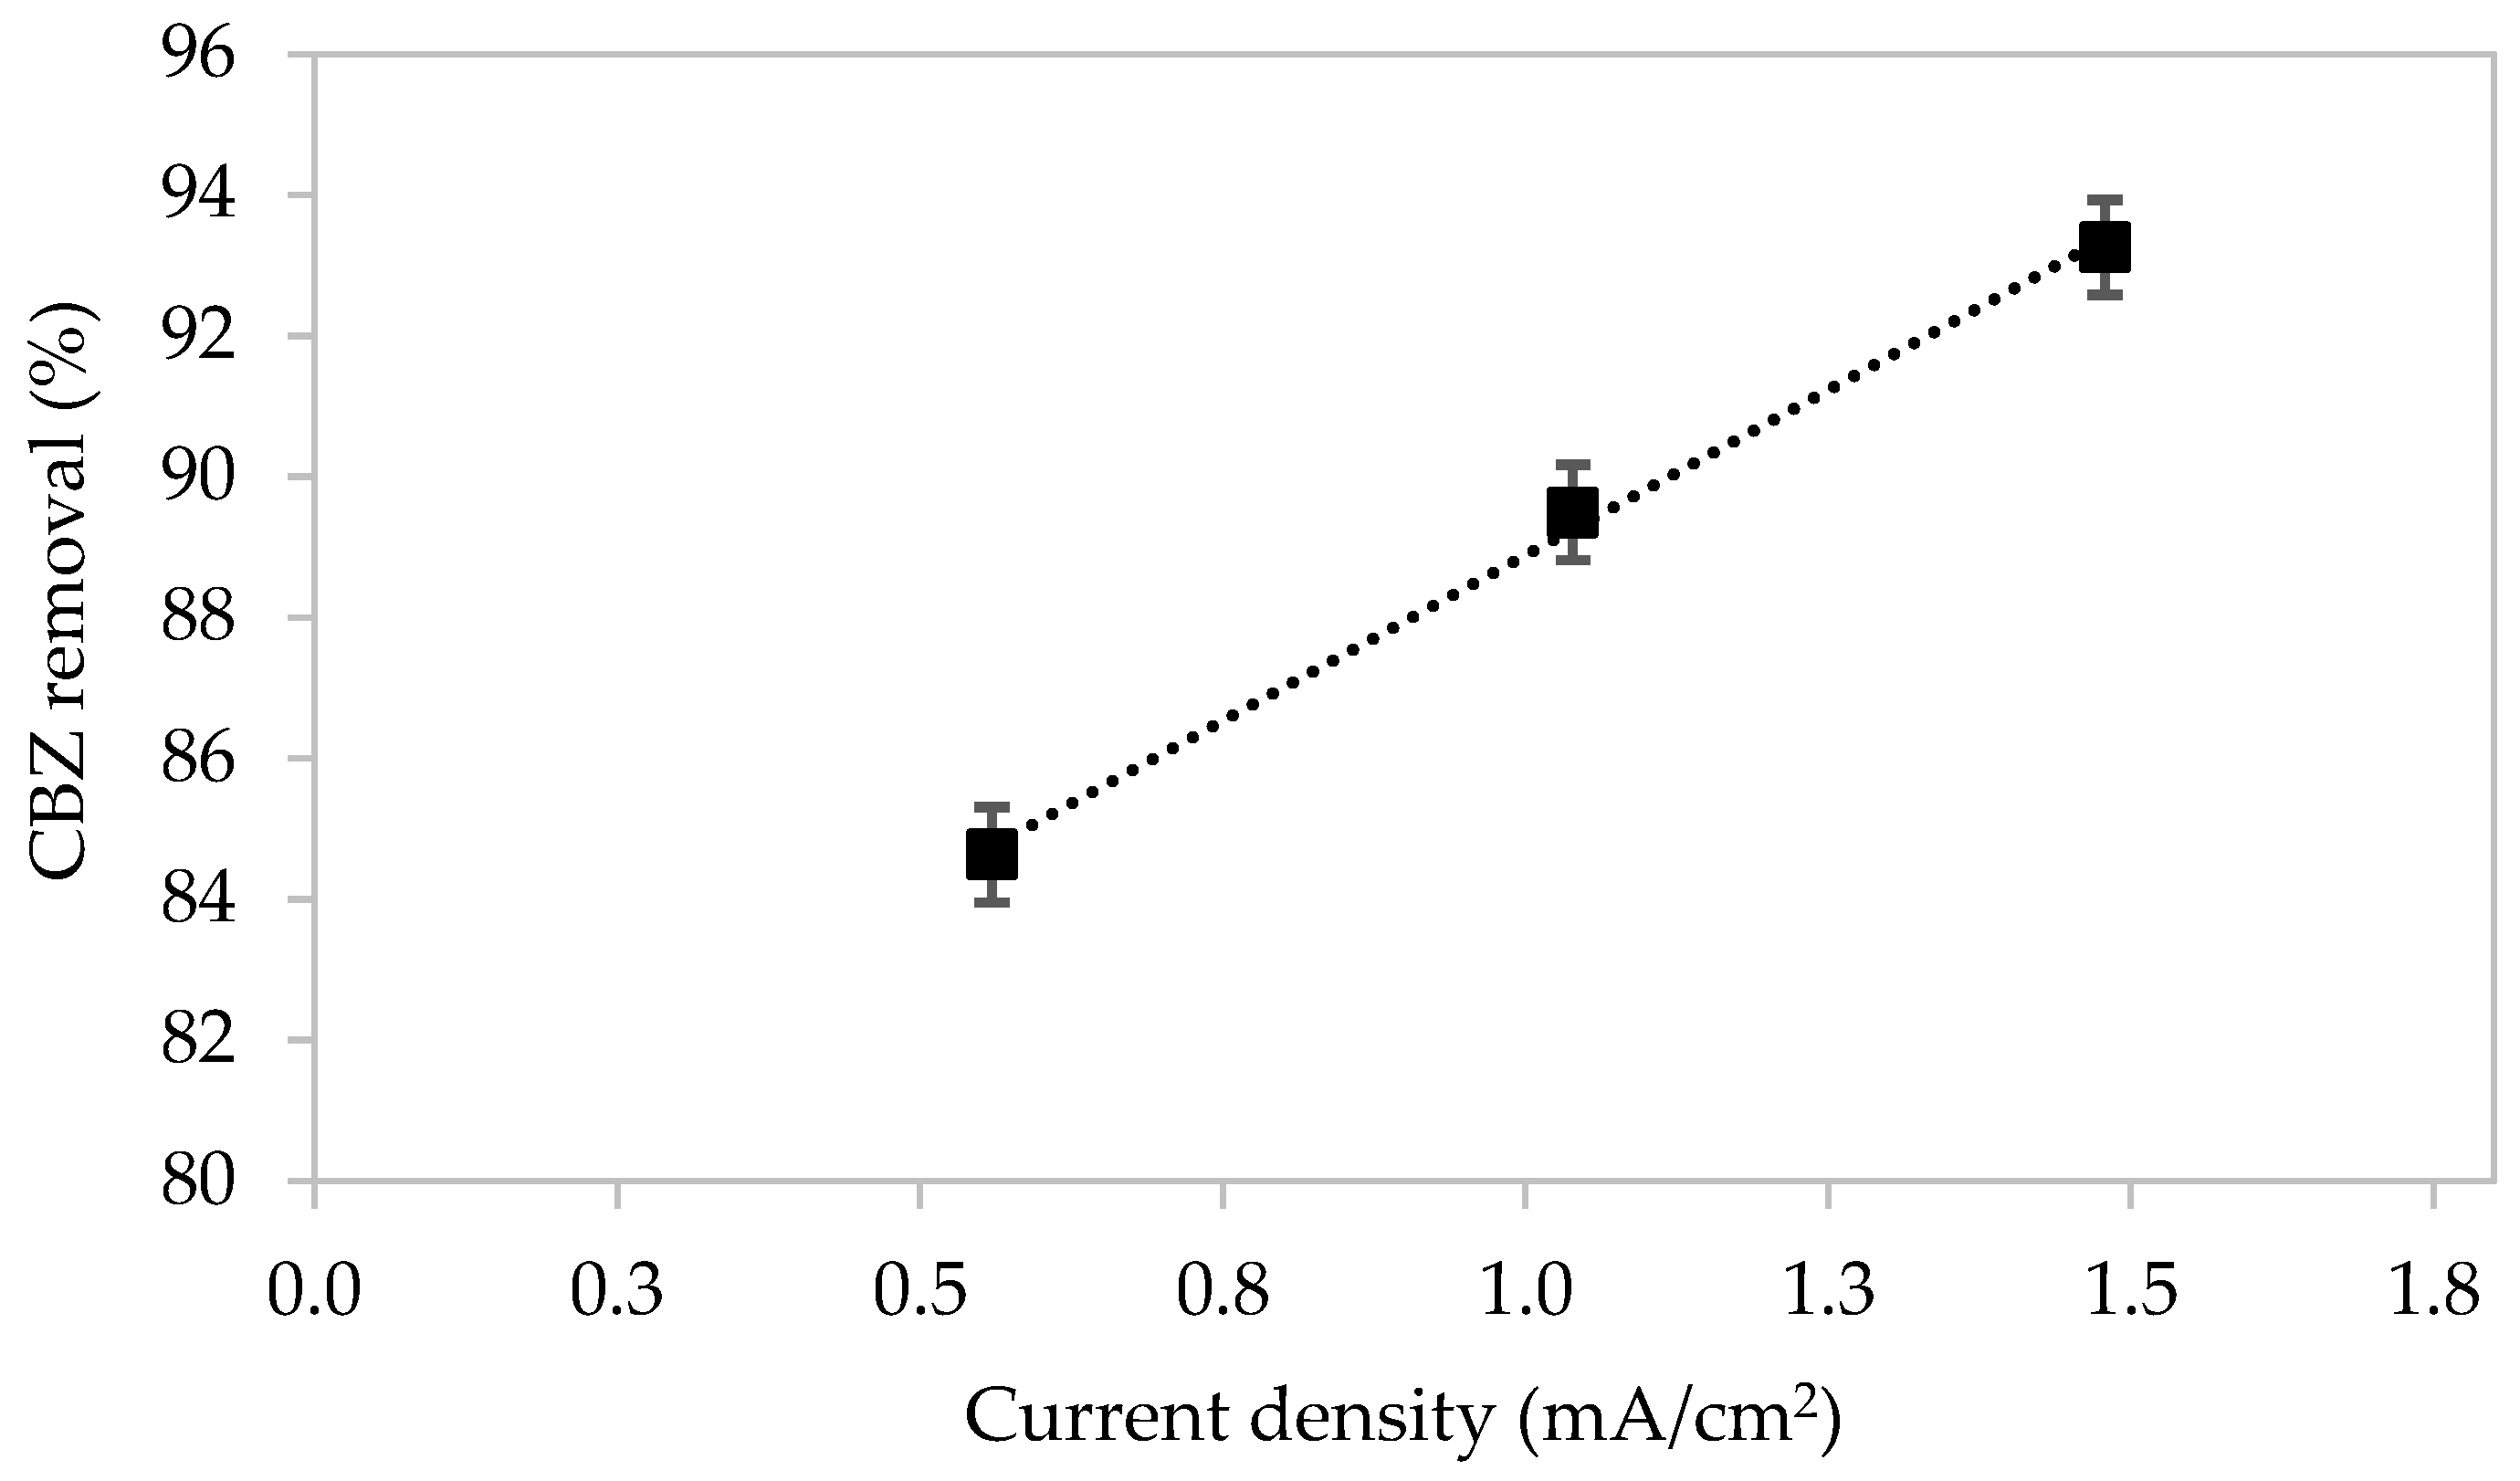
The influence of current density on CBZ degradation efficiency at a constant H
2O
2 to Fe
2+ molar ratio of 25:1 and RT of 5 min is displayed in
Figure 5. CBZ removal increased linearly with increasing current density, from 84.6 ± 1.3% at 0.6 mA/cm
2 to 89.5 ± 1.3% at 1.0 mA/cm
2, and reached 95.0 ± 2.5% at 1.5 mA/cm
2. This trend reflects the enhanced production of H
2O
2 and hydroxyl radicals at higher applied currents [
6,
24], which enhance effective CBZ oxidation.
Current efficiency of 50.8 ± 0.9% was obtained at
j = 1.0 and 1.5 mA/cm
2, while a lower value of 38.2 ± 2.2% was obtained at
j = 2.0 mA/cm
2 (
Table 2). It is established that current efficiency tends to plateau or decline at higher current densities as oxygen transport to the cathode becomes rate-limiting, leading to rapid depletion of dissolved O
2 at the electrode surface. As a result, the fraction of current contributing to the 2e
−-ORR decreases, while further reduction of oxygen intermediates and other side reactions increase. At the same time, H
2O
2 consumption via the Fenton reaction and cathodic reduction increases proportionally with its generation rate [
24], hence the ratio used in the CE expression (Equation (1)) remains largely unaffected. The slightly higher CE (56.1 ± 0.22) at the lowest current density of 0.6 mA/cm
2 (
Table 3) likely reflects reduced kinetic competition between the desired 2e
−-ORR pathway and parallel side reactions, allowing a greater fraction of electrons to form H
2O
2 [
24].
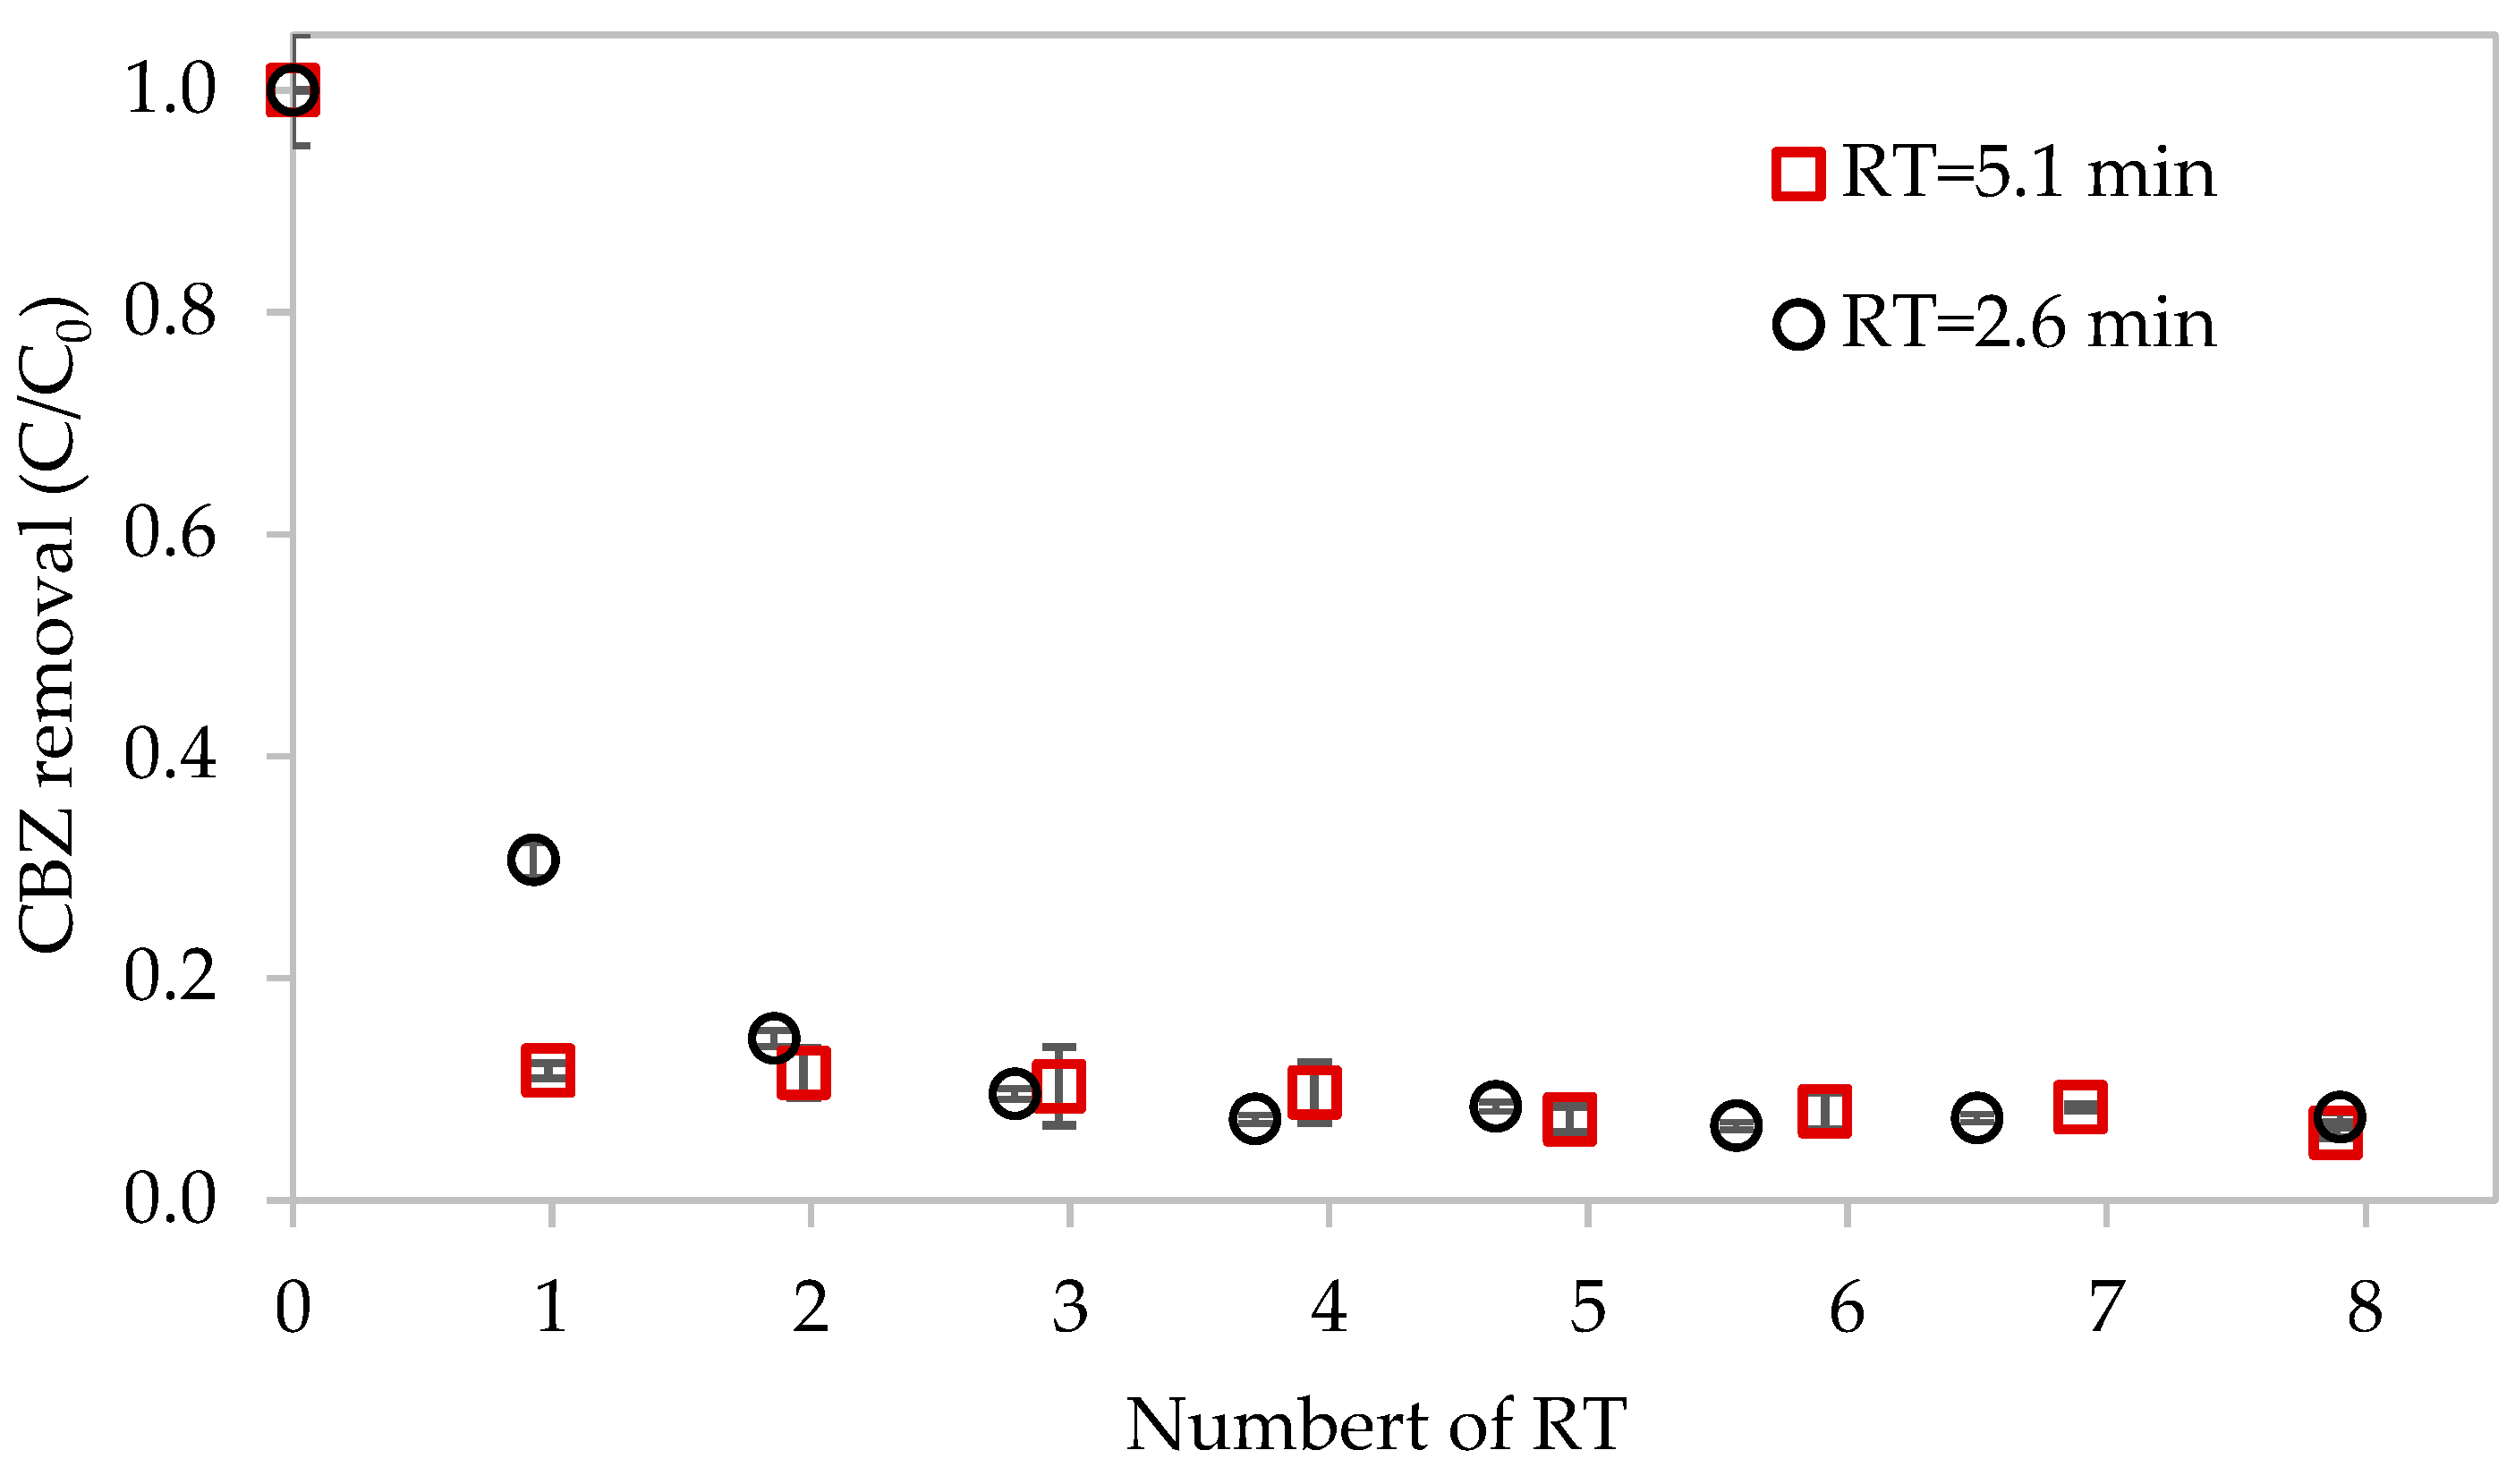
CBZ removal efficiencies remained unchanged at reduced RT of 2.6 min compared to 5 min, at a molar ratio of H
2O
2 to Fe
2+ of 25:1 and
j = 1.5 mA/cm
2 (
Figure 6), indicating that increasing RT beyond 2.6 min did not improve removal performance under the studied conditions. This behavior is consistent with a kinetically controlled reaction regime, rather than mass-transfer limitation [
25]. As CBZ is an uncharged MP, it does not experience electrostatic attraction toward the cathode surface, unlike ionizable MPs that can accumulate at electrochemical interfaces. As a result, its delivery to reactive zones depends solely on hydrodynamic transport and homogeneous hydroxyl radicals production from Fe
2+ and H
2O
2 rather than surface mediated pathways. In addition, under the applied operating conditions the rate of hydroxyl radicals generation was sufficiently high to achieve approximately 95% CBZ removal, such that further increases in RT yielded no measurable degradation improvement. Accordingly, the observed RT-independent removal behavior reflects the neutral character of CBZ and may not be directly transferable to charged or more reactive MPs, for which electrostatic interactions or faster reaction kinetics may introduce additional transport or degradation pathways. As discussed in
Section 3.1, RT of 5 min was used as the standard operating condition for subsequent experiments because it provided more reliable performance during continuous operation.
The energy demand of CBZ removal by EF oxidation is inherently embedded in the electrical energy required for H
2O
2 electro-production, which serves as the primary oxidant via reaction with Fe
2+. CBZ removal was quantified in terms of the energy required per mole of CBZ oxidized (kWh/mol CBZ), as calculated in Equation (4). As listed in
Table 3, the pollutant SEC decreased as current density and RT were reduced. At a constant RT of 5.1 min and a molar ratio of 25:1 H
2O
2:Fe
2+, reducing the current density from 1.5 to 0.6 mA/cm decreased SEC from 27.2 to 9.2 kWh/mol CBZ, consistent with improved current efficiency and reduced electrochemical losses. Similarly, shortening the RT from 5.1 to 2.6 min at a constant current density of 1.5 mA/cm
2 reduced SEC, reflecting more efficient conversion of CBZ per unit time. In contrast, increasing the H
2O
2:Fe
2+ molar ratio beyond 25:1 resulted in higher SEC values, indicating inefficient oxidant utilization and incomplete pollutant conversion, which limit overall energy efficiency.
where
U is the applied cell voltage (V),
I the current (A), and
Q the volumetric flow rate through the reactor (m
3/h),
Cin and
Cout are the influent and effluent CBZ concentrations (kg/m
3), and M
CBZ is the molar weight of carbamazepine (0.23627 kg/mol).
3.4. Asymmetric Cathode–Anode Flow Rates
To examine the effect of anode flow rate on CBZ removal in the cathode compartment, experiments were conducted under asymmetric flow conditions, in which lower flow rates were applied in the anode compartment. At an RT of 5 min, CBZ removal in the anode compartment was about 35%, attributable to uptake by the IEM. Under these conditions, the anolyte primarily functions to maintain charge balance and support ionic conduction across the membrane. When the treated catholyte is mixed with the anolyte containing residual CBZ, the CBZ concentration in the combined product stream increases relative to that of the cathode effluent alone, thereby reducing the apparent overall treatment efficiency. CBZ removal at the cathode compartment (maintained at 138 mL/min) was unaffected across a wide range of anode flow rates (from 12 mL/min to 138 mL/min). In contrast, in the anode compartment, CBZ uptake by the IEM increased from 35% at RTs of 5 and 10 min to 64% and 80% at extended RTs of 23 min and 58 min, respectively, as discussed in
Section 3.2.2.
Asymmetric hydrodynamics influence the SEC per mol of CBZ removed by affecting the removal efficiency rather than electrical energy input for H2O2 electro-production. High anode flow rates dilute the treated catholyte with anolyte containing residual CBZ, therefore reducing overall CBZ removal efficiency and increasing the SEC per mole of CBZ removed. Conversely, lower anode flow rates enhance overall CBZ conversion at the same electrical input, resulting in a lower SEC for CBZ removal.
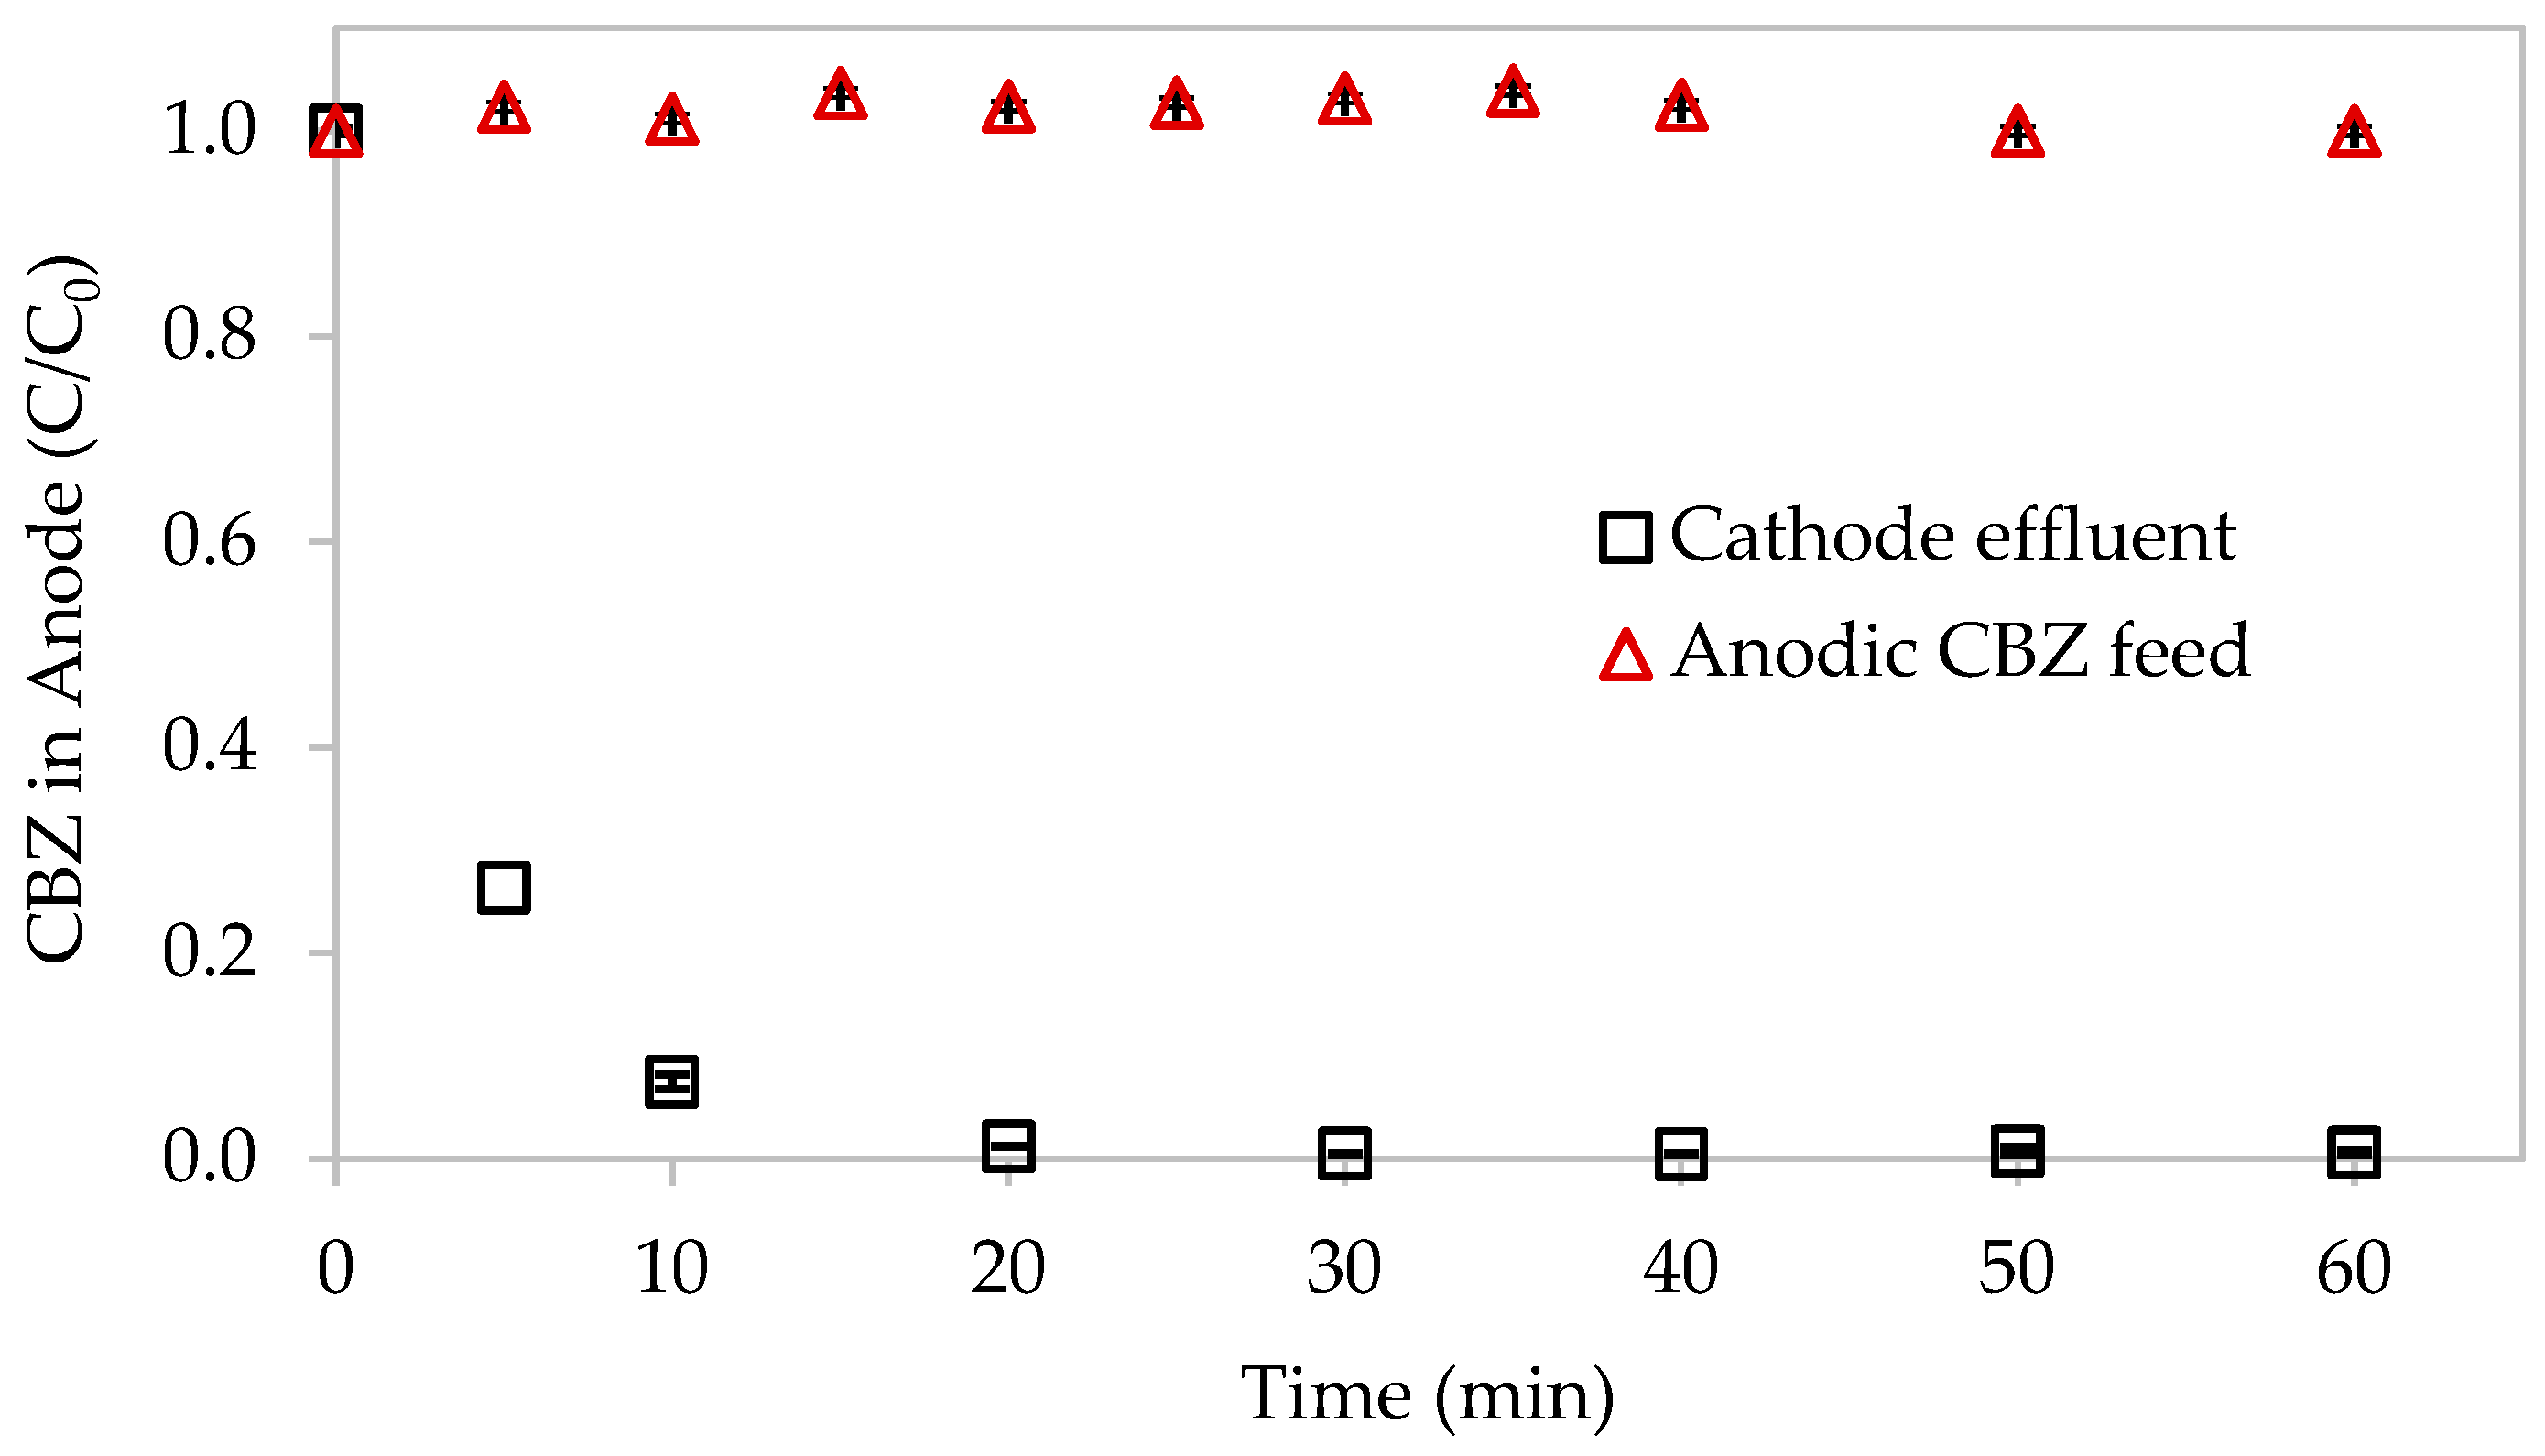
To mitigate dilution-induced losses in removal efficiency, an alternative flow configuration was evaluated in which the entire cathode effluent was directed through the anodic compartment. At an RT of 5 min, cathodic CBZ removal remained unchanged, while the residual CBZ concentration in the cathode effluent decreased from 44.2 ± 6.8 µg/L to 3.7 ± 2.9 µg/L after passage through the anode (
Figure 7). This additional oxidation is attributed to the carryover of H
2O
2 and Fe
2+, which sustains additional homogeneous Fenton reactions and increases effective oxidative contact time.
Beyond the improvement in CBZ removal efficiency, this configuration also offers operational and energetic advantages. By directing the cathodic effluent into the anodic compartment, the system eliminates the need for a separate anode feed pump, thereby reducing ancillary pumping energy and hydraulic complexity. This flow configuration limits internal dilution of reactive species, allowing a larger fraction of electro-produced H2O2 and regenerated Fe2+ to be utilized for oxidation without additional electrical input. As a result, oxidant utilization efficiency is improved, and the treated product water volume is reduced, leading to lower chemical consumption and energy demand per unit volume treated. Consequently, the NaOH requirement for post-treatment neutralization per unit volume of influent is reduced.
3.5. Comparison of CBZ Oxidation by Fenton and EF
Differences between EF and Fenton processes are primarily governed by how H
2O
2 is supplied and utilized, as H
2O
2 is the key precursor for hydroxyl radical generation. A direct comparison of Fenton and EF removal of CBZ was conducted in both a 0.1 M Na
2SO
4 electrolyte and secondary effluent obtained from the Haifa WWTP (
Table 1), at pH 3, with an RT of 5 min, molar ratios of 1:1, 2:1, 10:1, and 25:1 H
2O
2 to Fe
2+, at H
2O
2 concentration of 11.1 mg/L (corresponding to
j = 1.5 mA/cm
2) for both EF and Fenton, with additional concentration of 20.2 mg/L applied for Fenton oxidation. Because CBZ is a neutral MP, its oxidation in both systems occurs exclusively through homogeneous •OH attack. Therefore, EF does not benefit from electrostatic pollutant enrichment.
In the Na2SO4 electrolyte, Fenton and EF exhibited comparable performance at low H2O2:Fe2+ molar ratios of 2:1 and 10:1, with CBZ removal exceeding 96% in both cases. However, at the highest molar ratio of 25:1, the difference became apparent, with EF achieving 95.0 ± 2.5% removal compared with 77.5 ± 3.7% for Fenton.
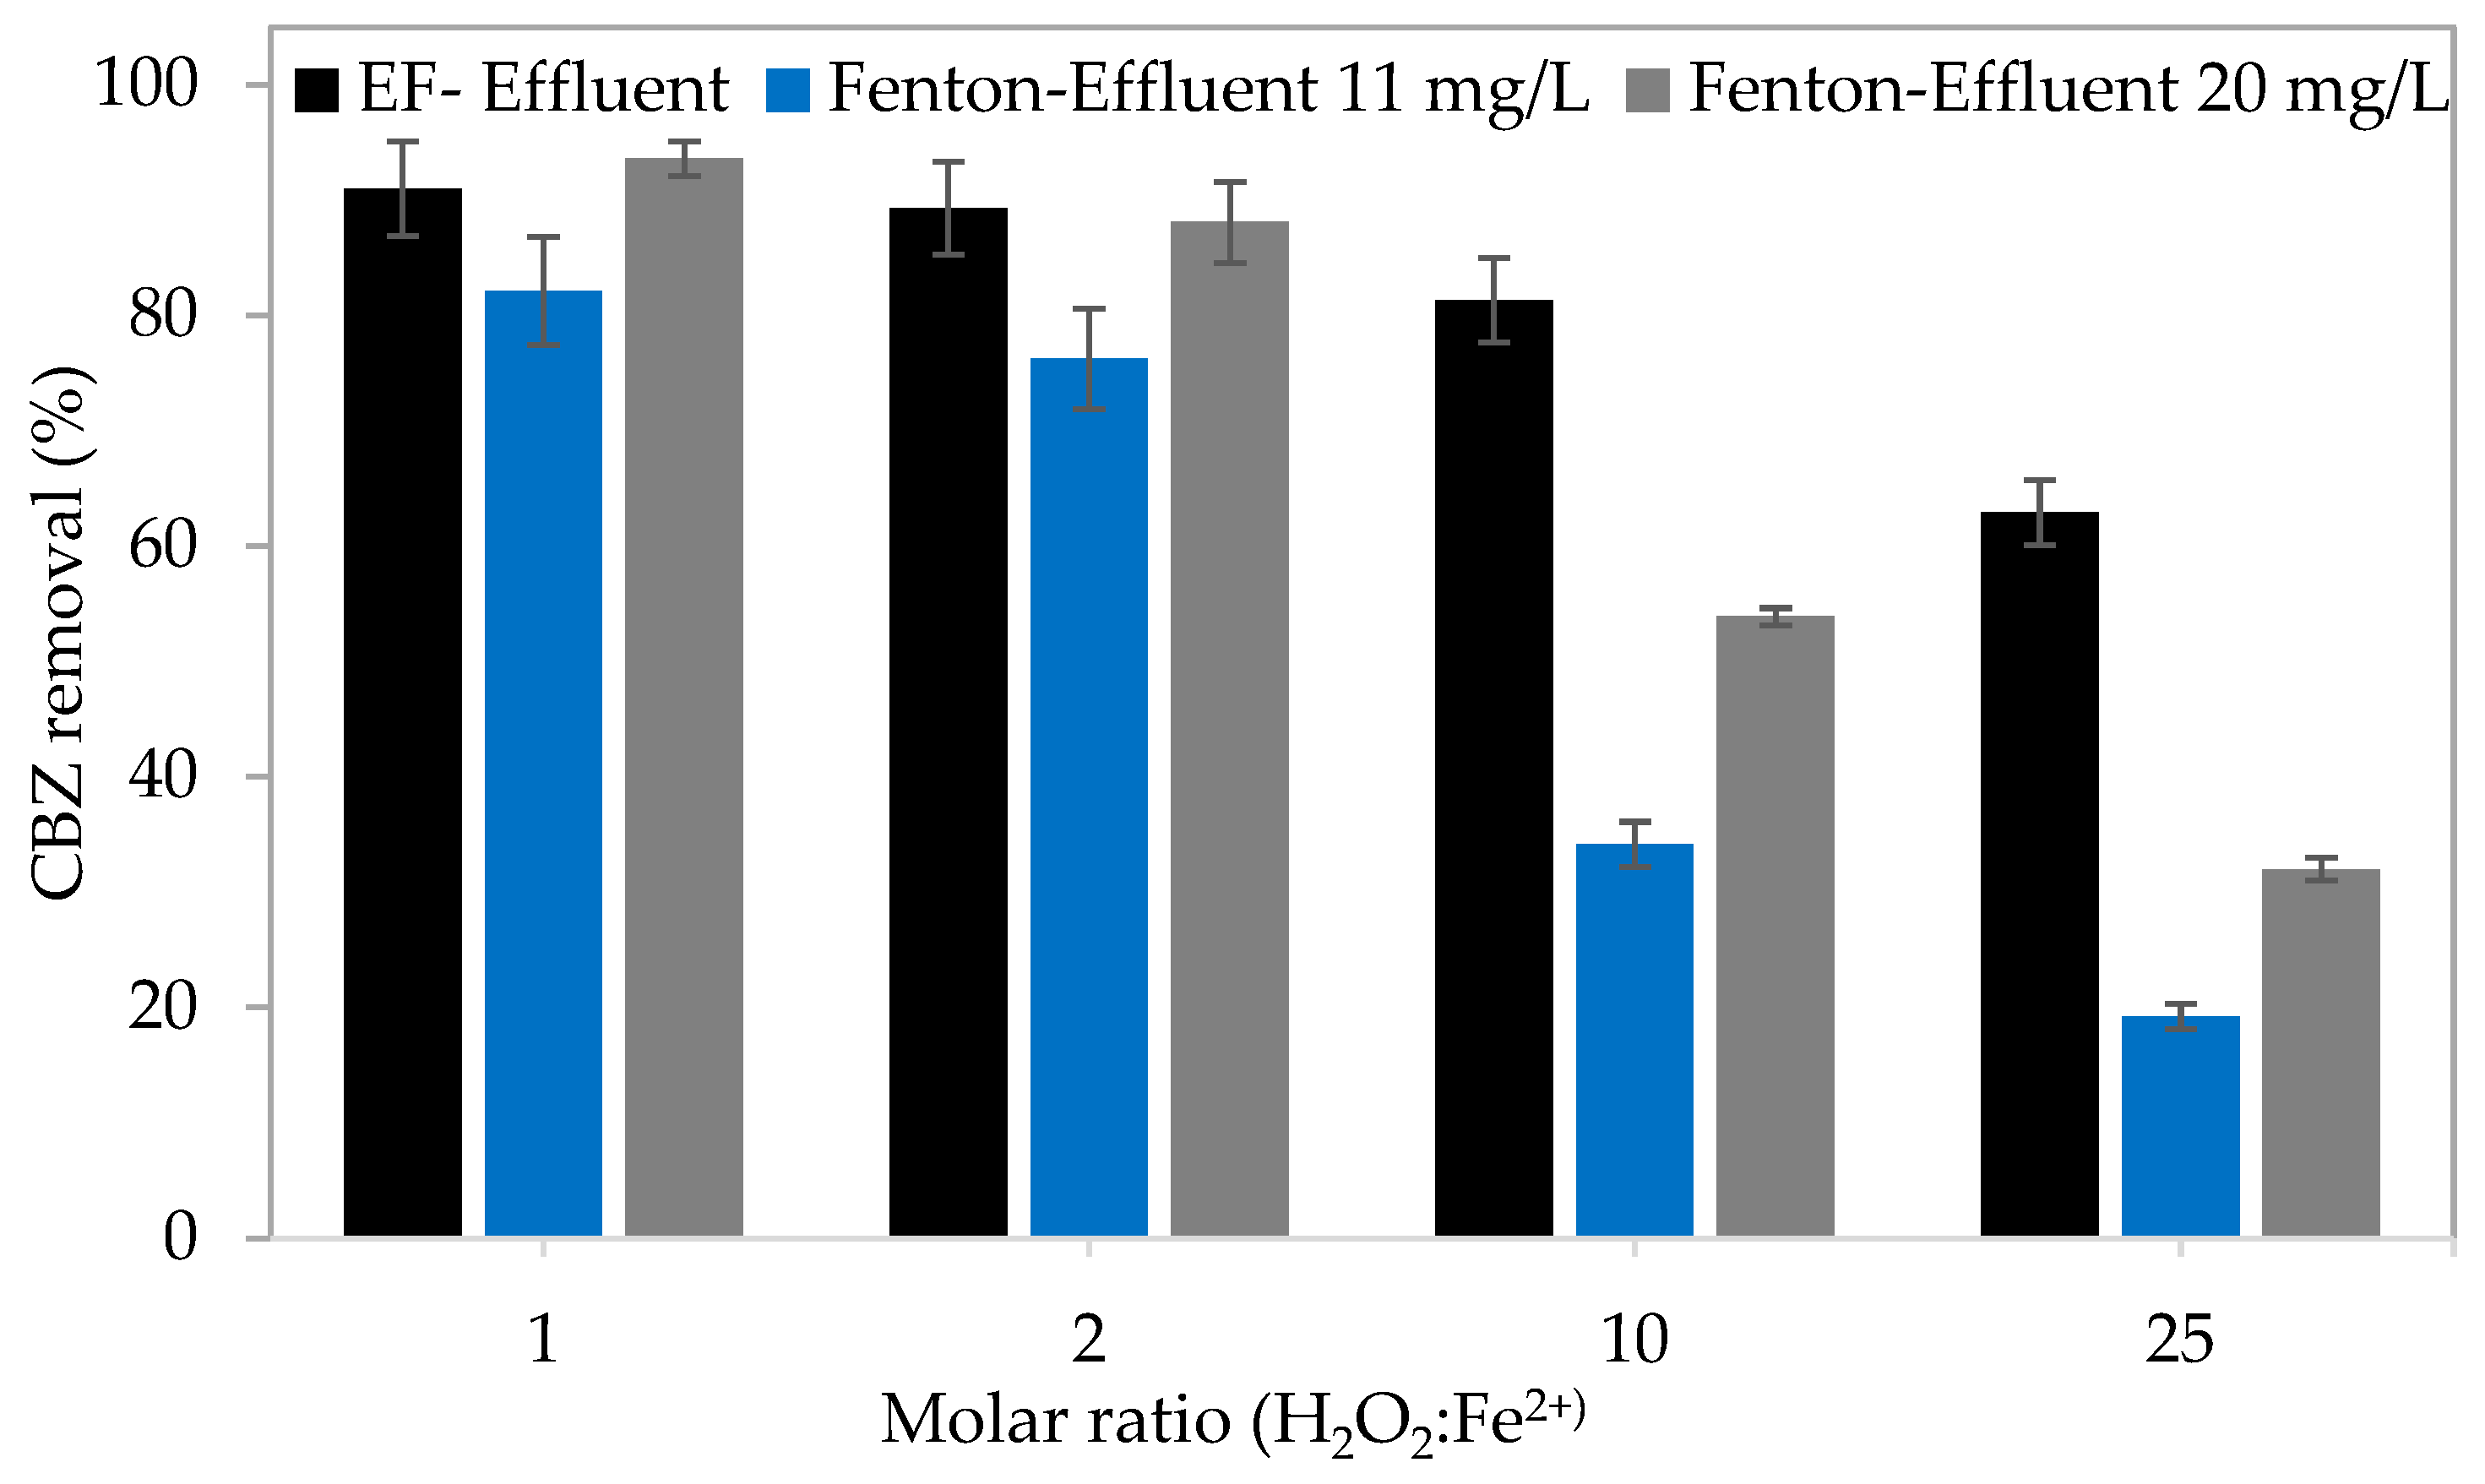
Clear performance differences were observed between the two processes in the secondary effluent, as displayed in
Figure 8. EF consistently achieved higher CBZ removal than Fenton, with Fenton CBZ removal decreasing from 82.1 ± 3.5% at a ratio of 1:1 to 19.2 ± 0.82% at a 25:1 ratio, whereas EF maintained significantly higher removal efficiencies, ranging from 91.0 ± 2.4% to 62.9 ± 3.9%. As the Fenton oxidation reached only 82% at a molar ratio of 1:1, the H
2O
2 concentration was increased to 20.2 mg/L. Under this H
2O
2 concentration, Fenton removal at low molar ratios (1:1 and 2:1) approached that of EF, reaching 93.6 ± 1.5% and 88.1 ± 2.5%, respectively, compared with 91.0 ± 1.9% and 89.3 ± 2.2% for EF. However, at higher molar ratios (10:1 and 25:1), EF exhibited higher removal efficiencies than Fenton.
The decreased efficiency observed for both processes was expected in secondary effluent, as this matrix contains a wide range of radical scavengers and iron-complexing species that substantially suppress the performance of Fenton-based AOPs. The pronounced difference between Fenton and EF in the effluent is attributed to the in situ generation of H
2O
2 at the cathode and continuous electrochemical regeneration of Fe
2+ in EF, which sustain a highly reactive interfacial zone that mitigates radical and iron losses in the bulk solution. In contrast, in the Fenton process, Fe
2+ is rapidly consumed and/or complexed, and radicals are scavenged, leading to a sharper decline in oxidative capacity [
23,
26].
Despite the high CBZ removal efficiencies observed based on concentration analysis, only minor reductions in the total TOC (<10%) were detected in the secondary effluent. This is expected because CBZ represents a trace fraction of the total dissolved organic carbon in the effluent, and its degradation contributes negligibly to bulk TOC removal. Under the investigated operating conditions, EF and Fenton mainly promote the transformation of CBZ into oxidation intermediates rather than mineralization.
Productivity expressed as mol CBZ/m3 h was comparable for both processes in Na2SO4 electrolyte, with EF values (0.031–0.034 mol CBZ/m3 h) closely matching those of Fenton (0.028–0.036 mol CBZ/m3 h). The small absolute differences in CBZ removal limit the ability of this molar-based metric to differentiate between the processes. In secondary effluent, Fenton productivity decreased sharply with increasing molar ratio, from 0.027 mol CBZ/m3 h at a ratio of 2:1 to 0.007 mol CBZ/m3 h at 25:1. When the H2O2 concentration was increased to 20.2 mg/L, Fenton productivity was 0.034 and 0.032 mol CBZ/m3 h at molar ratios of 1:1 and 2:1, respectively. The values declined with increasing molar ratio to 0.020 and 0.014 mol CBZ/m3 h at 10:1 and 25:1, respectively. In contrast, EF maintained higher productivity under the same conditions, ranging from 0.039 to 0.024 mol CBZ/m3 h at molar ratios of 2:1 and 25:1, respectively. The higher removal achieved by EF despite comparable productivity values suggests that continuous, localized H2O2 production enhances •OH availability and reduces H2O2 losses to non-productive reactions, thereby improving oxidative efficiency.
3.6. Comparative Energy Demand Electro-Fenton Versus Fenton
While kWh/mol CBZ, discussed in
Section 3.3, provides insight into the energy efficiency of CBZ removal, a process-level comparison between EF and Fenton oxidation was performed using the electrical energy required to achieve one order of magnitude (90%) reduction in CBZ concentration per cubic meter of treated water, expressed as EEO (kWh/m
3; Equation (5)). For EF, the EEO values reported in
Table 4 correspond to the system configuration in which the cathodic effluent was directed into the anodic compartment.
Table 4 distinguishes between ancillary energy consumption, including effluent feed pumping, recirculation, and air supply, and process-related energy demand, including chemical energy inputs and the electrical energy required for H
2O
2 electro-production. Pump wattage values were derived from specifications provided by multiple commercial manufacturers, representing typical operating power ranges.
where
P is the total electrical power (kW),
t is the operating time (h),
V is the treated volume (L), and
Cin and
Cout are the influent and effluent CBZ concentrations (kg/m
3).
As discussed previously, the two systems exhibited different oxidant requirements to achieve one order of magnitude (90%) reduction in CBZ concentration (
Figure 8). Fenton oxidation required approximately twice the H
2O
2 concentration (20.2 mg/L), with an H
2O
2:Fe
2+ molar ratio of 1.6:1, whereas EF achieved the same removal at 11.1 mg/L H
2O
2 and H
2O
2:Fe
2+ molar ratio of 1:1. The lower oxidant demand in EF directly reduces energy consumption and residual oxidant loading, thereby limiting the need for post-treatment oxidant quenching. To quantify the associated energy demand, the chemical inputs of iron salt, sulfuric acid, and sodium hydroxide were converted into their corresponding energy equivalents.
As shown in
Table 4, the ancillary energy demand in Fenton oxidation is primarily governed by continuous mechanical mixing in the CSTR and the operation of multiple reagent dosing pumps, resulting in a total ancillary EEO of 8.6–23.2 kWh/m
3. In contrast, EF relies on in situ electrochemical H
2O
2 production, thereby avoiding the need for external H
2O
2 dosing and its associated pumping requirements. However, this advantage is offset by the energy required for electrolyte recirculation through the cathodic and anodic compartments, as well as for air supply to the cathode to maintain dissolved oxygen for the 2e
−-ORR. As a result, recirculation and aeration dominate the ancillary energy demand in EF, yielding a lower ancillary EEO of 1.6–4.5 kWh/m
3. Although ancillary energy contributions arise from different operational requirements, they remain secondary relative to oxidant-related energy demand, consistent with the energy trends discussed in
Section 3.1.
In Fenton oxidation, the H
2O
2-related energy demand arises from commercial H
2O
2 production, whereas in EF it corresponds to the electrical energy required for in situ electro-generation. The EEO associated with commercial H
2O
2 production ranges from 50.9 to 73.6 kWh/m
3, based on cradle-to-gate electricity-equivalent energy demands of 2.8–3.3 kWh/kg H
2O
2 [
27]. These values are comparable to the EEO required for H
2O
2 electro-production in EF (69.1–77.3 kWh/m
3), indicating that the principal energy burden in both processes is associated with oxidant supply rather than ancillary operation.
In addition to H
2O
2, the energy demand associated with all other chemical inputs was considered. Despite differences in oxidant demand and molar ratios, both systems required similar amounts of FeSO
4·7H
2O, corresponding to 0.09 and 0.10 kg/m
3 for EF and Fenton oxidation, respectively. As a result, the associated energy contribution differed only marginally between the two processes. The energy demand for FeSO
4·7H
2O ranges from 0.03 to 0.17 kWh/kg, reflecting crystallization and drying of ferrous sulfate recovered as a by-product of TiO
2 sulfate production [
28].
The amounts of acid (H
2SO
4) required to adjust and maintain the process pH and base (NaOH) required to neutralize the product water pH are comparable in both systems. The production of sulfuric acid (98 wt%) requires 0.6–3.1 kWh/kg [
29,
30], whereas the production of sodium hydroxide (100%) requires 2.5–3.5 kWh/kg [
31]. The slightly higher sulfuric acid demand in EF (0.41–0.44 kg/m
3), compared to the Fenton reaction (0.31–0.41 kg/m
3), is attributed to proton consumption during the 2e
−-ORR.
The EEO of the Fenton and EF processes was found to be within a comparable range, with values of 61.1–100.0 kWh/m3 for Fenton and 73.8–94.4 kWhm3 for EF. In both systems, H2O2 represents the dominant energy contribution, accounting for 74–80% of the total energy demand in the Fenton process and 82–93% in EF. Despite the electrical requirement for electrochemical H2O2 production in EF, elimination of external oxidant dosing partially offsets this demand. Contributions from other ancillary energy demands and chemical inputs are closely comparable between the two processes.
The EEO values obtained in this study fall within the range reported in the literature for AOPs applied to real wastewaters. For electro-Fenton treatment of pharmaceuticals in real wastewater, reported EEO values range from 11.5 to 144.9 kWh/m
3 [
32]. Similarly, anodic oxidation-based electrochemical treatment of urban wastewaters exhibits a broad range of EEO values of 21.9–216.0 kWh/m
3 [
32]. For dye wastewater treatment, reported EEO values vary widely depending on the oxidation technique, with values of approximately 188 kWh/m
3 for ozonation, 245 kWh/m
3 for photo-Fenton, and 505 kWh/m
3 for photocatalysis [
33]. This wide variability in reported EEO values is primarily attributed to differences in treated water quality, target pollutants, specific removal efficiencies, system configurations, and operational parameters. Overall, these comparisons indicate that EF is an energetically competitive option, while additionally offering sustainability, reduced operational risk, and elimination of hazards associated with the transport and storage of concentrated H
2O
2.
From a scale-up perspective, total EEO is expected to decrease mainly because ancillary energy contributes proportionally less at higher throughput, as pump efficiency improves and relative hydraulic losses diminish. By contrast, the specific energy required for H2O2 electro-production is expected to remain approximately constant under comparable electrochemical conditions, since it is governed primarily by cell voltage and current efficiency. Consequently, unless reactor design parameters such as electrode spacing, reaction selectivity, electrolyte conductivity, or cathode mass-transfer characteristics are enhanced, improvements in overall process energy efficiency will depend primarily on reducing electrochemical losses rather than ancillary demand, although H2O2 electro-production remains intrinsically scalable.
Practical scale-up nevertheless requires management of scale-dependent factors that may influence current efficiency and specific energy consumption. At the same time, practical scale-up may introduce operational constraints that can influence long-term performance and energy demand, including membrane fouling and the associated increase in ohmic resistance, cathode durability (i.e., mechanical stability and long-term electrochemical activity), non-uniform current distribution, oxygen mass-transfer limitations at higher current densities and/or when operating larger electrode areas at increased volumetric throughput, and increased hydraulic losses due to longer flow paths or higher volumetric throughput.
Further reductions in EEO may be achieved through reactor- and process-level optimization strategies, including improved flow configurations, modular reactor architectures to enhance current distribution, minimized electrode spacing to reduce ohmic losses, and reduced residence times where target removal efficiencies are maintained.
4. Concluding Remarks
This study demonstrated the effectiveness and energy performance of the EF process by evaluating H2O2 electro-production and the degradation of the neutral micropollutant CBZ in a well-defined electrolyte (0.1 M Na2SO4) and in real secondary effluent from a WWTP treating wastewater from households supplied with desalinated water. Energy efficient performance was consistently achieved within the investigated parameters ranges: current densities in the range of 0.5–1.5 mA/cm2, moderate-to-high flow conditions (Re ~ 1000–1340), short residence times (2.6 and 5.1 min), pH 2 and 3, and temperatures of 9.0 and 23 °C, under which CE of ≥ 50% and low specific electrical energy consumption of 4.0–6.4 kWh/kg H2O2 were achieved.
In the divided electrolytic cell, system-intrinsic non-EF removal mechanisms accounted for approximately 35% of CBZ uptake at RTs of 5 and 10 min, consistent with membrane-associated retention and redistribution processes. CBZ removal by EF was governed by the combined effects of current density, oxidant stoichiometry, RT, and flow configuration, reaching 95 ± 2.5% at an H2O2:Fe2+ molar ratio of 25:1, a current density of 1.5 mA/cm2, and an RT of 5 min, following saturation of the IEM with CBZ. Directing the cathodic effluent to the anodic compartment was identified as a key design strategy, as it improved oxidant utilization, reduced dilution effects, and decreased the treated water volume without increasing energy input.
EF achieves energy-competitive performance relative to Fenton oxidation, while offering operational and safety advantages through in situ H2O2 production and continuous Fe2+ regeneration. EEO values of 73.8–94.4 kWh/m3 for EF and 61.1–100.0 kWh/m3 for Fenton indicate overlapping performance ranges, with H2O2 production accounting for the dominant share of energy demand in both systems. Although EF requires electrical energy for H2O2 electro-production, the overall energy balance remains competitive due to the reduced oxidant demand (11.1 mg/L H2O2 in EF compared to 20.2 mg/L in Fenton for 90% CBZ removal) and the elimination of external H2O2 dosing and associated pumping requirements.
Overall, the competitive EEO range indicates that EF is a viable and scalable advanced oxidation option for the treatment of persistent micropollutants in wastewater effluents, particularly in applications where on-site oxidant generation, reduced chemical handling, and operational flexibility are prioritized. The results further indicate that current density, residence time, and flow configuration play a central role in governing energy efficiency and operational robustness, highlighting these parameters as critical considerations for EF implementation and future system-level optimization.