Article

Spatio-Temporal Analysis of Mud Diapirism Dynamics in Membrillal, Cartagena de Indias: Implications for Rural Communities and Susceptibility Assessment


by
Gustavo Eliecer Florez de Diego
1,2,
Edgar Quiñones-Bolaño
3,
Gertrudis Arrieta-Marin
2,
Yamid E. Nuñez de la Rosa
2,4,* and
Jair Arrieta Baldovino
1,*
1
GIGA—Applied Geotechnical Research Group, Department of Civil Engineering, Universidad de Cartagena, Cartagena de Indias 130015, Colombia
2
Faculty of Engineering, Fundacion Universitaria Tecnologico Comfenalco, Cartagena Cra 44D N 30ª, 91, Cartagena 130015, Colombia
3
GIMA—Environmental Modelling Research Group, Department of Civil Engineering, Universidad de Cartagena, Cartagena de Indias 130015, Colombia
4
Faculty of Engineering and Basic Sciences, Fundacion Universitaria Los Libertadores, Bogotá 111221, Colombia
*
Authors to whom correspondence should be addressed.
Appl. Sci. 2026, 16(5), 2194; https://doi.org/10.3390/app16052194
Submission received: 16 November 2025 / Revised: 19 January 2026 / Accepted: 21 January 2026 / Published: 25 February 2026

Abstract

This study presents the first integrated quantification of mud diapirism susceptibility in the Membrillal sector of Cartagena de Indias, Colombia, through a multidisciplinary approach combining geospatial, geotechnical, hydrogeochemical, and socio-structural analyses. Using GIS-based multicriteria modeling, household surveys (n = 240), and temporal satellite imagery from 2013 to 2024, the research identifies spatial and temporal dynamics of active mud volcano reactivation. Field sampling of vent waters and gases followed ISO/IEC 17025 and APHA–AWWA–WEF standards, revealing high-salinity fluids (TDS = 13,220 mg/L; EC = 20.4 mS/cm; pH = 8.0) with elevated chloride (6996 mg/L) and low sulfate (1.67 mg/L) under reducing conditions, though a significant charge-balance discrepancy (Na+ = 8 mg/L) indicates either sample dilution during the collection or presence of unmeasured cationic species, and low free-gas flux constrained by high-density brine sealing. Principal component analysis of 240 georeferenced dwelling surveys yielded dimension-specific reliability (α = 0.68–0.76) and strong spatial correlation (Spearman ρ = 0.61–0.87) between vent proximity and structural damage—46.9% of dwellings exhibited visible cracking, with 27.2% severe (width > 1.5 mm). Satellite differencing documented 233% increase in active vents (3→10) and 35% vegetation reduction correlated with informal settlement expansion into moderate-to-high susceptibility zones. Weighted overlay GIS modeling (validated Kappa = 0.82) classified four hazard classes; high-susceptibility zones (18% of the study area) encompassed all ten active vents. Findings underscore anthropogenic pressurization drivers—primarily surface loading from settlement densification—and the need for continuous InSAR deformation monitoring, piezometric observation, complete hydrogeochemical characterization (including alkalinity and unmeasured cations), and establishing early-warning thresholds for community risk mitigation.

1. Introduction

Mud diapirism is defined by argilokinesis, an essentially upward movement of mud and clay masses with plastic properties, driven by buoyancy forces generated by the density contrast between the source material and the overlying denser sedimentary sequences [1,2,3]. Mud volcanoes, in turn, constitute surficial geological manifestations of deep geodynamic processes, characterized by the episodic or continuous expulsion of fluid-saturated fine sediments (predominantly clays), brackish water, gases (primarily thermogenic methane), and occasionally liquid hydrocarbons from depths of up to 10 km [4,5,6]. These structures form when overpressure of fluids confined in compressive sedimentary sequences exceeds the lithostatic and tensile strength of the overlying formations, generating vertical plumbing systems that culminate in distinctive morphological edifices with positive dome-shaped, conical, or caldera-type reliefs [6]. Therefore, understanding these mechanisms is crucial since the migration and emplacement of these ductile bodies can occur through pre-existing faults or fractures, and this activity inevitably translates into surface instability [7]. Globally, more than 1800 terrestrial mud volcanoes and thousands of submarine structures have been documented, predominantly concentrated in fold-thrust belts, active convergent margins, and sedimentary basins with rapid deposition rates [8,9].
Recent advances in mud volcano monitoring integrate multi-parameter geophysical, geochemical, and remote sensing techniques to establish precursor recognition and eruptive forecasting frameworks. In the western Pacific subduction margin, active systems have been characterized where seismic monitoring identifies harmonic tremor diagnostics of fluid circulation in the conduit system [10]. The Caspian–Black Sea region concentrates the world’s highest density: recent research describes the most active system known, Lokbatan (Azerbaijan), with recurrent explosive eruptions every 3–5 years and megablock transport of up to 50,000 m3 [11]. InSAR remote sensing in Azerbaijan, with millimetric resolution, has revealed pre-eruptive deformation patterns and uplifts on the order of ~1 m/year, consistent with pressurization phases of the system [12,13,14]. In the Mediterranean, particularly in Sicily, the pioneering deployment of high-resolution UAVs has institutionalized operational surveillance protocols with repetitive surveys every 1–2 months and detection of precursors at centimetric scale through photogrammetry and digital terrain modeling [13,15,16]. Recent integration of deep geological surveys (ERT) with LiDAR has proven effective for penetrating complex subsurfaces in high-conductivity unconsolidated sediments, as demonstrated in Romanian mud volcano systems [17].
Moreover, risk assessment methodologies now include Bayesian event trees for uncertainty quantification via conditional probabilities [18,19]. GIS-based multicriteria analysis validated in Indonesian mud volcano systems [20]. and buffer-zone methodologies retrospectively tested against Sicilian eruption records [15]. Furthermore, InSAR deformation monitoring techniques coupled with Functional Data Analysis have detected precursory signals 1.5 years prior to paroxysmal events [12]. Simplified monitoring frameworks adapted for resource-limited contexts have been operationalized in middle- and low-income countries [21], with online support systems available for global assessment [22].
In Latin America, Trinidad exhibits well-documented cyclic behavior with studies establishing links between regional seismic activity and eruption activation [13], while the Orinoco Delta in Venezuela presents direct tectonic analogies with northern South America, with active volcanoes expelling material from significant depths [14]. Studies from submarine benthic observatories have documented eruptive episodes in deep-water systems for the first time, revealing that methane release may be significantly greater than previous estimates [15].
The Colombian Caribbean represents one of the most active and least quantitatively characterized terrestrial systems in Latin America. At least 25 mud volcanoes have been documented between Barranquilla and the Gulf of Urabá, related to oblique deformation between the Caribbean and South American plates along the Sinú-Romeral fault system since the early Cenozoic [23]. The tectonic complexity of the Colombian Caribbean coast has been recently quantified through high-resolution Holocene-relative sea-level reconstructions, revealing that tectonic vertical motion is more prominent than previously assumed, with the transition from far- to intermediate-field glacial isostatic adjustment influence occurring between Manzanillo del Mar and the Gulf of Morrosquillo—precisely the region encompassing Membrillal [24]. This active tectonic setting, characterized by compressive deformation and fault reactivation, creates a structural framework for deep fluid mobilization and diapiric ascent. In fact, Di Lucio et al. [25] characterized nine terrestrial volcanoes in the Colombian Caribbean, documenting anomalously elevated thermal water temperatures compared to global systems, attributed to the unique compressive tectonic context and deep connection with active petroleum systems [26] and established the first systematic geochemical and mineralogical framework, revealing >86% thermogenic CH4 and mineralogical characterization identifying three compositional groups based on clay fraction: kaolinite-rich, illite-rich, and chlorite-rich. Trejos-Tamayo et al. [27] applied calcareous nannofossil and planktonic foraminifer biostratigraphy to ejected material, determining ages from middle Eocene to late Miocene with a spatial pattern indicative of variable detachment levels between 4 and 8 km depth. López-Ramos et al. [23] integrated U/Pb ages in detrital zircons with micropaleontological analysis, demonstrating different source depths according to structural domain.
Historical records of violent eruptions in Colombia document events with variable recurrence. The most recent catastrophic event occurred at Cacahual/El Aburrido, Antioquia, in 1992 following the Murindó earthquake, resulting in seven deaths and 20 injuries, with reactivation in November 2024 causing 8 injuries and major infrastructure damage [28]. The temporal coincidence between seismic events and mud volcano reactivation in Colombia aligns with global observations linking crustal stress perturbations to diapiric activity. In Colombia, systematic assessments of eruption susceptibility for mud volcanoes in the Caribbean region are still scarce, despite well-established protocols in analogous systems worldwide [26,27].
The rural community of Membrillal (Pasacaballo district, Cartagena de Indias, Bolívar department; 10°19′ N, 75°25′ W) constitutes a paradigmatic case of these multidimensional risks. The implications of this geological activity for nearby communities, particularly those located in rural areas or on the urban fringe adjacent to diapiric domes, are substantial and multidimensional. Risk is expressed through potentially catastrophic phenomena, such as the sudden venting of flammable gases (predominantly methane, with minor proportions of ethane, propane, butane, and CO2 [29]. The explosive potential of these events is strongly controlled by gas concentration, and in Membrillal, the susceptibility to hazardous explosions is elevated because the settlement overlies an active diapiric structure. The community experienced its first documented eruption in 2013, destroying a family dwelling and motivating intervention by the Colombian Geological Survey and the Regional Autonomous Corporation of the Canal del Dique. The reactivation in 2023 caused the collapse of multiple residential structures this time, evidencing a decadal recurrence.
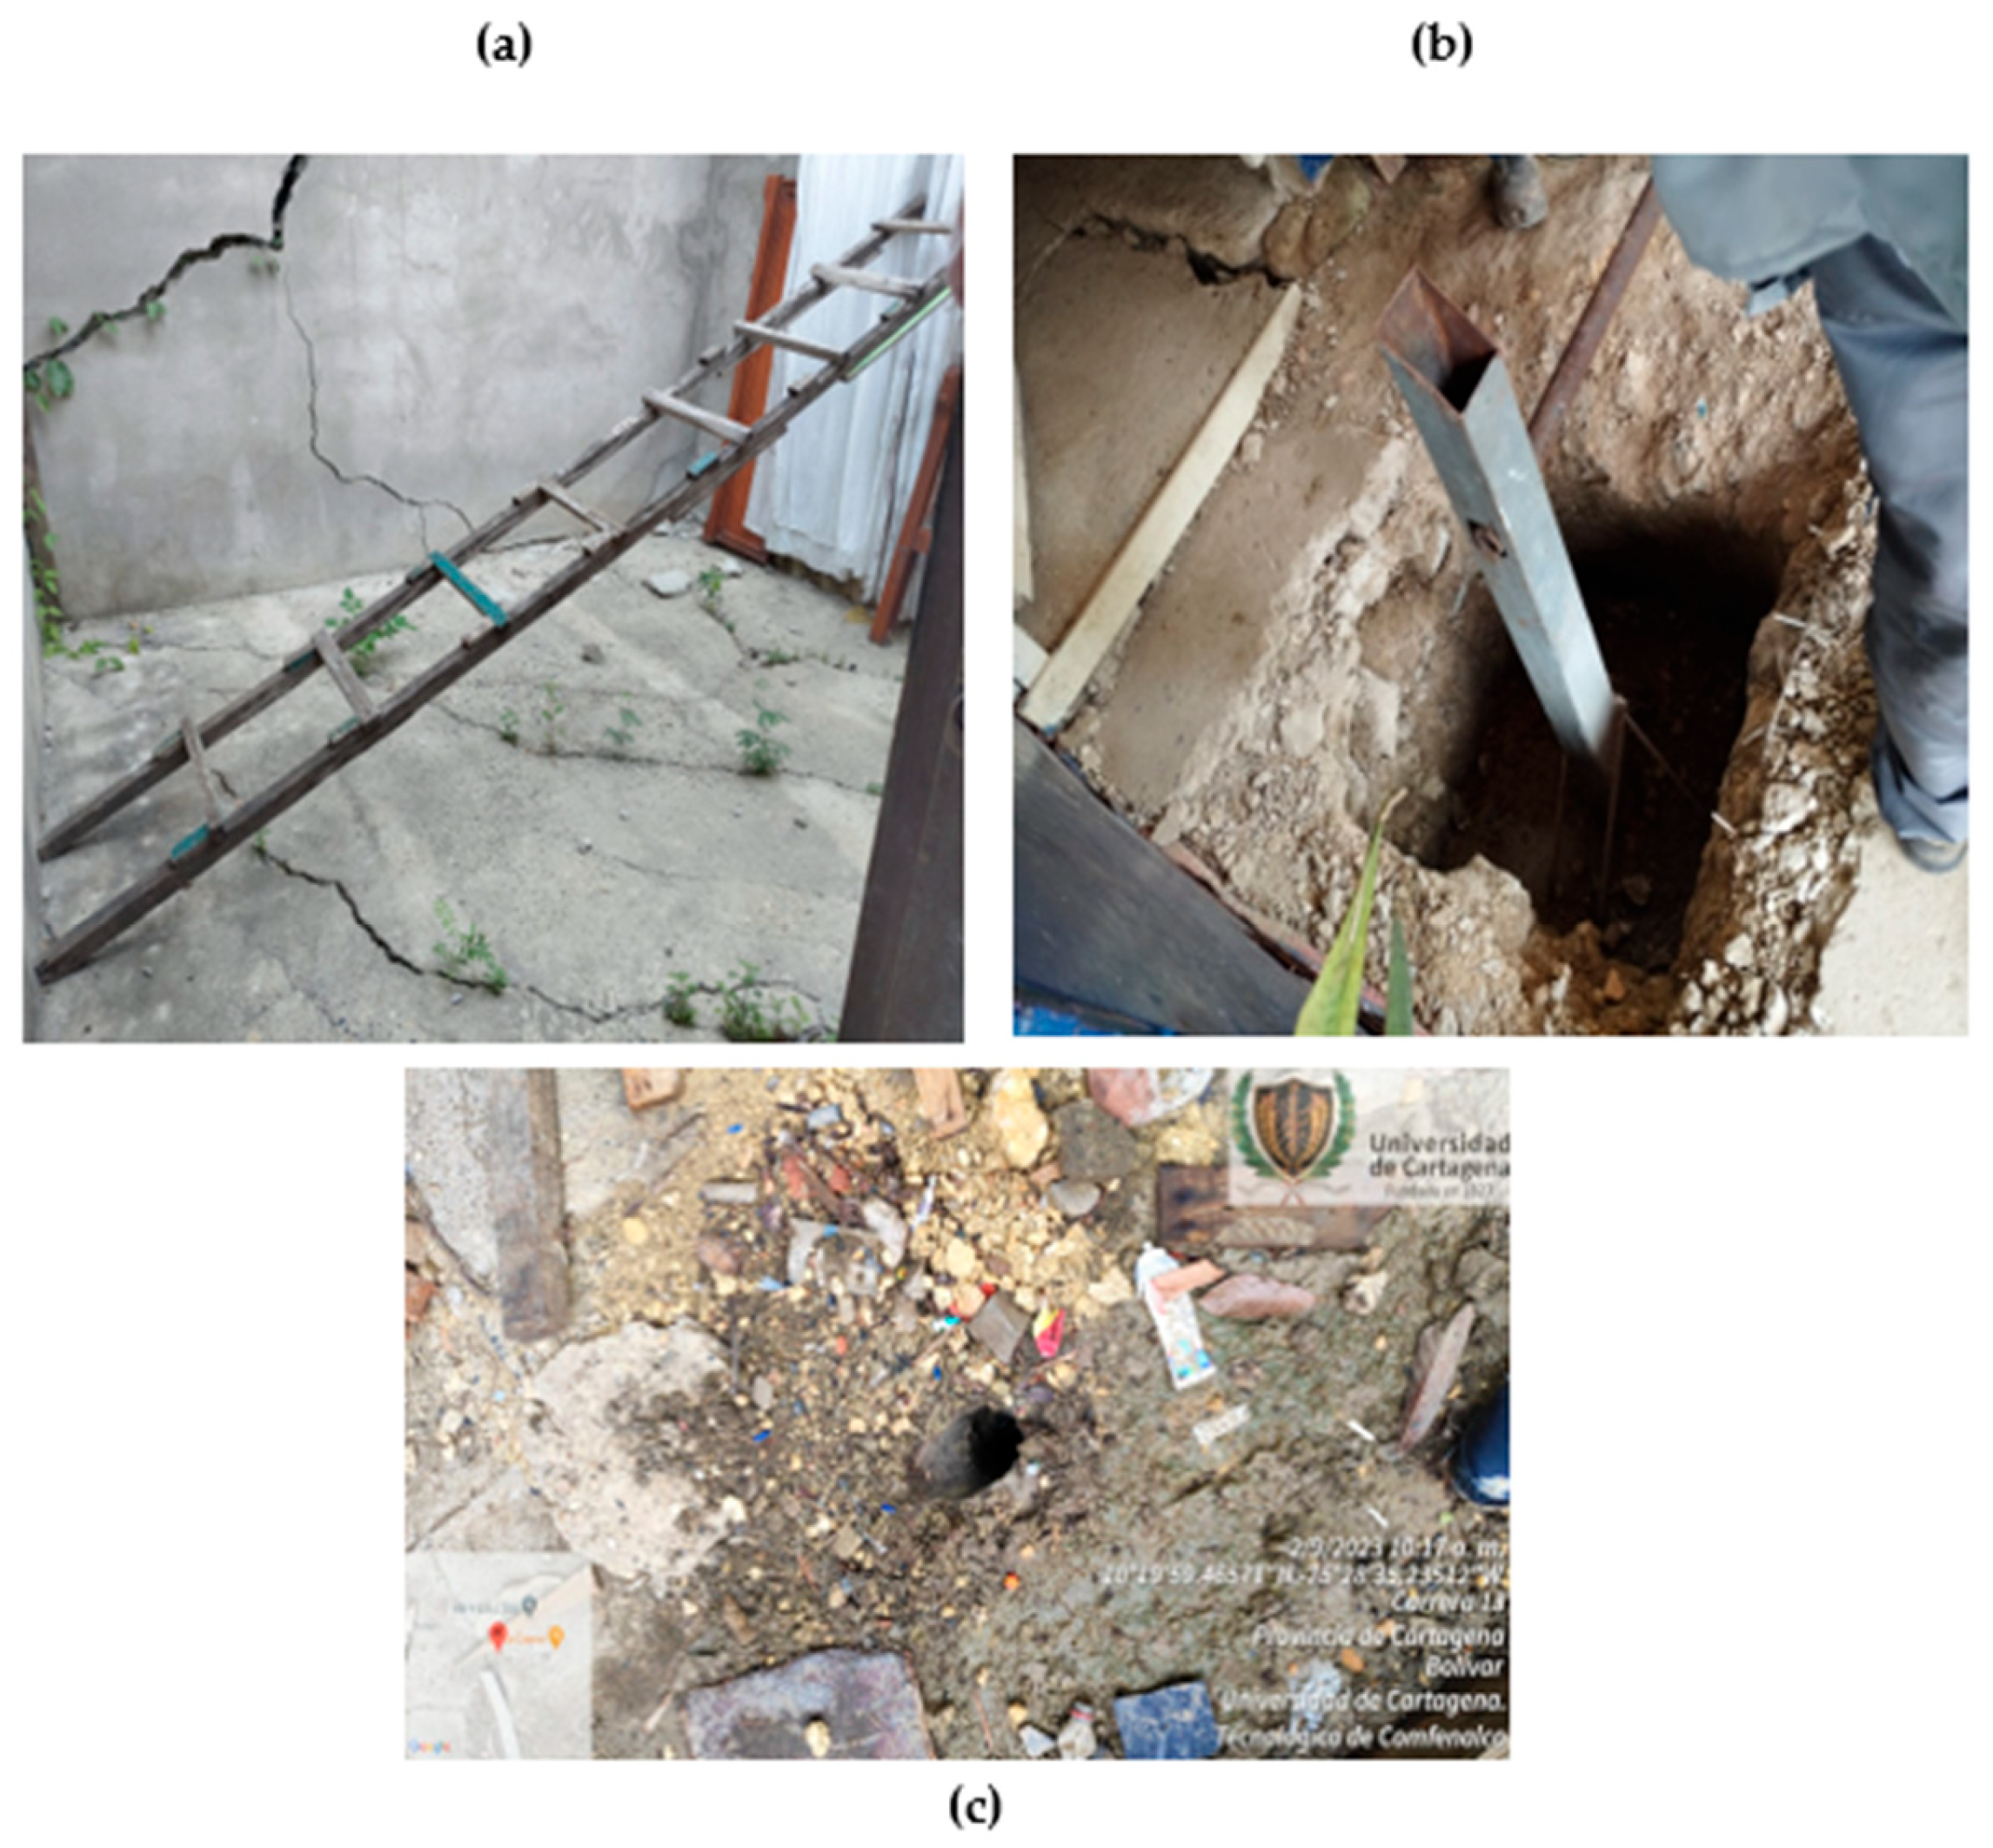
Barboza-Miranda et al. [30] conducted the most recent geophysical–geotechnical characterization integrating Standard Penetration Tests (SPTs), electrical resistivity tomography (ERT), and historical data analysis, delimiting zones of greater hazard but without systematically quantifying eruptive susceptibility or evaluating hydrogeochemical quality of expelled waters. The community of Membrillal (400 people under rural conditions connected to the more populated area) presents multidimensional vulnerability, considering the traditional and indigenous communities that inhabit there. Self-constructed dwellings on highly plastic expansive clays present elevated structural susceptibility, given that the community is settled on the volcano, while the subsistence economy based on agriculture and minimal volcano tourism generates dependence on volcano-associated resources. Therefore, the absence of formalized early warning systems contrasts with successful implementations in similar contexts [21,22] (Figure 1).
Nevertheless, several critical knowledge gaps persist in the Colombian context: (1) absence of systematic physicochemical characterization of expelled thermal waters, essential for understanding deep fluid flows and hydrogeochemical evolution during ascent; (2) lack of quantitative susceptibility maps based on internationally validated methodologies that integrate geological, structural, geophysical, and historical parameters; and (3) limited assessment of socioenvironmental implications in directly exposed rural communities, where historical eruptions have caused material losses and chronic risks.
The present study addresses part of these gaps through the first integrated quantification of mud diapirism susceptibility in Membrillal, combining GIS-based multicriteria modeling, hydrogeochemical characterization of vent waters and gases, statistical analysis of household vulnerability surveys, and multi-temporal satellite imagery analysis (2013–2024). This multidisciplinary approach establishes quantitative baselines for continuous monitoring, provides reproducible methodological frameworks transferable to analogous systems across the Colombian Caribbean and Latin American fold-thrust belts, and enables evidence-based land-use planning and community-based early-warning protocol development in vulnerable rural contexts, validating results against previous studies by Barboza-Miranda et al. [30] and CARDIQUE [31].

2. Experimental Area

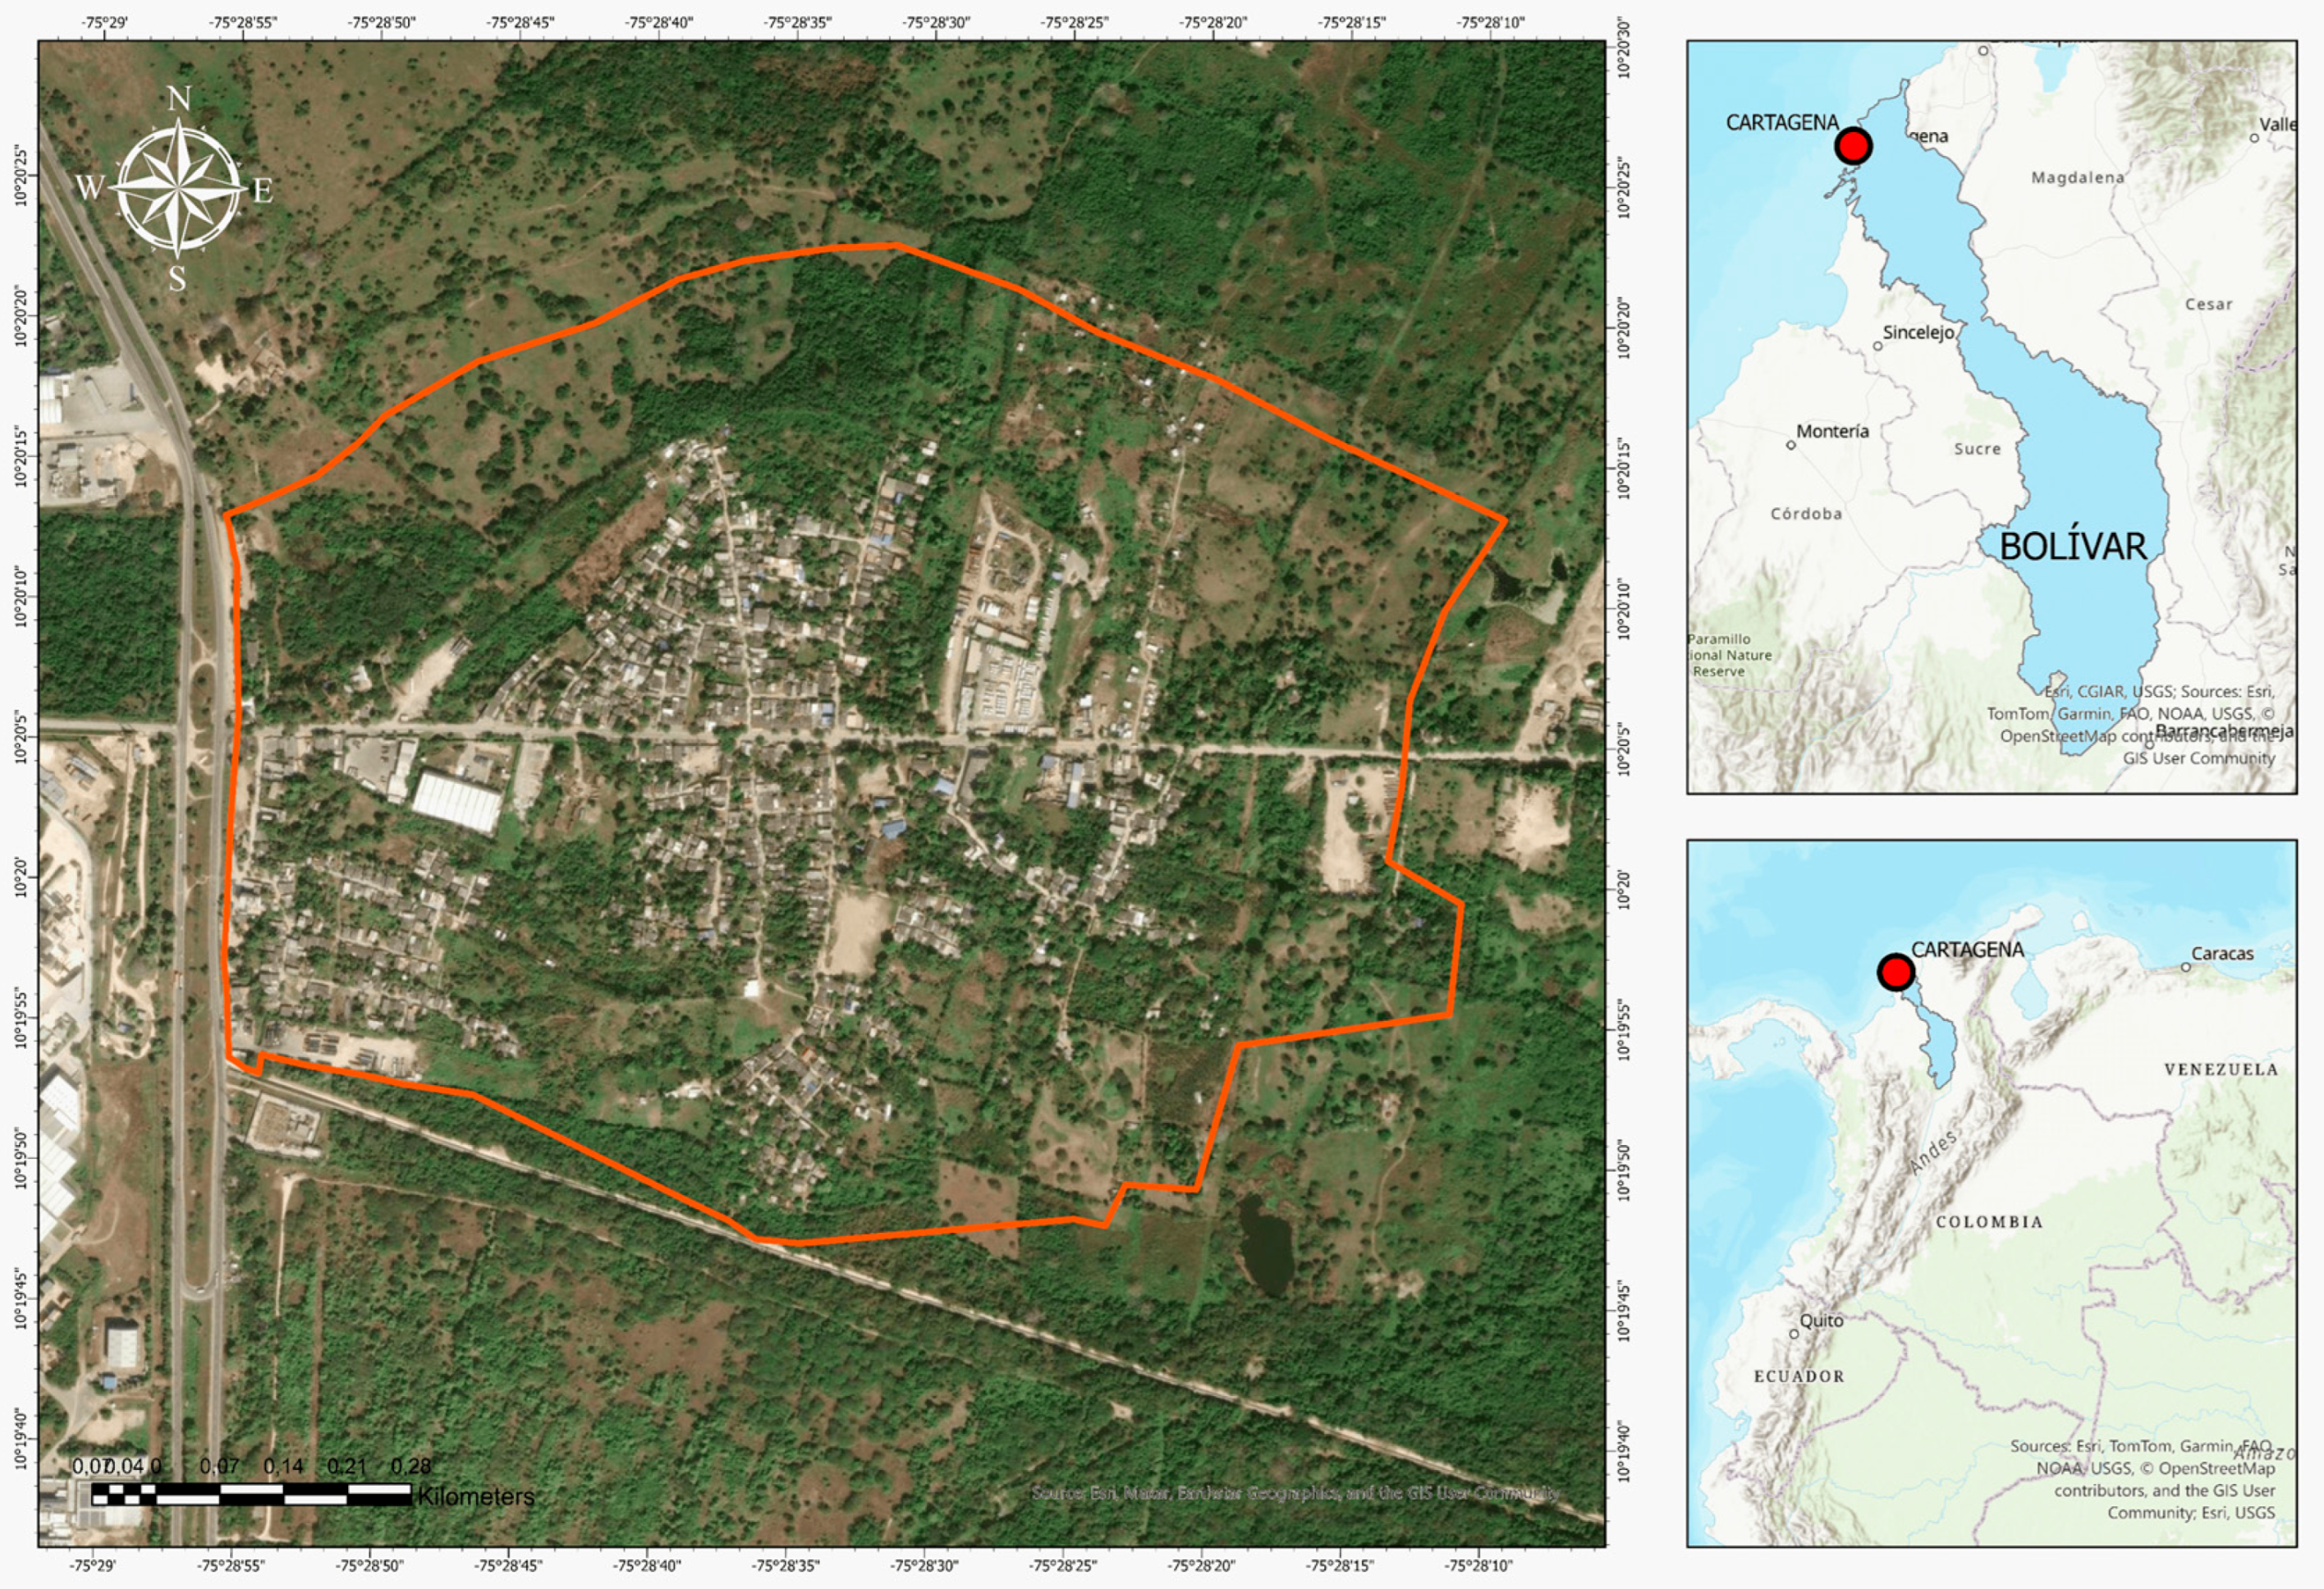
Membrillal is a rural community located in the district of Pasacaballos, a municipality of Cartagena de Indias, Colombia, situated at coordinates 10°20′4.82″ N, 75°28′33.41″ W. The community settlement is positioned over an active mud diapirism dome with an approximate diameter of 0.8 km2 and elevations above sea level ranging from 20 to 25 m. This geological feature is part of the accretion and folding processes of the Sinú Belt, a region characterized by active mud volcanism along the Colombian Caribbean Coast, extending from the Gulf of Urabá to Barranquilla.
The area is structurally controlled by the Pasacaballos Reverse Fault, which facilitates the upward migration of overpressurized mud from deep zones. Dominant geological formations include the Arjona Formation (Miocene–Pliocene siliceous and calcareous mudstones), the Bayunca Formation (fine sandstones alternating with clayey siltstones), and unconsolidated Quaternary alluvial deposits. A comprehensive geological, geotechnical, and geophysical characterization of Membrillal, including Standard Penetration Tests (SPT), Electrical Resistivity Tomography (ERT), laboratory analyses, and detailed stratigraphic descriptions, has been previously published by Barboza-Miranda et al. [30] (Figure 2).

2.1. Disaster Risk Management and Cultural Conditions in Membrillal

According to CARDIQUE [31], by 2013, the community of Membrillal is characterized by its predominantly local origin. It is estimated that there are currently around 5000 inhabitants. 85.5% of the inhabitants come from the department of Bolívar, mainly from the city of Cartagena de Indias, forming a community with deep roots in the Colombian Caribbean territory, and featuring diverse demographic manifestations such as Zenú groups and Afro-descendant traditional communities. This demographic composition has direct implications for patterns of land occupation and the construction of local identities.
Territorial rootedness is a key factor in how risk is configured and in the range of options available for its management. The data show that 29% of families have lived in the community for 21 to 30 years, forming foundational population nuclei with a strong sense of belonging. A further 44% report a residence time of 6 to 20 years, while 27% have lived in Membrillal for only 1 to 5 years, indicating recent processes of population densification. This diversity in length of residence gives rise to differentiated risk-perception dynamics: long-established families tend to normalize diapiric manifestations and have developed their own strategies to cope with ground instability, whereas more recent residents often lack historical information on how the phenomenon has evolved over time.

2.1.1. Cultural Expressions of the Community

Membrillal’s identity is reflected in living Afro-Indigenous cultural expressions. An emblematic example is the musical group “Cantadoras de Membrillal” (Membrillal Singers), founded in 2015, which teaches ancestral music (bullerengue, son de negro, chalupa, among others) to children and adults in the village. Over eight years, they have performed at local and regional festivals (Cartagena Fried Food Festival, Yuca Cake Festival, Bullerengue in María La Baja, among others). In 2022, they won a national call (“Proyecto Crea Sonidos” by Fundación Yuri Buenaventura) to record their first album, a sign of the local cultural flourishing [32]. Based on their trajectory, they have created dance and percussion “semilleros” (cultural seedbeds) in the community, establishing themselves as emerging cultural references in the Membrillal Community Action Board. Additionally, traditional culinary and medicinal knowledge is being recovered: for example, since 2024, a community children’s cafeteria has been operating, serving 100 children from Membrillal at the local educational center, featuring a Popular Entrepreneurship program that in 2023 trained 35 women from the village in traditional cuisine, providing them with seed capital to start gastronomic microenterprises [33]. Likewise, the Zenú Cabildo (Indigenous Council) has promoted medicinal plant market days and Indigenous culture recovery points at local fairs. These developments are novel compared to 2013 (when culture was documented as dispersed): today, there is a solid organizational offering that makes Membrillal’s cultural practices visible.

2.1.2. Mechanisms for Disaster Risk Management

In Colombia, the institutional framework for disaster risk management is grounded in Law 1523 of 2012 [34], which establishes the National Disaster Risk Management System (SNGRD) as the coordinating structure for all governmental, private, and community entities oriented toward prevention, mitigation, and response to adverse events. UNGRD operates as the national coordinating body, with territorial implementation delegated to municipal entities, including Cartagena’s OAGRD. Neighborhood Emergency Committees (COMBAS) constitute the community-level operational arm of this structure, trained to execute first-response protocols during mud volcano eruptions, landslides, and diapiric deformation events. COMBAS members facilitate household evacuation, relay institutional alerts, and mobilize local self-protection measures in high-susceptibility sectors.

3. Materials and Methods

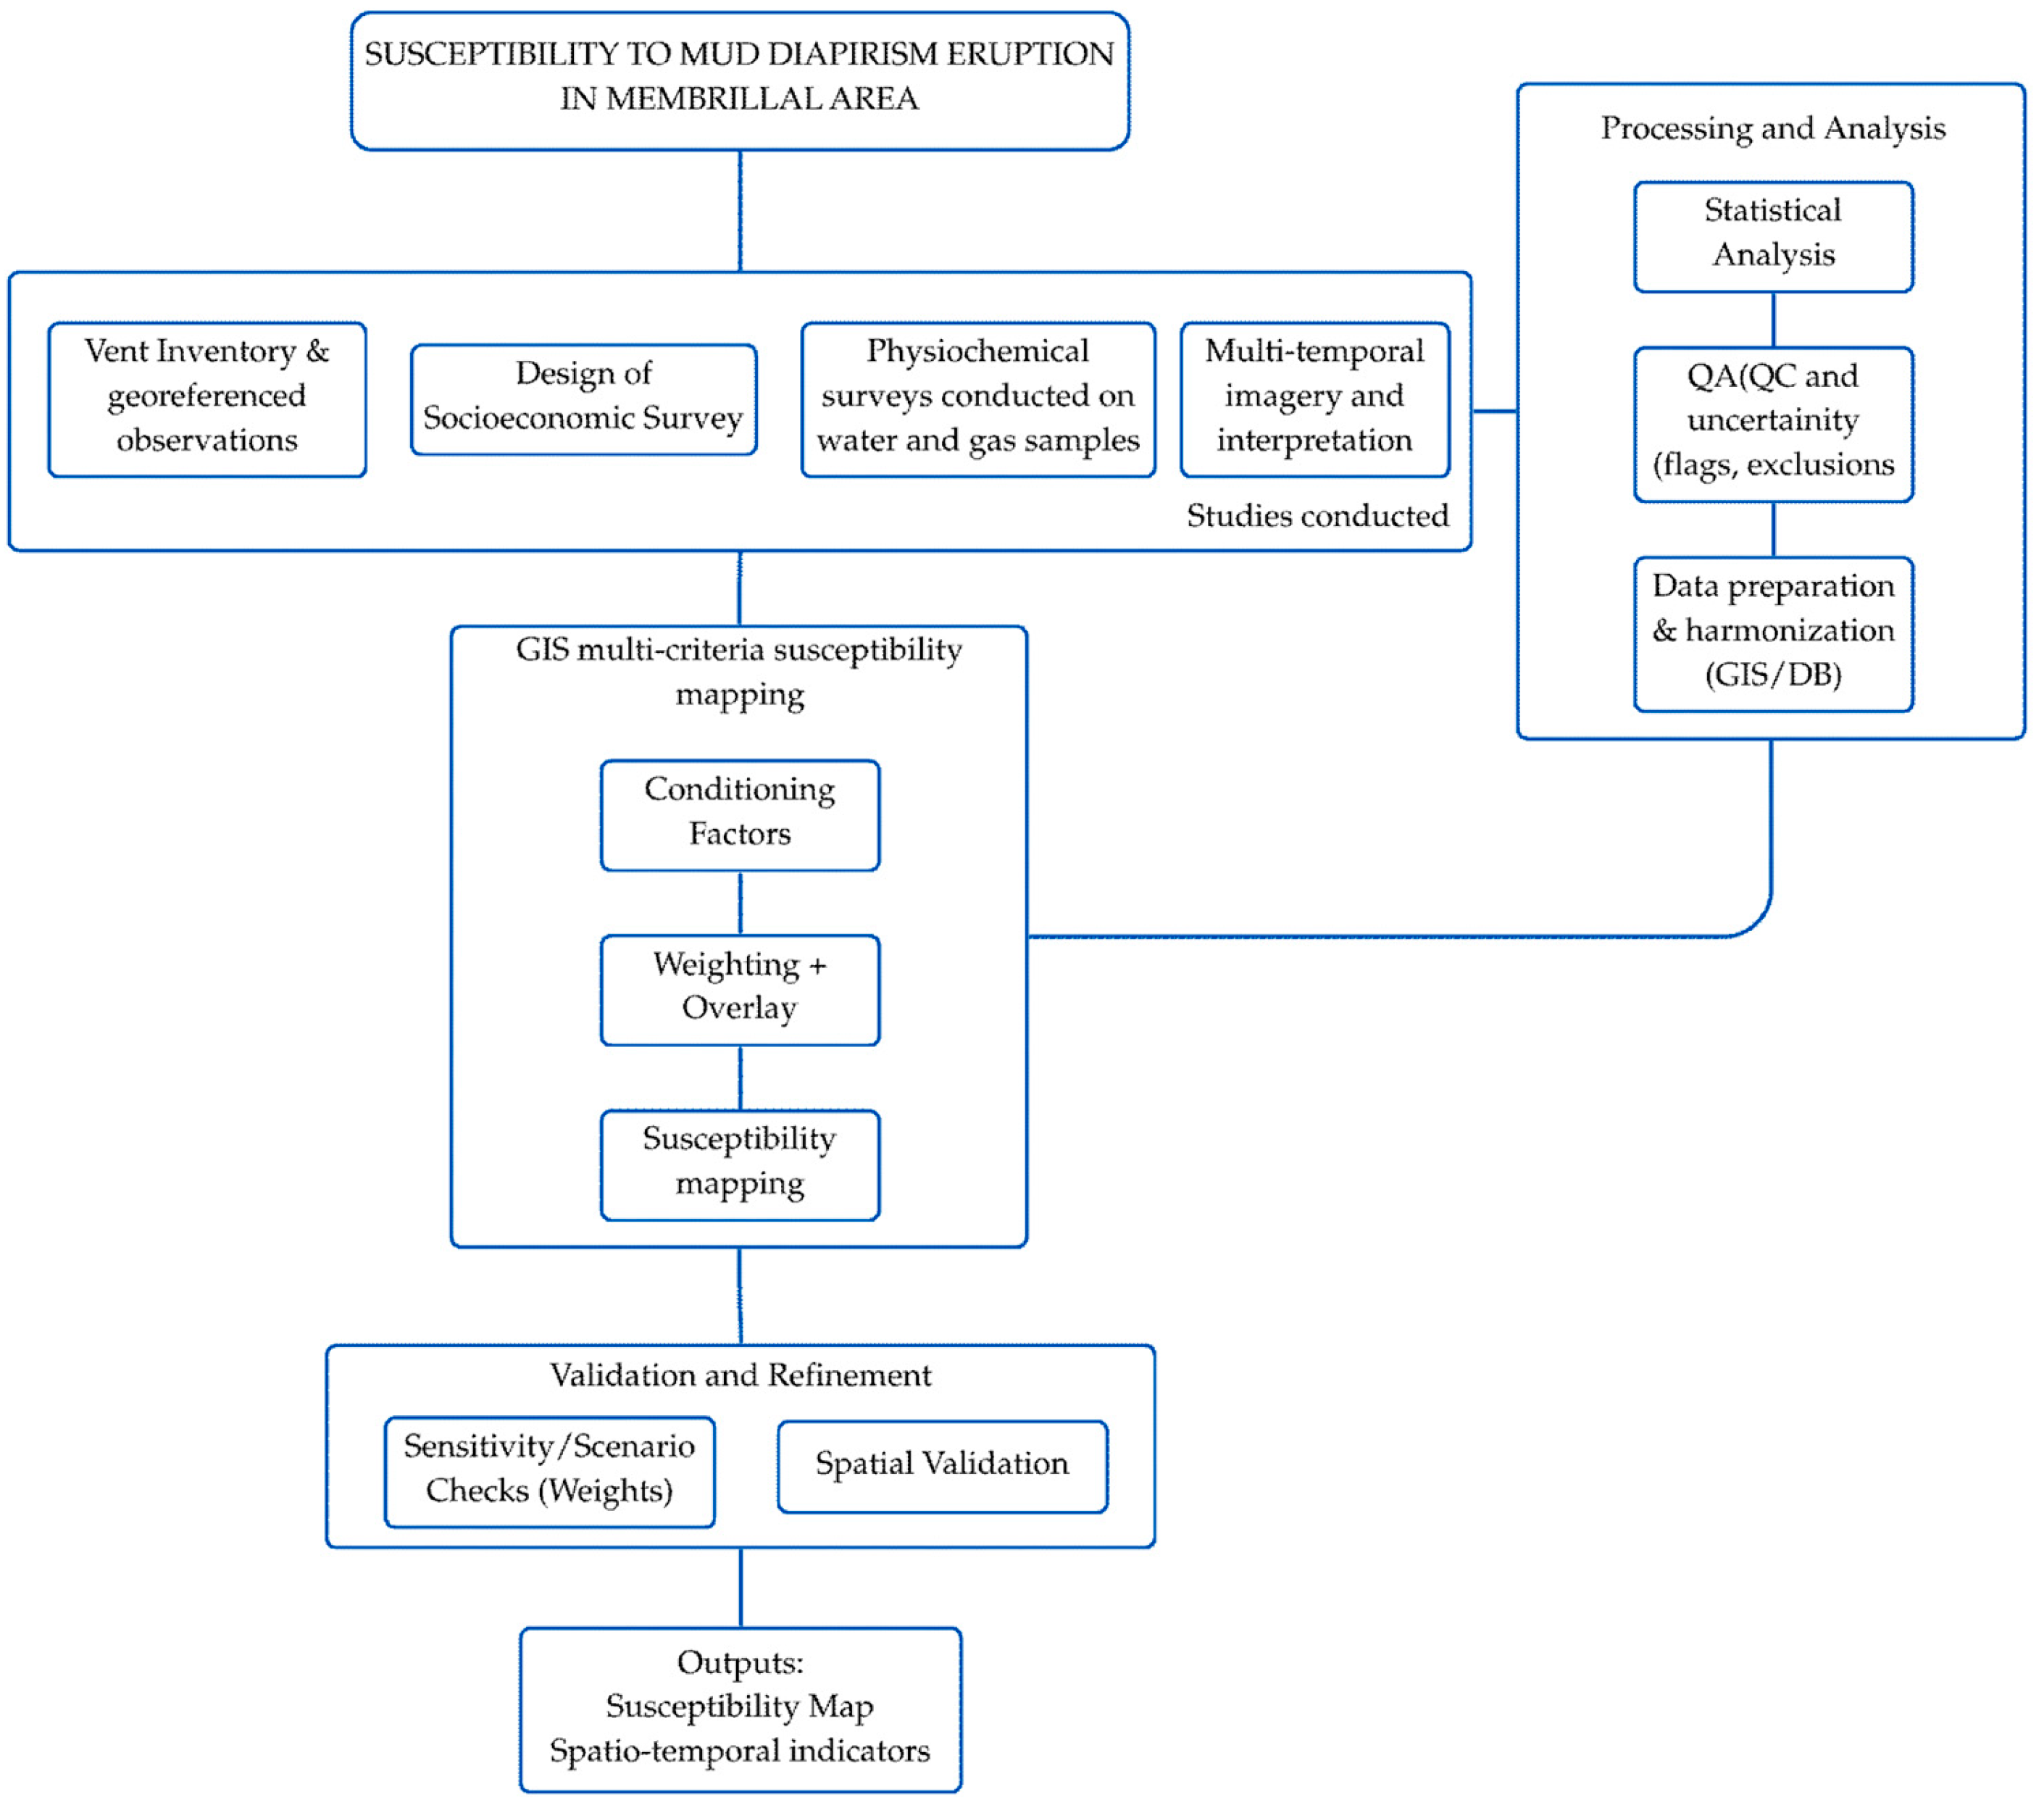
This section outlines the integrated workflow adopted to characterize mud diapirism dynamics and to assess territorial susceptibility in Membrillal (Cartagena de Indias, Colombia). The methodology combines (i) field-based socio-environmental data collection (stratified surveys and georeferenced observations), (ii) physicochemical and gas sampling with laboratory analyses under quality-control procedures, and (iii) multi-temporal remote sensing interpretation coupled with GIS-based multi-criteria modeling. Figure 3 summarizes the sequential steps from data acquisition and pre-processing to analytical integration, uncertainty control, and final outputs (spatio-temporal indicators and susceptibility maps), ensuring transparency and reproducibility of the proposed approach.

3.1. Survey Instrument Design and Operationalization

The questionnaire operationalized vulnerability across three analytical dimensions adapted from CARDIQUE protocols [31,35,36].
  • Structural: Dwelling construction quality, visible damage (cracking and settlement), and foundation stability under diapiric deformation;
  • Socioeconomic: Household composition, income sources, residence duration, and housing tenure status;
  • Geotechnical: Proximity to active vents, reported mud extrusion events, and evidence of ground fissuring or moisture infiltration.
Variables within each dimension were standardized (z-scores) and aggregated into composite indices for spatial vulnerability mapping (Table 1).

3.2. Statistical Analysis

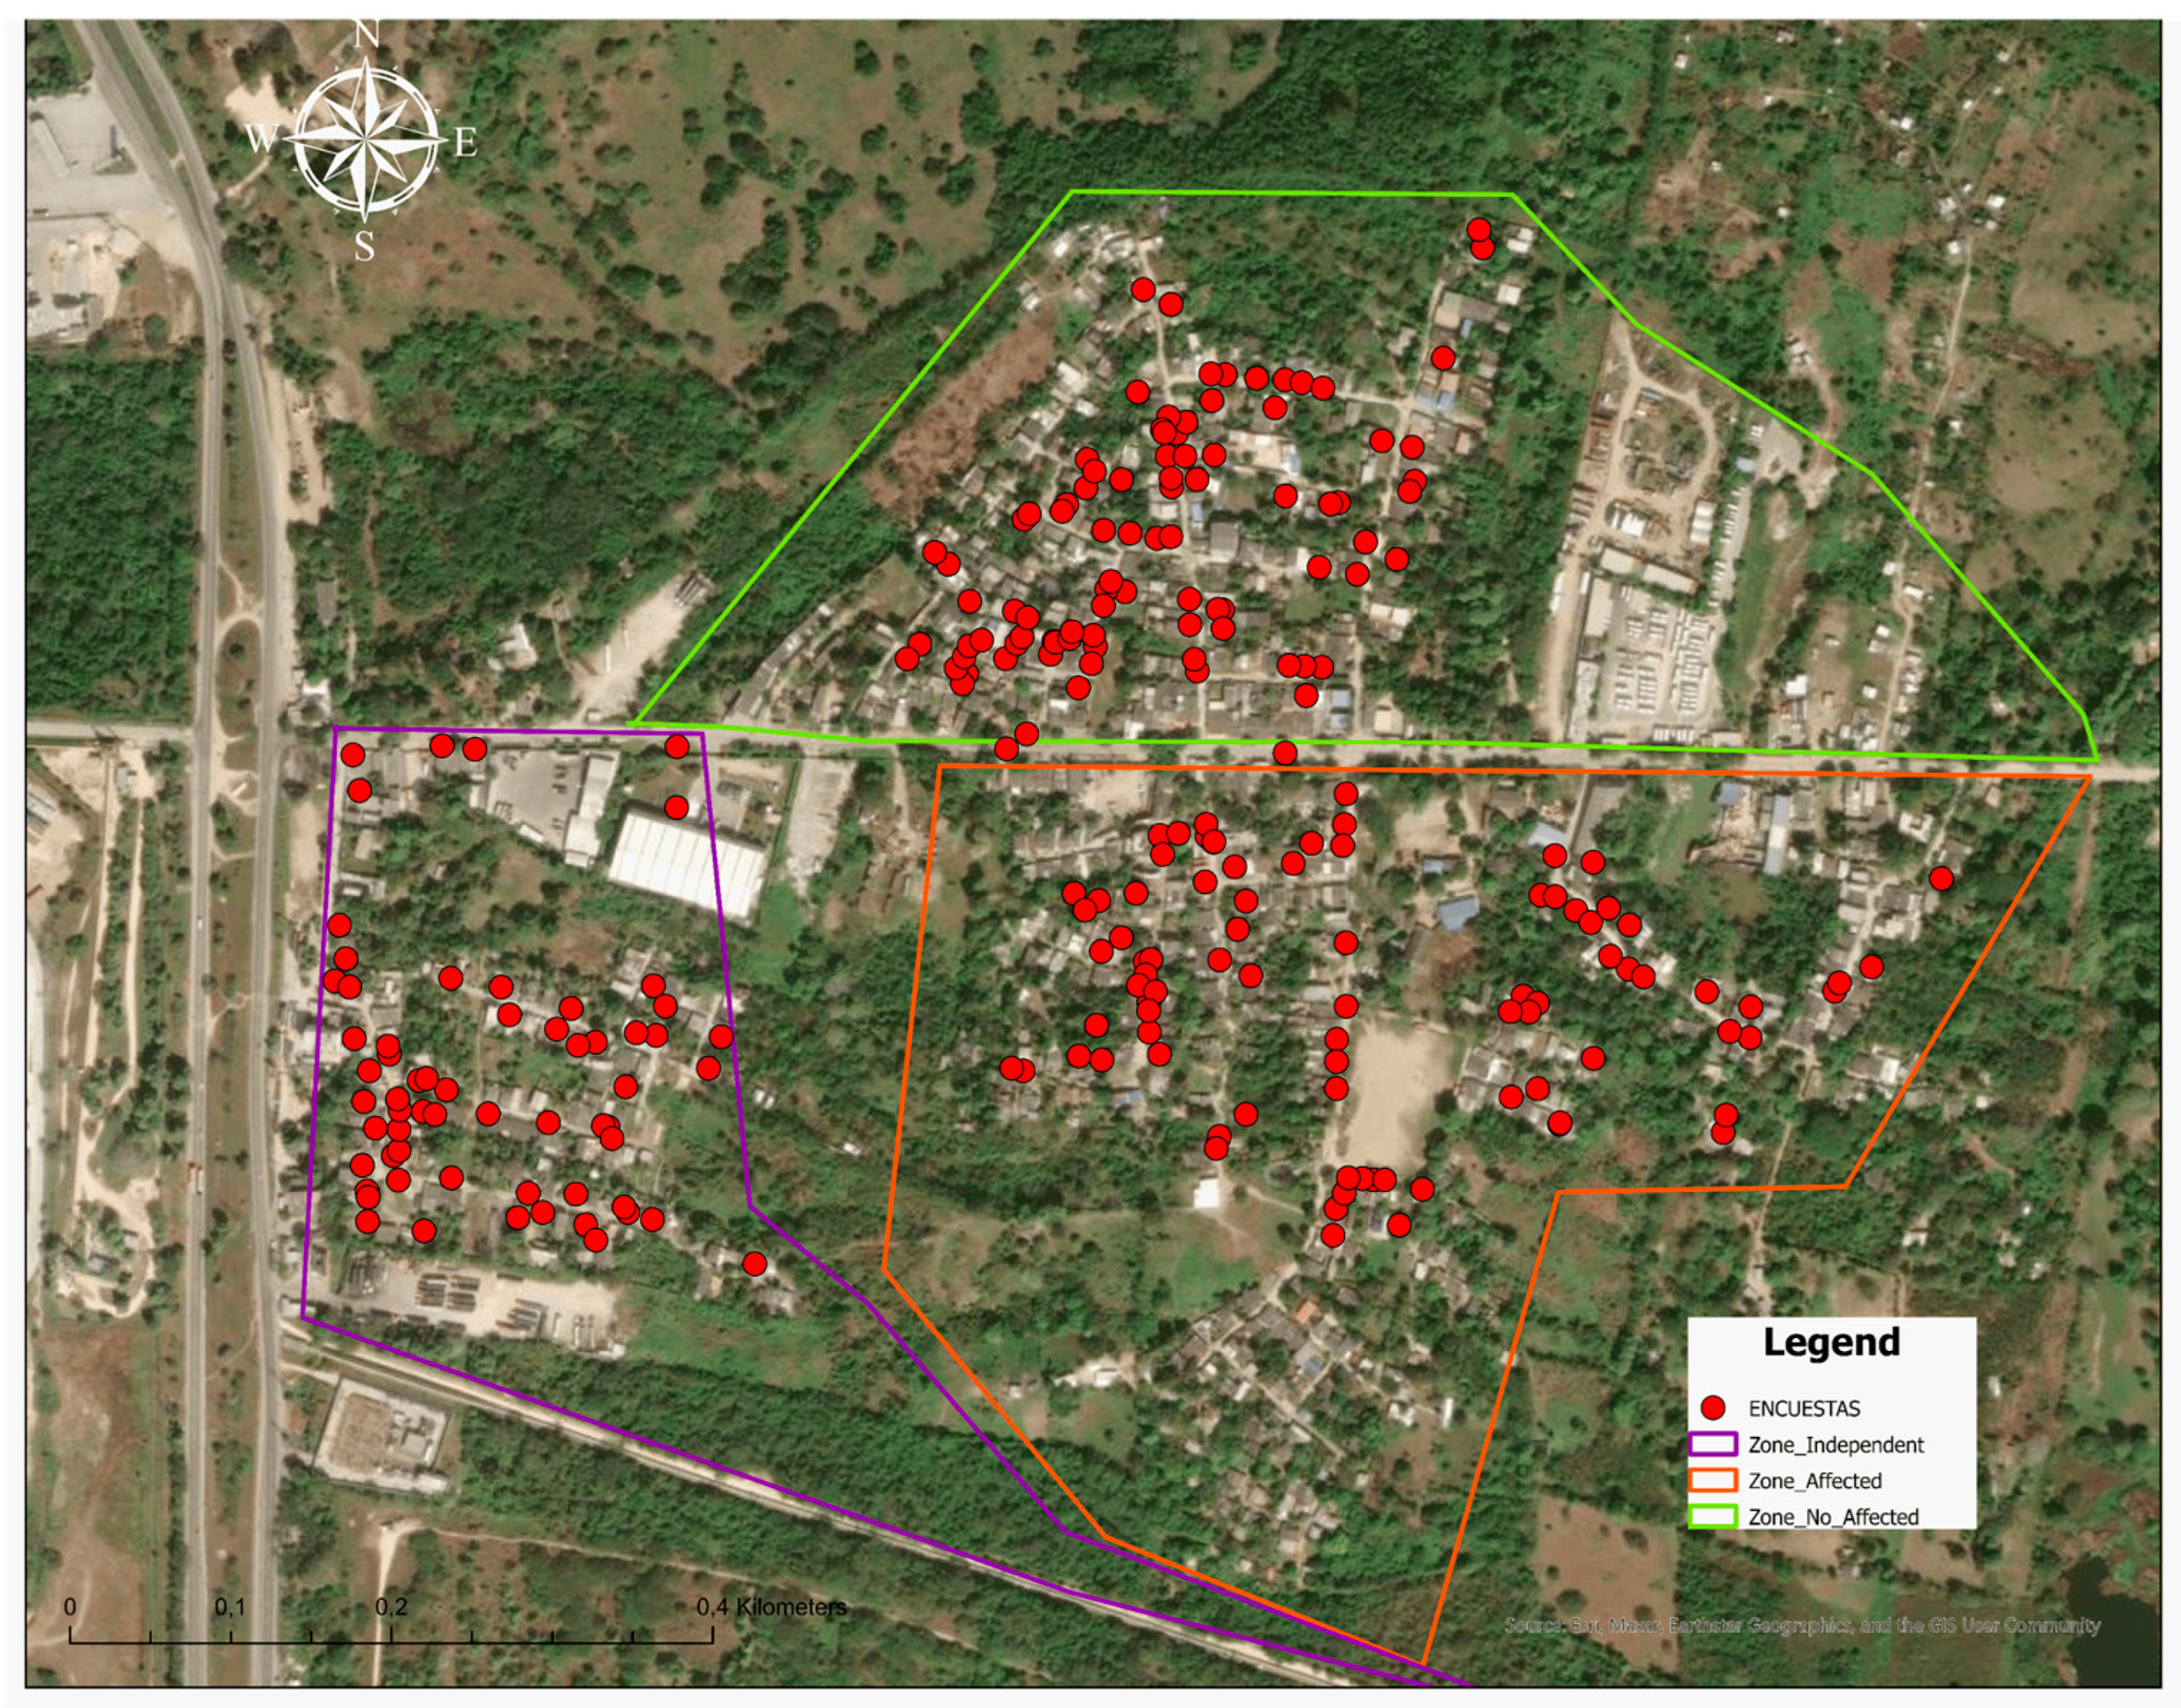
The sample size was determined via stratified sampling across three exposure strata—affected, non-affected, and independent—defined in the susceptibility zoning map. The population consisted of N = 1146 dwellings [37]. Each stratum was treated as a sub-population, and proportional allocation followed the finite-population equation. Each stratum was treated as a sub-population, and proportional allocation with a 10% oversample was applied to offset refusals and incomplete surveys. Sampling points were randomly generated in ArcGIS Pro v3.2 (Figure 4) (“Create Random Points”) within each polygonal stratum and were validated with COMBAS community leaders to correct cases of (i) no dwelling at the coordinate, (ii) duplicate points within a parcel, or (iii) inaccessible locations; see Equation (1).
n f i n i t e = N ×   Z 2 2 × p ( 1 p ) Z 2 2 × p ( 1 p ) + ( N 1 ) × e 2
Surveys were conducted using ArcGIS Online mobile forms with automatic GPS tagging. Given typical horizontal errors of ±5–10 m in mobile devices, field teams recorded supplementary waypoints via Google Earth, which were subsequently validated and corrected in the office before incorporation into the final geodatabase.

3.3. Data Processing

Survey data (n = 240) were consolidated into a single geodatabase and standardized via z-score transformation to enable cross-dimensional comparison despite differing units of measurement. Dimension-specific vulnerability indices were computed by averaging standardized variable scores within the socioeconomic, structural, and geotechnical domains.
Internal consistency within each dimension was evaluated using Cronbach’s alpha coefficient, which quantifies inter-item correlation strength and reliability of composite indices. Inter-dimensional relationships were assessed via Spearman’s rank correlation coefficient, appropriate for ordinal and non-normally distributed data, to identify associations between structural damage, geotechnical exposure, and socioeconomic vulnerability.
Principal component analysis was applied to extract latent vulnerability dimensions through dimensionality reduction. Prior to PCA, dataset adequacy was verified using the Kaiser–Meyer–Olkin (KMO) measure of sampling adequacy and Bartlett’s test of sphericity to confirm sufficient shared variance among items. Components with eigenvalues greater than 1 were retained following Kaiser’s criterion, and Varimax orthogonal rotation was applied to enhance interpretability by maximizing variance of squared loadings within each component. Communalities were computed to assess the proportion of variance in each variable explained by the retained component structure.
Categorical relationships between structural damage severity and geotechnical indicators were tested using chi-square tests of independence, with association strength quantified via Cramer’s V coefficient. Standardized residuals were calculated to identify specific cells contributing disproportionately to overall χ2 values, revealing patterns of damage concentration relative to vent proximity.

3.4. Water and Gas Sampling from Volcano Vents

3.4.1. Water Sampling and Preservation

Water collection followed IDEAM guidelines and APHA/AWWA/WEF Standard Methods for the Examination of Water and Wastewater. On 6 August 2024 (09:00–13:00), a grab sample was obtained at the Boca 10 vent (Membrillal mud dome) after site conditioning (vegetation and debris removal) and a purge period to allow fresh discharge and clarification. In situ measurements included temperature, pH, and electrical conductivity prior to bottling. Preservation and holding times adhered to Standard Methods (e.g., immediate analysis for pH and temperature; refrigeration < 6 °C for conductivity and total solids; acidification to pH < 2 for metals), as summarized in the project’s preservation table. Laboratory custody, coding, and analysis were performed under ISO/IEC 17025 [38] quality management (Table 2).

3.4.2. Gas Sampling and Preservation

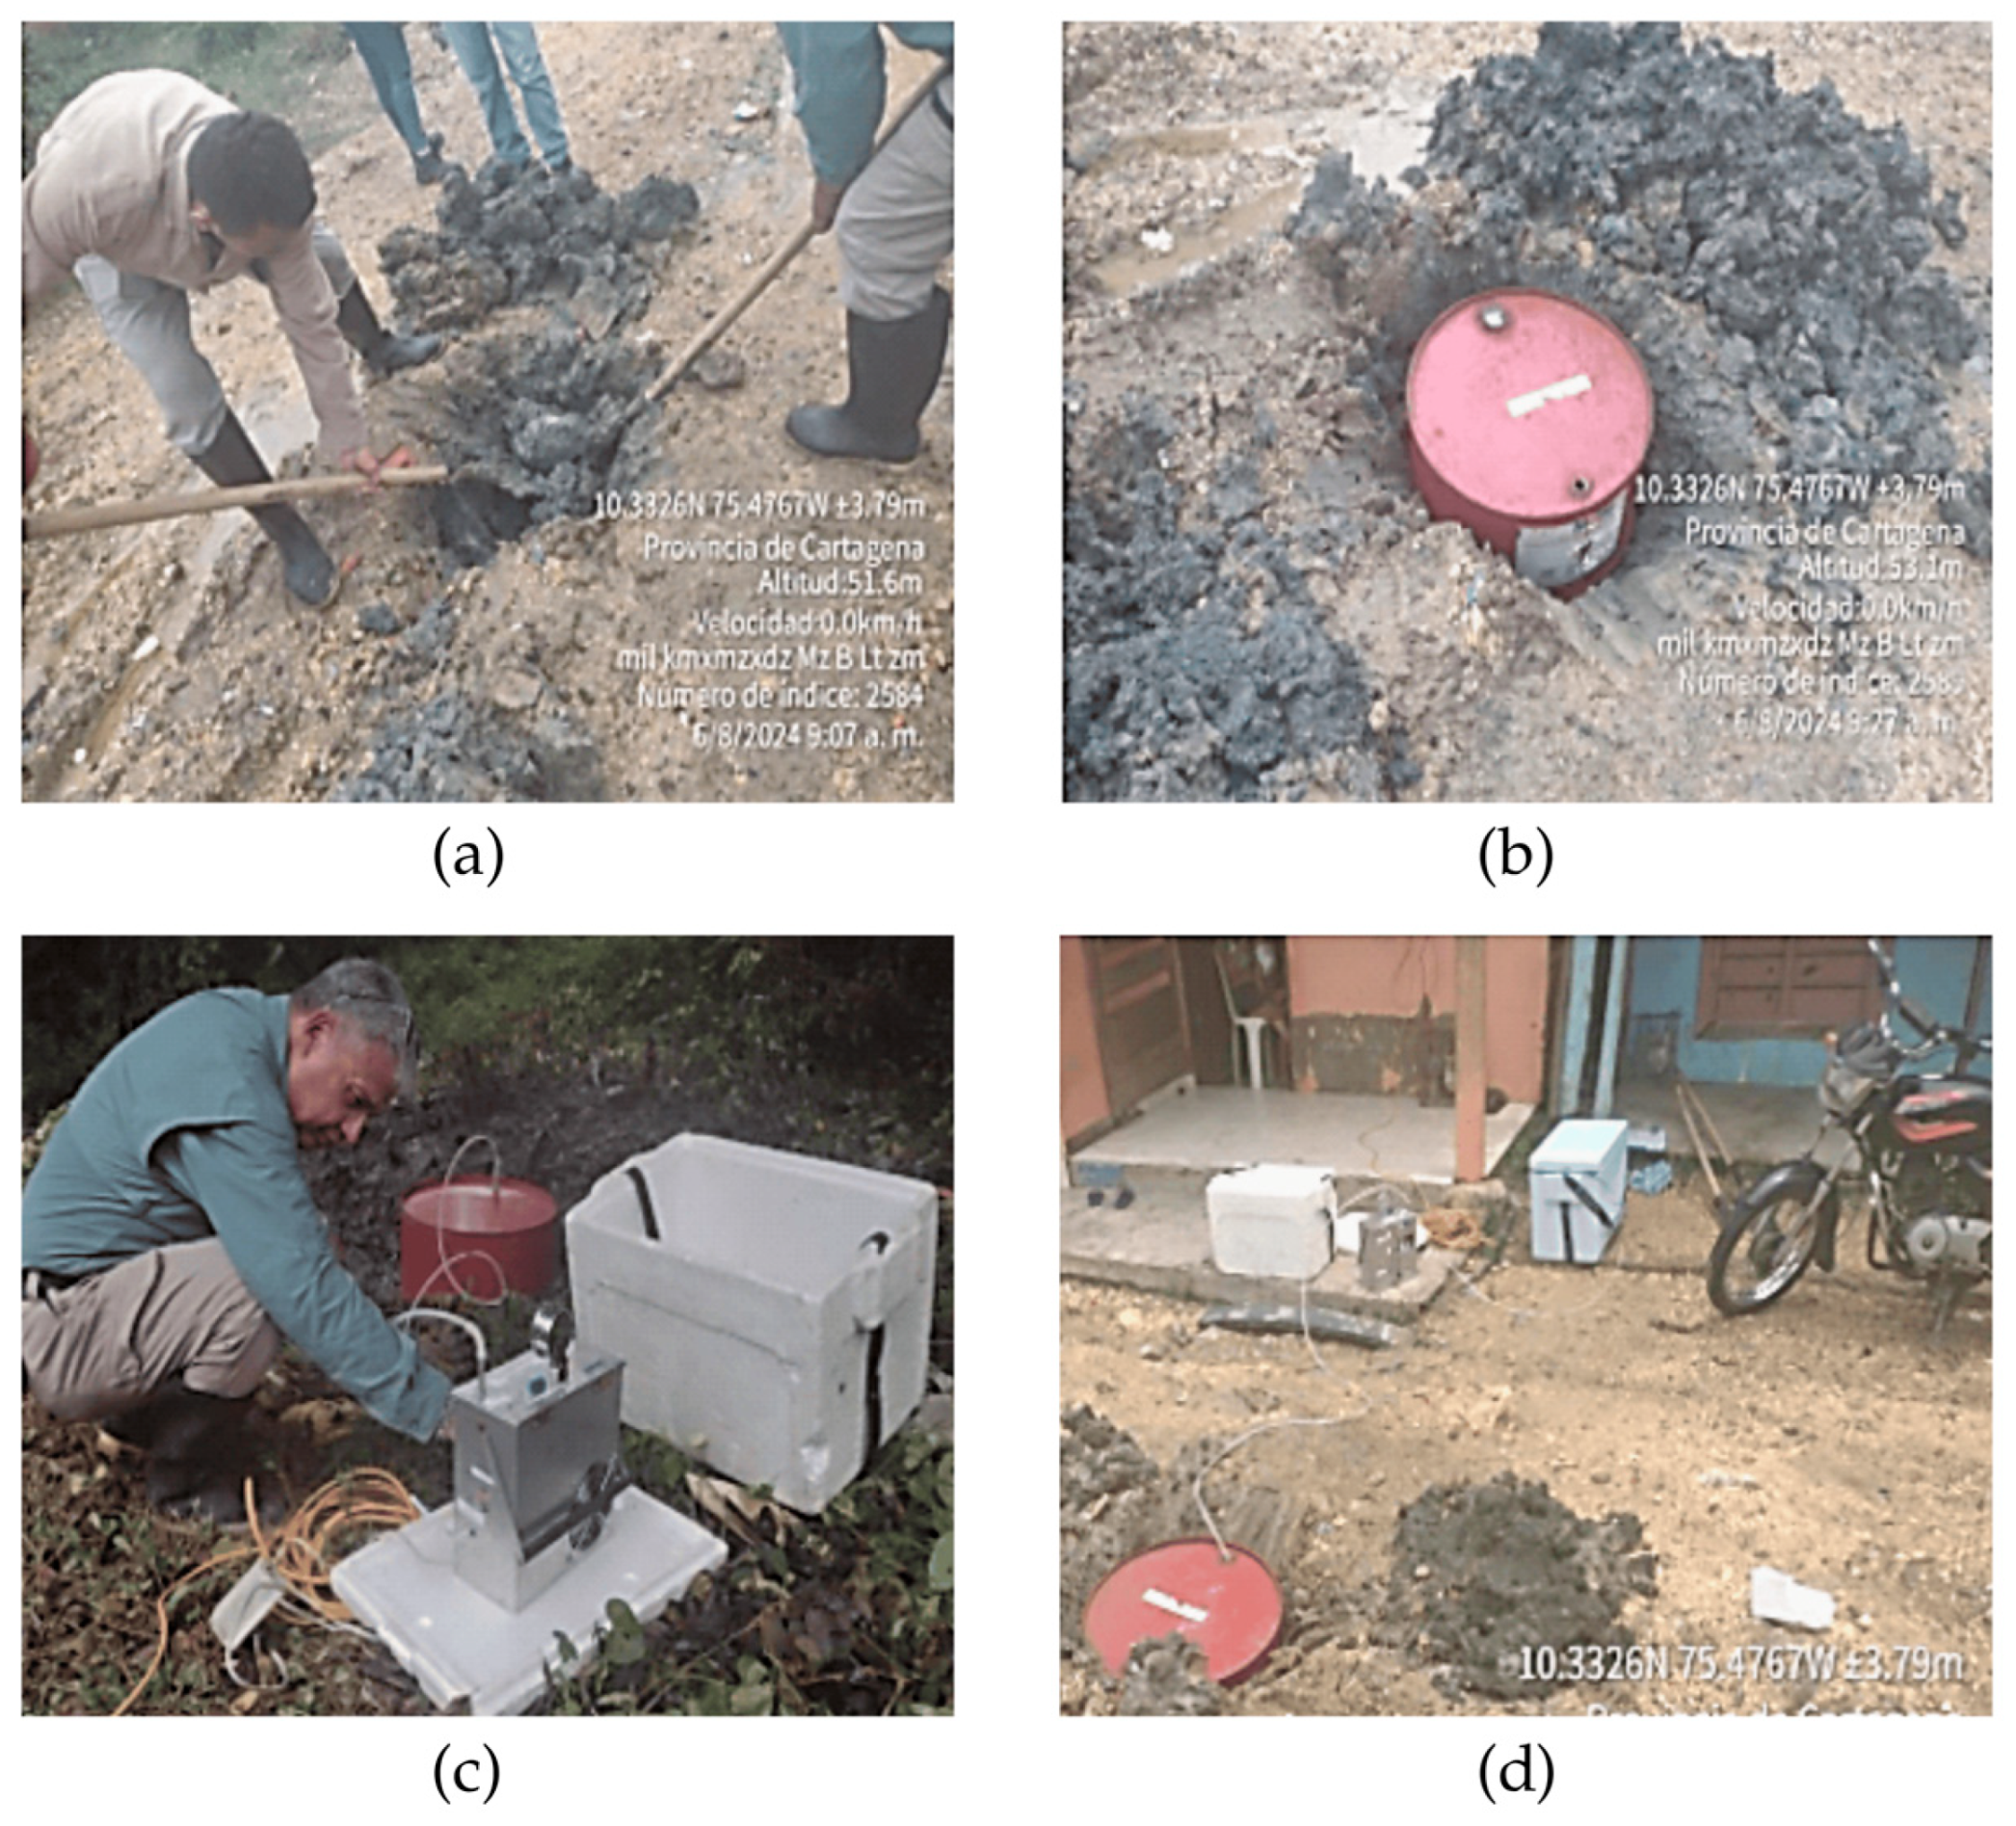
Gas sampling followed Air Quality Monitoring protocols adapted to Membrillal field conditions. Samples were collected using Tedlar® (Merck KGaA, Cartagena de Indias, Colombia) gas-sampling bags connected to a vacuum pump with calibrated flow control, minimizing atmospheric contamination. An inverted metallic chamber positioned over each vent orifice accumulated emitted gases for homogenization. Sampling initiated approximately one hour after chamber placement through a dedicated port once steady emission was observed.
Extraction flow was maintained at 0.2–0.3 L·min−1 depending on vent discharge rate, yielding 7.5 L from Vent 10 (25 min) and 4.5 L from Vent 4 (15 min). PTFE tubing and stainless-steel fittings prevented gas-surface reactions. Filled bags were sealed, labeled, and stored in opaque rigid cases at ambient temperature. Field logs recorded extraction time, flow rate, air temperature, and barometric pressure (Figure 5).

3.5. Laboratory Analytical Procedures

3.5.1. Water Laboratory Test

Water samples collected from Vent 10 were analyzed for major cations (Ca, Fe, Mg, K, and Na), anions (Cl, F, and SO42−), solid fractions (total, volatile, and suspended), and physical parameters (T, pH, and EC) following APHA–AWWA–WEF and EPA protocol, are presented in Table 3.

3.5.2. Gas Testing

Gas samples were equilibrated to 25 °C before analysis via dual-column gas chromatography-mass spectrometry (GC-MS). Column configuration employed: (1) PLOT Q for CO2 and C2–C4 hydrocarbons, (2) Molsieve 5Å for permanent gases (H2, O2, N2, CO, and CH4) using helium carrier gas at 1.0–1.5 mL·min−1. Temperature programming initiated at 35 °C and ramped to 180–200 °C to resolve C1–C2 compounds. The Agilent 5975C mass spectrometer operated in electron ionization mode (70 eV), acquiring full-scan spectra (m/z 2–100). Five-point calibration curves using certified reference gas mixtures bracketed sample concentrations. Compound identification relied on retention-time matching and NIST mass spectral library comparison.

3.6. Spatio-Temporal Analysis

In the Membrillal sector, spatio-temporal analysis of mud diapirism between 2013 and 2024 quantified surface deformation, morphological change, and eruptive behavior. Multi-temporal satellite imagery, historical eruption records, and geospatial modeling in ArcGIS Pro v3.4 were integrated in four stages: data acquisition, preprocessing, temporal normalization, and change detection.
Satellite imagery acquisition prioritized cloud-free scenes from Google Earth Pro and USGS Earth Explorer corresponding to documented eruption years (2013, 2016, 2020–2024) identified in CARDIQUE archives [31] and Barboza-Miranda et al. [30]. Morphological change detection integrated ERT-derived resistivity profiles, SPT penetration resistance data from 16 boreholes, and 240 georeferenced structural damage observations to establish spatial correlation between surface deformation patterns and subsurface diapiric activity. COMBAS complemented these datasets, validating eruption recurrence and community-perceived ground instability.

3.7. Data Compilation and Preparation—Susceptibility Mapping

The development of the susceptibility map for mud diapirism phenomena in the Membrillal sector was carried out through an integrated approach combining multicriteria spatial analysis, temporal evaluation of geological events, and geotechnical characterization of the terrain. The methodology was structured into three main phases: (1) data compilation and preparation, (2) spatial processing and analysis of georeferenced information, and (3) multicriteria integration and susceptibility zoning.

Data Compilation and Standardization

Geospatial, geological, geotechnical, geomorphological, and socio-structural data were compiled from previous studies, field campaigns, and community records, including historical diapiric events from 1995 to 2024 [48,49,50,51,52,53,54,55]. All datasets were standardized to the MAGNA–SIRGAS/Colombia West system (EPSG:3115) to ensure spatial consistency. Preprocessing eliminated redundancies and positional errors, harmonized attributes, and normalized variables using min–max scaling for continuous data and numerical reclassification for categorical layers.
A geodatabase in ArcGIS Pro v3.4 integrated thematic layers such as active vent locations [47,48,49,50,51,52,53,54], ERT-derived resistivity anomalies, SPT and test pit results, and housing or structural damage distribution. Raster data were resampled to 5 m resolution and reclassified on a 1–4 ordinal scale, from low to very high susceptibility. Spatial analysis generated proximity, density, and terrain derivative maps (slope and curvature) to represent factors influencing diapiric reactivation.

3.8. Methodological Limitations

This study acknowledges several methodological constraints that affect data collection scope and analytical resolution. Geospatial positioning was limited by consumer-grade GPS devices in mobile survey instruments, yielding typical horizontal errors of ±5–10 m, with residual positional uncertainty potentially affecting precise spatial correlation between household locations and subsurface geotechnical features. Satellite imagery interpretation for temporal change detection relied on freely available multispectral data with spatial resolutions of 0.5–30 m, limiting detection of micro-scale surface deformation between observation years.
Hydrogeochemical and gas sampling was constrained to a single field campaign (6 August 2024), collecting samples from two active vents, providing temporal snapshots without seasonal replication to assess variability linked to diapiric pressurization cycles. Laboratory analytical methods preclude quantification of all potential cationic species, and gas collection protocols using inverted-chamber methods may induce pressure artifacts.
GIS-based susceptibility modeling employed expert-judgment weighting validated through sensitivity analysis, but weights reflect subjective prioritization and may not capture emergent nonlinear interactions among factors. The 5 m raster resolution and ordinal classification system aggregate spatial heterogeneity. Validation relied on historical records and community data rather than independent continuous monitoring instrumentation.
Absence of quantitative precipitation records for the study period precluded statistical correlation analysis between rainfall patterns and documented vent reactivation events.

4. Results and Discussion

The following section presents the categorized results of data integration, which ultimately enable the development of a susceptibility map for mud volcano eruption hazards.

4.1. Sample Size from the Community

Stratified random sampling across three exposure zones (affected, non-affected, and independent) yielded a target sample of n = 407 dwellings from a population of N = 1146. Field verification via GPS and COMBAS validation identified 223 vacant or duplicate addresses, reducing the effective sample to n = 184. To ensure statistical robustness, 30% oversampling was applied, yielding a final sample of n = 240 dwellings distributed proportionally: Zone P1 (affected) = 118 dwellings (49%), Zone P2 (non-affected) = 84 dwellings (35%), and Zone P3 (independent) = 38 dwellings (16%); see Table 4 and Table 5.

4.2. Statistical Analysis-Results

To characterize surveyed households, descriptive statistics were organized by analytical dimension—structural, socioeconomic, and geotechnical—identifying physical, social, and environmental vulnerability factors in Membrillal (Table 6).
Structural assessment (n = 240) revealed cracking in 46.9% of dwellings, with diagonal patterns dominating (58 of 112 damaged structures). Crack width > 1.5 mm was recorded in 27.2%, and 60.3% were rated fair-to-poor condition requiring intervention. Household demographics showed a mean size of 4.23 ± 2.08 persons, with 72% reporting residence duration > 10 years.

4.2.1. Reliability and Internal Consistency of Survey Dimensions

Cronbach’s alpha (α) was computed to assess the reliability of each analytical dimension, evaluating internal consistency of items and their capacity to measure underlying constructs (Table 7).
Structural dimension reliability was moderate (α = 0.685; 95% CI [0.622–0.744]; mean inter-item r = 0.41). Removing V4_EST (overall dwelling condition) would raise α to 0.78, suggesting this item contributes unique variance beyond cracking-focused indicators. The socioeconomic dimension had low reliability (α = 0.289), consistent with formative constructs where items capture independent social and economic attributes. The geotechnical dimension achieved the highest reliability (α = 0.756; 95% CI [0.709–0.798]), with strong inter-item correlations confirming cohesive measurement of vent-proximity and ground-instability indicators.

4.2.2. Intradimensional Correlation (Spearman Analysis)

Spearman correlations (ρ) revealed strong internal cohesion in structural and geotechnical dimensions. Crack-related indicators correlated highly (ρ = 0.823–0.892), confirming a common damage mechanism from differential settlement, while overall dwelling condition showed a weak association (ρ ≈ 0.30), reflecting independent deterioration pathways. Geotechnical indicators exhibited moderate-to-strong correlations (ρ = 0.61–0.87), linking vent proximity, ground moisture, and fissuring as spatially clustered risk factors.

4.2.3. PCA Adequacy and Component Structure

Principal component analysis was applied to reduce dimensionality prior to geostatistical modeling. Sampling adequacy was acceptable (KMO = 0.724), and Bartlett’s test confirmed significant inter-item correlation (χ2(55) = 892.4, p < 0.001), validating PCA application (Table 8).
Three components with eigenvalues > 1 explained 63.9% of the total variance.
  • Component 1 (eigenvalue = 3.82, 34.8% variance) loaded structural damage indicators;
  • Component 2 (eigenvalue = 1.94, 17.6% variance) loaded geotechnical risk factors;
  • Component 3 (eigenvalue = 1.26, 11.5% variance) loaded socioeconomic vulnerability.
Varimax rotation enhanced interpretability, yielding factor loadings > 0.60 for primary indicators within each component.

4.3. Physicochemical Analysis from Water Samples

Groundwater sampled at Vent 10 (6 August 2024, 12:30) following IDEAM and APHA–AWWA–WEF procedures is a hypersaline, slightly alkaline brine (T = 30.4 °C; pH = 8.01; EC = 20.4 mS/cm) with high dissolved-solids load (TDS = 13,220 mg/L; TDS/EC ≈ 0.65), indicating ion-dominated chemistry with minimal suspended particulates (TSS = 20 mg/L) (Table 9).
Major ion composition reveals extreme chloride dominance (Cl = 6996 mg/L) with low sulfate (SO42− = 1.67 mg/L) and elevated dissolved iron (Fe2+ = 6.84 mg/L), characteristic of reducing conditions along diapiric fluid pathways. Measured cations include Ca2+ = 52.2 mg/L, Mg2+ = 23.1 mg/L, K+ = 39.1 mg/L, and Na+ = 8.0 mg/L.
The analytical dataset exhibits a charge-balance error of −94%, indicating severe cationic deficiency despite verified sodium measurement. This discrepancy does not reflect laboratory error but rather incomplete cationic characterization. Previous studies at Membrillal detected Ti, Mn, Si, Zn2+, and NO3 in vent waters, none of which were measured here. Additionally, alkalinity (HCO3 and CO32−) was not determined. Therefore, sodium data cannot be used for quantitative geochemical modeling. However, confirmed Cl, Fe2+, and SO42− indicate reducing, halide-dominated fluids consistent with connate marine water mobilization. Future campaigns should include expanded trace element and alkalinity analysis combined with isotopic measurements to achieve charge-balance closure.

4.4. Gas Sampling Analysis

Re-evaluating the gas-chromatography result in light of the subsurface sampling, the “air-only” chromatogram (N2/O2 at atmospheric proportions, no endogenous peaks) is most plausibly explained by a combination of low instantaneous free-gas yield and sampling hydraulics rather than by the absence of deep fluids: at the borehole/subsurface intake the conduit can be water-sealed by the dense, hypersaline brine documented at Membrillal, so the sampled interval contained little or no free gas and any headspace created during retrieval was rapidly back-filled with entrained atmospheric air through small leaks or through the annulus as pressure equalized; brief lags between purging and sealing, use of bags or tubing with non-zero permeability, or an incomplete seal at the probe can further bias the bottle toward air, while reduced conditions along the diapiric pathway can scrub CH4/H2S into CO2 (and if the GC setup lacked TCD/MS or an FID with methanizer, CO2 would not register as a diagnostic hydrocarbon peak, yielding a spectrum indistinguishable from air).
In saturated porous media, endogenous gases may also be present predominantly dissolved—not as free bubbles—and would therefore be underestimated unless a headspace-equilibration protocol was applied in the field; conversely, if the intake straddled the shallow vadose zone, diffusion from the surface can dominate the pore-gas composition during quiescent flux. Taken together, these mechanisms are consistent with the hydrogeochemical evidence of deep, chloride-rich brines and simply indicate transiently low recoverable free gas and/or atmospheric entrainment at the subsurface sampler. For future runs, a downhole packer-isolated interval with gas-tight stainless/borosilicate hardware, continuous purge to a closed flux chamber, and capture in gas-tight syringes or evacuated vials is recommended, paired detection (TCD + FID with methanizer or MS) and parallel dissolved-gas measurements (CH4/CO2 by headspace, with δ13C-CH413C-CO2 if possible); these adjustments will discriminate atmospheric ingress from low but geologically meaningful endogenous flux and bring the gas line of evidence into alignment with the groundwater chemistry already observed.

4.5. Spatio-Temporal Results

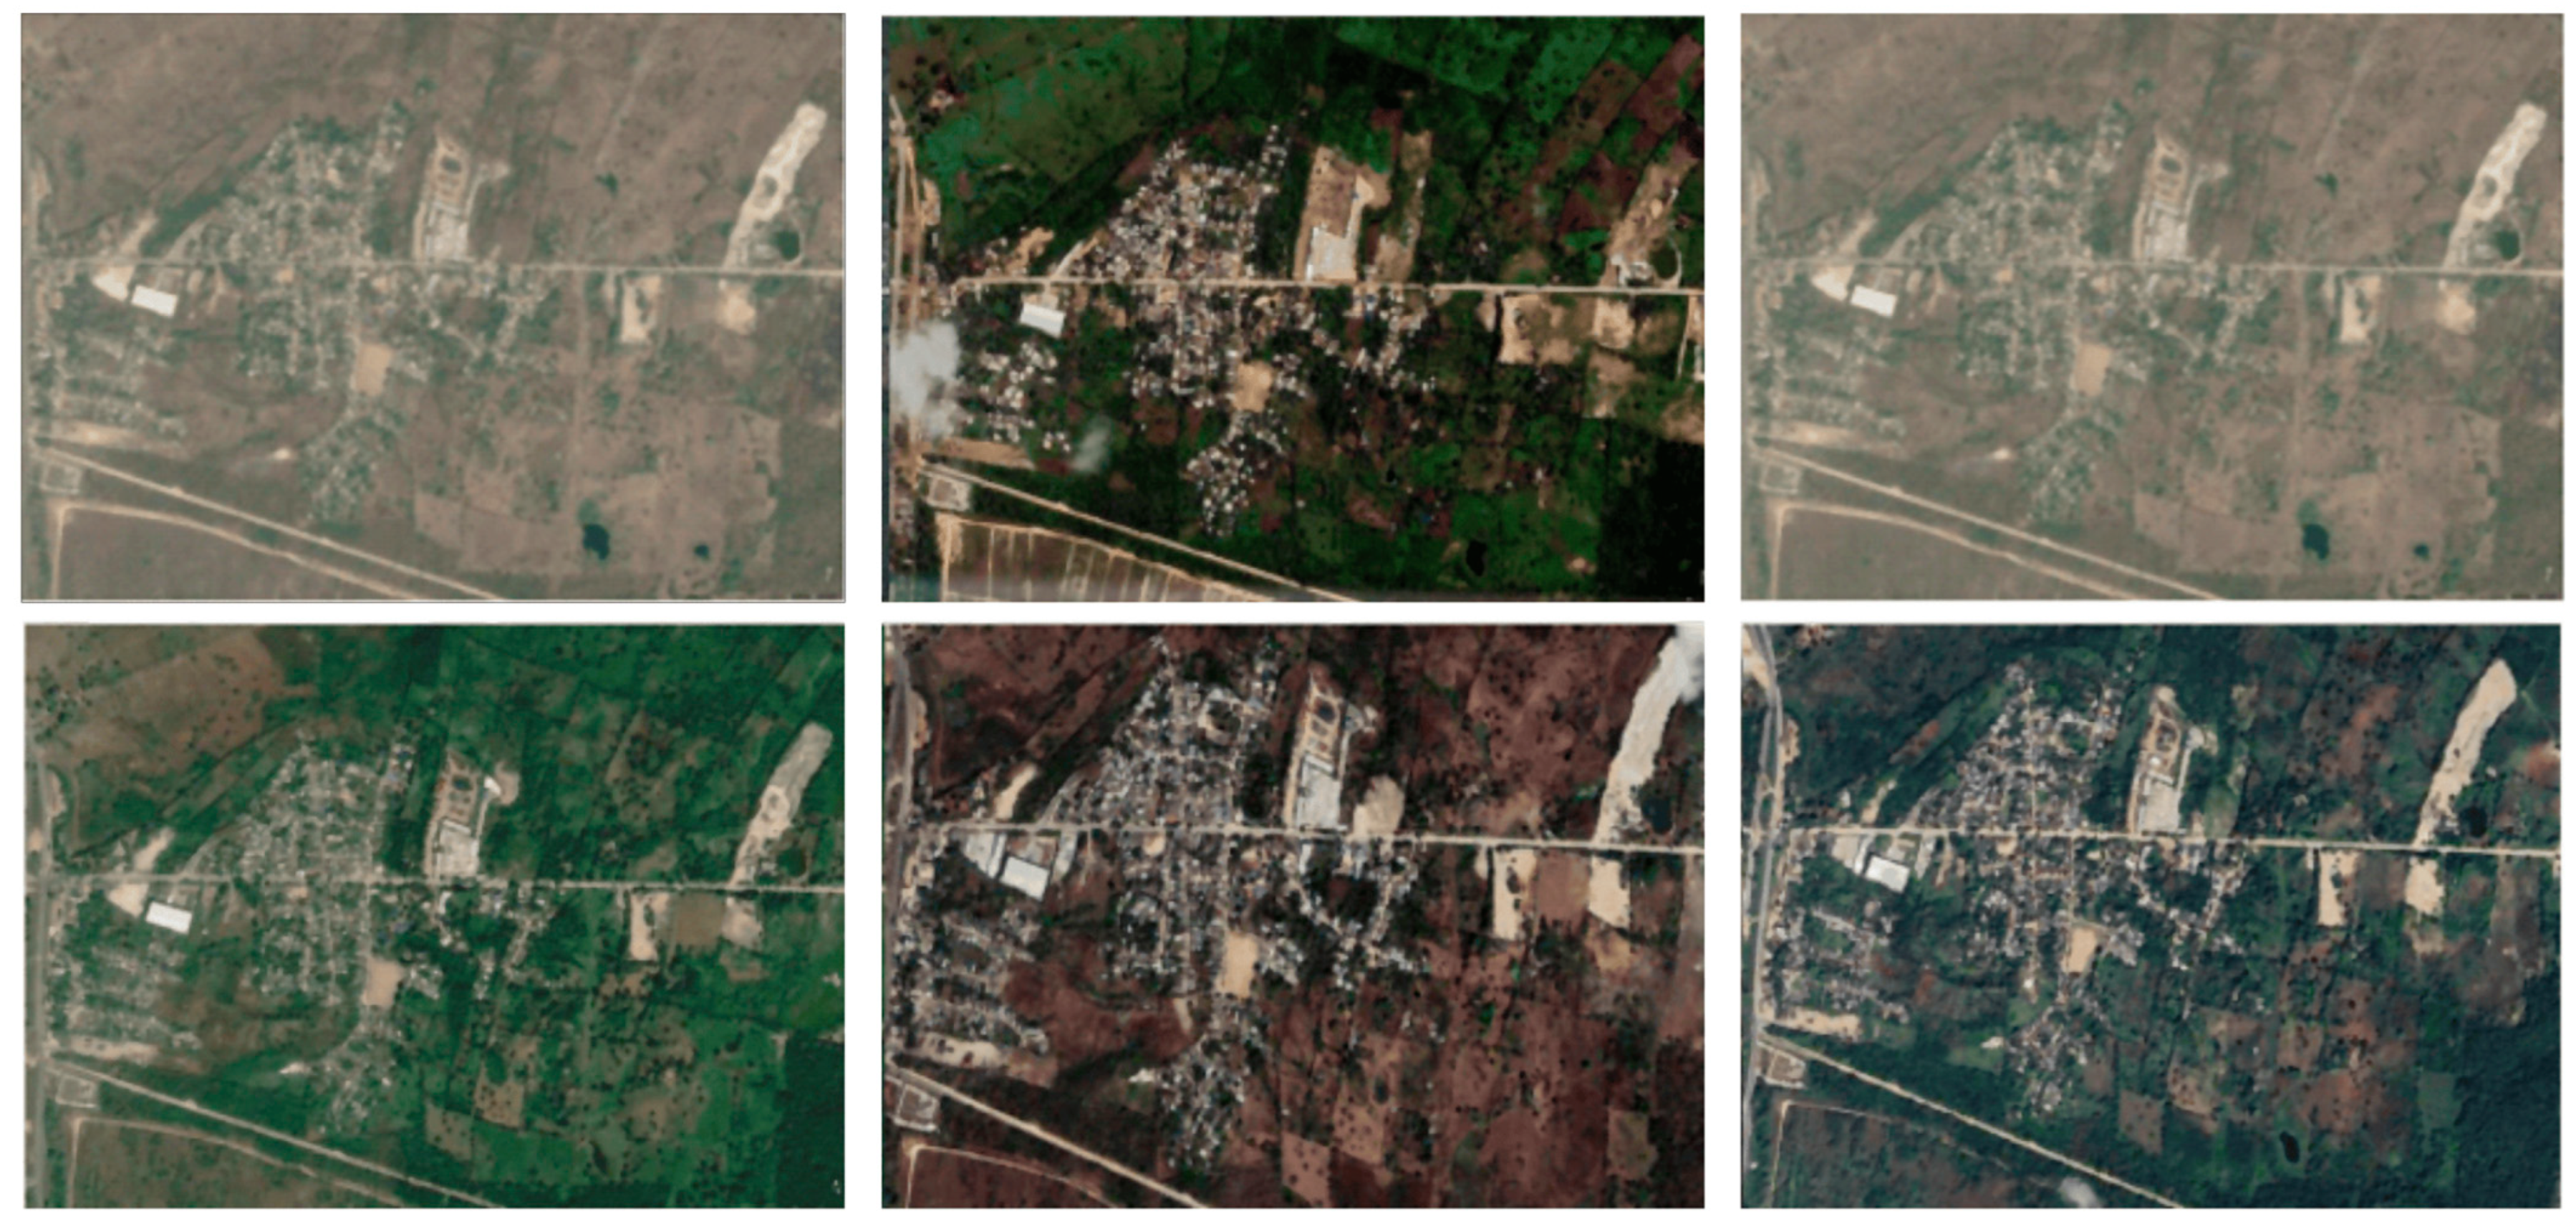
Multi-temporal satellite imagery (2013–2024) (Figure 6) documented progressive urban expansion into moderate-to-high susceptibility zones, vent proliferation from n = 3 to n = 10, and 35% vegetation reduction (Figure 6, Figure 7, Figure 8 and Figure 9). Field verification via COMBAS and August 2024 surveys correlated satellite-detected morphological changes with documented eruption events and structural damage patterns.

4.5.1. Baseline 2013 to 2016 Analysis

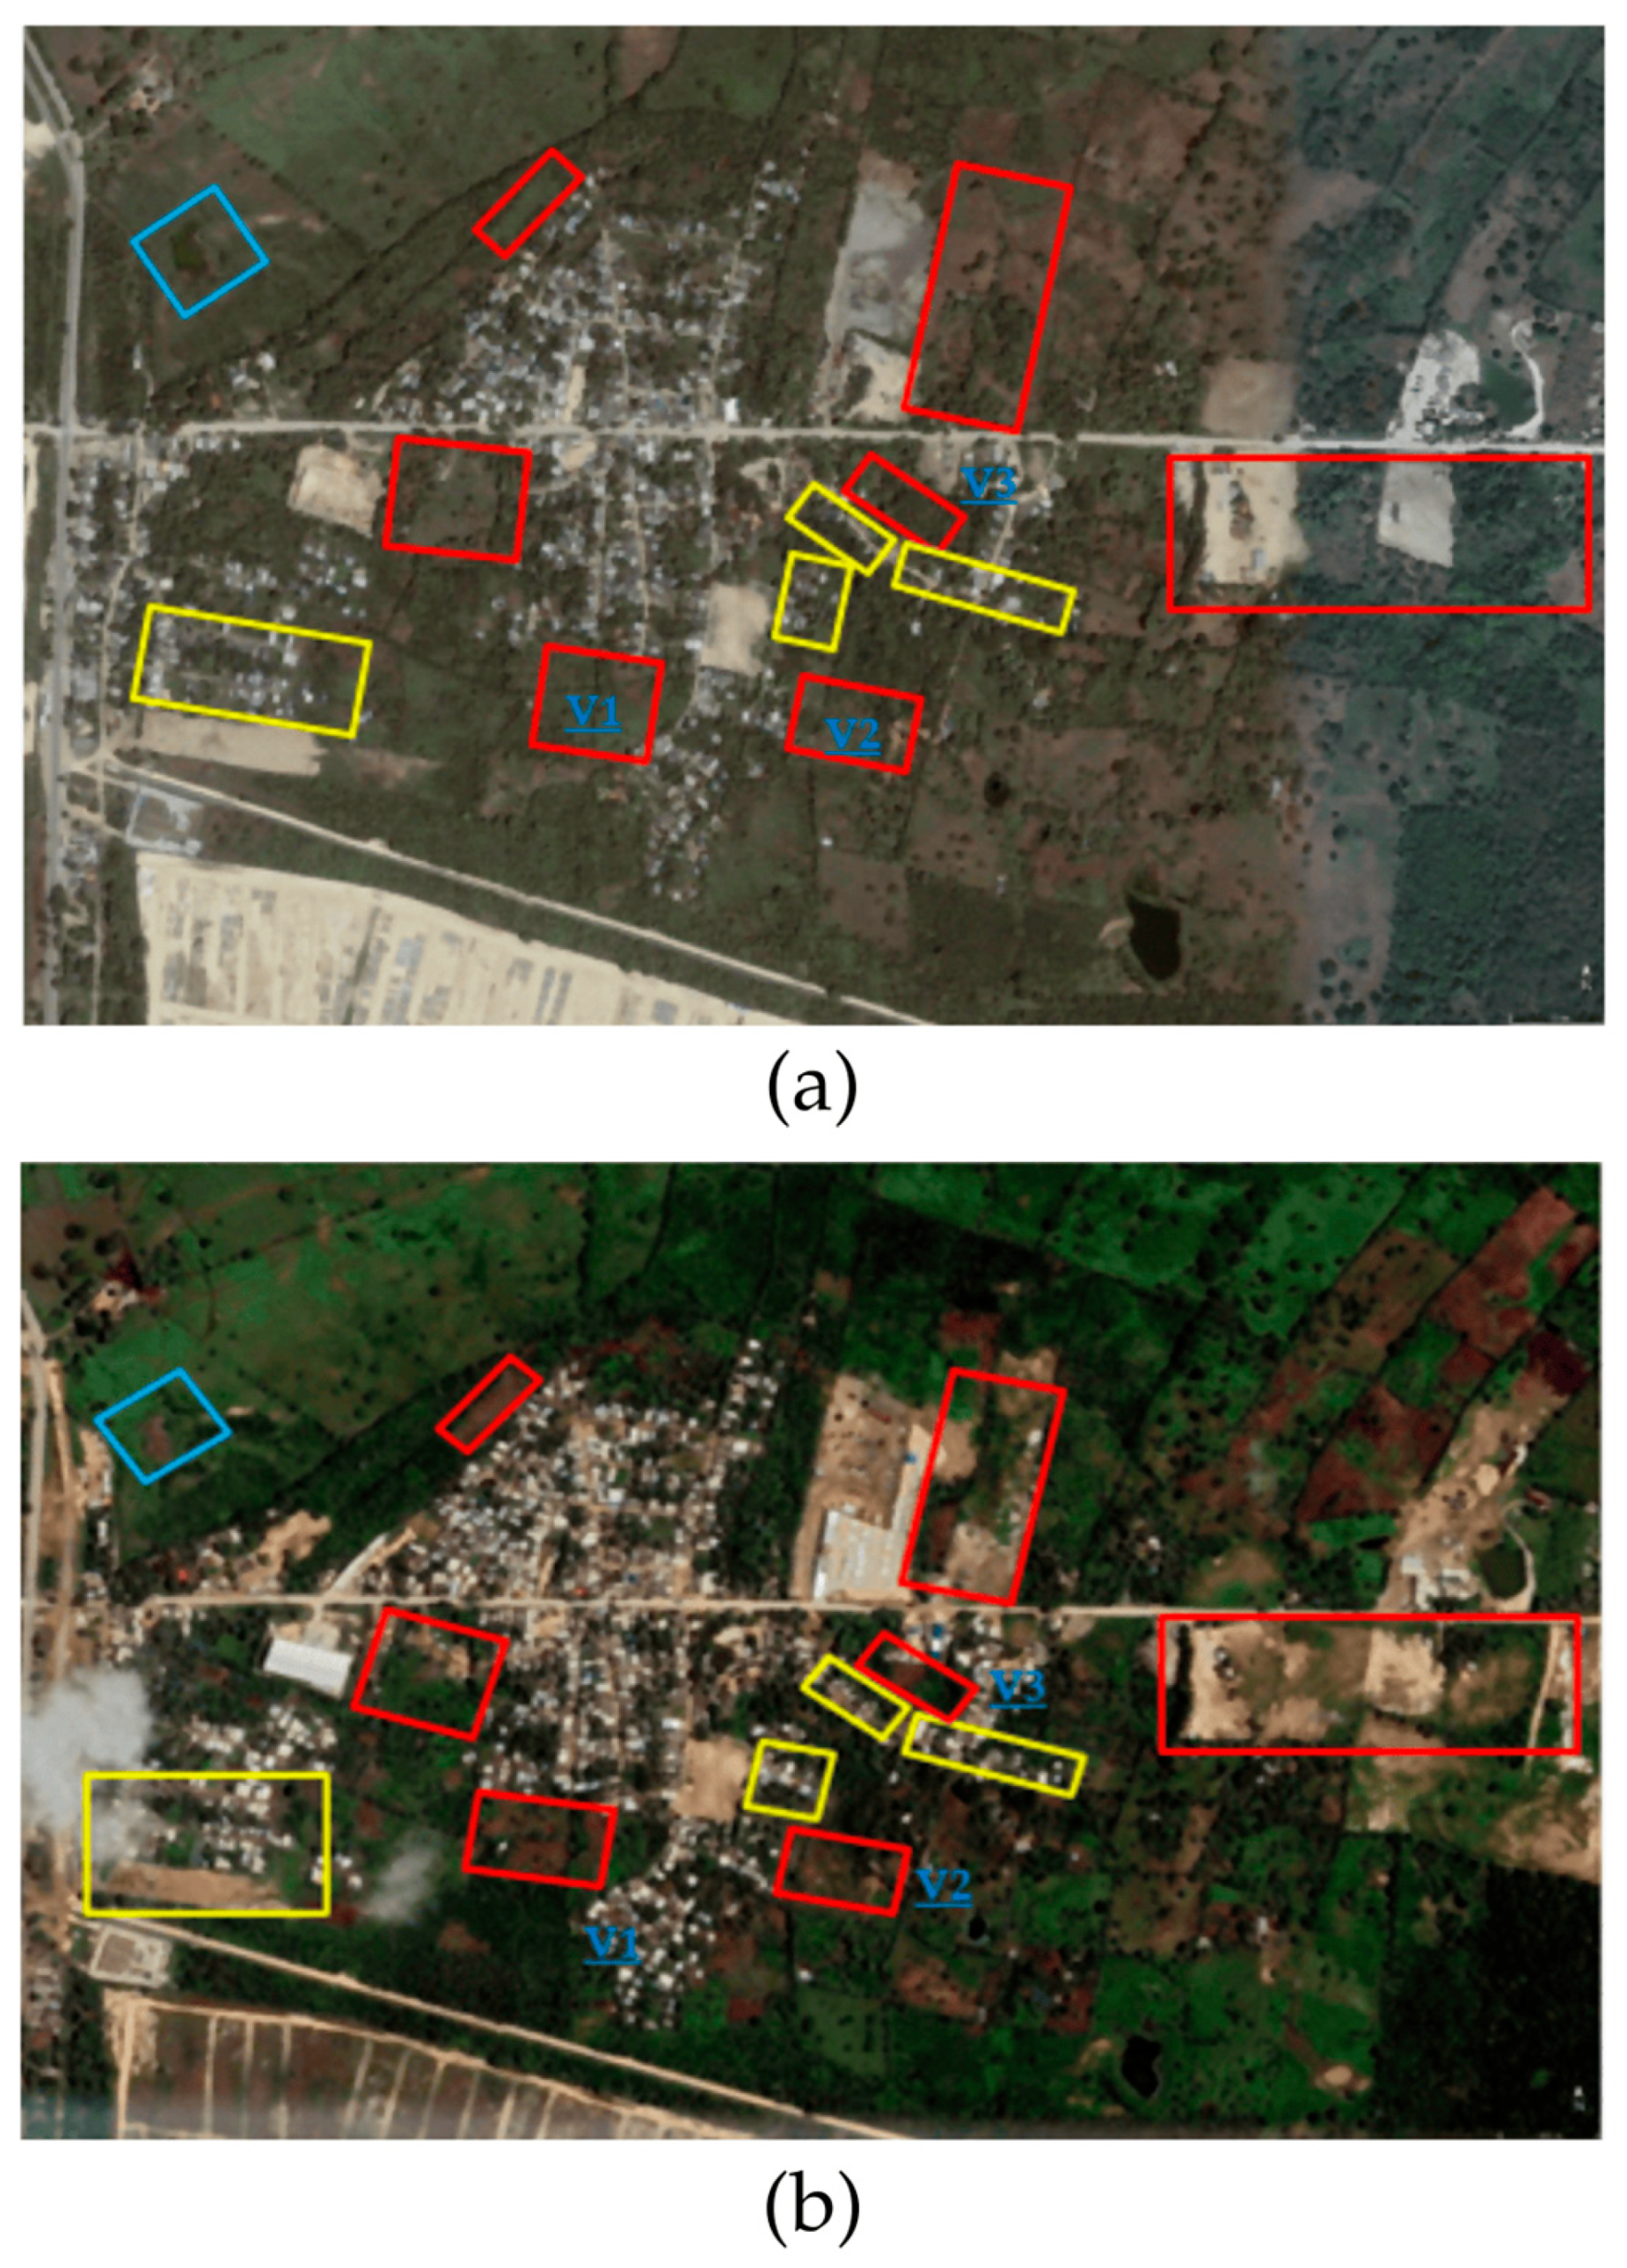
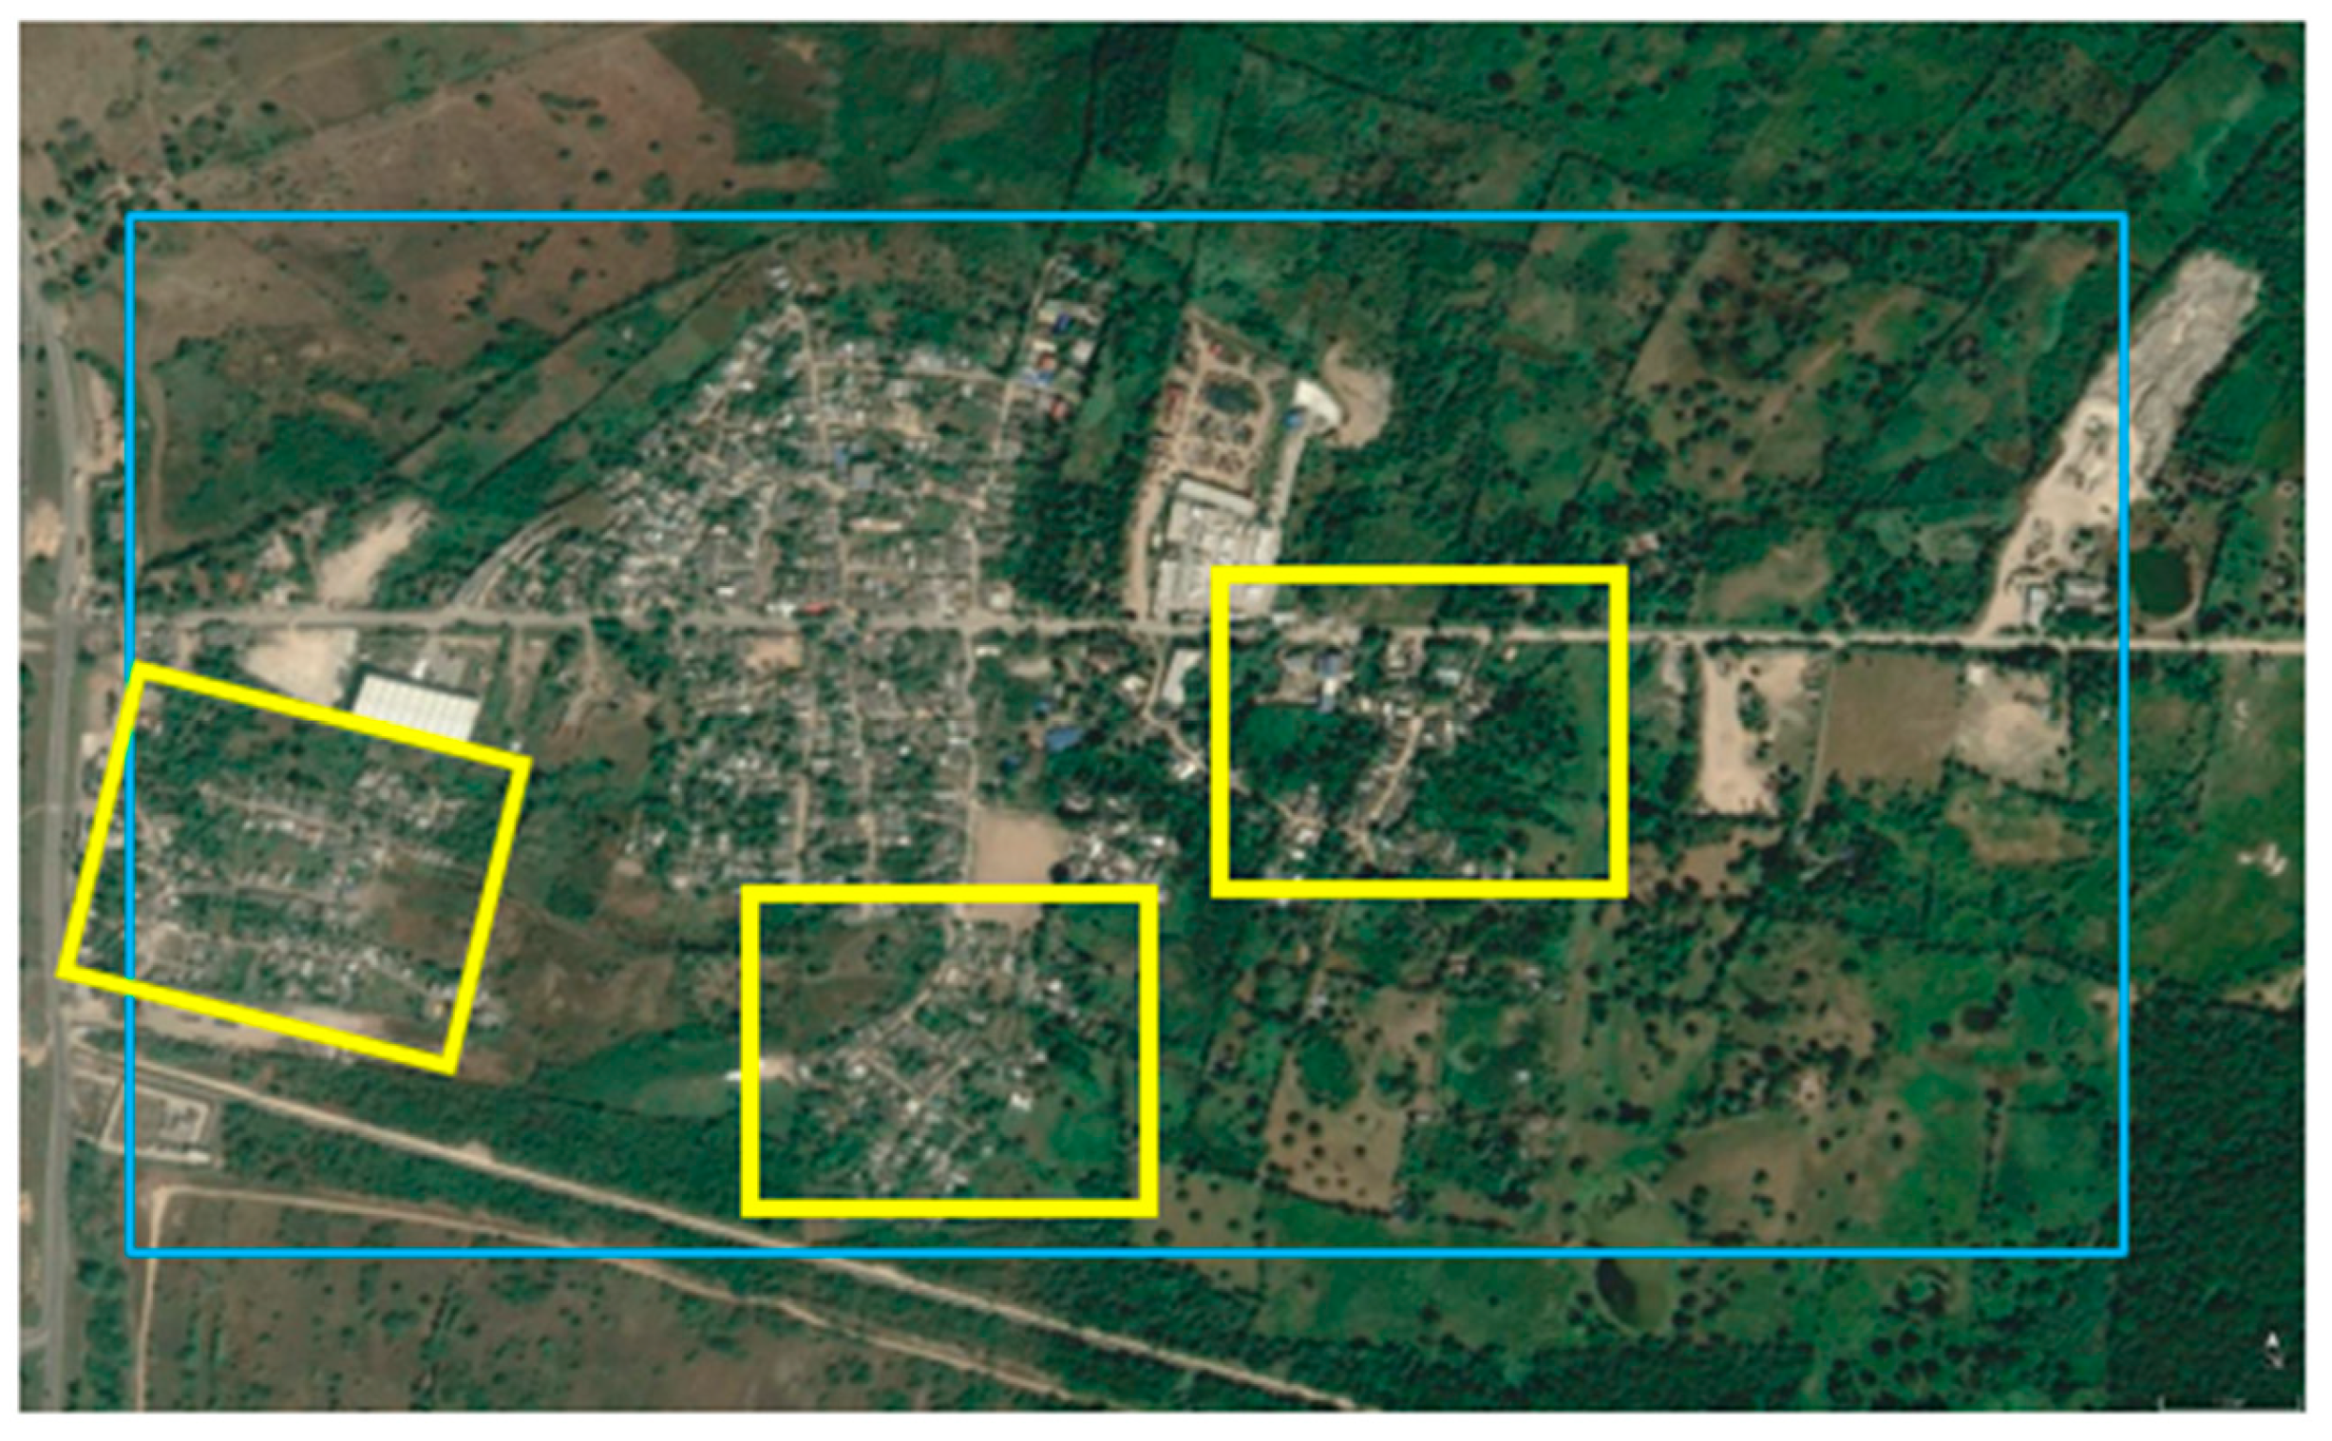
Satellite imagery from 2013 showed dense vegetation and dispersed rural housing around the central diapiric dome (Figure 7a). By 2016, the built-up area increased approximately 12%, concentrated in the northeastern periphery (Figure 7b). No major eruptions were evident in satellite imagery during this period, although CARDIQUE field reports [31] documented low-intensity mud seepage at Vents 1–3.

4.5.2. Early Urban Expansion and Associated Diapiric Subsurface Pressurization (2016–2021)

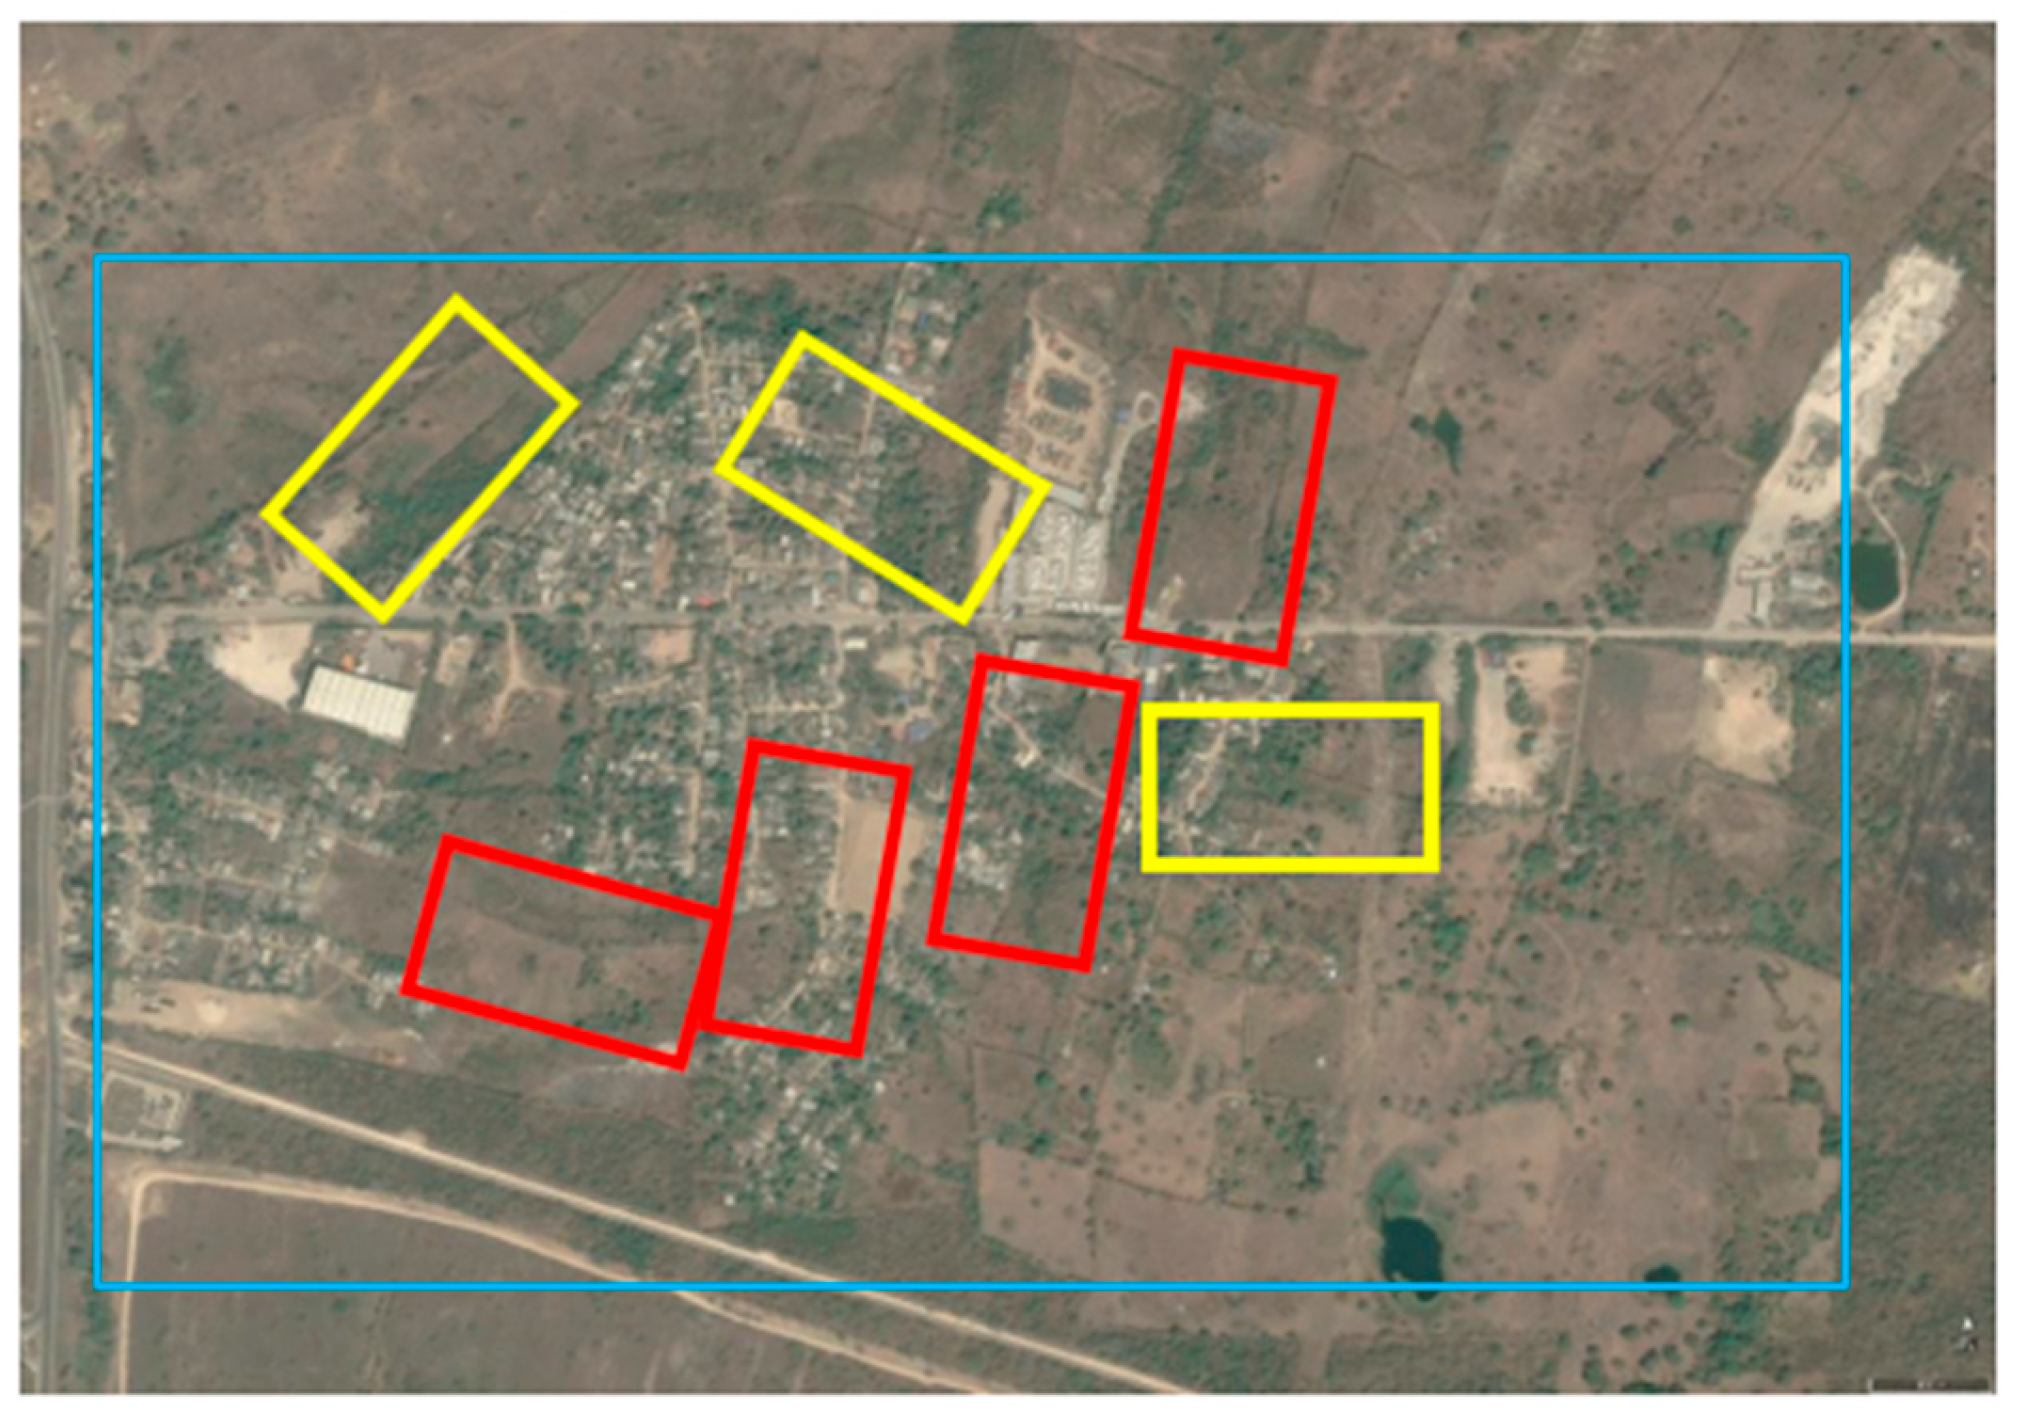
Between 2016 and 2021, the built-up area expanded an additional 18% relative to the 2016 baseline, with new residential clusters appearing within moderate-susceptibility zones delineated by Barboza-Miranda et al. [28] (Figure 8 and Figure 9). Field surveys (August 2024) recorded foundation cracking and moisture infiltration in post-2016 dwellings within high-susceptibility polygons. Morphological changes in the central dome sector corresponded to mud emission events documented by OAGRD. Vegetation cover analysis showed 25% reduction in arboreal density (2013–2021), attributed to regional drought and material extraction activities [31].

4.5.3. 2021–2023 Acceleration of Deformation and Event Recurrence

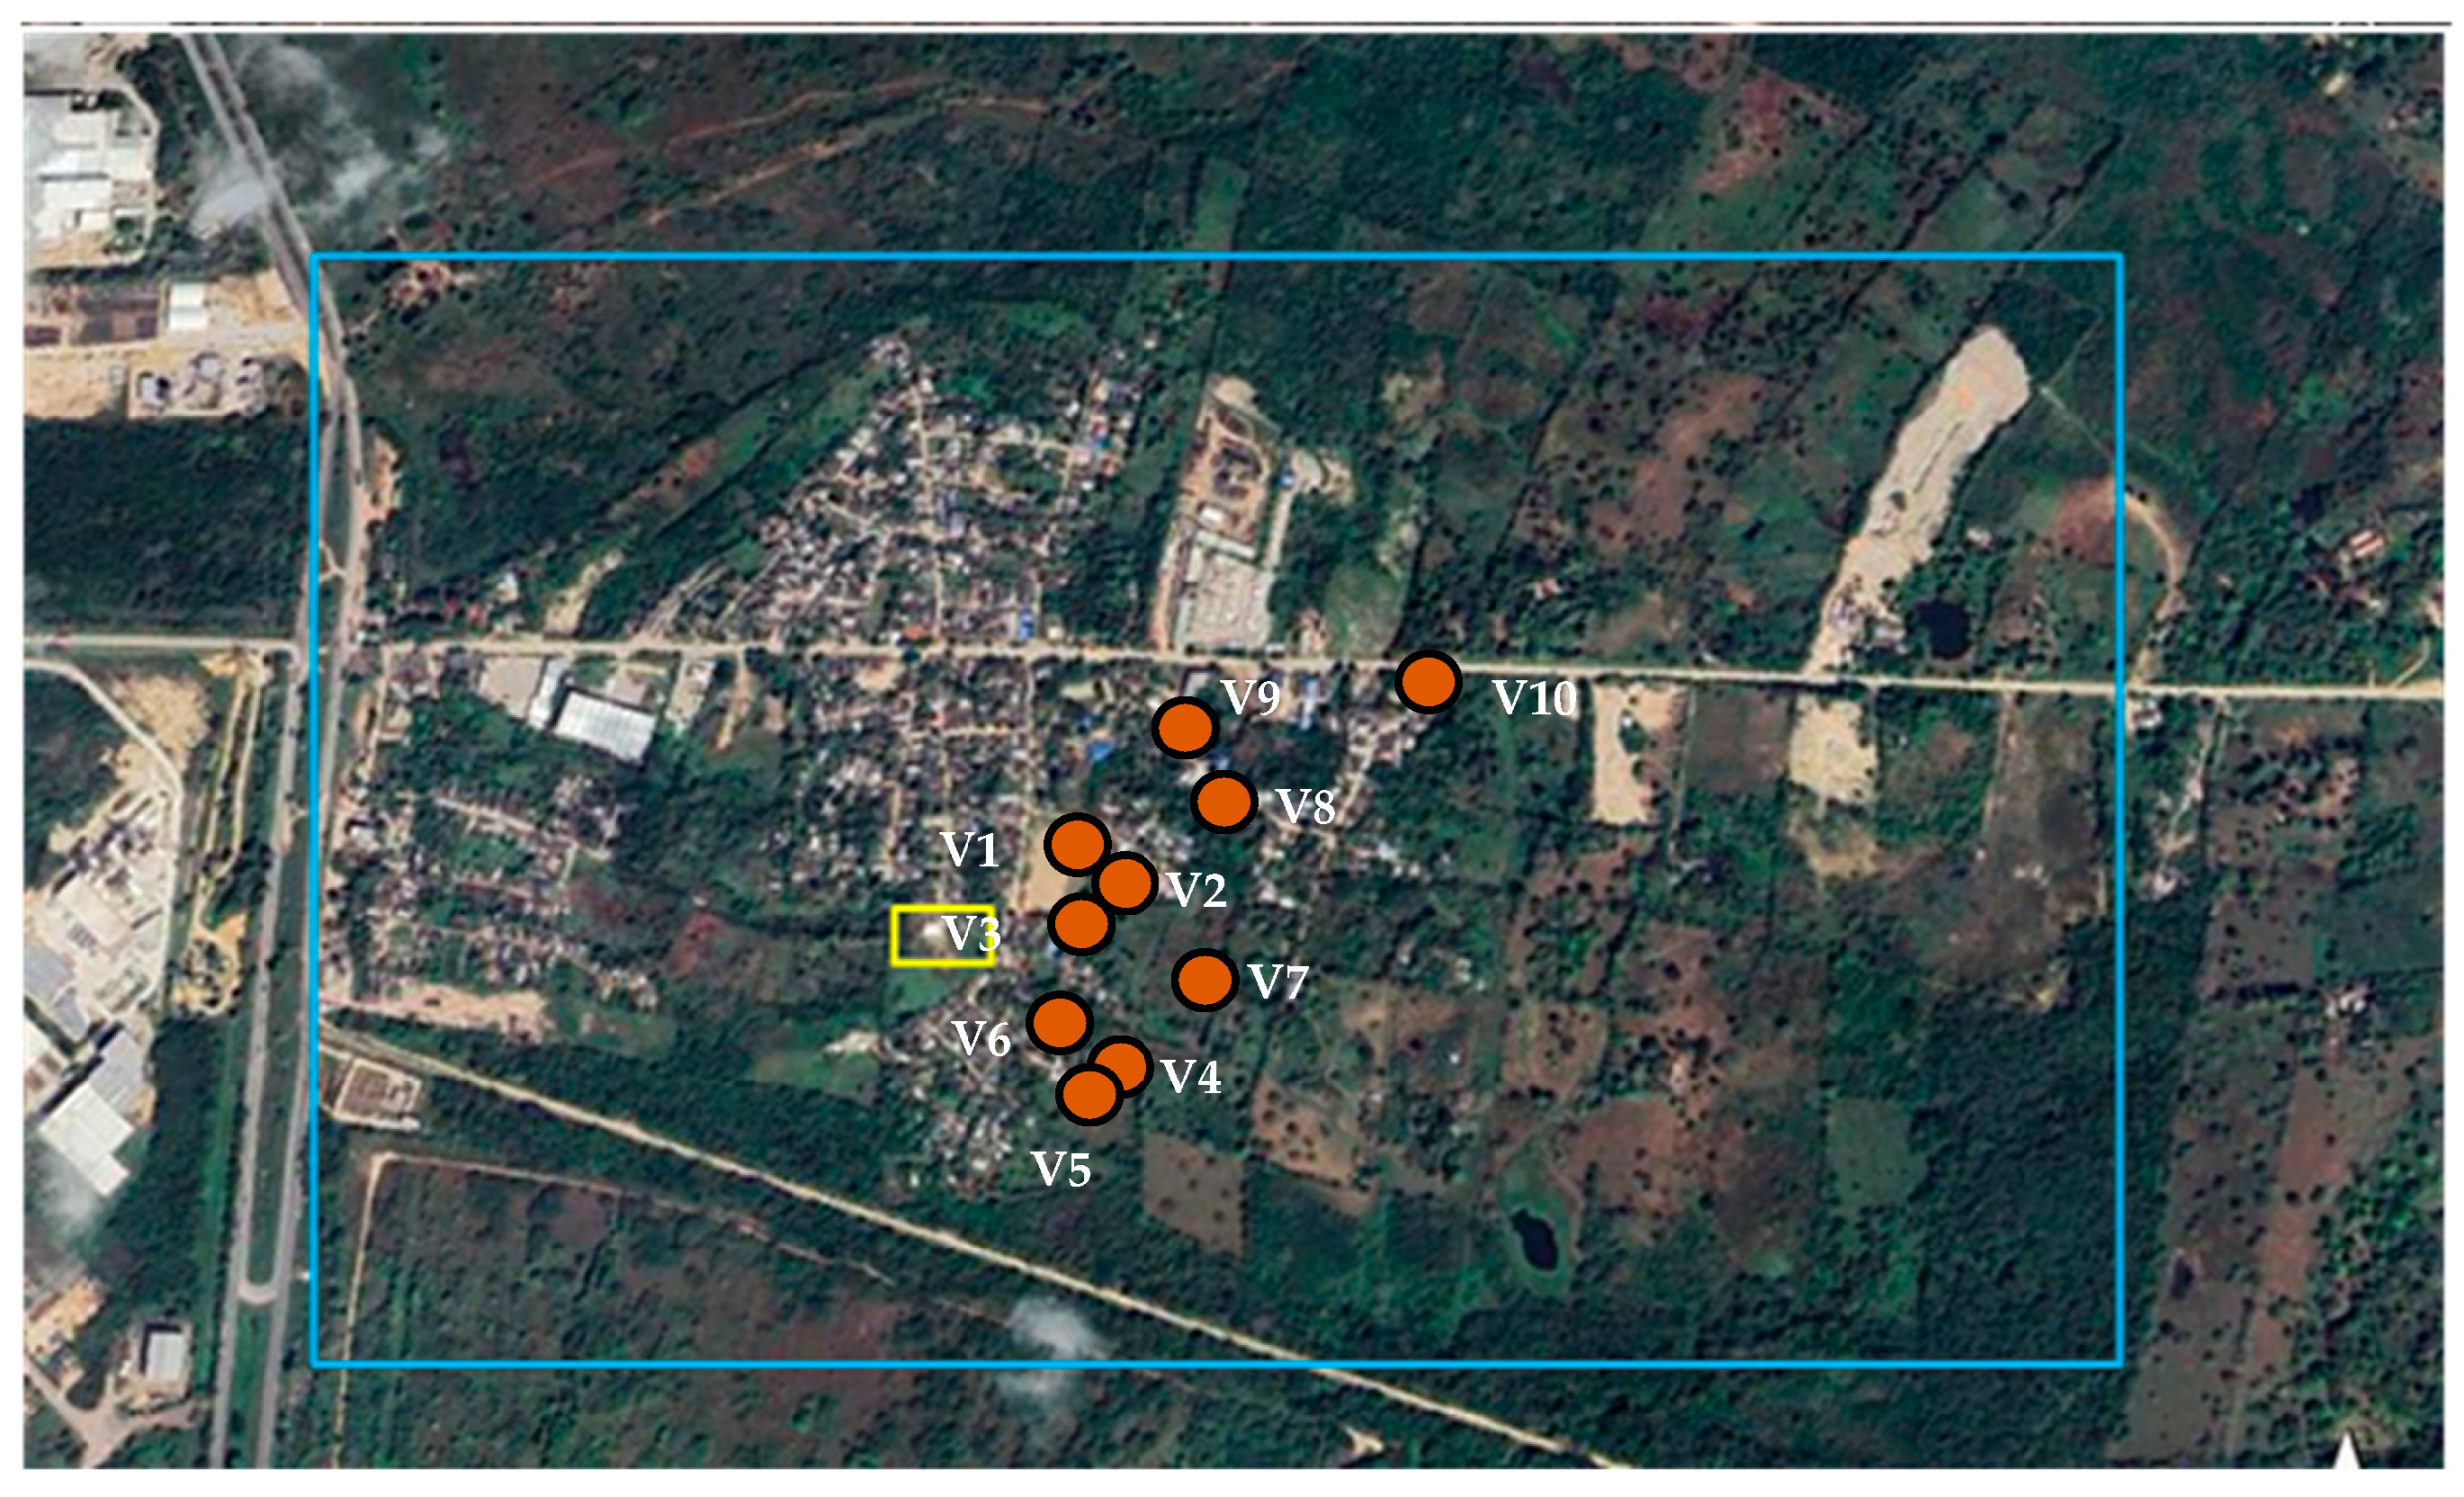
Between 2021 and 2023, residential expansion advanced into high-susceptibility zones [28], with satellite imagery documenting surface fissure networks and up to 0.25 m localized uplift near Vent 10 (Figure 9). Field verification identified ground fissures with widths > 10 mm extending 50–100 m radially from active vents. Household surveys reported structural damage in 30% of dwellings within 100 m of active vents. Vegetation loss totaled 35% relative to the 2013 baseline. Morphological features consistent with shallow rotational slides were identified in saturated clay slopes adjacent to Vent 8.

4.5.4. 2024: Consolidation of High-Risk Morphology

The 2013–2024 analysis quantified 233% increase in active vent count (n = 3→10), 35% vegetation loss, and progressive residential encroachment into high-susceptibility zones, establishing baselines for future InSAR deformation monitoring and early-warning system development.

4.6. Susceptibility to Mud Diapirism

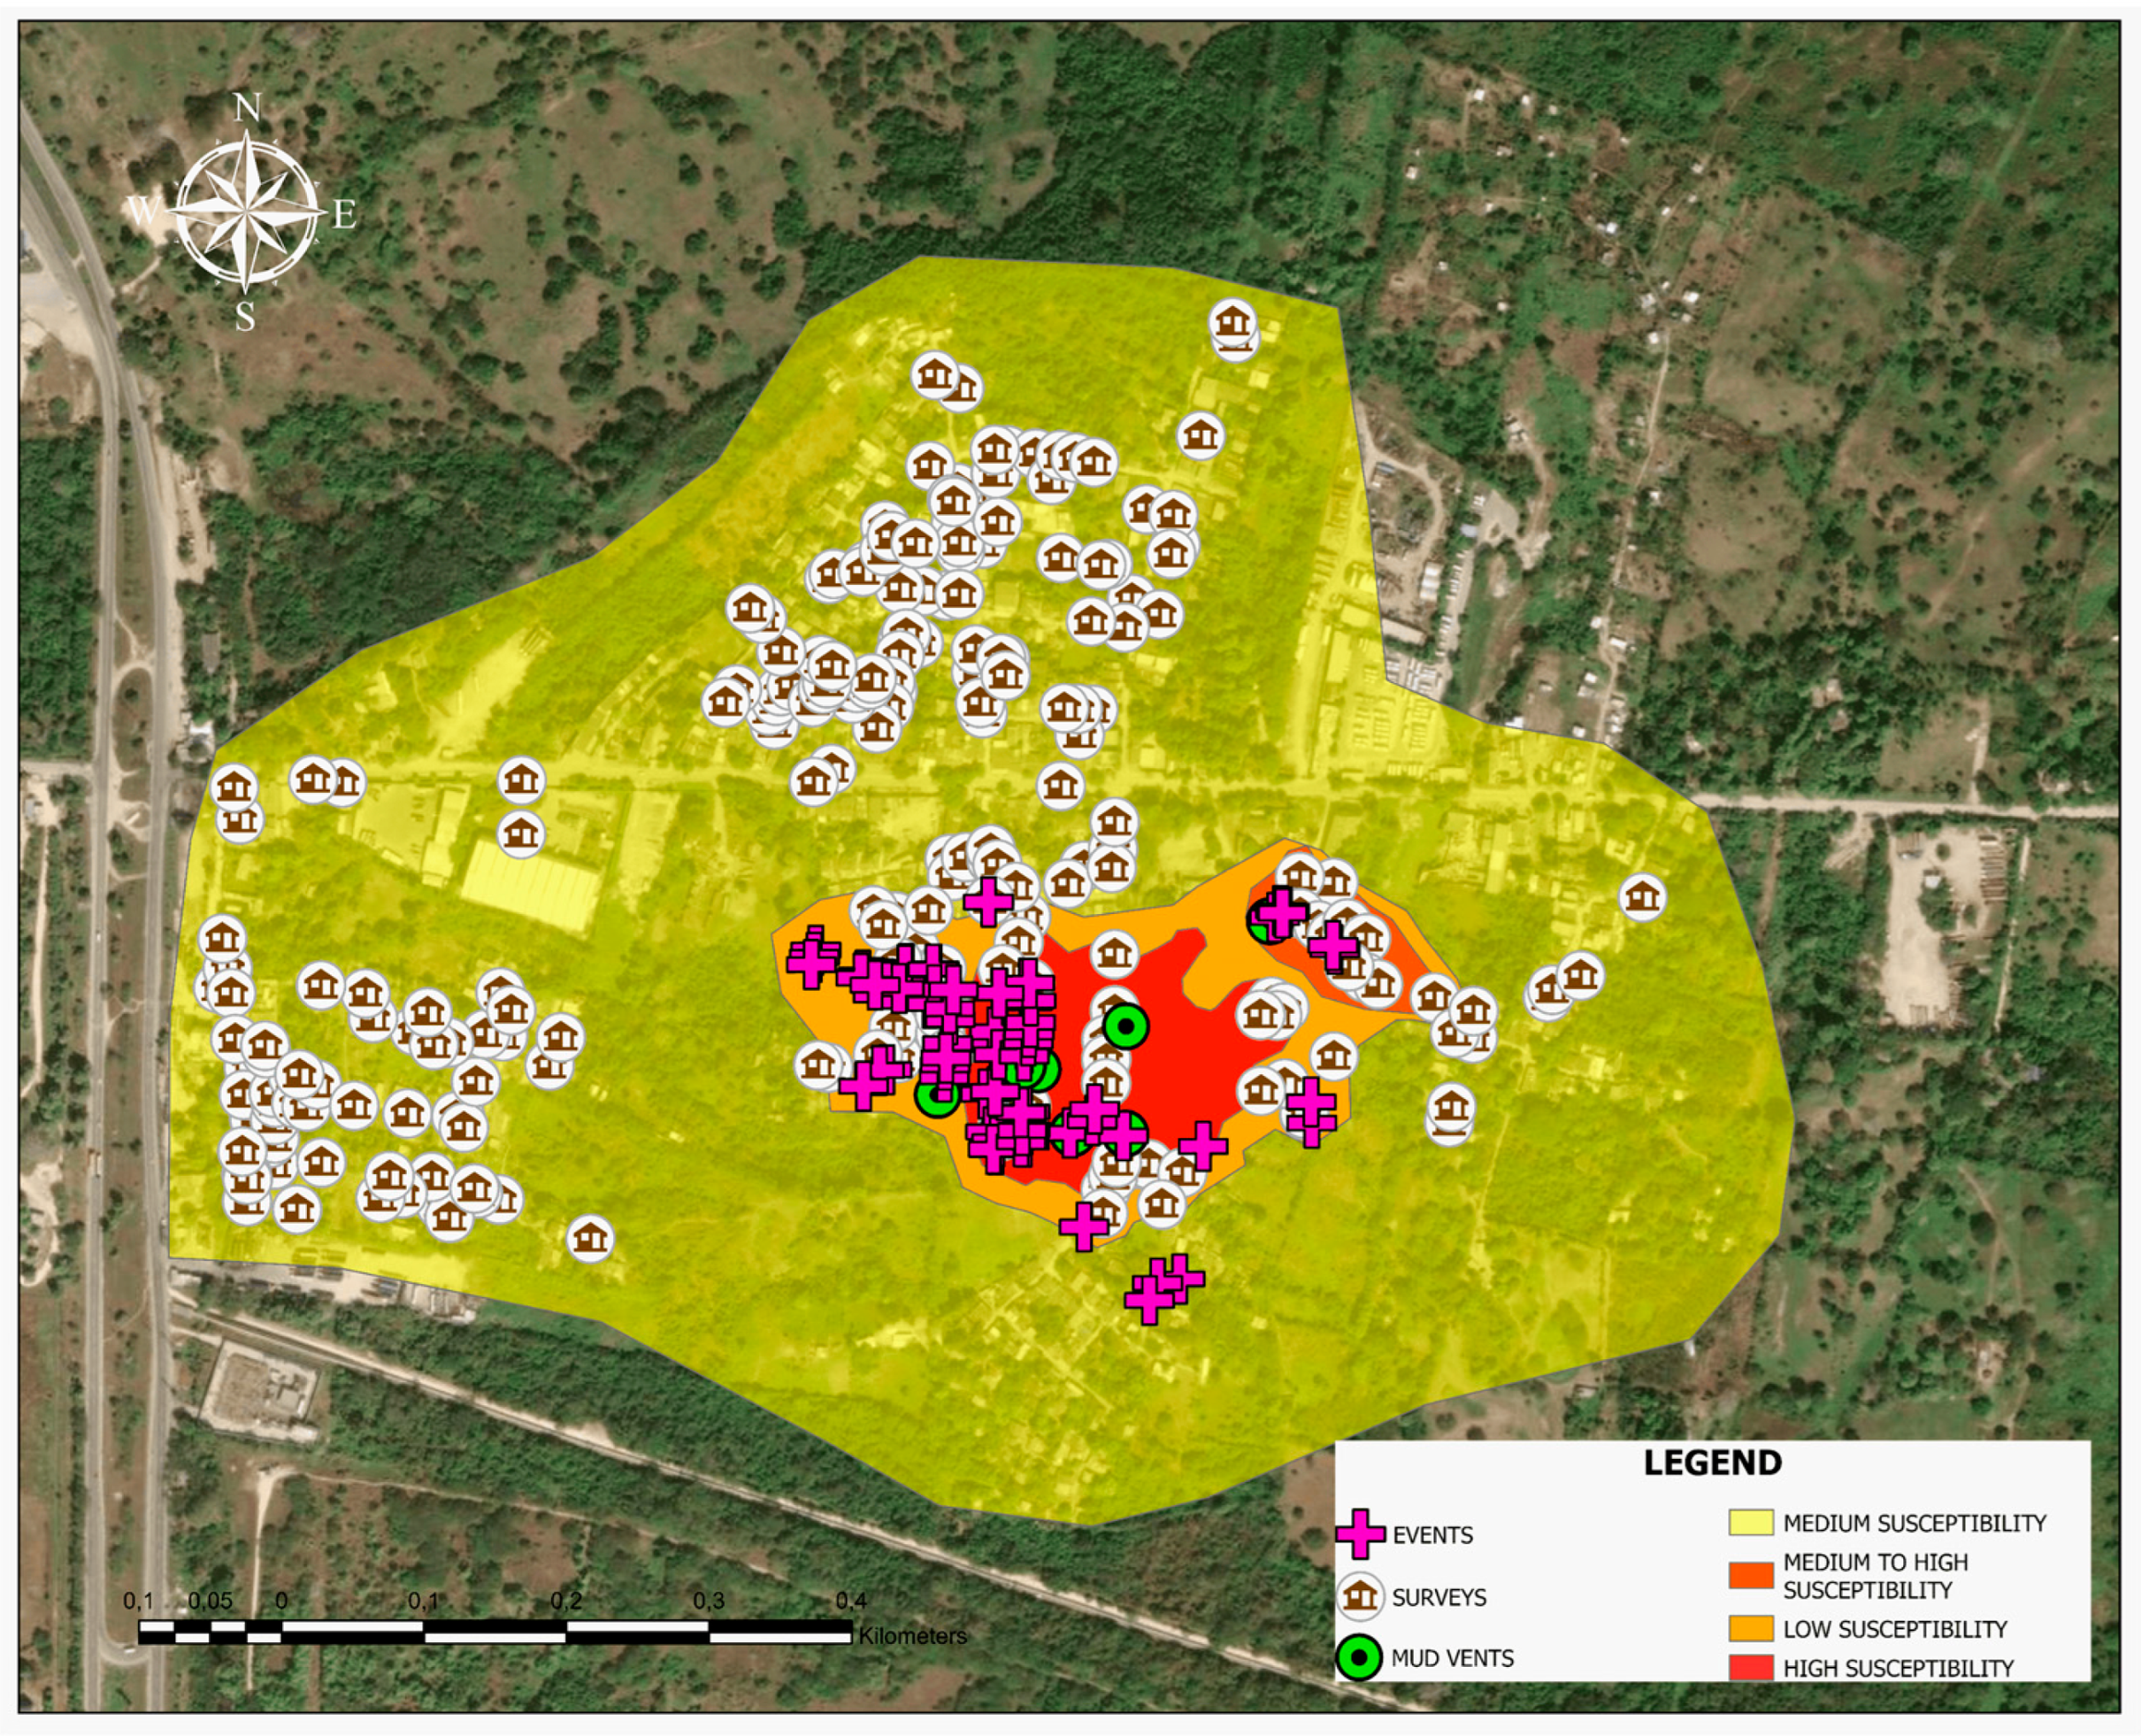
The susceptibility map integrates a weighted overlay of five thematic layers validated through field verification and COMBAS records, yielding three classification categories (Figure 10). High-susceptibility zones (red, 18% of study area) contain all ten active vents documented during 2023–2024 field campaigns, areas with recurrent mud extrusion documented in CARDIQUE records [29], and dwellings exhibiting severe structural damage with crack widths exceeding 1.5 mm (n = 65). One dwelling at 10°20′06″ N, 75°28′31″ W hosts an active vent in its backyard, representing direct residential-scale diapiric exposure.
Moderate-susceptibility zones (orange, 35% of area) overlie CH-classified high-plasticity clays identified in previous geotechnical characterizations [28], located 50–150 m from active vents. Field inspection in these zones recorded differential settlement and surface fissuring but no active mud discharge during the 2023–2024 campaign. Low-susceptibility zones (yellow, 47% of area) lack active vents, documented mud deposits, or geophysical anomalies. Structural damage in this category (13.4% of dwellings rated “poor” condition) reflects regional expansive clay shrink-swell behavior rather than localized diapiric activity (Figure 11).
Validation through spatial overlay with independent datasets yielded a Kappa coefficient of 0.82 and an overall classification accuracy of 87.3%. Among the 240 surveyed dwellings, 94.7% of structures with severe damage are located within high-susceptibility zones, confirming the predictive capacity of the weighted overlay model.

5. Conclusions

We performed an integrated assessment of Membrillal, which documented 233% growth in active vents (2013: n = 3; 2024: n = 10), concurrent with 35% vegetation loss and progressive residential encroachment into moderate-to-high susceptibility zones. Anthropogenic surface loading from informal settlement densification represents the primary pressurization driver, with 30% of dwellings within 100 m of vents exhibiting structural damage during 2023–2024 surveys.
Vent water chemistry (TDS = 13,220 mg/L; EC = 20.4 mS/cm; pH = 8.0) revealed hypersaline Na–Cl brines mobilized from Miocene–Pliocene formations. Charge-balance error of −94% reflects incomplete cationic characterization; sodium data cannot support quantitative geochemical modeling without expanded trace-element and alkalinity analysis. Gas compositional data are qualitative only and cannot be used for quantitative flux estimation due to brine sealing and atmospheric entrainment during sampling. Principal component analysis of 240 georeferenced surveys yielded dimension-specific reliability (α = 0.68–0.76) and strong spatial correlation (ρ = 0.61–0.87) between vent proximity and structural damage. Cracking affected 46.9% of dwellings, with 27.2% being severe (>1.5 mm width).
Weighted overlay GIS susceptibility modeling achieved validated performance (Kappa = 0.82; accuracy = 87.3%) and delineated three hazard categories: high-susceptibility zones (red, 18% of study area) contain all ten active vents and 94.7% of severely damaged dwellings; moderate-susceptibility zones (orange, 35%) overlie CH-classified clays 50–150 m from vents with differential settlement but no active discharge; low-susceptibility zones (yellow, 47%) lack diapiric evidence, with observed structural damage reflecting regional expansive clay behavior rather than localized diapiric activity.
The current absence of early-warning systems exacerbates vulnerability in Membrillal and analogous rural communities across the Colombian Caribbean. Study limitations include single-campaign hydrogeochemical sampling (August 2024), consumer-grade GPS errors (±5–10 m), satellite resolution constraints, and the absence of quantitative precipitation records, preventing statistical analysis of potential hydroclimatic contributions to reactivation timing.

Future Research Directions

Continuous monitoring should prioritize the following: (1) InSAR and GNSS networks to quantify pre-eruptive deformation thresholds with millimetric resolution; (2) multi-seasonal hydrogeochemical campaigns including complete cationic suites (NH4+, Al3+, Ti, Mn, and Zn2+), alkalinity, and multi-isotope analysis (δ18O, δD, δ13C-CH4, and 87Sr/86Sr) to constrain fluid source depths and residence times; (3) automated gas-flux measurement via downhole packer-isolated sampling with dual-detection GC-MS (TCD + FID) and dissolved-phase quantification; (4) continuous pore-pressure monitoring (5–10 m depth) coupled with surface-load quantification via LiDAR differencing to establish deformation–reactivation thresholds for early-warning protocols; and (5) comparative studies across Colombian Caribbean mud volcano systems to validate susceptibility modeling frameworks and enable Bayesian probabilistic eruption forecasting [18,19] for evidence-based land-use planning and risk communication.

Author Contributions

Conceptualization, G.E.F.d.D., J.A.B., and G.A.-M.; methodology, G.E.F.d.D., Y.E.N.d.l.R., and E.Q.-B.; software, G.A.-M. and E.Q.-B.; validation, E.Q.-B. and J.A.B.; formal analysis, G.E.F.d.D. and G.A.-M.; investigation,; J.A.B. and E.Q.-B. data curation, G.E.F.d.D.; writing—original draft preparation, G.E.F.d.D. and G.A.-M.; writing—review and editing, G.A.-M. and E.Q.-B.; visualization, J.A.B. and E.Q.-B.; supervision, J.A.B. and E.Q.-B.; project administration, J.A.B.; funding acquisition, E.Q.-B. and J.A.B. All authors have read and agreed to the published version of the manuscript.

Funding

This research received no external funding.

Institutional Review Board Statement

Not applicable.

Informed Consent Statement

Not applicable.

Data Availability Statement

Data are contained within the article.

Acknowledgments

The authors thank the University of Cartagena (Cartagena, Colombia), the Fundación Universitaria Tecnológico Comfenalco, and the Fundación Universitaria Los Libertadores (Bogotá, Colombia).

Conflicts of Interest

The authors declare no conflicts of interest.

References

  1. Chen, S.-C.; Hsu, S.-K.; Wang, Y.; Chung, S.-H.; Chen, P.-C.; Tsai, C.-H.; Liu, C.-S.; Lin, H.-S.; Lee, Y.-W. Distribution and characters of the mud diapirs and mud volcanoes off southwest Taiwan. J. Asian Earth Sci. 2014, 92, 201–214. [Google Scholar] [CrossRef]
  2. Rossello, E.A.; Osorio, J.A.; López-Isaza, S. The argilokinetic diapirism of the Colombian Caribbean Margin: A review of its sedimentary conditioning factors applied to hydrocarbon exploration. Bol. Geol. 2022, 44, 15–48. [Google Scholar] [CrossRef]
  3. Baldovino, J.J.A.; Pitalua, D.L.B. Evaluación de la Amenaza Potencial del Volcanismo de Lodo, que Incide en la Parte Urbanística de las Zonas de ‘Turbaco’, ‘El Rodeo’, ‘Membrillal’ y ‘Bayunca’ del Departamento de Bolívar; Universidad de Cartagena: Cartagena, Colombia, 2020. [Google Scholar]
  4. Kopf, A.J. Significance of mud volcanism. Rev. Geophys. 2002, 40, 2-1–2-52. [Google Scholar] [CrossRef]
  5. Mazzini, A.; Etiope, G. Mud volcanism: An updated review. Earth-Sci. Rev. 2017, 168, 81–112. [Google Scholar] [CrossRef]
  6. Dimitrov, L.I. Mud volcanoes—The most important pathway for degassing deeply buried sediments. Earth-Sci. Rev. 2002, 59, 49–76. [Google Scholar] [CrossRef]
  7. Bonini, M. Mud volcanoes: Indicators of stress orientation and tectonic controls. Earth-Sci. Rev. 2012, 115, 121–152. [Google Scholar] [CrossRef]
  8. Milkov, A.V. Worldwide distribution of submarine mud volcanoes and associated gas hydrates. Mar. Geol. 2000, 167, 29–42. [Google Scholar] [CrossRef]
  9. Napoli, S.; Spatola, D.; Casalbore, D.; Lombardo, L.; Tanyas, H.; Chiocci, F.L. Comprehensive global inventory of submarine mud volcanoes. Sci. Data 2025, 12, 382. [Google Scholar] [CrossRef]
  10. Franek, P.; Mienert, J.; Buenz, S.; Géli, L. Character of seismic motion at a location of a gas hydrate-bearing mud volcano on the SW Barents Sea margin. J. Geophys. Res. Solid Earth 2014, 119, 6159–6177. [Google Scholar] [CrossRef]
  11. Mazzini, A.; Akhmanov, G.; Manga, M.; Sciarra, A.; Huseynova, A.; Huseynov, A.; Guliyev, I. Explosive mud volcano eruptions and rafting of mud breccia blocks. Earth Planet. Sci. Lett. 2021, 555, 116699. [Google Scholar] [CrossRef]
  12. Fontana, M.; Bernardi, M.S.; Cigna, F.; Tapete, D.; Menafoglio, A.; Vantini, S. Identification of Precursors in InSAR Time Series Using Functional Data Analysis Post-Processing: Demonstration on Mud Volcano Eruptions. Remote Sens. 2024, 16, 1191. [Google Scholar] [CrossRef]
  13. Ahadov, B.; Fielding, E.; Kadirov, F. Far-Field Earthquake-Induced Crustal Deformation and Mud Volcano Activity in Azerbaijan Based on the InSAR Technique. Remote Sens. 2025, 17, 1421. [Google Scholar] [CrossRef]
  14. Iio, K.; Furuya, M. Surface deformation and source modeling of Ayaz-Akhtarma mud volcano, Azerbaijan, as detected by ALOS/ALOS-2 InSAR. Prog. Earth Planet. Sci. 2018, 5, 61. [Google Scholar] [CrossRef]
  15. Gattuso, A.; Italiano, F.; Capasso, G.; D’Alessandro, A.; Grassa, F.; Pisciotta, A.F.; Romano, D. The mud volcanoes at Santa Barbara and Aragona (Sicily, Italy): A contribution to risk assessment. Nat. Hazards Earth Syst. Sci. 2021, 21, 3407–3419. [Google Scholar] [CrossRef]
  16. Amici, S.; Turci, M.; Giulietti, F.; Giammanco, S.; Buongiorno, M.F.; La Spina, A.; Spampinato, L. Volcanic Environments Monitoring by Drones Mud Volcano Case Study. Int. Arch. Photogramm. Remote Sens. Spat. Inf. Sci. 2013, 40, 5–10. [Google Scholar] [CrossRef]
  17. Mihai, A.; Gerea, A.; Tataru, D.; Nastase, E.; Grecu, B. A Geophysical Investigation of the Pâclele Mici Mud Volcano in Romania Using Deep Geoelectrical Surveys. Appl. Sci. 2024, 14, 2463. [Google Scholar] [CrossRef]
  18. Tonini, R.; Sandri, L.; Thompson, M.A. PyBetVH: A Python tool for probabilistic volcanic hazard assessment and for generation of Bayesian hazard curves and maps. Comput. Geosci. 2015, 79, 38–46. [Google Scholar] [CrossRef]
  19. Marzocchi, W.; Sandri, L.; Selva, J. BET_VH: A probabilistic tool for long-term volcanic hazard assessment. Bull. Volcanol. 2010, 72, 705–716. [Google Scholar] [CrossRef]
  20. Dewi, C.; Astika, I.W.; Pramono, G.H. Assessment of Mud Volcano Vulnerable Area in Sidoarjo Regency, East Java Province, Indonesia. J. Appl. Sci. Res. 2011, 7, 722–731. [Google Scholar]
  21. Garthwaite, M.C.; Miller, V.L.; Saunders, S.; Parks, M.M.; Hu, G.; Parker, A.L. A Simplified Approach to Operational InSAR Monitoring of Volcano Deformation in Low- and Middle-Income Countries: Case Study of Rabaul Caldera, Papua New Guinea. Front. Earth Sci. 2019, 6, 240. [Google Scholar] [CrossRef]
  22. Takarada, S. The Volcanic Hazards Assessment Support System for the Online Hazard Assessment and Risk Mitigation of Quaternary Volcanoes in the World. Front. Earth Sci. 2017, 5, 102. [Google Scholar] [CrossRef]
  23. Ramos, E.L.; Penagos, F.G.; Martínez, D.A.R.; Gómez, N.R.M. Detachment levels of Colombian caribbean mud volcanoes. CTF—Cienc. Tecnol. Y Futuro 2022, 12, 49–77. [Google Scholar] [CrossRef]
  24. Paniagua-Arroyave, J.F.; Spada, G.; Melini, D.; Duque-Trujillo, J.F. Holocene relative sea-level changes along the Caribbean and Pacific coasts of northwestern South America. Quat. Res. 2024, 119, 28–43. [Google Scholar] [CrossRef]
  25. Di Luccio, D.; Guerra, I.M.B.; Valero, L.E.C.; Giraldo, D.F.M.; Maggi, S.; Palmisano, M. Physical and geochemical characteristics of land mud volcanoes along Colombia’s Caribbean coast and their societal impacts. Sci. Total Environ. 2021, 759, 144225. [Google Scholar] [CrossRef]
  26. Palmisano, M.; Balassone, G.; Maggi, S.; Arenas, A.A.; Guerra, I.M.B.; Valero, L.E.C.; Ippolito, F.; Mondillo, N.; Giraldo, D.F.M.; Mormone, A.; et al. Geochemistry and mineralogy of muds and thermal waters from mud volcanoes in the NW Caribbean Coast of Colombia and their potential for pelotherapy. Catena 2023, 235, 107621. [Google Scholar] [CrossRef]
  27. Trejos-Tamayo, R.; Vallejo, F.; Arias, V.; García, C.; Pardo-Trujillo, A.; Bedoya, E.; Flores, J.-A. Biostratigraphy of ejected material from mud volcanoes in the Caribbean region of Colombia: Contribution to the stratigraphy of Sinú Basin. J. S. Am. Earth Sci. 2020, 103, 102782. [Google Scholar] [CrossRef]
  28. Blaskovic, T. Major Eruption of Cacahual (El Aburrido) mud Volcano in Antioquia, Colombia Injures Eight, Damage Homes; The Watchers: Antioquia, Colombia, 2024. [Google Scholar]
  29. Bautista Manga, L.A.; Rada López, D.; Miranda, B. Evaluación de la Amenaza Geológica Potencial del Volcanismo de Lodo en la Vereda de Membrillal Distrito Turístico y Cultural de Cartagena de Indias. Doctoral Dissertation, Universidad de Cartagena, Cartagena, Colombia, 2015. [Google Scholar]
  30. Barboza-Miranda, G.; Macías, A.C.L.; Valdez-Vargas, J.; Pérez-Barón, M.; Rosa, Y.E.N.d.l.; de Diego, G.E.F.; Carrascal, J.J.; Baldovino, J.A. Geophysical-Geotechnical Characterization of Mud Volcanoes in Cartagena Colombia. Geosciences 2025, 15, 111. [Google Scholar] [CrossRef]
  31. CARDIQUE. Evaluación de la Amenaza Geológica Producida por el Fenómeno Diapirismo de Lodo en la Vereda Membrillal—Distrito de Cartagena de Indias y Corregimiento de Flamenco, Municipio de Marialabaja—Jurisdicción de Cardique; Universidad de Cartagena: Cartagena, Colombia, 2013. [Google Scholar]
  32. Wong. Cantadoras de Membrillal: Artesanía Musical de la Comunidad al Mundo. UdeC Radio. Available online: https://www.udecradio.co/2023/08/cantadoras-de-membrillal-artesania.html (accessed on 6 October 2025).
  33. Cartagena, C. Comedor Infantil de Membrillal en Cartagena Atenderá a 100 Niños. CARACOL RADIO. Available online: https://caracol.com.co/2024/04/06/comedor-infantil-de-membrillal-en-cartagena-atendera-a-100-ninos/?fbclid=PAAaYCW2laJNgZITtZI9cQax5m5GTb213cUbN2-bnz0DWGMh7kBYnLW020yW8_aem_AURqWPHAS8mG1DCjQKCDWbhB5aRvVjPc-BO1dipufB25oLqHA_zdUgH_b9BPV_4VlBI (accessed on 6 October 2025).
  34. Congreso de Colombia. Ley 1523 de 2012 por la cual se Adopta la Política Nacional de Gestión del Riesgo de Desastres y se Establece el Sistema Nacional de Gestión del Riesgo de Desastres y se Dictan Otras Disposiciones; Congreso de Colombia.: Bogotá, Colombia, 2012. [Google Scholar]
  35. Cronbach, L.J. Coefficient Alpha and the Internal Structure of Tests. Psychometrika 1951, 16, 297–334. [Google Scholar] [CrossRef]
  36. Cutter, S.L.; Boruff, B.J.; Shirley, W.L. Social Vulnerability to Environmental Hazards. Soc. Sci. Q 2003, 84, 242–261. [Google Scholar] [CrossRef]
  37. DANE. Censo Poblacional de Cartagena de Indias; Departamento Administrativo Nacional de Estadística: Cartagena, Colombia, 2018. [Google Scholar]
  38. ISO/IEC 17025:2017; General Requirements for the Competence of Testing and Calibration Laboratories. ISO: Geneva, Switzerland, 2017.
  39. Standard Methods Committee of the American Public Health Association; American Water Works Association; Water Environment Federation. 3030 Preliminary Treatment of Samples. In Standard Methods for the Examination of Water and Wastewater; American Public Health Association: Washington, DC, USA, 2017. [Google Scholar]
  40. U.S. Environmental Protection Agency. Method 200.8: Determination of Trace Elements in Waters and Wastes by Inductively Coupled Plasma—Mass Spectrometry; U.S. Environmental Protection Agency, Office of Research and Development: Cincinnati, OH, USA, 1994. Available online: https://www.epa.gov/sites/default/files/2015-08/documents/method_200-8_rev_5-4_1994.pdf (accessed on 16 November 2025).
  41. U.S. Environmental Protection Agency. Method 300.0: Determination of Inorganic Anions by Ion Chromatography; U.S. Environmental Protection Agency, Office of Research and Development: Cincinnati, OH, USA, 1993. Available online: https://www.epa.gov/sites/default/files/2015-08/documents/method_300-0_rev_2-1_1993.pdf (accessed on 16 November 2025).
  42. American Public Health Association; American Water Works Association; Water Environment Federation. Method 2540 B: Solids—Total Solids Dried at 103–105 °C. In Standard Methods for the Examination of Water and Wastewater, 23rd ed.; American Public Health Association: Washington, DC, USA, 2017. [Google Scholar]
  43. American Public Health Association; American Water Works Association; Water Environment Federation. Method 2540 E: Solids—Fixed and Volatile Solids Ignited at 550 °C. In Standard Methods for the Examination of Water and Wastewater, 23rd ed.; American Public Health Association: Washington, DC, USA, 2017. [Google Scholar]
  44. American Public Health Association; American Water Works Association; Water Environment Federation. Method 2540 D: Solids—Total Suspended Solids Dried at 103–105 °C. In Standard Methods for the Examination of Water and Wastewater, 23rd ed.; American Public Health Association: Washington, DC, USA, 2017. [Google Scholar]
  45. American Public Health Association; American Water Works Association; Water Environment Federation. Method 2510 B: Conductivity—Laboratory Method. In Standard Methods for the Examination of Water and Wastewater, 23rd ed.; American Public Health Association: Washington, DC, USA, 2017. [Google Scholar]
  46. American Public Health Association; American Water Works Association; Water Environment Federation. Method 4500-H+ B: pH Value—Electrometric Method. In Standard Methods for the Examination of Water and Wastewater, 23rd ed.; American Public Health Association: Washington, DC, USA, 2017. [Google Scholar]
  47. American Public Health Association; American Water Works Association; Water Environment Federation. Method 2550 B: Temperature—Laboratory and Field Methods. In Standard Methods for the Examination of Water and Wastewater, 23rd ed.; American Public Health Association: Washington, DC, USA, 2017. [Google Scholar]
  48. OARGD. Informe Gestión del Riesgo de Desastres de Cartagena de Indias—807—22; Oficina Asesora para la Gestión del Riesgo de Desastres: Cartagena, Colombia, 2022. [Google Scholar]
  49. OAGRD. Informe Gestión del Riesgo de Desastres de Cartagena de Indias—739—2022; Oficina Asesora para la Gestión del Riesgo de Desastres: Cartagena, Colombia, 2022. [Google Scholar]
  50. OAGRD. Informe Gestión del Riesgo de Desastres de Cartagena de Indias—523—22; Oficina Asesora para la Gestión del Riesgo de Desastres: Cartagena, Colombia, 2022. [Google Scholar]
  51. OAGRD. Informe Gestión del Riesgo de Desastres de Cartagena de Indias—306—21; Oficina Asesora para la Gestión del Riesgo de Desastres: Cartagena, Colombia, 2021; pp. 1–18. [Google Scholar]
  52. OAGRD. Informe Gestión del Riesgo de Desastres de Cartagena de Indias—174ª—22; Oficina Asesora para la Gestión del Riesgo de Desastres: Cartagena, Colombia, 2022. [Google Scholar]
  53. OAGRD. Informe de Gestión del Riesgo de Desastres de Cartagena de Indias—880—22; Oficina Asesora para la Gestión del Riesgo de Desastres: Cartagena, Colombia, 2022. [Google Scholar]
  54. OAGRD. Informe de Gestión del Riesgo de Desastres de Cartagena de Indias—781—22; Oficina Asesora para la Gestión del Riesgo de Desastres: Cartagena, Colombia, 2022. [Google Scholar]
  55. Escobar, J.D.U.; Gomez, H.Z.; Cordoba, J.H.T.; Rico, C.E.S. Informe de Coyuntura Económica Regional Departamento de Bolívar 2010 Convenio Interadministrativo No. 111 de abril de 2000 Comité Directivo Nacional ICER Comité Directivo Territorial ICER Entidades Participantes; DANE: Quezon, Philippines, 2011. [Google Scholar]
Figure 1. Mud diapirism activity due to overpressure and mud vents located at an uninhabited household. (a) Dwelling abandoned due to risk of collapse from continued diapiric overpressure and ground deformation; structural damage includes severe wall cracking (>1.5 mm width) and foundation settlement. (b) Improvised foundation reinforcement/modification implemented by residents to mitigate overpressure effects and water infiltration/seepage in the dwelling/structure; note concrete and masonry modifications around base. (c) A mud vent that expels water and mud material.
Applsci 16 02194 g001
Figure 2. Location of the rural community of Membrillal in Cartagena de Indias, Colombia.
Applsci 16 02194 g002
Figure 3. Methodological workflow for integrated mud diapirism susceptibility assessment in Membrillal, Cartagena de Indias.
Applsci 16 02194 g003
Figure 4. Allocation of sampling points in Membrillal using random points tool from ArcGIS Pro.
Applsci 16 02194 g004
Figure 5. Field procedure for gas sampling. (a) Equipment setup for installation of the extraction system; (b) Placement of the inverted chamber for gas collection; (c) Calibration of the vacuum pump; (d) Automated gas extraction process.
Applsci 16 02194 g005
Figure 6. Satellite images from Membrillal study area from 2013, 2016, 2020, 2021, 2022, and 2023.
Applsci 16 02194 g006
Figure 7. Multi-temporal comparison of Membrillal territorial configuration (2013–2016). (a) The 2013 baseline shows a predominantly rural landscape with dense vegetation cover. (b) The 2016 one shows urban expansion concentrated around the central diapiric dome periphery. The colored rectangles indicate the following: red = active vent locations (V1–V3), yellow = new residential development zones, and blue = vegetation loss areas. Scale bar = 500 m.
Applsci 16 02194 g007
Figure 8. Urban expansion and morphological changes in Membrillal, 2020. The image highlights the emergence of new residential clusters in high-susceptibility zones and visible alterations in terrain morphology, indicating increased diapiric activity and anthropogenic stress. Colored rectangles indicate the following: red = morphological settings due to mud diapirism expressions, yellow = zones rendered unusable for new or future residential zones.
Applsci 16 02194 g008
Figure 9. Urban intensification and new diapiric manifestations in Membrillal, 2021. The image shows rapid land transformation, the emergence of informal settlements in medium-susceptibility zones, newly active mud vents, and a notable increase in vegetation cover. Yellow-colored rectangles indicate urban intensification zones. The areas delimited by the two rightmost rectangles correspond to zones of high concentration of diapiric manifestations.
Applsci 16 02194 g009
Figure 10. Peak urban expansion and diapiric activity in Membrillal, 2022. The image displays intensified land occupation in high-susceptibility zones, emergence of new active mud vents (Vents 4–10), and visible fissure networks with localized uplift near Vent 10, alongside critical vegetation loss and signs of minor rotational landslides.
Applsci 16 02194 g010
Figure 11. Susceptibility map from mud diapirism in Cartagena de Indias.
Applsci 16 02194 g011
Table 1. Variables selected for each dimension and measurement scale.
DimensionVariable CodeIndicator Description 1Measurement ScaleCoding Scheme
StructuralV1_ESTPresence of structural cracks in walls, floors, or ceilingsBinary nominal0 = No visible cracks; 1 = Cracks present
V2_ESTPredominant orientation of visible cracksOrdinal category0 = No cracks; 1 = Horizontal; 2 = Vertical; 3 = Diagonal
V3_ESTMaximum crack widthOrdinal category0 = No cracks; 1 = 0.4–0.8 mm; 2 = 0.9–1.5 mm; 3 = >1.5 mm
V4_ESTResident-reported overall condition of the dwellingOrdinal category1 = Good; 2 = Fair; 3 = Poor
SocioeconomicV1_SOCPermanent household occupancy countContinuous (discrete-scale)1–11 persons (count)
V2_SOCPresence of vulnerable household membersOrdinal category0 = None; 1 = Children (<12); 2 = Elderly (>65); 3 = Both
V3_SOCLength of household residenceOrdinal category1 = <1 yr; 2 = 1–5; 3 = 6–10; 4 = 11–20; 5 = 21–30; 6 = 31–40; 7 = >40
V4_SOCHousing tenure statusOrdinal category1 = Rented; 2 = Borrowed/family-owned; 3 = Owned with title
GeotechnicalV1_GEOHousehold-reported diapiric events (uplift, extrusion, and subsidence)Binary nominal0 = No events; 1 = Events reported
V2_GEOTemporal frequency of reported eventsOrdinal categorical0 = Never; 1 = >5 yrs ago; 2 = Within 5 yrs; 3 = Multiple within 5 yrs
V3_GEOEvidence of rising damp in walls/floorsBinary nominal0 = No; 1 = Yes
V4_GEOVisible ground surface deformation (cracks, tilting, and settlement)Binary nominal0 = No; 1 = Yes
1 The same variables used in the CARDIQUE survey.
Table 2. Methodology for water sampling and preservation.
DeterminationContainer 1Min. Vol. (mL)Sample Type 2Preservation 3Recommended Holding TimeRegulation
ChlorideP50SNo preservation required28 d28 d
ConductivityP500SRefrigerate < 6 °C28 d28 d
FluorideP100SNo preservation required28 d28 d
MetalsP1000SAdd HNO3 to pH < 2.06 months6 months
pHP50SAnalyze immediately0.25 h0.25 h
SolidsP200SRefrigerate < 6 °C7 d2–7 d
TemperatureP50SAnalyze immediately0.25 h0.25 h
1 P = Plastic (polyethylene or equivalent); V = glass; V(A) or P(A) = acid-rinsed with HNO3 1 + 1; V(S) = solvent-rinsed glass or furnace-dried. 2 S = Single sample; C = Composite sample. 3 Refrigerate = store at <6 °C in the absence of light. Sample preservation must occur at the time of collection. For composite samples, each aliquot must be preserved immediately after retrieval.
Table 3. Laboratory procedures applied to water samples for hydrochemical analysis.
Parameter/ComponentAnalytical MethodReference StandardInstrument/ConditionsLimit of Quantification (LOQ)QA/QC Performance 1
Total Metals (Ca, Fe, Mg, K, and Na)ICP–MSAPHA 3030 K [39]; EPA 200.8 Rev.5 [40]Acid digestion with ultrapure HNO3 and multi-element calibration (R2 ≥ 0.999)0.09–0.15 mg·L−1Recoveries 97–102% and deviation < 5%
Major Anions (Cl, F, and SO42−)Ion Chromatography (IC)EPA 300.0 Rev.2.1 [41]Total of 0.45 µm filtration and suppressed conductivity detectionF: 0.05 mg·L−1; Cl, SO42−: 0.20 mg·L−1Calibration R2 ≥ 0.999, and duplicates and blanks verified
Total Solids (TSs)GravimetricAPHA 2540 B [42]Evaporation at 103–105 °C to constant weightRecovery 99% and precision confirmed
Volatile Solids (VTSs)Gravimetric (loss on ignition)APHA 2540 B/E [42,43]Ignition at 550 °C for 1 hExpressed as mg VTS L−1 and reproducibility verified
Total Suspended Solids (TSSs)GravimetricAPHA 2540 D [44]Filtration through pre-weighed glass fiber filters and drying at 103–105 °CPrecision confirmed via duplicates
Physical Parameters (T°, pH, and EC)In situ electrometric measurementAPHA 2550 B, 4500-H+ B, 2510 B [45,46,47]Temperature, pH, and conductivity, standardized to 25 °C±0.01 precision and field–lab consistency verified
1 According to laboratory equipment performance.
Table 4. Stratified sample composition for the household survey in Membrillal.
Parameter *Value
Confidence Level90%
α10%
α/20.5
Z1.64
Z 2 2.71
p(1 − p)0.21
e 2 0.01
* Parameters: confidence level 90% (Z = 1.64), variance estaimate p(1−p) 0.21, and margin of error 1%.
Table 5. Stratified sample distribution and adjustment by exposure zone in the Membrillal study area.
Point (Code)ZoneNumber of Households% of Total PopulationTheoretical Sample SizeAdjusted Sample (Effective n)Stratification Adjustment * (Final n)
P1Affected Zone55749%16190118
P2Non-Affected Zone40635%1456584
P3Independent Zone18316%1012938
Total1146100%407184240
* The “Adjusted Sample (Effective n)” corresponds to valid surveys collected after field verification (n = 184), while the “Stratification Adjustment (Final n)” represents the proportionally scaled sample (n = 240) after 30% oversampling, validated with COMBAS leaders using ArcGIS Pro random-point generation.
Table 6. Descriptive statistics of survey variables by analytical dimension (n = 240 households).
Dimension/VariableCategoryn* %Cumulative %Key Statistics/Notes
STRUCTURAL
V1: Crack presenceNo12753.153.1Mode = No; risk ratio 0.88:1 (approx. parity)
Yes11246.9100.0
V2: Crack orientation
(n = 112 cracked dwellings)
Horizontal2610.923.2Median = Vertical; Mode = Diagonal (indicative of differential settlement)
Vertical3815.957.1Mean = 2.20 ± 0.79
Diagonal4820.1100.0
V3: Crack severity
(n = 112 cracked dwellings)
0.4–0.8 mm (hairline)197.917.0Median and Mode = >1.5 mm (severe); Mean = 2.41 ± 0.82
0.9–1.5 mm (moderate)2811.742.0
>1.5 mm (severe)6527.2100.0
V4: Overall dwelling conditionGood9539.739.7Median = Fair; 60.3% require intervention (Fair + Poor)
Fair11246.986.6
Poor3213.4100.0
SOCIOECONOMIC
V1: Household size (persons)Mean = 4.23 ± 2.08; Range = 1–11; CV = 49.2% (moderate dispersion)
V2: Vulnerable population membersNone6728.028.0Median = Children only; 72.0% with ≥1 vulnerable member
Children only9138.166.1Mode = Children only
Elderly only93.869.9
Children + elderly7230.1100.0Mean = 1.36 ± 1.15
V3: Years of residence<1 year125.05.0Median = 11–20 years; 69% >10 years (high rootedness)
1–5 years3815.920.9
6–10 years4719.740.6
11–20 years6828.569.0
21–30 years4117.286.231% >20 years (very high attachment)
31–40 years229.295.4
>40 years114.6100.0
V4: Housing tenureRented4016.716.7Median and mode = Owned; owner/non-owner ratio 4.43:1
Borrowed/family41.718.4
-owned with title19581.6100.0Mean = 2.65 ± 0.73
GEOTECHNICAL
V1: Diapiric events reportedNo15062.862.8Mode = No; affected/unaffected ratio 1:1.69
Yes8937.2100.0
V2: Event temporal frequency (n = 89 affected)Single event > 5 yrs2711.330.3Median and mode = single event ≤5 yrs; 27% recurrent activity
Single event ≤ 5 yrs3815.973.0Mean = 1.97 ± 0.79
Multiple events ≤ 5 yrs2410.0100.0
V3: Rising damp evidenceNo16167.467.4Mode = No; ratio of damp/dry = 1:2.06
Yes7832.6100.0
V4: Ground surface deformationNo18376.676.6Mode = No; ratio of deform/stable = 1:3.27
Yes5623.4100.0
* Percentages for subsamples (e.g., cracked dwellings n = 112 and affected households n = 89) were calculated separately. All variables assessed June–August 2024. Missing data: 0 cases (0%).
Table 7. Internal consistency and reliability of survey dimensions based on Cronbach’s alpha (α).
Dimensionn ItemsCronbach’s α95% CIα (Standardized)Mean Inter-Item CorrelationItem–Total Correlations α If Item Deleted
Structural40.685[0.622, 0.744]0.6920.41V1: 0.58
V2: 0.61
V3: 0.59
V4: 0.28
V1: 0.587
V2: 0.564
V3: 0.578
V4: 0.784
Socioeconomic40.289[0.178, 0.401]0.3010.09V1: 0.21
V2: 0.19
V3: 0.15
V4: 0.24
V1: 0.219
V2: 0.234
V3: 0.287
V4: 0.198
Geotechnical40.756[0.709, 0.798]0.7610.48V1: 0.67
V2: 0.69
V3: 0.58
V4: 0.62
V1: 0.651
V2: 0.637
V3: 0.717
V4: 0.689
Coefficients α = 0.70–0.80 were interpreted as acceptable reliability; values < 0.50 reflected formative indicator structure rather than measurement error.
Table 8. PCA adequacy and component structure results.
TestValueCriterion
KMO0.724≥0.60
Bartlett’s χ2892.4p < 0.05
Bartlett’s df55
Bartlett’s p<0.001
n/variables ratio21.7:1≥5:1
KMO > 0.70 indicates adequate sampling eingenvalues > 1.0 retained according to the Kaiser criterion.
Table 9. Physicochemical analysis of water samples.
ParameterUnitMethodResult
Timehours12:30
Temperature°CElectrometric30.4
pHunitsElectrometric8.01
ConductivitymS/cmElectrometric20.4
Total Suspended Solids (TSSs)mg/LGravimetric20
Total Dissolved Solids (TDSs)mg/LGravimetric13,220
Total Volatile Solids (TVSs)mg/LGravimetric40
Total Solids (TSs)mg/LGravimetric13,240
Fluoride (F)mg/LIon chromatography<0.05
Chloride (Cl)mg/LIon chromatography6996.49
Sulfate (SO42−)mg/LIon chromatography1.67
Calcium (Ca2+)mg/LICP-MS52.2
Magnesium (Mg2+)mg/LICP-MS23.1
Iron (Fe, dissolved)mg/LICP-MS6.84
Potassium (K+)mg/LICP-MS39.1
Sodium (Na+) *mg/LICP-MS8.0
* SGS Colombia ISO/IEC 17025-accredited analysis (Report BO2405753, 21 August 2024). Laboratory quality control: LCS recovery 98–102% for all analytes, method blanks < LCM. Sodium concentration verified through duplicate analysis with RSD < 2%.
Disclaimer/Publisher’s Note: The statements, opinions and data contained in all publications are solely those of the individual author(s) and contributor(s) and not of MDPI and/or the editor(s). MDPI and/or the editor(s) disclaim responsibility for any injury to people or property resulting from any ideas, methods, instructions or products referred to in the content.