1. Introduction
Femtosecond lasers, characterized by pulse widths in the femtosecond regime (
), enable the temporal resolution of ultrafast dynamics in electrons and atomic nuclei, serving as a powerful tool for investigating ultrafast phenomena. When a femtosecond laser pulse is compressed to only a few optical cycles, the relative phase between the pulse envelope and the carrier oscillation—known as the carrier-envelope phase (CEP)—directly dictates the instantaneous electric field waveform, thereby exerting a decisive influence on light–matter interaction processes. Its precision measurement and control are fundamental to frontier research such as attosecond physics, strong-field physics, and optical frequency combs [
1,
2,
3]. With the continuous advancement of ultrafast laser technology, femtosecond laser systems have achieved significant enhancements in repetition rate, average power, and temporal stability.
Early studies on attosecond pulse generation and streaking camera measurements have demonstrated the significance and feasibility of stabilizing and controlling the carrier-envelope phase (CEP) [
4]. For high-repetition-rate (>1 MHz) femtosecond laser oscillators, mature techniques such as self-referencing (
) and difference frequency generation (DFG) have been developed. These methods, combined with phase-locked loop (PLL) circuits, enable long-term precision locking [
5,
6]. However, the implementation of kilohertz-level low-repetition-rate, high-energy chirped-pulse amplification (CPA) systems is hindered by complex environmental noise and the inability to utilize traditional beat-note measurements. Meanwhile, significant progress has been made in high-power ultrafast laser systems, supercontinuum nonlinear conversion, and long-distance transmission [
7,
8]. The current mainstream measurement approach is spectral interferometry based on frequency doubling. This method extracts the CEP value by analyzing the interference spectrum via Fast Fourier Transform (FFT) [
9,
10], facilitating rapid locking. Recently, by employing
interferometry, long-term CEP stabilization has been achieved with a residual jitter of approximately 82 mrad (RMS) [
11].
Currently, femtosecond laser systems operating at a 10 kHz repetition rate impose stringent requirements on the bandwidth of CEP measurement systems, necessitating processing latencies at the microsecond (μs) level. While software-based processing schemes utilizing general-purpose processors (CPUs) offer advantages in flexibility, their serial execution architecture and operating system scheduling mechanisms often introduce non-negligible stochastic delays and temporal jitter. When long-term stability is required at repetition rates of 10 kHz or higher, such deterministic uncertainties significantly reduce the feedback bandwidth, making pulse-to-pulse real-time measurement and locking difficult to achieve. Furthermore, as interference spectral data are typically captured by commercial spectrometers, the raw data often suffer from non-uniform sampling. Directly feeding such non-uniform data into a Fast Fourier Transform (FFT) core violates the orthogonality foundation of the algorithm, introducing significant computational artifacts (pseudo-peaks) into the FFT results. This leads to substantial CEP measurement errors, which ultimately hinder precise phase locking. Fordell et al. proposed a detection scheme in 2011 based on an FPGA and a customized 16-element photodiode array (PDA), in which high-speed ADCs were used to simultaneously acquire pixel information from 8/16 channels of interferometric light, and the real-time CEP was calculated by the FPGA [
12]. This scheme demonstrated excellent real-time performance at a repetition rate of 100 kHz, laying the foundation for single-shot CEP measurement and fast feedback locking of ultrafast laser pulses.
This work develops a microsecond-level low-latency real-time CEP measurement system based on a field-programmable gate array (FPGA). Based on the Xilinx Artix-7 series platform (model XC7A100T), a hardware-based real-time CEP calculation system is proposed that combines linear interpolation resampling preprocessing with fast Fourier transform analysis, while also allowing the region of interest in the spectrum to be independently selected on the host computer. The innovations of this work are mainly reflected at the level of FPGA hardware architecture and engineering implementation, including the following aspects:
A hardware-level implementation of a real-time CEP measurement scheme for femtosecond laser amplification systems operating at a 10 kHz repetition rate is proposed. This scheme can access and process high-density spectral streams of up to 2136 pixels in real time, enabling a more accurate reconstruction of the interferometric fringe profile, effectively suppressing the influence of random noise on phase extraction, and improving the signal-to-noise ratio.
A configurable region-of-interest (ROI) spectral band selection function is implemented in the FPGA system, allowing users to dynamically select the optimal interferometric band within the original spectrum via the host computer, thereby enabling the system to adapt to different supercontinuum spectral distributions without adjusting the physical optical path.
To address spectral phase distortion and elevated CEP measurement errors caused by non-uniform sampling in spectrometer data, a real-time resampling algorithm based on linear interpolation is developed. A corresponding hardware resampling module is implemented within the controller, which maps the spectral data into a uniform frequency domain before FFT processing, effectively suppressing spectral phase distortion and computational errors.
To meet the low-latency requirements for shot-to-shot measurement at 10 kHz, a fully pipelined parallel processing architecture is implemented in the master controller. This reduces the CEP calculation latency to the microsecond scale and ensures strict determinism in single-shot pulse processing latency. While maintaining measurement precision, this approach significantly enhances the system’s real-time capability and long-term operational stability.
The remainder of this paper is organized as follows:
Section 2 details the physical principles of
spectral interferometry and the design of the proposed real-time algorithm.
Section 3 describes the experimental methodology and results for the real-time shot-to-shot CEP measurement in a high-repetition-rate laser amplification system, followed by a comprehensive analysis. Finally,
Section 4 concludes the study.
2. Materials and Methods
2.1. Principle of f-2f Interference and CEP Detection
In the study of strong-field physics and attosecond science, the key to characterizing an ultrashort laser pulse lies in the precise waveform of its optical electric field. For pulses approaching the Fourier transform limit, the electric field is typically represented as a carrier oscillation modulated by a Gaussian envelope. Its time-domain expression is given by:
In Equation (
1),
represents the pulse envelope,
represents the center frequency of the pulse spectrum, and
is the Carrier-Envelope Phase (CEP) of the pulse. By performing a Fourier transform on Equation (
1), the electric field in the frequency domain,
, can be expressed as:
where
is the center frequency of the pulse spectrum,
is the standard deviation of the pulse spectrum, and
represents the Carrier-Envelope Phase information of the pulse. Equation (
2) indicates that, in the frequency domain, the CEP manifests as a global constant term added to the spectral phase [
13].
In 2001, Kakehata et al. [
14] proposed a technique for measuring the CEP of amplified laser pulses at repetition rates of several kilohertz using spectral interferometry. In this method, when a broadened femtosecond pulse passes through a dispersive medium (such as a nonlinear crystal), the short-wavelength components of its spectrum experience an additional time delay
, relative to the long-wavelength components. Within the nonlinear crystal, the Second-Harmonic Generation (SHG) of the long-wavelength component interferes with the naturally occurring short-wavelength component of the same frequency. This produces a spectral interference curve where the optical intensity varies periodically with wavelength [
15,
16]. The expression for the spectral intensity, resulting from the superposition of the fundamental short-wavelength component and the second harmonic of the long-wavelength component, is given by:
where
is the spectral intensity of the short-wavelength component in the fundamental light;
is the spectral intensity generated by the second-harmonic generation (SHG) of the long-wavelength component in the fundamental light; and
is the fixed time delay introduced by the dispersive medium.
In Equation (
3),
can be decomposed into a slowly varying spectral background term and a high-frequency oscillatory term carrying the phase information. The Fourier transform enables the clear separation of these two components—which are mixed in the frequency domain
—within their conjugate time domain
t [
17]. By performing a one-dimensional Fast Fourier Transform (FFT) on
, the time-domain signal
is obtained. The ideal algorithmic procedure for extracting the CEP from
is as follows [
18]:
Frequency-Domain Filtering: A bandpass filter is applied in the time domain t to precisely isolate one of the sideband peaks (e.g., the peak located at ).
Phase Calculation: The phase of the filtered sideband peak is subsequently calculated. There exists a direct linear relationship between the phase of the sideband peak, , and the phase term within the interference spectrum:
where
is a fixed constant, denoted as
C. Consequently, by measuring the pulse-to-pulse variation of the sideband peak phase,
, the pulse-to-pulse jitter of the carrier-envelope phase,
, can be precisely determined [
19].
2.2. Spectral Calibration and Non-Uniform Sampling Correction
In CEP measurements based on spectral interferometry, the input data for the Fast Fourier Transform (FFT),
, must be sampled at equal intervals in the frequency domain
to ensure the orthogonality of the transform and the accuracy of spectral peak localization [
20]. However, in practical physical measurements, this prerequisite is often not satisfied. The reason is that the detector array of a spectrometer physically performs approximately equidistant sampling in the wavelength domain
, whereas a non-linear relationship exists between frequency and wavelength:
where
c is the speed of light. Due to the inverse proportional nature of this relationship, the equidistant sampling points in the wavelength domain
, once mapped to the frequency domain, correspond to non-equidistant points
[
21]. If these non-uniformly sampled data are directly used as input for the FFT algorithm module, the underlying orthogonality of the transform is compromised. This leads to the emergence of numerous computational pseudo-peaks in the results, which alias with the interference sideband signals of the original spectrum. Consequently, the extracted CEP information deviates and becomes distorted, significantly increasing calculation errors [
22].
To resolve this issue, it is necessary to perform resampling on the raw spectral data. The objective of this step is to interpolate the data in the wavelength-domain
into equidistant sampling points in the frequency domain
[
23]. Given that each
corresponds to a specific wavelength
, the intensity value is obtained by linear interpolation to ensure uniform sampling. Using the real-time FPGA linear interpolation algorithm designed in this study, the input spectrum undergoes pipelined pre-processing, eliminating pseudo-peak interference caused by non-uniform sampling [
24].
2.3. Experimental Setup and Optical Layout
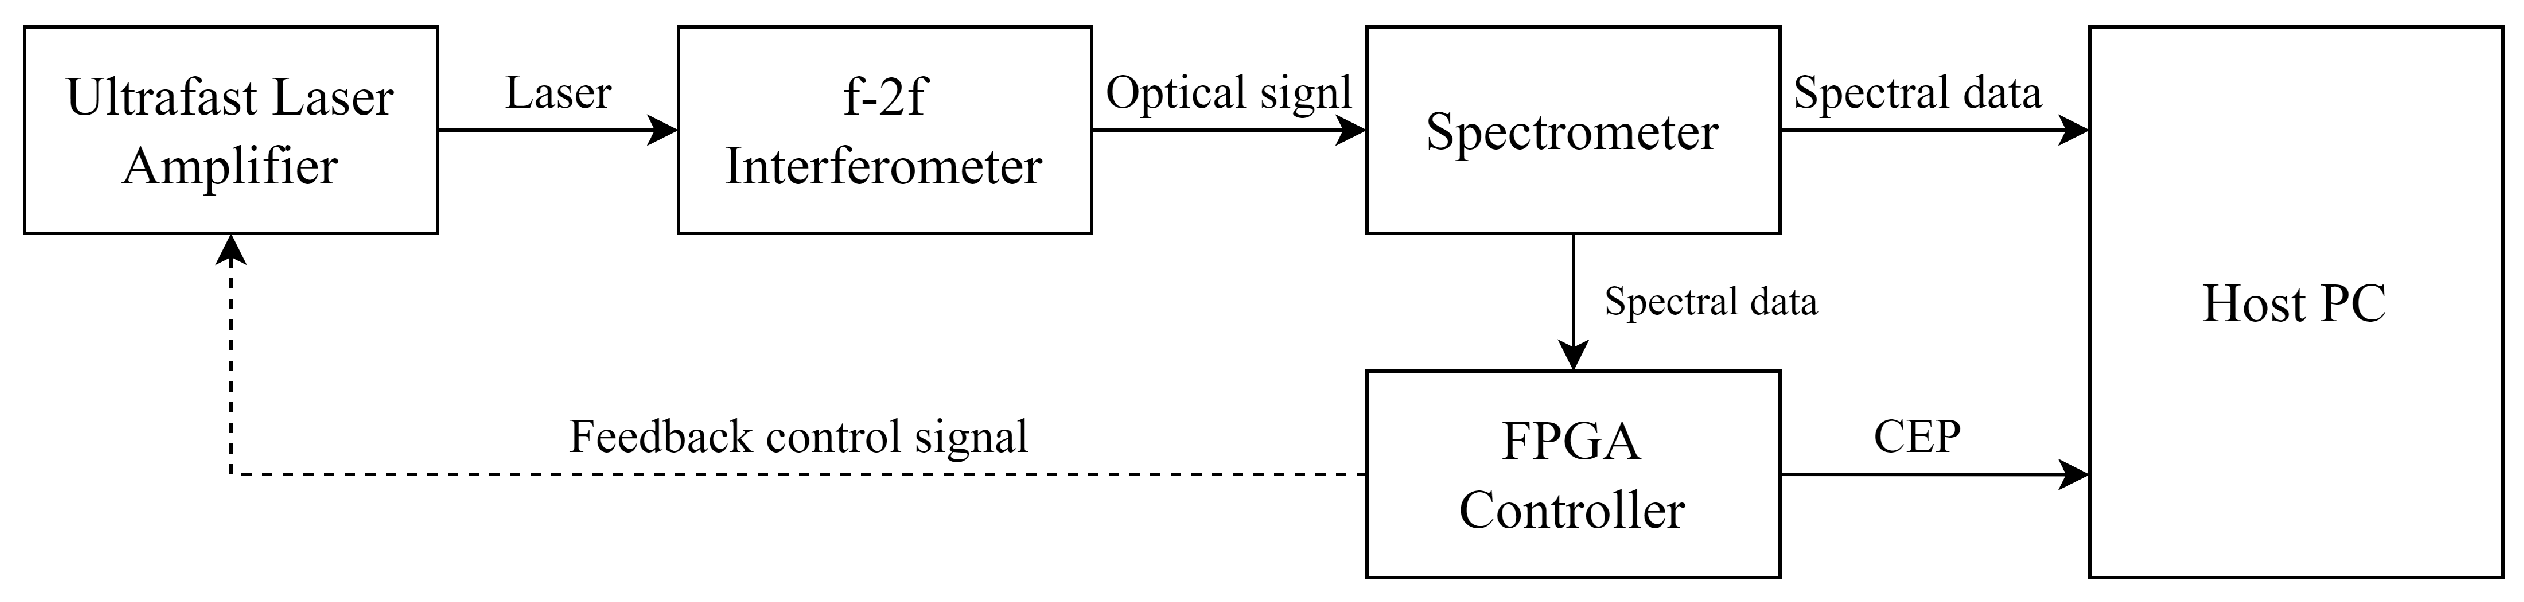
The experimental setup of the proposed system consists of an ultrafast laser amplification system, an
interferometric platform, a spectrometer, an FPGA-based master computational platform, and a host computer. The overall configuration of the system is illustrated in
Figure 1. The feedback path indicated by the dashed line illustrates the potential application structure of this system in closed-loop CEP stabilization experiments. It should be noted that the focus of this work is on the FPGA-based real-time CEP extraction algorithm and its performance verification under high repetition rates (10 kHz). Physical closed-loop CEP stabilization experiments have not yet been conducted. Related feedback control experiments, including actuators and control algorithms, will be the focus of future work.
The laser source employed in the experiment was developed in-house by the Songshan Lake Materials Laboratory, delivering output pulses with a central wavelength of 800 nm, a pulse duration of 40 fs, and a repetition rate of 10 kHz. This high repetition rate imposes stringent requirements on the real-time performance of the measurement system, as the temporal interval between consecutive pulses is merely 100 μs. The optical layout of the
interferometric platform is illustrated in
Figure 2. The laser pulse first passes through a half-wave plate (HWP) to adjust the polarization direction in order to optimize the efficiency of nonlinear frequency conversion, and then the beam is tightly focused by a concave mirror (M1, focusing mirror) into the sapphire crystal. The peak power density upon focusing is sufficient to induce significant nonlinear effects within the crystal, primarily dominated by self-phase modulation (SPM), which generates a broadband supercontinuum white light. After being collimated by a second concave mirror (
, collimating mirror), the supercontinuum light passes through a
-barium borate (BBO) nonlinear crystal. The long-wavelength (infrared) components of the spectrum undergo second-harmonic generation (SHG) in the BBO, resulting in a frequency that matches the short-wavelength components already present in the supercontinuum, leading to collinear interference. Subsequently, a thin-film polarizer (TFP) is employed to align the polarization states of the second-harmonic light and the original short-wavelength light, thereby enhancing the interference fringe contrast. Finally, a filter is used to remove the remaining long-wavelength components that do not participate in the interference, and the resulting interferometric spectrum is coupled into a spectrometer via a fiber coupler for data acquisition.
The experiment employed an Ocean FX series high-speed miniature fiber-optic spectrometer (Ocean Optics, Orlando, FL, USA) for spectral acquisition. The device is equipped with a 2136-pixel CMOS detector, covering a wavelength detection range of 200–1100 nm. Under the system configuration used in this work (with a 25 μm slit), the optical resolution is approximately 1.5 nm (FWHM), providing sufficient sampling accuracy to clearly resolve the interference fringes. The integration time of the spectrometer is adjustable from 10 μs to 1 s. Prior to the experiment, the wavelength calibration of the spectrometer was verified using a mercury–argon (Hg/Ar) lamp. This method utilizes multiple narrowband atomic emission lines generated by mercury and argon atoms in the visible spectral range, whose central wavelengths exhibit high stability and traceability. By comparing the measured spectral line positions with their known standard wavelengths, the pixel-to-wavelength mapping of the spectrometer was calibrated, achieving a wavelength error of approximately 0.1–0.2 nm. In the experiment, the integration time for the interferometric spectral data was set to 1 ms based on the interferometric signal intensity. This setting represents a physical compromise under the current experimental light intensity to obtain interference fringes with a high signal-to-noise ratio (SNR), achieving optimal SNR and dynamic range. Although the physical sampling rate is currently limited by the detector sensitivity, the FPGA processing system designed in this study is still configured for a 10 kHz processing capability, aiming to verify the real-time performance and determinism of this architecture when handling future high-repetition-rate, high-brightness light source data streams. The data are transmitted in real time to the FPGA control unit via a gigabit Ethernet interface for processing.
2.4. Integrated Design of Real-Time CEP Extraction Algorithm on FPGA
This section focuses on the real-time CEP extraction algorithm architecture implemented on the FPGA hardware platform. To complete the entire sequence of CEP extraction computations within a critically short interval of 100 μs (corresponding to a 10 kHz repetition rate), the system adopts a modular and pipelined design approach.
The implemented CEP measurement algorithm is deployed on a Xilinx Artix-7 master controller(model XC7A100T, Xilinx, Inc., San Jose, CA, USA). The logic development and deployment are performed using Vivado 2024.1, with modules for linear interpolation, Fast Fourier Transform (FFT), peak detection, and CEP extraction implemented via Verilog HDL. This chip provides abundant logic resources and integrated DSP slices, satisfying the computational requirements for high-bandwidth real-time linear interpolation and high-speed FFT operations.
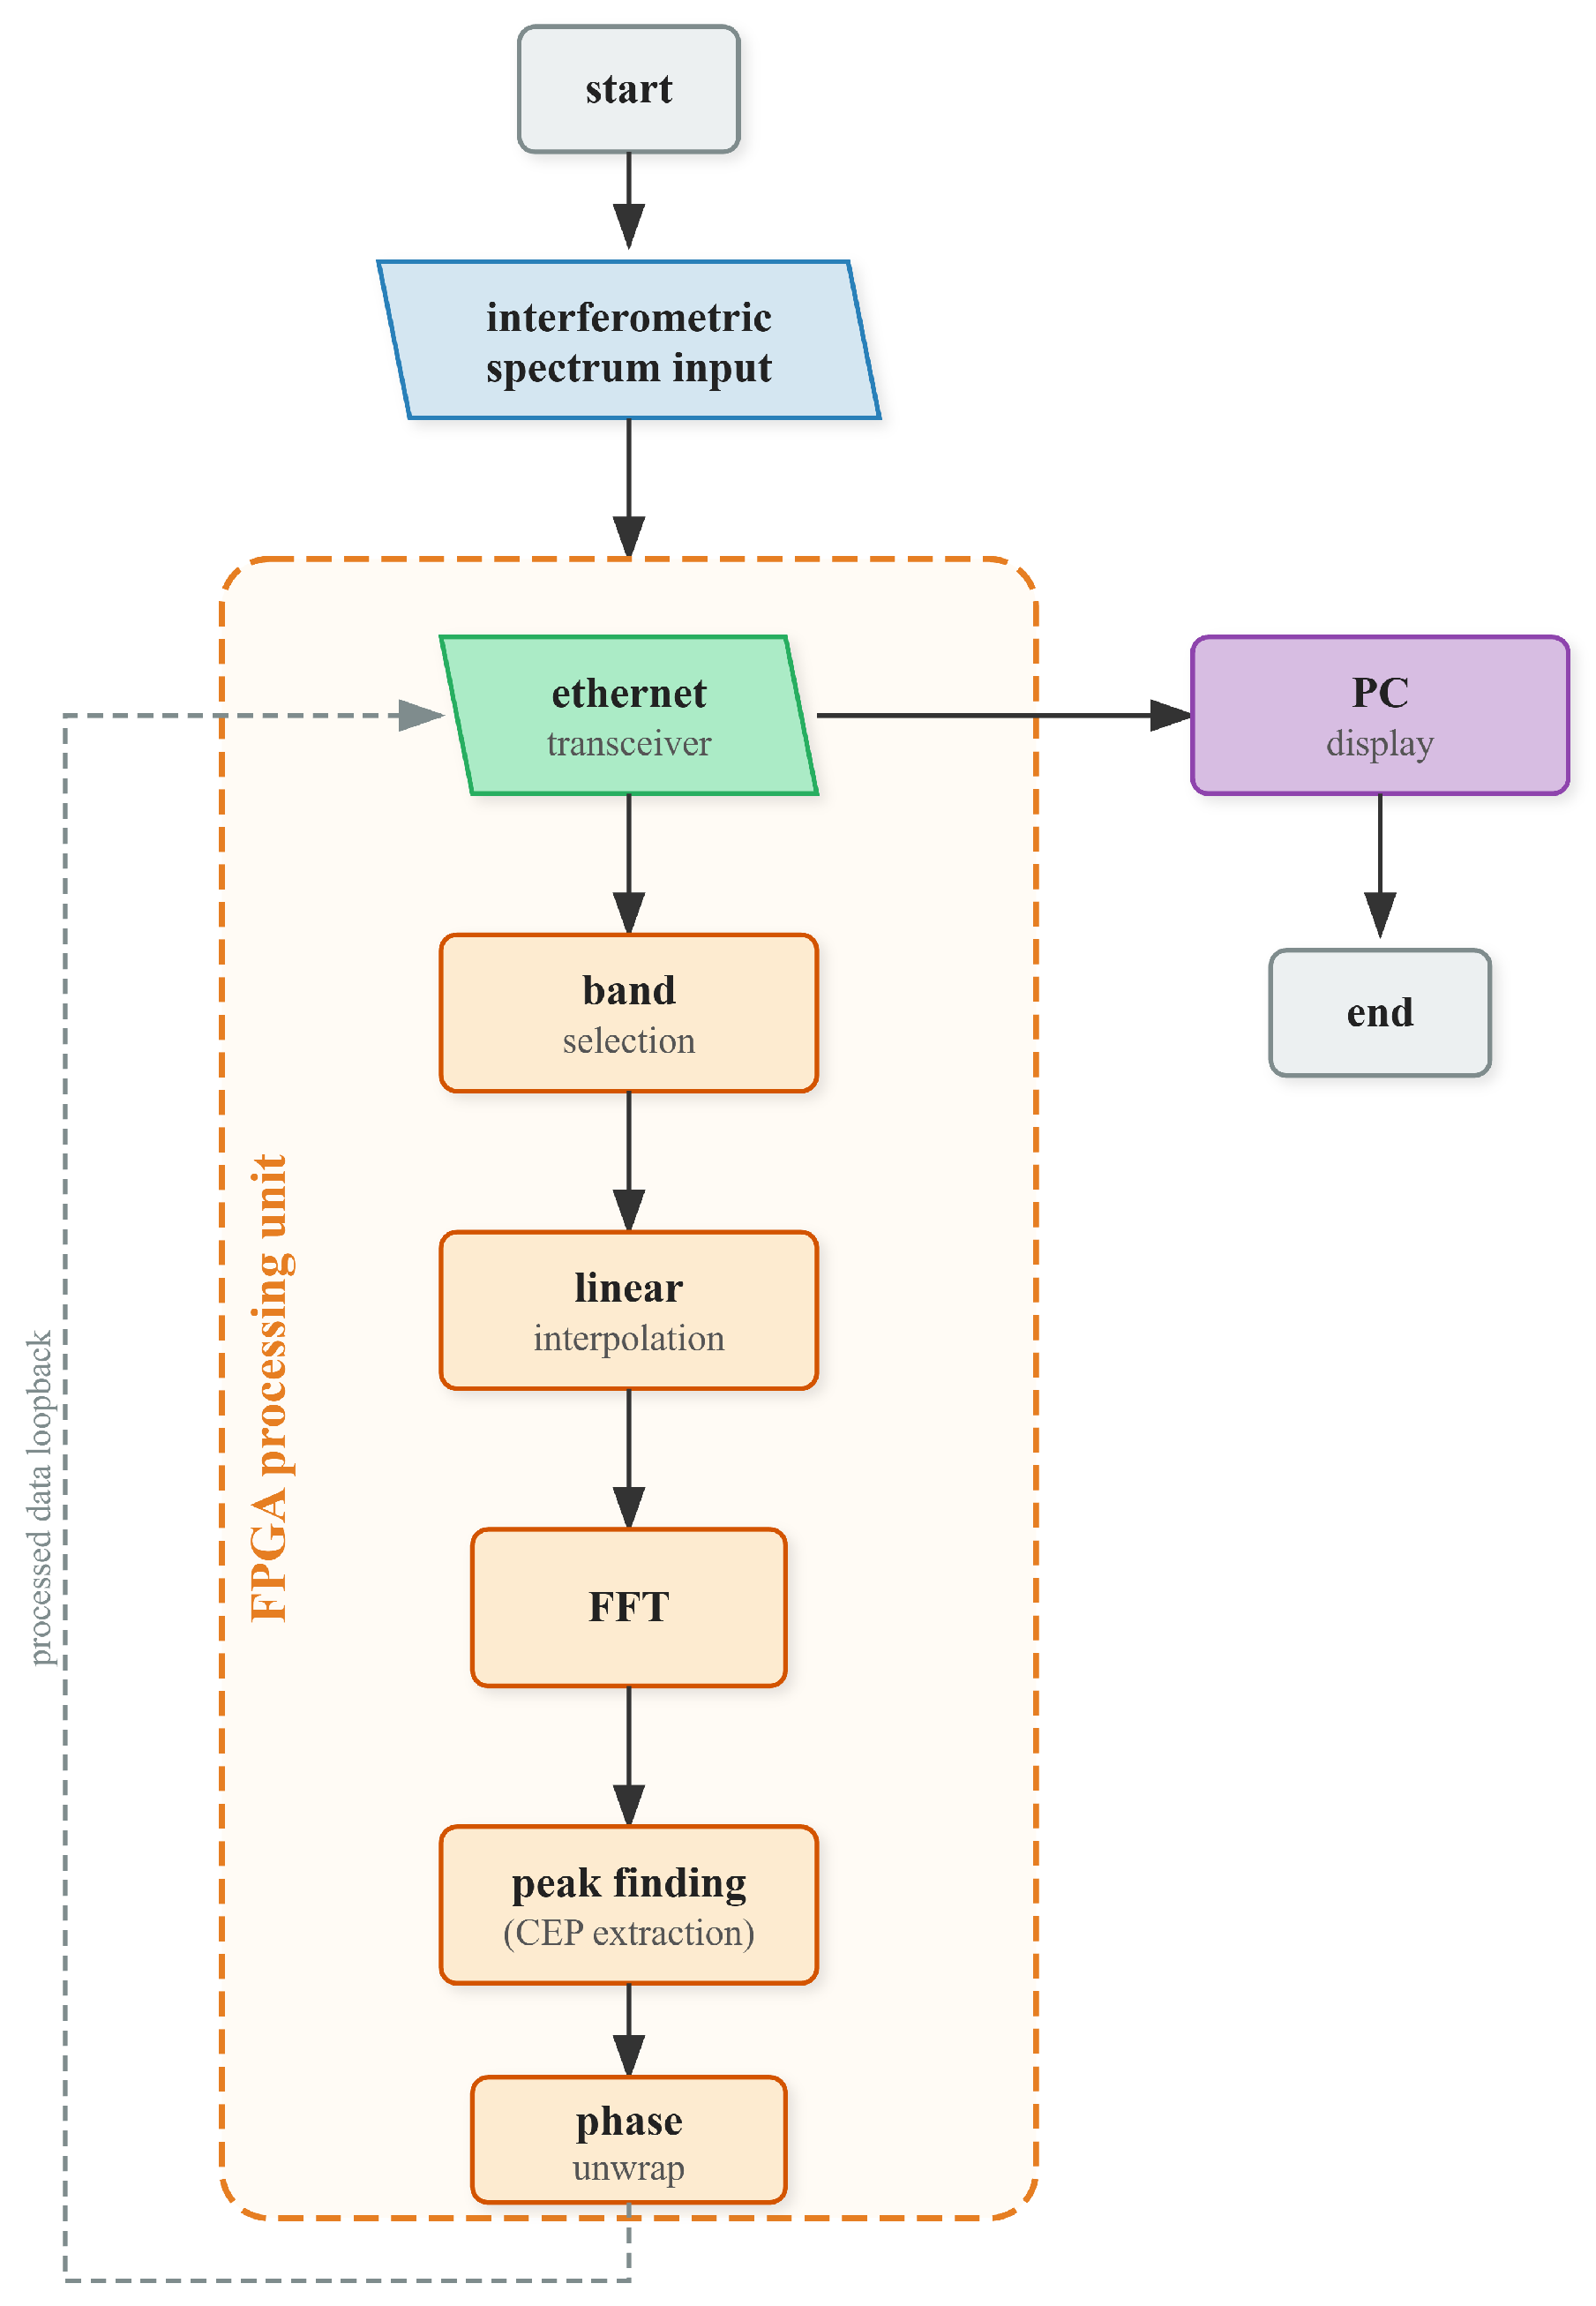
The workflow between the modules is illustrated in
Figure 3. The system is divided into the following four primary modules:
Ethernet Module: Responsible for high-speed communication between the FPGA, the host computer, and the spectrometer. It implements UDP protocol decapsulation to feed the sampled spectral data into the master controller, where it is received by 16-bit registers.
Linear Interpolation Module: Utilizes a linear interpolation algorithm to precisely resample the raw input spectral data, ensuring compatibility with the requirements of the FFT algorithm.
FFT Module: Implemented based on a pipelined Radix-4 butterfly architecture, this module transforms the interference spectrum from the wavelength domain to the frequency domain, enabling the quantitative extraction of interference peak shifts and phase differences.
CEP Extraction Module: Utilizes a bubble sort algorithm and a pipeline-based comparator array for peak detection logic. This module identifies peaks in the frequency-domain signals output by the FFT and performs phase decapsulation to achieve high-precision CEP jitter extraction.
The system employs a multi-clock architecture to optimize timing paths. A high-stability 50 MHz base system clock is provided by a SITIME SIT8008BI active crystal oscillator(SiTime Corporation, 5451 Patrick Henry Dr, Santa Clara, CA 95054, USA). Utilizing the Clock Wizard IP core (based on a Phase-Locked Loop, PLL, structure), this reference clock is synthesized into multiple synchronous clock domains to drive distinct functional modules:
125 MHz Interface Clock: Drives the Gigabit Ethernet PHY interface, ensuring that spectral data are streamed into the master controller in real-time at a 1 Gbps rate, satisfying the bandwidth requirements for 10 kHz operation.
100 MHz Core Logic Clock: Serves as the primary clock for the algorithm pipeline, driving the real-time interpolation, FFT-based phase extraction, and peripheral logic modules.
Synchronization Strategy: The system precisely synchronizes the starting point of spectral data acquisition by monitoring external laser trigger signals. Data transfer between different clock domains is managed through asynchronous FIFOs, ensuring the continuity and stability of high-speed data streams under high-repetition-rate conditions.
In the pipeline architecture adopted in this work, the system throughput is typically determined by the slowest stage. As shown in
Figure 3, the FPGA master control unit receives 2136 data points transmitted from the spectrometer via Ethernet, with each data point being 16 bit in length. The system uses an 8-bit register to receive the data serially. Ideally, receiving a complete frame of spectral data requires 4272 clock cycles. In addition, extra data such as frame headers and footers need to be transmitted, resulting in an actual time of approximately 50–60 μs. This data acquisition stage constitutes the performance bottleneck of the entire system pipeline. Although the total latency for a single measurement is 89 μs, thanks to the parallel processing characteristics of the pipeline, the system’s maximum throughput for spectral data can reach 16,666–20,000 fps. This ensures sufficient computational margin when the system handles high-repetition-rate (10 kHz) laser pulses.
2.5. Hardware Implementation of Real-Time Linear Interpolation
Higher-order interpolation methods (such as sinc interpolation or cubic interpolation) offer better smoothness in spectral amplitude reconstruction. However, within the interferometric spectral range used in this work, the CEP jitter of the amplified femtosecond laser system itself reaches at least several tens of milliradians, while the influence of different interpolation methods on the final CEP extraction is typically less than 2 mrad. MATLAB R2023a (version 9.14.0.2206163) simulation results indicate that under the same sampling density, the CEP values obtained using linear interpolation, cubic interpolation, and sinc interpolation are highly consistent, with differences far smaller than the intrinsic phase noise of the system. In contrast, higher-order interpolation in an FPGA generally requires a large number of multiply-accumulate operations and more complex control logic, significantly increasing hardware resource consumption and reducing the maximum operating frequency of the system. Considering CEP extraction accuracy, hardware resource usage, and real-time requirements, linear interpolation is adopted in this work.
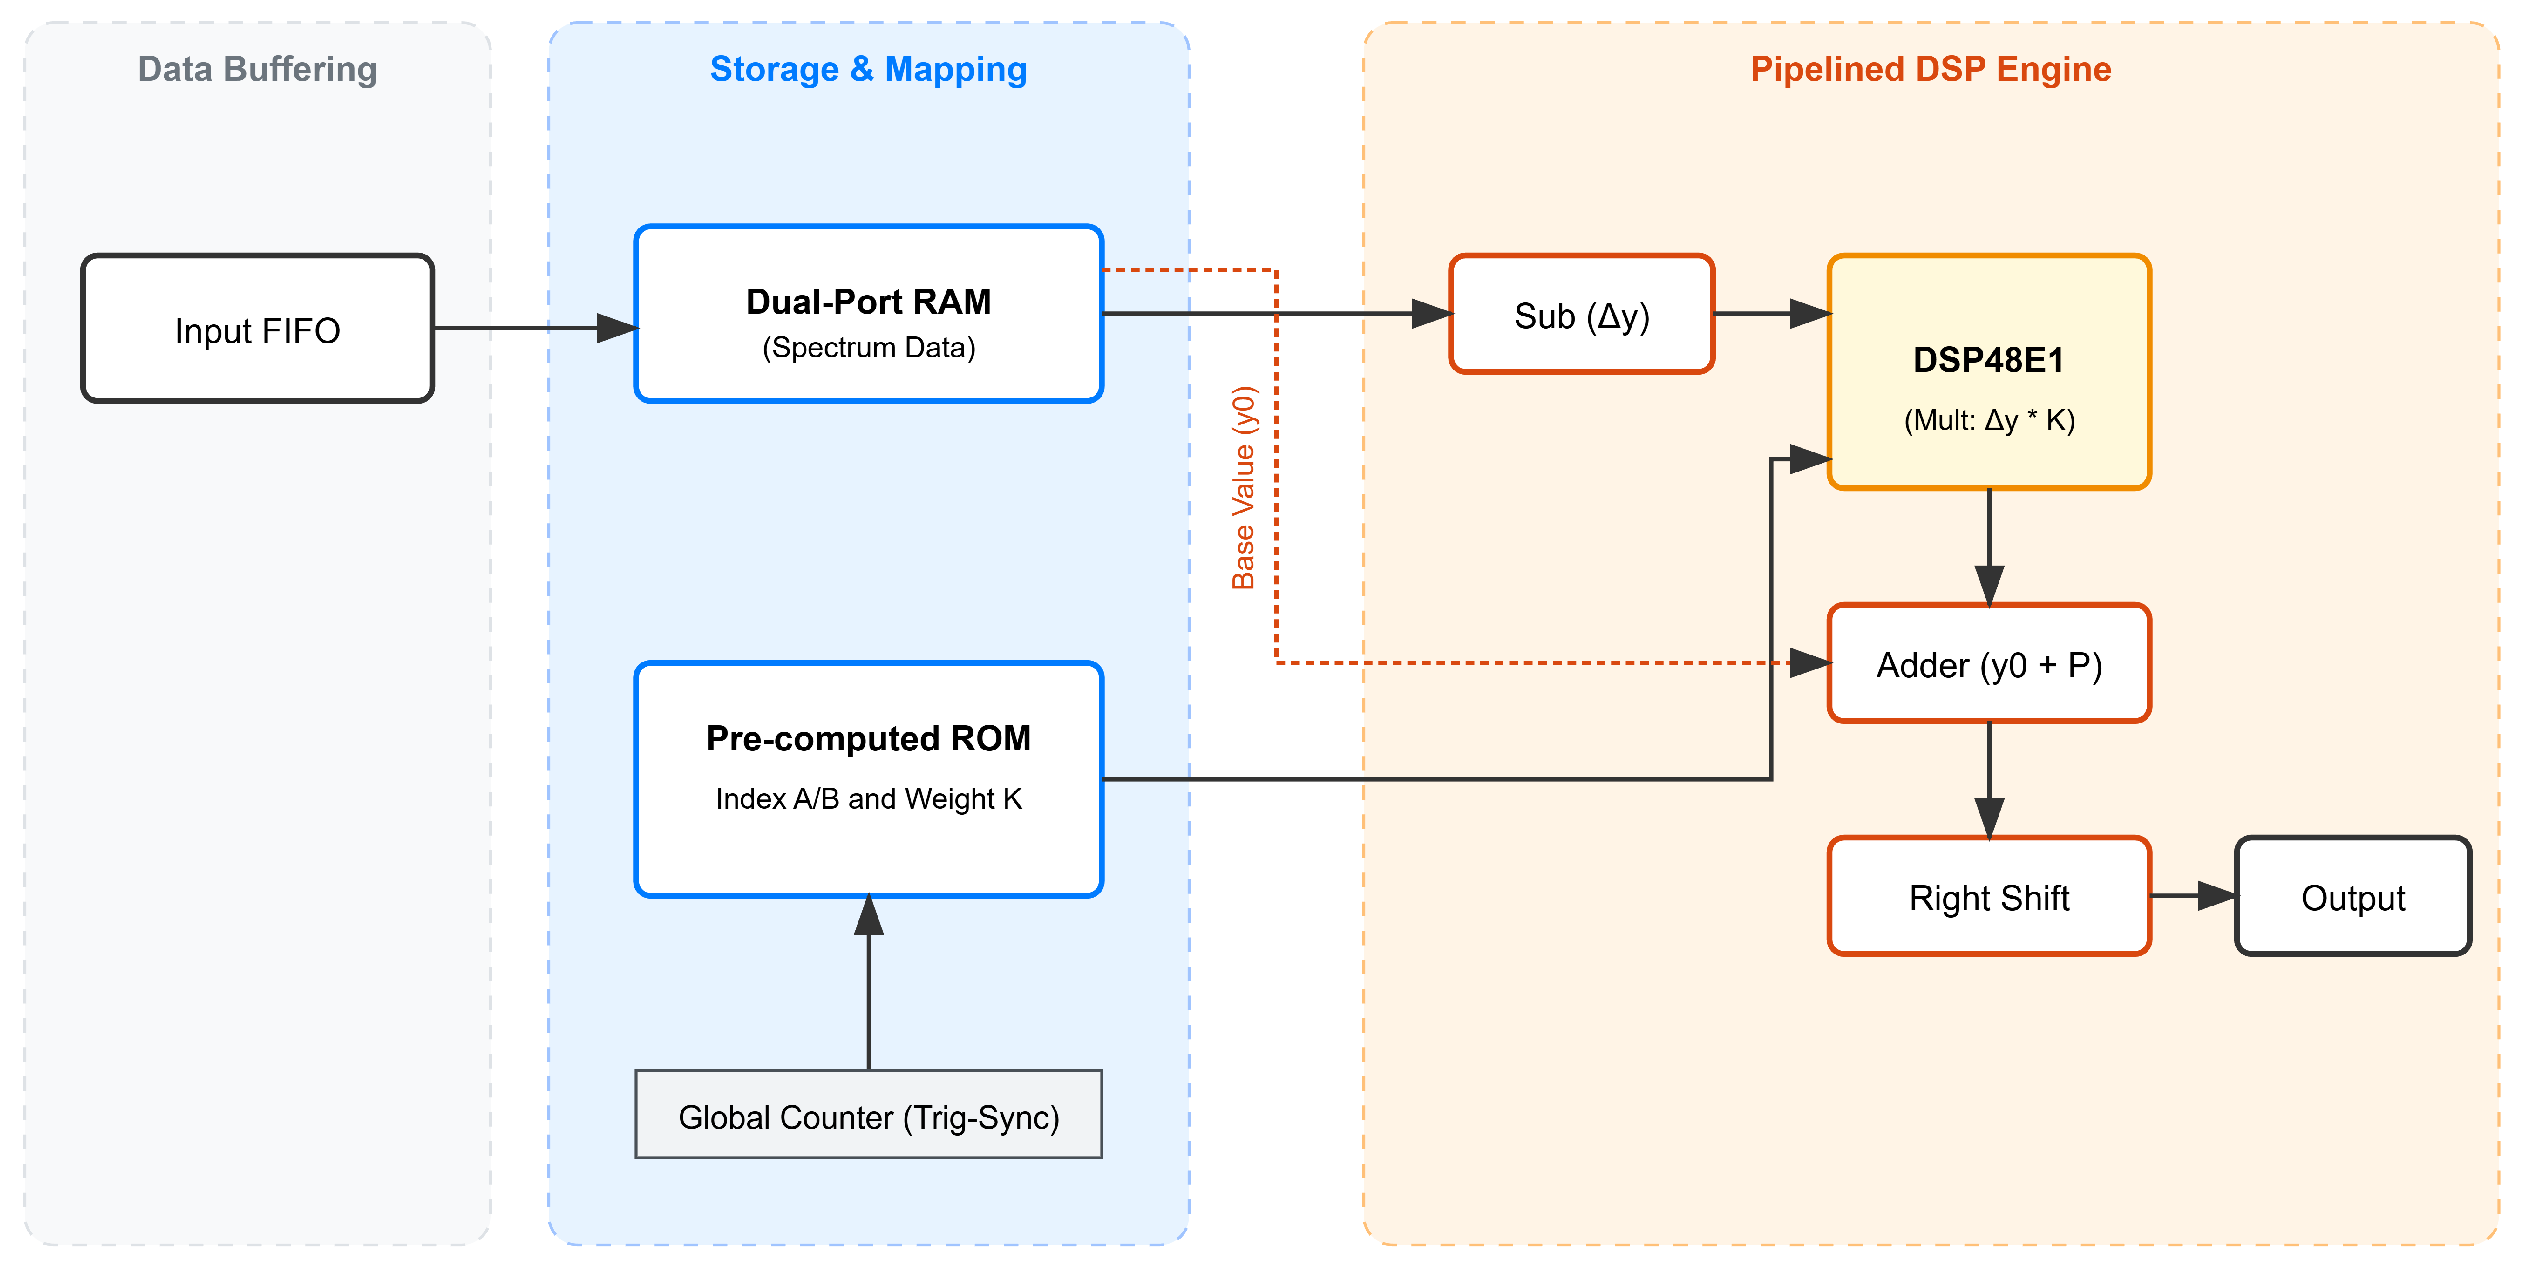
The logical workflow of the linear interpolation is illustrated in
Figure 4. The linear interpolation algorithm necessitates intensive mathematical computations. Within the FPGA, it is essential to balance the limited logic resources with the requirement for high-bandwidth data throughput. To address this, the module transforms complex calculations through mathematical optimization and hardware-level refinements, converting them into a high-efficiency pipelined design.
Since performing division operations on an FPGA incurs high latency and consumes a significant amount of DSP processing units, this module employs a pre-computed mapping table. This allows the division in the original formula to be replaced by a combination of multipliers and adders. Based on the wavelength coordinates calibrated from the spectrometer and the target equidistant frequency coordinates, the interpolation weights (i.e., scaling factor k) for all sampling points are pre-calculated. These weight values are stored in the internal ROM resources of the FPGA in a 16-bit fixed-point format. Upon completion of the spectral data reception, the system synchronously reads the interpolation weights from the ROM based on the current pixel index, transforming the operation into one subtraction, one fixed-point multiplication, and one addition. Internally, a 32-bit bit-width is used for intermediate variable calculations to prevent overflow during multiply-accumulate operations and ensure computational precision.
To meet high-speed computational requirements, this module adopts a five-stage pipelined structure, performing: input pixel storage and ROM weight lookup, calculation of adjacent pixel interpolation, invocation of DSP units for multiplication, execution of linear compensation, and data stream format conversion and output, respectively. In the system design, since the spectral band with the optimal signal-to-noise ratio (SNR) of the interferometric spectrum may shift under different experimental conditions, the full spectral data are acquired and buffered to support flexible selection of the SNR-optimal region of interest (ROI) for CEP extraction under varying experimental conditions.Through this pipelined structure optimization, the computation of 2136 points of spectral data per frame takes approximately 116 clock cycles (about 1.2 μs), rendering the latency introduced to the system nearly negligible.
2.6. Hardware Implementation of Phase Extraction and Phase Unwrapping Logic
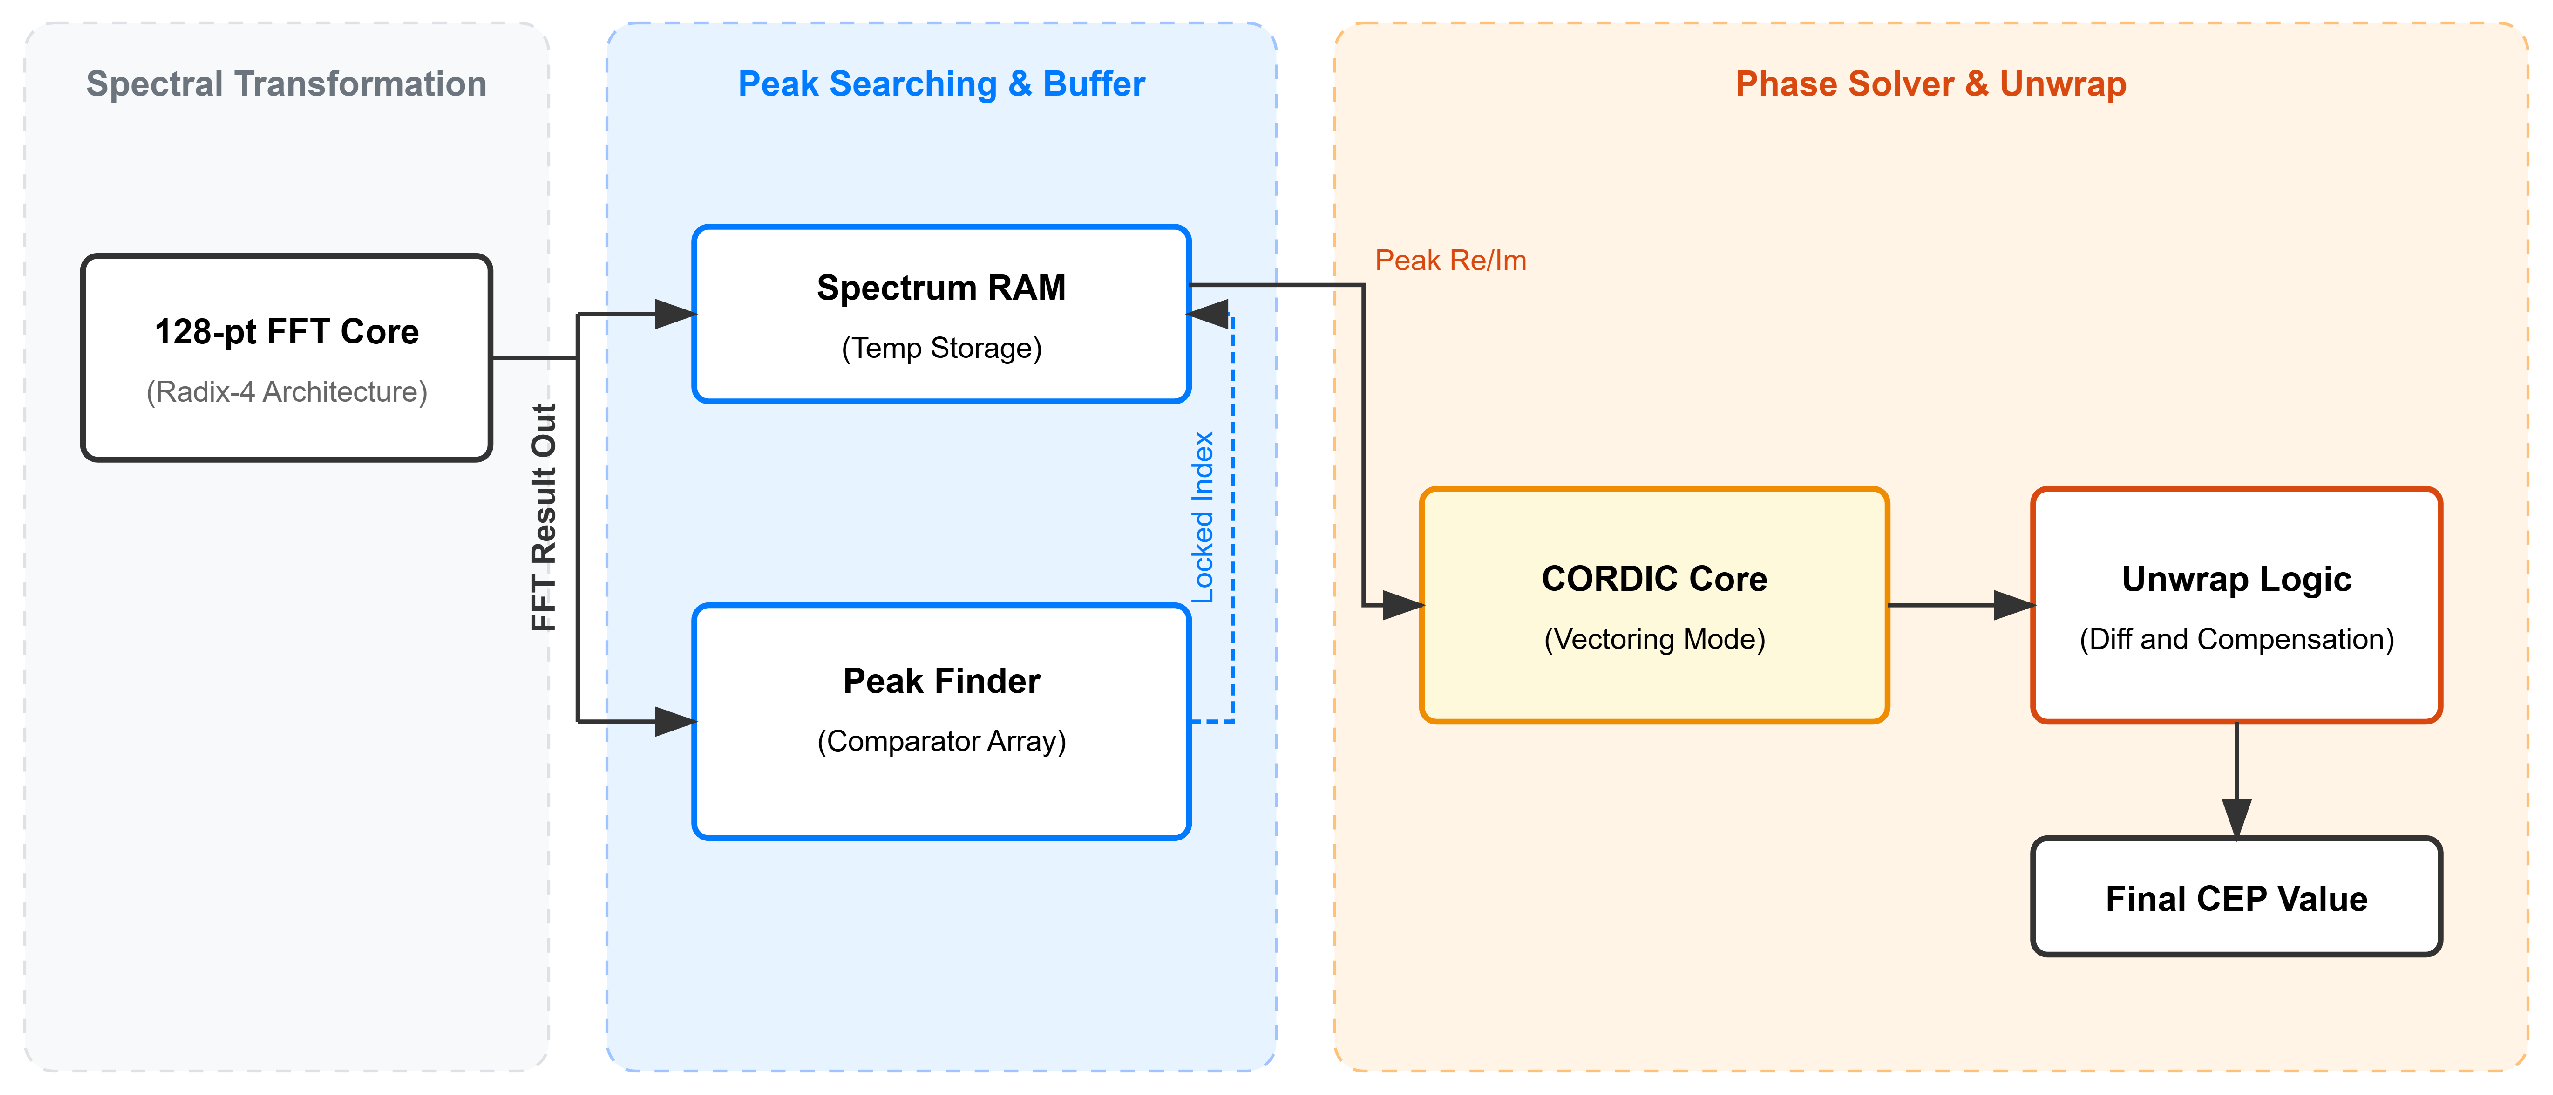
The flowcharts for phase extraction and phase unwrapping are shown in
Figure 5. After completing the preprocessing of the spectral data, the equidistant frequency data stream enters the phase extraction module, which consists of a four-stage pipeline: Fast Fourier Transform (FFT), peak search, CORDIC algorithm, and Unwrap logic. The system adopts a 128-point FFT operation, with the data source retrieved from the buffer stored by the previous module. This operation is based on the Radix-4 butterfly computation and consumes 496 clock cycles. When the FFT results are output, the system enters the second pipeline stage, synchronously starting the peak search logic while temporarily storing the FFT output results in a RAM. A serial comparator array is utilized to traverse 128 frequency-domain samples within approximately 140 clock cycles, calculating the peak index by dynamically updating the maximum value register. Once the peak index is determined, its corresponding complex domain value enters the CORDIC computational core. Using the vector mode, the phase solution is completed through a 28-stage iterator using an approximation algorithm. The solution process takes about 20 clock cycles, initially extracting the CEP value.
Due to computational reasons, the phase values extracted by CORDIC jump within the interval . The system implements phase unwrapping through a fourth-stage pipeline structure. The implementation principle is that when the absolute difference between two adjacent phase data points exceeds , an accumulation compensation amount is added, thereby achieving continuous phase processing.
The output value after unwrapping is the single-shot pulse CEP value of the femtosecond pulse amplifier extracted by the system.
3. Results
3.1. FPGA Resource Utilization and Timing Performance
To verify the hardware efficiency of the CEP real-time extraction algorithm proposed in this paper, the design was synthesized and implemented based on the Xilinx XC7A100T. The system operates under dual clocks of 100 MHz and 125 MHz, and the resource utilization is shown in
Table 1.
As shown in
Table 1, the utilization of LUT, FF, BRAM, and DSP resources is reasonable, with the BRAM utilization reaching 61.5%. This is primarily due to the multi-stage buffering strategy adopted by the system to implement pipelined processing, including intermediate buffers for storing raw spectral data, linear interpolation data, and FFT calculation data. Each resource retains a certain margin, providing reserved resource space for future functional expansions.
In terms of timing performance, timing closure was achieved after placement and routing. Under the constraint of the 100 MHz clock, the Worst Negative Slack (WNS) is maintained above 5 ns, ensuring system stability.
3.2. Validation of the Real-Time Interpolation Algorithm
A typical spectral interferogram measured on the optical table is shown in
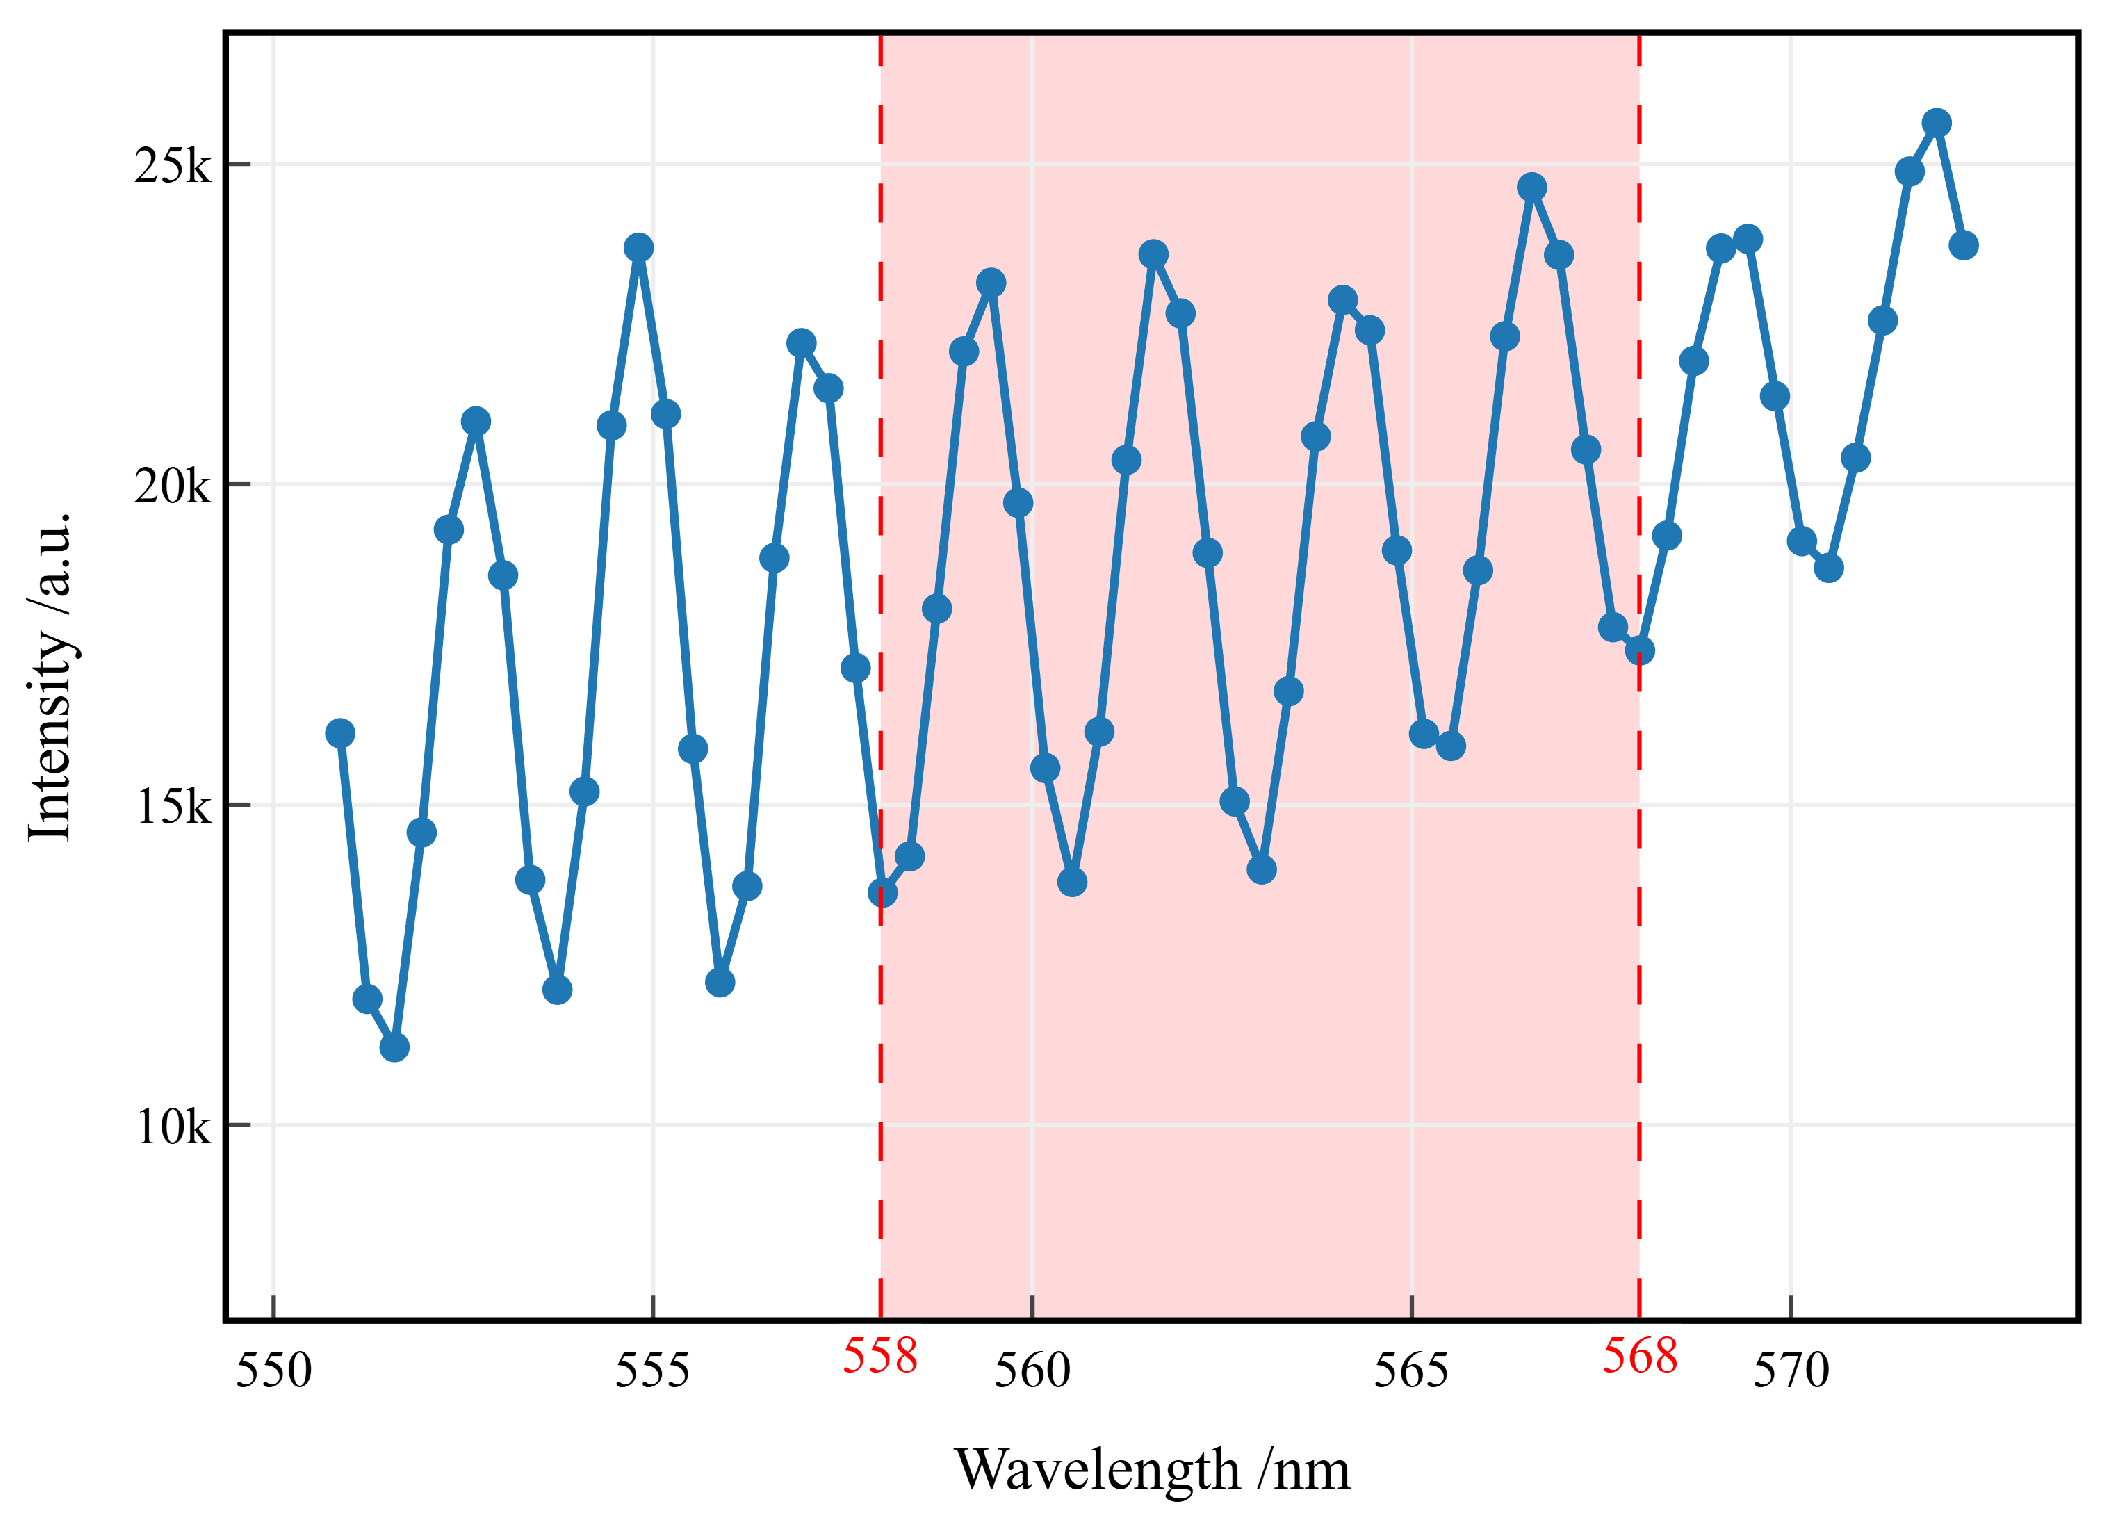
Figure 6. The spectral data were acquired by the spectrometer. Due to the nonlinear Kerr effect under strong-field conditions, femtosecond pulses with an 800 nm central wavelength undergo self-phase modulation (SPM) in the sapphire crystal, generating a broad supercontinuum spectrum covering the visible to near-infrared range (approximately 400–1200 nm). This broad spectral feature allows the long-wavelength components’ second-harmonic light to spectrally overlap with the short-wavelength components, thereby producing
interference. In the experiment, the interferometric signal within the 558–568 nm wavelength range, which exhibits good fringe contrast and SNR, was selected. In this band, the long-wavelength component around 1120 nm in the supercontinuum generates its second harmonic through a BBO crystal, which then interferes collinearly with the short-wavelength component around 560 nm in the original supercontinuum. When the oscillator CEP is fast-loop locked, this segment of the interferometric signal is clear and stable, with sampling points approximately uniformly distributed in the wavelength domain.
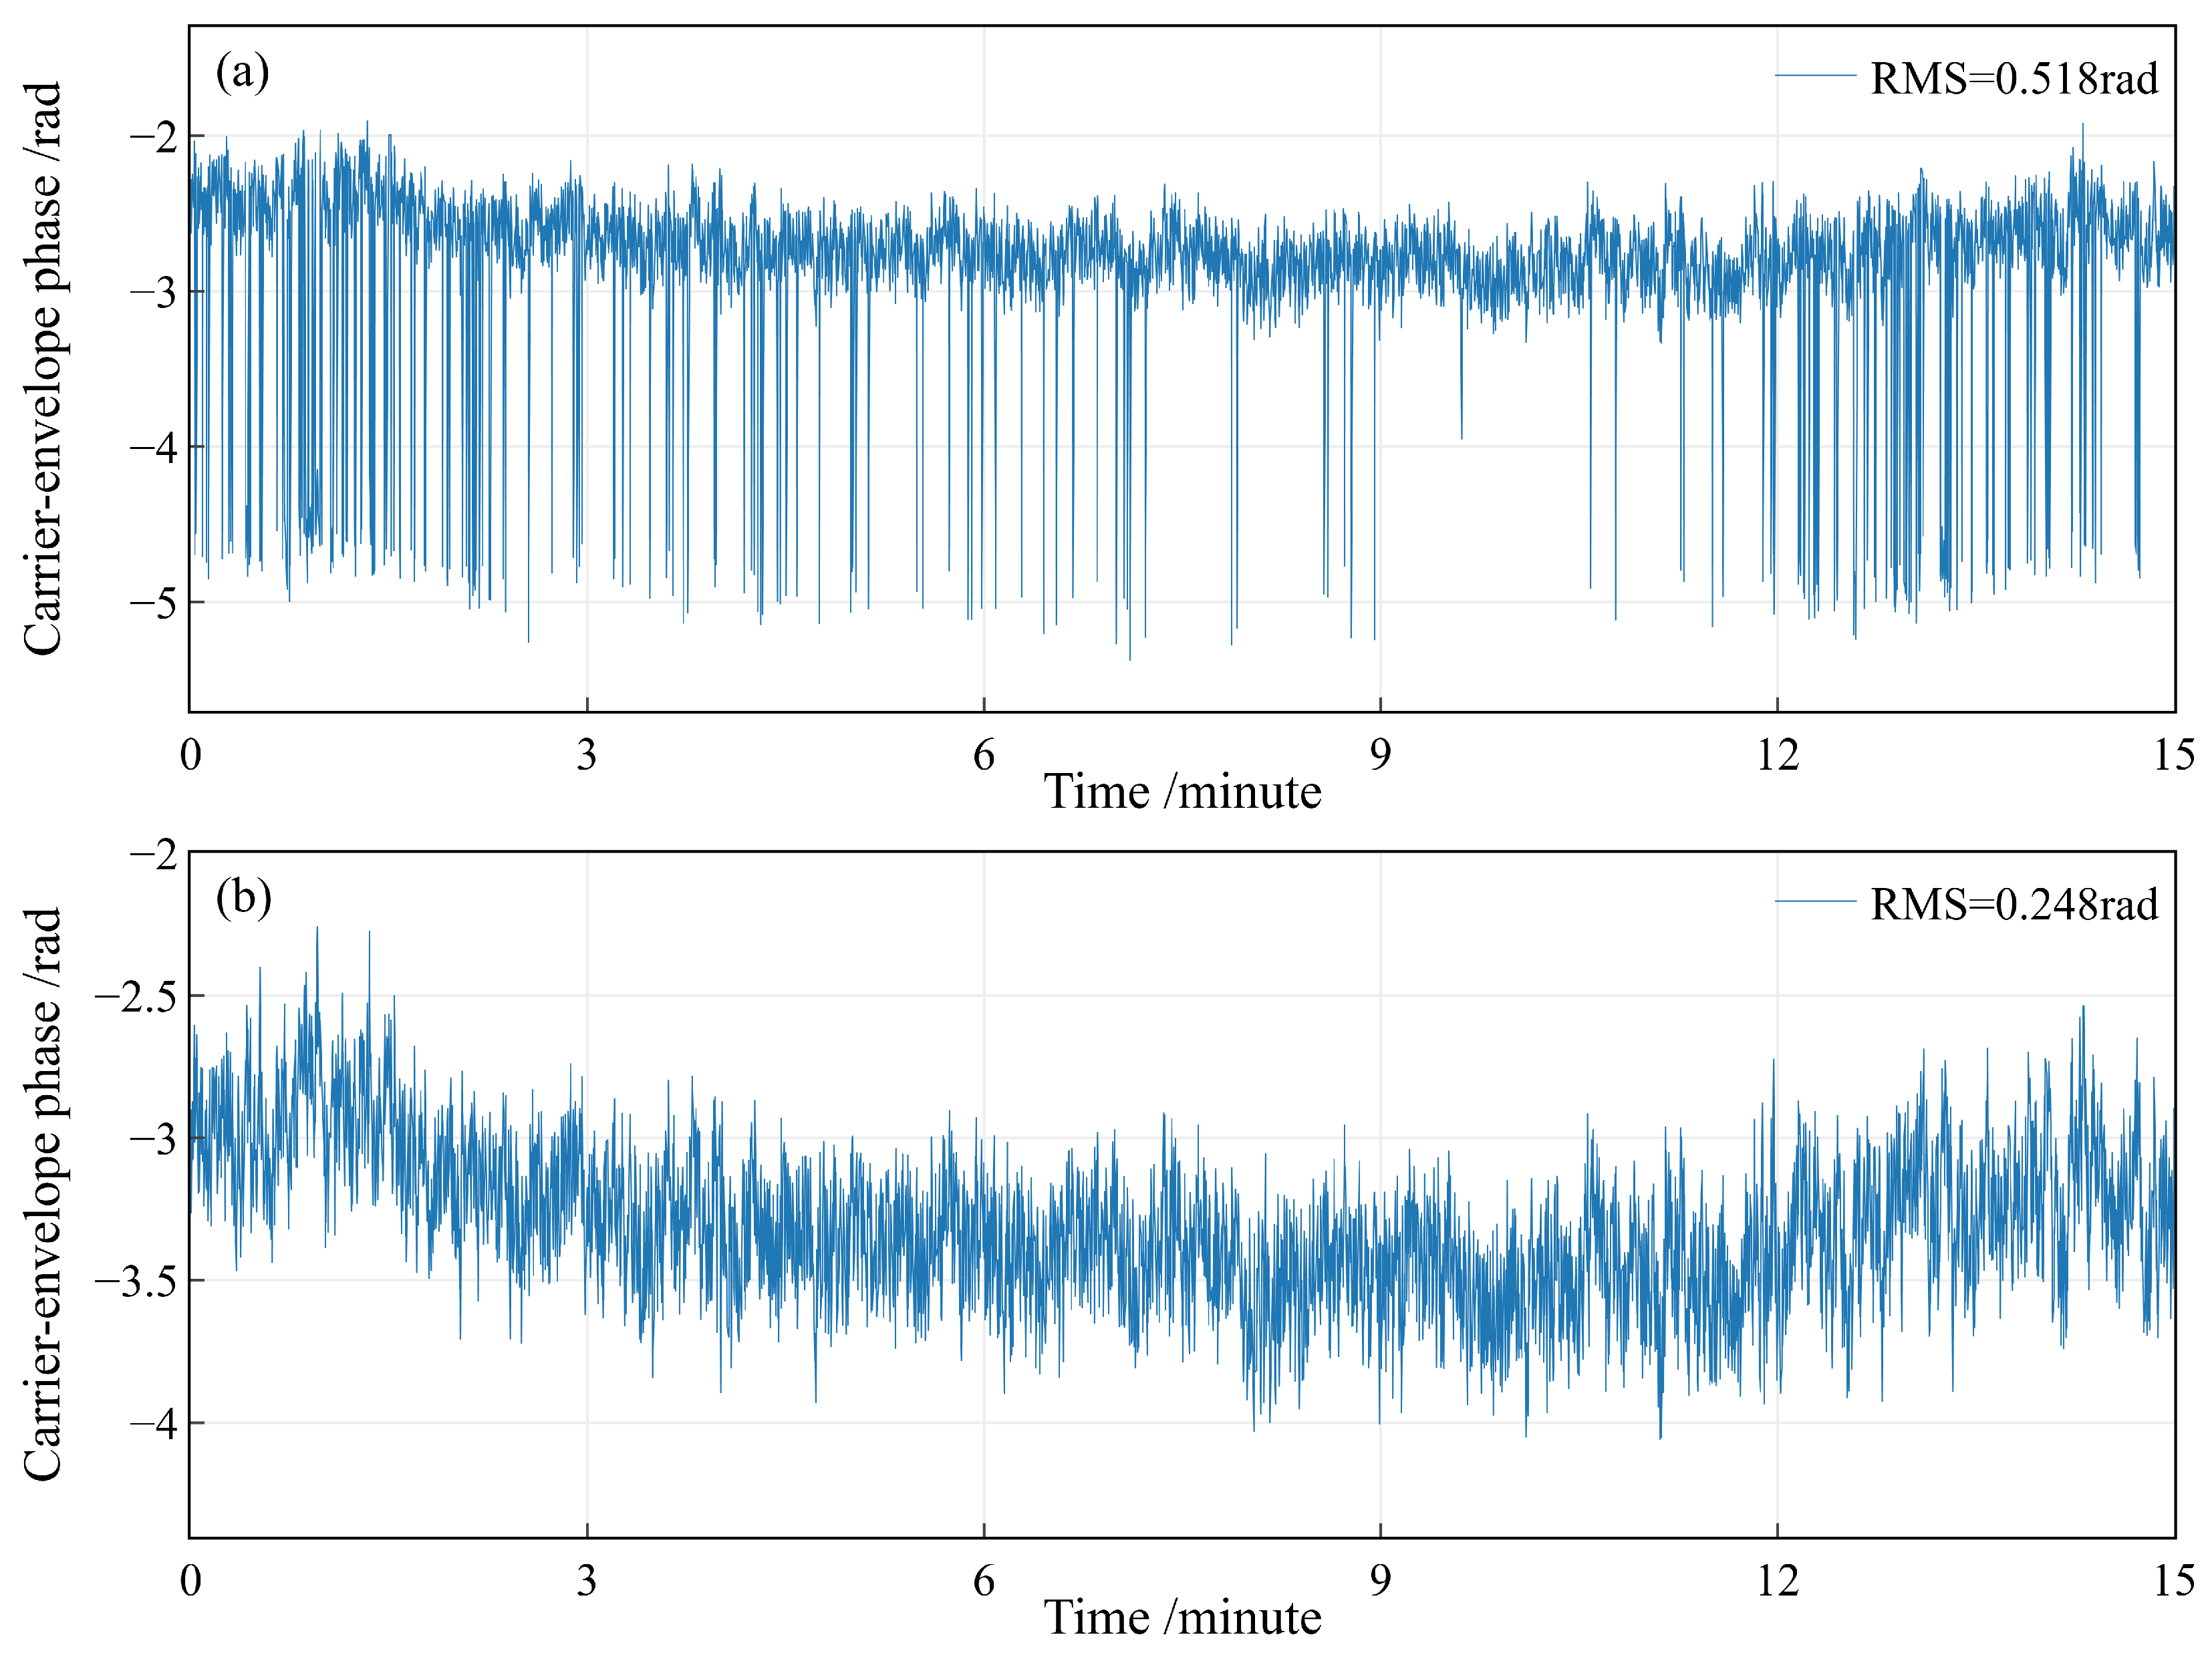
A comparison of the linear interpolation algorithm processing on the same set of spectral interference data over 15 min is shown in
Figure 7. As seen in
Figure 7a, the CEP measured without correction exhibits a large number of pseudo-peaks, with a jitter of 518 mrad (RMS), which is primarily caused by phase noise introduced by computational pseudo-peaks. After correction, as shown in
Figure 7b, the measured CEP pseudo-peaks are basically eliminated, the jitter is reduced to 248 mrad (RMS), and the measurement error is significantly decreased.
3.3. Numerical Accuracy Analysis via HIL Testing
To verify the reliability and calculation error of the algorithm, a Hardware-in-the-Loop (HIL) simulation testing system was designed. Stable spectral interference data, collected from a femtosecond pulse laser after CPA (Chirped Pulse Amplification), were used as test samples. For this spectral sequence, a mixed signal composed of a background CEP signal and a modulation signal was constructed as the input. A simulated data stream was generated using MATLAB, with its corresponding CEP sequence formed by the superposition of two components:
Background CEP signal: The CEP phase jitter extracted directly from the interference spectral data.
Modulation signal: A sinusoidal noise signal with known frequency, amplitude, and phase.
The simulated data stream is input to the FPGA processor in real-time via the Ethernet interface, and the result calculated by the master control algorithm,
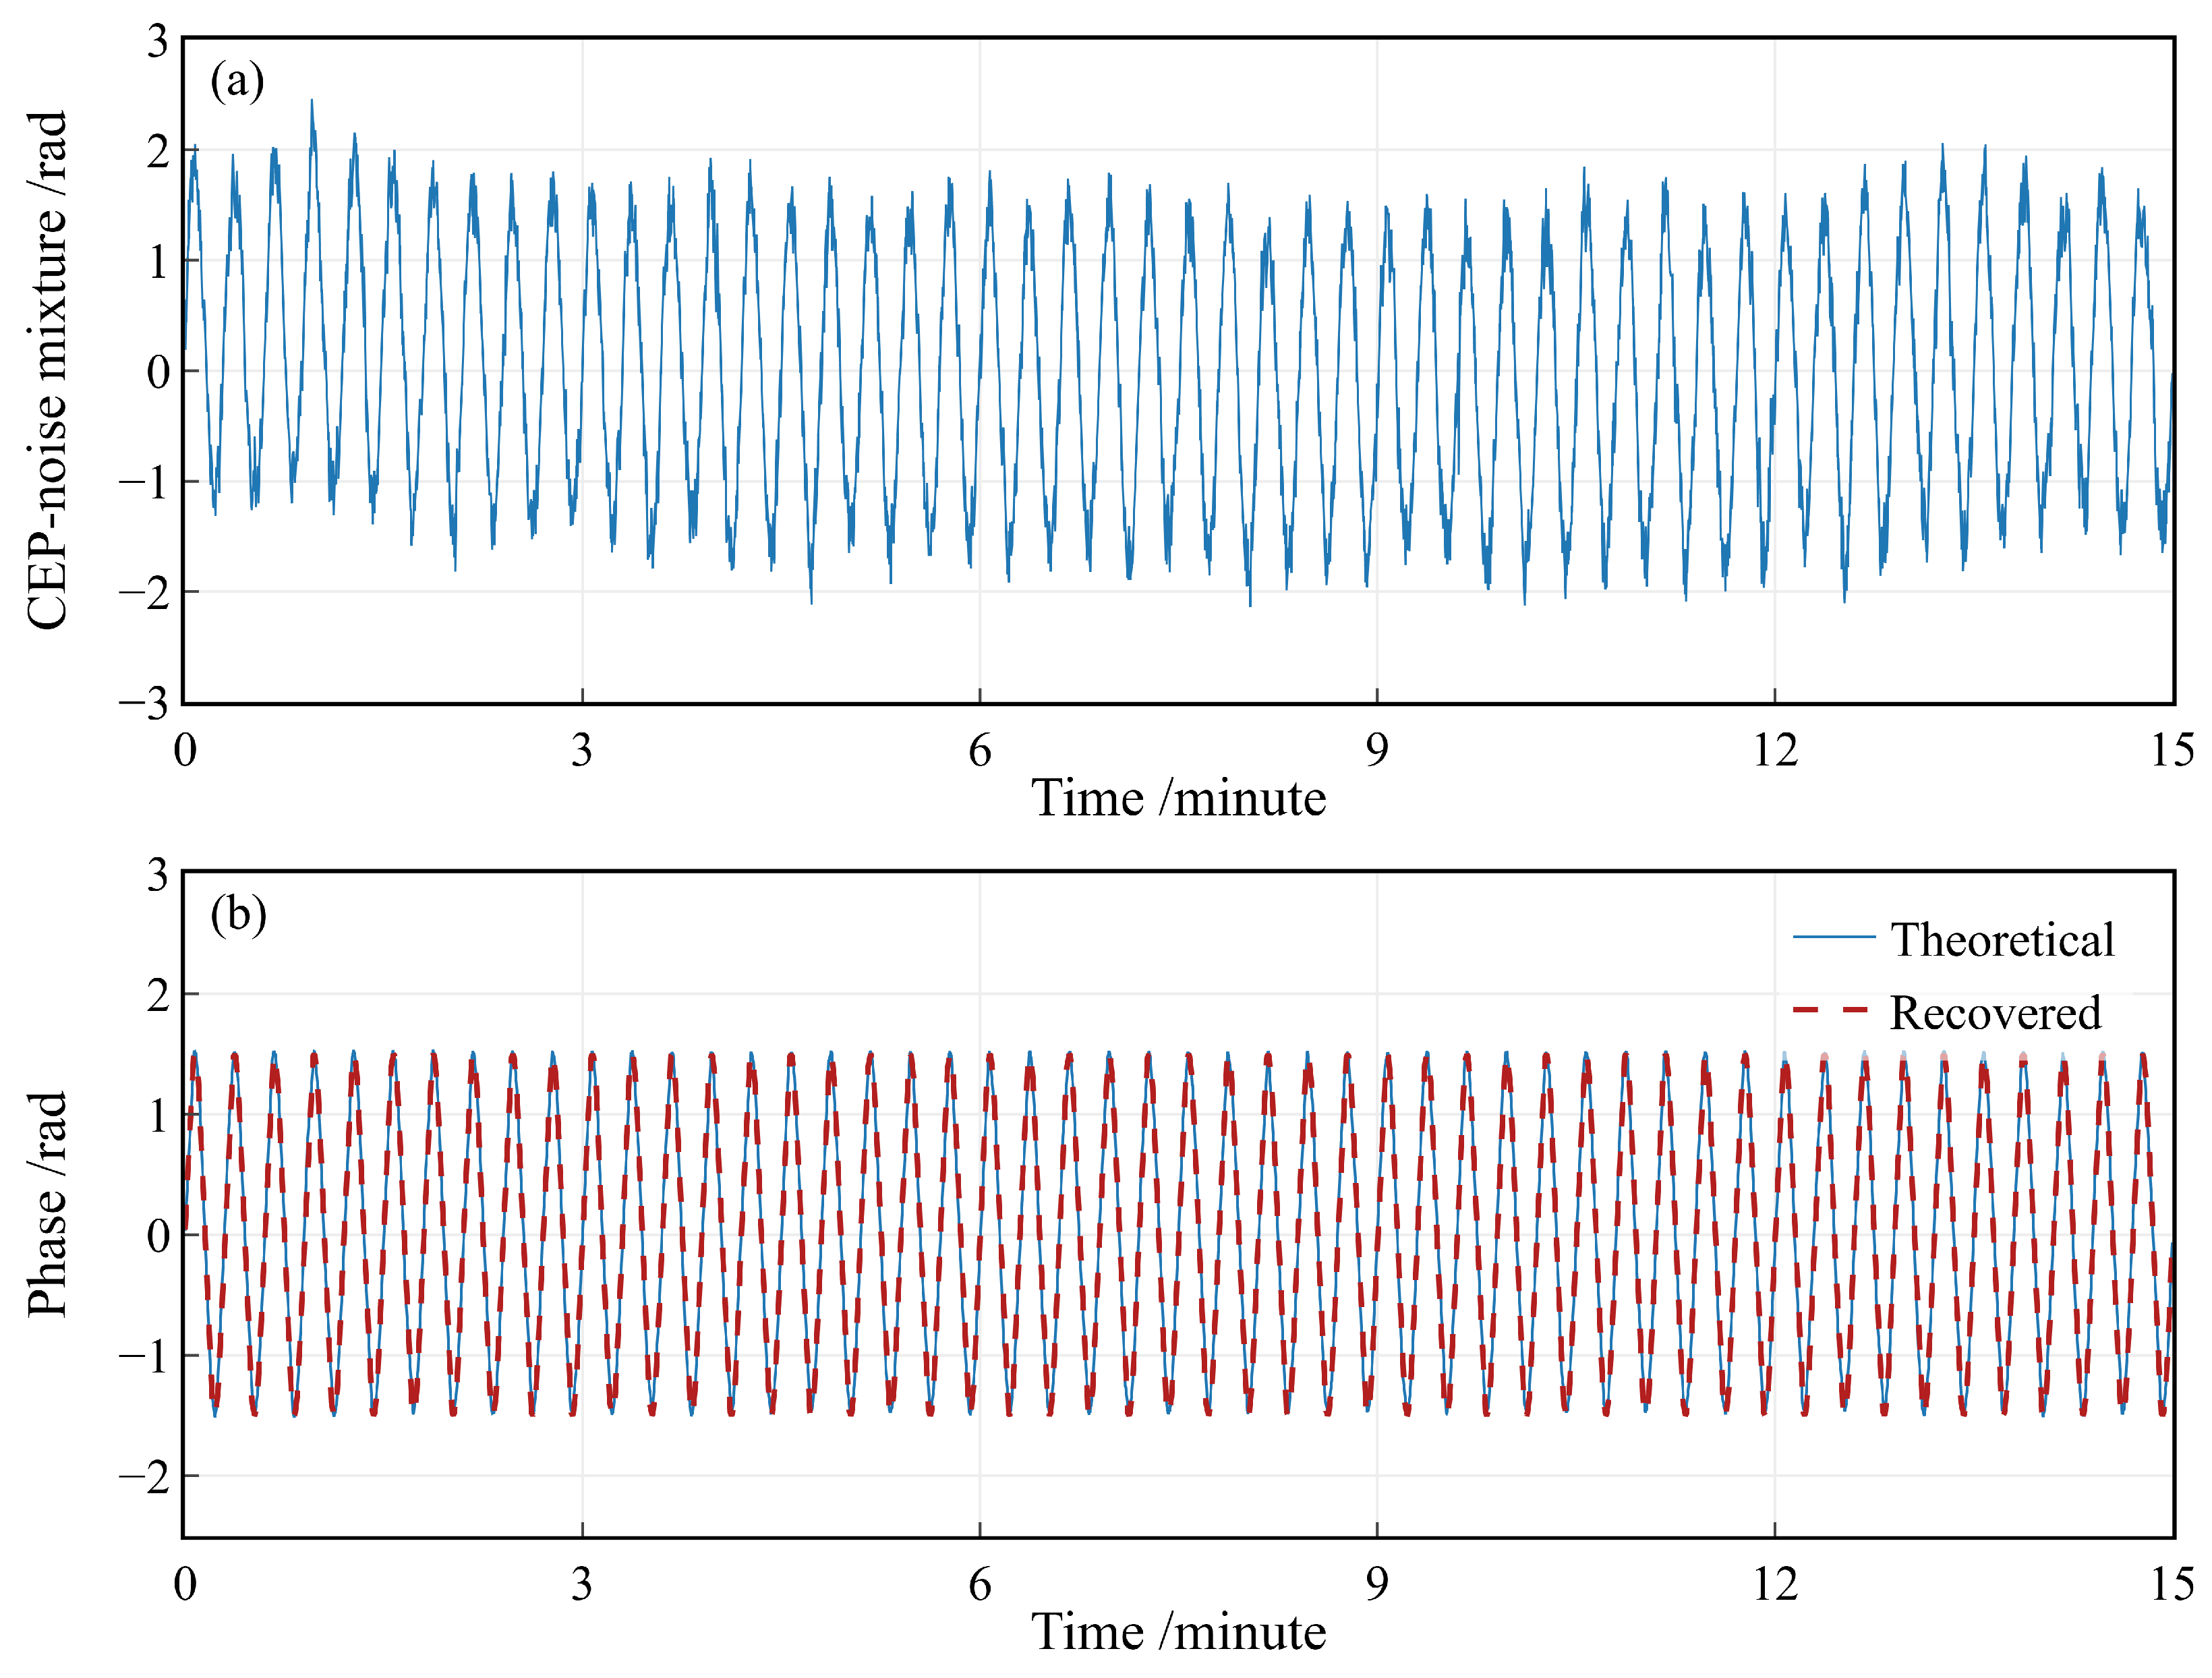
, is transmitted back to the host computer for comparative analysis. To verify the linearity of the system, the background CEP signal is removed from the FPGA measurement results to recover the superimposed sinusoidal signal. The results are shown in
Figure 8:
Figure 8a displays the superimposed simulated data stream signal. In
Figure 8b, The blue solid line represents the known theoretical modulation signal added, while the red dashed line represents the actual values extracted after removing the background CEP through algorithmic analysis. Comparing the extracted signal in
Figure 8b with the theoretical sine wave, the extracted actual values closely match the original injected theoretical sine wave in both amplitude and phase, indicating that the measurement result can be regarded as a linear superposition of the physical ground truth and a minute calculation error.
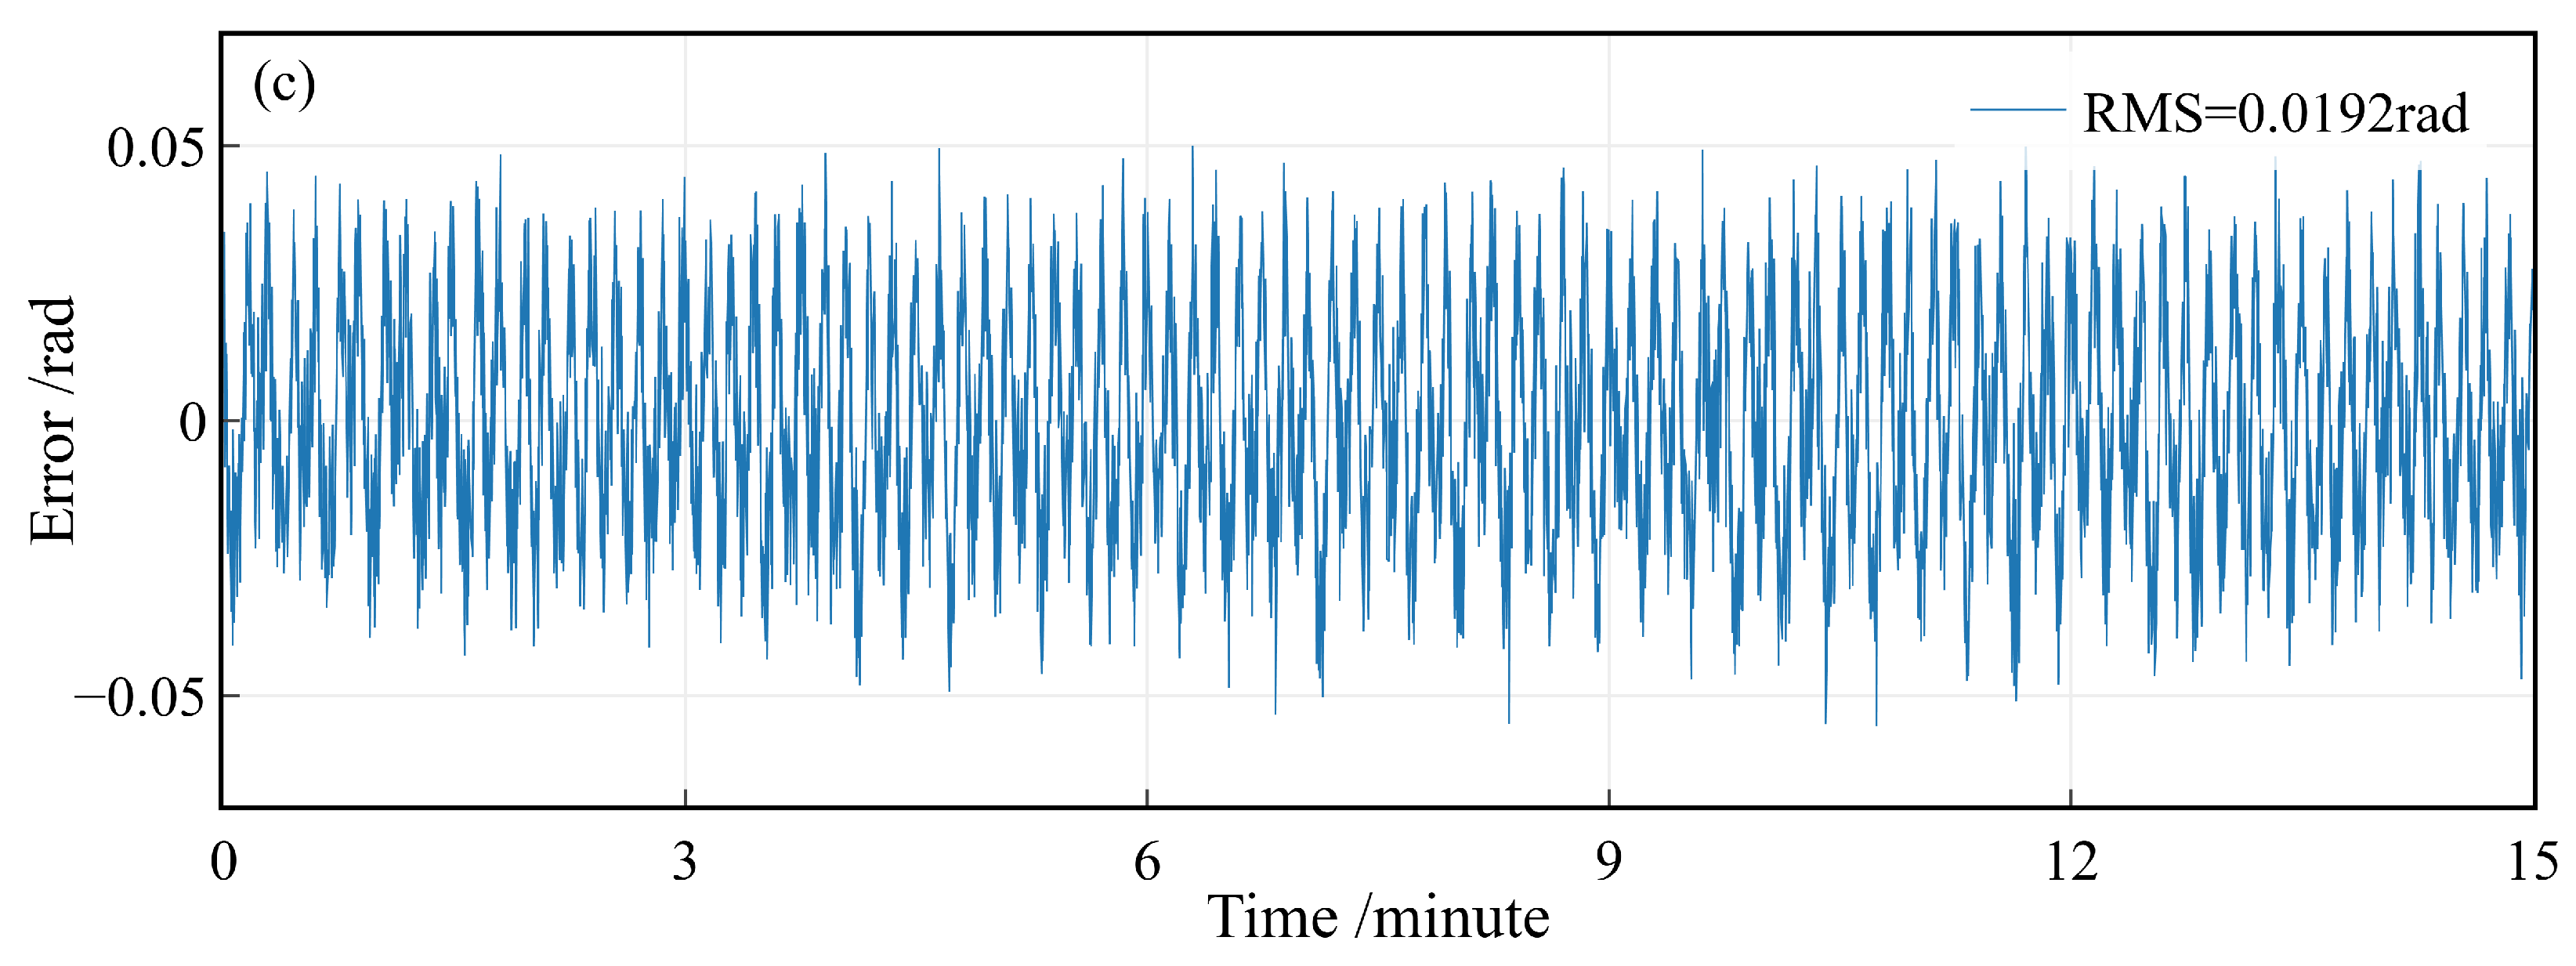
Figure 8c illustrates the final calculation error curve (i.e., the difference between the theoretical sine wave and the extracted signal). Through statistical analysis, the error exhibits minute fluctuations around zero, with a Root Mean Square (RMS) of approximately 25 mrad. The test results demonstrate that the calculation error introduced by the FPGA-based CEP measurement algorithm implementation and hardware fixed-point arithmetic (∼25 mrad) is far lower than the total jitter observed in actual laser systems (∼240 mrad). The hardware implementation of this design possesses high computational precision and meets the requirements for precision measurement.
3.4. System Latency and Real-Time Processing Capability
In addition to computational accuracy, the processing latency and throughput of the system are critical indicators that determine the feedback bandwidth for CEP locking. To verify the advantages of this FPGA processor in terms of real-time performance, we conducted a quantitative analysis of its timing performance.
The design adopts a fully pipelined hardware architecture, allowing data to flow continuously between processing modules without the need for instruction fetching, decoding, or context switching characteristic of CPU architectures. Through Post-Implementation Timing Simulation in the Vivado development environment at a clock frequency of 125 MHz, the end-to-end processing latency—from the valid input of spectral data to the valid output of the CEP phase result—was precisely determined. Experimental results show that the processing latency for spectral data consisting of 2136 pixels per frame is approximately 89 μs. This latency is hardware-deterministic. In addition, in computer simulation tests, the system was able to input and process data at 10 kfps, indicating that the system architecture can support CEP processing at up to 10 kHz. However, in the actual experiment, the Ocean FX spectrometer currently used can achieve only 3000–4500 fps under extreme conditions. Moreover, due to light passing through a slit, two mirrors, and a grating before reaching the sensor, some optical loss occurs. To ensure sufficient signal-to-noise ratio (SNR) of the interferometric spectrum, the integration time was set to 1 ms, which limits the system throughput to this rate. In future CEP stabilization experiments, a line-scan camera based on Camera Link will be used to replace the spectrometer, further unleashing the designed throughput capability of the system.
Table 2 compares the performance of the present FPGA solution with other approaches.
4. Conclusions
This work addresses issues in carrier-envelope phase (CEP) measurement for 10 kHz high-repetition-rate femtosecond laser amplification systems—including non-uniform sampling distortion, high processing latency in traditional schemes, and insufficient real-time performance—by developing and implementing a high-performance FPGA-based real-time processing system. The method first analyzes the physical mechanism of spectral interferometry, and a hardware resampling module based on linear interpolation is designed inside the FPGA to map the spectral data in real time to a uniform frequency domain, eliminating spurious peaks in the FFT calculation. Combined with a fully pipelined architecture, this enables complete hardware-accelerated processing from acquisition and resampling to phase extraction.
In hardware-in-the-loop (HIL) simulation tests, the computational accuracy of the processor was verified by injecting known sinusoidal modulation signals and background noise. The results show that the proposed algorithm possesses high precision when processing complex spectral signals. The root-mean-square (RMS) value of the calculation error for the extracted CEP signal is approximately 25 mrad, and this intrinsic error is significantly lower than the CEP jitter of the laser amplification system itself.
In the practical application of 10 kHz femtosecond laser CEP measurement, the high-speed CEP hardware implemented in this work was tested. From the acquired continuous spectral interferometric data, the algorithm achieved stable extraction of the CEP phase. The processing latency from spectrometer input to CEP calculation was below 100 μs, demonstrating good real-time performance and determinism. This effectively addresses the challenge of single-shot measurement in high-repetition-rate laser systems and provides core technical support for achieving high-bandwidth CEP stabilization.