Article

The Influence of Supercritical CO2 Displacement at Different Temperatures on Porosity and Permeability Evolution in Marine Unconsolidated Strata


1
College of Engineering, China University of Geosciences (Wuhan), Wuhan 430074, China
2
Chinese Academy of Geological Sciences, Beijing 100037, China
3
Institute of Exploration Techniques, Chinese Academy of Geological Sciences, Tianjin 300300, China
4
College of Construction Engineering, Jilin University, Changchun 130000, China
*
Author to whom correspondence should be addressed.
Appl. Sci. 2026, 16(3), 1507; https://doi.org/10.3390/app16031507
Submission received: 20 December 2025 / Revised: 28 January 2026 / Accepted: 30 January 2026 / Published: 2 February 2026

Abstract

CO2 geological sequestration in marine sediment is one of the important ways to lower carbon emissions. To study the influence of CO2 sequestration on the permeability and porosity of unconsolidated strata, this paper conducted overpressure permeability, isothermal adsorption and CO2 displacement experiments. Through nuclear magnetic resonance (NMR) technology, the effects of supercritical CO2 (SCO2) at different temperatures on the permeability evolution and pore size variation of unstratified strata in marine hydrate reservoirs were studied. The experimental results show that: (1) When the pressure changed from 0 to 17.5 MPa, the permeability and porosity of the soil samples decreased sharply. The porosity dropped from 36.83% to 16.07%, and the permeability also decreased from 48.53 mD to 1.18 mD. (2) During the adsorption tests, the fitted absolute adsorption capacity of CO2 and CH4 gradually increased with pressure growth. The maximum fitted absolute adsorption capacity of CO2 was 2.45 times that of CH4. (3) Through displacement experiments, the porosity and permeability increments during SCO2 displacement were much greater than those during non-SCO2 displacement. From 30 °C to 70 °C, the increments of porosity and permeability all increased. After SCO2 displacement, the pores’ proportions (>0.1 μm) increased for all samples, with the largest growth rate reaching 34.37%. Above all, these results indicate that environmental pressure significantly affects the permeability of soil samples, and that SCO2 displacement can effectively enhance the proportion of large-sized pores, thereby further improving the permeability of unconsolidated strata.

1. Introduction

In recent years, the excessive use of fossil fuels has led to a gradual increase in atmospheric CO2 levels. In 2023, global emissions reached 37 billion tons, with the annual average CO2 concentration rising to 419 ppm, nearly 50% higher than pre-industrial levels [1,2,3]. Against the backdrop of global warming and increasingly frequent extreme weather events, reducing carbon emissions and enhancing carbon sequestration have become urgent priorities [4,5]. Currently, the geological storage of CO2 in underground reservoirs stands as a crucial measure to reverse the worsening trend of global climate change and as one of the most effective methods for lowering atmospheric carbon dioxide concentrations [6].
Among these, CO2-Enhanced Oil Recovery (CO2-EOR) technology can enhance recovery rates while simultaneously achieving CO2 sequestration, thereby fulfilling carbon reduction objectives [7,8,9]. This technology has undergone large-scale trials and industrial applications in oil and gas fields across multiple countries. CO2-EOR technology was first field-tested in North America. Particularly in Texas’ Permian Basin, dozens of large-scale CO2-EOR projects have been implemented since the 1970s. By 2020, over 140 CO2-EOR projects were operational or under trial in the United States, with cumulative injection exceeding 1 × 10⁸ tons and annual crude oil production increases reaching millions of barrels [10]. In addition, the Weyburn Oilfield Project is a typical joint demonstration initiative in Canada for CO2-EOR and carbon sequestration. Since 2000, it has injected industrial CO2 tail gas from North Dakota, USA, achieving the dual objectives of enhanced oil recovery and stable carbon sequestration [11]. In Europe, Norway’s Sleipner gas field became the first project to inject CO2 on a large scale into deep saline aquifers for storage. Although its primary objective was not to enhance oil and gas recovery, it demonstrated the technical feasibility and storage safety for subsequent CO2-enhanced oil recovery projects [12,13,14]. Given the favorable economic and environmental benefits achieved by CO2-EOR, a method of CO2 displacement for extracting natural gas hydrates has been proposed [15,16], and numerous scholars have conducted many related studies. In 1993, Ebinuma et al. [17] first proposed the theoretical concept of utilizing CO2 displacement technology for natural gas hydrate extraction. Subsequently, Ohgaki et al. [18] experimentally demonstrated the technical feasibility of the CH4/CO2 displacement method for gas hydrate extraction in 1996. Pandey et al. [19] conducted comparative analyses of CO2 displacement characteristics for CH4 hydrates in pure water systems, confirming that increasing the contact area between hydrates and CO2 could significantly enhance displacement rates and efficiency. Furthermore, Ota et al. [20] observed via in-situ Raman spectroscopy that even after 307 h of displacement reaction, 65% of CH4 molecules remained trapped within the hydrate cage, yielding a displacement efficiency of only 35%. Zhang’s research group [21] innovatively proposed a combined extraction method integrating CO2 displacement with thermal stimulation, successfully increasing the CH4/CO2 displacement efficiency to 64.63%. However, current research indicates that the CO2 displacement of natural gas hydrates proceeds at a relatively low speed and with low efficiency, failing to meet industrial application requirements [22,23].
To address the challenges of poor permeability and low efficiency in CO2–hydrate displacement in marine silty clay reservoirs, CO2 displacement experiments were conducted using remolded soil samples under confining pressure to simulate seafloor condition. In this research, SCO2 at different temperatures (from 30 °C to 80 °C) was sequentially injected into saturated water-saturated soil samples. Using NMR technology, the evolution of soil sample permeability and porosity at different displacement temperatures was investigated. This result will provide an optimized approach for further research on the efficiency of SCO2–hydrate displacement in marine unconsolidated strata.

2. Experiments

2.1. Experimental Materials

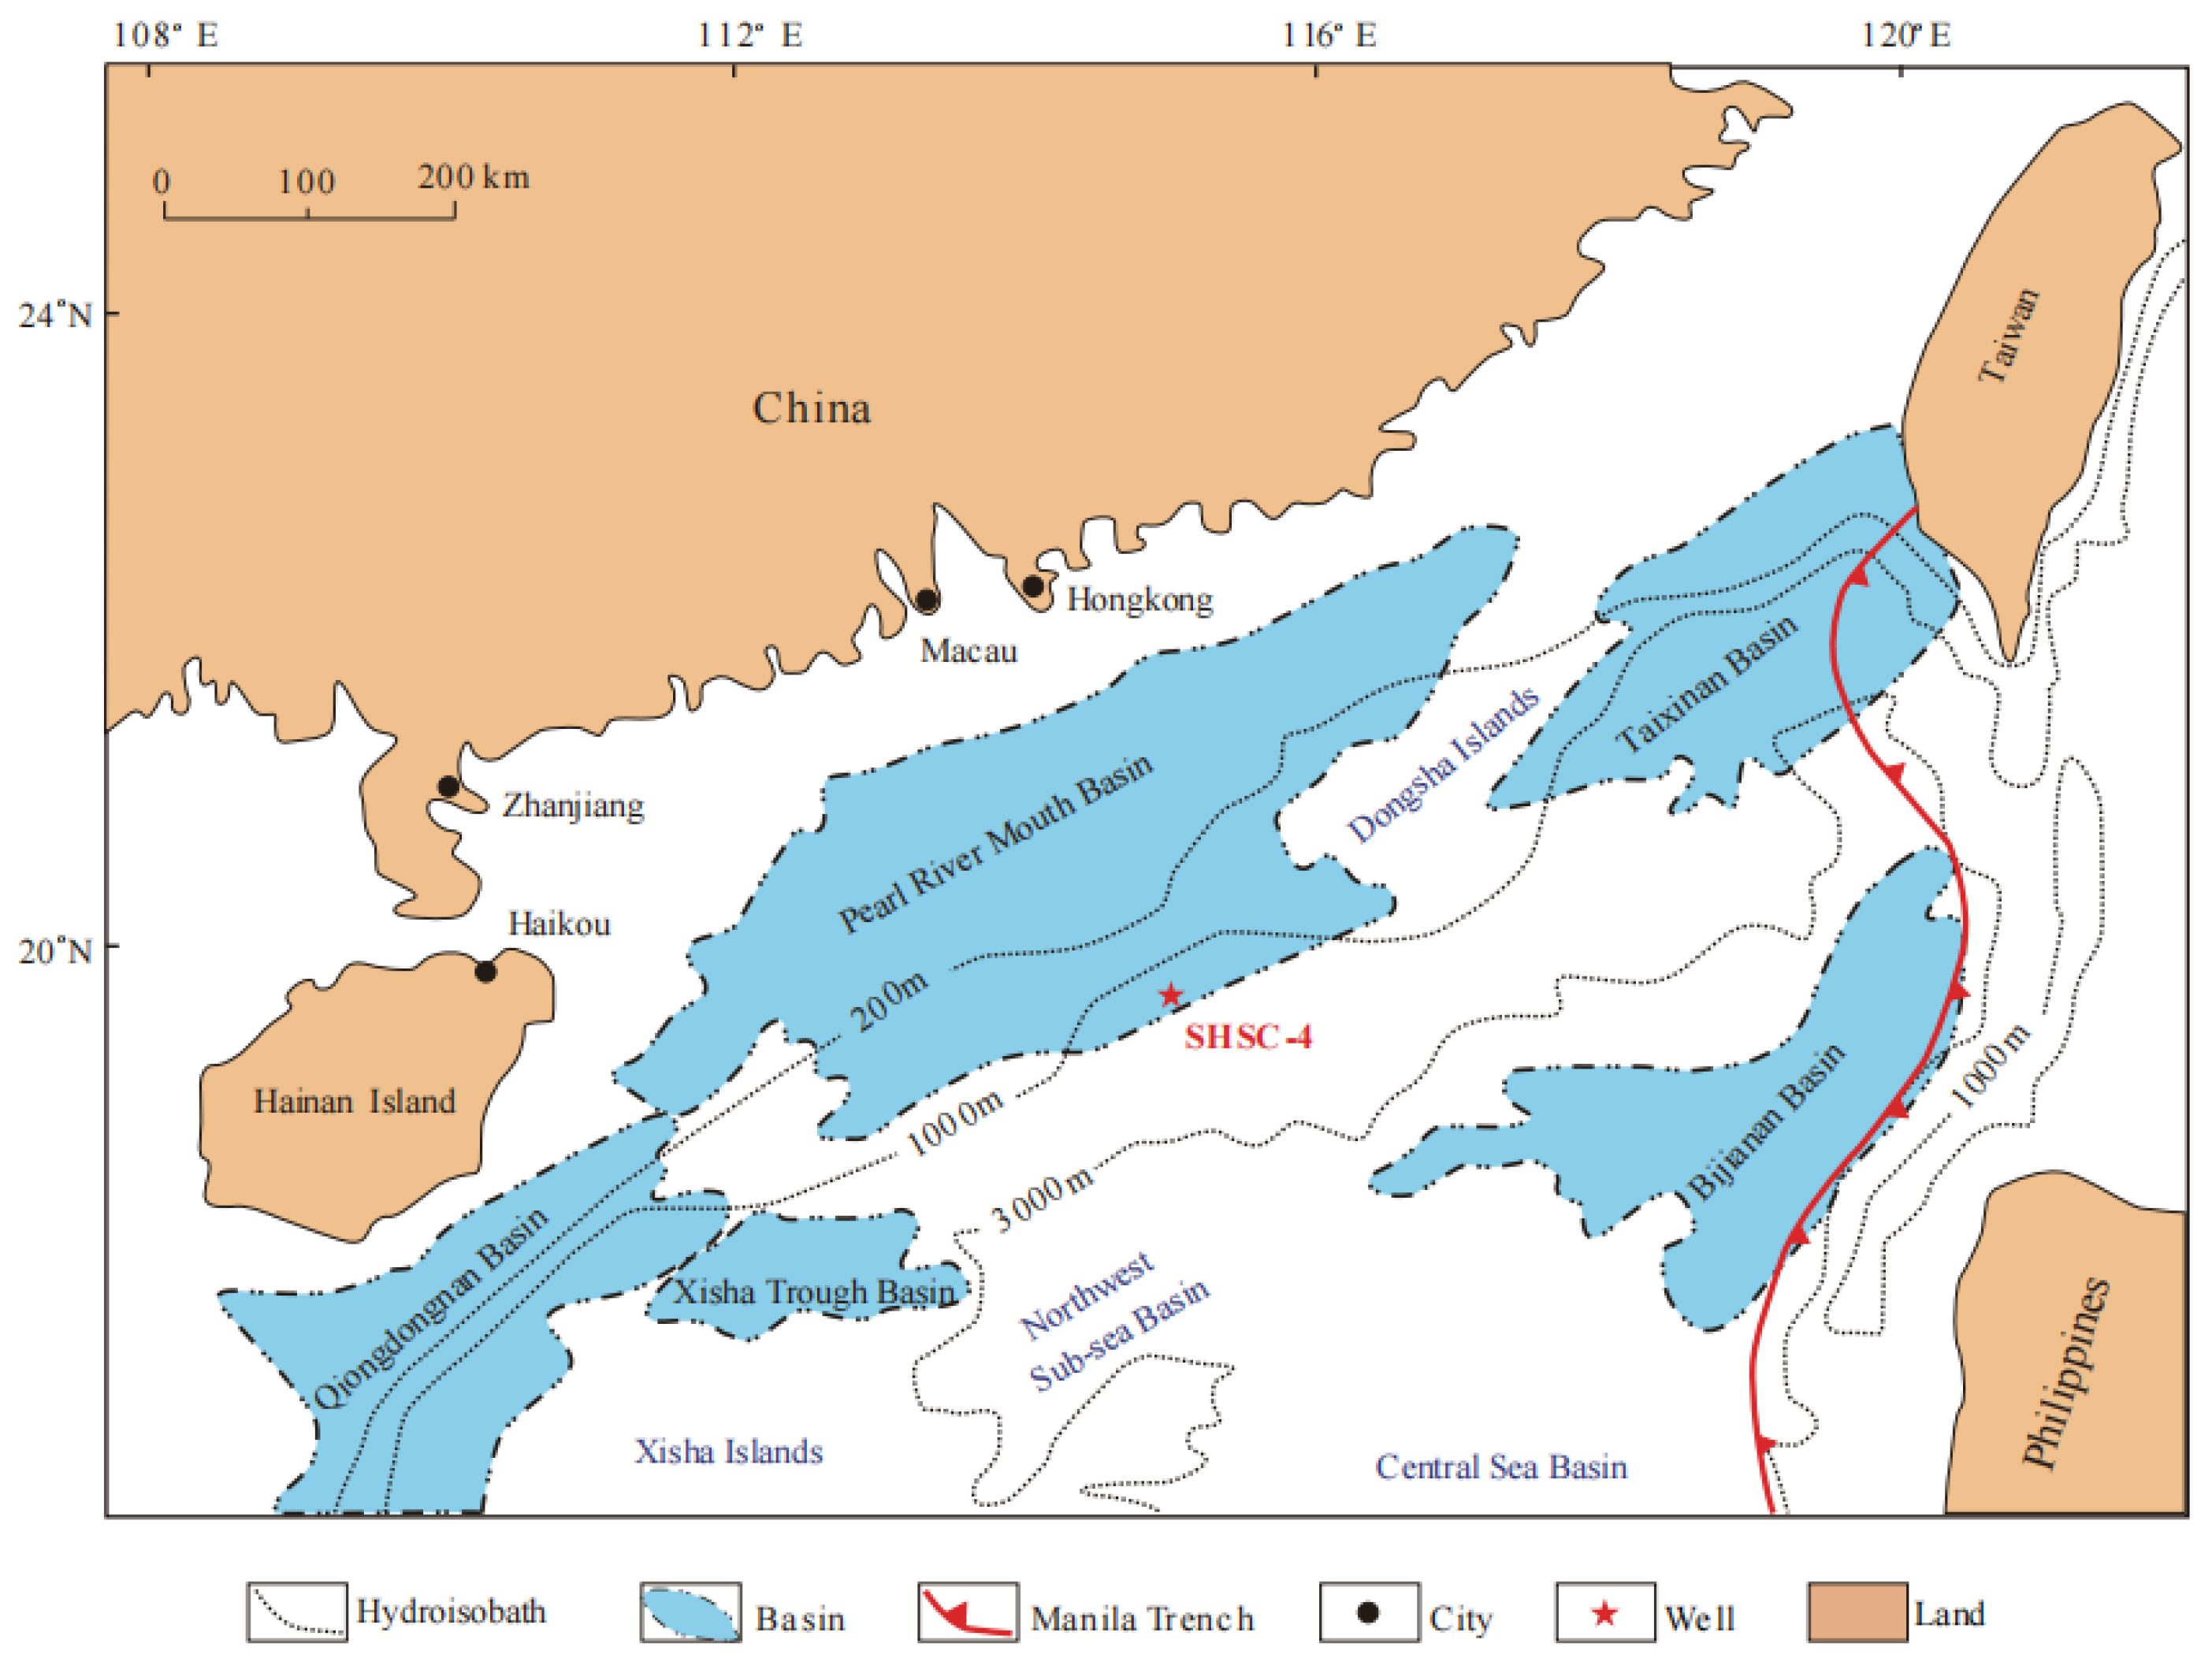
The study area was located in the Pearl River Mouth Basin, which is situated on the continental shelf in the Northern part of South China Sea (in Figure 1) [24]. It is a Middle and Cenozoic basin developed on the basis of a Mesozoic active continental margin basement structure. Marine gas hydrate reservoirs are mainly located in unconsolidated sedimentary strata beneath the seafloor at the continental margin [25,26]. The seabed temperature is mostly between 2 °C and 4 °C, with a geothermal gradient of 44 to 67 °C/km [27]. The pressure on the seabed is generally greater than 10 MPa. This stratum is essentially a low-permeability, mechanically weak sedimentary body with extremely low mechanical strength. Its formation resulted from the combined effects of specific temperature–pressure conditions and sedimentary dynamics, exhibiting characteristics of unconsolidated rock, low permeability, and the coexistence of gas hydrates.
To study its characteristics, several core samples from unconsolidated strata were taken, and detailed tests on these samples were conducted. The results are shown in Table 1. The density of soil samples was found to be 1.61 g/cm3. Moreover, it exhibited extremely low permeability and was highly friable, presenting a non-consolidated state. The oxide content of the sampled soil was tested using XRF, and the particle size of soil was measured using a laser particle size analyzer. There was a large amount of SiO2, Al2O3 and CaO in the target stratum (as shown in Table 2), with the particle size mainly ranging from 0.4 to 400 μm. Among them, D10 was 3.673 μm, D30 was 14.98 μm, D50 was 48.30 μm, and D60 was 66.11 μm. This soil sample was determined to be silty clay based on the particle size gradation distribution. In addition, the gas permeability of the soil sample was 17.19 mD, with a porosity of 44.27%, which fell within the data range for the porosity and permeability of hydrate reservoirs in the South China Sea [28]. Although the pore structure of remolded soil samples may differ from that of the in-situ samples, it still could, to some extent, reflect the characteristics of original soil samples.
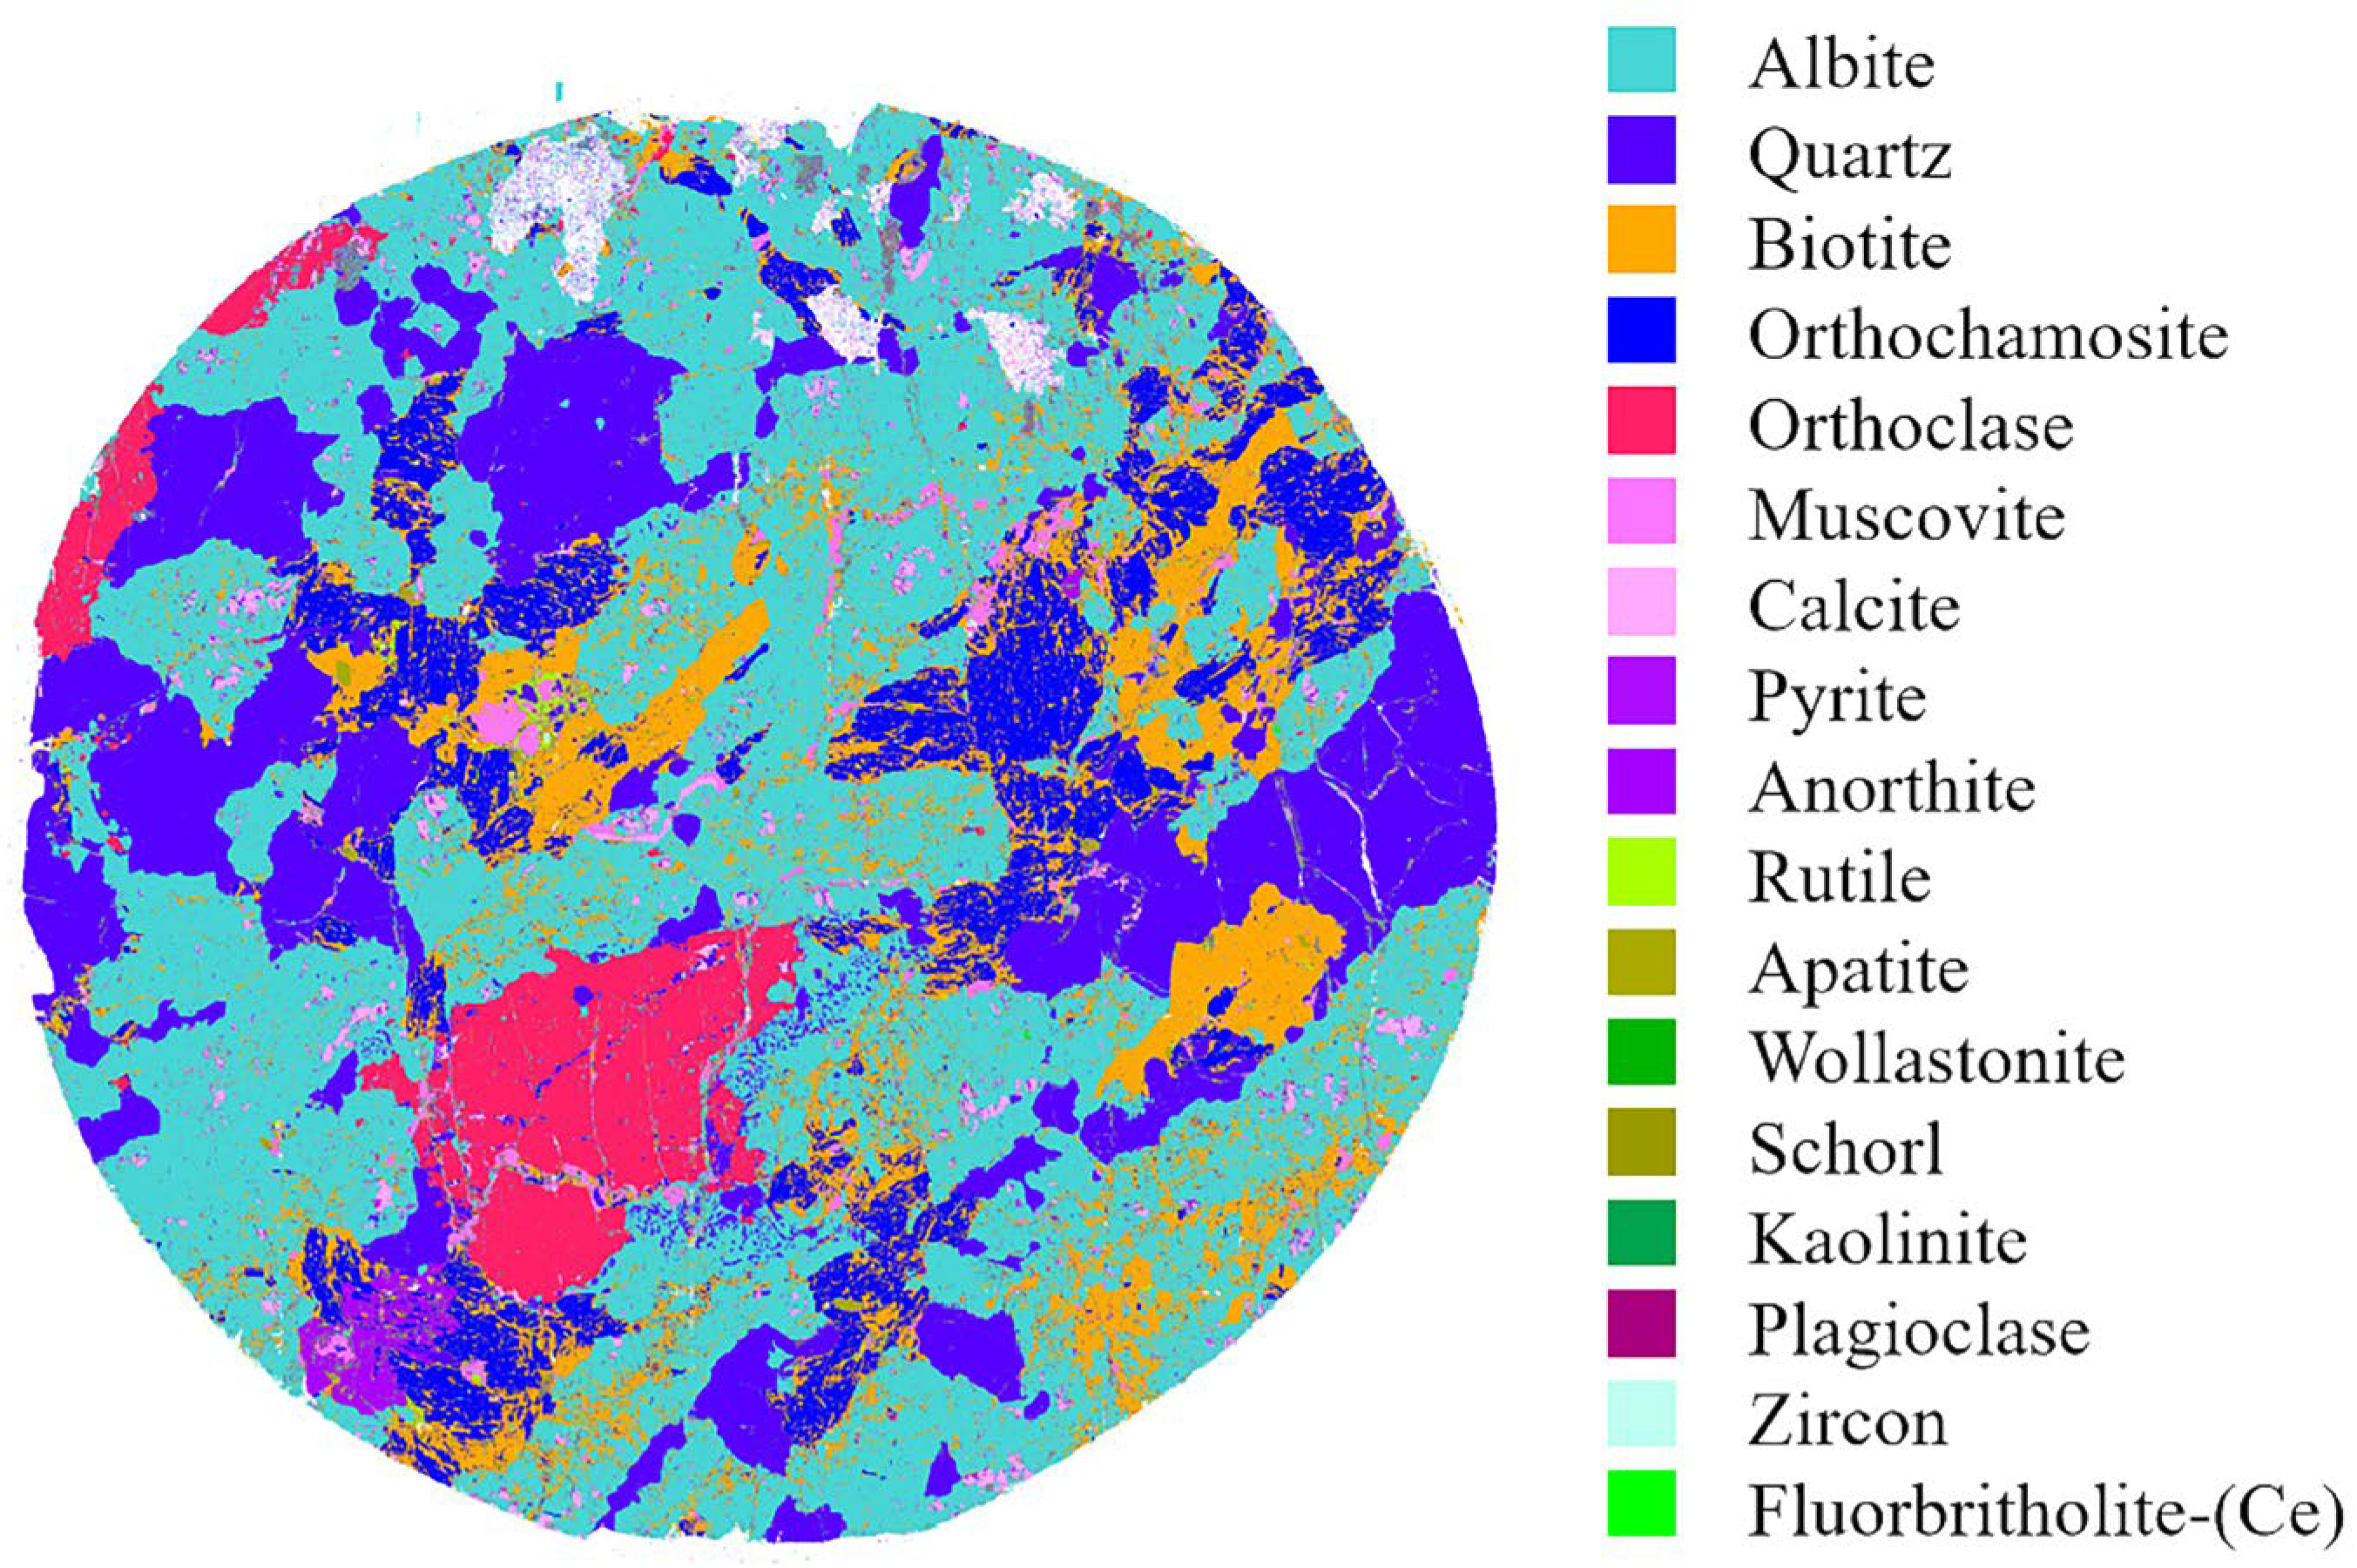
Due to the difficulty in preserving in-situ hydrate soil samples, remade soil samples were prepared using soil from hydrate reservoirs to study the CO2 displacement effects. The diameter of reconstructed soil samples was 2.5 cm and the height was 6.0 cm. Energy-dispersive X-ray spectroscopy (EDS) was performed on the remolded soils to determine their elemental composition and precise mineralogical information. The specific results were presented in Table 3 and Figure 2, where oxygen constituted the largest proportion at 47.17%, followed by sodic feldspar at 41.70%.

2.2. Experimental Setup

The experimental samples were scanned using an NMR scanner provided by Suzhou Tainiu Testing Service Co., Ltd. (Suzhou, China), with an effective maximum core size measurement capacity of Φ 25.4 mm × H 60 mm.
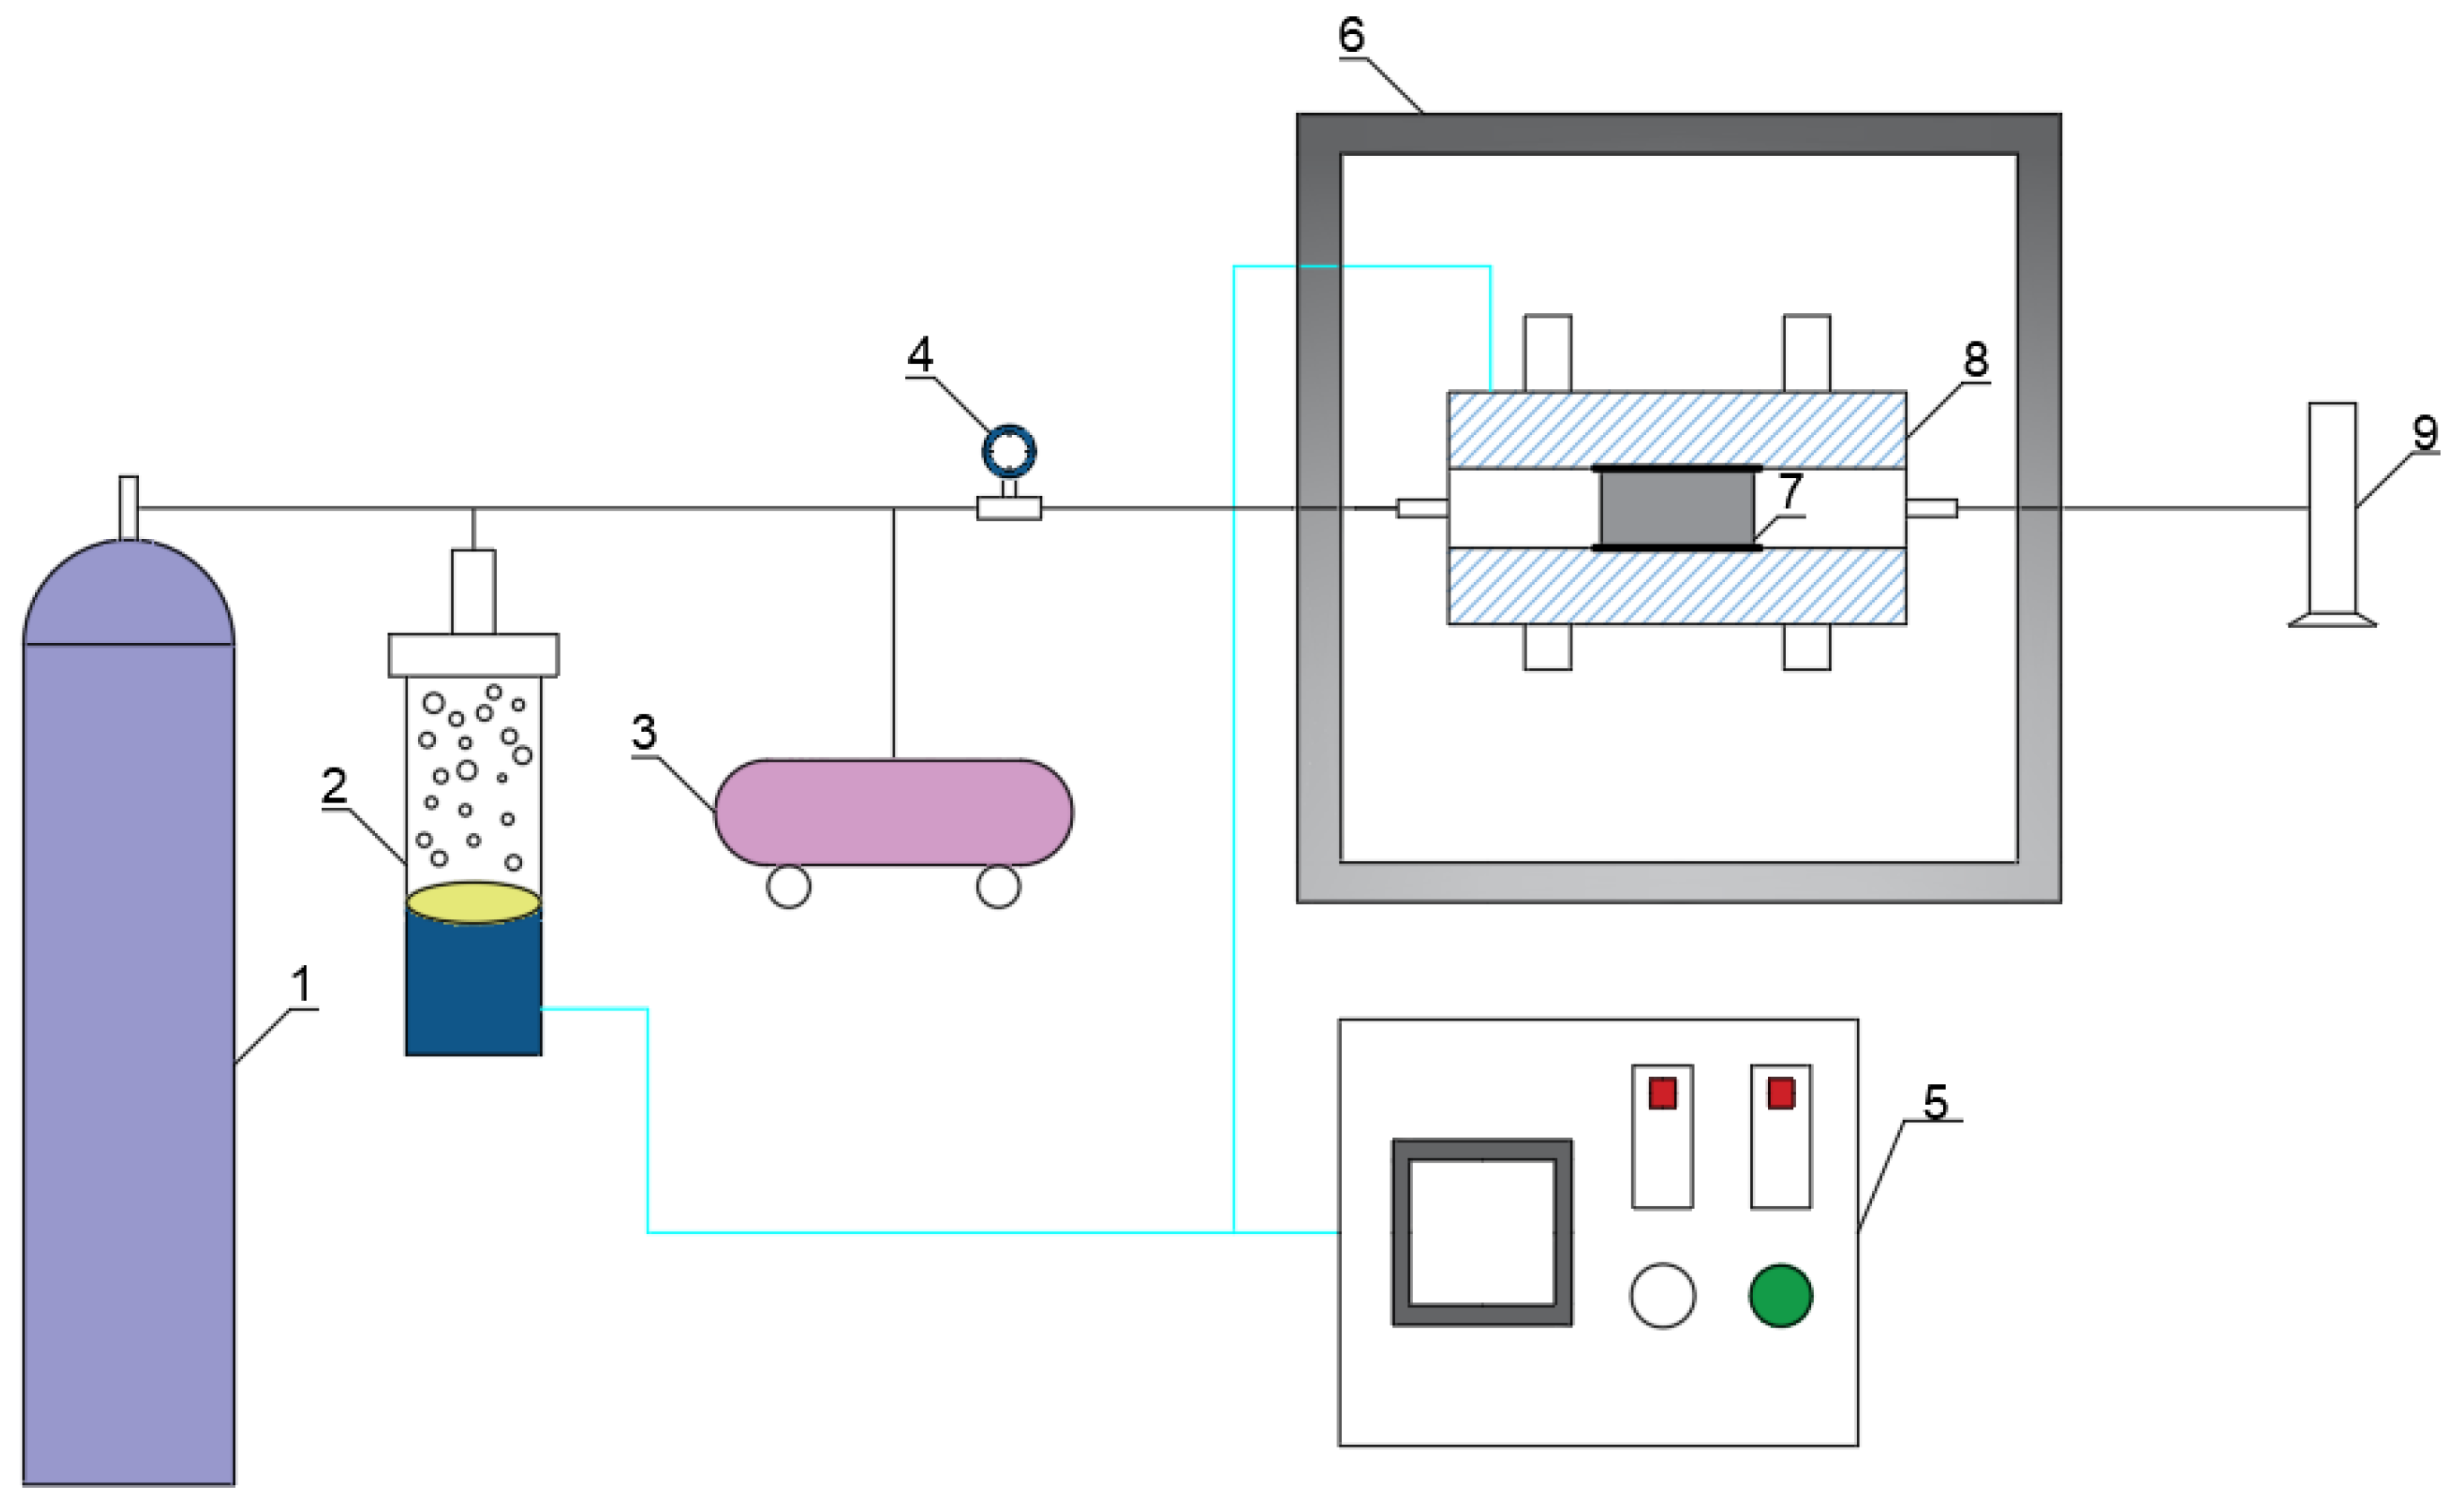
The CO2 displacement test system consisted primarily of a carbon dioxide cylinder, a CO2 pressurization device, a pressure sensor, a confining pressure control device (with a maximum confining pressure of 22 MPa), a temperature control cabinet, soil samples, a clamper and a water collector. The clamper constitutes the central component of this test apparatus, serving to mechanically secure the core within a sealed chamber. It employs a hydraulic system to simulate the confining pressure of underground reservoirs, thereby preventing fluid leakage from the sides of the core. In this system, the intermediate container pressurized CO2 to 8 MPa. Furthermore, the temperature control cabinet heated CO2 to reach the supercritical state. The confining pressure control device produced and maintained confining pressure using water. A diagram of the experimental system is shown in Figure 3.

2.3. Experimental Processes

(1) Overburden permeability tests were conducted on the soil samples obtained from marine unconsolidated sediments at ambient temperature (25 °C). The test pressures ranged from 0.0 to 17.5 MPa. The porosity and permeability of the reconstructed soil samples was measured under different pressures. Additionally, isothermal adsorption tests of CO2 and CH4 were carried out at ambient temperature to evaluate their adsorption capacities, with pressures ranging from 0 to 25 MPa.
(2) CO2 displacement experiments were conducted at different temperatures, with injection temperatures at 30 °C, 40 °C, 50 °C, 60 °C, 70 °C, and 80 °C. To simulate the temperature and pressure conditions of subsea sediment samples, the confining pressure was set at 10 MPa, with a CO2 injection pressure of 8 MPa. CO2 at temperatures exceeding 31.1 °C and pressures exceeding 7.38 MPa is classified as supercritical CO2 [29]. For comparison, non-supercritical CO2 was injected at 6 MPa and 25 °C. The test parameters are detailed in Table 4. The CO2 used in all experiments was of commercial grade with a purity of 99.95% to ensure the accuracy and reproducibility of the results. The detailed procedures were as follows:
① Sample Preparation: Reconstituted soil specimens were prepared according to displacement test specifications, based on measured in-situ soil density and moisture content. The specimens were sealed using a combination of heat-shrink tubing and spacers to prevent deformation or fragmentation during subsequent displacement procedures. Their initial weights (M1) were determined using an electronic balance with a precision of 0.1 mg.
② Vacuum water retention and T2 measurement: The sample was immersed in deionised water and placed in a vacuum water saturation apparatus at −0.1 MPa for 10 h. After saturation, the sample (M2) was reweighed. The water-saturated sample was wrapped with PTFE tape to prevent water loss and contamination of the nuclear magnetic resonance (NMR) probe. Subsequently, the sample was placed in the NMR system for scanning. The porosity and permeability was measured using Equation (1). The primary CPMG sequences sampled by the NMR system were as follows: Spectral Width (SW) = 200 KHz, Wait Time (TW) = 3000 ms, and Number of Scans (NS) = 16.
1 T 2 1 T 2 S = ρ 2 · S V
where T2 denotes transverse relaxation time, ms; T2S is the surface relaxation time, ms; ρ 2 is the surface relaxation rate, μm/ms; and S/V is the ratio of surface area to the volume of the pores, μm−1.
③ Clamper preheating: First, a dummy core matching the sample dimensions was inserted into the clamper to prevent damage to the inner sleeve from high temperatures during preheating. Subsequently, the clamper containing the dummy core was placed within the temperature control system and heated for 20 min to ensure the interior reached and maintained the set test temperature, thereby establishing constant thermal conditions for subsequent sample testing.
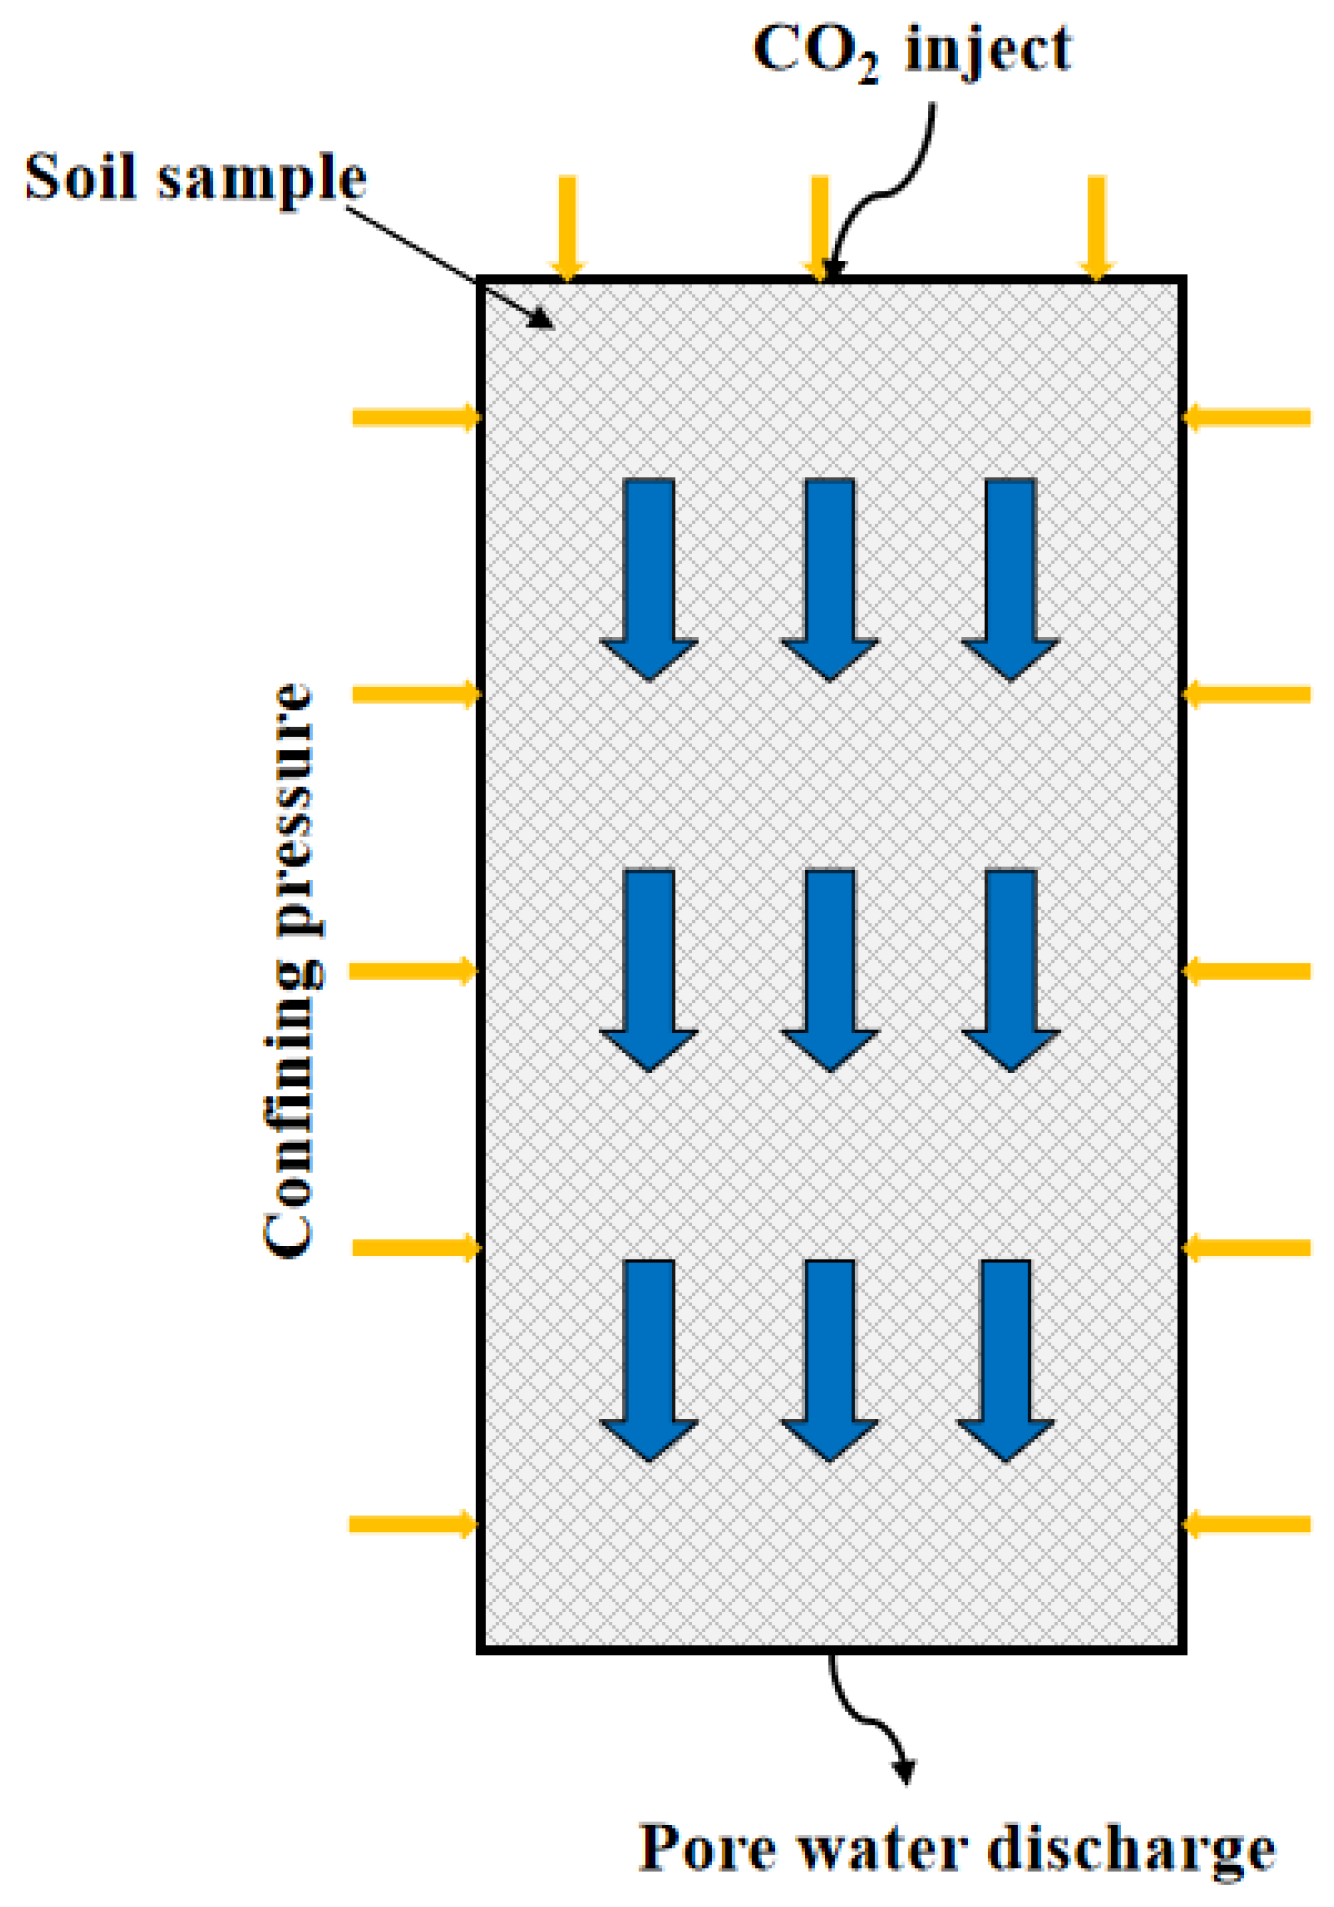
④ SCO2 displacement: The preheated clamper was removed, the dummy core was replaced with the actual saturated soil sample, and it was reinserted into the temperature control system. The CO2 pressurization device was connected. As the section of the SCO2 pipeline passing through the temperature control system had already reached the preset temperature prior to entering the sample, no additional heating of the SCO2 was required. Displacement experiments were conducted on the saturated soil sample at various temperatures using the displacement system, maintaining a confining pressure of 10 MPa throughout. A continuous SCO2 injection was maintained for a displacement duration of 4 h. At the outset of the experiment, continuous water discharge was observed at the outlet end of the apparatus. As displacement progressed, bubbles gradually appeared in the outlet fluid. The injection process of SCO2 is illustrated in Figure 4.
⑤ Vacuum water retention and T2 measurement: Following displacement, the sample was placed back into the vacuum water saturation apparatus and subjected to saturation treatment at −0.1 MPa for 10 h to ensure complete saturation of the internal pore space. Subsequently, NMR testing was conducted to obtain porosity and permeability data. The sample was weighed again (M3).
⑥ Weight porosity was calculated using Equation (2). Then, the weight porosity was compared with NMR porosity to verify the accuracy of NMR porosity.
The weighting porosity of the soil sample after displacement was calculated according to Equation (2), as follows:
n 1 = M 2 M 1 V n 2 = M 3 M 1 V
where n1 denotes the porosity of soil samples before displacement, %; n2 denotes the porosity of saturated soil samples after displacement, %; M1 is the mass of the original reconstructed soil sample, g; M2 is the mass of the saturated reconstructed soil sample before displacement, g; M3 is the mass of the saturated soil sample after displacement, g; and V is the volume of the soil sample, cm3.

3. Results and Discussion

3.1. Overpressure Permeability Tests

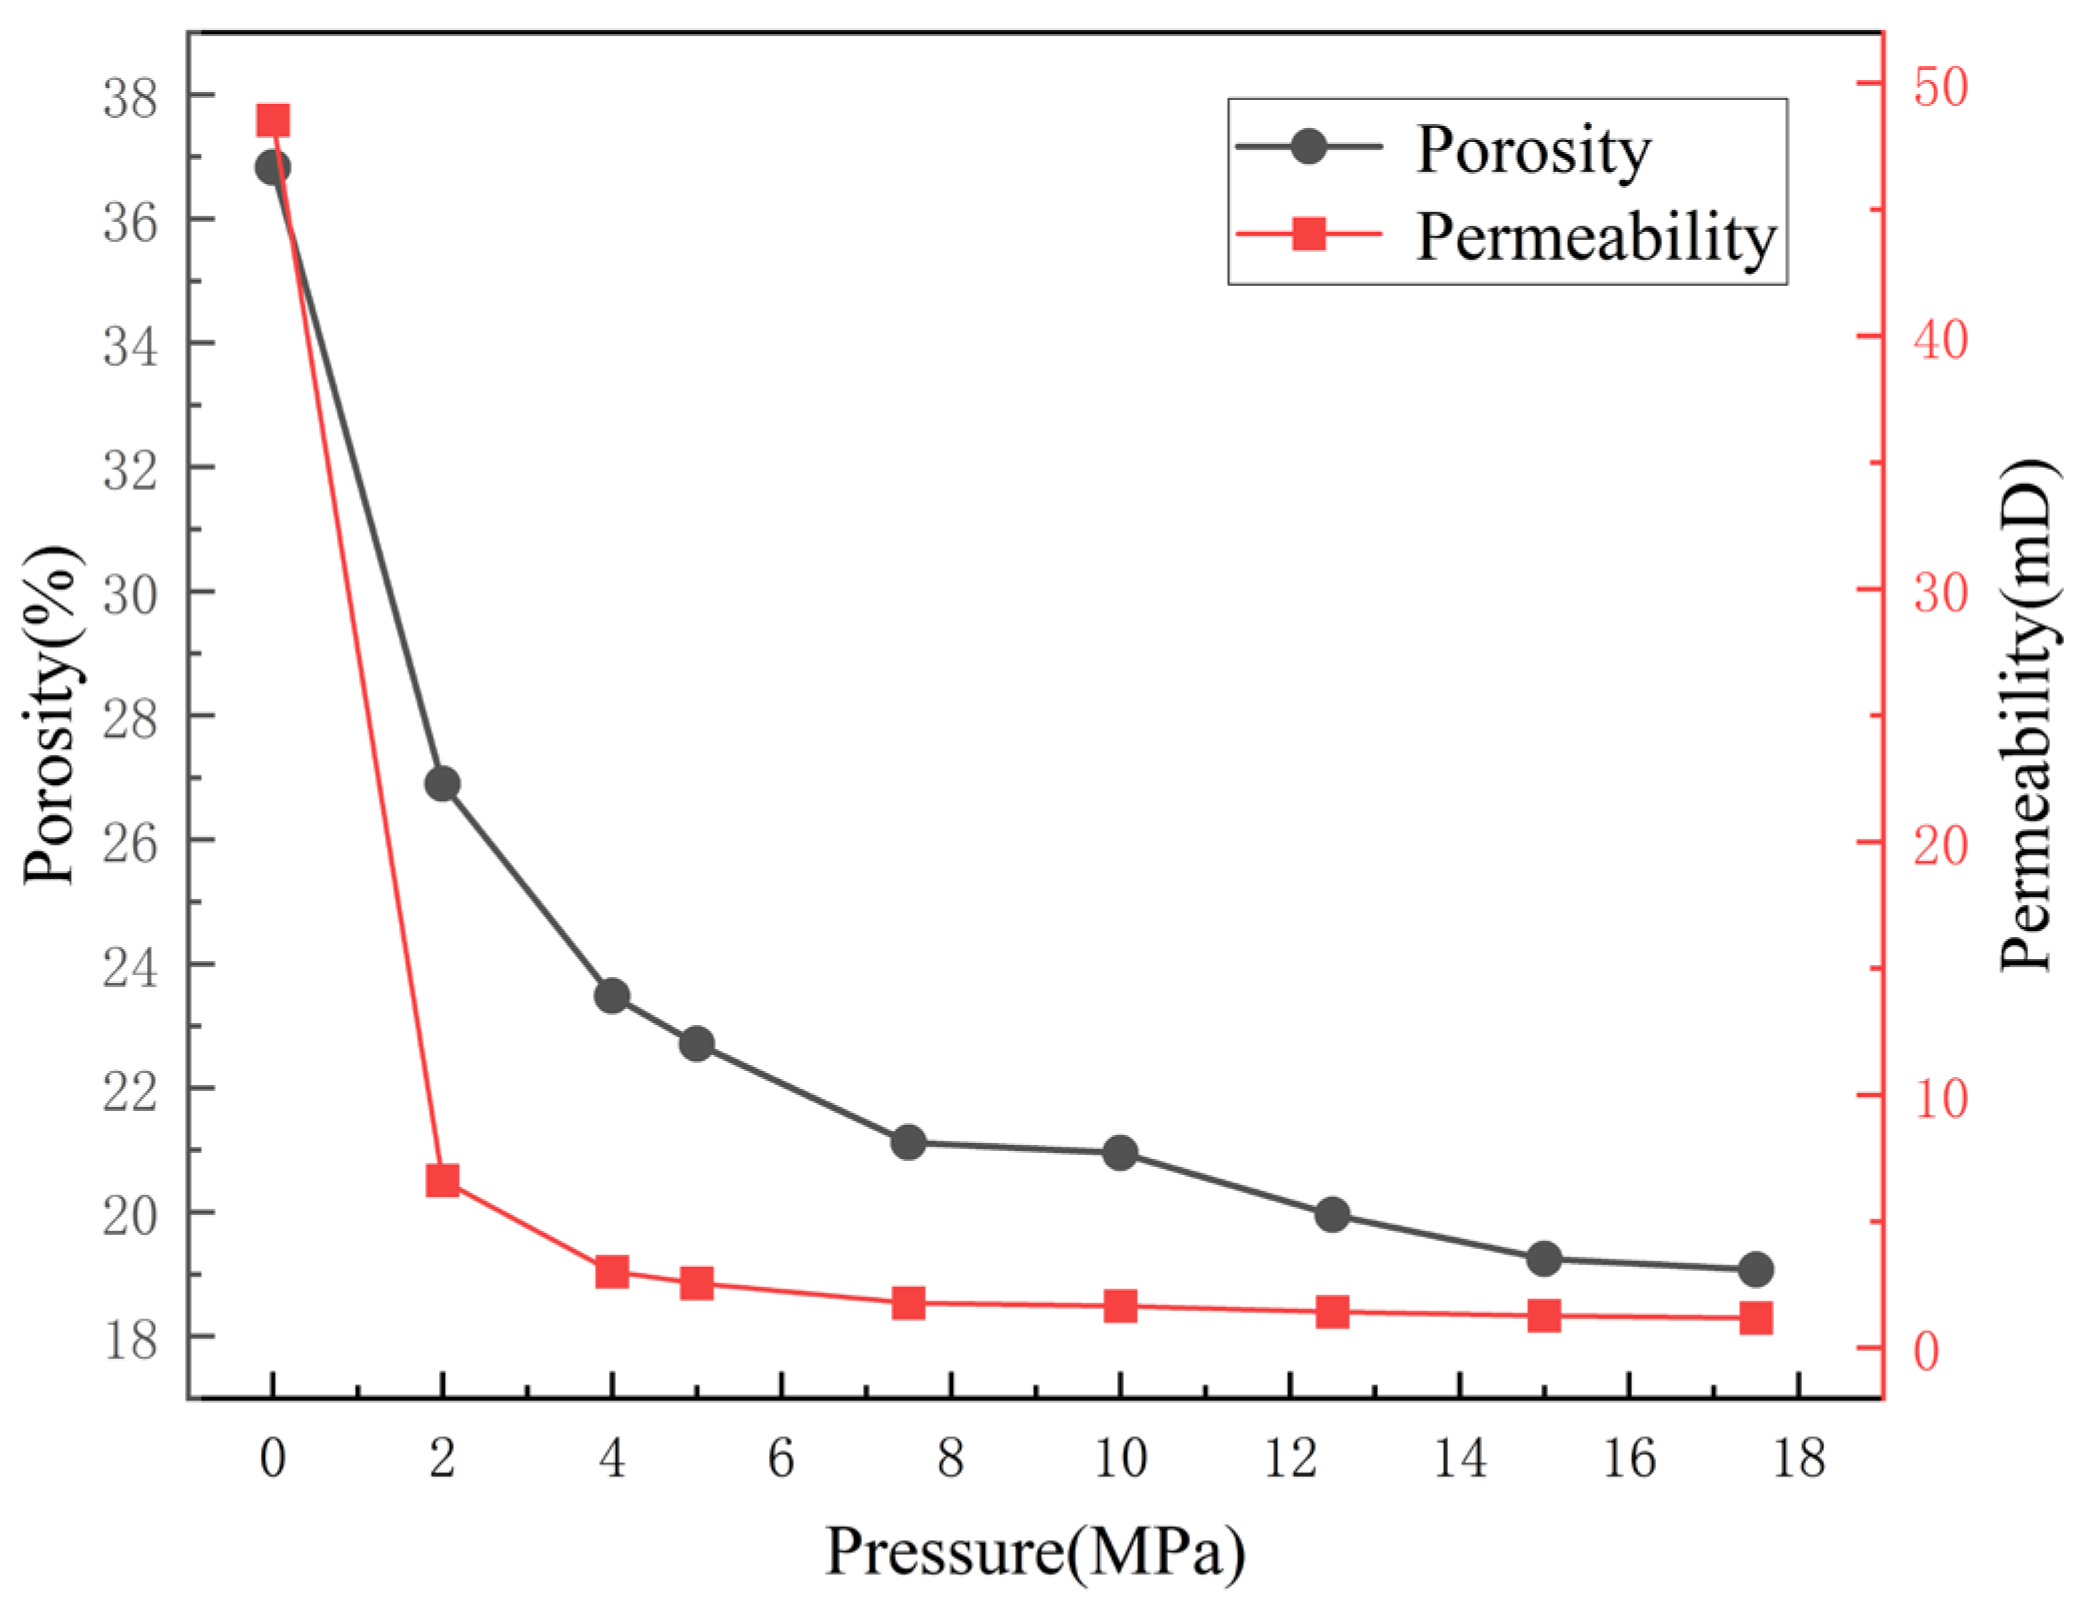
The overpressure permeability tests were conducted to investigate the effects of soil porosity and permeability changes on high-pressure marine environments. Figure 4 shows the variation curves of the porosity and permeability of the soil samples under ambient temperature as the confining pressure increased from 0 to 17.5 MPa. As shown in Figure 5, the pore structure and fluid flow capacity of soil underwent significant changes with increasing pressure. The porosity dropped markedly from 36.83% to 16.07%, owing to pore volume shrinkage from compaction under high-pressure conditions. At the same time, the permeability declined from 48.53 mD to 1.18 mD, suggesting that the pores available for fluid flow were markedly reduced, thereby greatly suppressing the seepage capacity of soil. During the pressure range of 0–4 MPa, permeability dropped sharply. Beyond this range, although the soil continued to compact and porosity steadily decreased, permeability exhibited little change. This phenomenon may be associated with the pore water within the soil; although the interparticle pores were compressed under external pressure, the incompressibility of water prevented water-filled pores from being compacted, and, in some cases, previously unconnected pores may have become interconnected under confining stress, thereby enhancing fluid mobility [30,31,32]. Therefore, pressure has an important and significant influence on the porosity and permeability characteristics of marine unconsolidated strata.

3.2. Isothermal Adsorption Experiments

The adsorption capacities of soil samples for CO2 and CH4 under different pressure conditions were tested to evaluate their gas storage capacity and sequestration potential, providing fundamental data for CO2 geological storage in unconsolidated marine sediments. Isothermal adsorption experiments of CO2 and CH4 were carried out separately to investigate the adsorption behavior of the soil samples and the variation in adsorption capacity for both gases. To quantitatively describe the adsorption behavior of gases in reservoir media, the Langmuir isothermal adsorption model (Equation (3)) was employed to fit the experimental data [33]. This model assumes that adsorption occurs as a monolayer process with a finite number of adsorption sites that are independent of one another. It effectively represents the fundamental adsorption characteristics of gases in porous media such as coal and shale. From the fitting results, the Langmuir volume VL and Langmuir pressure PL indicate the maximum adsorption capacity and the adsorption strength of the gas, respectively, serving as key parameters for characterizing reservoir adsorption properties. Owing to its simple structure, clear physical meaning, and high fitting accuracy, the Langmuir model has been widely applied in studies of adsorption characteristics in unconventional gas reservoirs, analyses of gas displacement mechanisms, and evaluations of geological CO2 sequestration.
n = n 0 × P P L + P × ( 1 ρ g ρ a d )
In Equation (3), n is the adsorption capacity at the current pressure adsorption equilibrium, cm3/g; n0 represents the Langmuir maximum adsorption capacity, cm3/g; PL is the Langmuir pressure, MPa; P is the environmental pressure, MPa; ρad is the adsorption phase density, g/cm3; and ρg is the free gas density, g/cm3.
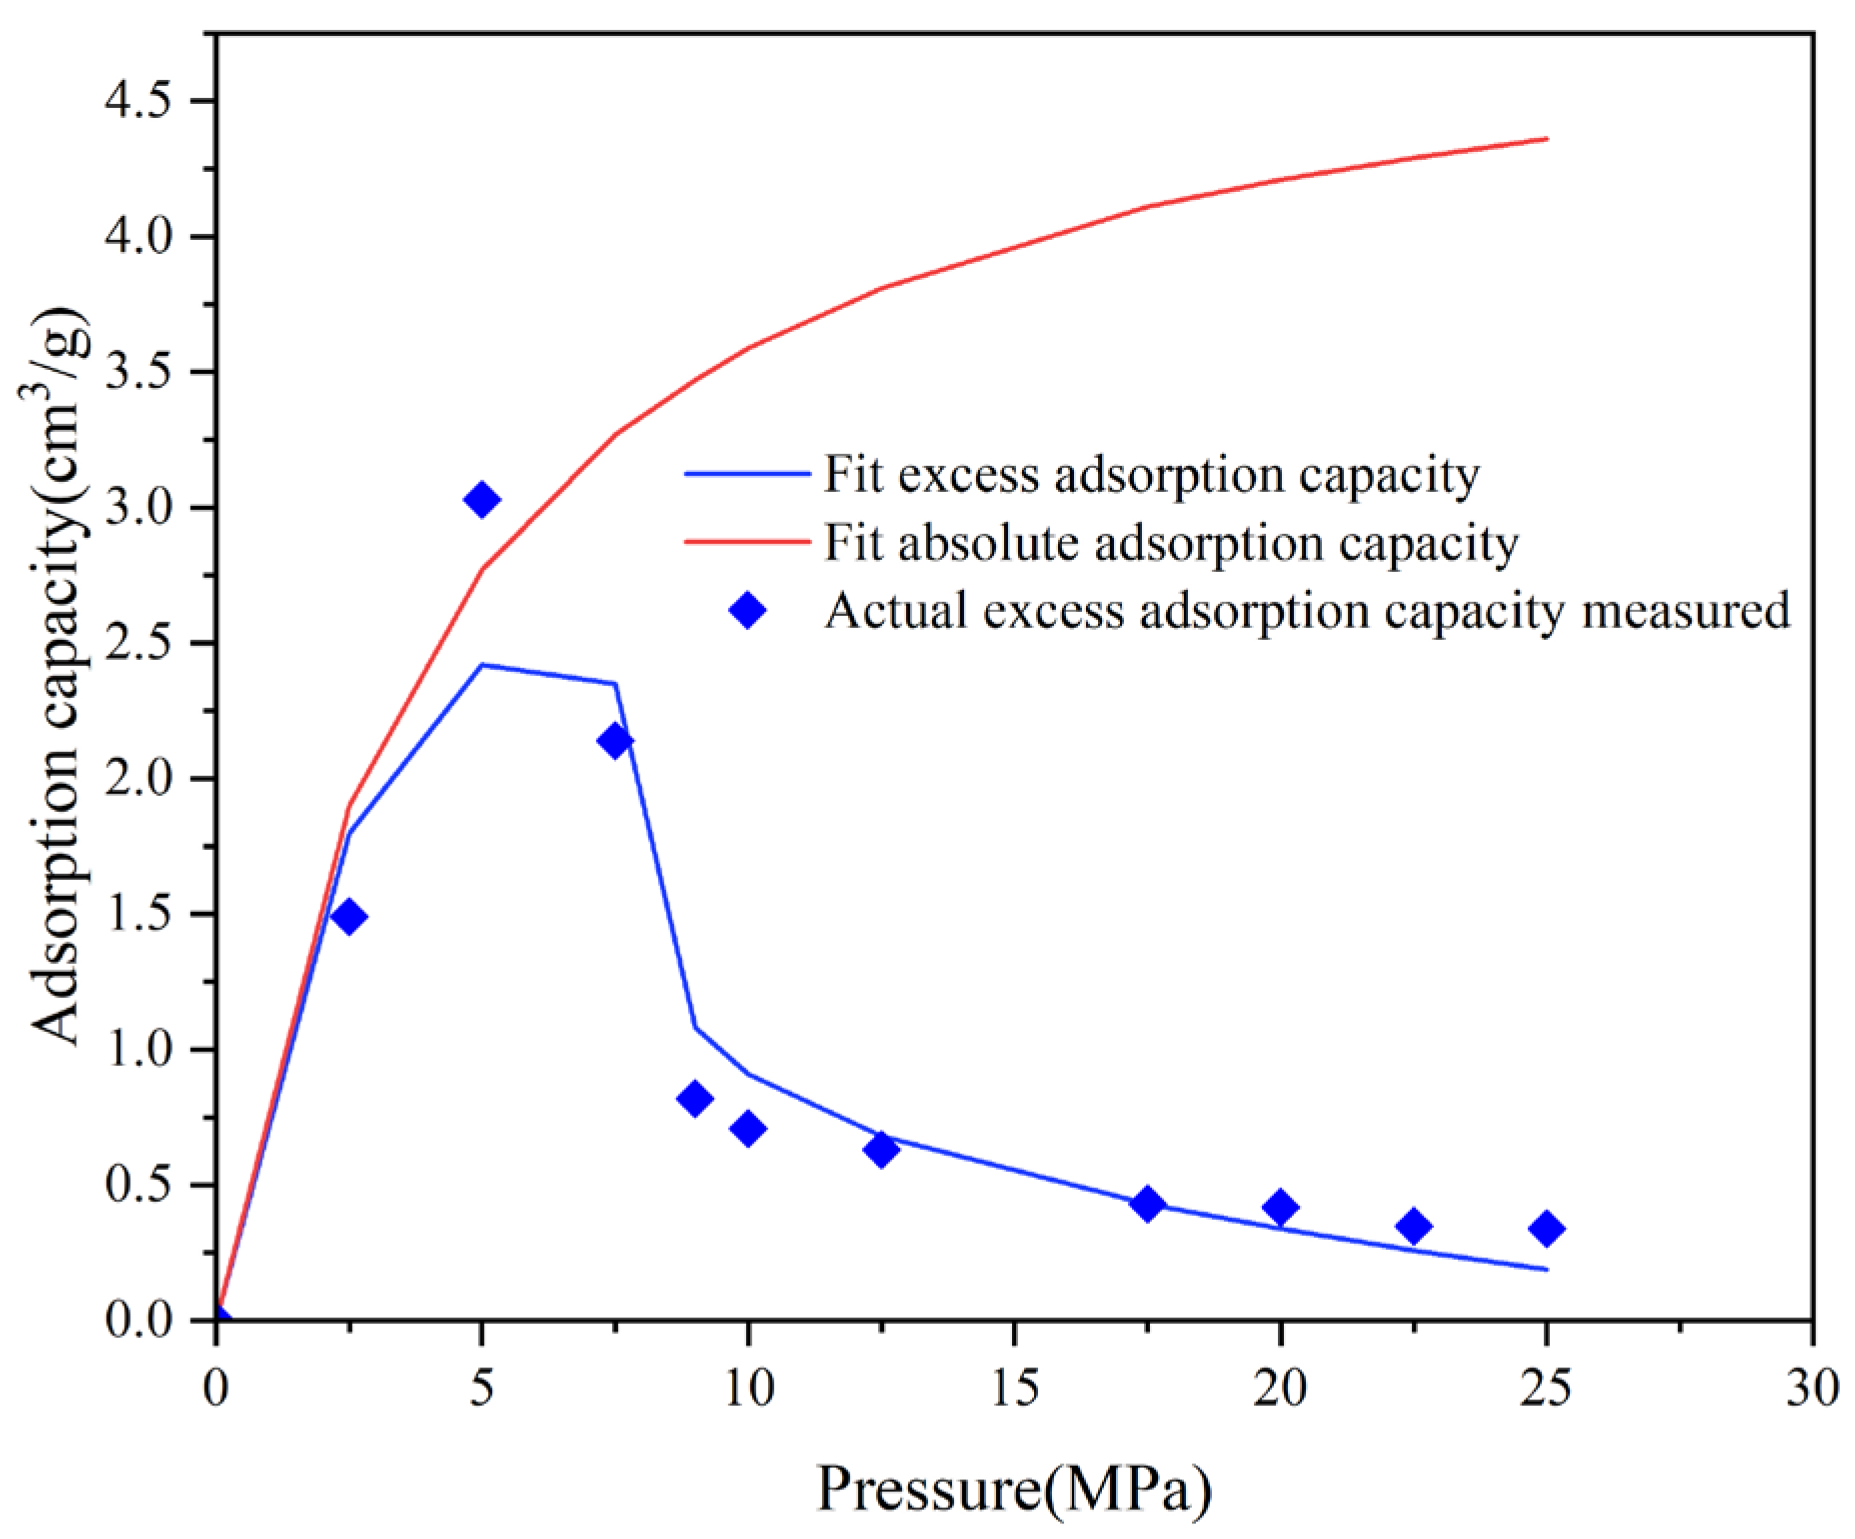
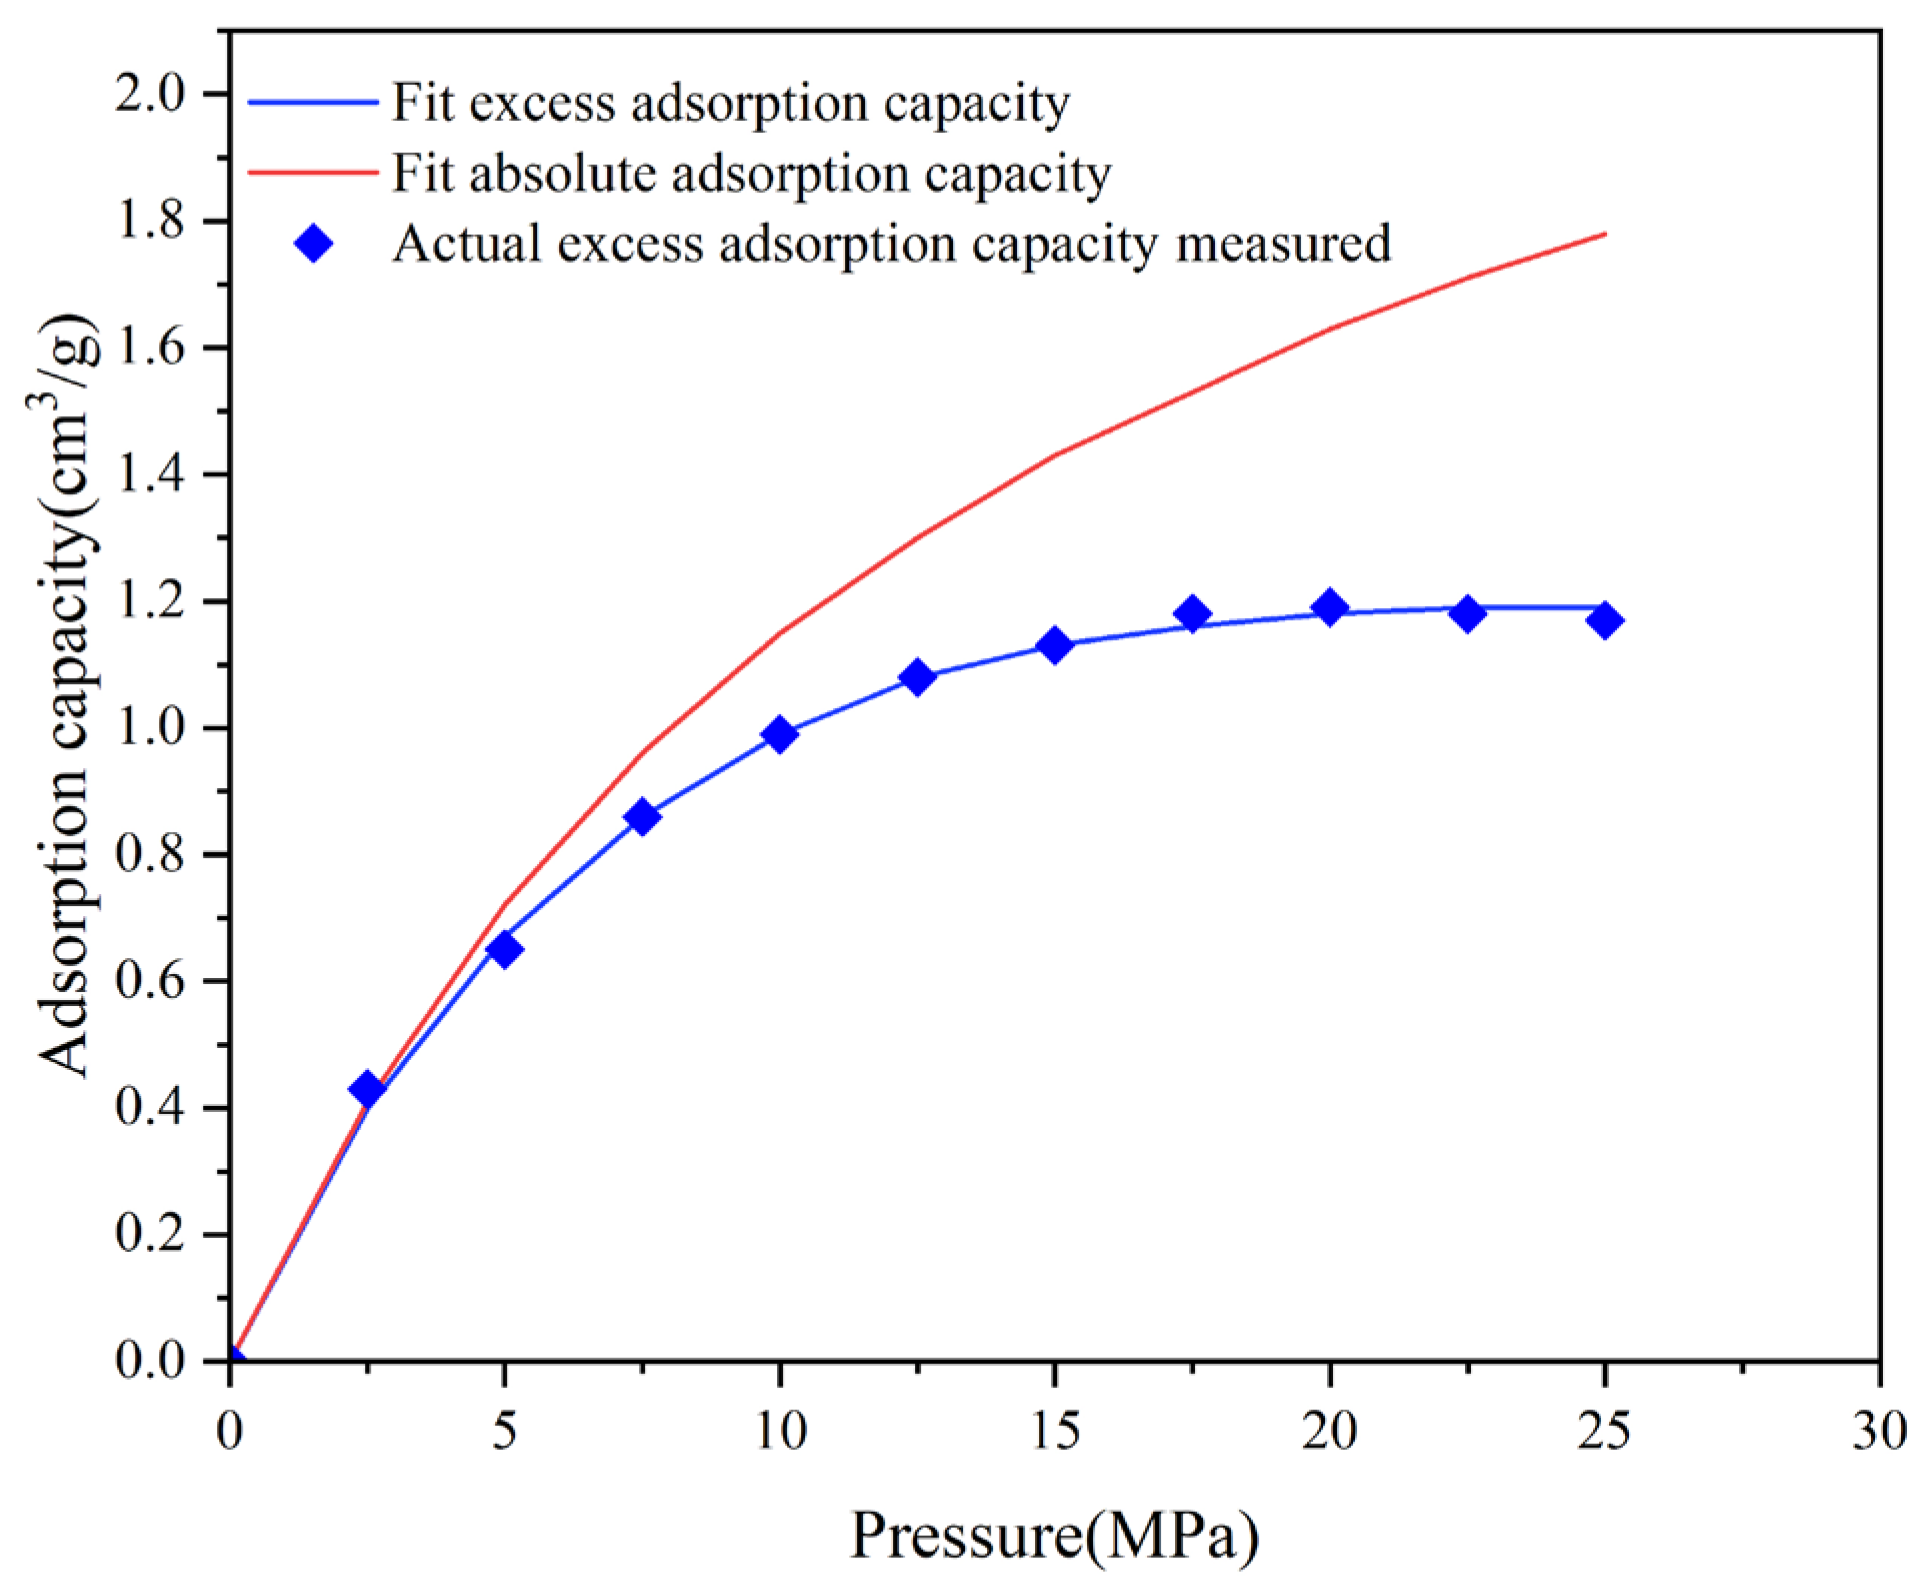
Figure 6 and Figure 7 show the adsorption curves of CO2 and CH4 under different pressure conditions. As illustrated, due to differences in the molecular properties and thermodynamic states, the two gases exhibit distinctly different adsorption behaviors. The excess adsorption capacity of CO2 increases rapidly with pressure, then decreases gradually, reaching a peak at approximately 7.5 MPa. This phenomenon is associated with the phase transition of CO2 into the supercritical state. Fitting results indicate that the absolute adsorption capacity of CO2 continued to rise, reaching a maximum of 4.36 cm3/g, with an adsorbed phase density of 0.938 g/cm3. In contrast, CH4 adsorption increased monotonically with pressure and stabilized at approximately 1.78 cm3/g, with an adsorbed phase density of 0.537 g/cm3, consistent with the typical Langmuir monolayer adsorption characteristics. At 25 MPa, the adsorption capacity of CO2 in the soil samples was 2.45 times that of CH4.
The experimental results demonstrate that CO2 has a stronger adsorption capacity than CH4. As CO2 transitions into the supercritical state, its adsorbed phase density increases significantly. Under identical pressure conditions, both the Langmuir volume and Langmuir pressure of CO2 indicate stronger adsorption performance. These differences primarily arise from the distinct molecular properties of the two gases. Firstly, CO2 is a linear polar molecule with stronger intermolecular forces, particularly enhanced electrostatic attraction and van der Waals interactions with organic surfaces or oxygen-containing functional groups. In contrast, methane, as a non-polar molecule, exhibits relatively weak adsorption affinity [34,35]. Secondly, CO2 molecules have slightly smaller diameters, higher diffusion rates, and greater accessibility to micropore systems, which strengthen their competitive advantage in occupying nanoscale pores. Furthermore, CO2 demonstrates stronger competitiveness at adsorption sites, effectively displacing pre-adsorbed methane molecules and thereby achieving displacement effects [36,37].

3.3. Effect of SCO2 Displacement on Soil Sample Porosity at Different Temperatures

The porosity of the soil samples before and after CO2 displacement at different injection temperatures was characterized using both NMR and weighting methods, as summarized in Table 5. Among the 8 test samples, the displacement processes of No. 1 and No. 2 occurred under non-supercritical conditions, whereas the displacement tests for the remaining samples were conducted using SCO2.
Overall, as shown in Table 5, the increase in soil sample porosity following SCO2 displacement was greater than that observed with non-SCO2. From 30 °C (No. 3) to 70 °C (No. 7), the porosity increments of the soil samples increased in both NMR porosity and weight porosity. In most cases, the porosity increment measured using the weight method was slightly lower than that obtained from NMR analysis. This phenomenon also validates the effectiveness of the test results. At 70 °C, the NMR porosity of the soil samples after displacement reached a maximum of 34.64%. In addition, the increase in soil sample porosity also reached its maximum value. In 80 °C (No. 8), the porosity increment was slightly lower than No. 7. Therefore, the experimental results above demonstrate that SCO2 exerted a significantly greater impact on the porosity increment of soil samples compared to non-SCO2 displacement. Moreover, to a certain extent, as the temperature of injected SCO2 increased, the increment in soil sample porosity also increased.

3.4. Effect of SCO2 Displacement on Soil Sample Permeability at Different Temperatures

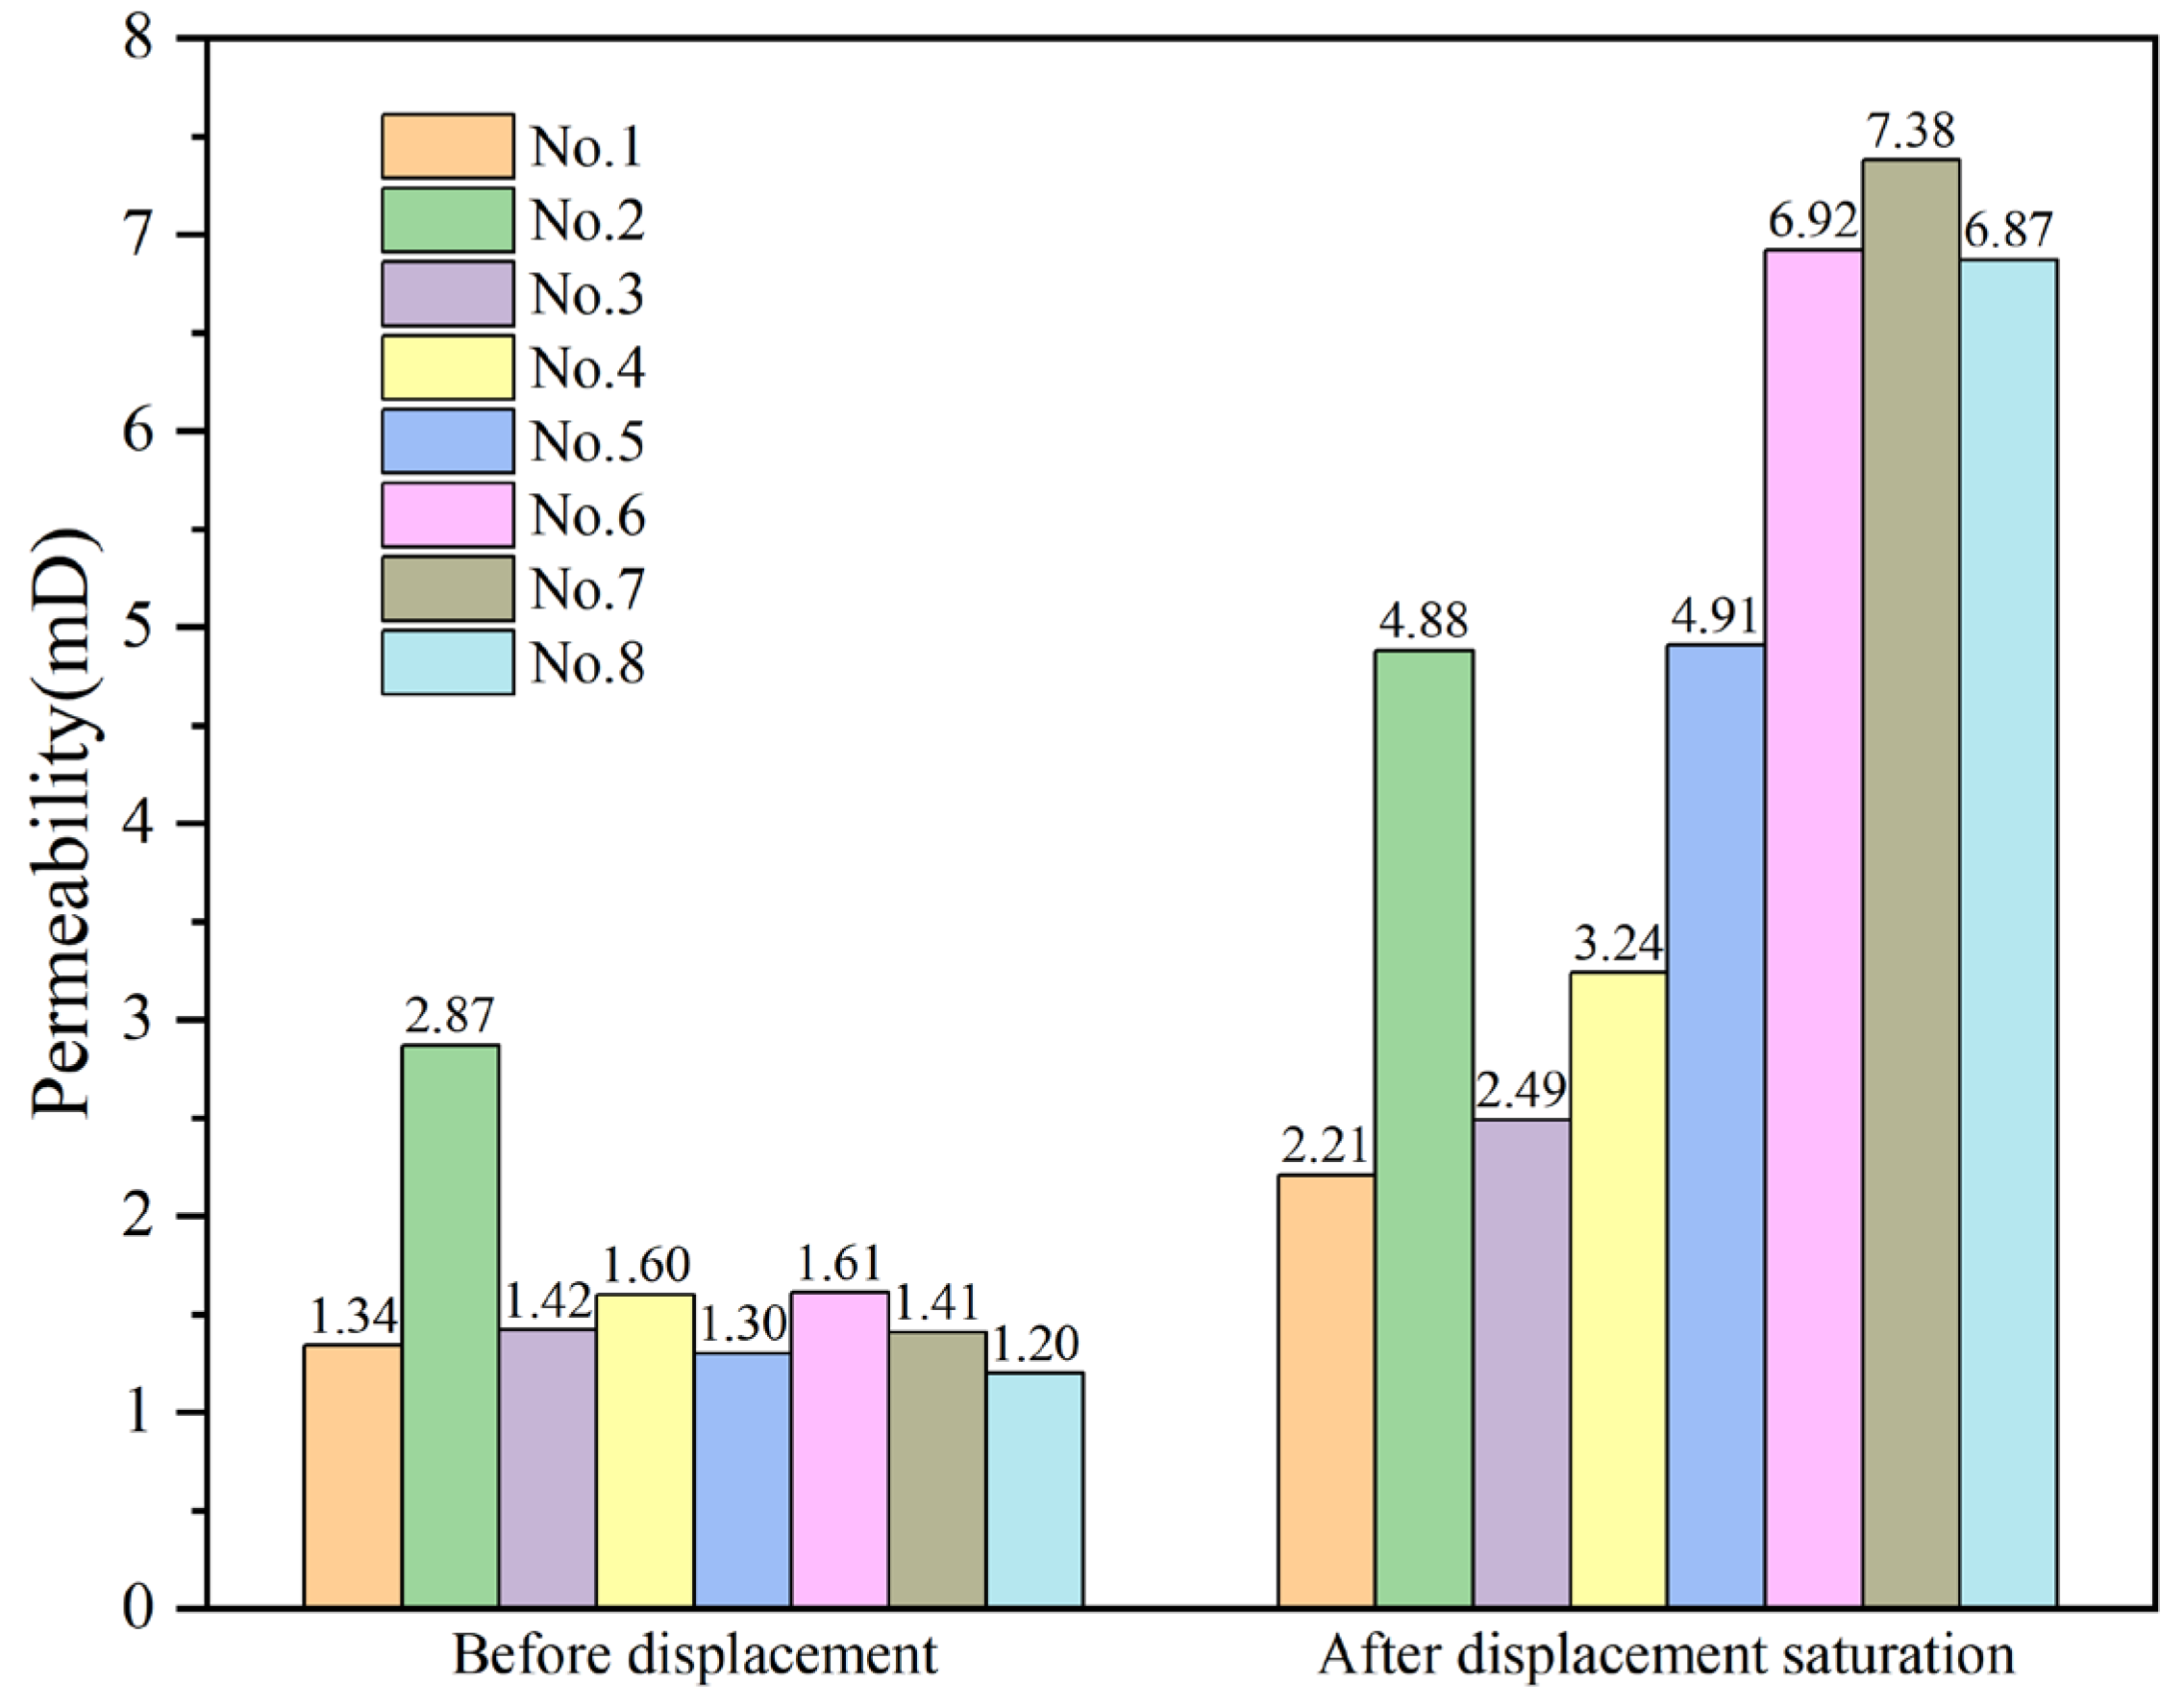
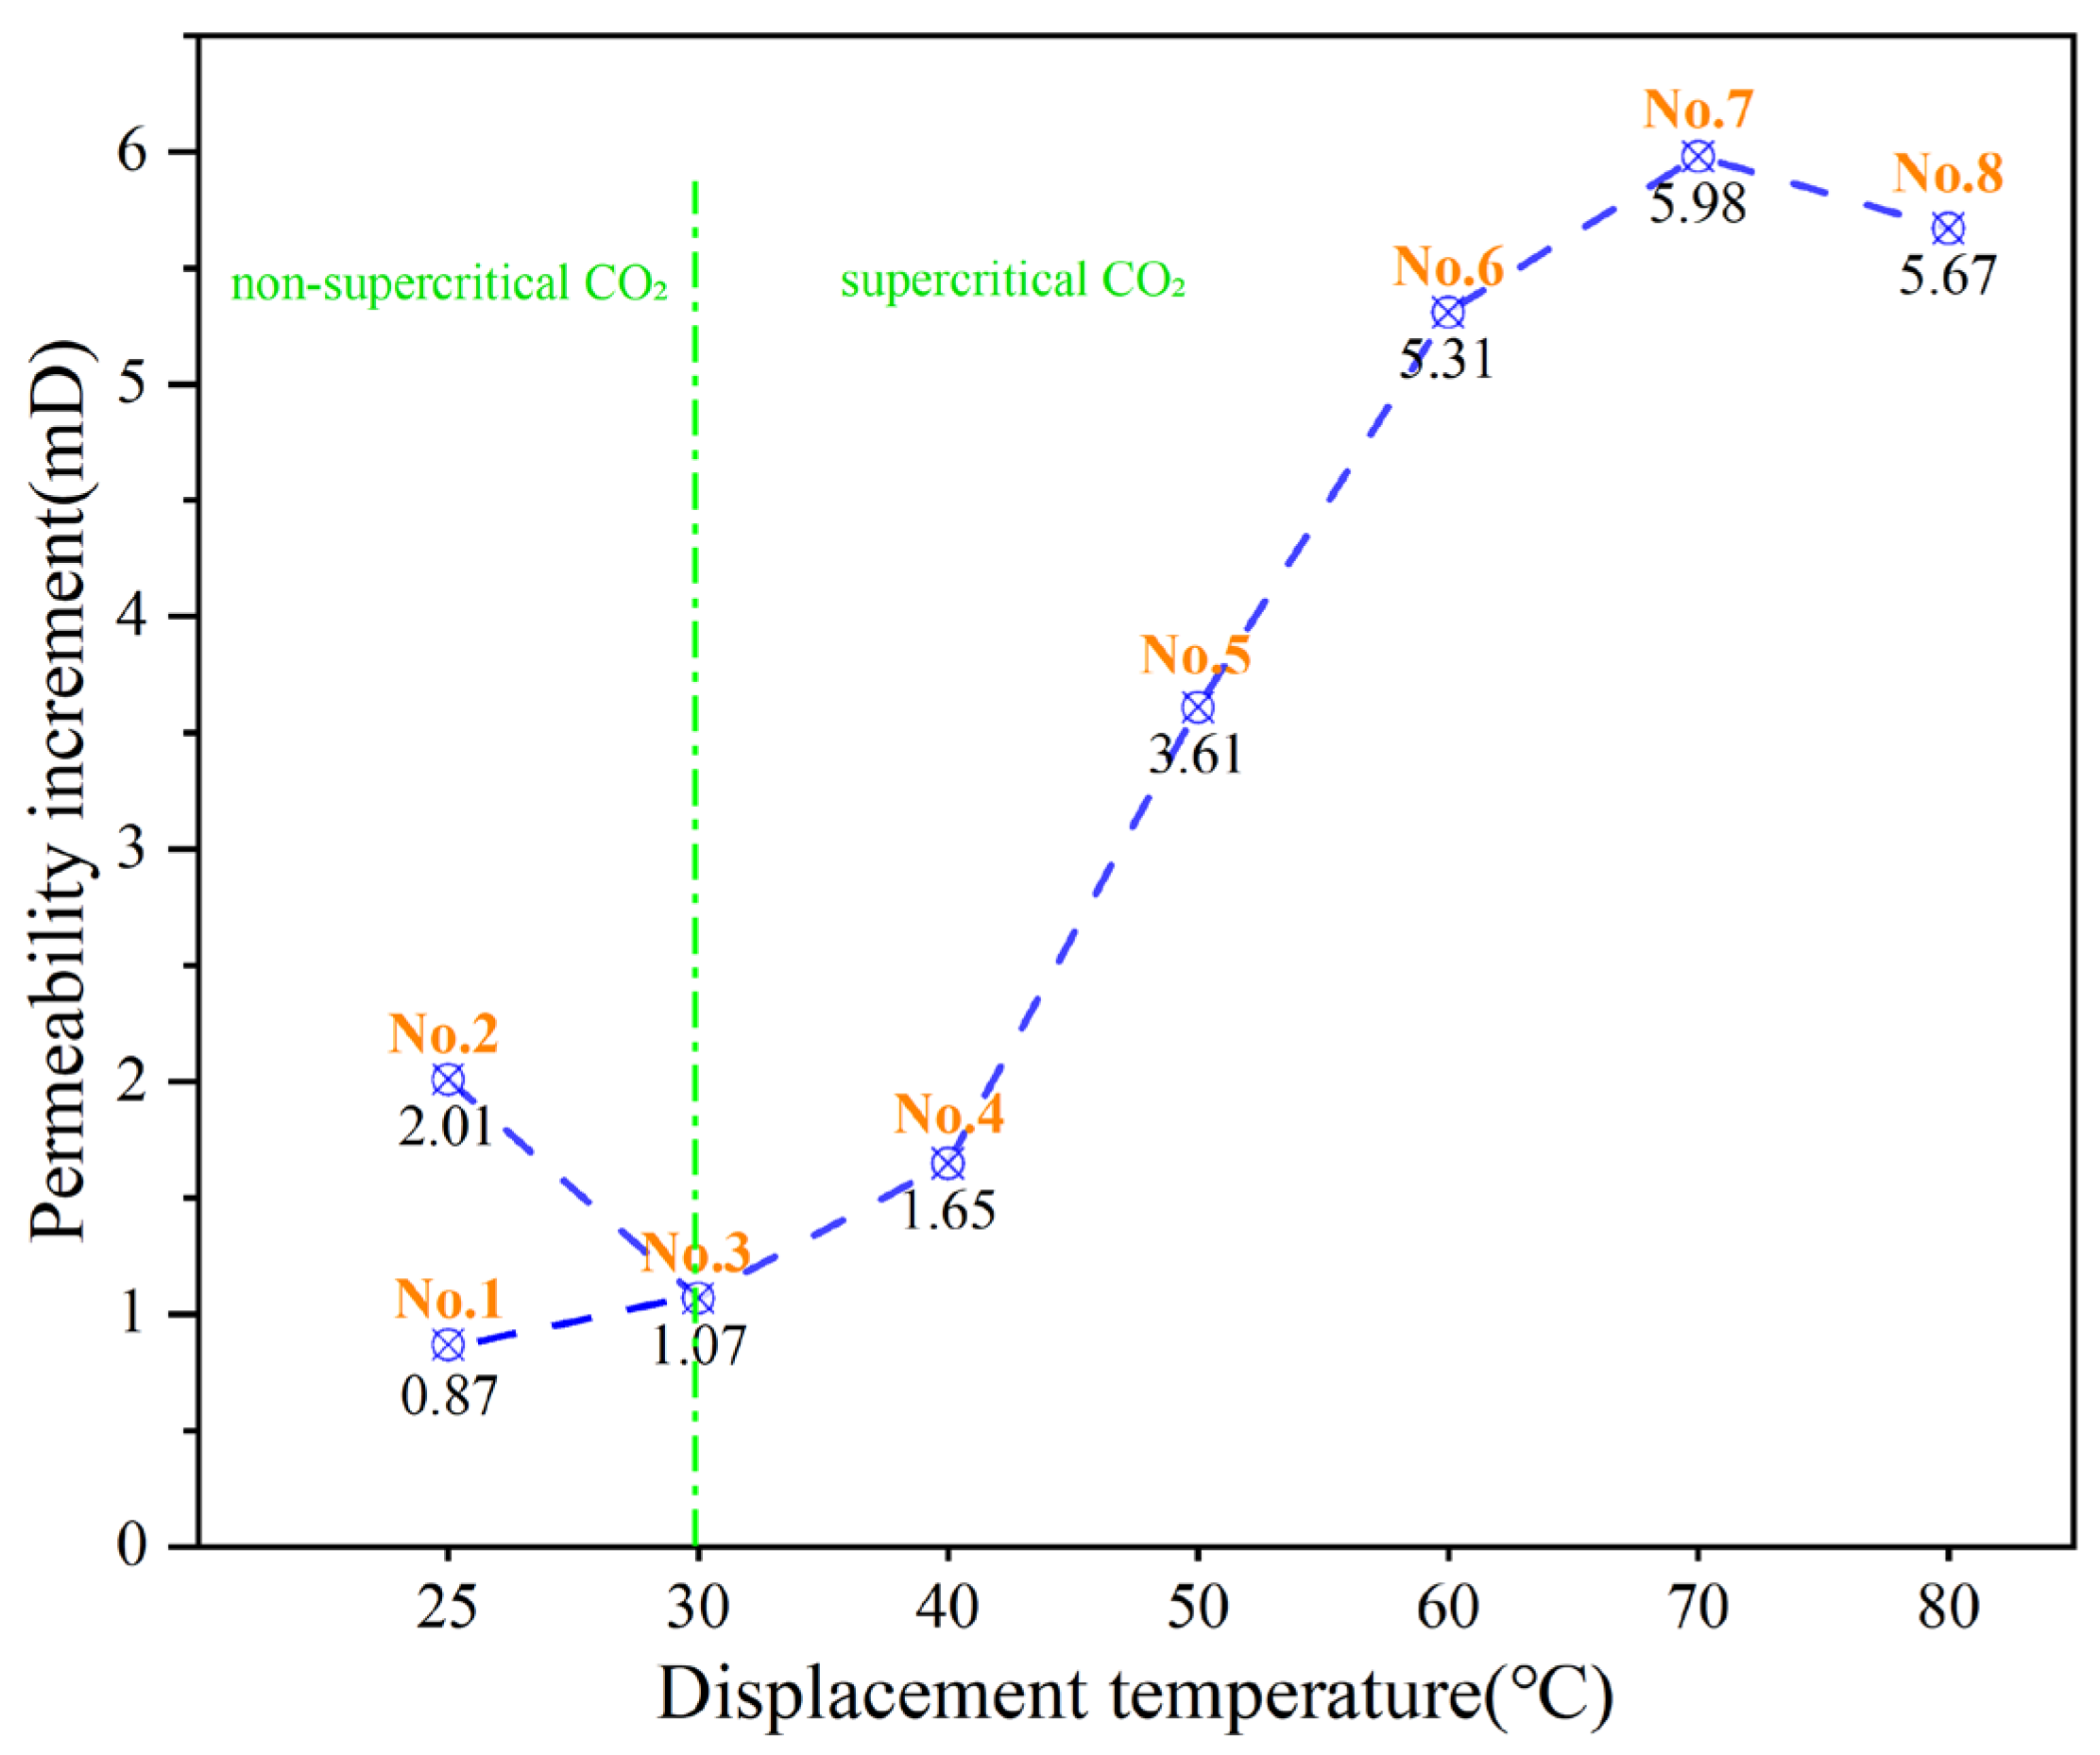
Figure 8 displays the permeability changes of saturated soil samples before and after CO2 displacement under different temperature conditions. It was evident that the permeability of all samples increased significantly following displacement. Before displacement, the overall permeability of soil was low at 25 °C. The permeability ranged from 1.2 to 2.87 mD, indicating that the soil samples had relatively poor permeability. After displacement, the permeability generally increased substantially, particularly under high-temperature conditions. For example, at 70 °C, permeability rose to 7.38 mD, much higher than other supercritical conditions. From 30 °C to 70 °C, post-displacement permeability increased with temperature, whereas at 80 °C, a slight decrease was observed. This change pattern was consistent with the variation in soil sample porosity. As shown in Figure 9, the increment in soil permeability began to rise from 30 °C and reached a maximum of 5.98 mD at 70 °C, but it did not continue to increase at 80 °C. Under 25 °C, the permeability increment with non-SCO2 was relatively lower, at 0.87 and 2.01, respectively. These results indicate that non-SCO2 has a far weaker influence on soil permeability increment than SCO2.

3.5. Characteristics of Pore Structure Changes in Soil Samples Before/After SCO2 Displacement

Low-field NMR can induce resonance in hydrogen nuclei within pore fluids. When an external magnetic field is applied, hydrogen nuclei in the fluid align directionally under the field’s influence, generating a magnetic signal. Upon removal of the external field, the aligned hydrogen nuclei revert to a disordered state, causing the magnetic signal to gradually decay [38]. Based on this principle, mathematical inversion of the NMR relaxation signal from this process yields an NMR spectrum of transverse relaxation time T2. A low T2 value indicates smaller pore diameters, whereas a high T2 value indicates larger pore diameters. Furthermore, the spectral area exhibits a quantitative relationship with the molar mass of hydrogen nuclei, enabling the determination of fluid mass within pores [39,40]. When applying this technique to measure sample porosity, it is essential to maximize fluid filling within the pore space to ensure the NMR-measured porosity closely approximates the sample’s true porosity.
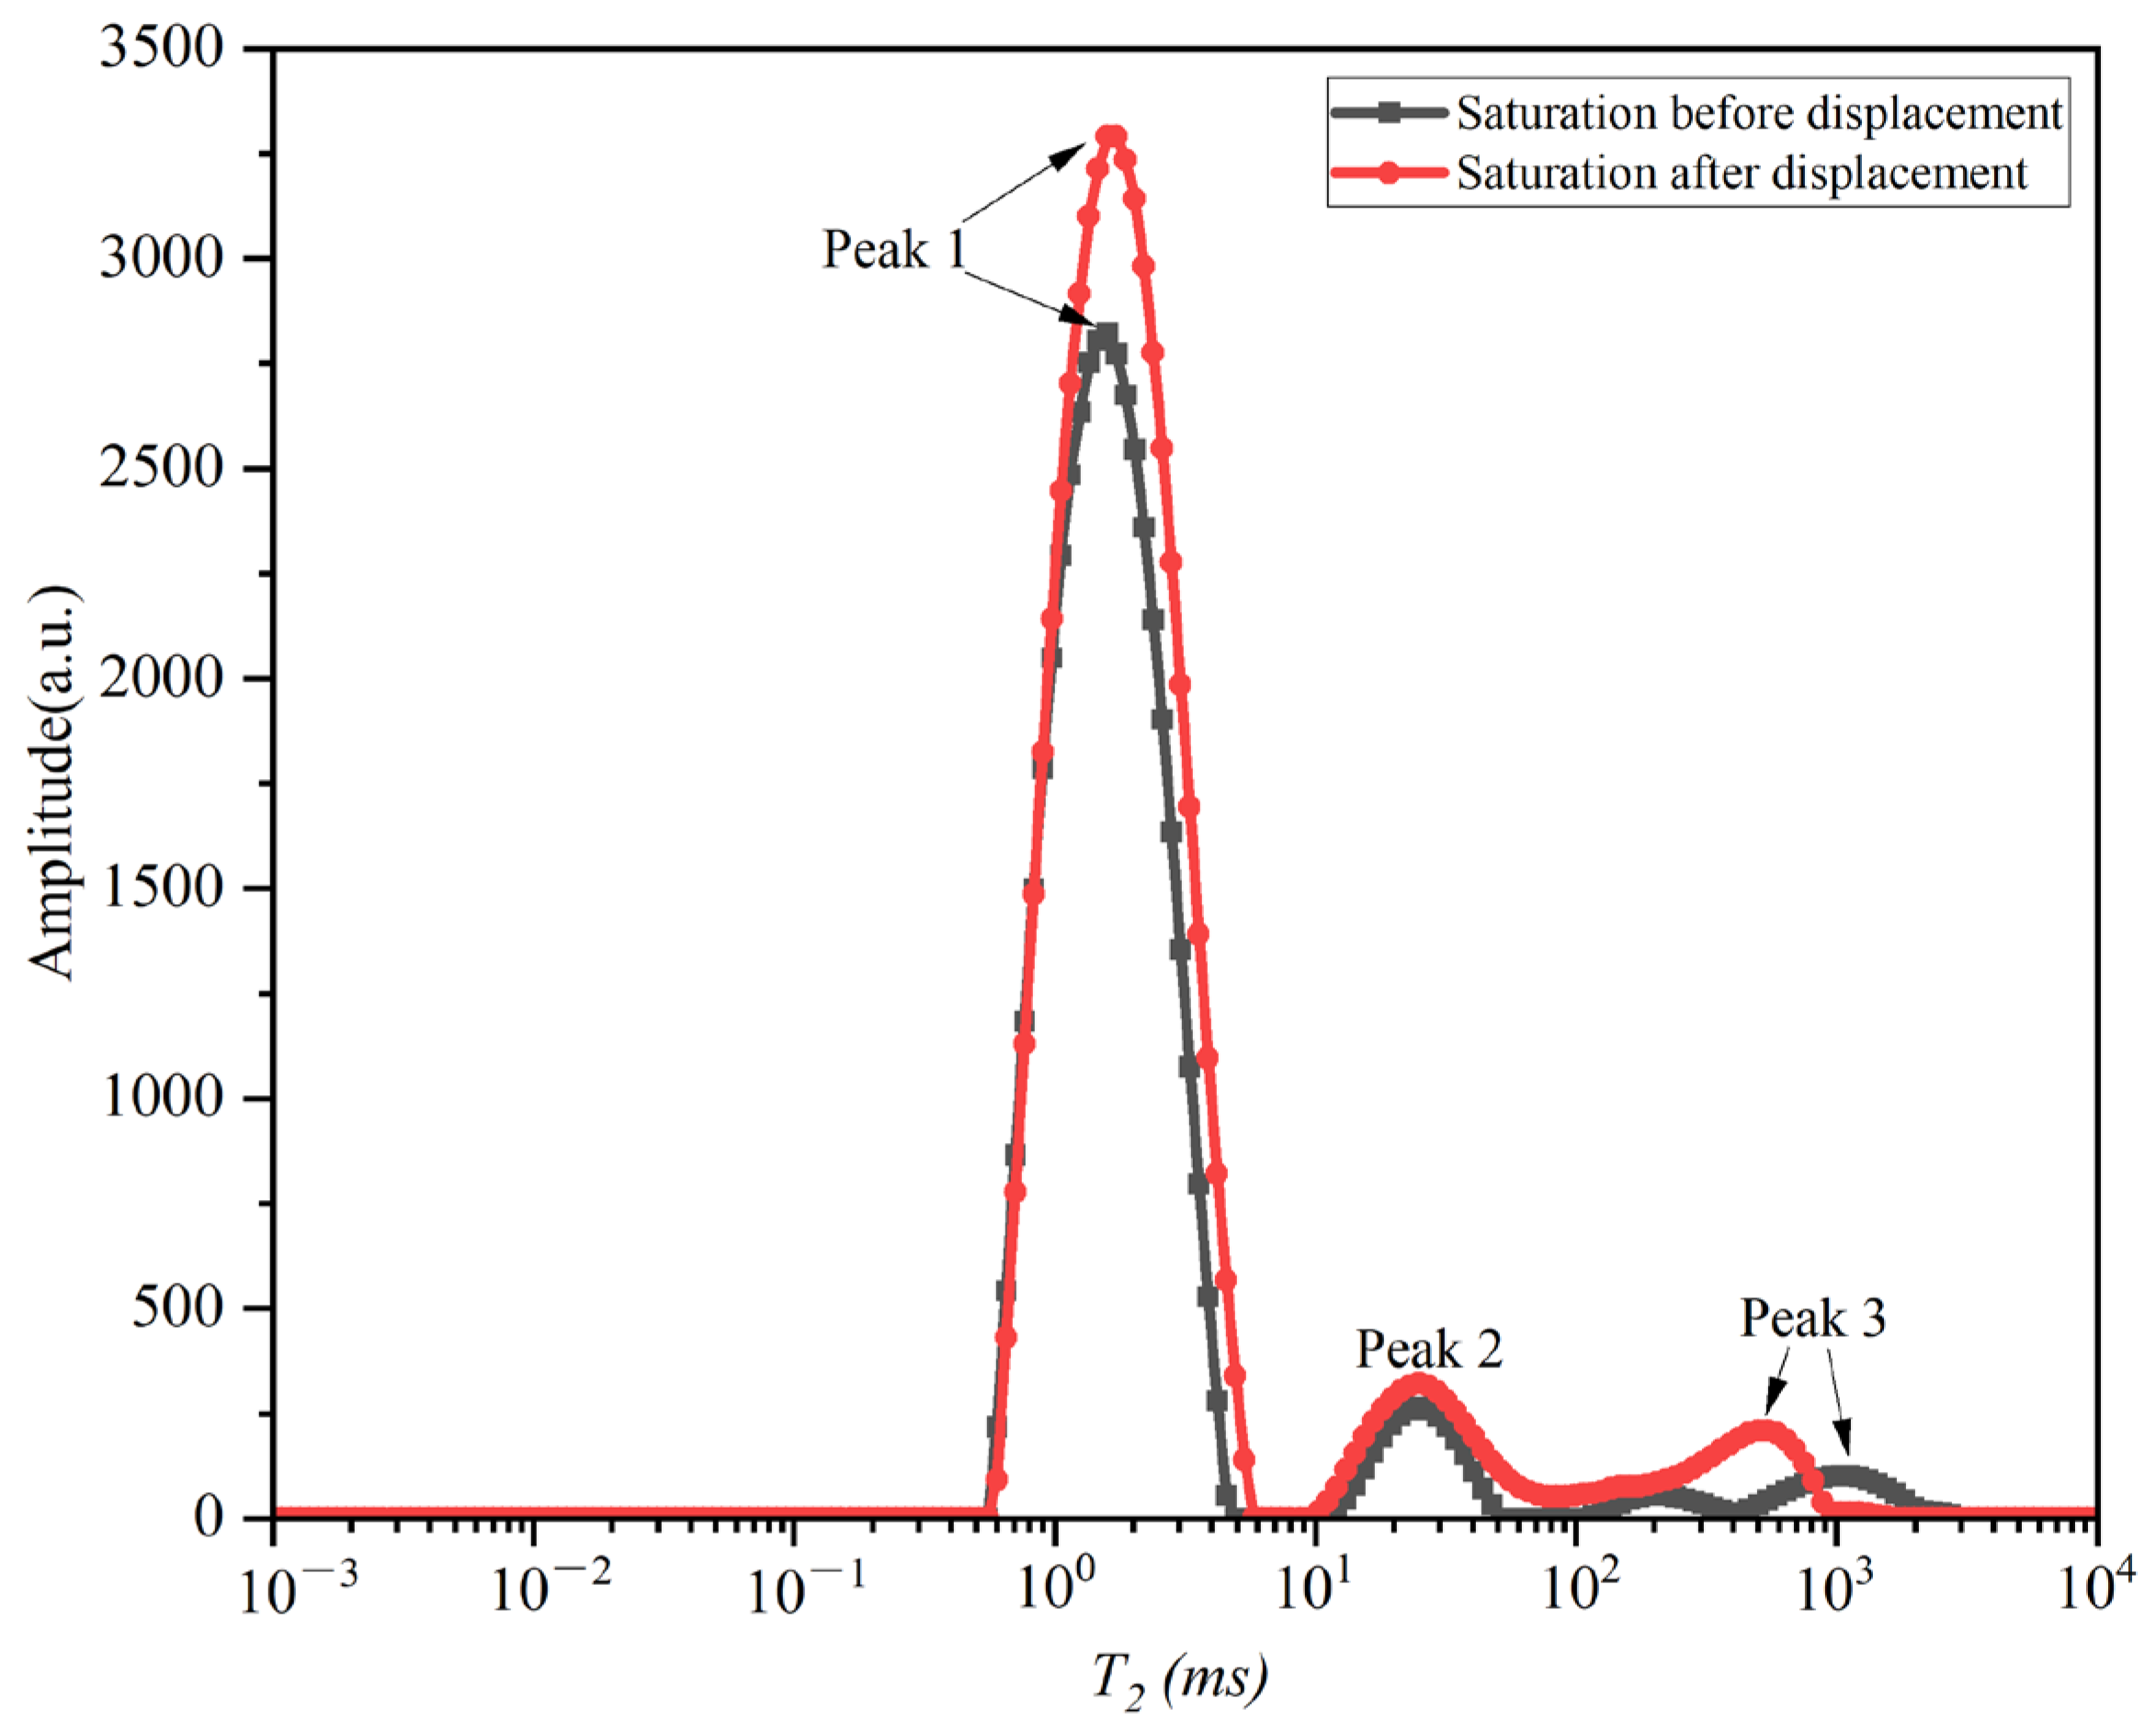
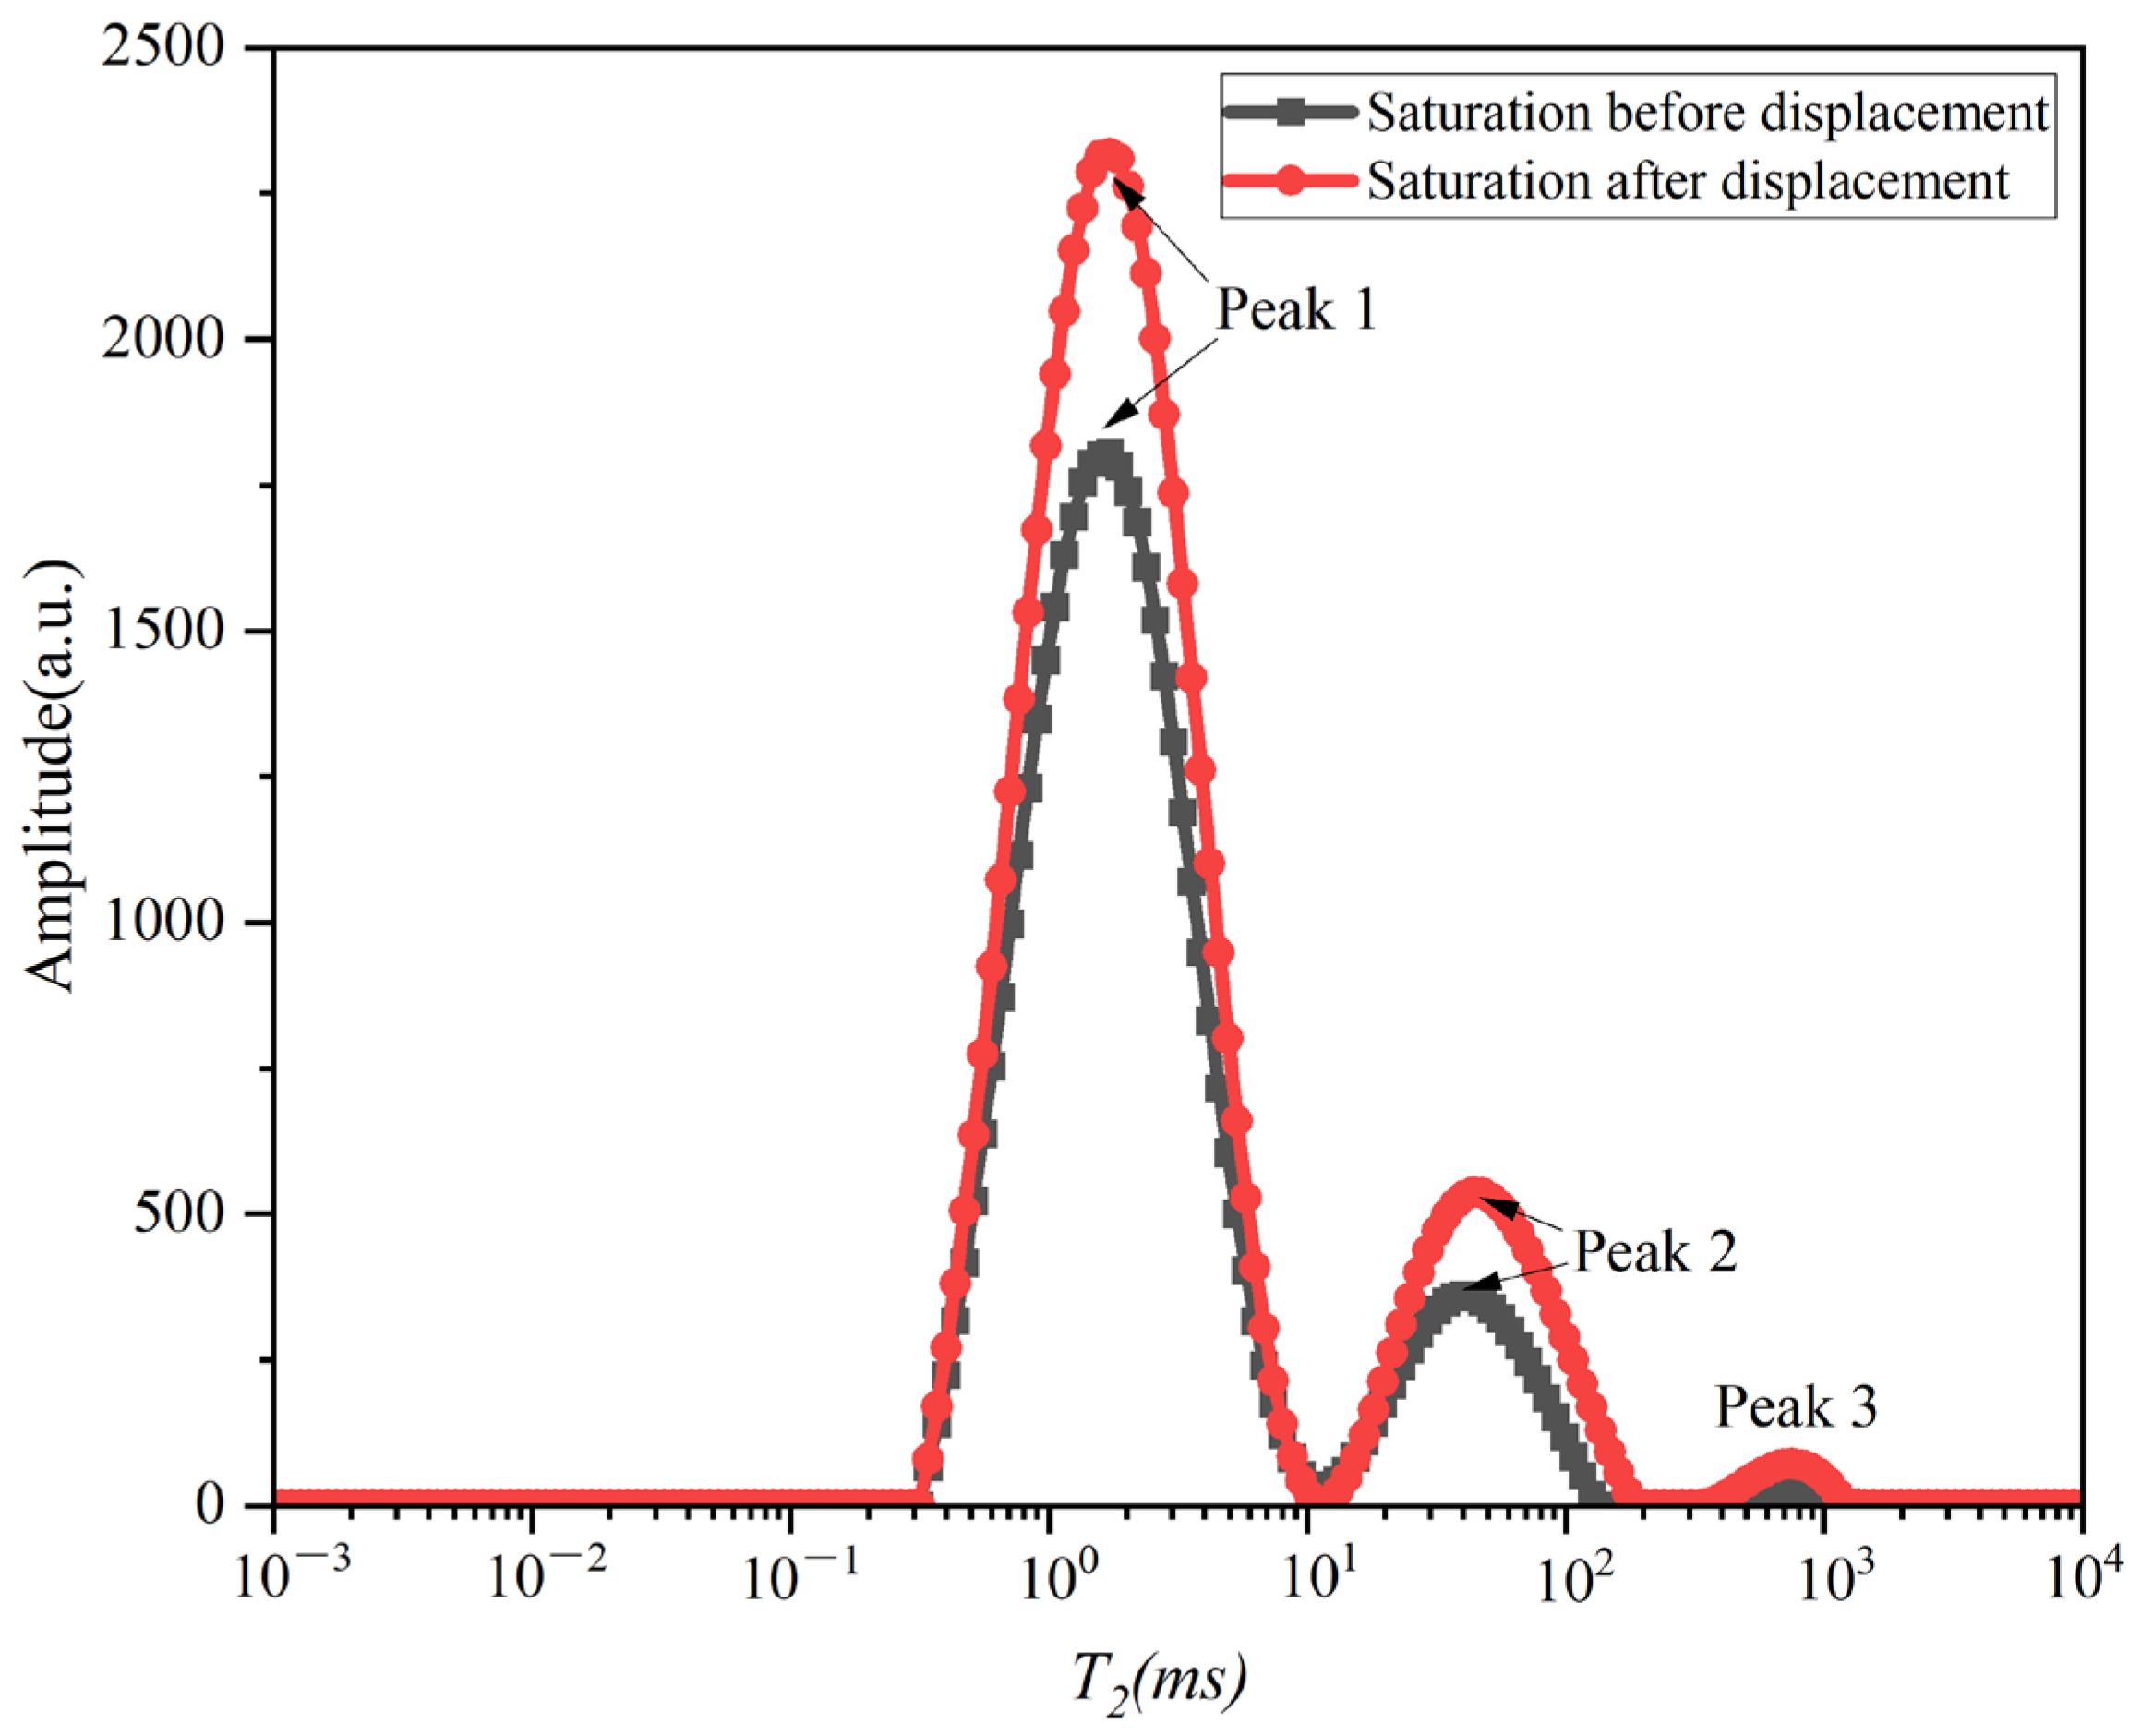
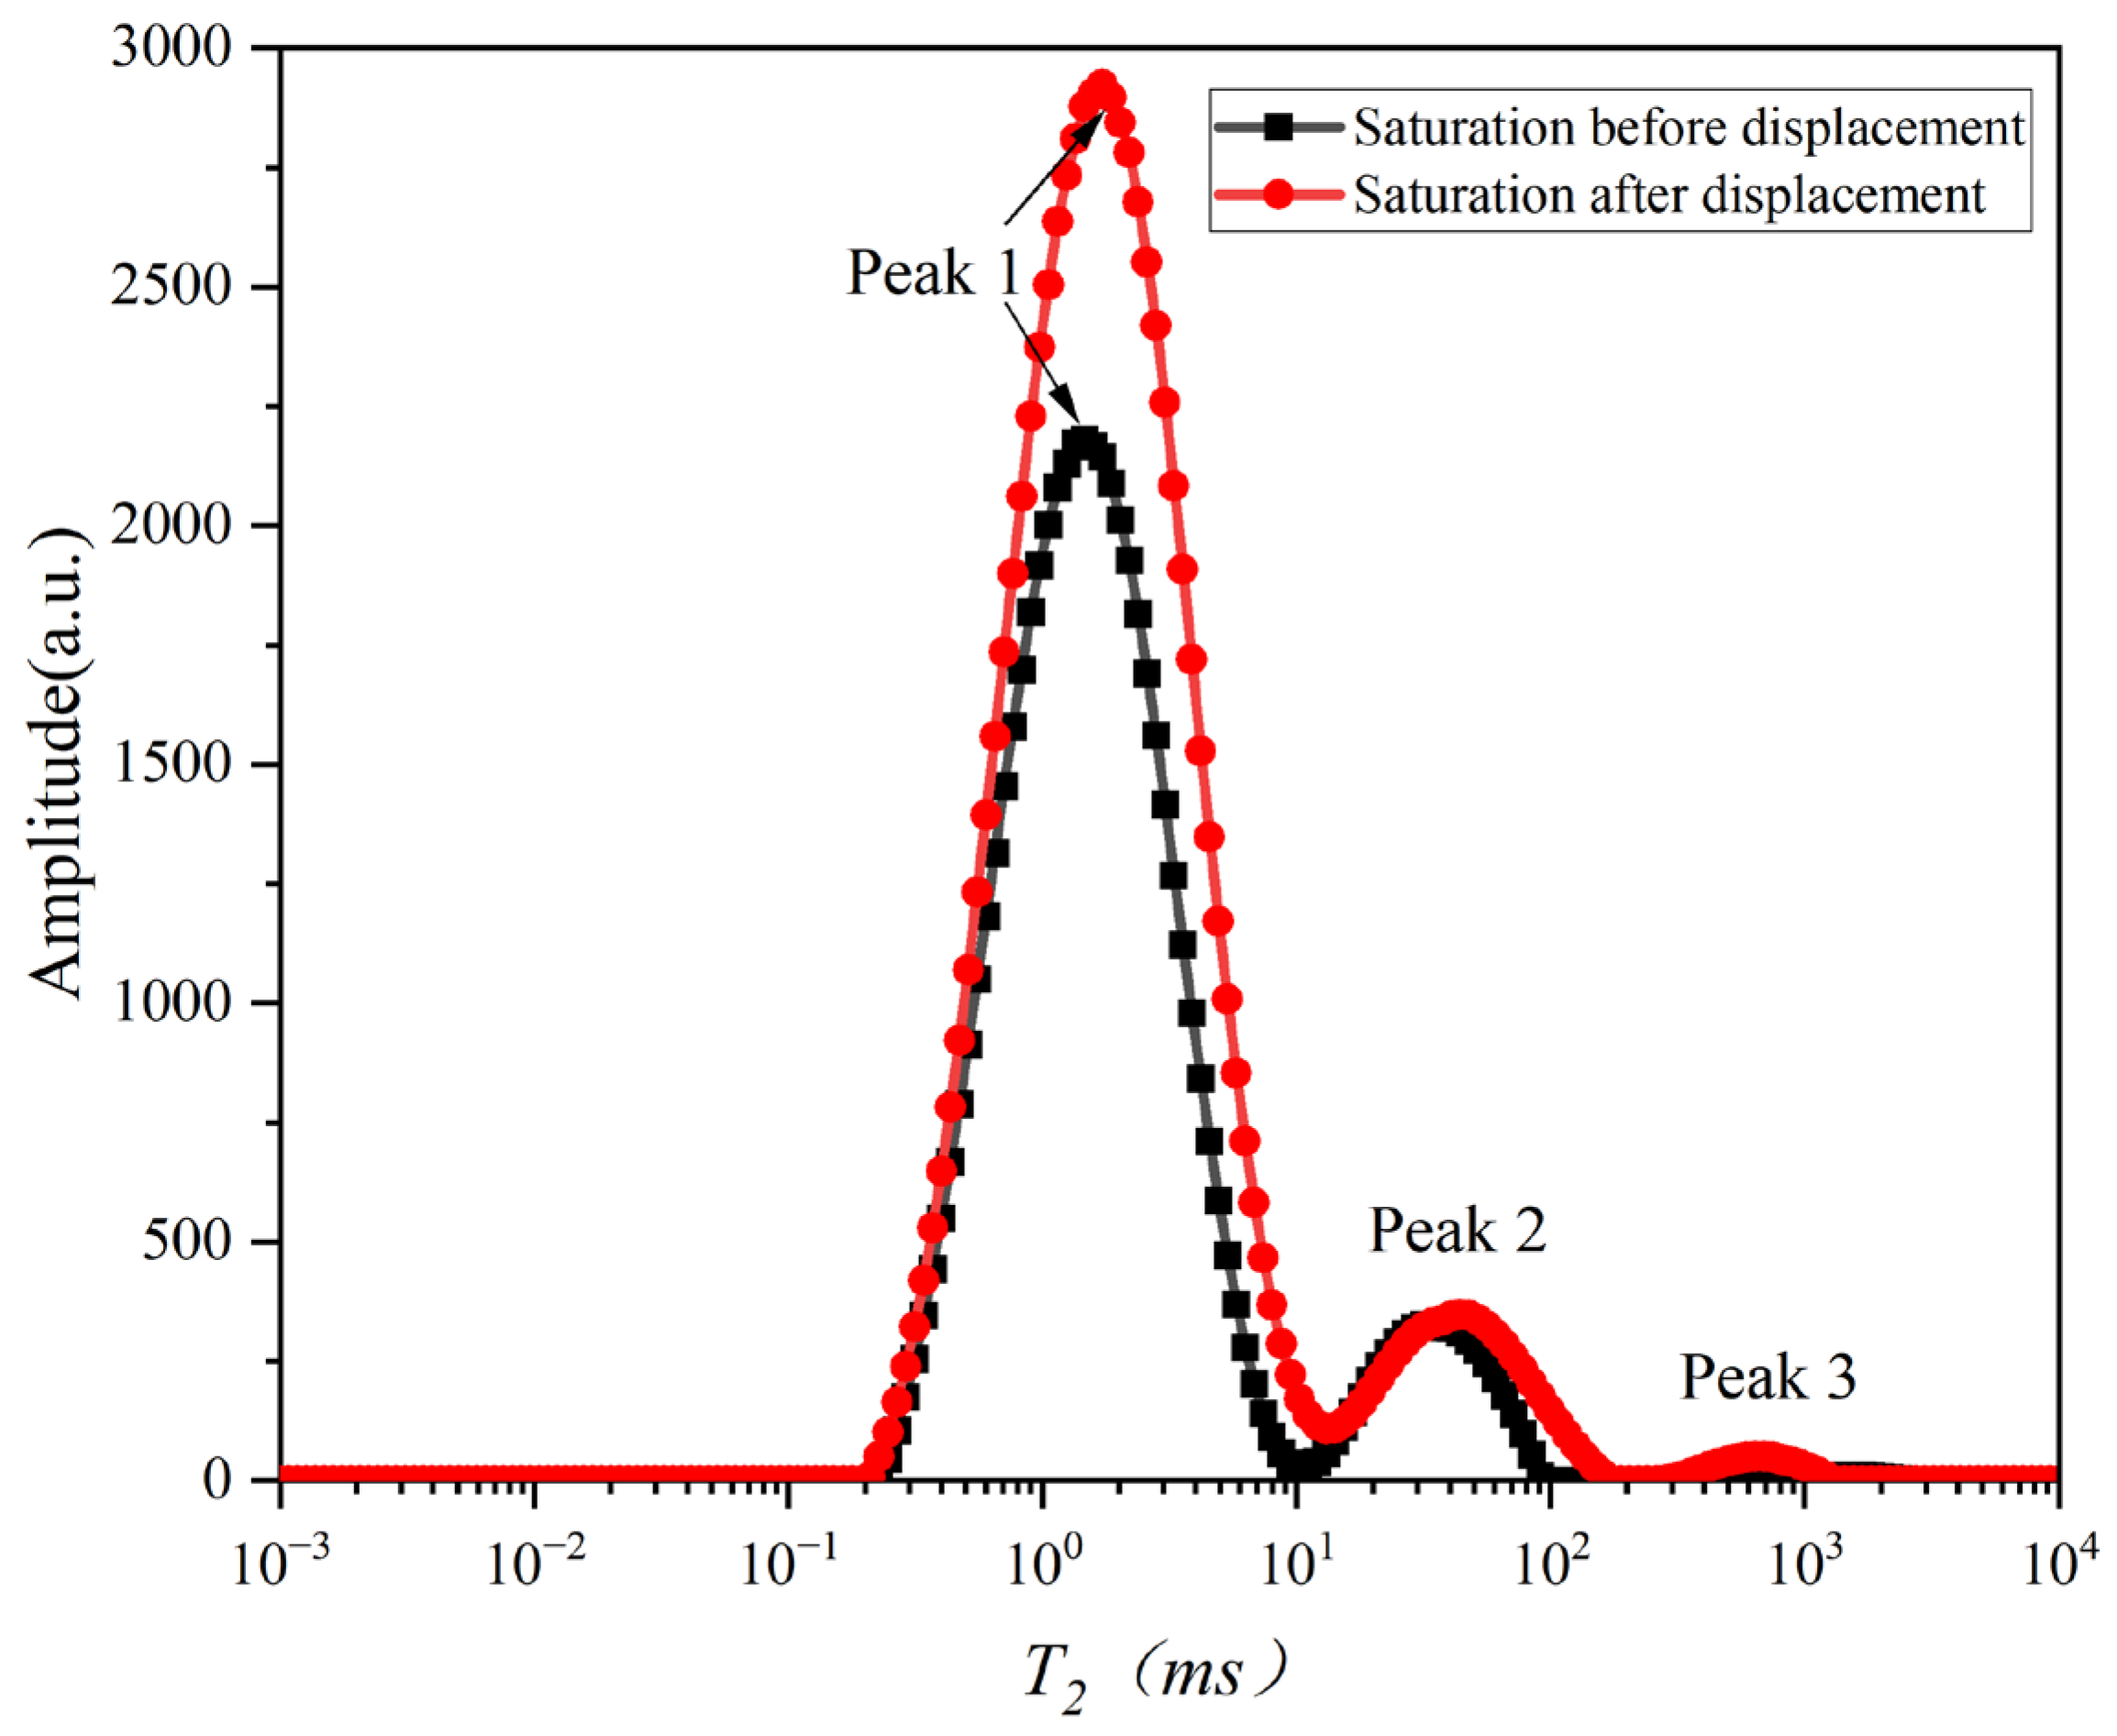
Taking the soil samples displaced by SCO2 for No. 5, No. 6, and No. 7 as examples, the NMR T2 characteristics before and after displacement were analyzed in Figure 10, Figure 11 and Figure 12. It can be seen that three peaks appeared in the T2 curves before and after the displacement. The amplitude of Peak 1 after displacement was obviously larger than that before displacement. The width of Peak 1 also significantly widened. In three tests, the greatest increase in Peak 1 was No. 7. Peak 1 before displacement was 2179.74, and Peak 1 after displacement was 2922.41, with an increase of 34.07%. In addition, the values of Peak 2 and Peak 3 were approximately the same before/after displacement. Compared to before displacement, Peak 2 after displacement was only slightly shifted to the right. This result proved that the pore structure of the soil sample changed before and after displacement.
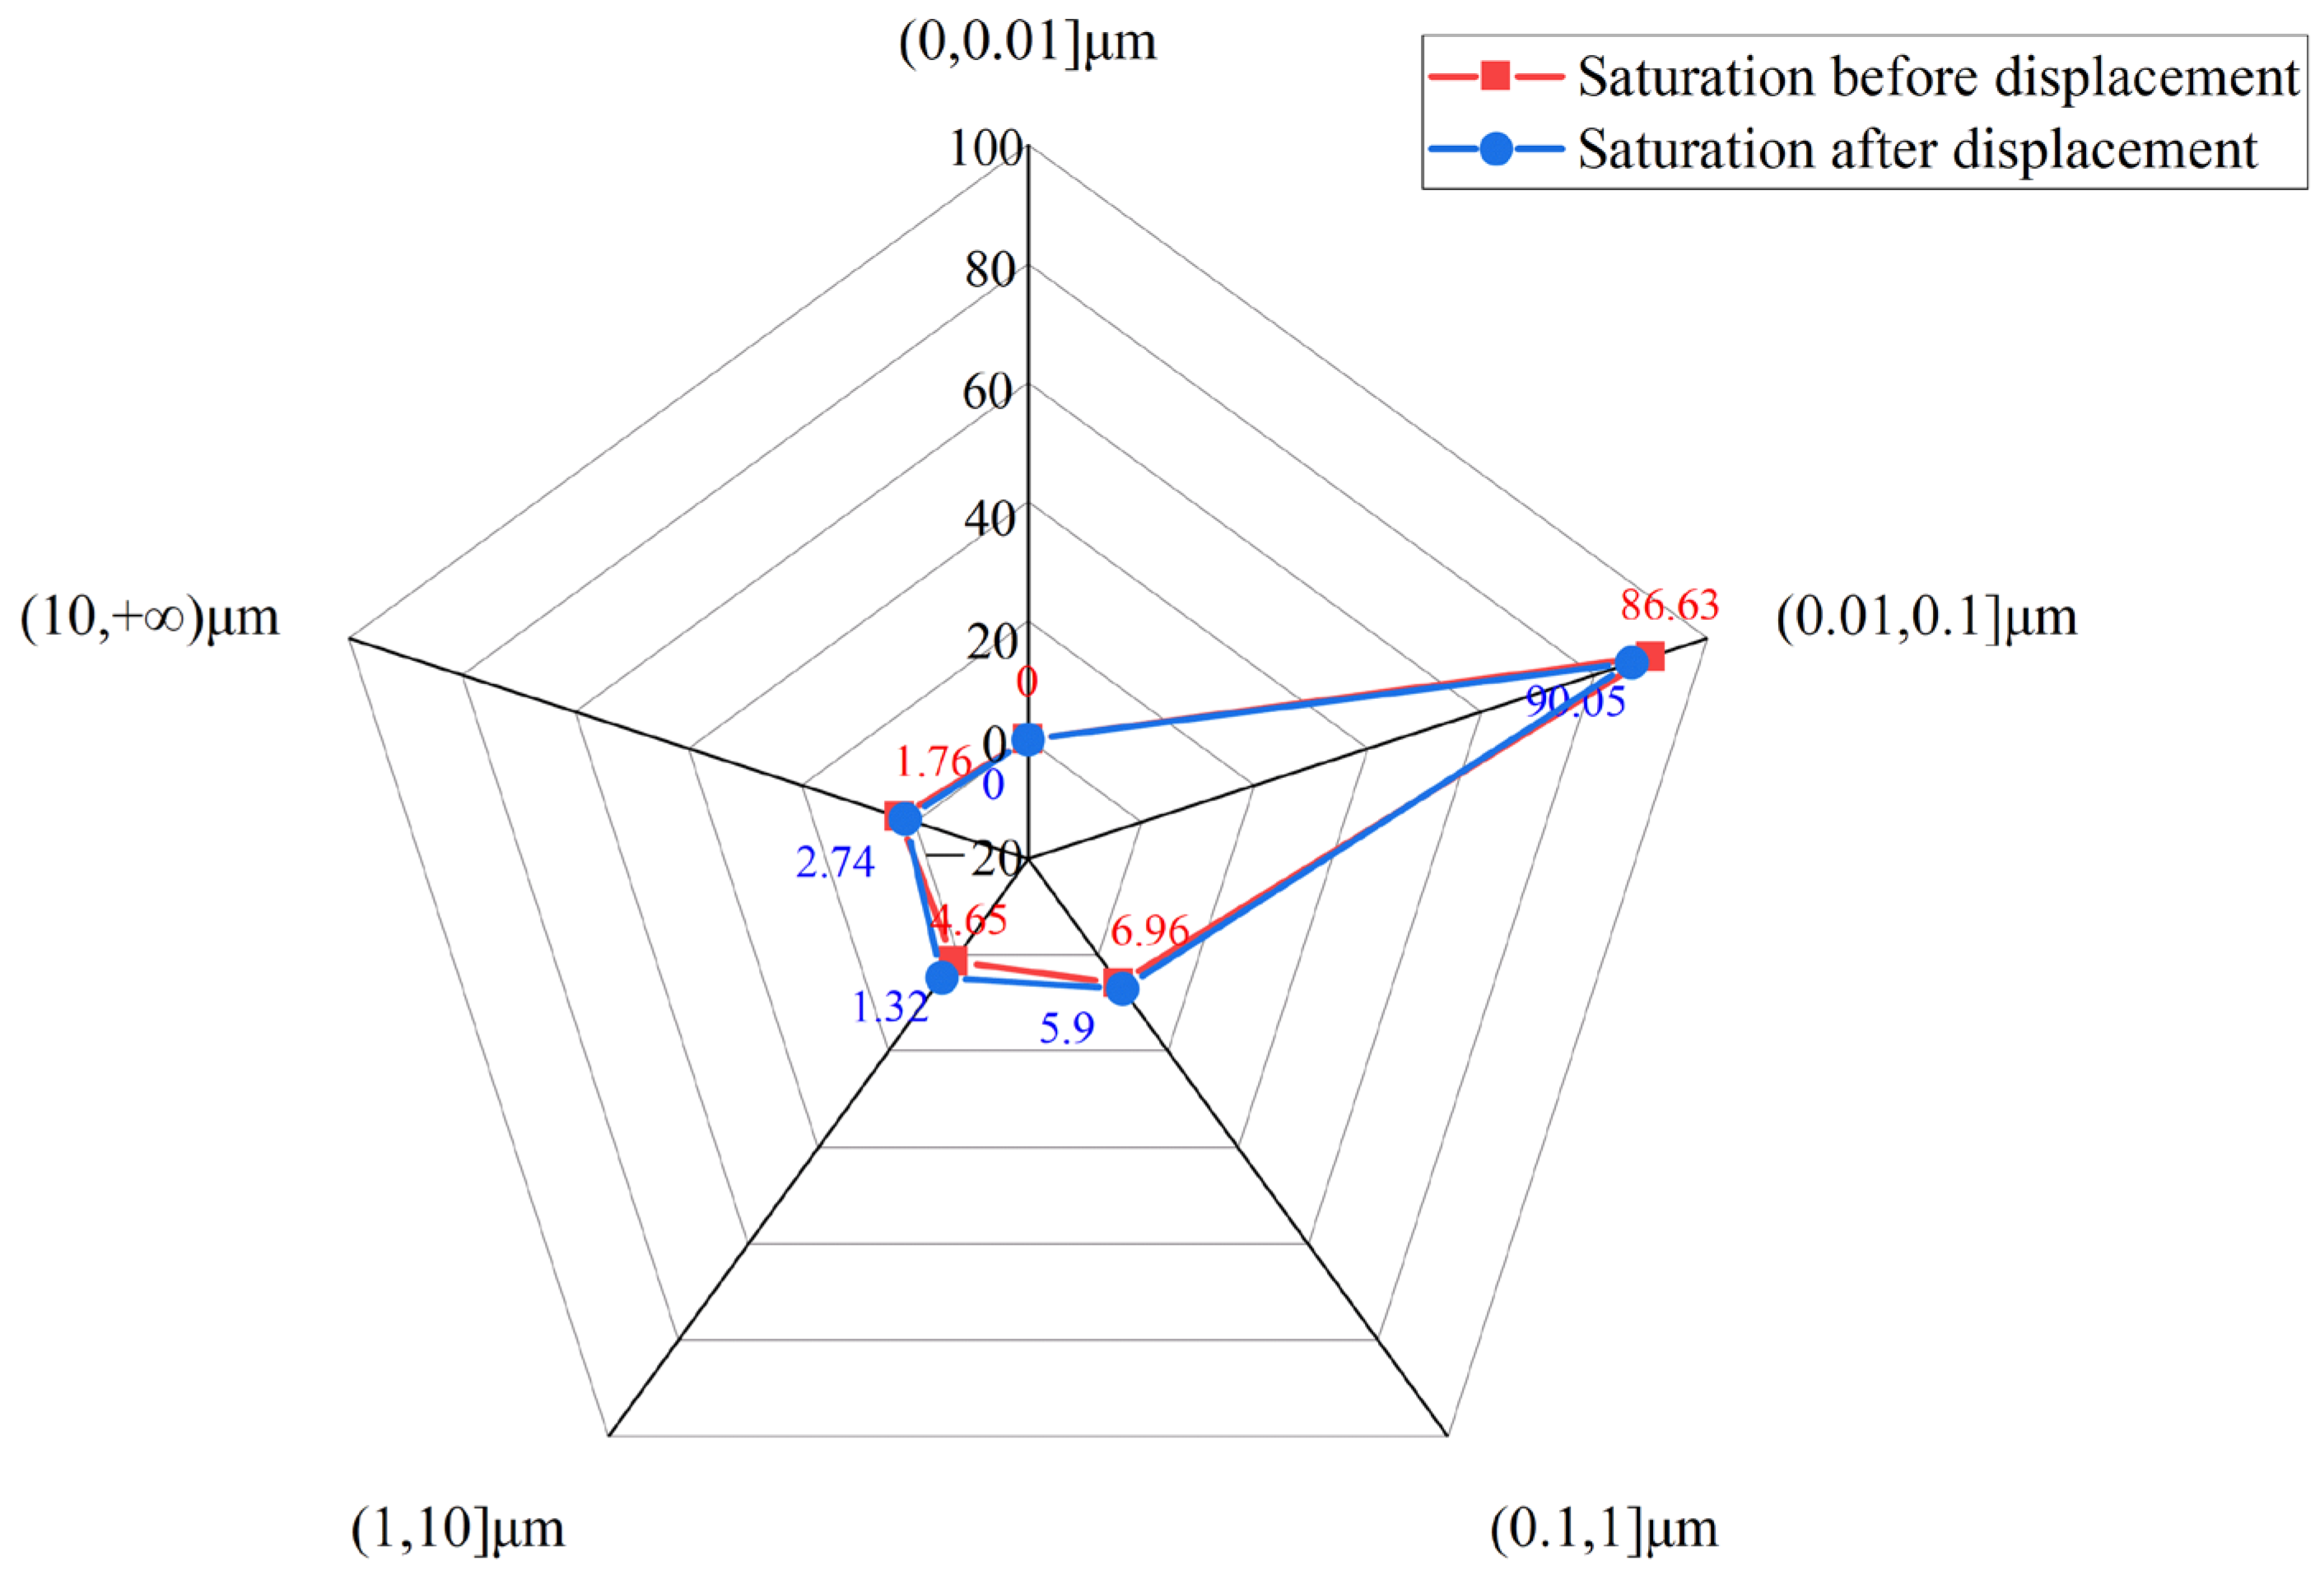
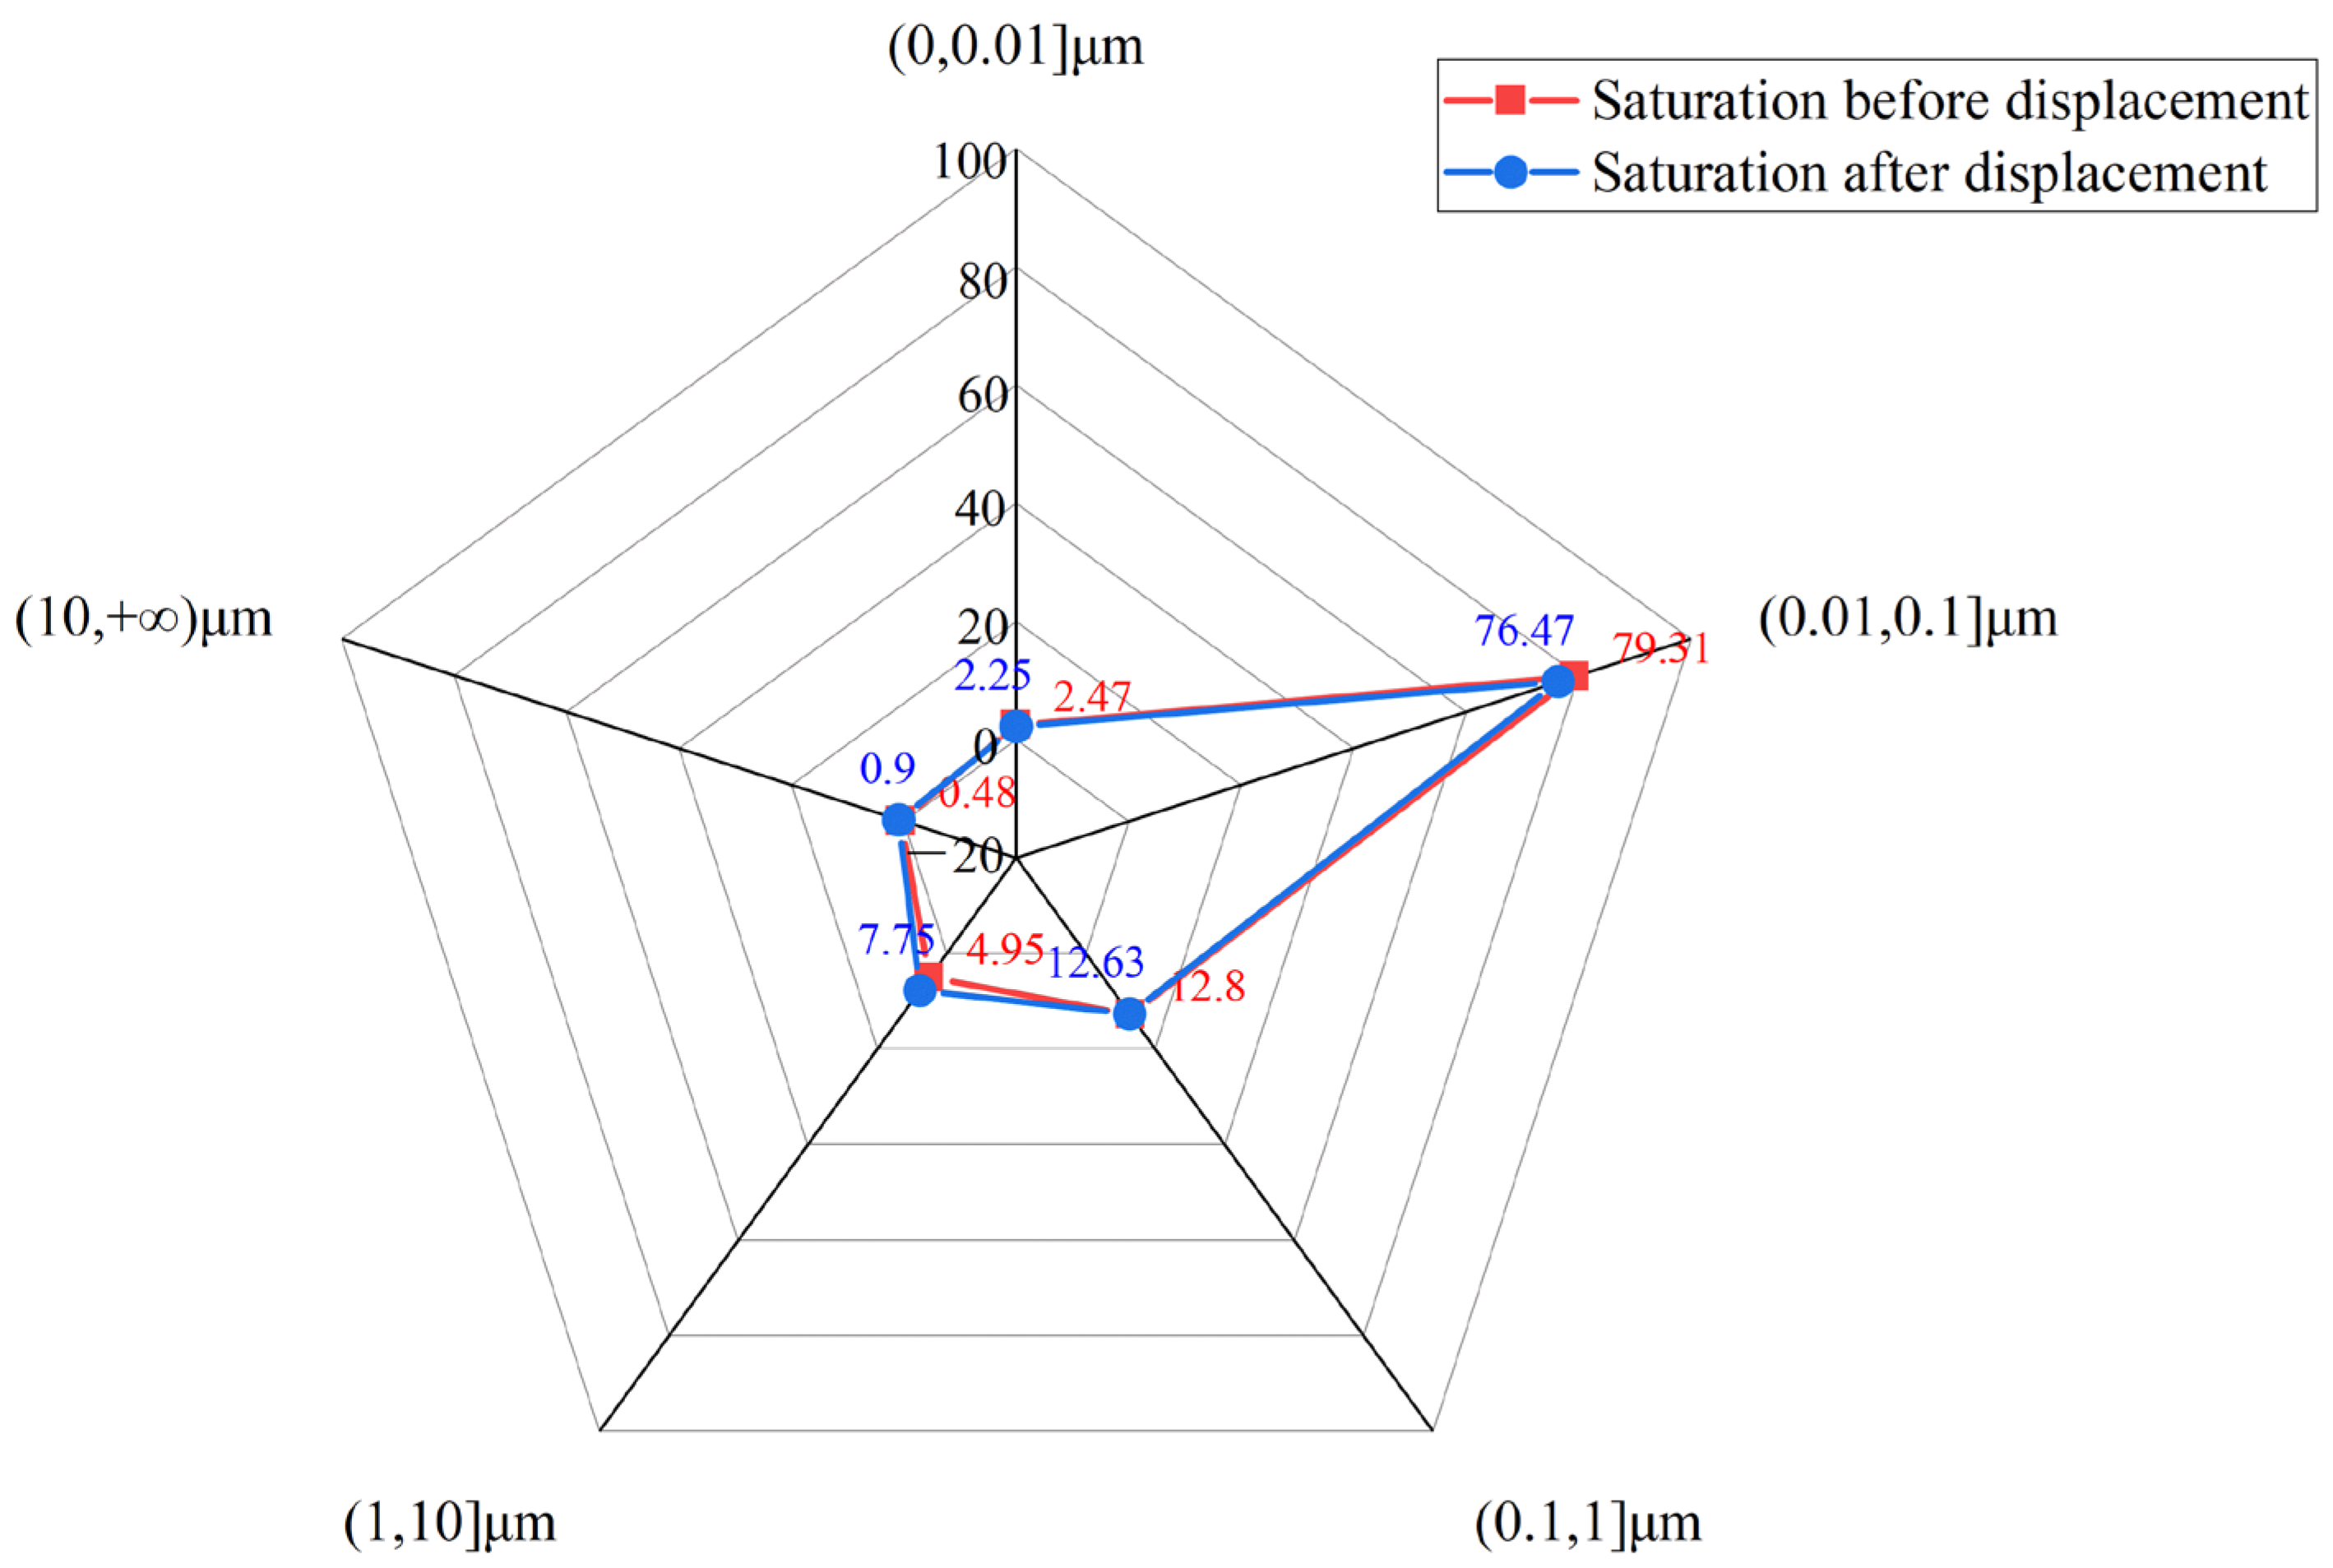
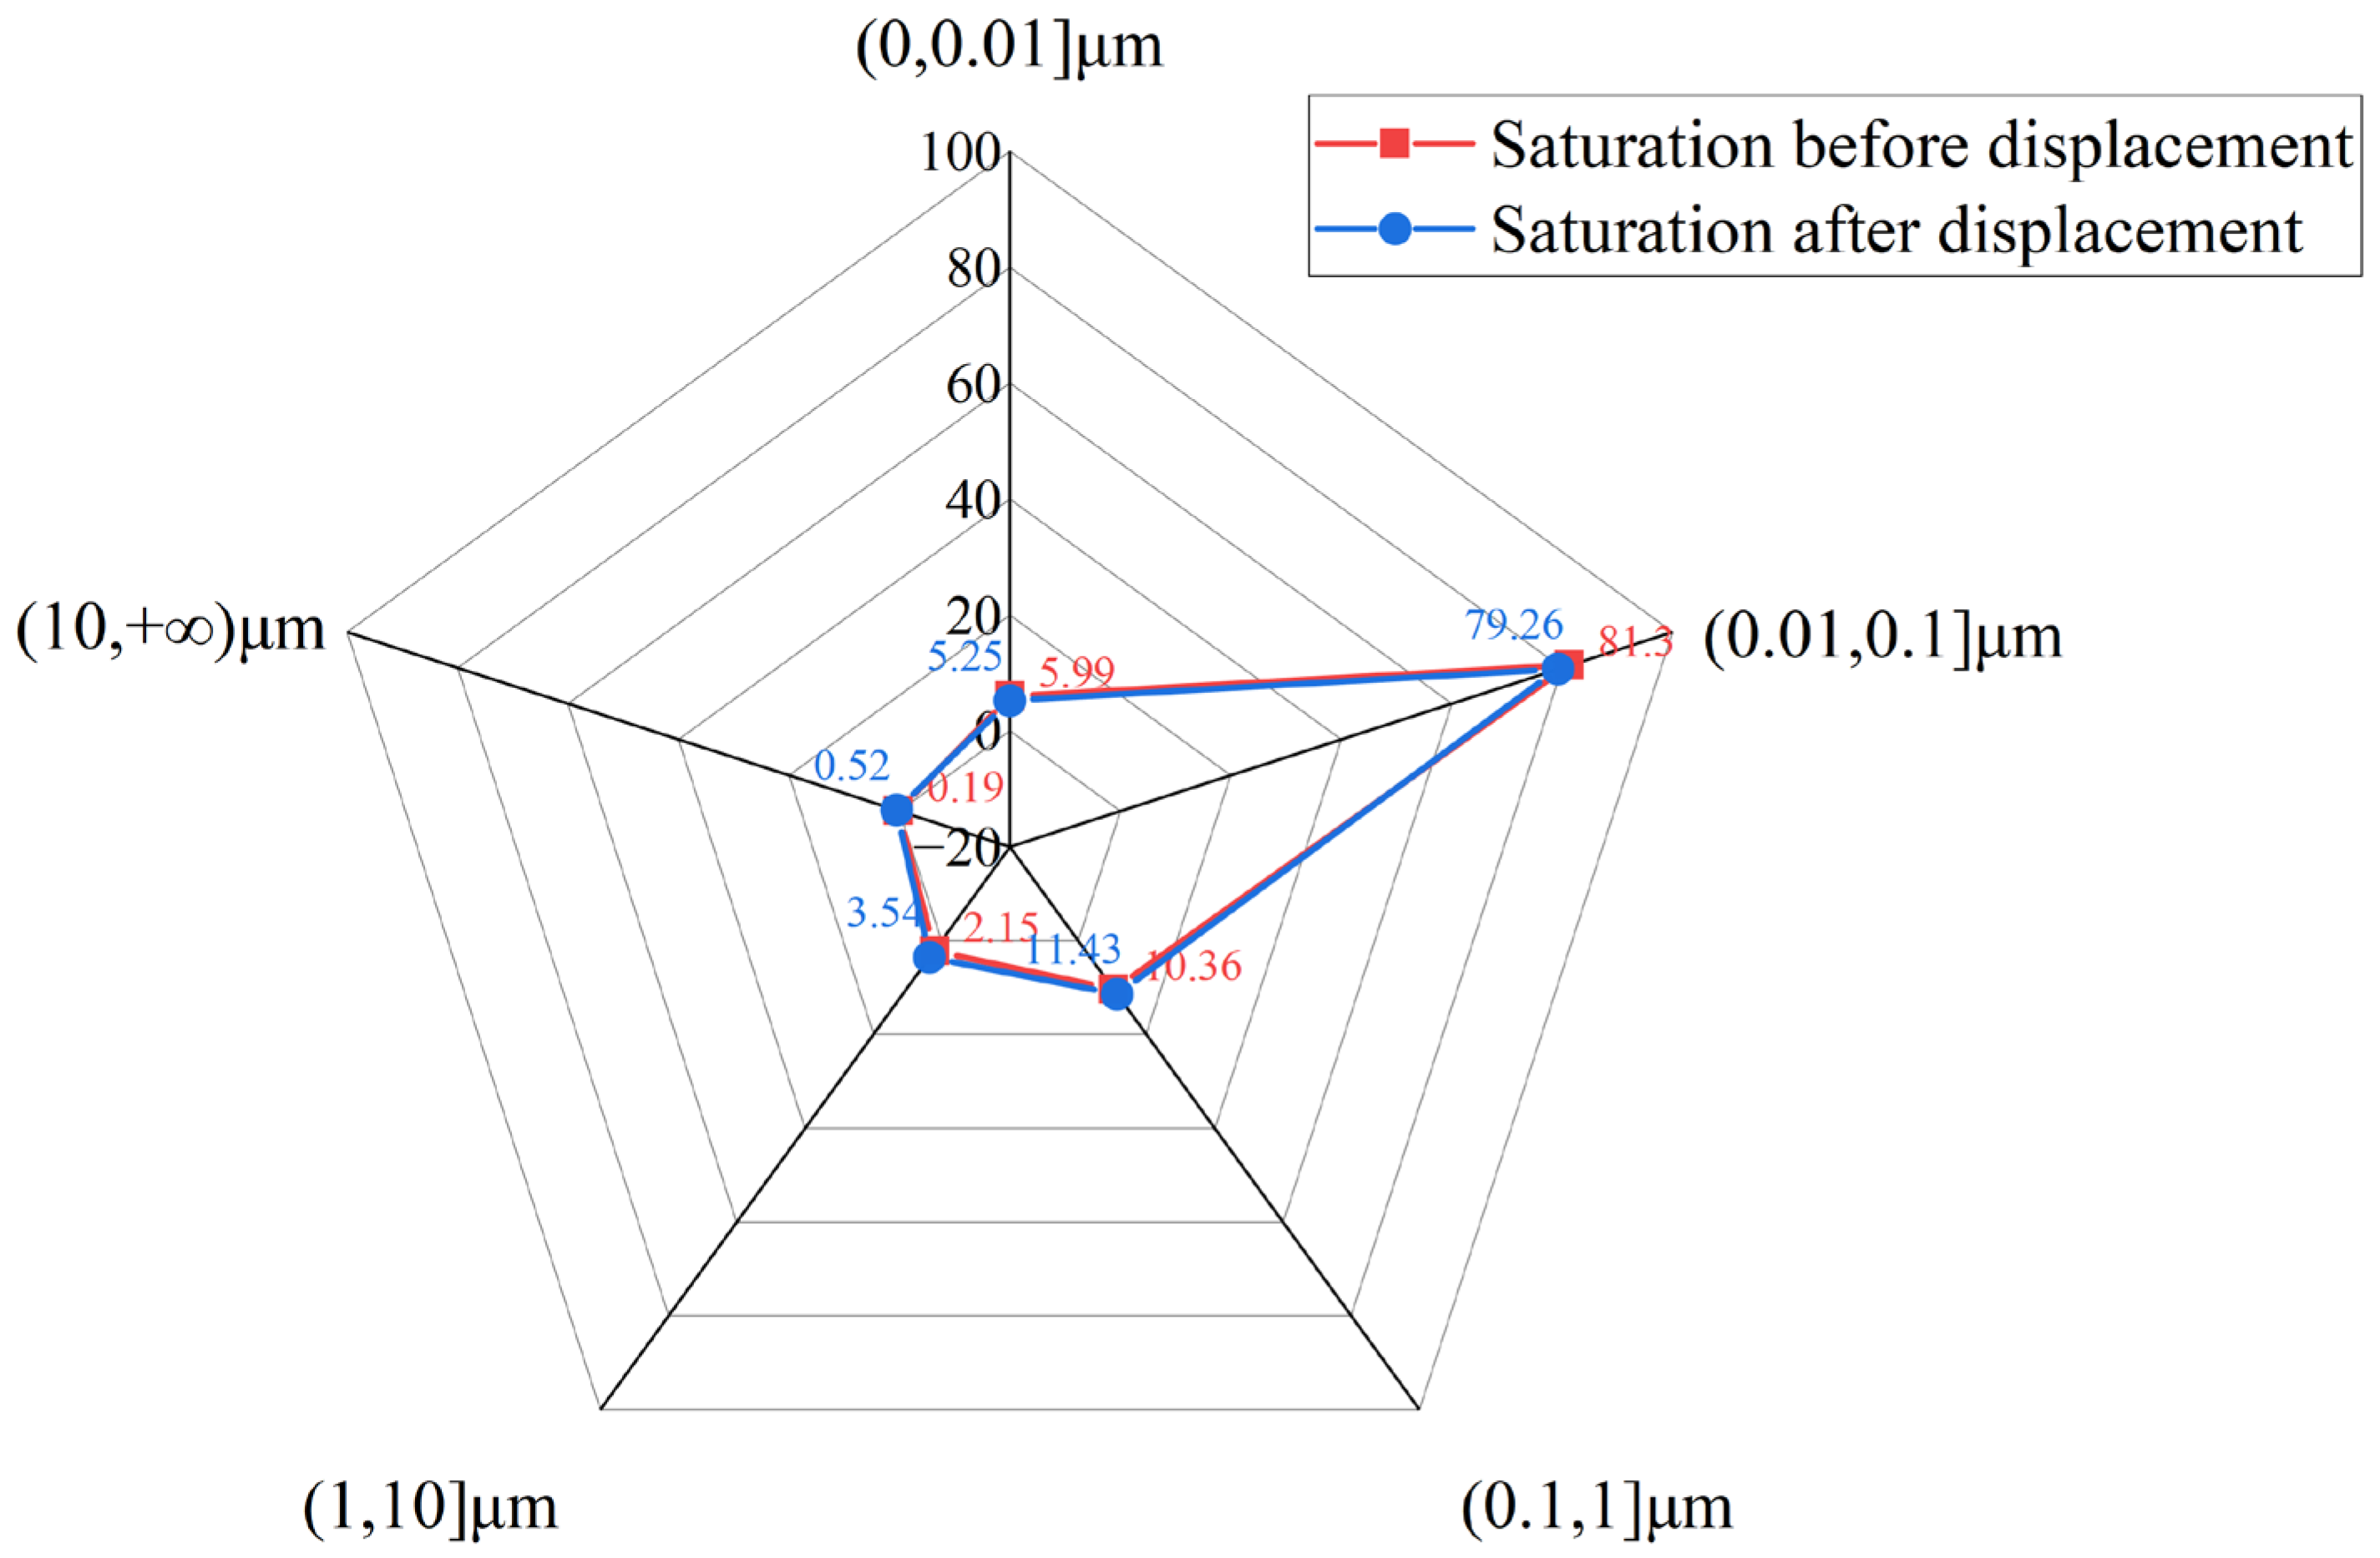
The pores were categorized into five size ranges (≤0.01 μm, 0.01–0.1 μm, 0.1–1 μm, 1–10 μm, and ≥10 μm). The proportions of each pore type are presented in Figure 13, Figure 14 and Figure 15. Before and after displacement, the predominant pore size in the soil samples was 0.01–0.1 μm. The pore volume proportion for this size ranged from 76.47% to 90.05%. Compared to the pore size distribution in the soil samples before SCO2 displacement, the pore proportions (>0.1 μm) after displacement increased for all samples. Their growth rates were 34.37%, 16.79%, and 21.87%, respectively. However, all the pore proportions less than ≤0.1 μm decreased. These test results demonstrate that SCO2 displacement effectively increases the proportion of large pores, thereby significantly enhancing the permeability of soil samples (in Table 6).
Regarding the above experimental results, there are three hypothesized mechanisms for pore changes: (1) During the displacement processes, the pores in the soil samples are under the combined effects of confining pressure and SCO2. Changes in pore pressure caused by confining pressure and CO2 injection lead to significant alterations in the internal stress of the soil samples. As confining pressure increases, pore spaces and throats undergo compression and shrinkage. Some throats close off, forming isolated “dead pores”. Once isolated, the water trapped within becomes immobile and cannot be displaced by injected CO2, thereby reducing microporous connectivity [41]. This mechanism is particularly pronounced in unconsolidated formations and significantly impacts the assessment of pore structure under reservoir confining pressure conditions. However, when the SCO2 was injected, the pressure and temperature generated by SCO2 further increased pore sizes, particularly those larger than 0.1 μm. (2) Simultaneously, higher temperature can reduce the viscosity of the fluids within the pores, accelerating flow velocity and improving pore connectivity. (3) Due to a large amount of CaO in the soil samples, the injected SCO2 may react with CaO, causing the dissolution of some soil particles near the pores and, consequently, altering pore size. Ultimately, the combined effects of these two processes resulted in significant alterations to the pore size distribution of soil samples after SCO2 displacement, particularly for pores larger than 0.1 μm.

4. Conclusions and Prospects

This study involved CO2 displacement experiments combined with NMR analysis to investigate the effect of CO2 displacement on the evolution of porosity and permeability in marine unconsolidated strata. The main results are summarized below:
(1) Overpressure permeability tests and adsorption experiments were conducted on remolded soil samples. The results show that the porosity and permeability of the samples decreased sharply as the pressure increased. The fitted absolute adsorption capacities of CO2 and CH4 increased with pressure. Below 25 MPa, the fitted absolute adsorption of CO2 was 2.45 times greater than that of CH4. These experiments demonstrated that pressure significantly influences the permeability and adsorption properties of unconsolidated samples. Furthermore, CO2 has a stronger adsorption capacity than CH4, which facilitates the displacement of CH4 from subsea strata by CO2.
(2) Compared to non-SCO2 displacement, SCO2 displacement yielded greater increments in the porosity and permeability of soil samples. From 30 °C to 70 °C, these increments also increased. The predominant pore size in the soil samples was 0.01–0.1 μm. Following SCO2 displacement, the proportion of pores (>0.1 μm) increased, with the largest growth rate reaching 34.37%. However, all pore proportions ≤0.1 μm decreased. These test results demonstrated that SCO2 displacement could effectively increase the proportion of large pores to enhance the permeability of soil samples.
(3) Due to significant changes in pore characteristics before and after the CO2 displacement experiments, no duplicate experiments were conducted. Examining trends in pore changes before and after displacement across multiple unconsolidated samples revealed that CO2 displacement could moderately enhance the permeability of silty clay formations. This phenomenon may offer potential benefits to improve the seepage velocity of decomposed gas and water in hydrate production.

Author Contributions

Conceptualization, X.L. and Y.H.; methodology, X.L.; validation, Y.W.; formal analysis, H.W.; investigation, J.C.; data curation, Y.W.; writing—original draft preparation, S.Z.; writing—review and editing, X.L.; supervision, Q.H.; project administration, Y.H.; funding acquisition, X.L. All authors have read and agreed to the published version of the manuscript.

Funding

This study was funded by the National Natural Science Foundation of China (Grant No. 42102352) and the National Key Research and Development Program of China (Grant No. 2018YFE0208200).

Institutional Review Board Statement

Not applicable.

Informed Consent Statement

Not applicable.

Data Availability Statement

Data will be made available on request.

Conflicts of Interest

The authors declare that they have no known competing financial interests or personal relationships that could have appeared to influence the work reported in this paper.

Abbreviations

The following abbreviations are used in this manuscript:
NMRNuclear magnetic resonance
SCO2Supercritical CO2

References

  1. Tian, Y.; Ren, X.; Li, K.; Li, X. Carbon Dioxide Emission Forecast: A Review of Existing Models and Future Challenges. Sustainability 2025, 17, 1471. [Google Scholar] [CrossRef] [Scilit]
  2. Benjamin, B.; Rödenbeck, C.; Dohner, J.L.; Keeling, R.F.; Schwartzman, A. Surprising stability of recent global carbon cycling enables improved fossil fuel emission verification. Nat. Clim. Change 2023, 13, 961–966. [Google Scholar] [CrossRef] [Scilit]
  3. Cai, Q.; Zeng, N.; Zhao, F.; Han, P.; Liu, D.; Lin, X.; Chen, J. The impact of human and livestock respiration on CO2 emissions from 14 global cities. Carbon Balance Manag. 2022, 17, 17. [Google Scholar] [CrossRef] [Scilit]
  4. delaVega, E.; Chalk, T.B.; Wilson, P.A.; Bysani, R.P.; Foster, G.L. Atmospheric CO2 during the Mid-Piacenzian Warm Period and the M2 glaciation. Sci. Rep. 2020, 10, 11002. [Google Scholar] [CrossRef] [Scilit]
  5. Peters, G.P.; Andrew, R.M.; Canadell, J.G.; Friedlingstein, P.; Jackson, R.B.; Korsbakken, J.I.; Le Quere, C.; Peregon, A. Carbon dioxide emissions continue to grow amidst slowly emerging climate policies. Nat. Clim. Change 2020, 10, 3–6. [Google Scholar] [CrossRef] [Scilit]
  6. Gooya, R.; Silvestri, A.; Moaddel, A.; Andersson, M.P.; Stipp, S.; Sorensen, O. Unstable, super critical CO2-water displacement in fine grained porous media under geologic carbon sequestration conditions. Sci. Rep. 2019, 9, 11272. [Google Scholar] [CrossRef] [Scilit]
  7. Ringrose, P.S.; Furre, A.K.; Gilfillan, S.M.V.; Krevor, S.; Landro, M.; Leslie, R.; Meckel, T.; Nazarian, B.; Zahid, A. Storage of Carbon Dioxide in Saline Aquifers: Physicochemical Processes, Key Constraints, and Scale-Up Potential. Annu. Rev. Chem. Biomol. Eng. 2021, 12, 12471–12494. [Google Scholar] [CrossRef] [Scilit]
  8. Worden, R.H. Carbon Dioxide Capture and Storage (CCS) in Saline Aquifers versus Depleted Gas Fields. Geosciences 2024, 14, 146. [Google Scholar] [CrossRef] [Scilit]
  9. Ndlovu, P.; Babaee, S.; Naidoo, P. Review on CH4-CO2 replacement for CO2 sequestration and CH4/CO2 hydrate formation in porous media. Fuel 2022, 320, 123795. [Google Scholar] [CrossRef] [Scilit]
  10. Ali, M.; Jha, N.K.; Pal, N.; Keshavarz, A.; Hoteit, H.; Sarmadivaleh, M. Recent advances in carbon dioxide geological storage, experimental procedures, influencing parameter, and future outlook. Earth-Sci. Rev. 2022, 225, 103895. [Google Scholar] [CrossRef] [Scilit]
  11. Aminu, M.D.; Nabavi, S.A.; Rochelle, C.A.; Manovic, V. A review of developments in carbon dioxide storage. Appl. Energy 2017, 208, 1389–1419. [Google Scholar] [CrossRef] [Scilit]
  12. Kali, R.F.S.; Fan, D.; Hazel, N.; Striolo, A. Techno-socio-economic analysis of geological carbon sequestration opportunities. Environ. Sci. Adv. 2022, 1, 138–155. [Google Scholar] [CrossRef] [Scilit]
  13. Eiken, O.; Ringrose, P.; Hermanrud, C.; Nazarian, B.; Torp, T.A.; Hoier, L. Lessons learned from 14 years of CCS operations: Sleipner, In Salah and Snohvit. Energy Procedia 2011, 4, 5541–5548. [Google Scholar] [CrossRef] [Scilit]
  14. Cavanagh, A.J.; Haszeldine, R.S. The Sleipner storage site: Capillary flow modeling of a layered CO2 plume requires fractured shale barriers within the Utsira Formation. Int. J. Greenh. Gas Control 2014, 21, 101–112. [Google Scholar] [CrossRef] [Scilit]
  15. Pradhan, S.; Bhattacherjee, R.; Aichele, C.; Bikkina, P. Determination of CO2 solubility in brines and produced waters of various salinities for CO2 EOR and storage applications. Chem. Eng. 2025, 507, 16040. [Google Scholar] [CrossRef] [Scilit]
  16. Ye, Y.; Chen, Y.; Yao, X.; Dong, P.; Chen, Y.; Niu, Y.; Duan, J.; Wu, Z.; Li, Y.; Jiang, Y.; et al. How injecting CO2 enhances marine natural gas hydrate exploitation: Review and prospect. Renewable and Sustainable Energy Rev. 2025, 222, 116011. [Google Scholar] [CrossRef] [Scilit]
  17. Takao, E. Method for Dumping and Disposing of Carbon Dioxide Gas and Apparatus Therefor. Google Patents. U.S. Patent 5,261,490, 16 November 1993. [Google Scholar]
  18. Ohgaki, K.; Takano, K.; Sangawa, H.; Matsubara, T.; Nakano, S. Methane exploitation by carbon dioxide from gas hydrates—Phase equilibria for CO2-CH4 mixed hydrate systemtl. J. Chem. Eng. Jpn. 1996, 29, 478–483. [Google Scholar] [CrossRef] [Scilit]
  19. Pandey, J.S.; von Solms, N. Hydrate stability and methane recovery from gas hydrate through CH4–CO2 replacement in different mass transfer scenarios. Energies 2019, 12, 2309. [Google Scholar] [CrossRef] [Scilit]
  20. Ota, M.; Abe, Y.; Watanabe, M.; Smith, R.L., Jr.; Inomata, H. Methane recovery from methane hydrate using pressurized CO2. Fluid Phase Equilibria 2005, 228, 553–559. [Google Scholar] [CrossRef] [Scilit]
  21. Zhang, X.; Yang, L.; Wang, Q.; Zhao, F.; Dong, S.; Yang, J.; Liu, Y.; Song, C. Enhanced CH4 recovery and CO2 storage via thermal stimulation in the CH4/CO2 replacement of methane hydrate. Chem. Eng. J. 2017, 308, 40–49. [Google Scholar] [CrossRef] [Scilit]
  22. Tupsakhare, S.; Castaldi, J. Efficiency enhancements in methane recovery from natural gas hydrates using injection of CO2/N2 gas mixture simulating in-situ combustion. Appl. Energy 2019, 236, 825–836. [Google Scholar] [CrossRef] [Scilit]
  23. Liu, T.; Wu, P.; Chen, R.; Li, H. Review on carbon dioxide replacement of natural gas hydrate: Research progress and perspectives. Energy Fuels 2022, 36, 7321–7336. [Google Scholar] [CrossRef] [Scilit]
  24. Li, J.; Ye, J.; Qin, X.; Qiu, H.; Wu, N.; Lu, H.; Xie, W.; Lu, J.; Peng, F.; Xu, Z.; et al. The first offshore natural gas hydrate production test in South China Sea. China Geol. 2018, 1, 5–16. [Google Scholar] [CrossRef] [Scilit]
  25. Li, Z.; Su, Y.; Li, L.; Hao, Y.; Wang, W.; Meng, Y.; Zhao, A. Evaluation of CO2 storage of water alternating gas flooding using experimental and numerical simulation methods. Fuel 2022, 311, 122489. [Google Scholar] [CrossRef] [Scilit]
  26. Li, X.; Tian, Y.; Zhang, X.; Song, G.; Zhao, M.; Liang, J.; Huang, W.; Meng, F. Numerical Simulation Study on the Effect of Horizontal Well Reservoir Stimulation for Gas Hydrate Production. Acta Geol. Sin. (Engl. Ed.) 2022, 96, 701–712. [Google Scholar] [CrossRef] [Scilit]
  27. Jing, E.; Zhao, X.; Luo, H.; Liu, G.; Chen, K.; Wang, M.; Deng, M.; Wu, L.F. Marine controlled-source electromagnetic imaging of natural gas hydrates and gas source conditions in the Shenhu area of the South China Sea. Acta Geol. Sin. 2024, 98, 2024185. [Google Scholar] [CrossRef]
  28. Ye, L.; Qin, W.; Qiu, J.; Xie, W.; Lu, F.; Lu, C.; Zhou, H.; Liu, Y.; Yang, B.; Cao, J.; et al. Data report: Molecular and isotopic compositions of the extracted gas from China’s first offshore natural gas hydrate production test in South China Sea. Energies 2018, 11, 2793. [Google Scholar] [CrossRef] [Scilit]
  29. Nikolai, P.; Rabiyat, B.; Aslan, A.; Llmutdin, A. Supercritical CO2: Properties and Technological Applications—A Review. J. Therm. Sci. 2019, 28, 394–430. [Google Scholar] [CrossRef] [Scilit]
  30. Yu, L.; Ma, X.; Gan, Y.; Zhang, H.; Wen, Z.; Du, X. Response characteristics of shale permeability to cyclic loading under different gas pressures. Sci. Rep. 2025, 15, 27839. [Google Scholar] [CrossRef] [Scilit]
  31. Tao, L.; Wen, M.; Yue, D.; Zhao, Z.; Liu, B.; Zhang, J.; Chen, S.; Zhao, X. Unloading-induced permeability recovery in rock fractures. J. Rock Mech. Geotech. Eng. 2023, 15, 3148–3162. [Google Scholar] [CrossRef] [Scilit]
  32. Wen, M.; Harpers, N.; Inskip, N.F.; Buckman, J.; Singh, K.; Miller, P.; Busch, A. Mechanical Responses and Permeability Evolution in Porous Sandstones Under Cyclic Loading Conditions: Implications for Subsurface Hydrogen Storage. Rock Mech. Rock Eng. 2025, 58, 10643–10673. [Google Scholar] [CrossRef] [Scilit]
  33. Tang, X.; Wang, Z.; Ripepi, N.; Kang, B.; Yue, G. Adsorption affinity of different types of coal: Mean isosteric heat of adsorption. Energy Fuels 2015, 29, 3609–3615. [Google Scholar] [CrossRef] [Scilit]
  34. Zaheer, H.; Dzeti, F. Carbon dioxide adsorption on shale: A comparative study of isotherm models across diverse samples and temperatures. In E3S Web of Conferences; EDP Sciences: Les Ulis, France, 2024; Volume 488, p. 03009. [Google Scholar]
  35. Long, F.; Shi, M. A Novel experimental system for accurate gas sorption and its application to various shale rocks. Chem. Eng. Res. Des. 2021, 165, 180–191. [Google Scholar] [CrossRef] [Scilit]
  36. Zhao, Y.; Luo, M.; Zhang, T.; Hu, H.; Yang, C.; Luo, Q.; Guan, B. Competitive adsorption of CH4/CO2 in shale nanopores during static and displacement process. Nat. Gas Ind. B 2024, 11, 239–251. [Google Scholar] [CrossRef] [Scilit]
  37. Rafikova, G.R.; Khasanov, M.K. Replacement of Methane as Part of the Gas Hydrate by Carbon Dioxide in the Stratum with Negative Temperature. J. Eng. Phys. Thermophys. 2023, 96, 312–321. [Google Scholar] [CrossRef] [Scilit]
  38. Zhao, Y.; Zhang, Y.; Lei, X.; Zhang, Y.; Song, Y. CO2 flooding enhanced oil recovery evaluated using magnetic resonance imaging technique. Energy 2020, 203, 117878. [Google Scholar] [CrossRef] [Scilit]
  39. Yao, Y.; Liu, D. Comparison of low-field NMR and mercury intrusion porosimetry in characterizing pore size distributions of coals. Fuel 2012, 95, 152–158. [Google Scholar] [CrossRef] [Scilit]
  40. Wang, C.; Zhao, Y.; Ning, L.; Bi, J. Permeability evolution of coal subjected to triaxial compression based on in-situ nuclear magnetic resonance. Int. J. Rock Mech. Min. Sci. 2022, 159, 105213. [Google Scholar] [CrossRef] [Scilit]
  41. Yan, M.; Lu, Z.; Yang, X.; Zheng, J.; Wang, L.; Hong, Y. Influence of thermodynamic and stress conditions in saline aquifers on CO2 drainage: Optimization of CO2 storage and energy recovery. Adv. Geo-Energy Res. 2025, 18, 207–217. [Google Scholar] [CrossRef] [Scilit]
Figure 1. A map of the Pearl River Mouth Basin on the northern continental shelf of the South China Sea [24].
Applsci 16 01507 g001
Figure 2. Mineral content of the remolded soil.
Applsci 16 01507 g002
Figure 3. Diagram of the CO2 displacement soil sample test bench. 1—carbon dioxide cylinder; 2—CO2 pressurization device; 3—pressure maintenance device; 4—pressure sensor; 5—confining pressure control device; 6—temperature control system (oven); 7—soil sample; 8—clamper; 9—water collector.
Applsci 16 01507 g003
Figure 4. The CO2 injection process in the soil sample.
Applsci 16 01507 g004
Figure 5. Variation curves of soil sample porosity and permeability under different pressures.
Applsci 16 01507 g005
Figure 6. Adsorption capacity of the soil samples for CO2.
Applsci 16 01507 g006
Figure 7. Adsorption capacity of the soil samples for CH4.
Applsci 16 01507 g007
Figure 8. Permeability of the soil samples before and after CO2 displacement at different temperatures.
Applsci 16 01507 g008
Figure 9. Permeability increment of the soil samples at different temperatures.
Applsci 16 01507 g009
Figure 10. T2 comparison curves of No. 5 soil samples before/after SCO2 displacement.
Applsci 16 01507 g010
Figure 11. T2 comparison curves of No. 6 soil samples before/after SCO2 displacement.
Applsci 16 01507 g011
Figure 12. T2 comparison curves of No. 7 soil samples before/after SCO2 displacement.
Applsci 16 01507 g012
Figure 13. Proportions of different pore sizes in No. 5 soil samples before and after displacement.
Applsci 16 01507 g013
Figure 14. Proportions of different pore sizes in No. 6 soil samples before and after displacement.
Applsci 16 01507 g014
Figure 15. Proportions of different pore sizes in No. 7 soil samples before and after displacement.
Applsci 16 01507 g015
Table 1. Basic physical properties of the soil samples.
Density (ρ)1.61 g/cm3
Water content (w)28.56%
Porosity (n)44.27%
Permeability (mD)17.19
Table 2. XRF analysis of the component content of soil samples.
ComponentSiO2Al2O3CaOFe2O3MgOK2ONa2O
Content (wt.%)52.6517.1011.747.023.373.641.85
Table 3. EDS analysis of element content in the remolded soil.
ComponentsO2SiAlFeNaMgKCaSTi
Content (wt.%)47.1729.027.554.753.462.802.451.200.630.32
Table 4. Parameters of the CO2 displacement experiments.
NumberConfining PressureCO2 Injection PressureInjection
Temperature
CO2 Phase State
No. 110 MPa6 MPa25 °Cnon-supercritical phase
No. 210 MPa8 MPa25 °Cnon-supercritical phase
No. 310 MPa8 MPa30 °Csupercritical phase
No. 410 MPa8 MPa40 °Csupercritical phase
No. 510 MPa8 MPa50 °Csupercritical phase
No. 610 MPa8 MPa60 °Csupercritical phase
No. 710 MPa8 MPa70 °Csupercritical phase
No. 810 MPa8 MPa80 °Csupercritical phase
Note: Due to variations in the initial permeability and porosity of each soil sample, duplicate tests could not be performed on any single sample. Therefore, each CO2 displacement experiment was conducted only once.
Table 5. NMR porosity and weight porosity before/after displacement of the soil samples.
NumberNMR Porosity Before DisplacementNMR Porosity After DisplacementIncrement of NMR
Porosity
Weight Porosity Before
Displacement
Weight
Porosity After
Displacement
Increment of Weight
Porosity
No. 125.24%26.76%1.52%25.08%26.47%1.39%
No. 226.08%27.55%1.47%25.27%27.28%2.01%
No. 322.97%24.97%2.00%22.54%24.64%1.90%
No. 422.26%24.51%2.25%22.62%24.19%1.57%
No. 521.96%27.82%5.86%21.79%27.37%5.58%
No. 621.91%29.14%7.23%21.65%28.94%7.29%
No. 724.51%34.64%10.13%24.35%33.99%9.64%
No. 823.05%30.47%7.42%22.91%29.91%7.00%
Table 6. Pore percentage change before/after displacement in No. 5, No. 6 and No. 7 soil samples.
Soil Sample NumberPore Percentage Before Displacement
(≤0.1 μm)
Pore Percentage After Displacement
(≤0.1 μm)
IncrementPore Percentage Before Displacement
(>0.1 μm)
Pore Percentage After Displacement
(>0.1 μm)
Increment
No. 590.05%86.63%−3.80%9.95%13.37%34.37%
No. 681.78%78.72%−3.85%18.22%21.28%16.79%
No. 787.29%84.51%−3.18%12.71%15.49%21.87%
Disclaimer/Publisher’s Note: The statements, opinions and data contained in all publications are solely those of the individual author(s) and contributor(s) and not of MDPI and/or the editor(s). MDPI and/or the editor(s) disclaim responsibility for any injury to people or property resulting from any ideas, methods, instructions or products referred to in the content.