1. Introduction
Japan faces converging challenges in road safety and in the regulation and deployment of advanced driver assistance and automated driving technologies [
1]. The driver population is ageing, with those aged 65+ projected to exceed 30% of licence holders by 2030. Consequently, national initiatives promoting advanced driver-assistance systems and partial driving automation have increased. Japanese industry and regulators now emphasise human-centred supervision of Level 2 systems through initiatives such as the Japanese Ministry of Land, Infrastructure, Transport, and Tourism (MLIT) Advanced Safety Vehicle (ASV) Promotion Plan [
1] and the United Nations Economic Commission for Europe World Forum for Harmonization of Vehicle Regulations (UNECE WP.29). These factors underscore the challenge of maintaining driver situation awareness when supervising systems that perform continuous control yet still depend on human oversight.
Research on human interaction with automation consistently highlights the
Out-Of-The-Loop (OOTL) problem [
2,
3], in which operators lose system and environmental awareness without direct control. During Level 2 automation, the driver remains responsible for monitoring but often experiences reduced engagement and delayed responses once manual control is resumed [
4,
5]. Level 2 driver assistance systems are already deployed in production vehicles and rely on continuous human supervision, making even short-term supervisory degradation a practical safety concern rather than a hypothetical future risk.
Traditional measures of driver attention, such as overall eyes-on-road time, provide limited insight into how attention shifts between visual targets. Situation awareness develops through continuous perceptual sampling and the organisation of gaze [
4,
6,
7,
8]. Therefore, we model transition probabilities between Areas of Interest (AOIs) rather than static glance proportions.
This approach builds on the Malleable Attentional Resources Theory (MART; [
9]), which predicts that attentional resources contract under low-demand conditions, potentially weakening the structured scanning loops that sustain awareness.
This study applies Markov-based gaze analysis to characterise how visual attention patterns evolve during extended supervision of Level 2 driving automation. We interpret supervisory performance through a situation awareness discrepancy model (
; see
Section 2.4), which links the awareness required by the driving environment (
) to that achieved by the driver (
). Prolonged automation exposure is expected to widen this discrepancy through gradual reorganisation of supervisory gaze behaviour, affecting takeover responses.
This study characterises gaze-based supervisory behaviour during Level 2 automation over realistic durations (5–15 min, representative of Japanese expressway intervals; Nippon Expressway Company [
10,
11]), with a focus on methodological clarity and interpretive transparency rather than statistical generalisation alone. The findings are discussed in relation to Japan’s ongoing safety and automation policy objectives.
The remainder of this paper is organised as follows.
Section 2 summarises prior work on driver supervision and gaze analysis;
Section 3 details the experimental method and Markov-based modelling;
Section 4 presents exploratory results across three driving scenarios; and
Section 5 discusses implications within the
framework for system design and driver education in Japan.
2. Related Work
2.1. Driver Supervision and Automation Exposure
Research on driver attention and takeover readiness during partial and conditional automation has grown rapidly, focusing on how engagement changes with automation exposure [
5,
12]. Level 2 driving automation requires the driver to supervise the system continuously, yet sustained attention is difficult to maintain when control is stable and demands are low [
13,
14].
Repeated findings show that prolonged automation leads to reduced engagement and slower takeovers [
5,
15,
16]. In a 40 min simulation, hazard detection rates fell by more than 30%, with reaction times lengthening as the drive progressed [
17]. Solis et al. similarly observed reduced P3 amplitudes during partially automated driving compared with manual driving, indicating diminished neural resource allocation to the secondary task despite stable behavioural performance [
18]. These findings are consistent with an attentional underload pattern rather than a classical vigilance decrement, suggesting that reduced effort investment (not fatigue) may underlie early stages of disengagement. Studies comparing short versus extended exposure to automation (5 vs. 20 min; [
19]) and tracking sleepiness/fatigue over the first ∼35 min of highly automated driving [
16] indicate that measurable attentional changes can emerge within ≈15 min of exposure. More direct evidence for a 15 min timescale comes from recent simulator research on vigilance in Level 2 automation. Lin et al. reported that the first vigilance decrement in automated driving occurred around 15 min into the drive, with a second decrement emerging between 25 and 40 min [
20]. In contrast, the first vigilance decrement in manual driving occurred later, after 25 to 40 min, indicating that automated driving accelerates the onset of reduced vigilance. Fifteen-minute automation phases have also been widely used as standard test windows in simulator studies of drowsiness and takeover behaviour under highly automated driving [
21].
2.2. Gaze Behaviour and Situation Awareness
Visual attention is a core component of Situation Awareness (SA), which encompasses perception, comprehension, and projection of environmental states [
13]. Conventional SA measures such as the Situation Awareness Global Assessment Technique (SAGAT; [
13]) and the Situation Awareness Rating Technique (SART; [
22]) offer validated indices but require task interruption or subjective self-report, limiting ecological validity during continuous driving. Recent work has therefore used gaze behaviour as a dynamic, unobtrusive proxy for SA [
23].
Prior work has shown that gaze dispersion narrows under partial occlusion and becomes concentrated when drivers perform a non-driving-related task, illustrating how information availability shapes visual strategies [
4]. Similarly, during 30 min of supervised automation without attention reminders, 11 of 30 drivers (>1/3) made off-path glances longer than 8 s [
24]. When attention reminders were introduced, no driver showed such prolonged glances and on-road focus improved, indicating that simple prompts can restore driver supervision. Naturalistic crash studies support this pattern: Drivers who maintained scanning across forward and peripheral regions were less likely to crash, indicating that balanced visual sampling aids hazard anticipation and crash avoidance [
25]. However, most previous work has averaged gaze data over long time windows, obscuring the sequence and structure of gaze shifts that sustain situation awareness [
6,
7,
8,
26].
A growing line of research therefore models gaze transitions to capture the sequencing of attention and its link to higher levels of situation awareness. One recent study analysed gaze behaviour across 13 Areas of Interest using partial least-squares regression to estimate out-of-the-loop onset from visual strategies [
27].
Drivers with higher mind-wandering scores made fewer mirror and peripheral glances and showed poorer take-over performance, underscoring the need for structurally resolved, scenario-specific analyses linking gaze dynamics with safety outcomes.
2.3. Transition-Based Modelling and Theoretical Context
Beyond descriptive gaze metrics, transition-based analyses provide a structural perspective on how attention is organised. Markov chain approaches quantify the conditional probabilities of gaze shifts between AOIs, revealing how drivers integrate visual information streams [
8,
28]. This level of analysis connects directly with theoretical models: The [
3] complacency framework predicts reduced monitoring during prolonged automation, while [
7,
13] three-level SA model highlights that comprehension and projection depend on sustained cross-referencing of perceptual cues.
This study applies a Markov chain framework to analyse scenario-specific gaze transitions during Level 2 supervision. Scenarios were developed in reference to [
29] to ensure methodological realism and alignment with international test-scenario standards. By examining how transition probabilities evolve over short versus extended automation exposure, the approach provides a reproducible, theory-anchored method for assessing degradation in supervisory gaze structure and its behavioural correlates.
2.4. Situation-Awareness Discrepancy Framework
Building on Endsley’s model of situation awareness and Malleable Attentional Resources Theory (MART), supervisory gaze can be interpreted through the situation awareness discrepancy model
, where
denotes the monitoring effort required by the situation and
the effort actually exhibited by the driver [
30]. This discrepancy provides a descriptive measure linking gaze transition patterns to the efficiency of supervisory control, complementing traditional static allocation indices.
The framework was first introduced in our earlier work on spontaneous gaze behaviour and OOTL detection during driving automation [
30]. That study defined
as the normative monitoring demand and
as the observed monitoring level inferred from gaze data. The present paper extends this concept from individual glances to scenario-level gaze transition probabilities, providing a quantitative means to evaluate how extended automation exposure reshapes supervisory monitoring behaviour.
2.5. Summary of Research Gap and Contributions
The literature reviewed above shows that automation exposure can reduce driver engagement and alter gaze behaviour, with measurable effects on takeover readiness and monitoring quality [
5,
15,
16,
20]. However, much of this work has relied on aggregated gaze measures or long observation windows, such as eyes-on-road proportions or prolonged off-path glances averaged across entire drives [
24,
25]. These approaches obscure how supervisory attention is organised and sustained within specific driving contexts. In addition, reduced engagement is often induced through secondary tasks or explicit attentional manipulations [
4,
14] rather than being allowed to emerge naturally from automation underload. This limits ecological validity when studying everyday Level 2 supervision.
The present study addresses these gaps through four specific contributions.
First, it analyses supervisory gaze behaviour at the scenario level, preserving contextual boundaries rather than aggregating gaze data across entire drives. This enables the assessment of how monitoring strategies adapt to specific supervisory demands.
Second, it models the structure of supervisory gaze using first-order Markov transition probabilities, with particular emphasis on recovery transitions (e.g., mirror-to-road-centre and Human–Machine Interface (HMI)-to-road-centre) that are obscured by allocation-based measures but are central to sustaining situation awareness [
7,
8].
Third, it characterises early supervisory degradation during realistic Level 2 automation exposures (5–15 min) by allowing drivers to drift naturally into an out-of-the-loop state.
Fourth, it extends the situation-awareness discrepancy framework from static gaze allocation to scenario-level transition probabilities, providing a theory-anchored means of interpreting how supervisory efficiency degrades under extended automation [
30].
3. Method
This section describes the experimental design, participants, apparatus, procedures, and measures used to investigate supervisory gaze behaviour during Level 2 automated driving. The experimental protocol comprised a set of non-critical driving scenarios selected to elicit sustained supervision under automated control.
3.1. Participants
Data were collected in 2021 from 43 licensed drivers (mean age
years,
), including 15 females and 28 males. All participants were employees of the Automated Driving Safety Department of the Japan Automobile Research Institute (JARI), where the study was conducted. At the time of data collection, institutional COVID-19 policies restricted recruitment to internal staff, and external participant recruitment was not permitted. Participants had substantial driving experience (
years,
). The study complied with the internal code of ethics of the research institute. All participants held valid driving licences and had normal or corrected-to-normal vision. Participant demographics by automation-duration are outlined in
Table 1.
3.2. Experimental Setup
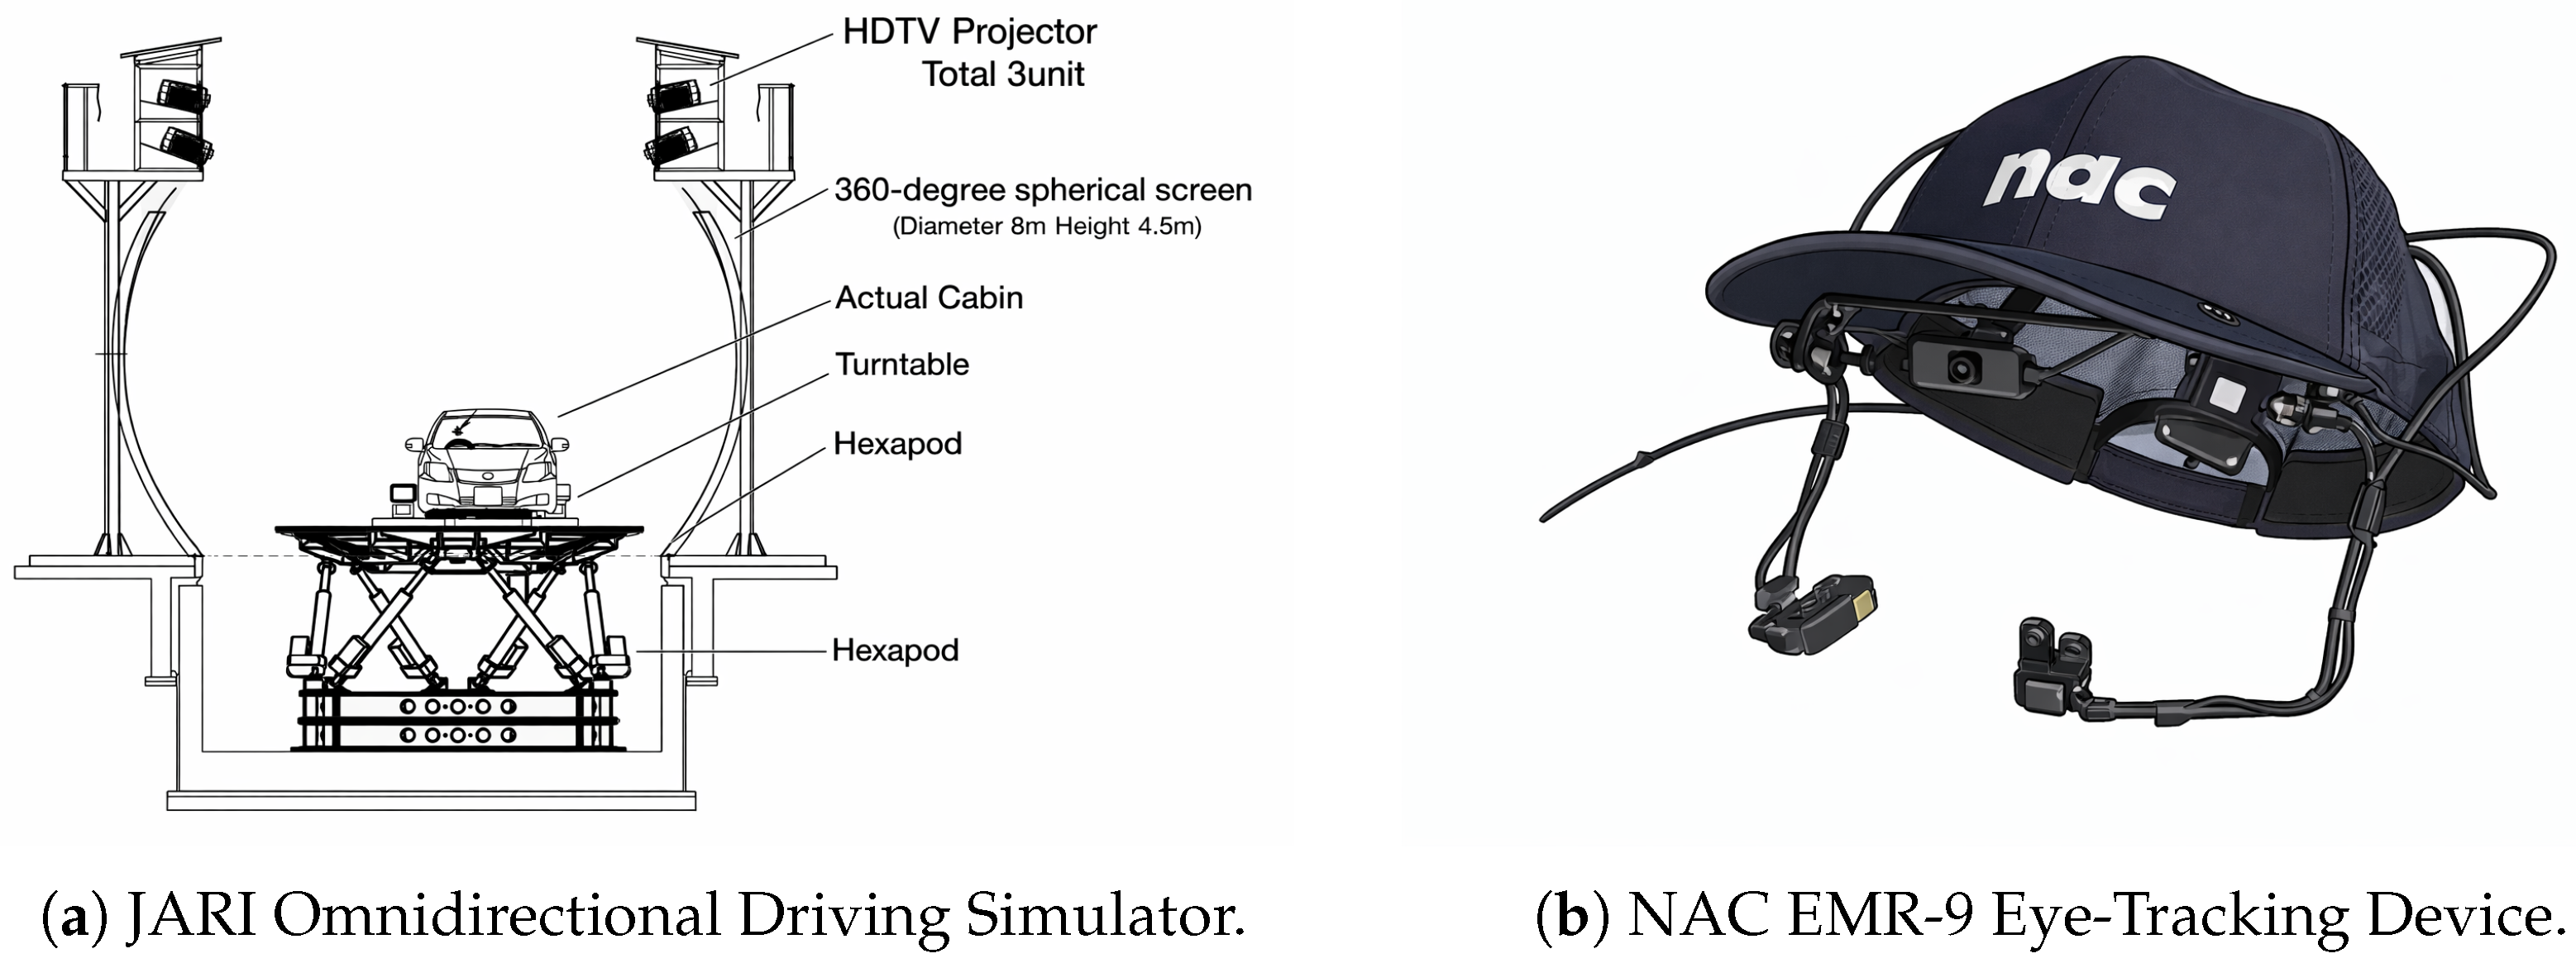
The experiment was conducted in JARI’s high-fidelity 360° driving simulator (
Figure 1a) housed on a six-degree-of-freedom motion base. The simulator comprised a full-size vehicle mock-up with a realistic cabin, steering, and pedal controls, and an integrated HMI display. Eye movements were recorded at 60 Hz using a NAC EMR-9 eye-tracker (
Figure 1b). Calibration followed a nine-point procedure with manual lens adjustment for each eye; when one eye produced unreliable calibration, the dominant eye was used. Experimenters monitored participants from an adjacent control room via intercom.
3.3. Experimental Design
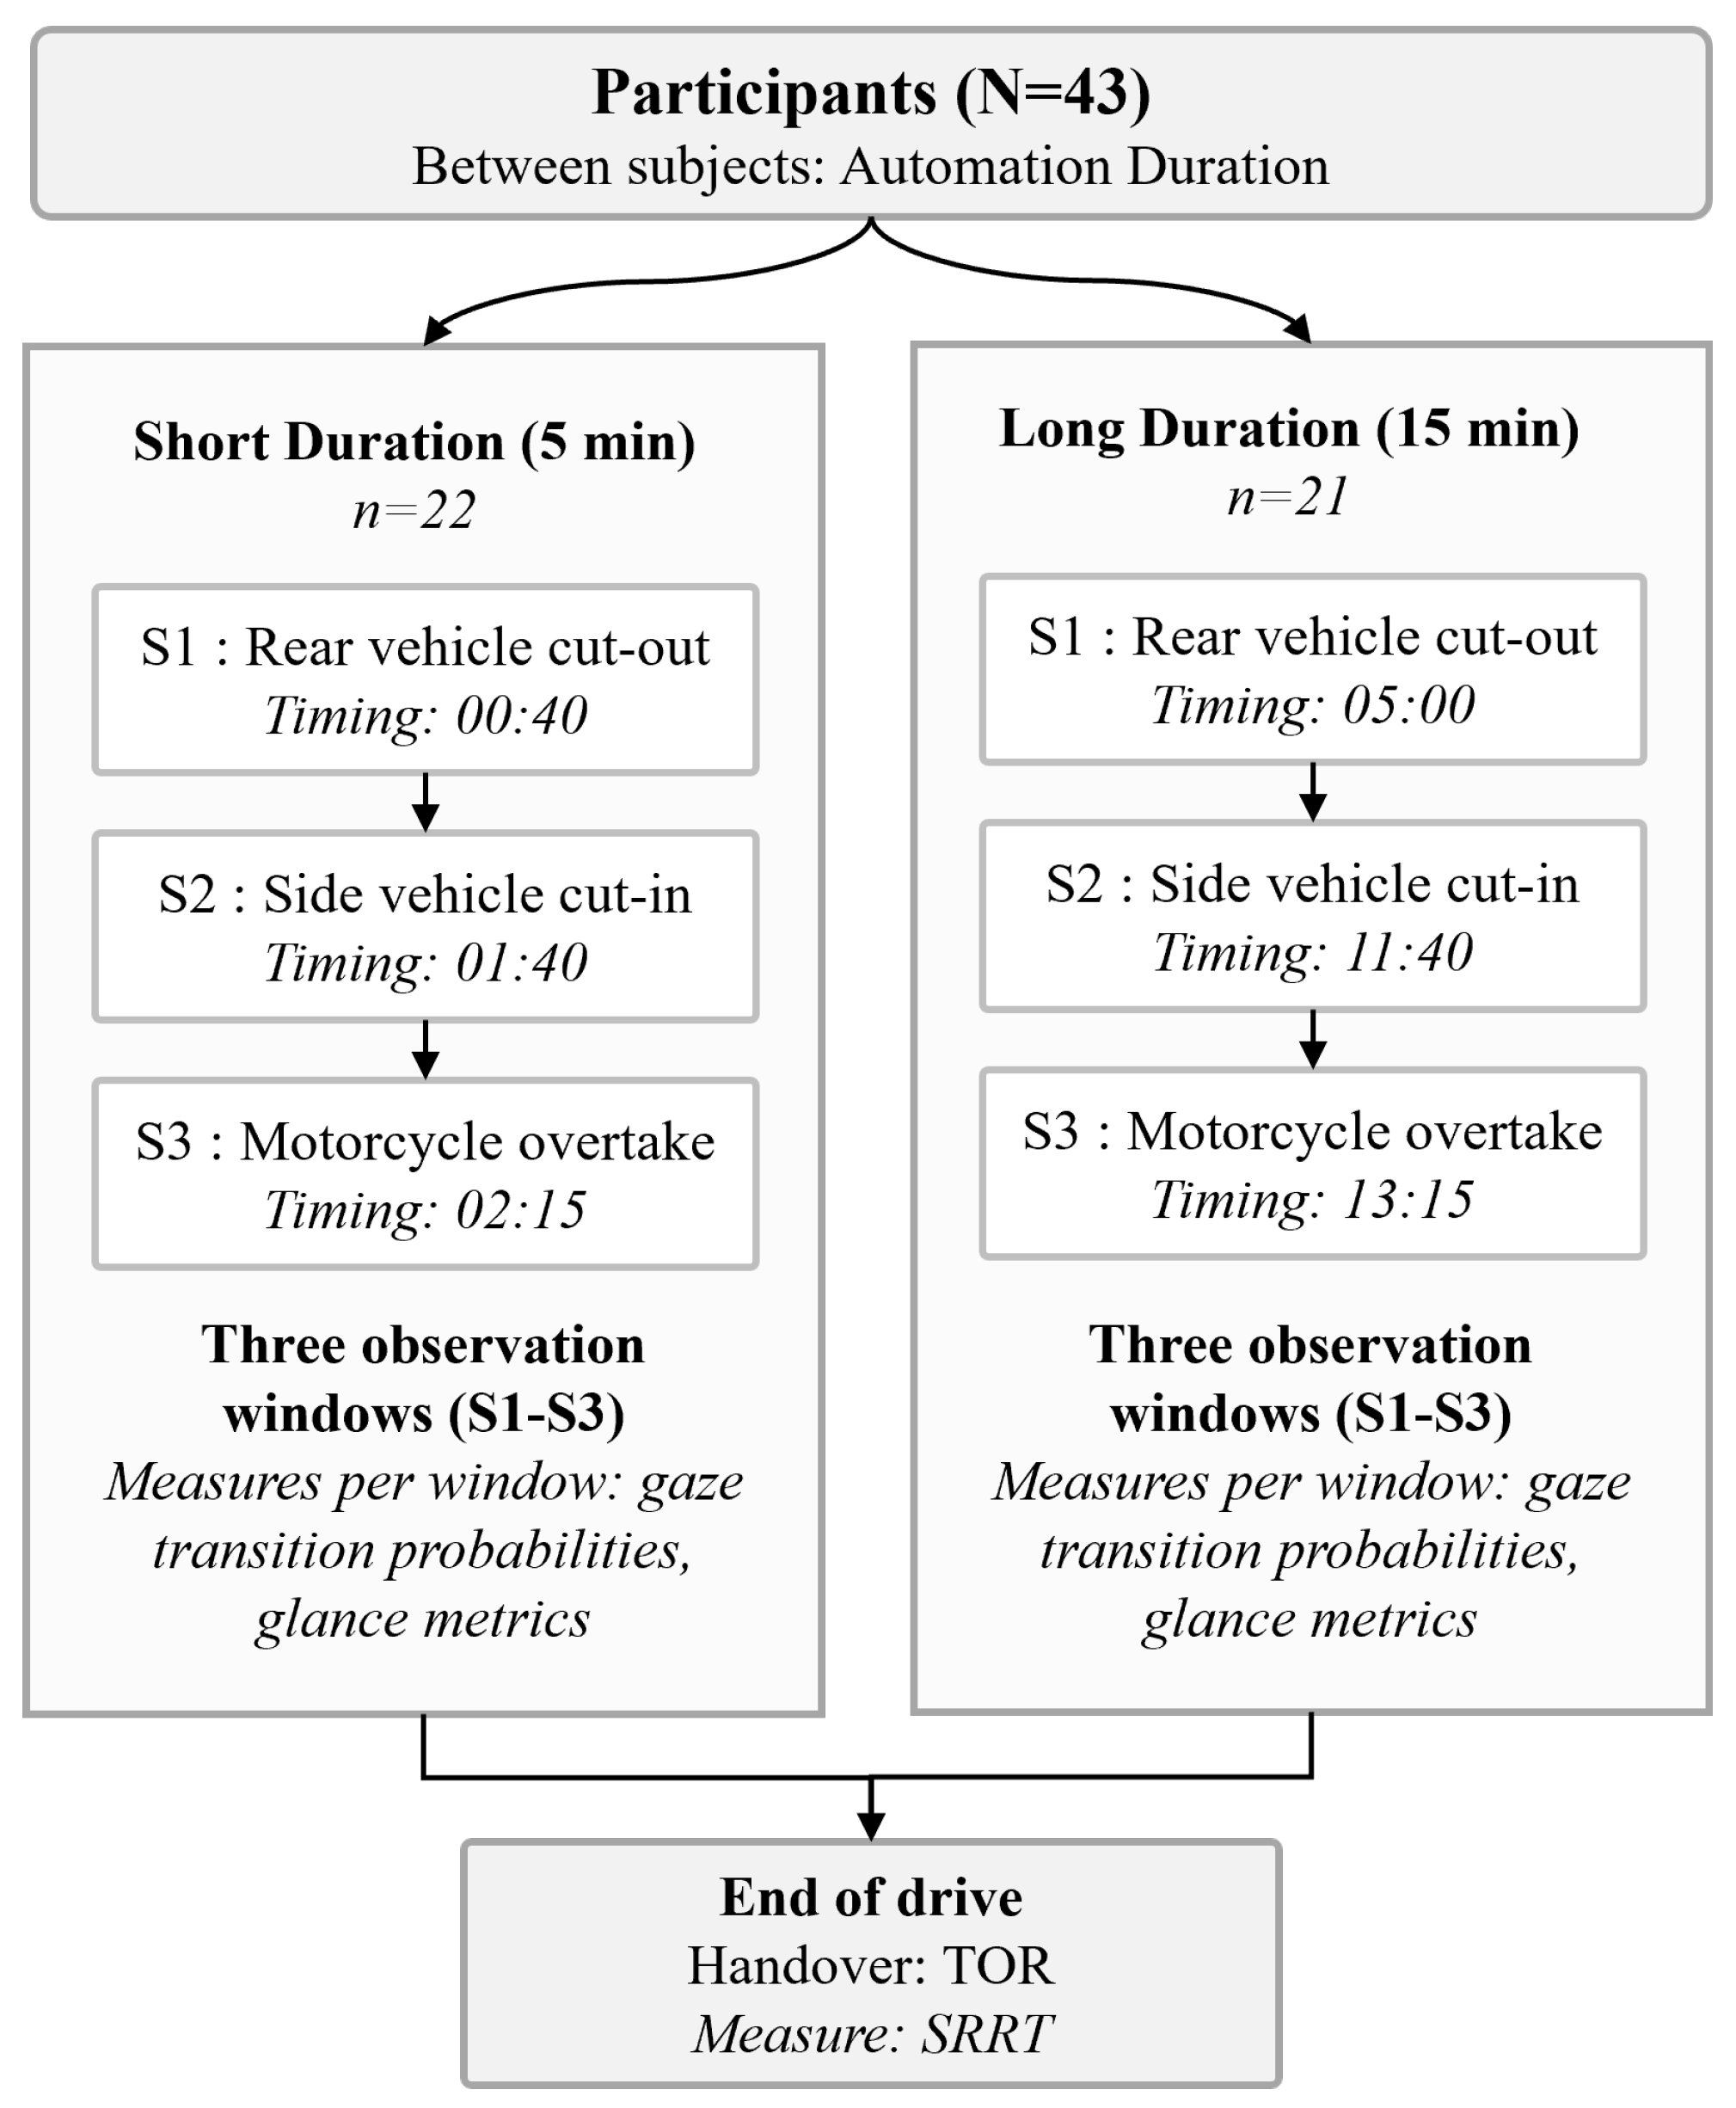
The study employed a between-subjects design based on automation duration (
Figure 2). Participants were randomly assigned to one of two exposure conditions:
The 5 min duration was intentionally selected to represent an early supervisory period in which participants were expected to remain alert. The 15 min duration was selected because simulator evidence indicates that vigilance decrement under Level 2 automated driving can emerge on this timescale [
20]. In addition, these exposure windows correspond to typical intervals between rest facilities on Japanese expressways, where Parking Areas and Service Areas are spaced such that drivers encounter rest opportunities on the order of 10–15 min of expressway driving [
10]. Following the approach in [
30], scenario timing was arranged to occur at fixed points within these exposure windows, enabling comparable environmental contexts between groups while capturing vigilance changes over time. Each participant experienced three non-critical driving scenarios under continuous Level 2 automation, followed by a single takeover request (TOR) at the end of the drive. All inferential analyses contrasted automation durations
within each scenario; between-scenario comparisons were not performed.
3.4. Procedure
The experiment began with a familiarisation phase to ensure participants understood both the simulator controls and the automation behaviour. Each participant first completed a 5 min manual driving trial for acclimatisation followed by a 5 min hands-off automated drive that included a practice takeover to confirm comprehension of system alerts and response timing.
During the main experimental phase, participants supervised their assigned automation condition (short: 5 min; long: 15 min) while driving along a simulated highway. They were instructed to remain attentive and monitor the environment throughout automation engagement. No secondary tasks were introduced, allowing spontaneous monitoring and natural gaze allocation to be measured under ecologically valid conditions. This design isolated automation duration effects on vigilance without confounding cognitive load from non-driving activities. The experimental procedure timeline is illustrated in
Figure 3.
3.5. Scenarios
Participants supervised the Level 2 driving automation system under normal traffic conditions on a simulated two-lane, bi-directional expressway. The virtual road replicated the geometry of Japanese Metropolitan Expressways, featuring elevated sections with tall noise barriers on both sides. The left (passenger-side) barrier and roadside vegetation provided minimal driving-relevant information, whereas the right (driver-side) lane carried other traffic. This asymmetric visual environment was intentional, enabling assessment of how drivers allocate gaze toward informative versus non-informative areas.
Across the session, participants encountered three non-critical driving scenarios, each designed to elicit distinct visual–cognitive demands.
3.5.1. Scenario 1: Rear-Vehicle Cut-Out
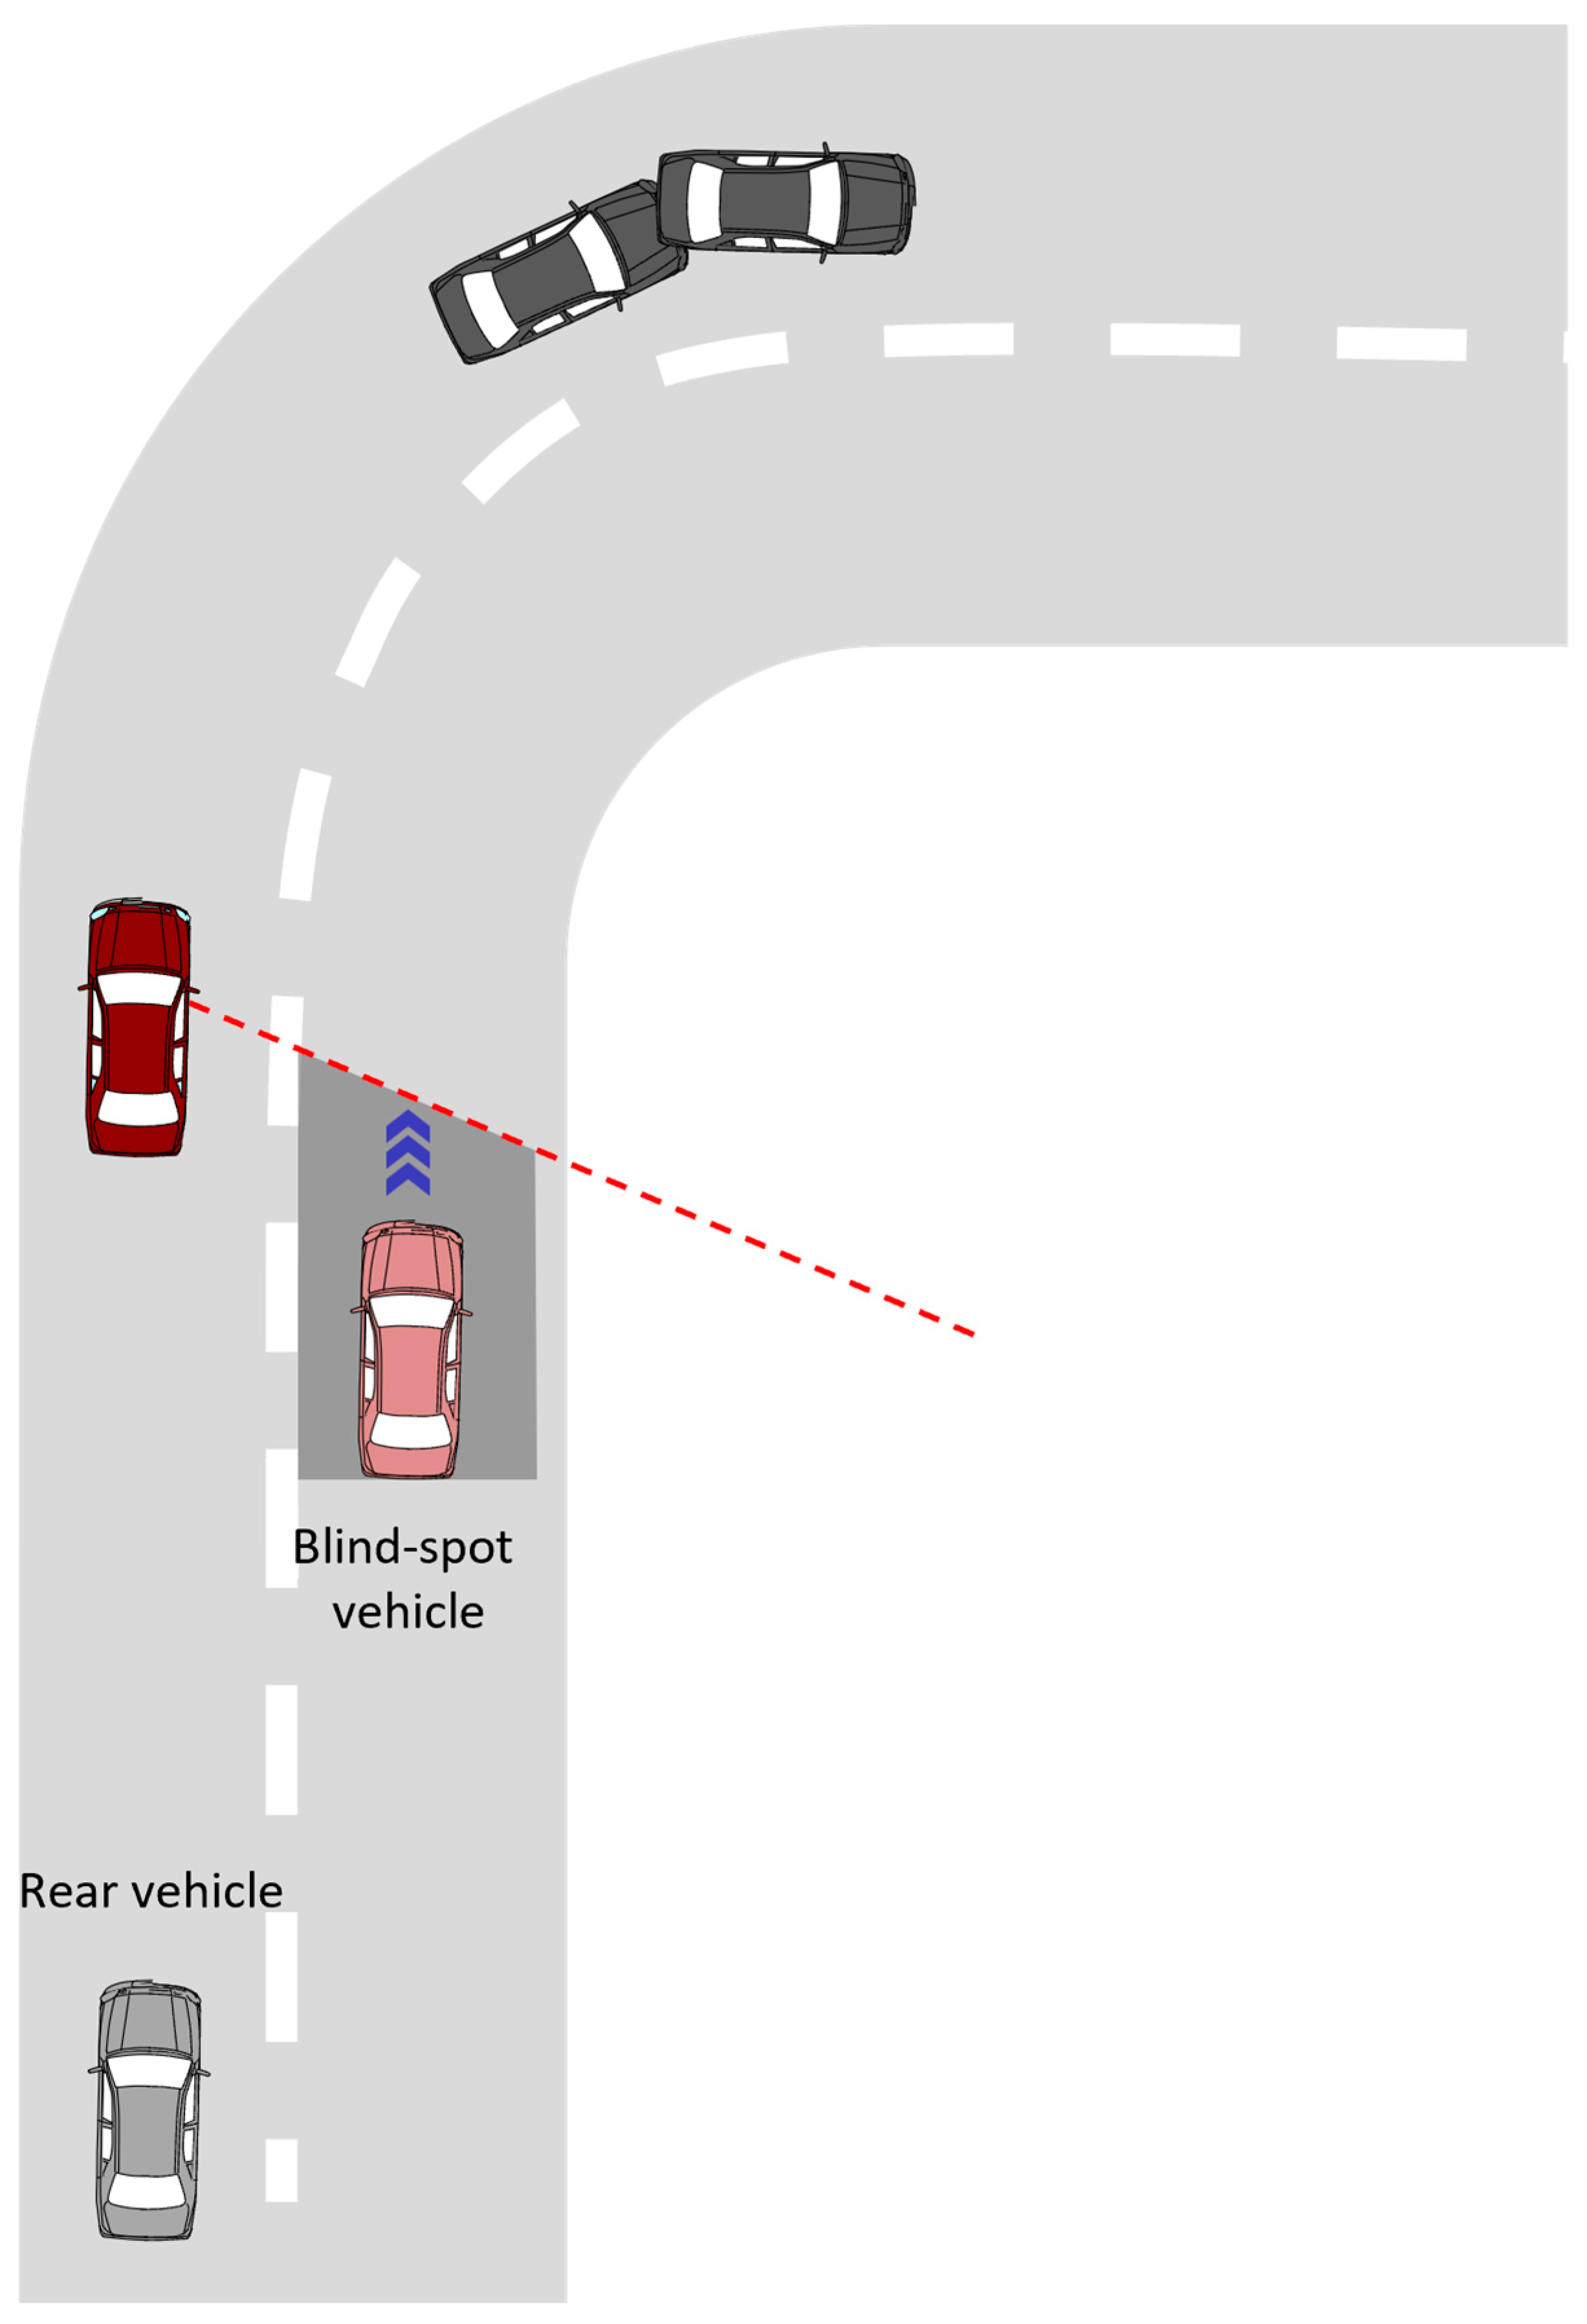
This scenario involved a non-critical overtaking event where a following truck initially positioned behind the ego vehicle signalled and moved into the adjacent lane to pass. The ego vehicle was in the leftmost lane adjacent to a barrier. Gaze behaviour was analysed for 27 s, starting 5 s before the 4 s event and continuing 18 s after it ended (
Figure 4). The event required monitoring of the forward path and following traffic (rear-view mirror) and reintegration of attention to the road centre after mirror checks.
3.5.2. Scenario 2: Side-Vehicle Cut-In
This scenario featured a vehicle from the adjacent lane cutting in ahead of the ego vehicle. The cut-in occurred at a safe distance, creating a lead vehicle. Gaze behaviour was analysed for 24 s, starting 15 s before the 4 s cut-in and ending 5 s afterward (
Figure 5). The event drew attention toward the driver-side periphery and the outside mirror (driver side), with continued need to recover to the road centre for forward hazard monitoring.
3.5.3. Scenario 3: Motorcycle Overtake
This scenario involved a motorcycle overtaking the ego vehicle in the same lane and cutting in to become the lead vehicle. Gaze behaviour was analysed for 27 s, beginning 5 s before the 22 s overtaking manoeuvre and ending when the motorcycle reached a 2 s time headway (
Figure 6). The event increased monitoring demand on the rear-view mirror and driver-side outside mirror, alongside forward-road supervision.
3.5.4. Scenario Validation and Standards Alignment
To maintain alignment with international safety-assessment frameworks, scenario development was also benchmarked against ISO 34502:2022, which defines a structured taxonomy of traffic-related critical scenarios for automated-driving evaluation. The implemented events corresponded to Category 1 (cut-in), Category 2 (motorcycle acceleration), Category 3 (rear acceleration), and Category 5 (motorcycle advance). This alignment ensured methodological relevance, ecological validity, and consistency with automotive industry standards [
29].
3.5.5. Presentation Order and Exposure Blocks
Scenarios were presented in a fixed order to maintain consistent event timing relative to automation onset and ensure comparable situational demands across participants.
Table 2 summarises when each scenario occurred in the short (5 min) and long (15 min) conditions and the elapsed time differences between them. This controlled sequencing allowed systematic comparison of equivalent driving events after different durations of automated supervision.
3.5.6. Critical Takeover Event
At the end of the drive, a single TOR was issued, prompting manual re-engagement (
Figure 7). Takeover performance measures are defined in
Section 3.9.
3.6. Areas of Interest (AOIs)
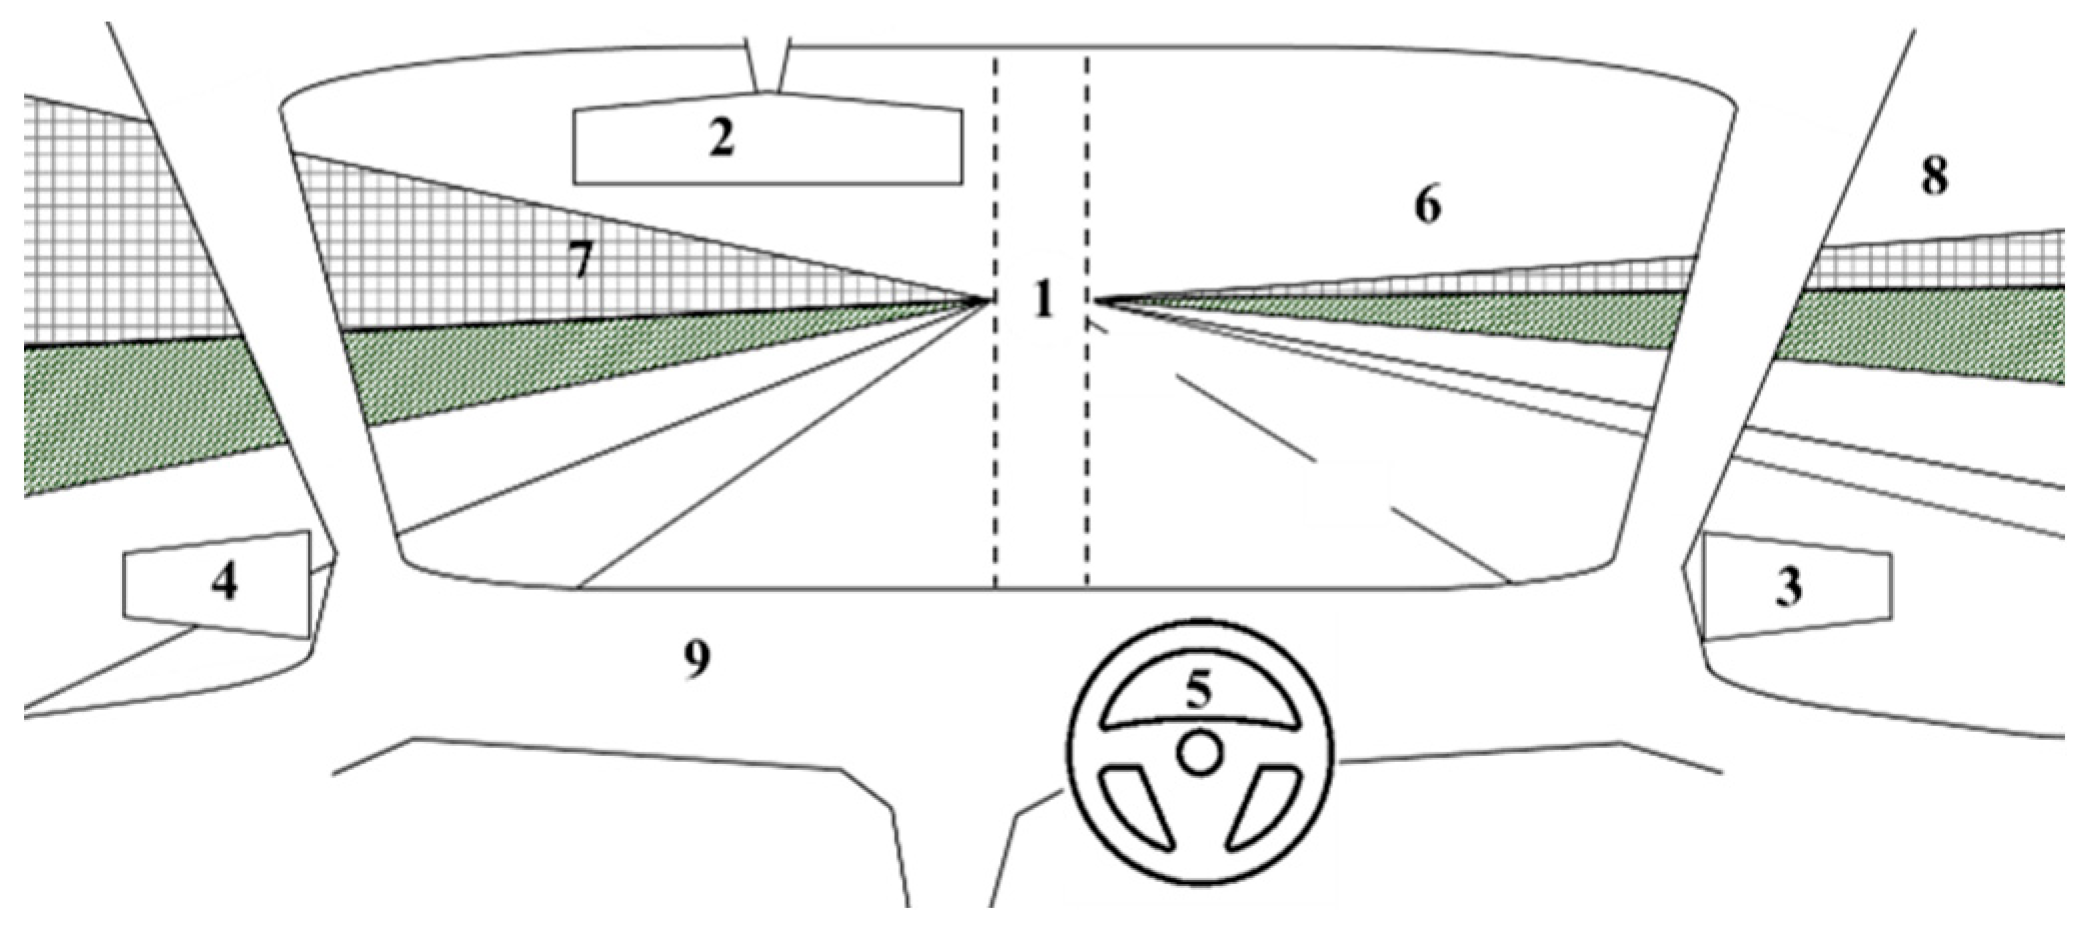
Gaze was annotated frame-by-frame into nine mutually exclusive Areas of Interest (AOIs): (1) road centre (RC), (2) rear-view mirror (RVM), (3) outside mirror driver side (OMD), (4) outside mirror passenger side (OMP), (5) HMI, (6) right periphery (RP), (7) left periphery (LP), (8) side window driver side (SWD), and (9) other (OTH).
Figure 8 depicts the AOI schema used for coding. The grey areas represent the tall noise barriers on both sides of the expressway, and in green the hedges lining these barriers.
3.7. Preprocessing and Thresholds
Raw gaze data were recorded at 60 Hz and processed through a multi-stage pipeline. First, blink events were identified and classified according to duration. Normal blinks shorter than 300 ms (approximately 18 frames) were retained in the data stream, longer closures between 300 and 500 ms were kept as extended blinks, and closures exceeding 500 ms were excluded as non-visual intervals that may indicate microsleeps [
31].
Each sample was then assigned to one of nine predefined Areas of Interest (AOIs): (1) road centre (RC), (2) rear-view mirror (RVM), (3) outside mirror driver side (OMD), (4) outside mirror passenger side (OMP), (5) HMI, (6) right periphery (RP), (7) left periphery (LP), (8) side window driver side (SWD), and (9) other (OTH). AOI classification was performed manually by the experimenter using the scene camera view from the simulator. No pixel- or angle-based boundaries were applied; instead, the coder judged the target area when the gaze marker appeared within a boundary, ensuring consistency with the
Figure 8 layout.
Consecutive samples within the same AOI were consolidated into a single
glance when the total dwell duration was at least 150 ms (nine frames). This operational choice follows prior driving research [
32] and sits close to ISO 15007:2020’s guidance that sub-120 ms AOI dwells are “fly-through” samples rather than fixations (
Appendix F). Dwells below 150 ms were therefore merged into the subsequent valid glance, in line with our leading-transition rule (ISO 15007:2020, Annex F).
The resulting sequence of validated glances retained the frame-by-frame structure required for subsequent transition analysis. No automated event segmentation or intermediate aggregation was applied. Transition counts were derived directly from these verified sequences following the study’s coding manual.
3.8. Markov Modelling Pipeline
Gaze dynamics were modelled using first-order Markov chains to capture the
probabilistic transition structure of visual attention. In this representation, each AOI corresponds to a discrete state, and each observed shift in gaze between two different AOIs constitutes a transition. Let
denote the conditional probability of shifting gaze from AOI
i to AOI
j. Transition matrices were constructed by counting all observed AOI changes and then row-normalising by the total number of outgoing transitions from each origin AOI:
where
is the number of gaze shifts from AOI
i to AOI
j, and each row of the matrix satisfies
.
This analysis quantifies how supervisory attention is distributed across information sources during automated driving. A first-order model was chosen for conceptual and empirical reasons: The probability of a driver’s current glance is strongly dependent on the immediately preceding glance, and higher-order models offer limited additional explanatory power in naturalistic gaze data [
8,
33,
34]. The resulting transition probabilities were computed separately for each participant and scenario and then averaged within experimental conditions for statistical analysis.
Alongside these dynamic metrics, traditional ISO-based measures were also derived, including the mean glance duration (total glance time divided by the number of glances) and glance rate (number of glances divided by the total duration of the condition). All analyses were carried out on the verified glance sequences described above, ensuring that both transition-level and aggregate metrics adhered to ISO 15007:2020 standards.
3.9. Reaction Time Measure
Takeover performance was quantified using System-Recognised Reaction Time (SRRT). SRRT was defined as the interval between the onset of the takeover request (TOR) and the system’s recognition of manual control re-engagement, as logged by the simulator controller.
SRRT provides a reproducible, system-level index of takeover duration corresponding to the point at which automation officially transferred control back to the driver. This metric allows consistent cross-participant comparison because it is based on a controller-recognised state change rather than individual actuator thresholds or pedal sensitivity. Accordingly, SRRT served as the sole reaction-time indicator of takeover performance. Full computation details and threshold specifications are provided in
Appendix E.
3.10. Analytical Approach
Gaze data were pre-processed in
MATLAB version 9.10, implementing threshold filters, AOI sequence construction, and transition matrix generation. Statistical analyses were conducted in JASP (version 0.95.2). Distributional assumptions were verified using Shapiro–Wilk tests. Between-condition comparisons (short vs. long automation) were performed using Mann–Whitney
U tests for non-normal data and
t-tests for normally distributed variables. False discovery rate (FDR) correction followed the Benjamini–Hochberg procedure, applied
within each scenario’s family of gaze transition tests to control for multiple comparisons. Both uncorrected
p and FDR-adjusted
q values are reported for transparency, accompanied by corresponding effect sizes (
r for non-parametric tests, Cohen’s
d where applicable). The FDR computation workflow is detailed in
Appendix D.
3.10.1. Interpretive Framework
Given the modest sample size and the large number of transitions tested, interpretation emphasised effect estimation and directional consistency rather than dichotomous inference. A sensitivity analysis using G*Power 3.1 [
35] indicated that, for the realised group sizes (
,
), the minimum detectable effect (MDE) at 80% power was approximately
(two-tailed,
). Smaller effects would not be expected to reach conventional significance with this sample; therefore, the focus was placed on the magnitude and coherence of effects across scenarios, complemented by within-scenario FDR correction.
3.10.2. Theoretically-Motivated Predictions
Drawing on the Out-of-the-Loop (OOTL) framework and Malleable Attentional Resources Theory (MART), we identified three gaze-transition patterns likely to be affected by automation duration. These predictions guided our analytical focus but were evaluated exploratorily given the modest sample size () and multiple-scenario design.
Prolonged automation narrows gaze dispersion and reduces monitoring frequency, indicating lower engagement and emerging OOTL effects [
4,
5,
7]. MART predicts that perceived task stability causes attention to narrow, making monitoring more efficient but less adaptive [
9].
We therefore examined three theoretically-specified gaze transitions:
- (P1)
Reduced rear-view mirror→road-centre (RVM→RC) recovery probability. Verification loops from mirrors to the forward roadway support continuous updating of situation awareness. The OOTL account links automation supervision to reduced information sampling and overconfidence in awareness [
7], while empirical studies show that as trust and familiarity with automation increase, drivers monitor mirrors less frequently and focus more narrowly on the forward scene [
36,
37]. We therefore expected longer automation exposure to reduce RVM→RC recoveries, indicating weaker integration of rearward information.
- (P2)
Increased self-transitions at the road centre (RC→RC). Under stable automation, task demands become predictable and workload decreases, encouraging static monitoring routines. MART predicts that attentional capacity contracts when perceived demand is low, leading to narrower focus and more repetitive sampling of familiar sources [
9]. From an OOTL perspective [
7], such contraction weakens environmental updating and promotes reliance on the forward scene as a default anchor. Behaviourally, this appears as more repeated forward fixations, captured by higher RC→RC self-transitions after longer exposure.
- (P3)
Reduced HMI→road-centre (HMI→RC) recovery probability. When drivers attend frequently to the automation interface, rapid refocusing on the roadway is essential for maintaining supervisory awareness. Research on automation trust shows that higher familiarity and confidence reduce such refocusing, as attention remains on the system display rather than the environment [
36,
38]. We therefore expected lower HMI→RC recoveries after longer exposure, reflecting slower or less consistent re-engagement with external driving cues.
3.10.3. Data Quality and Ethical Compliance
All procedures followed JARI’s internal ethics review standards. Data loss due to calibration error or simulator malfunction led to the exclusion of two participants. Remaining datasets were inspected for completeness before analysis, ensuring reliable estimation of gaze-transition probabilities.
4. Results
4.1. Overview
This study focused on comparing Short (5 min) versus Long (15 min) automation within scenario. Dynamic outcomes are first-order transition probabilities between Areas of Interest (AOIs), quantifying the probabilistic transition structure of supervisory gaze. Families of tests were corrected using Benjamini–Hochberg false discovery rate (FDR) procedures within each scenario; we report uncorrected
p and adjusted
q values. We treat
as statistically reliable and
as marginal. Effect sizes are reported as rank-biserial
r for Mann–Whitney tests. System-Recognised Reaction Time (SRRT;
Appendix E) measures takeover performance.
We examined all AOI→AOI gaze transitions. For simplicity, this paper highlights transitions with
(or
) and those of specific theoretical interest (RVM→RC, RC→RC, HMI→RC). Full schematic diagrams are provided in
Appendix F.
4.2. Scenario 1: Rear-Vehicle Cut-Out
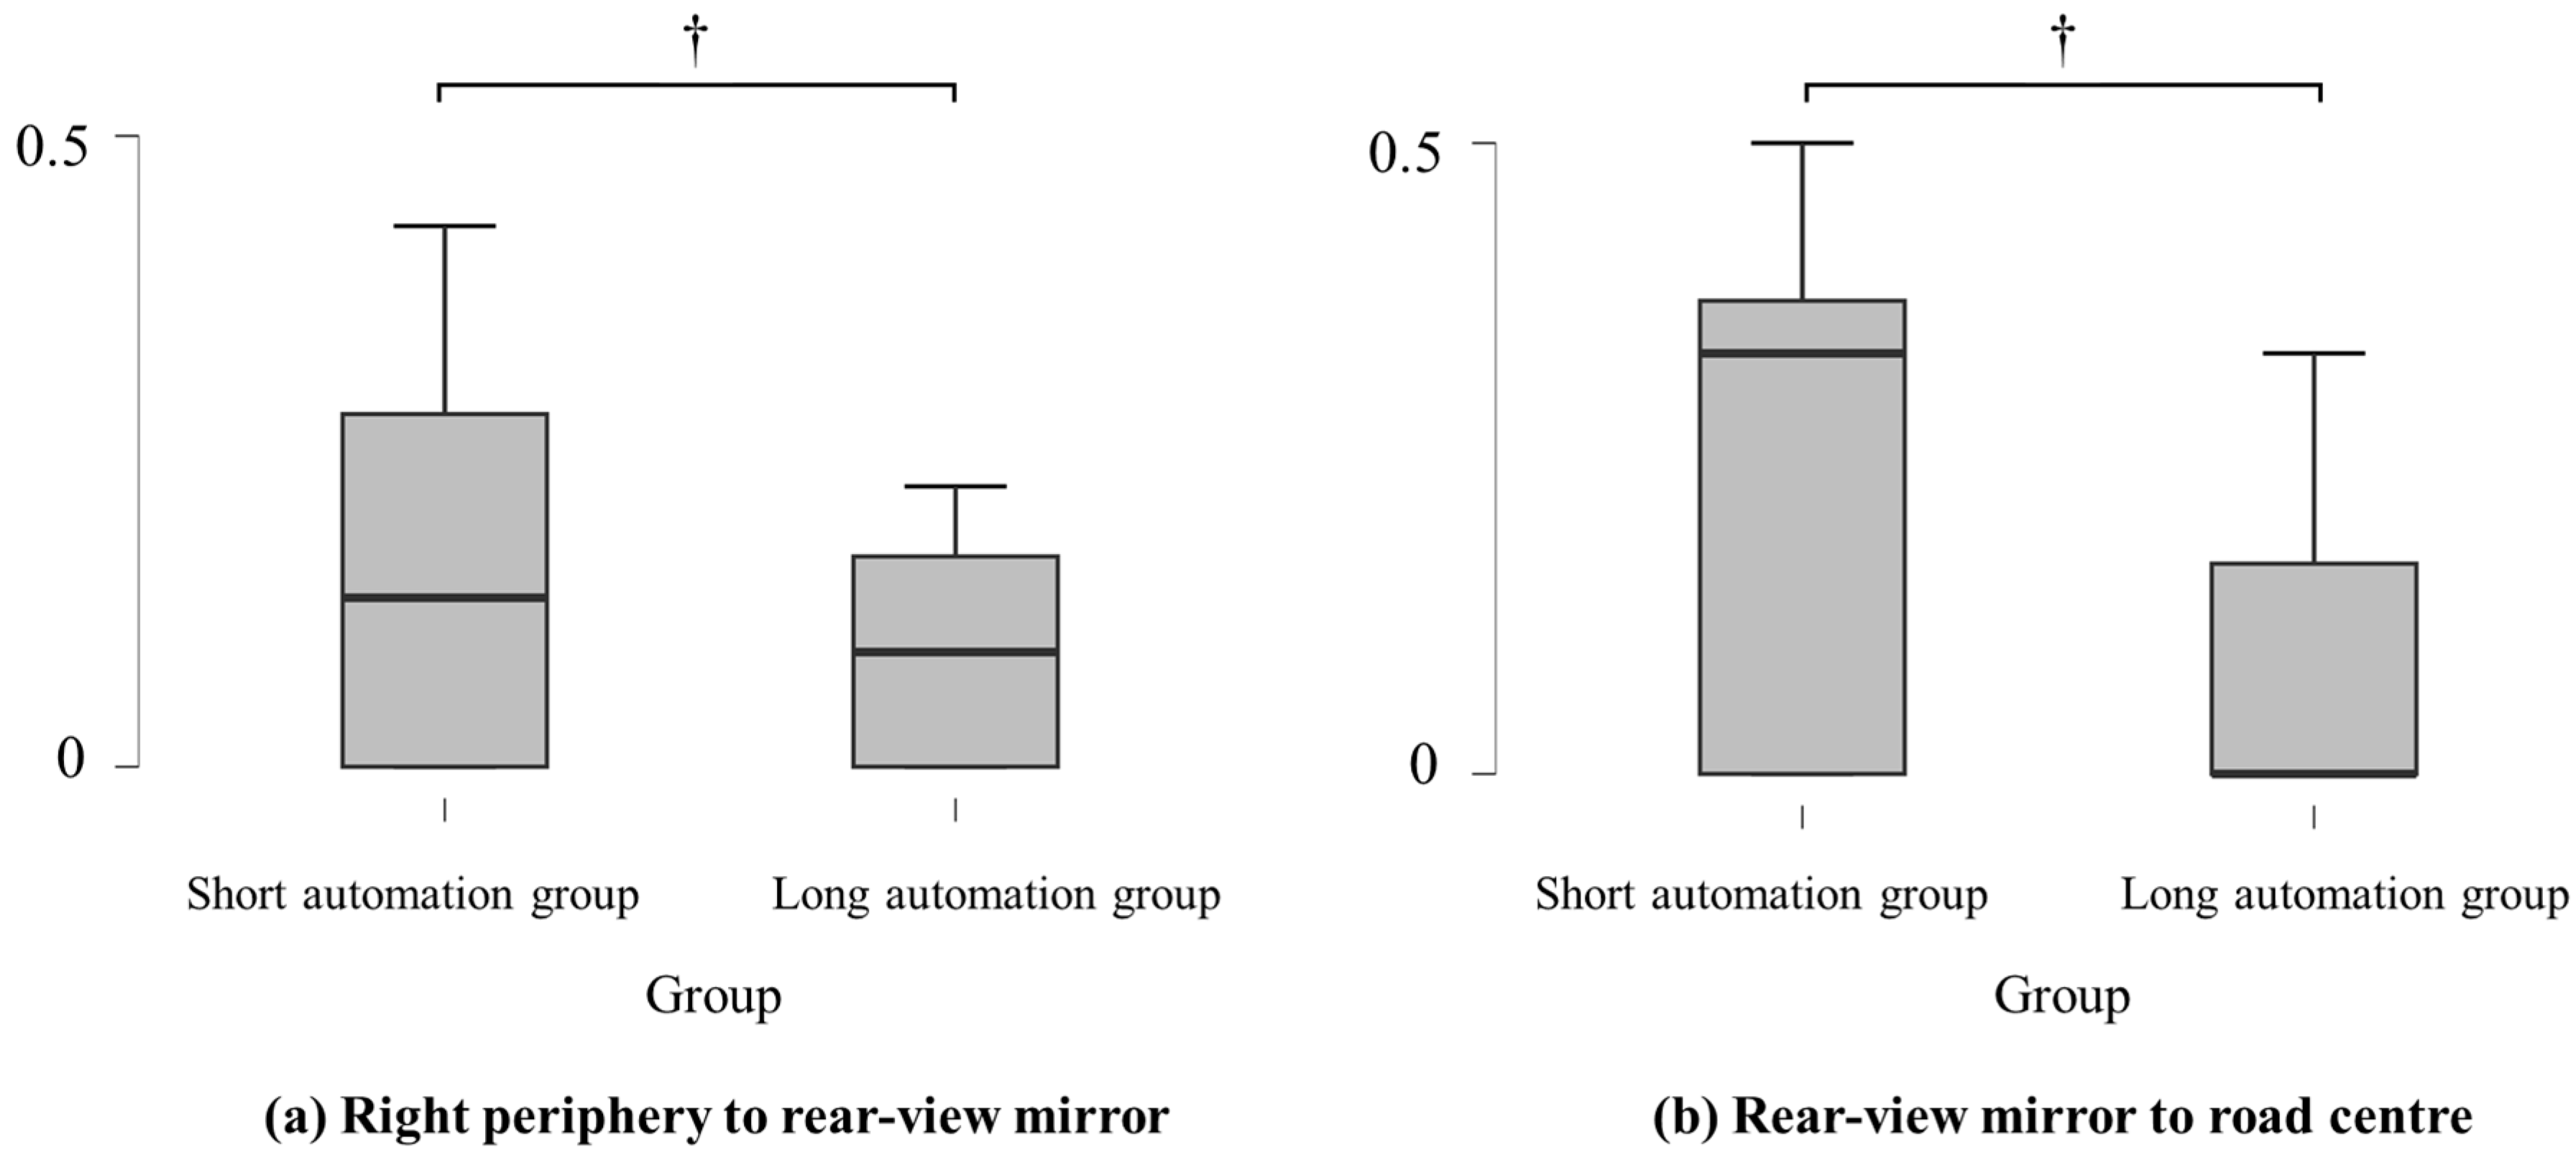
Longer exposure was associated with reduced gaze transition recoveries from mirrors to the forward roadway and fewer checks of the rear-view mirror after peripheral glances. Specifically, rear-view mirror→road centre (RVM→RC) was lower in Long (Md = 0.000) vs. Short (Md = 0.333),
,
,
,
(directional, not FDR-survived). RP→RVM was also lower after Long (Md = 0.091 vs. 0.148),
,
,
,
. Descriptively, the long-exposure group showed more LP-directed transitions (RC→LP:
; RVM→LP: emergent), whereas RC→HMI decreased (
), consistent with a redistribution of monitoring toward peripheral sampling in this scenario (
Table 3).
Traditional gaze metrics echoed these findings. The mean glance rate (MGR) to the rear-view mirror was marginally lower after long automation exposure (Md , ) than after short exposure (Md , ), , , , . This pattern indicates a higher sampling rate of the rear-view mirror in the short-exposure group, consistent with the need to monitor the manoeuvres of the rear vehicle in this scenario. Taken together with the reduced RVM→RC recoveries, the combination of fewer transitions and lower mirror sampling after long exposure supports the interpretation that attentional control becomes less strategic over time.
Table 3 summarises the corresponding transition probabilities, and
Figure 9 visualises their distributions by group. A representative schematic is provided in
Appendix F,
Figure A3.
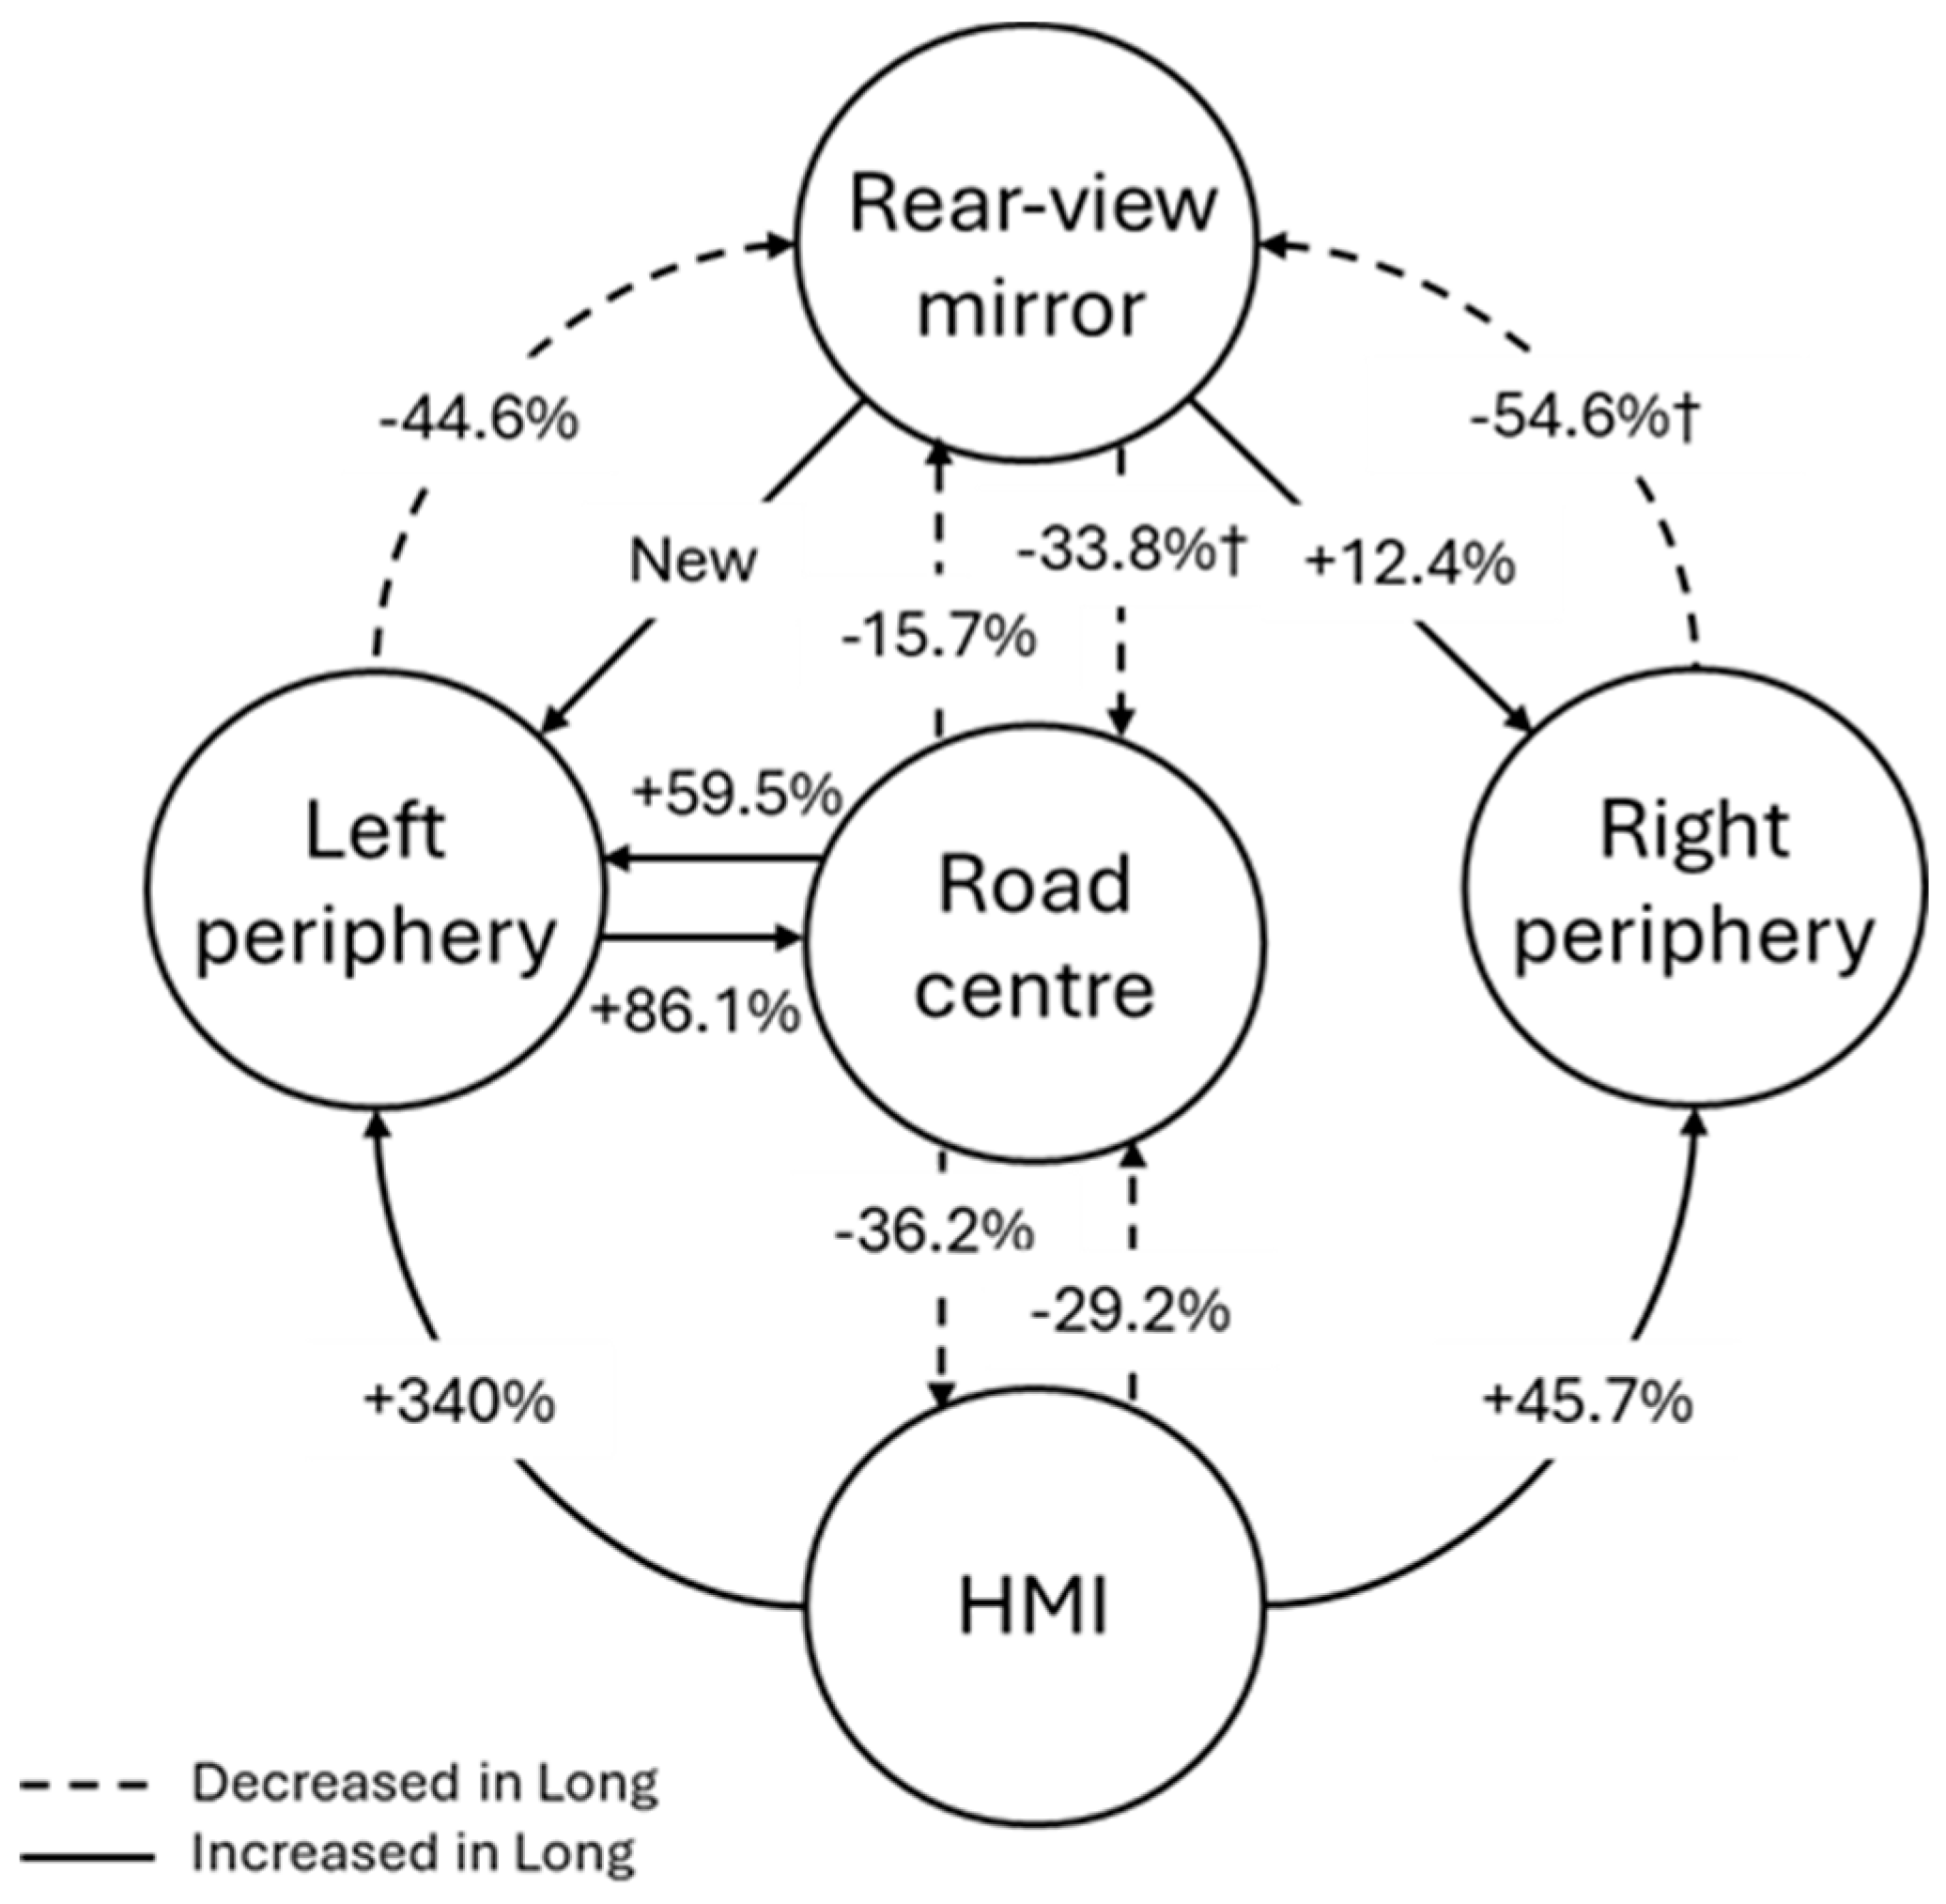
Interpretation. Relative to Short, Long showed fewer verification cycles: RVM→RC fell by 33.8% (0.325→0.216) and HMI→RC by 29.2% (0.478→0.339), while RC→LP increased by 59.5% (0.037→0.059). No between-condition differences were detected for RC→RC or RC static metrics in this scenario (all , ), indicating that the observed supervisory drift primarily reflected reduced mirror-to-road recoveries and a redistribution toward peripheral sampling rather than increased forward fixation repetition. On this road, the left periphery contains a barrier/verge and adds little driving-relevant information, so increased RC→LP alongside weaker recoveries suggests less strategic refocusing on the forward scene. Effects were small to medium and did not survive FDR correction; they are therefore interpreted as convergent directional evidence rather than confirmatory findings, providing a basis for future confirmatory research.
4.3. Scenario 2: Side-Vehicle Cut-In
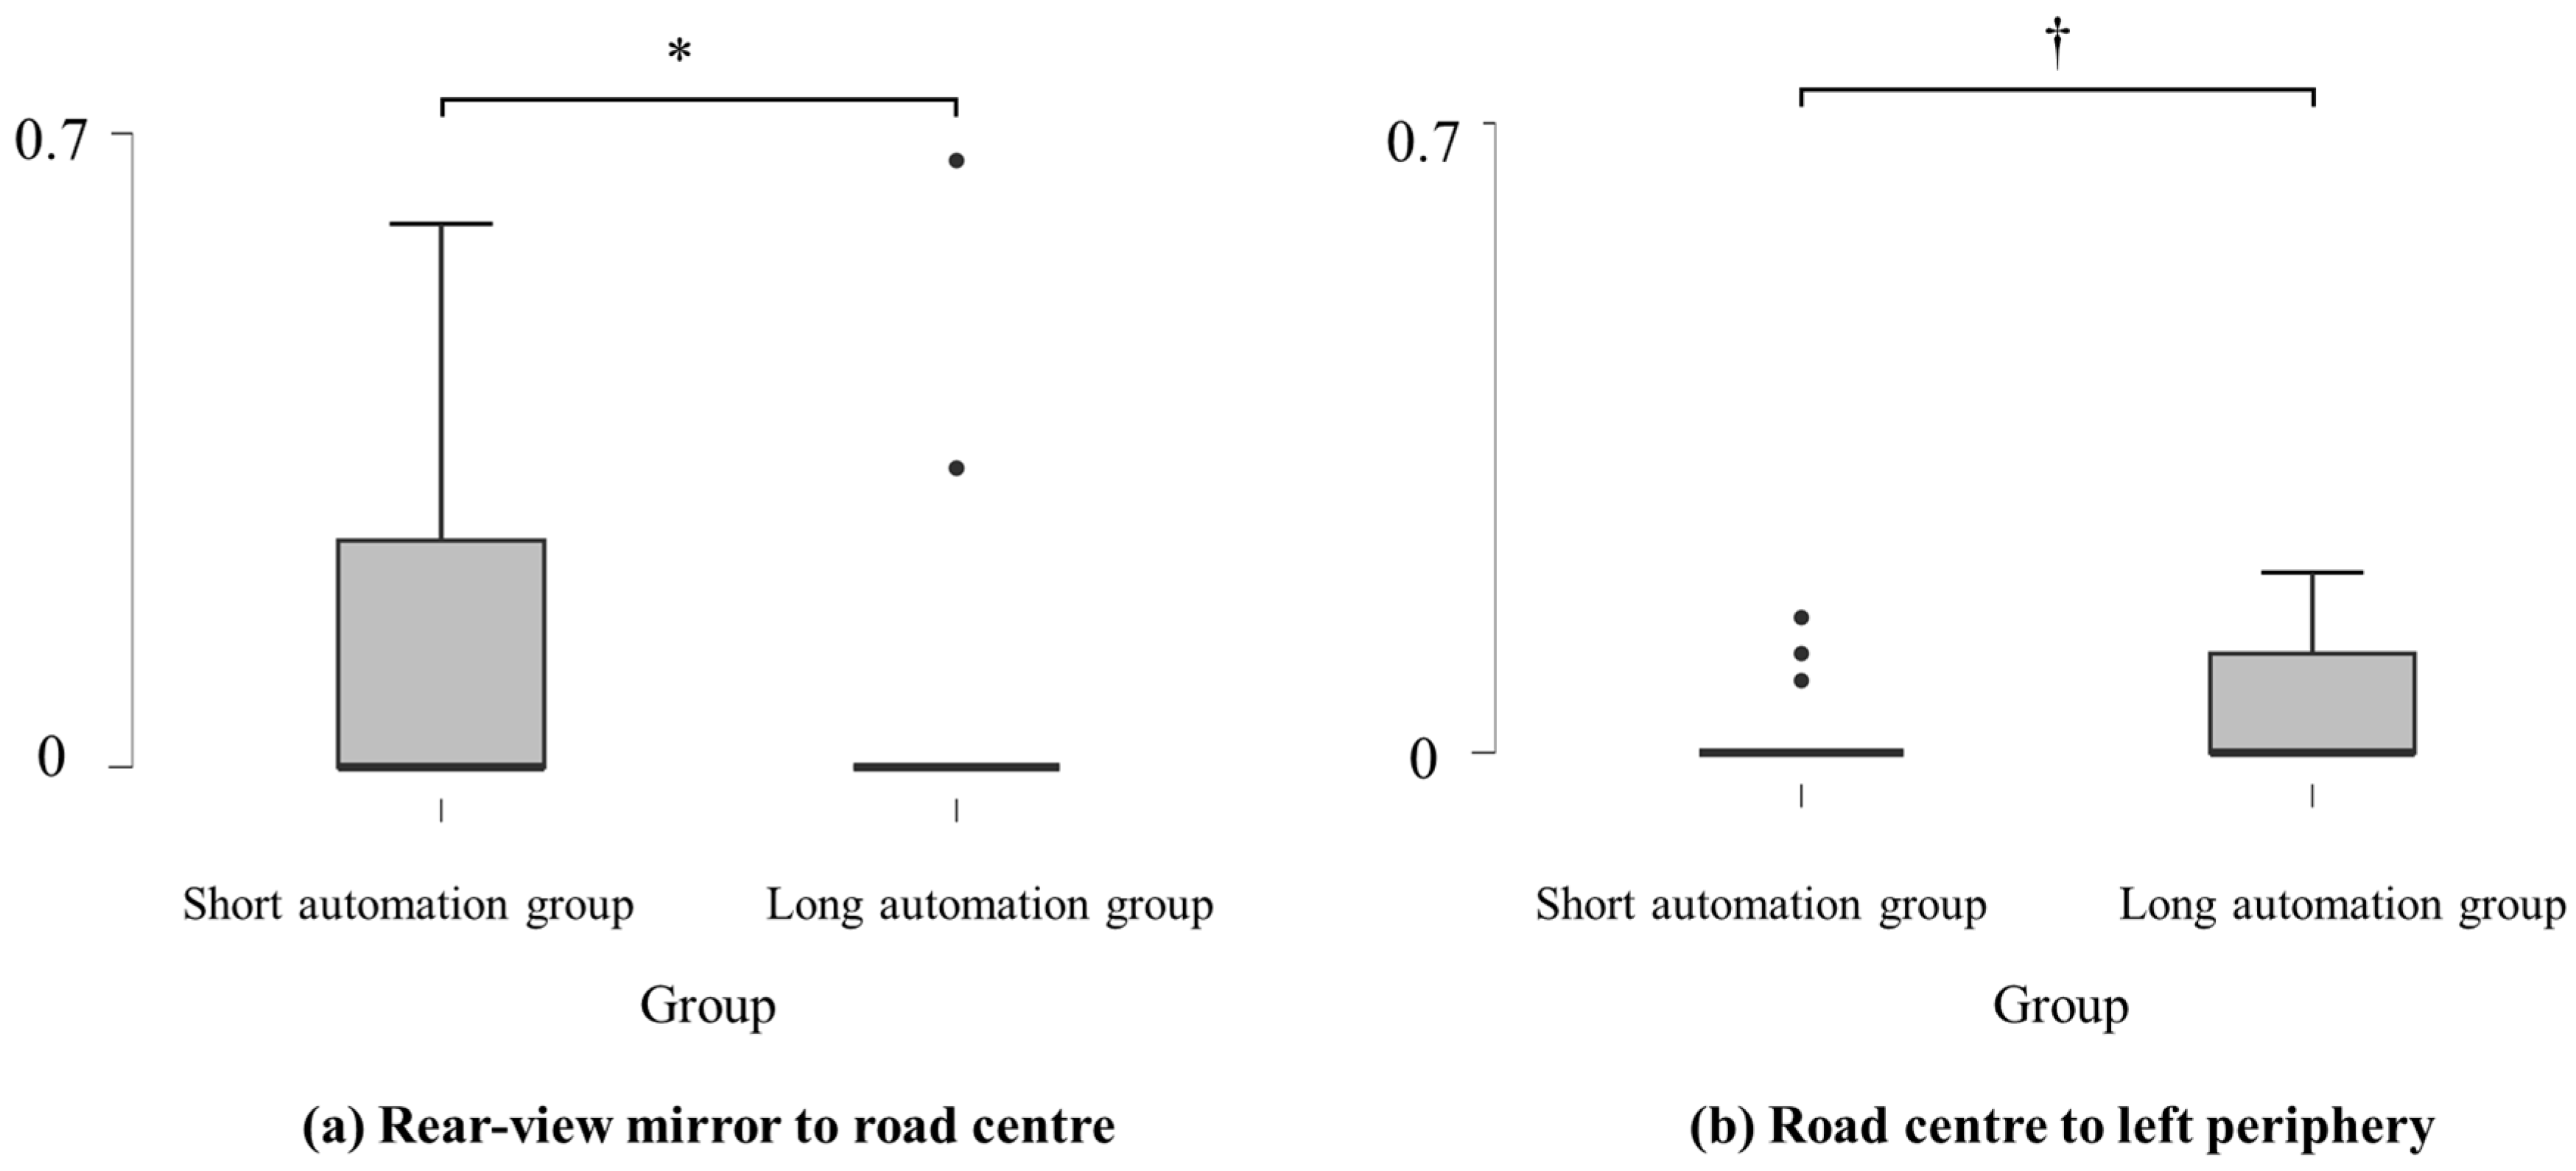
Longer automation exposure was associated with reduced mirror-to-road recoveries and greater peripheral sampling. Specifically, rear-view mirror→road centre (RVM→RC) probability was lower in the long condition (Md = 0.000, n = 21) than in the short condition (Md = 0.500, n = 22), U = 306, p = 0.045, r = 0.325, q = 0.090 (marginal after FDR adjustment). Transitions from road centre→left periphery (RC→LP) increased modestly in the long condition (M = 0.050 vs. 0.015), U = 171, p = 0.059, r = −0.260, q = 0.118. Although this effect did not survive correction, its direction and magnitude are consistent with a shift of attention away from the forward roadway toward less informative peripheral regions, suggesting early signs of supervisory drift.
Traditional gaze metrics supported these patterns. A Mann–Whitney U test revealed a marginal difference in mean glance duration to the left periphery, with longer glances after long exposure (, , , ), suggesting not only more frequent peripheral glances but also potentially prolonged disengagement from the forward roadway. Mean glance duration to the rear-view mirror was also longer after long exposure (Md s vs. s), , , , .
Table 4 summarises transition probabilities, and
Figure 10 illustrates the key effects. A representative schematic of the transition structure is provided in
Appendix F,
Figure A4.
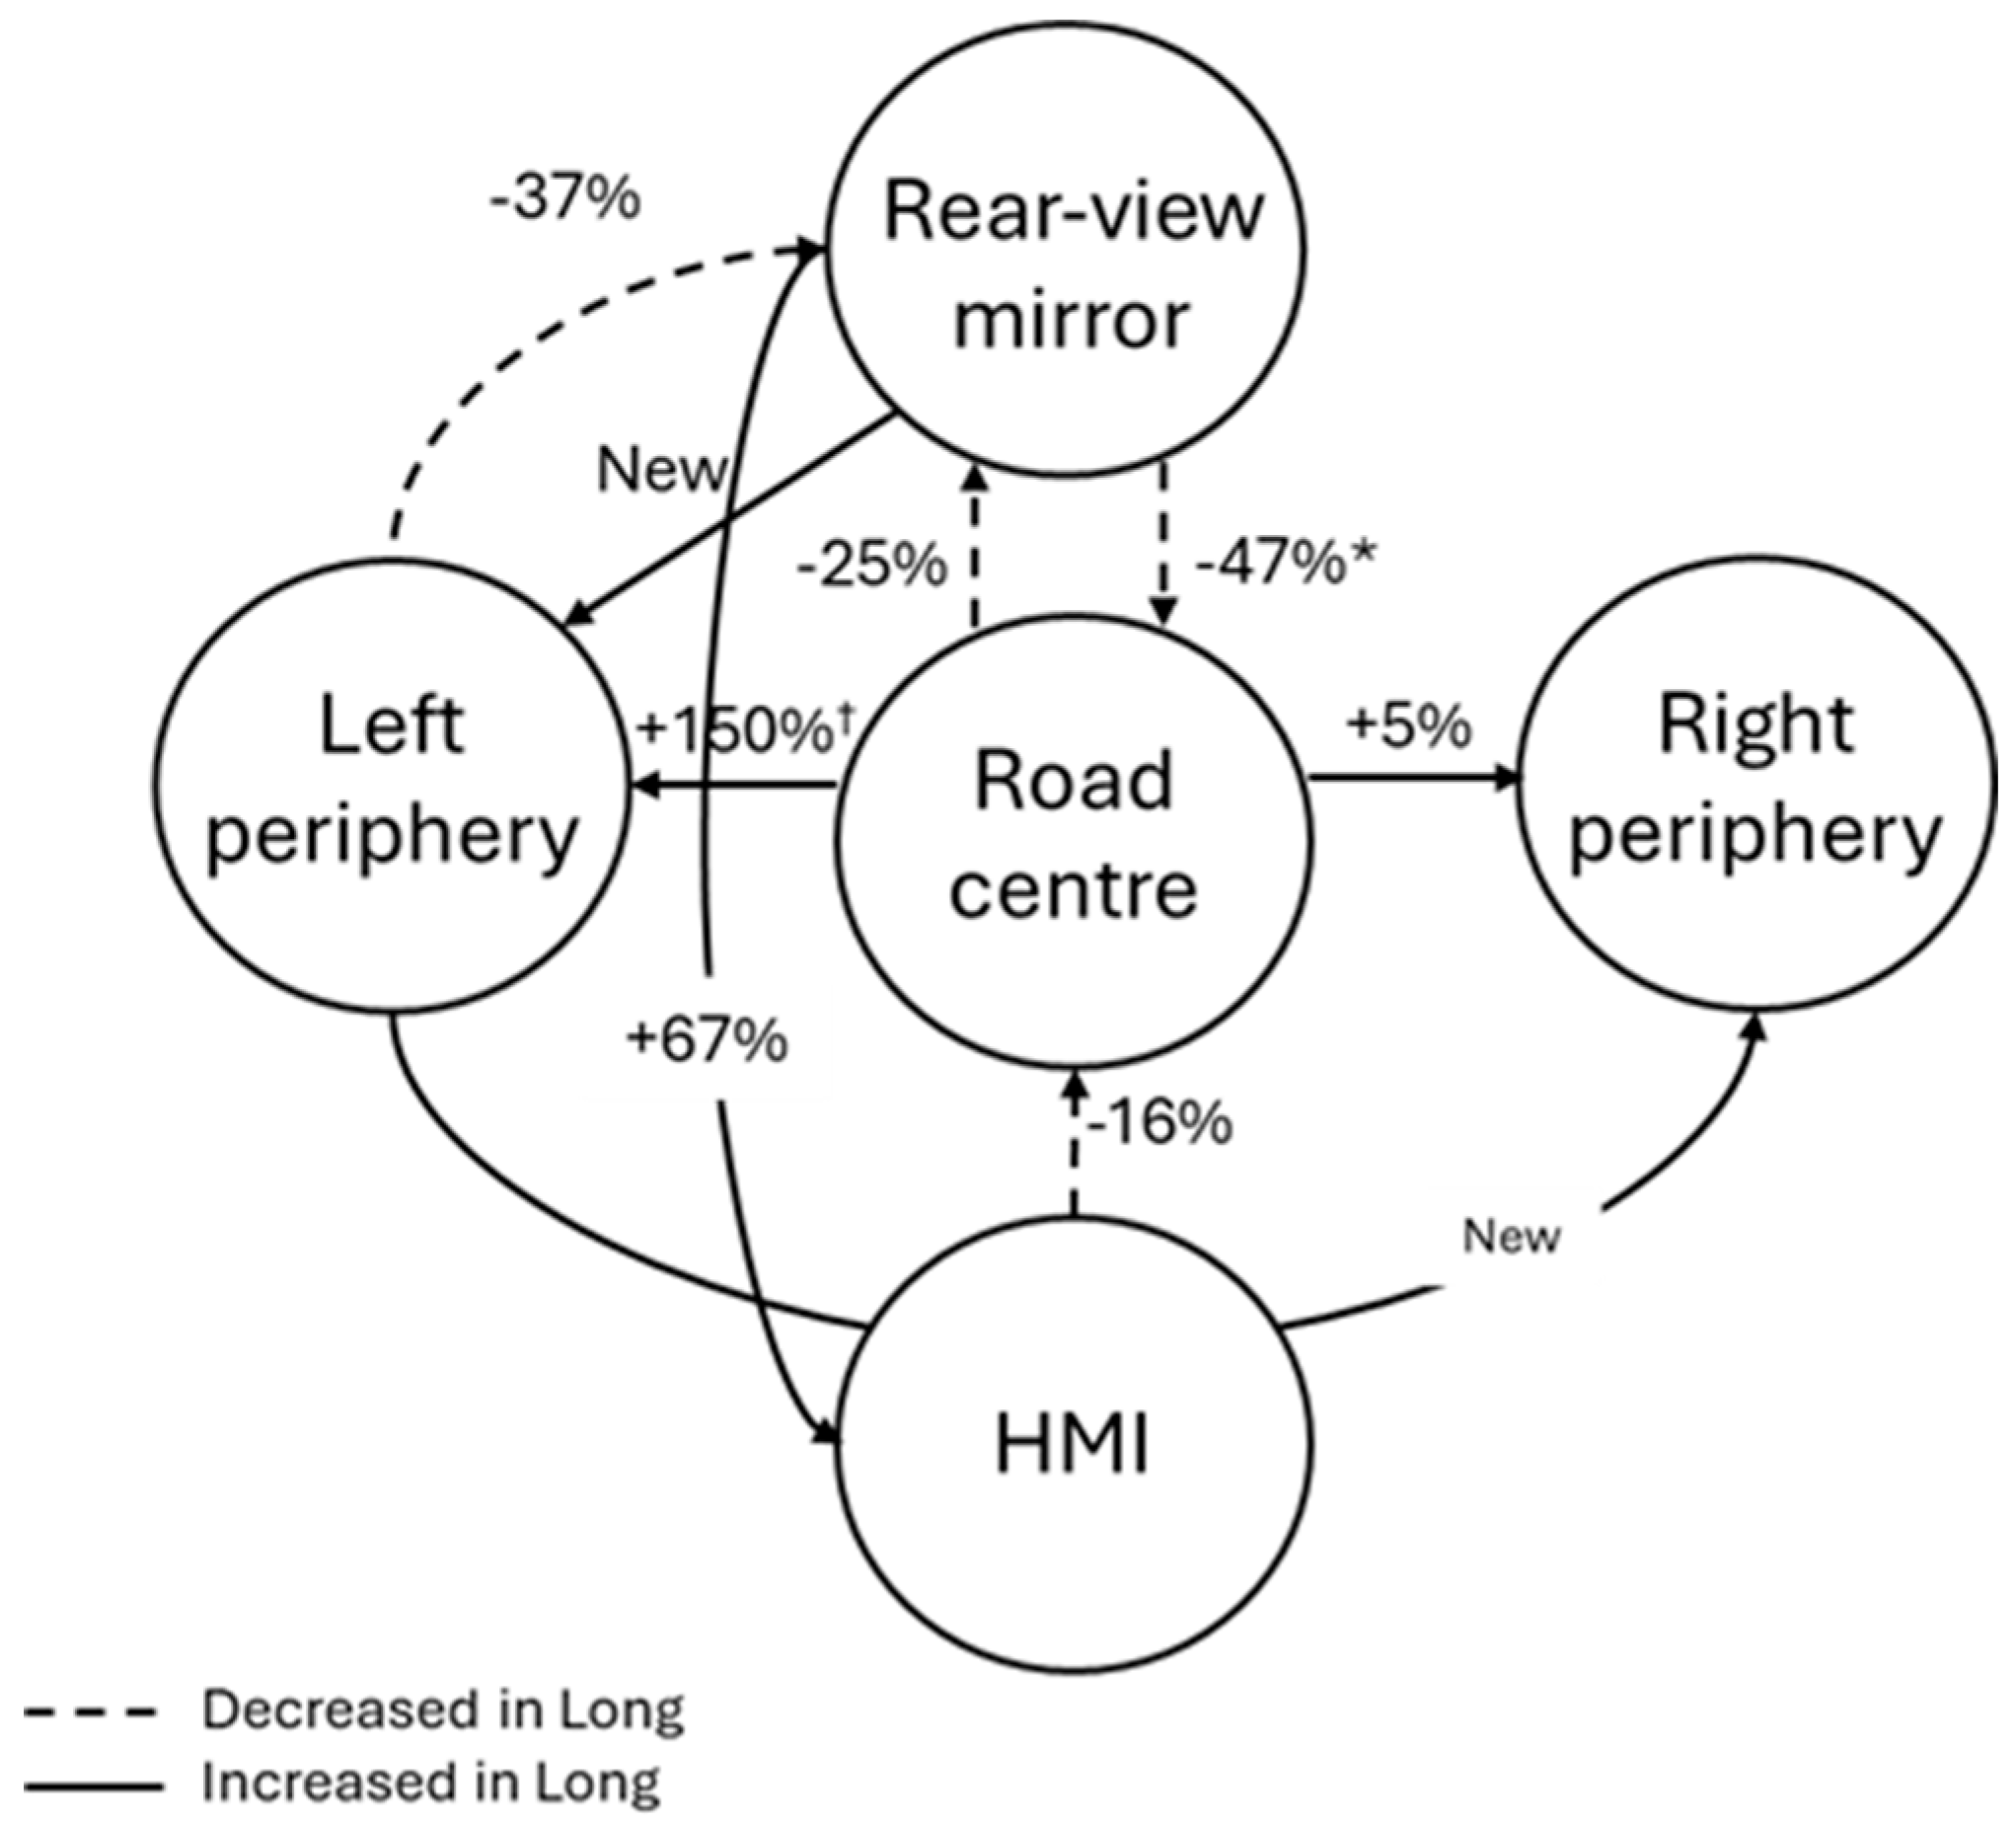
Interpretation. Relative to Short, Long showed reduced rear-view mirror-to-road-centre recovery (RVM→RC; −47%, 0.580→0.310) and elevated lateral monitoring (RC→LP; +150%, 0.020→0.050), together with increased HMI consultation (RVM→HMI; +67%, 0.240→0.400). The left periphery on this road mainly contains a barrier and roadside vegetation, offering minimal driving-relevant information. Hence, the rise in RC→LP transitions, alongside weaker RVM→RC recoveries and reduced HMI→RC refocusing, suggests that attention drifted toward less informative areas while the structural linkage between mirror checks and forward refocusing degraded. These patterns point to an emerging structural drift in supervisory scanning loops under sustained automation. Although small to medium in size and marginal after FDR correction, the consistency of these effects across metrics strengthens their interpretive value and motivates targeted replication in future confirmatory research.
4.4. Scenario 3: Motorcycle Overtake
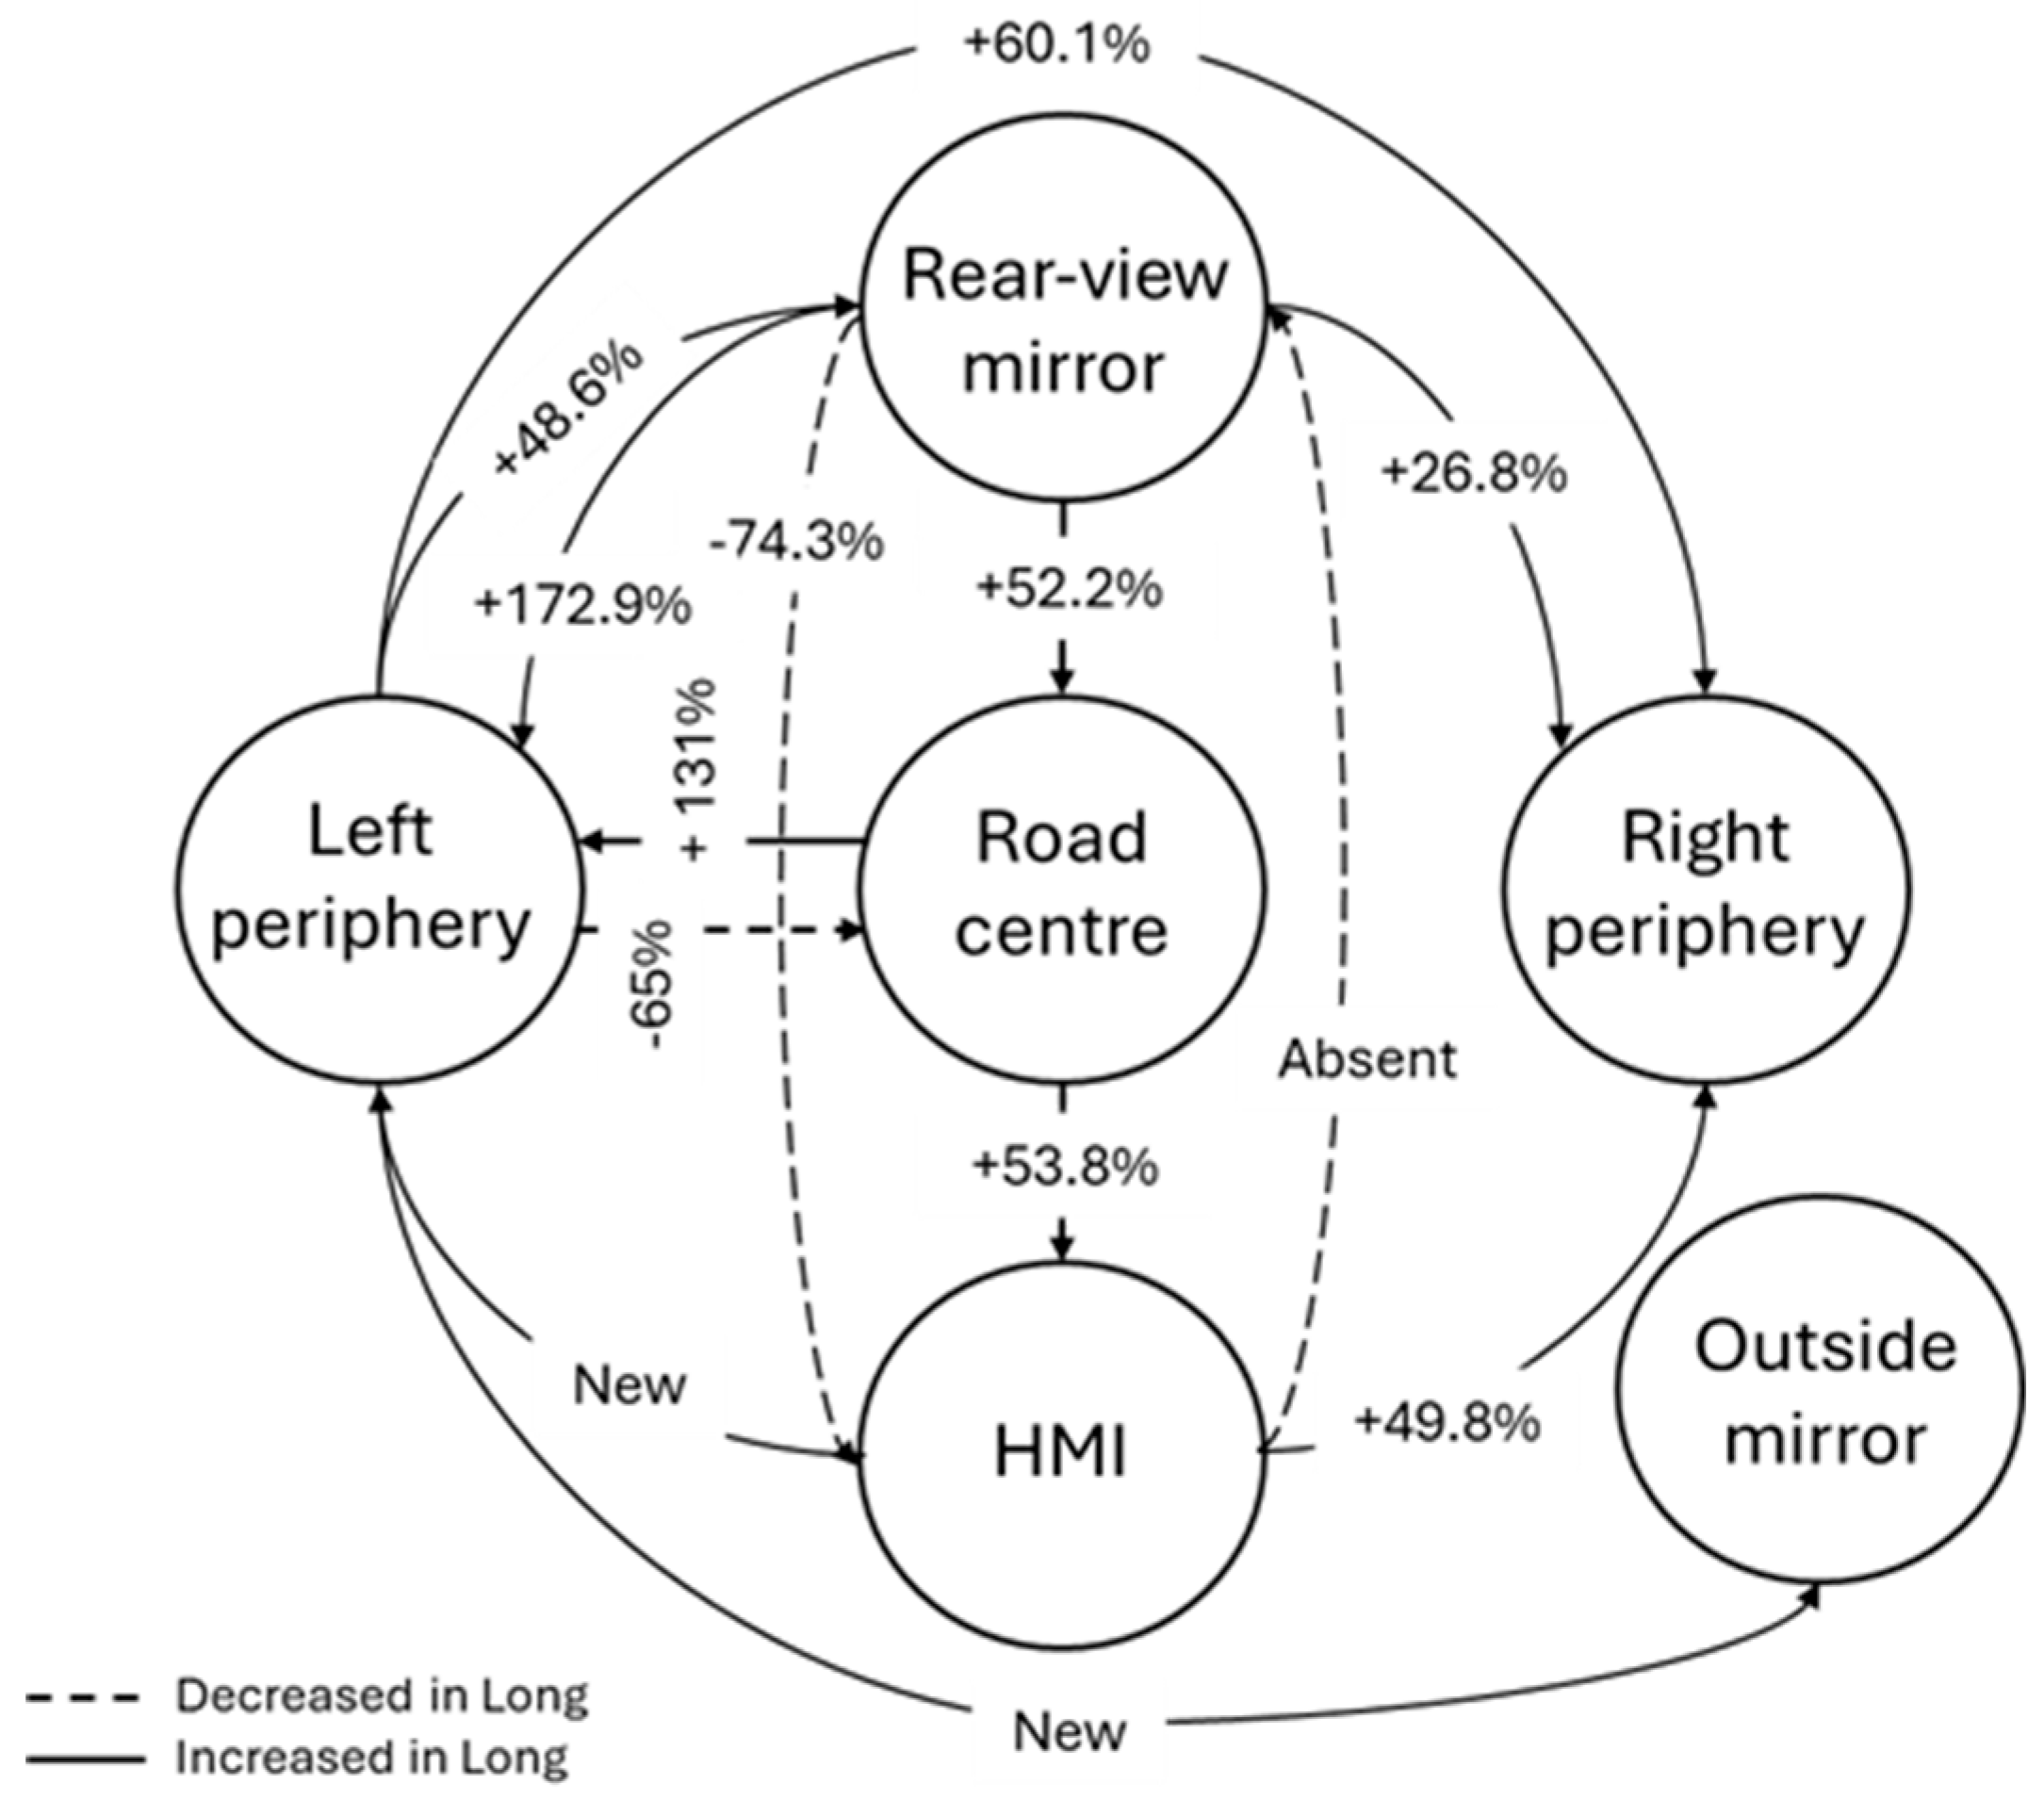
Although no transition reached significance, the same directional patterns appeared. Long exposure reduced left-periphery→road centre transitions (0.426→0.149; ↓ 65.0%) and eliminated HMI→RVM recoveries (0.167→0.000), while increasing left-periphery→rear-view mirror transitions (0.370→0.550; ↑ 48.6%). Mean glance duration to the rear-view mirror was longer after long exposure (Md
s vs.
s),
,
,
. For completeness,
Table 5 lists the descriptive transition probabilities for Scenario 3. A representative schematic is provided in
Appendix F,
Figure A5.
Interpretation. Although no transition reached FDR-corrected significance, the pattern is informative given Scenario 3’s position as the latest event (2:15 vs. 13:15 from automation onset in Short vs. Long). Long exposure reduced LP→RC returns by 65% (0.426→0.149) and increased RC→LP by 131% (0.029→0.067), indicating fewer forward-refocusing gaze shifts and more glances toward the driver-side barrier, which carries little driving-relevant information in this scene. The increase in RVM→RC (0.201→0.306; +52.2%) departs from Scenarios 1–2. A plausible reading is that the motorcycle’s close-proximity overtake (a vulnerable road user and a salient dynamic threat) intermittently refocuses monitoring to the forward roadway after mirror checks despite accumulated drift. Yet overall scanning still shows reduced LP→RC recovery and more non-informative lateral allocation. This suggests an adaptive but incomplete correction: Situational complexity temporarily heightens required awareness () without fully restoring achieved awareness (). Effects remain directional but coherent with the cumulative pattern of supervisory drift, positing a theoretically consistent foundation for future confirmatory studies on the dynamics of attention under automation.
4.5. Cross-Scenario Summary
A recurring pattern across all scenarios was the reduction in rear-view mirror to road centre recovery transitions under long automation exposure.
Table 6 summarises,
within each scenario, the RVM→RC probability by exposure duration.
The convergence of these within-scenario trends, even where not statistically significant after correction, delineates an early sign of supervisory drift in gaze transition organisation.
4.6. System-Recognised Reaction Time (SRRT)
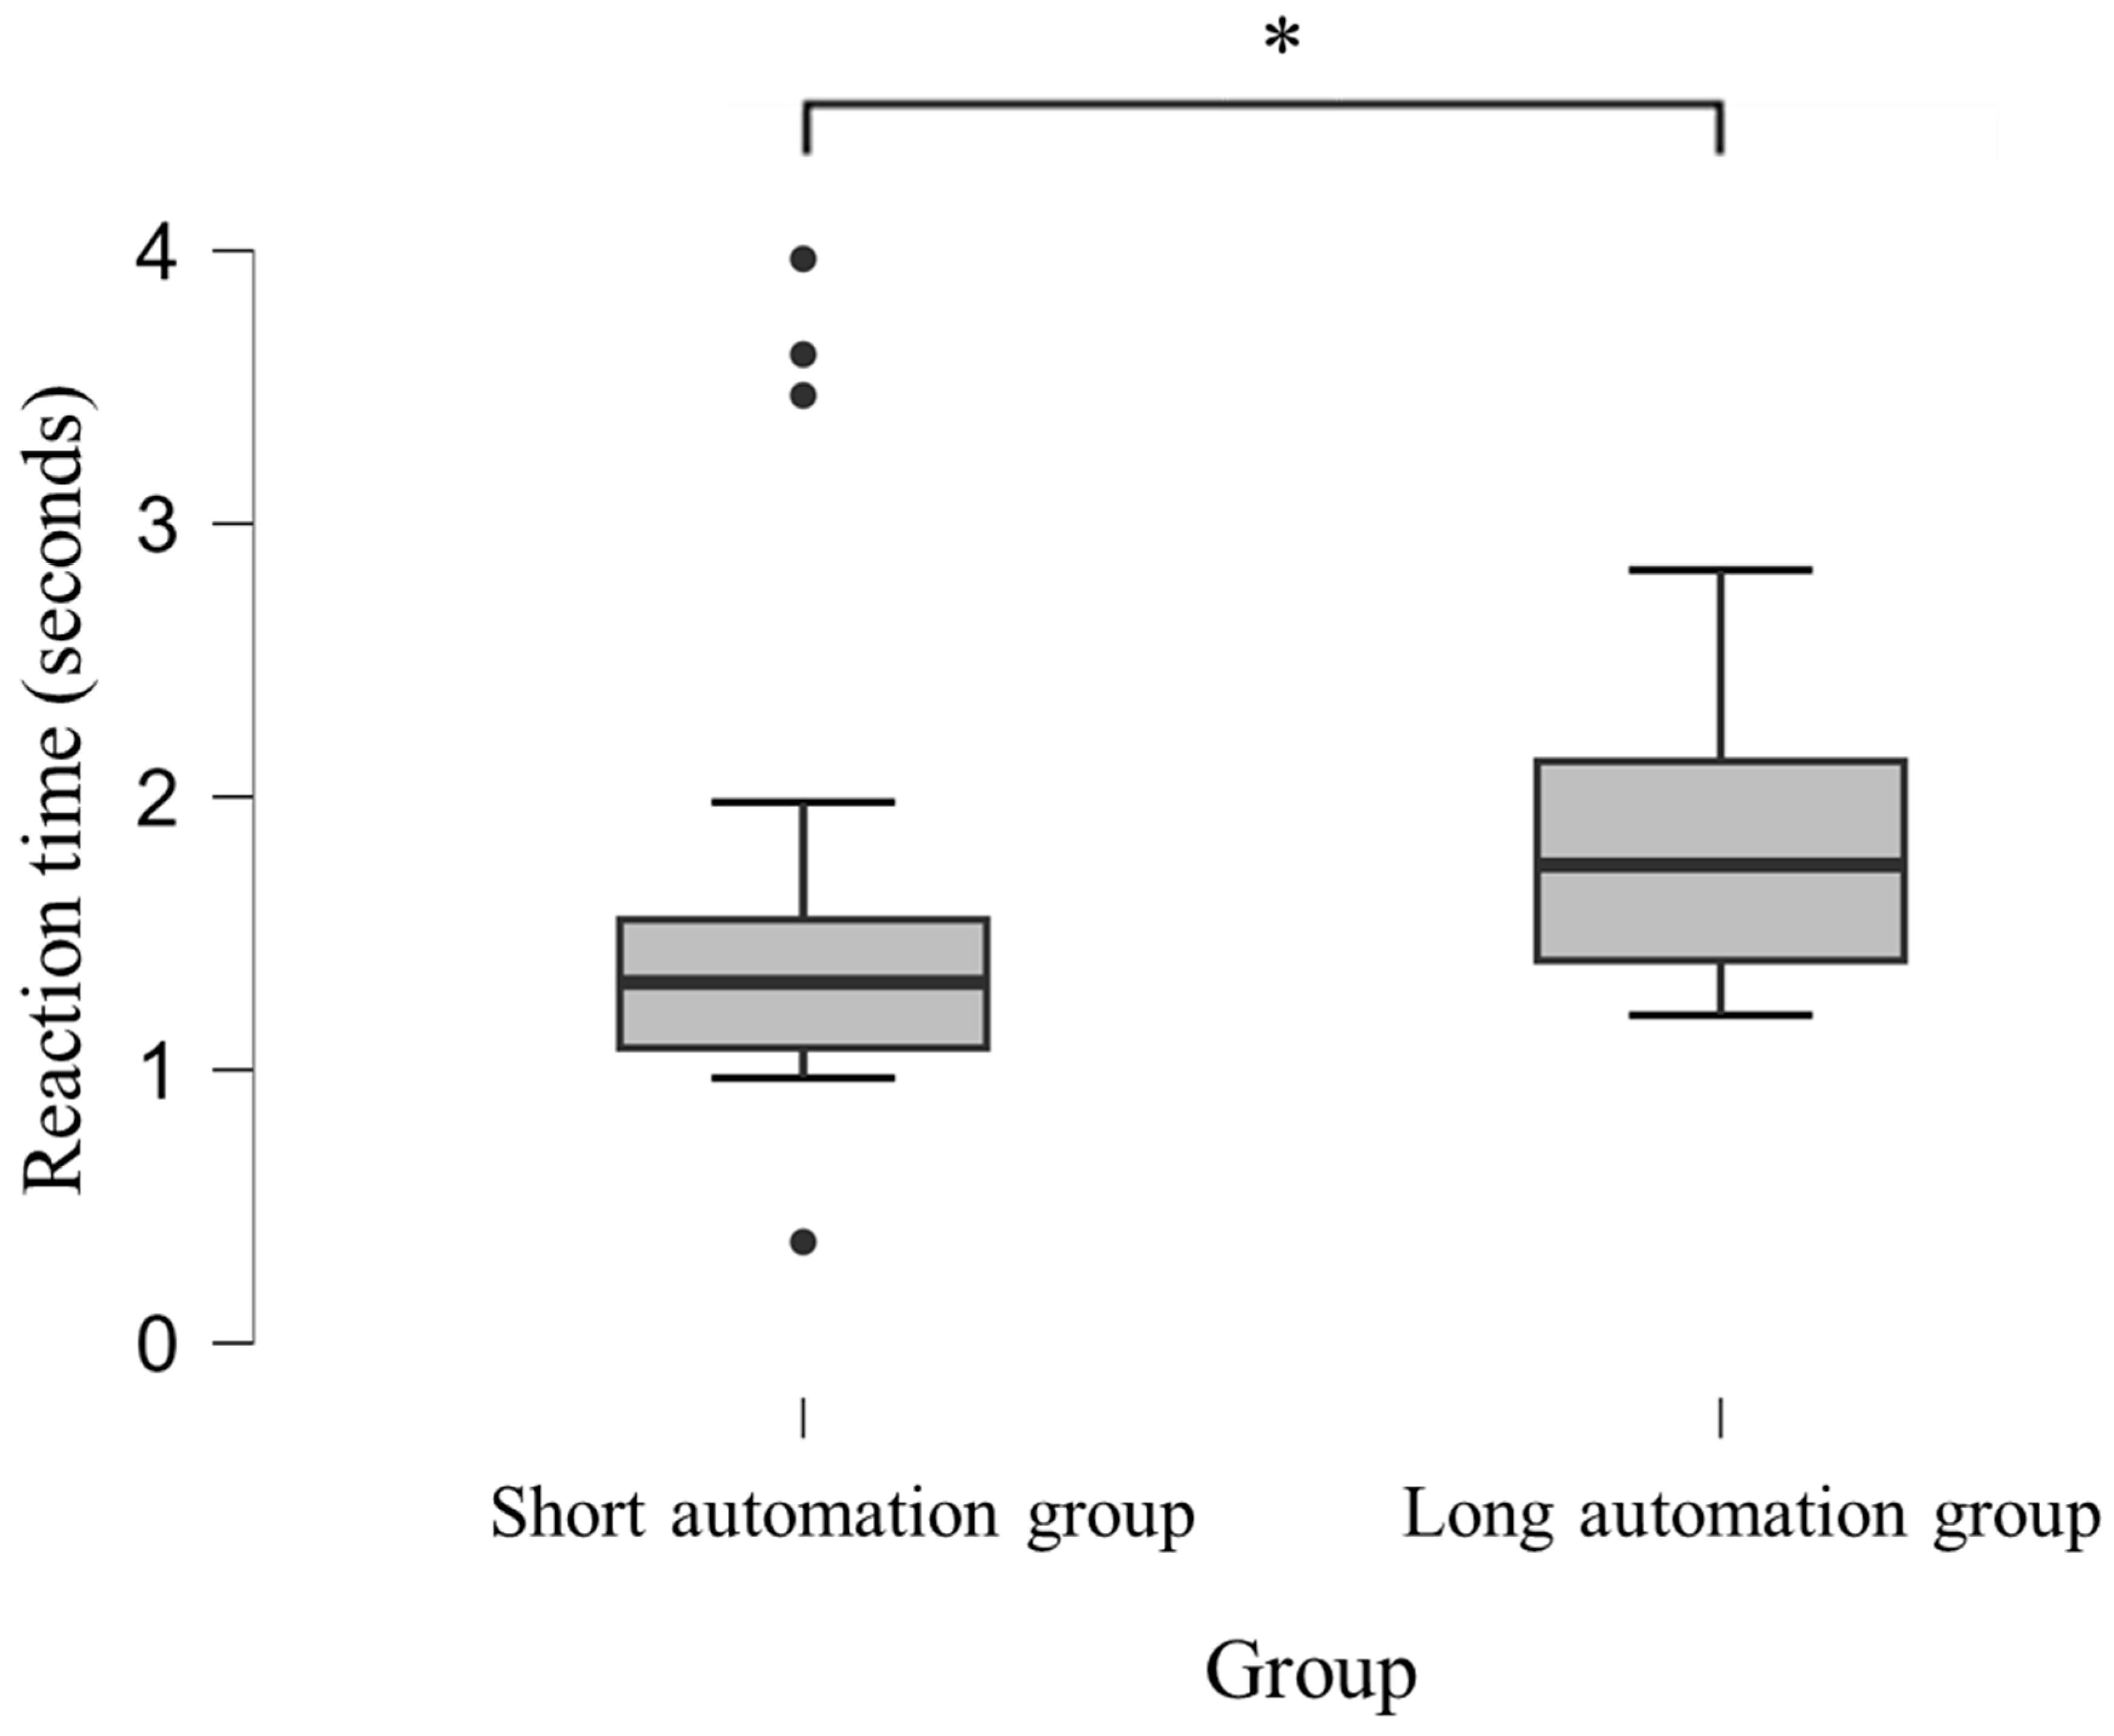
SRRT provided an objective measure of takeover readiness. Responses were slower after long exposure (Md
s,
) than after short exposure (Md
s,
),
,
,
(
Figure 11). Computation details appear in
Appendix E. As shown in
Figure 11, the long automation group shows a higher median reaction time and an overall upward shift in the distribution compared with the short automation group, indicating slower takeover responses at the group level despite individual variability.
4.7. Summary of Findings
Across scenarios, RVM→RC was lower after Long in Scenarios 1–2 (−33.8%, −47.0%) but higher in Scenario 3 (+52.2%). We read Scenario 3’s divergence as a context-sensitive, partial refocusing prompted by a visually prominent, fast-approaching, vulnerable road user (motorcycle) occurring later in the exposure timeline, coexisting with reduced LP→RC recovery (−65%) and increased non-informative RC→LP (+131%).
Long automation exposure reduced rear-view mirror-to-road-centre recovery across Scenarios 1–2 (significant in Scenario 2) and increased HMI and left lateral allocation.
Scenario 3 exhibited directionally similar but non-significant changes (longer glances, reduced LP→RC), indicating possible attentional drift.
SRRT was reliably slower following long exposure, demonstrating a performance cost that paralleled changes in gaze-transition structure.
Together, these results indicate that even moderate extensions of automation duration can alter the probabilistic structure of gaze transitions and delay takeover responses, marking an early behavioural signature of supervisory disengagement.
5. Discussion
This study examined how Level 2 automation exposure duration influences supervisory gaze organisation and subsequent takeover readiness. Understanding this relationship is essential for designing systems that preserve driver situation awareness even during relatively short automation periods in which early supervisory drift can emerge. By combining first-order Markov modelling of gaze transitions with behavioural takeover measures, we contribute an integrated method for quantifying how short-term automation exposure reshapes the structure (not merely the amount) of supervisory attention.
Building on the Markov-based analysis of gaze-transition probabilities and behavioural reaction times reported above, this section interprets the findings in relation to established frameworks of attention and situation awareness. The discussion first summarises the main results, then situates them within theories of adaptive attention, Out-of-the-Loop performance, and the situation awareness discrepancy () framework, before outlining their applied implications for driver monitoring and automation design.
5.1. Overview of Findings
The present study examined how automation duration influences the transition structure of supervisory gaze and subsequent takeover performance. We discuss these results in terms of the structure of supervisory gaze (verification loops), their mapping to Endsley’s three levels of situation awareness, and implications for DMS/HMI design and policy.
Using first-order Markov modelling, we quantified conditional gaze-shift probabilities between Areas of Interest (AOIs) during Short (5 min) and Long (15 min) automation. Across scenarios, and as shown in
Appendix F (
Figure A3,
Figure A4 and
Figure A5) and summarised in
Table 3,
Table 4 and
Table 5, the Long condition showed
weaker verification loops, especially reduced rear-view mirror→road-centre recoveries (RVM→RC), alongside a redistribution toward peripheral sampling; importantly, no between-condition differences emerged for RC→RC or related static RC measures. This null RC→RC result suggests that early drift in supervisory organisation may first manifest as disrupted verification loops (e.g., fewer RVM→RC recoveries) and shifts toward peripheral sampling, without an accompanying increase in repeated forward glances. This pattern is consistent with previous automation duration studies reporting degraded engagement and slower takeover performance with extended supervision, even when coarse gaze allocation measures remain relatively stable [
39,
40].
In Endsley’s framework, situation awareness develops through perception of environmental elements (Level 1), comprehension of their meaning (Level 2), and projection of their near-future status (Level 3) [
7,
13]. Building on this logic, we interpret static gaze allocation as reflecting
perceptual awareness of scene elements (Level 1), the transition structure of gaze as reflecting
comprehension through integration across multiple sources (Level 2), and recurrent verification loops as behavioural support for
projection (Level 3) by maintaining an up-to-date forward model of the situation. Accordingly, the observed reduction of RVM→RC recoveries in the Long condition may indicate weakened comprehension and reduced support for projection, even though overall eyes-on-road time (Level 1 perception) remained stable. This operationalisation does not claim a one-to-one mapping of gaze to SA levels but provides a behavioural approximation of the processes (perception, integration, and forward modelling) through which situation awareness is sustained. This distinction aligns with prior gaze-based driving research showing that aggregate measures such as percent road centre or prolonged off-path glances capture where drivers look but not how information from different regions is integrated over time [
24,
25].
Takeover performance also deteriorated, with significantly slower steering reaction times after extended exposure (
Figure 11). Comparable delays in takeover response with increasing automation exposure have been reported in simulator studies of Level 2 and Level 3 driving, linking supervisory disengagement to delayed control re-engagement [
39,
40,
41]. Although several transition differences did not remain significant after within-scenario FDR adjustment, their convergence in direction and the accompanying behavioural cost together suggest a measurable form of supervisory drift.
5.2. Supervisory Drift and Attentional Adaptation
Longer automation exposure appeared to alter how drivers organised their gaze transitions rather than causing clear visual disengagement. Overall eyes-on-road proportions remained high, yet the underlying transition structure became less varied and less cyclical, reflecting a shift from active scanning to passive monitoring. This change is consistent with the Malleable Attentional Resources Theory (MART) [
9], which proposes that attentional resources are dynamically redistributed according to perceived task demands. Under stable automation, reduced environmental variability lowers subjective demand, encouraging an efficiency-oriented strategy that gradually diminishes the frequency of confirmatory checks such as mirror→road-centre loops.
The decline in these verification cycles represents a weakening of environmental updating. Drivers may retain the impression of adequate supervision while failing to integrate peripheral and rearward information into a coherent mental model. Consequently, when a takeover request arises, the driver’s
situational representation can lag behind the
information required by the environment (i.e., the set of cues needed to act safely at that moment). The observed change does not reflect “repetitive scanning” in a colloquial sense but rather a
structural reorganisation of supervisory gaze: Verification loops linking peripheral or interface checks back to the forward roadway (e.g., RVM→RC, HMI→RC) became less frequent, while forward fixations themselves remained stable. This pattern indicates erosion of the monitoring structure rather than an increase in forward dwell repetition, consistent with cognitive underload during sustained Level 2 supervision [
4,
5]. Recent vigilance-focused simulator studies further indicate that measurable vigilance decrement under automated driving can emerge within approximately 15 min, supporting the timescale at which supervisory reorganisation was observed here [
16,
20].
5.3. Situation-Awareness Interpretation and the δ Framework
Within the situation awareness discrepancy framework (
) [
30], these results can be viewed as a widening gap between required (
) and achieved awareness (
). Task demands were identical across exposure durations, yet the long-exposure group achieved lower effective awareness, behaviourally indexed by the breakdown of coherent gaze transitions. Frequent and well-organised transition loops correspond to small
, whereas their erosion signals increasing divergence between normative and actual monitoring performance.
The associated delay in SRRT (about 0.3–0.4 s) illustrates the behavioural cost of weaker verification loops. During routine automation, remains relatively stable and low; with a sudden demand (the TOR), spikes. If verification loops have thinned, may not keep pace, producing a momentary discrepancy manifested as an SRRT delay. At 100 km/h ( m/s), such a 0.3–0.4 s delay corresponds to an additional 8.3–11.1 m of travel before driver action, underscoring how even brief cognitive lags can have tangible operational consequences.
5.4. Theoretical Integration and OOTL Perspective
These results refine the Out-of-the-Loop (OOTL) account by showing that loss of supervisory effectiveness develops through
structural reorganisation of gaze dynamics rather than abrupt attentional dropout. Specifically, reduced RVM→RC and HMI→RC recoveries indicate partial decoupling between
perceptual sampling and
situation updating. In Endsley’s terms,
perception (Level 1) remains largely intact, while
comprehension (Level 2) and support for
projection (Level 3) erode as verification loops thin. Whereas many Out-of-the-Loop paradigms examine supervisory degradation using secondary tasks or explicit attentional manipulation [
4,
42], the present results show that comparable structural degradation can emerge naturally under stable Level 2 automation, without introducing additional task demands.
From a resource allocation standpoint, the findings are consistent with MART [
9]: Under stable automation, drivers adapt by compressing monitoring routines, thereby lowering effort but weakening the framework that supports situation awareness. The Markov-based transition approach quantifies this drift in a way that aligns behavioural evidence with cognitive theory, without requiring continuous modelling.
5.5. Engineering and Policy Implications
For human–machine interface (HMI) and driver-monitoring systems (DMS), these findings argue for metrics that track
transition structure, not only aggregate eyes on road. This perspective aligns with recent driver-readiness research indicating that static gaze allocation thresholds alone cannot adequately capture supervisory readiness under Level 2 automation. Interpretable, scenario-aware indicators are therefore required to support effective interventions [
43]. This approach complements existing DMS strategies that rely on static thresholds such as eyes-on-road time or prolonged off-path glances [
24], by targeting earlier changes in supervisory organisation that may precede overt visual disengagement.
Indicators such as RVM→RC and HMI→RC
recovery probabilities and LP→RC
return-to-forward transitions, can serve as early markers of supervisory drift. Real-time detection of a thinning recovery structure could trigger soft, context-sensitive prompts or suggest short breaks. These interventions are particularly relevant on expressways where ∼15 min corresponds to typical distances between service areas [
10].
Scenario 3 (motorcycle overtake) suggests adaptive but incomplete correction: Despite accumulated exposure, the visually prominent, safety-aware vulnerable road user (VRU) appears to transiently re-orient mirror checks back to the forward roadway (RVM→RC increased by 52.2%), yet other patterns still indicate reduced strategic monitoring (LP→RC down 65%, RC→LP up 131%). DMS logic could exploit this by giving greater weight to VRU-related gaze transitions when the scene indicates a VRU, helping detect when driver adaptation is insufficient and a prompt is needed.
From a policy perspective, the linkage between transition structure degradation and response delay supports current ASV/MLIT directions that seek quantitative DMS thresholds [
1,
44]. Transition-based analytics provide a principled pathway for defining intervention criteria that are
scenario-aware (e.g., weighting returns-to-forward differently in VRU vs. non-VRU contexts).
5.6. Limitations and Future Work
The present study provides an initial view of early supervisory drift, but several limitations should be noted. The modest sample size implies a detectable effect threshold of approximately for 80% power, indicating that only large effects could be reliably identified under the current design. Consequently, the analyses were treated as exploratory and intended to highlight effect magnitudes and consistent directional trends rather than to establish confirmatory inference. Future work should include larger and more balanced samples to enable confirmatory designs and to test the generalisability of the observed trends.
Second, the modelling approach focused on first-order Markov transitions, which capture the probabilistic structure of successive gaze shifts but not their broader organisation [
8]. In contrast to prior work that aggregates gaze behaviour over extended time windows or relies on discrete event-based measures [
24,
25], the present approach prioritises structural information at the cost of longer-range temporal dependencies. This means that specific transition patterns could not be tied directly to moment-to-moment driving demands even within a specific structured traffic scenario. Higher-order or sequential modelling techniques, such as Hidden Markov Models (HMMs) or dynamic Bayesian networks, could reveal how attention unfolds across multiple time steps and identify underlying monitoring states that precede recovery or lapse episodes.
Third, the two exposure intervals (5 and 15 min) capture only short-term adaptation. Longer experimental drives and within-subject designs would be needed to track non-linear trajectories of trust and monitoring, including potential episodic corrections hinted at in Scenario 3. In addition, the set of driving scenarios was intentionally limited to three non-critical, foreseeable expressway events in order to maintain experimental control and comparable supervisory demands across exposure conditions. While these scenarios captured distinct monitoring requirements, they do not represent the full diversity of traffic situations encountered in real-world driving. Future studies should extend this approach to a broader range of scenarios, including varying traffic densities, road geometries, and longer automation exposures, to assess the generalisability of scenario-specific supervisory gaze reorganisation.
The sample consisted of experienced, automation-literate drivers, representing a conservative case: If drift occurs in such a population, it may be equal or more pronounced among less experienced or older users of Level 2 systems. Finally, although simulator control ensured reproducibility, on-road validation is required under varying traffic density, road curvature, and workload conditions. Scenario 3 also suggests that accumulated drift may be partly mitigated by visually prominent, safety-relevant events (e.g., vulnerable road users) yet co-occur with less informative gaze allocation (e.g., increased RC→LP), highlighting the need to understand how and when attention re-orients during natural driving. Further work should extend this analysis to longer drives and more varied traffic compositions to examine whether such adaptive re-engagements represent brief recoveries or transitions between distinct phases of Out-of-the-Loop degradation.
6. Conclusions
This study investigated how automation exposure duration (5 versus 15 min) affects the structure of supervisory gaze behaviour during Level 2 driving. The analysis preserved scenario boundaries and did not impose secondary tasks, allowing changes in supervisory behaviour to emerge naturally from automation underload rather than being experimentally induced.
Markov chain analysis showed directionally consistent patterns across scenarios: Longer exposure was associated with fewer mirror-to-road-centre recovery transitions and slower takeover responses (median SRRT increase of approximately 0.4 s).
While gaze transition effects did not reach statistical significance after correction for multiple comparisons, their consistent direction combined with the confirmed SRRT effect suggests systematic change in supervisory behaviour. Given that only effects exceeding roughly could be detected with high power, smaller trends should be interpreted as preliminary but practically informative for identifying candidate gaze metrics.
The situation-awareness discrepancy framework () provides a coherent account of these patterns: Longer automation increases the gap between required awareness and achieved awareness by degrading the monitoring loops that build and maintain situation awareness. This degradation can occur while aggregate eyes-on-road time remains high, indicating a limitation of current driver-monitoring approaches. Static allocation metrics capture whether drivers look at relevant regions but cannot assess whether they integrate information across multiple sources or maintain ongoing environmental model updates. Within Endsley’s situation-awareness framework, we interpret static gaze allocation as an index of perception (Level 1), transition structure as a behavioural correlate of comprehension through information integration (Level 2), and recurrent verification loops as support for projection by maintaining an updated forward model (Level 3). The transition structure approach addresses this gap by quantifying how gaze organises across information channels, providing a quantifiable link between gaze organisation and takeover readiness.
These findings should be considered exploratory. Scenario 3 (motorcycle overtake) showed weaker and less-consistent effects than Scenarios 1 and 2. This difference might reflect adaptive attention correction triggered by the close-proximity vulnerable road user; such adaptive re-engagements represent brief recoveries or transitions between distinct phases of Out-of-the-Loop degradation, potentially masking broader trends in supervisory drift. Replication with larger samples and within-subject designs is needed to determine whether the observed patterns reflect systematic drift or sample-specific variation.
For Japan’s Advanced Safety Vehicle (ASV) Promotion Plan, these results suggest that transition-based gaze metrics might complement existing driver-monitoring approaches by capturing supervisory quality beyond aggregate eyes-on-road time. The Markov chain framework implements a reproducible computational method based on gaze definitions and metrics consistent with ISO standards, enabling future work to determine whether RVM→RC and HMI→RC probabilities can serve as validated indicators of supervisory state and inform real-time detection criteria for driver-monitoring systems, enabling interventions calibrated to scenario-specific demands (for example, applying different thresholds when vulnerable road users are present versus routine highway supervision).
Future research should extend exposure durations, increase sample sizes, and validate the proposed gaze metrics in naturalistic settings and across diverse traffic conditions. By quantifying candidate indicators of how supervisory attention reorganises under automation and linking transition structure to takeover performance, this study provides a methodological foundation and directional evidence to guide the specification of human-monitoring requirements in Level 2 systems.
Author Contributions
H.C.: conceptualisation, methodology, validation, formal analysis, investigation, data curation, writing—original manuscript, review and editing, visualisation, and project administration. J.L.: Methodology, software, validation, investigation, data curation, and writing—review. Y.S.: Methodology, software, validation, data curation, and writing—review. H.N.: Methodology, validation, resources, writing—review, and supervision. G.A.: Resources, writing—review and editing, supervision, project administration, and funding acquisition. M.I.: Resources, writing—review and editing, supervision, and funding acquisition. All authors have read and agreed to the published version of the manuscript.
Funding
This research was partly supported by JSPS KAKENHI 24H00361.
Institutional Review Board Statement
The study was conducted in accordance with the Declaration of Helsinki and was approved by theJapan Automobile Research Institute Experimental Ethics Committee, approval code: 21-026, date: 2021/1/11.
Informed Consent Statement
Informed consent was obtained from all subjects involved in the study.
Data Availability Statement
The original contributions presented in this study are included in the article. Further inquiries can be directed to the corresponding author.
Acknowledgments
We thank the Japan Automobile Research Institute technical staff for simulator support.
Conflicts of Interest
The authors declare no conflicts of interest.
Abbreviations
The following abbreviations are used in this manuscript:
| AOI | Area of interest |
| HMI | Human–machine interface |
| SRRT | System-recognised reaction time |
| MART | Malleable Attentional Resources Theory |
| OOTL | Out-of-the-loop |
| SA | Situation awareness |
| FDR | False discovery rate |
Appendix A. Driver Point-of-View Snapshots
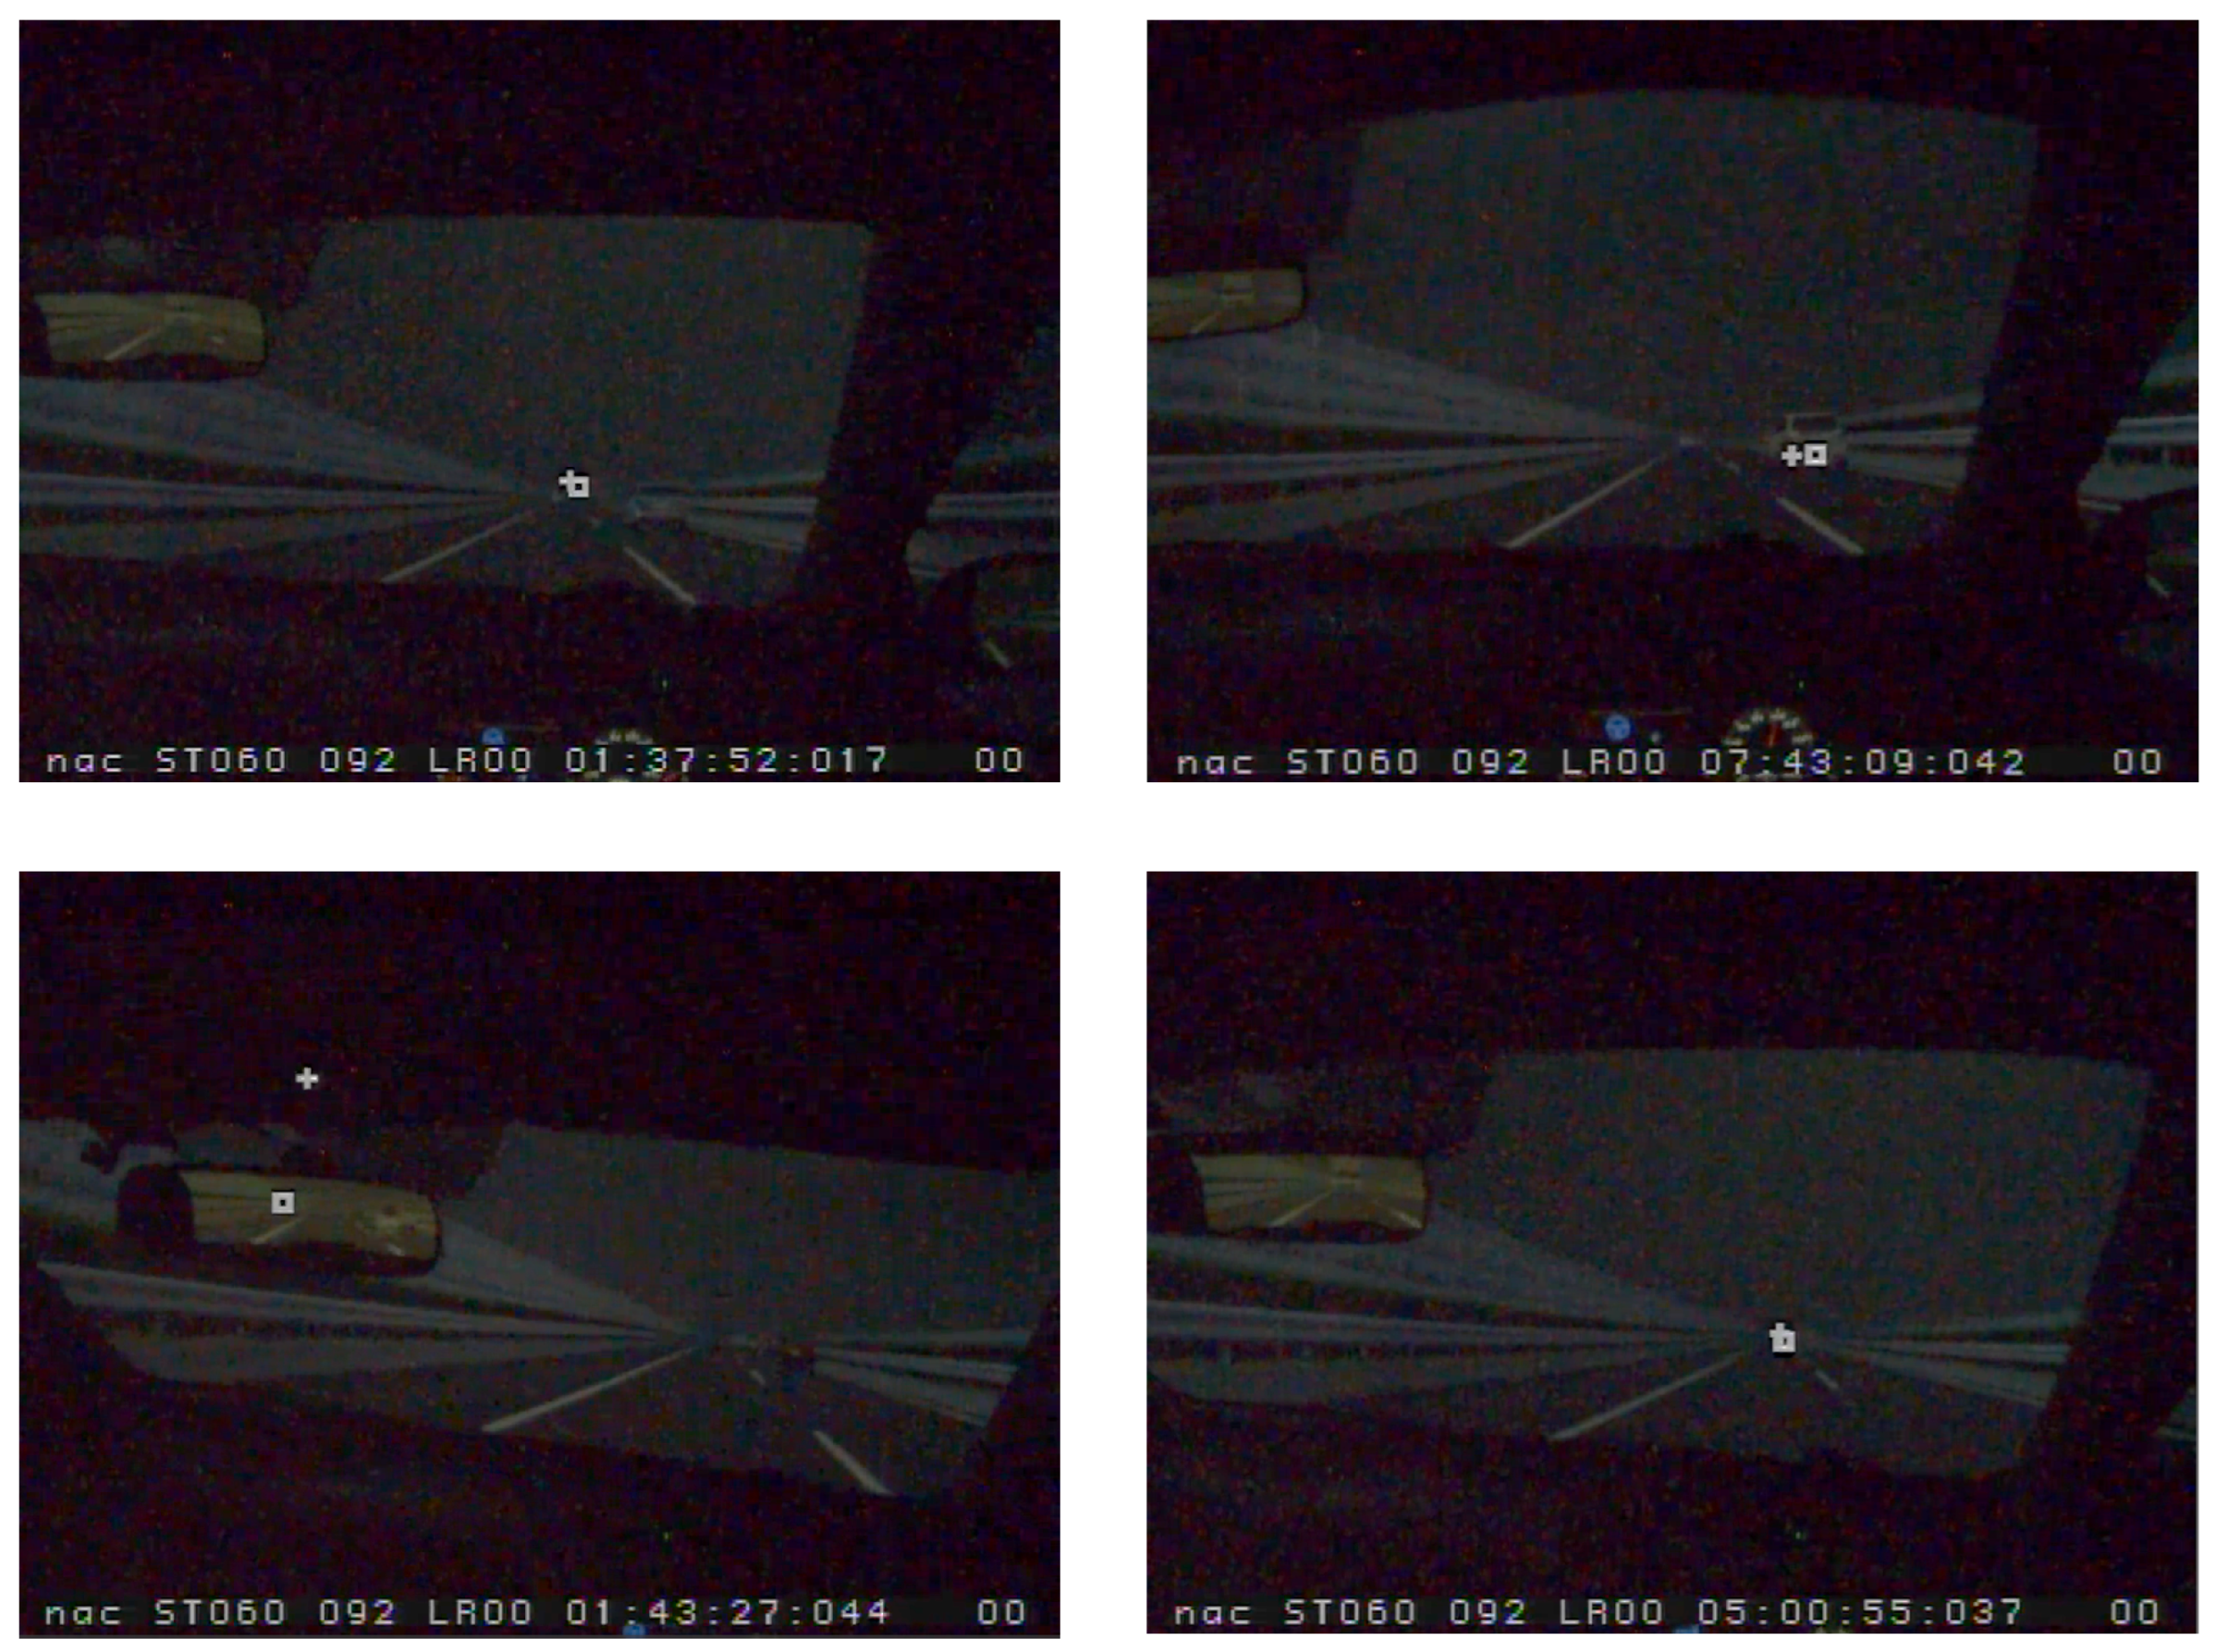
Representative scene camera frames are provided to illustrate typical driver viewpoints in the simulator. All AOIs were coded directly from the continuous scene-camera video feed.
Figure A1.
Representative scene camera frames illustrating driver point-of-view from four different participants during Level 2 automation. Gaze positions are overlaid: Square marker (□) indicates right eye fixation; cross marker (+) indicates left eye fixation.
Figure A1.
Representative scene camera frames illustrating driver point-of-view from four different participants during Level 2 automation. Gaze positions are overlaid: Square marker (□) indicates right eye fixation; cross marker (+) indicates left eye fixation.
Appendix B. Theoretical Foundation of First-Order Transitions
Eye movements were modelled as a first-order Markov process [
8,
33,
34]. This approach represents the probability of shifting gaze between Areas of Interest (AOIs) and assumes that each glance depends only on the immediately preceding one. For each participant and scenario, the number of gaze shifts from AOI
i to AOI
j was counted to form a matrix
. The conditional transition probability was
with
. Diagonal elements
represent persistence within an AOI; off-diagonal elements indicate the likelihood of a shift between AOIs. Such a model captures the main structure of supervisory scanning behaviour in Level 2 driving automation without requiring more complex higher-order dynamics.
Appendix C. Preprocessing and AOI Definitions
Raw gaze samples (60 Hz) were processed according to ISO 15007:2020. Blink classification followed standard duration criteria [
31]. Each gaze point was manually assigned to one of nine AOIs: road centre (RC), rear-view mirror (RVM), outside mirrors (OMD, OMP), HMI, right periphery (RP), left periphery (LP), side window driver side (SWD), and other (OTH). Mapping was performed manually from scene video using coder judgement; no pixel- or angle-based thresholding was applied.
Consecutive samples within the same AOI were merged into a single
glance if the dwell lasted at least 150 ms (nine frames). This threshold follows previous work in driving research [
32,
45] and is consistent with fixation durations reported in other high-speed visuomotor contexts [
46]. Shorter dwells were merged with the next valid glance, in line with ISO 15007 Annex F.
Appendix D. False Discovery Rate Correction
False discovery rate control used the Benjamini–Hochberg procedure [
47] with
, applied separately within each scenario (
comparisons: 72 transition probabilities and 27 static metrics). For example, in Scenario 2, the smallest uncorrected
p-values were RVM→RC (
) and RC→LP (
). After BH correction these became
and
, confirming that no transition remained significant once multiplicity was controlled. The single System-Recognised Reaction Time (SRRT) comparison (
) required no correction and remained significant.
Appendix E. Takeover Performance Computation
Appendix E.1. Automation Disengagement Criteria
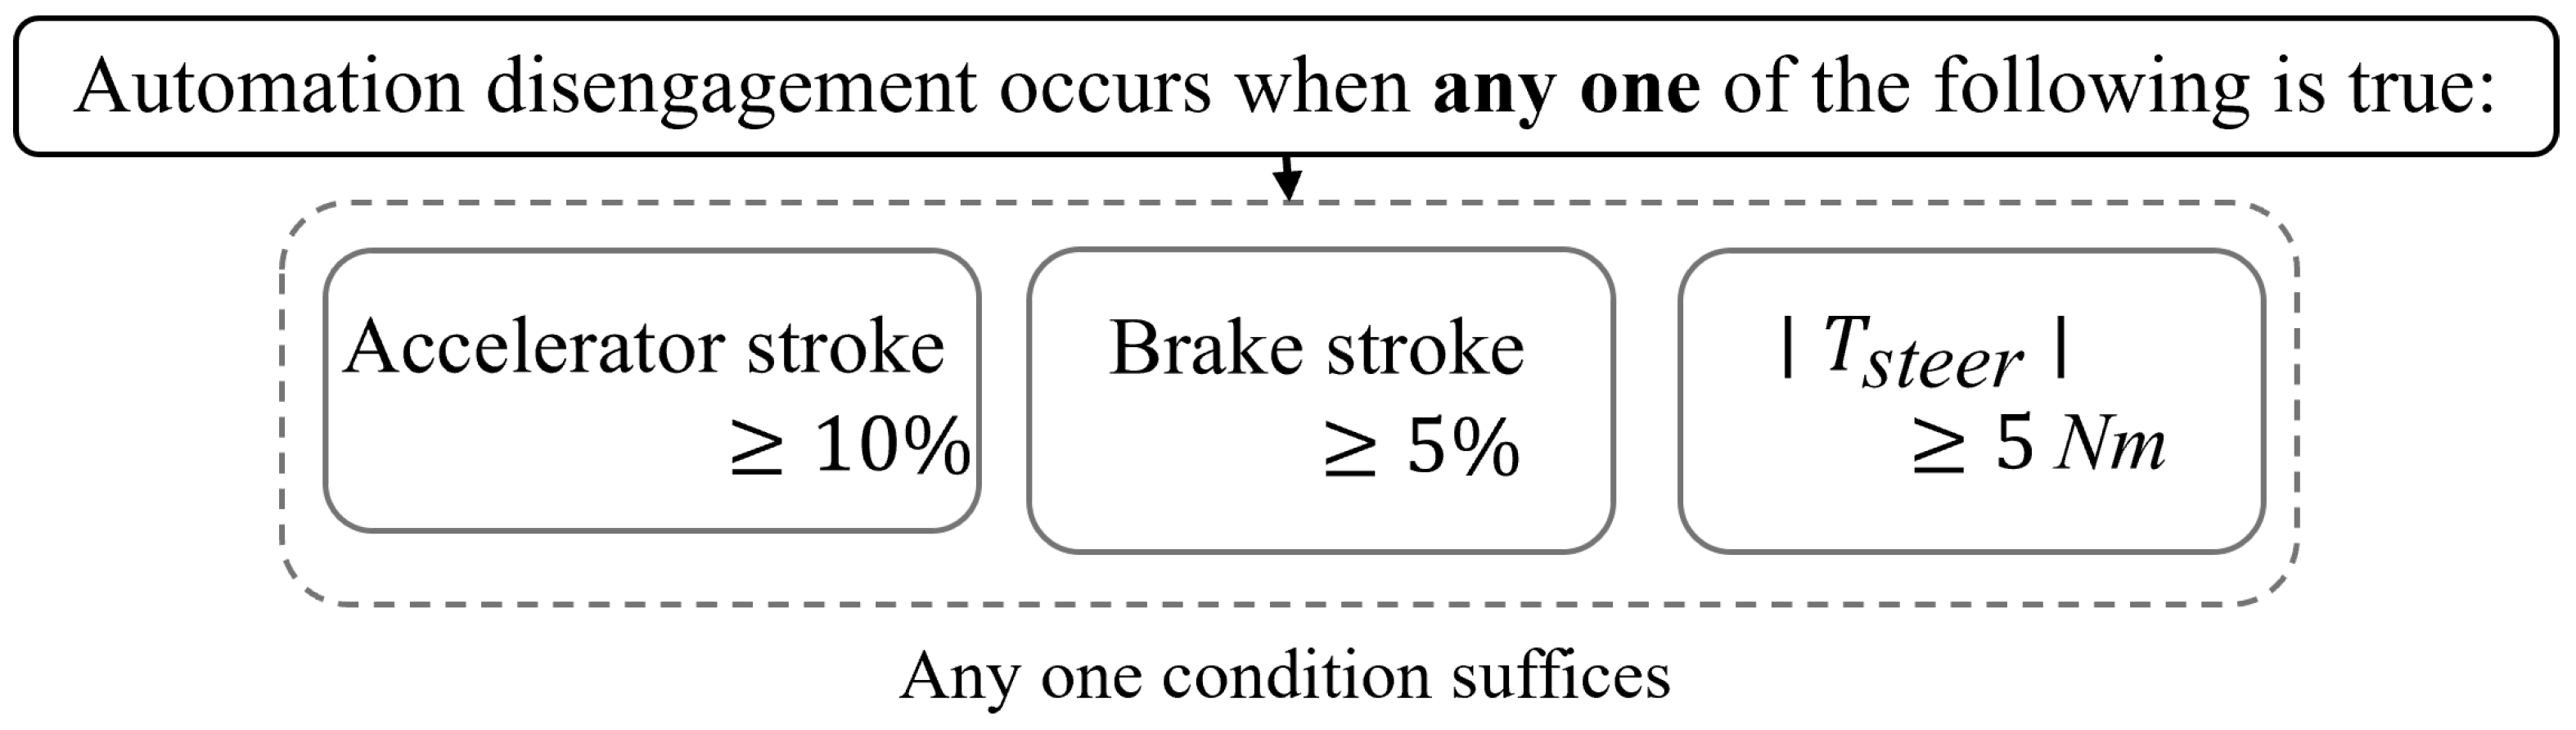
Automation disengagement thresholds followed the official JARI scenario documentation. These thresholds defined when the Level 2 system transitioned from automated to manual control during a takeover request (TOR).
Translated specification:
Automation is considered disengaged when any of the following conditions is met:
Accelerator pedal stroke ,
Brake pedal stroke ,
Steering torque magnitude ≥ 5 Nm.
Figure A2.
Automation disengagement thresholds used for computing takeover reaction time (JARI specification).
Figure A2.
Automation disengagement thresholds used for computing takeover reaction time (JARI specification).
Appendix E.2. System-Recognised Reaction Time (SRRT)
SRRT was the sole metric used to quantify takeover performance. It was computed from simulator log data as the interval between the onset of the takeover request and the system’s detection of manual re-engagement, based on the
automation status flag recorded in the log file: A value of 3 denoted the takeover request state, and 0 denoted automation off (manual control restored):
where 120 Hz is the simulator’s data-logging rate.
This measure captures the total takeover duration as recognised by the automation. Since SRRT derives from discrete state transitions, it avoids variability due to sensor noise or individual differences in input magnitude. SRRT was chosen for three reasons: (i) system comparability (the automation status transition is identical across participants), (ii) reproducibility (the metric derives from deterministic log events), and (iii) safety relevance (SRRT reflects the timing recognised by the automation for control transfer).
Appendix F. Representative Gaze Transition Schematics
This appendix presents first-order gaze transition schematics for each driving scenario. Each diagram displays the Areas of Interest (AOIs) as nodes and shows only those AOI→AOI transitions whose probabilities changed between the Short and Long conditions. Arrows indicate the direction of gaze movement, and the percentage change labels show how transition probabilities differed in the Long condition relative to Short. Solid arrows denote increases, and dashed arrows denote decreases. Transitions labelled “New” appeared only after longer automation exposure.
Symbols on the arrows indicate the strength of the underlying statistical effect: * marks transitions that reached uncorrected significance in the main tests (), and † marks transitions that were marginally significant at the uncorrected level (). These schematics are descriptive visual summaries intended to complement the numerical results in the main text; they are not used for statistical inference.
Figure A3.
Scenario 1 (rear vehicle cut-out): schematic showing transitions that changed between Short and Long automation. Solid arrows = increases in Long; dashed arrows = decreases; “New” = observed only in Long; † = uncorrected (marginal, not FDR-survived).
Figure A3.
Scenario 1 (rear vehicle cut-out): schematic showing transitions that changed between Short and Long automation. Solid arrows = increases in Long; dashed arrows = decreases; “New” = observed only in Long; † = uncorrected (marginal, not FDR-survived).
Figure A4.
Scenario 2 (side-vehicle cut-in): schematic of transitions that changed between Short and Long automation. * uncorrected
;
† uncorrected
. Conventions as in
Figure A3.
Figure A4.
Scenario 2 (side-vehicle cut-in): schematic of transitions that changed between Short and Long automation. * uncorrected
;
† uncorrected
. Conventions as in
Figure A3.
Figure A5.
Scenario 3 (motorcycle overtake): schematic of transitions that changed between Short and Long automation. Conventions as in
Figure A3.
Figure A5.
Scenario 3 (motorcycle overtake): schematic of transitions that changed between Short and Long automation. Conventions as in
Figure A3.
References
- Ministry of Land, Infrastructure, Transport and Tourism. The Future of Vehicle Safety for a Traffic Accident-Free Society; Road Transport Bureau, MLIT: Tokyo, Japan, 2021. [Google Scholar]
- Endsley, M.R. Toward a theory of situation awareness in dynamic systems. In Situational Awareness; Routledge: Oxfordshire, UK, 2017; pp. 9–42. [Google Scholar]
- Parasuraman, R.; Riley, V. Humans and automation: Use, misuse, disuse, abuse. Hum. Factors 1997, 39, 230–253. [Google Scholar] [CrossRef]
- Louw, T.; Merat, N. Are you in the loop? Using gaze dispersion to understand driver visual attention during vehicle automation. Transp. Res. Part C Emerg. Technol. 2017, 76, 35–50. [Google Scholar] [CrossRef]
- Gold, C.; Happee, R.; Bengler, K. Modeling take-over performance in level 3 conditionally automated vehicles. Accid. Anal. Prev. 2018, 116, 3–13. [Google Scholar] [CrossRef] [PubMed]
- Land, M.; Tatler, B. Looking and Acting: Vision and Eye Movements in Natural Behaviour; Oxford University Press: Oxford, UK, 2009. [Google Scholar]
- Endsley, M.R. Situation awareness misconceptions and misunderstandings. J. Cogn. Eng. Decis. Mak. 2015, 9, 4–32. [Google Scholar] [CrossRef]
- Underwood, G.; Chapman, P.; Brocklehurst, N.; Underwood, A.; Crundall, D. Visual attention while driving: Sequences of eye fixations made by experienced and novice drivers. Ergonomics 2003, 46, 629–646. [Google Scholar] [CrossRef]
- Young, M.S.; Stanton, N.A. Malleable attentional resources theory: A new explanation for the effects of mental underload on performance. Hum. Factors 2002, 44, 365–375. [Google Scholar] [CrossRef] [PubMed]
- NEXCO East. Guide to Expressway Service and Parking Areas in Japan; NEXCO: Tokyo Japan, 2022. [Google Scholar]
- Central Nippon Expressway Company. Central Nippon Expressway Pass Pamphlet (English); Central Nippon Expressway Company: Nagoya, Japan, 2022. [Google Scholar]
- Eriksson, A.; Stanton, N.A. Takeover time in highly automated vehicles: Noncritical transitions to and from manual control. Hum. Factors 2017, 59, 689–705. [Google Scholar] [CrossRef]
- Endsley, M.R. Measurement of situation awareness in dynamic systems. Hum. Factors 1995, 37, 65–84. [Google Scholar] [CrossRef]
- Casner, S.M.; Schooler, J.W. Vigilance impossible: Diligence, distraction, and daydreaming all lead to failures in a practical monitoring task. Conscious. Cogn. 2015, 35, 33–41. [Google Scholar] [CrossRef]
- Louw, T.; Markkula, G.; Boer, E.; Madigan, R.; Carsten, O.; Merat, N. Coming back into the loop: Drivers’ perceptual-motor performance in critical events after automated driving. Accid. Anal. Prev. 2017, 108, 9–18. [Google Scholar] [CrossRef]
- Vogelpohl, T.; Kühn, M.; Hummel, T.; Vollrath, M. Asleep at the automated wheel—Sleepiness and fatigue during highly automated driving. Accid. Anal. Prev. 2019, 126, 70–84. [Google Scholar] [CrossRef]
- Greenlee, E.T.; DeLucia, P.R.; Newton, D.C. Driver vigilance in automated vehicles: Hazard detection failures are a matter of time. Hum. Factors 2018, 60, 465–476. [Google Scholar] [CrossRef]
- Solís-Marcos, I.; Galvao-Carmona, A.; Kircher, K. Reduced attention allocation during short periods of partially automated driving: An event-related potentials study. Front. Hum. Neurosci. 2017, 11, 537. [Google Scholar] [CrossRef]
- Feldhütter, A.; Gold, C.; Schneider, S.; Bengler, K. How the duration of automated driving influences take-over performance and gaze behavior. In Advances in Ergonomic Design of Systems, Products and Processes: Proceedings of the Annual Meeting of GfA 2016, Aachen, Germany, 2–4 March 2016; Springer: Berlin/Heidelberg, Germany, 2016; pp. 309–318. [Google Scholar]
- Lin, C.; Zhang, F.; Zhang, Y.; Zhang, T. Vigilance decrement in automated vs. manual driving: Insights from multimodal data. Transp. Res. Part Traffic Psychol. Behav. 2025, 112, 207–220. [Google Scholar] [CrossRef]
- Schömig, N.; Hargutt, V.; Neukum, A.; Petermann-Stock, I.; Othersen, I. The interaction between highly automated driving and the development of drowsiness. Procedia Manuf. 2015, 3, 6652–6659. [Google Scholar] [CrossRef]
- Taylor, R.M. Situational awareness rating technique (SART): The development of a tool for aircrew systems design. In Situational Awareness; Routledge: Oxfordshire, UK, 2017; pp. 111–128. [Google Scholar]
- Zhou, F.; Yang, X.J.; de Winter, J.C.F. Using eye-tracking data to predict situation awareness in real time during takeover transitions in conditionally automated driving. IEEE Trans. Intell. Transp. Syst. 2021, 23, 2284–2295. [Google Scholar] [CrossRef]
- Victor, T.W.; Tivesten, E.; Gustavsson, P.; Johansson, J.; Sangberg, F.; Ljung Aust, M. Automation expectation mismatch: Incorrect prediction despite eyes on threat and hands on wheel. Hum. Factors 2018, 60, 1095–1116. [Google Scholar] [CrossRef]
- Seppelt, B.D.; Seaman, S.; Lee, J.; Angell, L.S.; Mehler, B.; Reimer, B. Glass half-full: On-road glance metrics differentiate crashes from near-crashes in the 100-Car data. Accid. Anal. Prev. 2017, 107, 48–62. [Google Scholar] [CrossRef]
- Salmon, P.M.; Stanton, N.A.; Young, K.L. Situation awareness on the road: Review, theoretical and methodological issues, and future directions. Theor. Issues Ergon. Sci. 2012, 13, 472–492. [Google Scholar] [CrossRef]
- Schnebelen, D.; Charron, C.; Mars, F. Estimating the out-of-the-loop phenomenon from visual strategies during highly automated driving. Accid. Anal. Prev. 2020, 148, 105776. [Google Scholar] [CrossRef]
- Mukherjea, A. Non-negative matrices and Markov chains—Seneta, E. Metrika 1983, 30, 66–67. [Google Scholar]
- ISO 34502:2022; Road Vehicles—Test Scenarios for Automated Driving Systems—Scenario Based Safety Evaluation Framework. International Organization for Standardization: Geneva, Switzerland, 2022.
- Chouchane, H.; Nakamura, H.; Sato, K.; Antona-Makoshi, J.; Abe, G.; Itoh, M. Identifying the out-of-the-loop phenomenon during driving automation using spontaneous gaze behavior. In Proceedings of the Human Factors and Ergonomics Society Annual Meeting, Atlanta, GA, USA, 10–14 October 2022; Volume 66, pp. 305–309. [Google Scholar]
- Stern, J.A.; Skelly, J.J. The eye blink and workload considerations. In Proceedings of the Human Factors Society Annual Meeting, San Antonio, TX, USA, 22–26 October 1984; SAGE Publications Sage CA: Los Angeles, CA, USA, 1984; Volume 28, pp. 942–944. [Google Scholar]
- Ohno, T. What can be seen from eye movements: Understanding higher cognitive processing based on eye tracking. Cogn. Stud. 2002, 9, 565–579. [Google Scholar]
- Liu, A. What the driver’s eye tells the car’s brain. In Eye Guidance in Reading and Scene Perception; Elsevier: Amsterdam, The Netherlands, 1998; pp. 431–452. [Google Scholar] [CrossRef]
- Liu, A.; Chapman, P.; Underwood, G. Towards predicting driver intentions from patterns of eye fixations. In Vision in Vehicles-Vii; Elsevier: Amsterdam, The Netherlands, 1999. [Google Scholar]
- Faul, F.; Erdfelder, E.; Buchner, A.; Lang, A.G. Statistical power analyses using G* Power 3.1: Tests for correlation and regression analyses. Behav. Res. Methods 2009, 41, 1149–1160. [Google Scholar] [CrossRef]
- Hergeth, S.; Lorenz, L.; Vilimek, R.; Krems, J.F. Keep your scanners peeled: Gaze behavior as a measure of automation trust during highly automated driving. Hum. Factors 2016, 58, 509–519. [Google Scholar] [CrossRef]
- Beggiato, M.; Krems, J.F. The evolution of mental model, trust and acceptance of adaptive cruise control in relation to initial information. Transp. Res. Part F Traffic Psychol. Behav. 2013, 18, 47–57. [Google Scholar] [CrossRef]
- Forster, Y.; Hergeth, S.; Naujoks, F.; Beggiato, M.; Krems, J.F.; Keinath, A. Learning and development of mental models during interactions with driving automation: A simulator study. In Proceedings of the Driving Assessment Conference, Santa Fe, NM, USA, 24–27 June 2019; Volume 10. [Google Scholar]
- Gold, C.; Damböck, D.; Lorenz, L.; Bengler, K. “Take over!” How long does it take to get the driver back into the loop? In Proceedings of the Human Factors and Ergonomics Society Annual Meeting, San Diego, CA, USA, 30 September–4 October 2013; Volume 57, pp. 1938–1942. [Google Scholar]
- Gold, C.; Körber, M.; Hohenberger, C.; Lechner, D.; Bengler, K. Trust in automation–before and after the experience of take-over scenarios in a highly automated vehicle. Procedia Manuf. 2015, 3, 3025–3032. [Google Scholar] [CrossRef]
- Merat, N.; Jamson, A.H.; Lai, F.C.; Daly, M.; Carsten, O.M. Transition to manual: Driver behaviour when resuming control from a highly automated vehicle. Transp. Res. Part F Traffic Psychol. Behav. 2014, 27, 274–282. [Google Scholar] [CrossRef]
- Merat, N.; Louw, T.; Madigan, R.; Wilbrink, M.; Schieben, A. The “out-of-the-loop” concept in automated driving: Proposed definition, measures and implications. Cogn. Technol. Work 2019, 21, 87–98. [Google Scholar] [CrossRef]
- Gonçalves, R.C.; Goodridge, C.M.; Kuo, J.; Lenné, M.G.; Merat, N. Using driver monitoring to estimate readiness in automation: A conceptual model based on simulator experimental data. Cogn. Technol. Work 2024, 26, 569–584. [Google Scholar] [CrossRef]
- International Transport Forum. Japan: Road Safety Country Profile 2023; OECD/ITF: Paris, France, 2023. Available online: https://www.itf-oecd.org/sites/default/files/japan-road-safety.pdf (accessed on 26 December 2025).
- Fukuda, R.; Sakuma, M.; Nakamura, E.; Fukuda, T. An experimental consideration on the definition of a fixation point. Jpn. J. Ergon. 1996, 32, 197–204. [Google Scholar] [CrossRef]
- Abernethy, B. Expertise, visual search, and information pick-up in squash. Perception 1990, 19, 63–77. [Google Scholar] [CrossRef] [PubMed]
- Benjamini, Y.; Hochberg, Y. Controlling the false discovery rate: A practical and powerful approach to multiple testing. J. R. Stat. Soc. Ser. B (Methodol.) 1995, 57, 289–300. [Google Scholar] [CrossRef]
Figure 1.
Experimental apparatus.
Figure 1.
Experimental apparatus.
Figure 2.
Experimental design showing short (5 min) and long (15 min) automation exposure conditions with three scenario windows (S1–S3) and a final takeover request (TOR).
Figure 2.
Experimental design showing short (5 min) and long (15 min) automation exposure conditions with three scenario windows (S1–S3) and a final takeover request (TOR).
Figure 3.
Experimental procedure timeline including familiarisation, automated driving, and takeover phases.
Figure 3.
Experimental procedure timeline including familiarisation, automated driving, and takeover phases.
Figure 4.
Illustration of Scenario 1: Rear Vehicle Cut-Out.
Figure 4.
Illustration of Scenario 1: Rear Vehicle Cut-Out.
Figure 5.
Illustration of Scenario 2: Side Vehicle Cut-In.
Figure 5.
Illustration of Scenario 2: Side Vehicle Cut-In.
Figure 6.
Illustration of Scenario 3: Motorcycle Overtake.
Figure 6.
Illustration of Scenario 3: Motorcycle Overtake.
Figure 7.
Illustration of the critical take-over scenario.
Figure 7.
Illustration of the critical take-over scenario.
Figure 8.
Areas of Interest (AOIs) used for gaze annotation.
Figure 8.
Areas of Interest (AOIs) used for gaze annotation.
Figure 9.
Scenario 1 boxplots of transition probabilities by exposure group: (a) right periphery→rear-view mirror; (b) rear-view mirror→road centre. Markers indicate group medians and spread; † = uncorrected (marginal, not FDR-survived).
Figure 9.
Scenario 1 boxplots of transition probabilities by exposure group: (a) right periphery→rear-view mirror; (b) rear-view mirror→road centre. Markers indicate group medians and spread; † = uncorrected (marginal, not FDR-survived).
Figure 10.
Scenario 2 boxplots of transition probabilities by exposure group: (a) rear-view mirror→road centre; (b) road centre→left periphery. * = uncorrected (not FDR-survived); † = uncorrected (marginal, not FDR-survived).
Figure 10.
Scenario 2 boxplots of transition probabilities by exposure group: (a) rear-view mirror→road centre; (b) road centre→left periphery. * = uncorrected (not FDR-survived); † = uncorrected (marginal, not FDR-survived).
Figure 11.
System Recognised Reaction Time (SRRT) by exposure duration. Responses were slower after long exposure (Mann–Whitney , ). Points show participants; bars/intervals show group summaries with 95% CIs. * uncorrected .
Figure 11.
System Recognised Reaction Time (SRRT) by exposure duration. Responses were slower after long exposure (Mann–Whitney , ). Points show participants; bars/intervals show group summaries with 95% CIs. * uncorrected .
Table 1.
Participant demographics by automation-duration condition.
Table 1.
Participant demographics by automation-duration condition.
| Characteristic | Short (5 min) | Long (15 min) | Total |
|---|
| Participants (n) | 22 | 21 | 43 |
| Age (years), M (SD) | 42.1 (11.8) | 38.9 (12.3) | 40.5 (12.0) |
| Sex (M/F) | 13/9 | 15/5 | 28/15 |
| Years of driving, M (SD) | 23.5 (12.1) | 19.4 (13.0) | 21.5 (12.5) |
Table 2.
Timing of each scenario in short and long automation conditions.
Table 2.
Timing of each scenario in short and long automation conditions.
| Scenario | Short | Long | Time Difference |
|---|
| Rear vehicle cut-out | 40 s | 5 min | 4 min 20 s |
| Side vehicle cut-in | 1 min 40 s | 11 min 40 s | 10 min 0 s |
| Motorcycle overtake | 2 min 15 s | 13 min 15 s | 11 min 0 s |
Table 3.
Scenario 1—Selected transition probabilities (mean).
Table 3.
Scenario 1—Selected transition probabilities (mean).
| Transition | Short | Long | Change |
|---|
| Rear-view mirror→Road centre | 0.325 | 0.216 | ↓ 33.8% |
| Road centre→HMI | 0.101 | 0.064 | ↓ 36.2% |
| Road centre→Left periphery | 0.037 | 0.059 | ↑ 59.5% |
| Rear-view mirror→Left periphery | 0.000 | 0.081 | New |
| Right periphery→Rear-view mirror | 0.201 | 0.091 | ↓ 54.6% |
| HMI→Road centre | 0.478 | 0.339 | ↓ 29.2% |
Table 4.
Scenario 2—Selected transition probabilities (mean).
Table 4.
Scenario 2—Selected transition probabilities (mean).
| Transition | Short | Long | Change |
|---|
| Road centre→Rear view mirror | 0.16 | 0.12 | ↓ 25% |
| Road centre→Left periphery † | 0.02 | 0.05 | ↑ 150% |
| Rear view mirror→Road centre * | 0.58 | 0.31 | ↓ 47% |
| Rear view mirror→HMI | 0.24 | 0.40 | ↑ 67% |
| HMI→Road centre | 0.67 | 0.56 | ↓ 16% |
| Left periphery→Right periphery | 0.00 | 0.33 | New |
Table 5.
Scenario 3—Selected transition probabilities (mean).
Table 5.
Scenario 3—Selected transition probabilities (mean).
| Transition | Short | Long | Change |
|---|
| Left periphery→Road centre | 0.426 | 0.149 | ↓ 65.0% |
| Left periphery→Rear-view mirror | 0.370 | 0.550 | ↑ 48.6% |
| HMI→Rear-view mirror | 0.167 | 0.000 | No pattern |
| Road centre→Left periphery | 0.029 | 0.067 | ↑ 131.0% |
| Road centre→HMI | 0.065 | 0.100 | ↑ 53.8% |
Table 6.
Within-scenario RVM→RC transition probability by exposure duration (means).
Table 6.
Within-scenario RVM→RC transition probability by exposure duration (means).
| | Short | Long | Change |
|---|
| Scenario 1 (cut-out) | 0.325 | 0.216 | ↓ 33.8% |
| Scenario 2 (cut-in) | 0.580 | 0.310 | ↓ 47.0% |
| Scenario 3 (overtake) | 0.201 | 0.306 | ↑ 52.2% |
| Disclaimer/Publisher’s Note: The statements, opinions and data contained in all publications are solely those of the individual author(s) and contributor(s) and not of MDPI and/or the editor(s). MDPI and/or the editor(s) disclaim responsibility for any injury to people or property resulting from any ideas, methods, instructions or products referred to in the content. |



 ,
,