1. Introduction
Gait analysis is the systematic study of human walking patterns using biomechanical and computational methods. It evaluates parameters such as stride length, joint kinematics, and walking speed. These measures support clinical diagnosis, rehabilitation monitoring, sports performance assessment, and human–machine interaction [
1]. Within this domain, gait detection focuses on identifying walking activity or distinguishing individuals based on their unique gait signatures. This is commonly achieved using video-based systems, wearable sensors, or artificial intelligence (AI) models [
2].
Human gait analysis plays a central role in the control of lower-limb assistive devices, including prostheses, orthoses, and exoskeletons [
3,
4,
5]. A core component of these systems is discrete gait-phase detection, which identifies temporal segments such as stance, swing, and transitional phases. The accurate recognition of gait phases and their transitions is essential for safe and responsive interaction between humans and assistive robots. It enables stable locomotion, reliable torque generation, and real-time adaptation to user intent [
3,
4].
A wide range of sensing modalities has been explored for gait-phase detection. Vision-based systems provide detailed kinematic information and remain a laboratory reference standard [
6,
7,
8,
9]. However, their dependence on controlled environments and careful camera calibration limits their applicability in outdoor and daily-life scenarios. Physiological sensing modalities, such as electromyography (EMG) and electroencephalography (EEG), offer insights into neuromuscular activation during gait and exoskeleton-assisted locomotion [
10,
11,
12]. Despite their advantages, these sensors remain sensitive to electrode placement, perspiration, and electrical noise.
Wearable sensors have therefore emerged as a practical solution for continuous gait monitoring in natural environments. Foot-mounted pressure sensors and force-sensing resistors (FSRs) enable reliable detection of heel-strike (HS) and toe-off (TO) events [
13,
14,
15,
16,
17]. However, mechanical degradation and signal drift may affect their long-term reliability [
18]. Inertial measurement units (IMUs) provide a lightweight, low-cost sensing of human motion. They have been widely applied to rehabilitation assessment, gait event detection, and ground reaction force estimation [
19,
20,
21,
22,
23]. However, IMU-based systems remain susceptible to sensor drift, movement artefacts, and inter-subject gait variability.
Recent studies have shown that multimodal wearable systems can improve robustness across diverse locomotion tasks. These systems typically integrate IMUs with plantar pressure sensors, flex sensors, or footswitches. They have been evaluated during variable-speed walking, turning, stair ascent and descent, and ramp ambulation [
24,
25]. Despite these advances, heterogeneous signal quality and inconsistent pressure activations remain challenging. Misaligned contact events can further complicate the generation of consistent gait-phase labels. Notably, relatively few studies provide systematic and reproducible pipelines for automatically relabeling raw multimodal wearable data into discrete gait phases suitable for supervised learning.
From an algorithmic perspective, gait-phase detection approaches can be broadly categorized into rule-based methods and data-driven machine learning techniques [
26,
27]. Rule-based approaches rely on heuristic thresholds applied to gyroscope or pressure signals and are computationally efficient. However, they often exhibit limited robustness to sensor placement variability and inter-subject differences [
26]. In contrast, classical machine learning models, including support vector machines, k-nearest neighbors (kNN), artificial neural networks, and ensemble classifiers, have demonstrated improved performance across a range of gait datasets. Several studies have reported that ensemble and instance-based methods can outperform alternative classifiers for discrete gait-event recognition [
27,
28,
29]. However, systematic comparisons of modern ensemble learning techniques under consistent experimental conditions remain limited.
Machine learning (ML) has become an important tool for gait-phase detection in prosthetic and rehabilitation applications [
27,
29]. ML methods are well suited to extracting subtle temporal patterns from noisy multi-sensor data that are difficult to capture using manual rules. From a gait-phase perspective, ML models have been applied to detect stance and swing phases, classify sub-phases, and recognize locomotion contexts such as level walking [
27,
30]. Such capabilities are essential for the safe and adaptive control of prostheses and exoskeletons.
Motivated by these gaps, this study investigates discrete gait-phase recognition using multimodal lower-limb wearable sensor data. The analysis is conducted on a publicly available dataset comprising multiple subjects instrumented with IMUs, plantar flex sensors, footswitches, and EMG channels. A total of forty biomechanical and kinematic features are extracted from segmented gait signals using fixed-length sliding windows. From each window, statistical descriptors including the mean, standard deviation, minimum, maximum, and root mean square values are computed. To establish consistent ground-truth labels, we develop an automatic relabeling pipeline that integrates HS–TO detection, adaptive threshold tuning, and sensor fusion across modalities. These features are then used to evaluate a suite of classical and ensemble machine learning models. The evaluated models include Random Forests, Extra Trees, kNN, XGBoost, and LightGBM. Structured hyperparameter optimization and k-fold cross-validation are applied to all models.
The main contribution of this work is a rigorous and reproducible evaluation pipeline. It combines automatic gait-phase relabeling, multimodal feature engineering, and a controlled benchmarking of widely used machine learning models under consistent experimental conditions. The results suggest that ensemble tree-based classifiers provide strong performance for discrete gait-phase recognition on the considered dataset. The study is limited by the specificity of the dataset and the adopted validation strategy. However, it yields practical insights for designing wearable sensor–based gait analysis systems for rehabilitation, prosthetic control, and exoskeleton-assisted mobility.
2. Literature Review
Gait-phase detection refers to the identification of different stages of the walking cycle, such as stance and swing, from signals recorded by wearable or external sensors. It enables a meaningful interpretation of human locomotion by segmenting continuous movement into discrete events. The accurate timing of gait phases is important in prosthetic devices and rehabilitation robots, which must synchronize their assistance with the user’s natural motion. Gait-phase detection is also used in clinical settings for assessing mobility impairments and monitoring recovery progress. For these reasons, reliable gait-phase detection is a central component of human movement analysis and the safe control of assistive technologies.
Farah et al. [
27] investigated whether gait phases could be identified using only thigh and knee kinematics collected from healthy adults. They compared decision trees, Random Forests, neural networks, and support vector machines using a short sliding-window approach. Their results showed that a decision tree model achieved the lowest classification error, demonstrating that reliable gait-phase detection is possible even with a single thigh-mounted inertial sensor. This finding supports the feasibility of real-time orthosis control using minimal sensing configurations.
Several studies have explored alternative wearable sensing modalities. Pazar et al. [
29] and Nazari et al. [
30] examined whether soft, textile-based strain sensors embedded in ankle braces could be used to recognize gait phases during slow walking. Both studies evaluated multiple ML models, including Random Forests, neural networks, and support vector machines. In each case, Random Forest classifiers provided the most reliable performance. These findings indicate that lightweight, fabric-integrated sensors can offer practical alternatives to traditional IMU-based systems for gait phase detection.
Khamparia et al. [
31] explored the use of machine learning to distinguish normal walking from freezing episodes in neuro-rehabilitated individuals. Acceleration signals were recorded from wearable sensors placed on the hip and legs. The authors evaluated several feature-reduced models and found that tree-based and nearest-neighbor methods outperformed simpler linear approaches. This study highlights the value of combining robust classifiers with appropriate feature processing for gait-related neurological assessment.
Vision-based approaches have also been investigated for gait-phase recognition. Pasinetti et al. [
9] proposed a depth-camera-based system for users of powered gait orthoses. Their method extracts three-dimensional foot–floor geometry from Time-of-Flight images and uses percentile-based distance features as inputs to a modified Random Forest classifier. By incorporating prediction uncertainty, the system reduces misclassification during ambiguous transitions between stance and swing phases. The study demonstrates that depth sensing can support reliable real-time gait phase estimation in controlled environments.
Beyond classifier choice, gait-phase prediction performance is influenced by how sensor signals are segmented and processed. Sliding-window segmentation has been widely adopted for gait-phase identification, as it provides a simple and effective way to partition quasi-periodic inertial sensor signals into analysis units [
32]. However, window design remains critical, since window length and overlap directly affect classification accuracy and detection latency. In particular, inappropriate window sizes can lead to a loss of phase-specific information or blurred boundaries around heel-strike and toe-off events [
27].
Table 1 summarizes representative studies on gait-phase detection using machine learning approaches. It provides an overview of the datasets employed, the ML models evaluated, the best-performing classifiers, the target applications, and the key limitations identified in each study.
3. Materials and Methods
The dataset used in this study is publicly available and open source. It was published by Zafar et al. [
33] and is accessible at (
https://figshare.com/articles/dataset/Dataset_for_Lower_Limb_Prosthesis/11881332/9?file=33417746) (accessed on 10 November 2025). The dataset comprises recordings from six adult participants who completed structured lower-limb gait acquisition sessions. Five participants were healthy, while one participant was rehabilitated. All participants performed repeated level-ground walking trials under controlled laboratory conditions. Trials were conducted in both forward and backward walking directions. The demographic information provided in the original dataset documentation is summarized in
Table 2.
A wearable sensing system was used to acquire multimodal lower-limb gait data. The setup integrated heterogeneous modalities, including surface electromyography (sEMG), inertial measurement units (IMUs), joint-angle encoders, and plantar-pressure sensors. In total, 20 physical sensors were mounted bilaterally: eight sEMG electrodes (four per leg) positioned over major lower-limb muscle groups, four IMUs (two per leg) attached to the thigh and shank segments, four potentiometer-based joint-angle encoders (knee and ankle per leg), and four FlexiForce plantar-pressure sensors (heel and toe per leg). In addition, footswitches embedded in the insole provided contact-state information for gait-event detection, and push-button triggers supported event annotation and trial management. All sensing streams were synchronized and logged using a dual NI-myRIO acquisition setup, enabling high-frequency sampling and precise temporal alignment across modalities. During the experimental trials, multimodal signals were collected continuously from both lower limbs while participants performed forward and backward walking and routine locomotor transitions, including level-ground walking, stair ascent and descent, ramp ascent and descent, and sit–stand movements. The resulting recordings capture complementary biomechanical information, joint kinematics, segment dynamics, muscle activation, and foot–ground interaction across a range of gait conditions. All channels were recorded simultaneously within each trial, yielding time-synchronized bilateral measurements. Although the acquisition platform supported up to 56 channels, the publicly released dataset contains 50 recorded channels (25 per leg), comprising 23 biomechanical channels and two auxiliary meta-signals (
mode and
tick_count).
Table 3 summarizes the sensing hardware and the corresponding recorded channels.
The dataset is distributed in raw and post-processed formats; we use the post-processed version, in which streams are synchronized and quality-checked by the dataset authors [
33]. For consistency across subjects and to simplify model evaluation, we restrict the analysis to right-leg signals and exclude
mode and
tick_count from the model input. Accordingly, each trial is represented by 23 right-leg input channels (
Table 3).
3.1. Data Preprocessing
Before analysis, an additional structuring step was performed to consolidate the data across subjects and trials. Each participant’s recordings were distributed across multiple files corresponding to repeated walking trials and walking directions (forward or backward). First, all trials belonging to the same participant were merged into a continuous subject-level sequence. Metadata fields (
subject,
trial, and
direction) were appended to each sample to preserve trial provenance. Finally, all subject-level sequences were concatenated into a single unified dataset. Any missing sensor samples arising from synchronization or recording gaps were imputed using simple interpolation to ensure continuity of the time series prior to window segmentation. The merged file served as the final dataset for window segmentation, feature extraction, and model training.
Figure 1 provides a schematic overview of the final dataset.
To reduce inter-subject variability, a per-subject z-score normalization was applied independently to each sensor channel.
3.1.1. Data Labeling
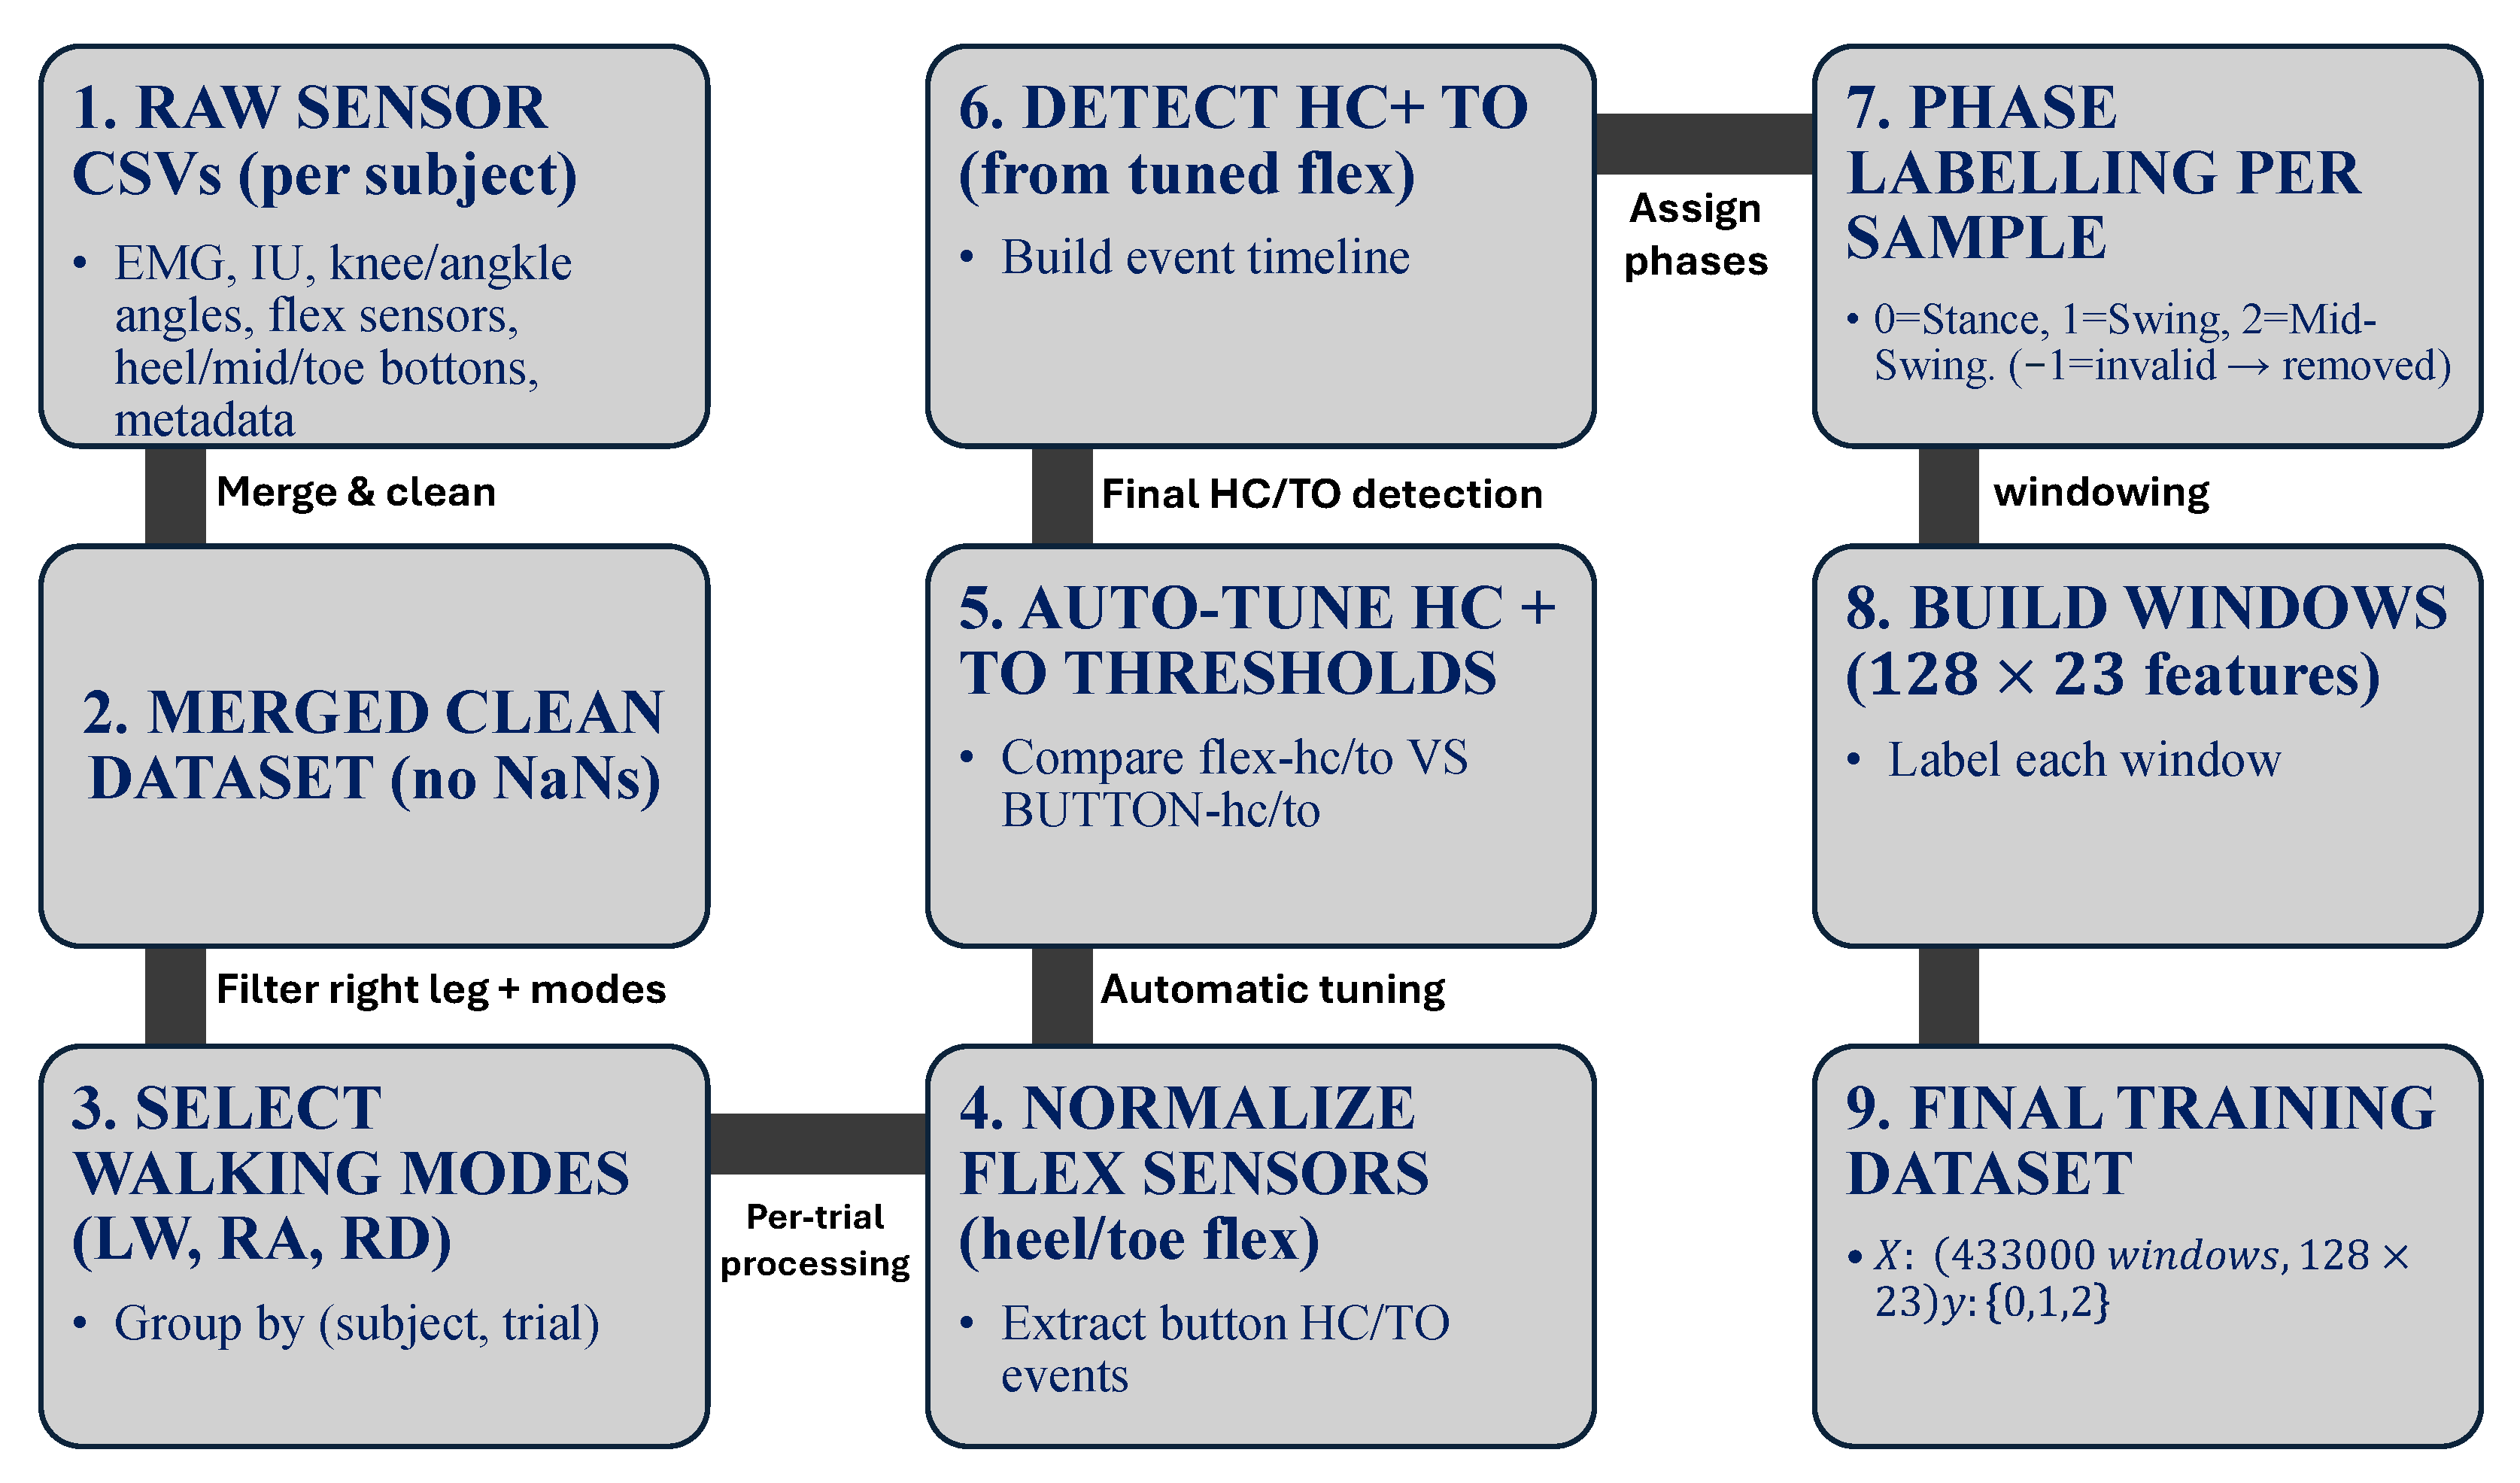
Accurate gait-phase labeling is essential for the supervised classification of stance, swing, and mid-swing. The original dataset does not have labels for the gait-phase. Therefore, a multi-stage labeling pipeline was developed. The heel-strike (HS) and toe-off (TO) events were first estimated from the binary transitions of the shoe-mounted heel and toe buttons. Mechanical bounce and delayed releases occasionally introduced uncertainty. For this reason, the analogue heel-flex and toe-flex signals were incorporated to refine event timing. To account for amplitude differences across subjects, fixed thresholds were avoided. Instead, an automatic threshold-search procedure was used. The flex signals were normalized to the range [0,1]. A grid of candidate thresholds (0.10–0.90 in steps of 0.05) was evaluated. For each candidate threshold, HS/TO timings from the flex sensors were compared with the button-derived events, and the threshold minimizing the temporal deviation was selected. The optimal thresholds typically fell between 0.2 and 0.4. This selection provided trial-specific adaptability and improved consistency.
Using the refined HS and TO events, each sample was assigned to one of three gait phases: stance (HS to TO), swing (TO to mid-swing), and mid-swing (central 20–25% of the swing interval). Samples outside valid HS–TO–HS structures were removed. The final labeled dataset contained 186,468 stance, 125,033 swing, and 122,431 mid-swing samples. The labeling pipeline is summarized in
Figure 2. These annotations served as ground truth for subsequent windowing and model training.
3.1.2. Segmentation and Windowing
After preprocessing, the synchronized multi-channel signals were partitioned into windows of length samples across channels. For classical machine-learning models, each window was vectorized into a 2944-dimensional feature vector (). Feature scaling was applied only when required by the classifier: kNN models were trained using a pipeline with standardization (StandardScaler), whereas tree-based ensemble models were trained directly on the unscaled vectors, as they are insensitive to monotonic feature transformations.
The final dataset was segmented into fixed-length windows to enable supervised learning from continuous multimodal recordings. Window-based segmentation converts time-series signals into samples suitable for classical machine learning models while preserving the local temporal context relevant for distinguishing stance, swing, and mid-swing phases.
Let
denote the multichannel sensor vector at time index
t, where
corresponds to the selected right-leg channels used for gait phase prediction. A window of length
L is defined as
where
represents one training instance. In this work, the window length was set to
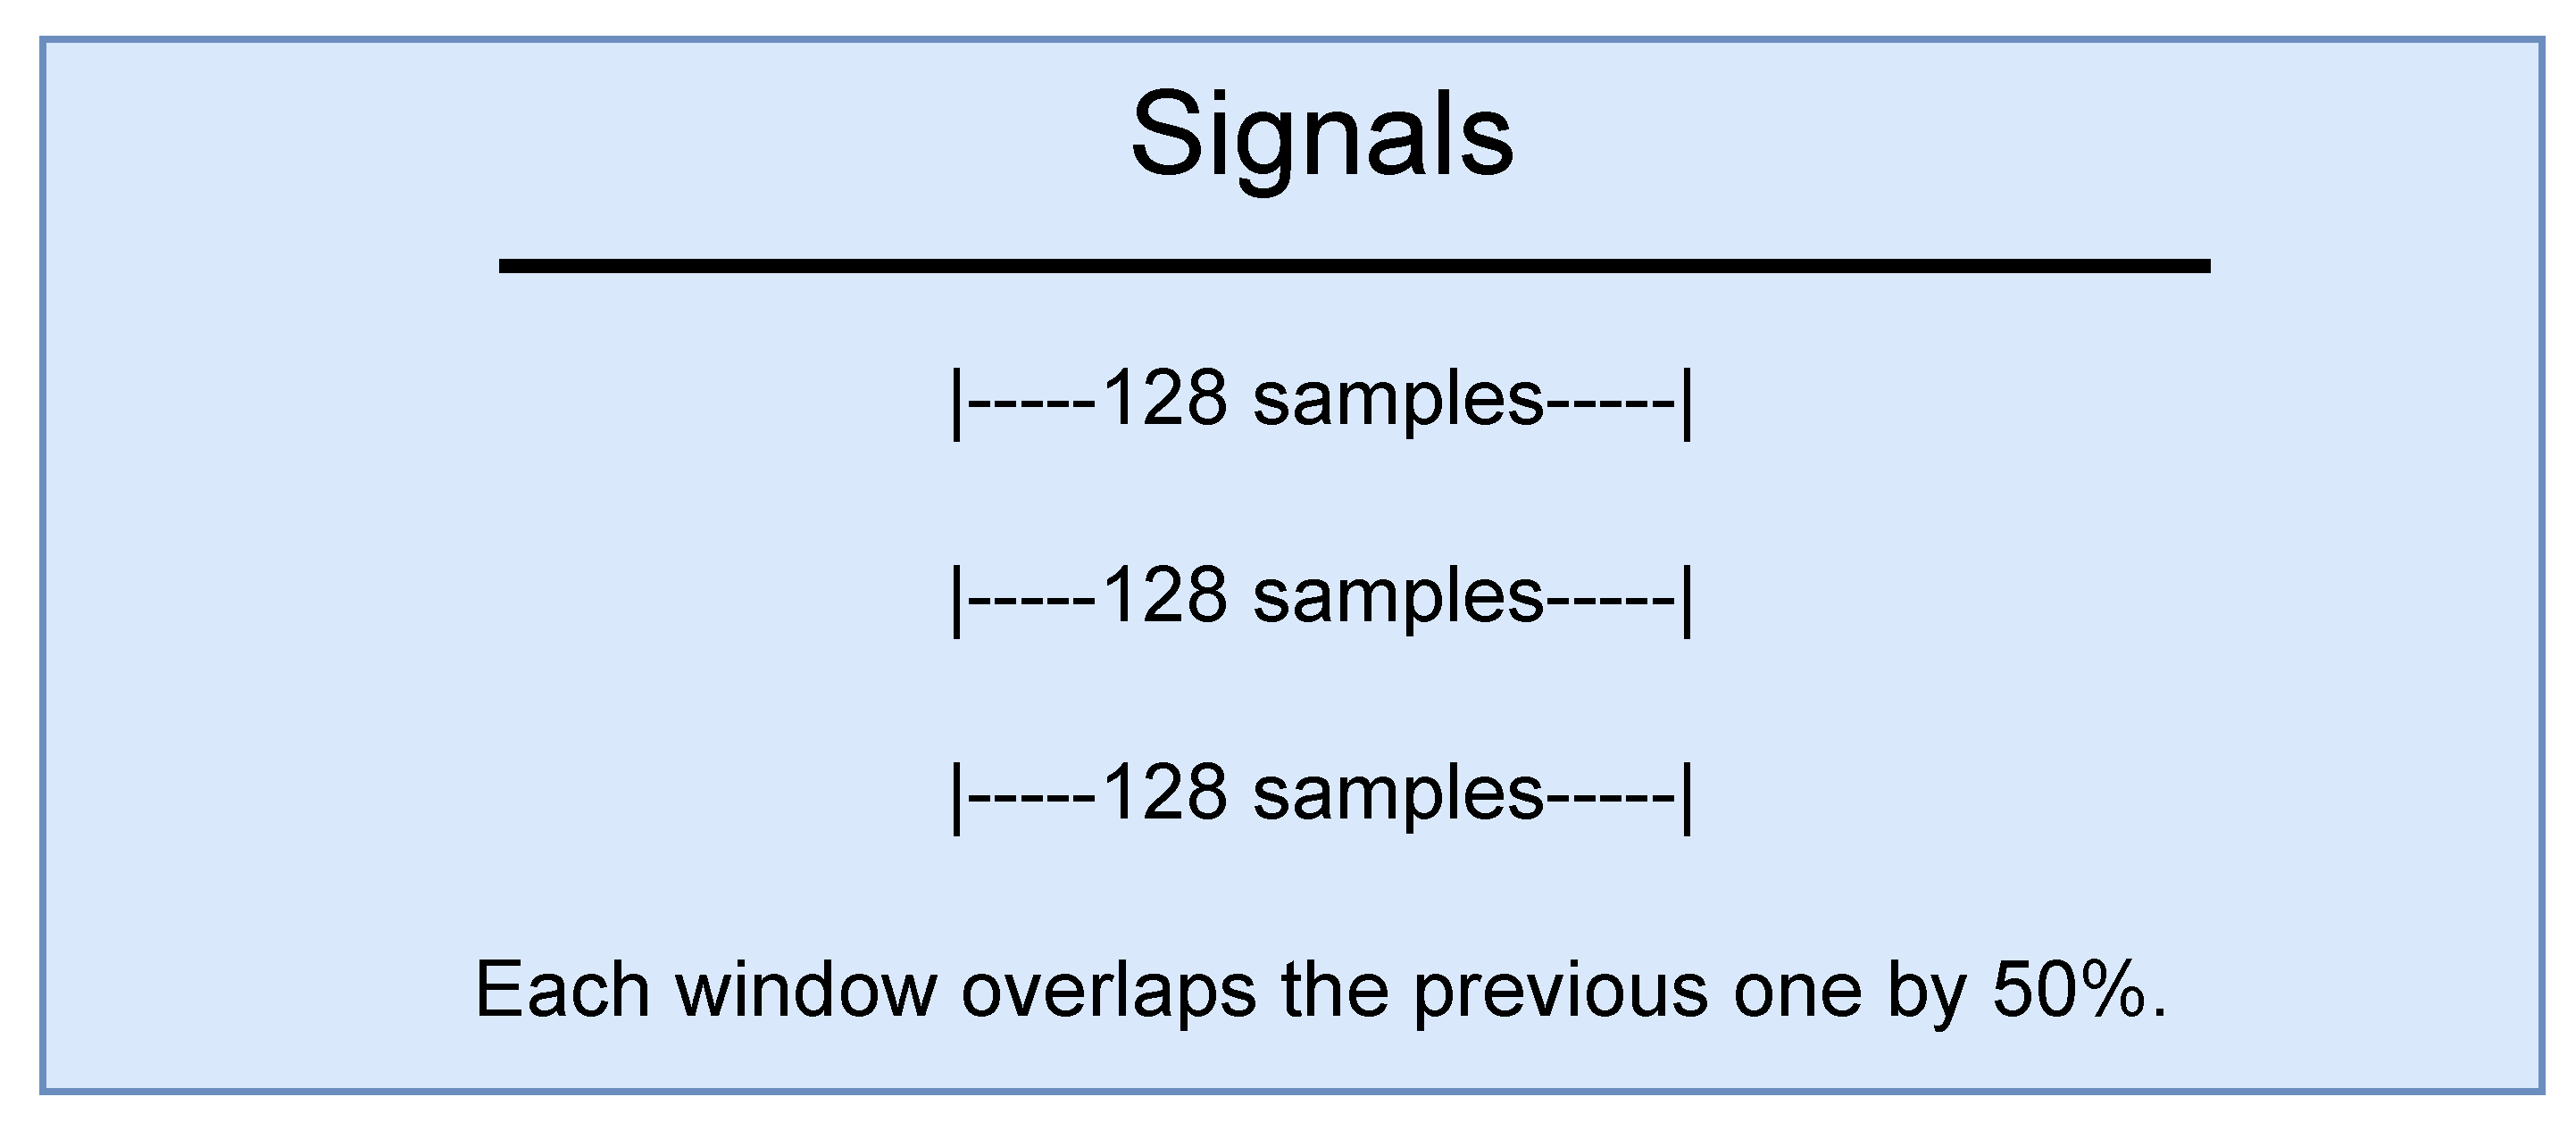
samples. With a sampling frequency of 100 Hz, each window spans approximately 1.28 s, which is sufficient to capture a complete gait cycle during normal walking. This duration allows heel-strike, toe-off, and mid-swing events to be contained within a single window, thereby improving phase discrimination. Shorter windows may fail to capture full phase transitions, whereas substantially longer windows increase latency and reduce temporal specificity. A sliding-window strategy with 50% overlap was adopted, resulting in a stride of
Overlapping windows increase the sample density and provide a denser temporal coverage of gait dynamics. Although this introduces dependence between adjacent windows, such overlap is commonly used in gait analysis and human activity recognition to improve classification accuracy [
34]. This approach is appropriate when the objective is reliable phase classification rather than strict sample independence. Each window was assigned a single class label corresponding to the dominant gait phase within the segment. Three gait phases were considered: stance, swing, and mid-swing (
Section 3.1.1). Windows containing ambiguous phase transitions or mixed labels were excluded to reduce label noise and improve classification reliability.
Table 4 summarizes the segmentation procedure, and
Figure 3 illustrates the sliding-window strategy.
3.2. Machine Learning Models
A set of classical machine learning classifiers was used for gait-phase recognition from extracted time- and frequency-domain features. The evaluated models include Extremely Randomized Trees (Extra Trees) [
35], Random Forest,
k-Nearest Neighbors (kNN) [
36], XGBoost [
37], and LightGBM [
38]. These algorithms are widely used for structured sensor data and have shown strong performance in human activity recognition and gait classification tasks.
Random Forest and Extra Trees are ensemble methods based on decision trees. Given an input feature vector
, each ensemble consists of
T trees
trained on bootstrapped samples and random feature subsets [
35,
36]. For multiclass classification with classes
, the predicted label is obtained by majority voting:
where
is the indicator function. Random Forest uses optimized splits at each node. Extra Trees introduces additional randomness by selecting split thresholds from a random set rather than performing an exhaustive search. This additional randomness can reduce variance and improve performance on noisy, high-dimensional features.
XGBoost and LightGBM are gradient-boosted decision tree methods designed for efficient learning on structured features. Both models iteratively add trees to minimize a regularized loss function. For multiclass problems, the objective typically involves the sum of cross-entropy losses over all samples:
where
is the i-th instance in the dataset,
is the corresponding class label,
denotes the predicted class probabilities, and
penalizes tree complexity.
The kNN classifier is a non-parametric, distance-based method. The distance between two vectors
x and
z is defined using the Minkowski metric:
When
, the metric corresponds to the Manhattan distance; when
, it reduces to the Euclidean distance. The
k-Nearest Neighbors are then identified, and the predicted class is obtained by distance-weighted voting. Because kNN is sensitive to feature scaling, standardization (i.e., zero mean and unit variance) was applied using a pipeline.
The computational results were obtained using PyCharm version 2025.2.1.1 (build 252.25557.178).
3.3. Machine Learning Model Evaluation and Hyperparameter Tuning
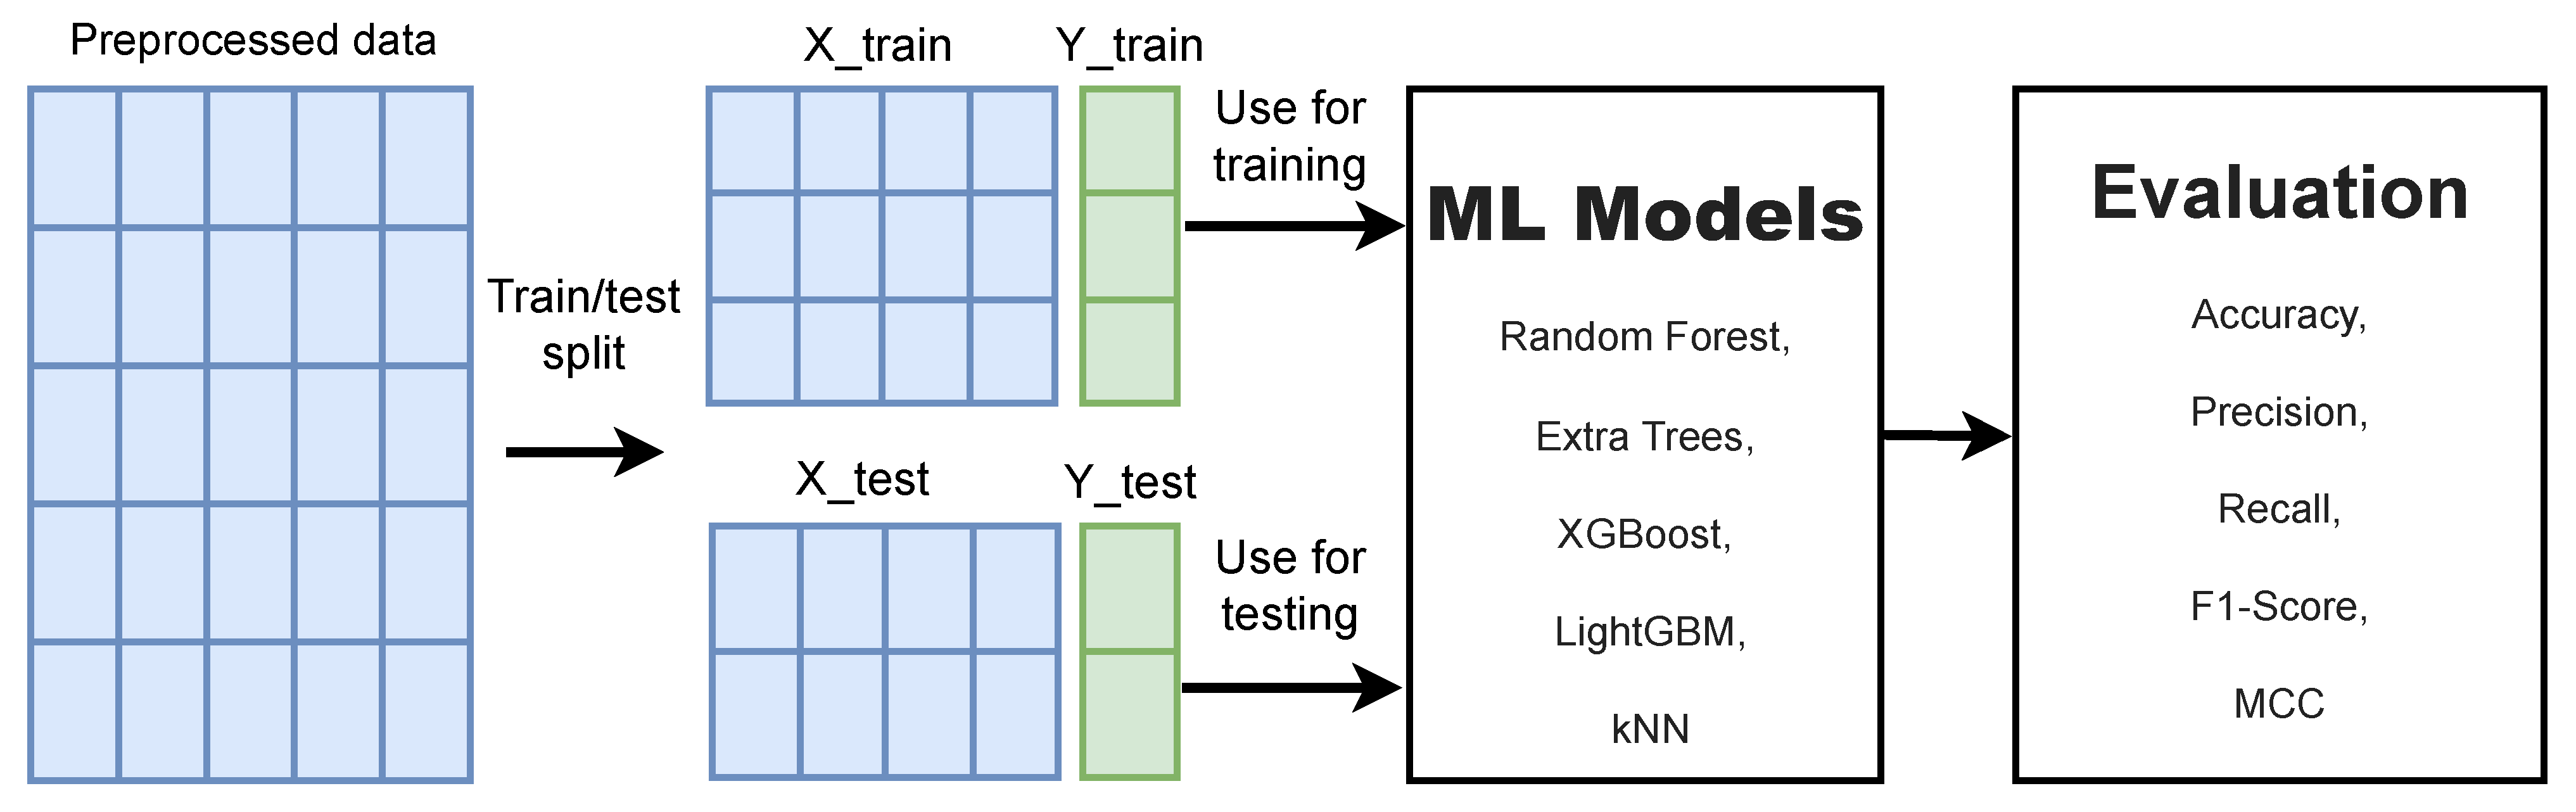
The overall machine learning workflow employed in this study is illustrated in
Figure 4. After segmentation and feature preparation, five machine learning models were trained and evaluated using a structured validation strategy combined with systematic hyperparameter tuning. Each model was trained using windowed samples.
Hyperparameters were explored through preliminary tuning experiments to identify model configurations that balance predictive performance, generalization ability, and computational cost [
39]. The explored ranges were selected based on common practice in gait analysis and human activity recognition as well as initial exploratory experiments on the training data. This tuning step is essential because the performance of ensemble- and distance-based classifiers is highly sensitive to parameters such as the tree depth, number of estimators, learning rate, and neighborhood size.
Table 5 lists the hyperparameter ranges evaluated for each model during the tuning phase. Only the best-performing configurations were retained for the final experiments.
Model performance was evaluated using a two-stage validation strategy. First, the dataset was divided using a stratified 80/20 train–test split to preserve the class proportions across stance, swing, and mid-swing windows. The training subset (80%) was used for model fitting and hyperparameter tuning, while the held-out test subset (20%) was reserved exclusively for final performance reporting. Second, stratified ten-fold cross-validation was used to obtain a robust estimate of generalization performance [
40]. The dataset was partitioned into ten non-overlapping folds with approximately equal class proportions. In each iteration, nine folds were used for training and the remaining fold was used for testing. This procedure was repeated ten times, such that each fold served exactly once as the test set, and performance was averaged across folds.
Table 6 summarizes the distribution of windowed samples across the three gait phases together with the stratified 80/20 train–test split used in the experiments. Because the dataset exhibits class imbalance, inverse-frequency class weights were computed from the training set and applied to the tree-based models during training to reduce bias toward the majority class. Distance-based classifiers such as kNN were trained without explicit class weighting.
The performance of the machine learning models was evaluated using standard multiclass classification metrics, including accuracy, precision, recall, F1-score, and Matthews correlation coefficient (MCC).
In these expressions,
(true positive) denotes the number of samples correctly classified as belonging to a given gait phase,
(true negative) represents samples correctly identified as not belonging to that phase,
(false positive) corresponds to samples incorrectly assigned to a gait phase, and
(false negative) indicates samples belonging to the phase that were misclassified. For multiclass evaluation, these quantities were computed in a one-vs-rest manner for each gait phase and then aggregated using weighted averaging based on class support. Accuracy measures the overall proportion of correctly classified windows. Precision quantifies the correctness of positive predictions, while recall reflects sensitivity to detecting positive instances. The F1-score balances precision and recall and is particularly informative under class imbalance. MCC provides a correlation-based summary metric that remains reliable for imbalanced multiclass classification and was therefore included as a primary evaluation criterion.
4. Results and Discussion
This study tests and compares five machine-learning classifiers for three-phase gait recognition (stance, swing, and mid-swing) using a high-dimensional window-based feature representation extracted from lower-limb wearable sensors. The evaluated models are Extra Trees, Random Forest, kNN, XGBoost, and LightGBM. Performance is assessed using accuracy, precision, recall, F1-score, and Matthews correlation coefficient, thereby providing both overall and class-balanced measures.
The main contribution is an end-to-end and reproducible evaluation framework that enables a controlled comparison of standard methods. Specifically, the pipeline integrates (i) automatic gait-phase relabeling based on heel-strike/toe-off (HS/TO) refinement with adaptive threshold calibration and sensor fusion; (ii) unified feature construction from multimodal wearable signals; and (iii) consistent preprocessing, hyperparameter tuning, and benchmarking across models. This design ensures that observed performance differences can be attributed to the classifiers themselves rather than to inconsistencies in data preparation or tuning, and it clarifies why classical ensemble methods remain strong baselines on this dataset.
The final hyperparameter configurations are reported in
Table 7. Parameters were selected based on validation performance under a computationally feasible tuning budget. To ensure comparability and limit overfitting, we tuned only a standard set of high-impact hyperparameters for each model (e.g., number of estimators, maximum depth, learning rate, and subsampling ratios), avoiding extensive search procedures that could inadvertently favor one algorithm over another.
4.1. Test-Set Performance
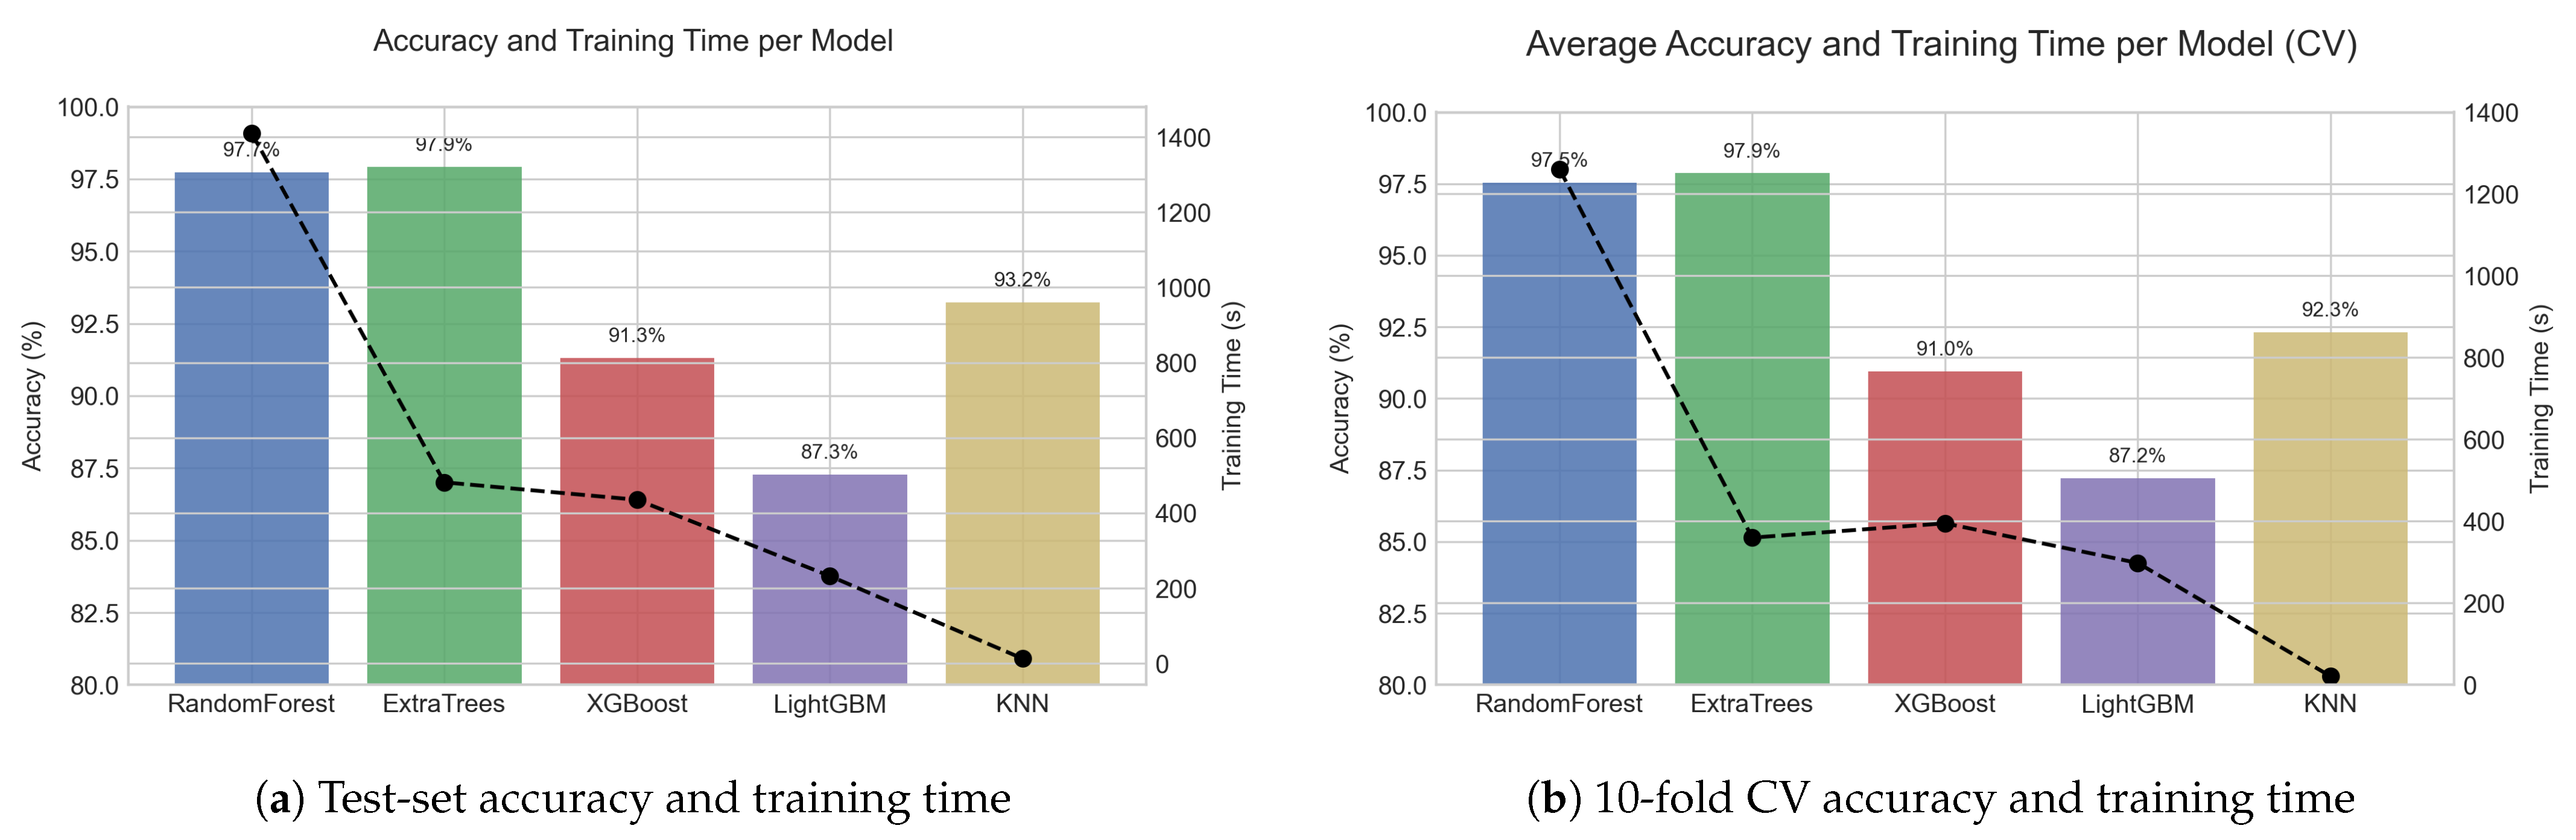
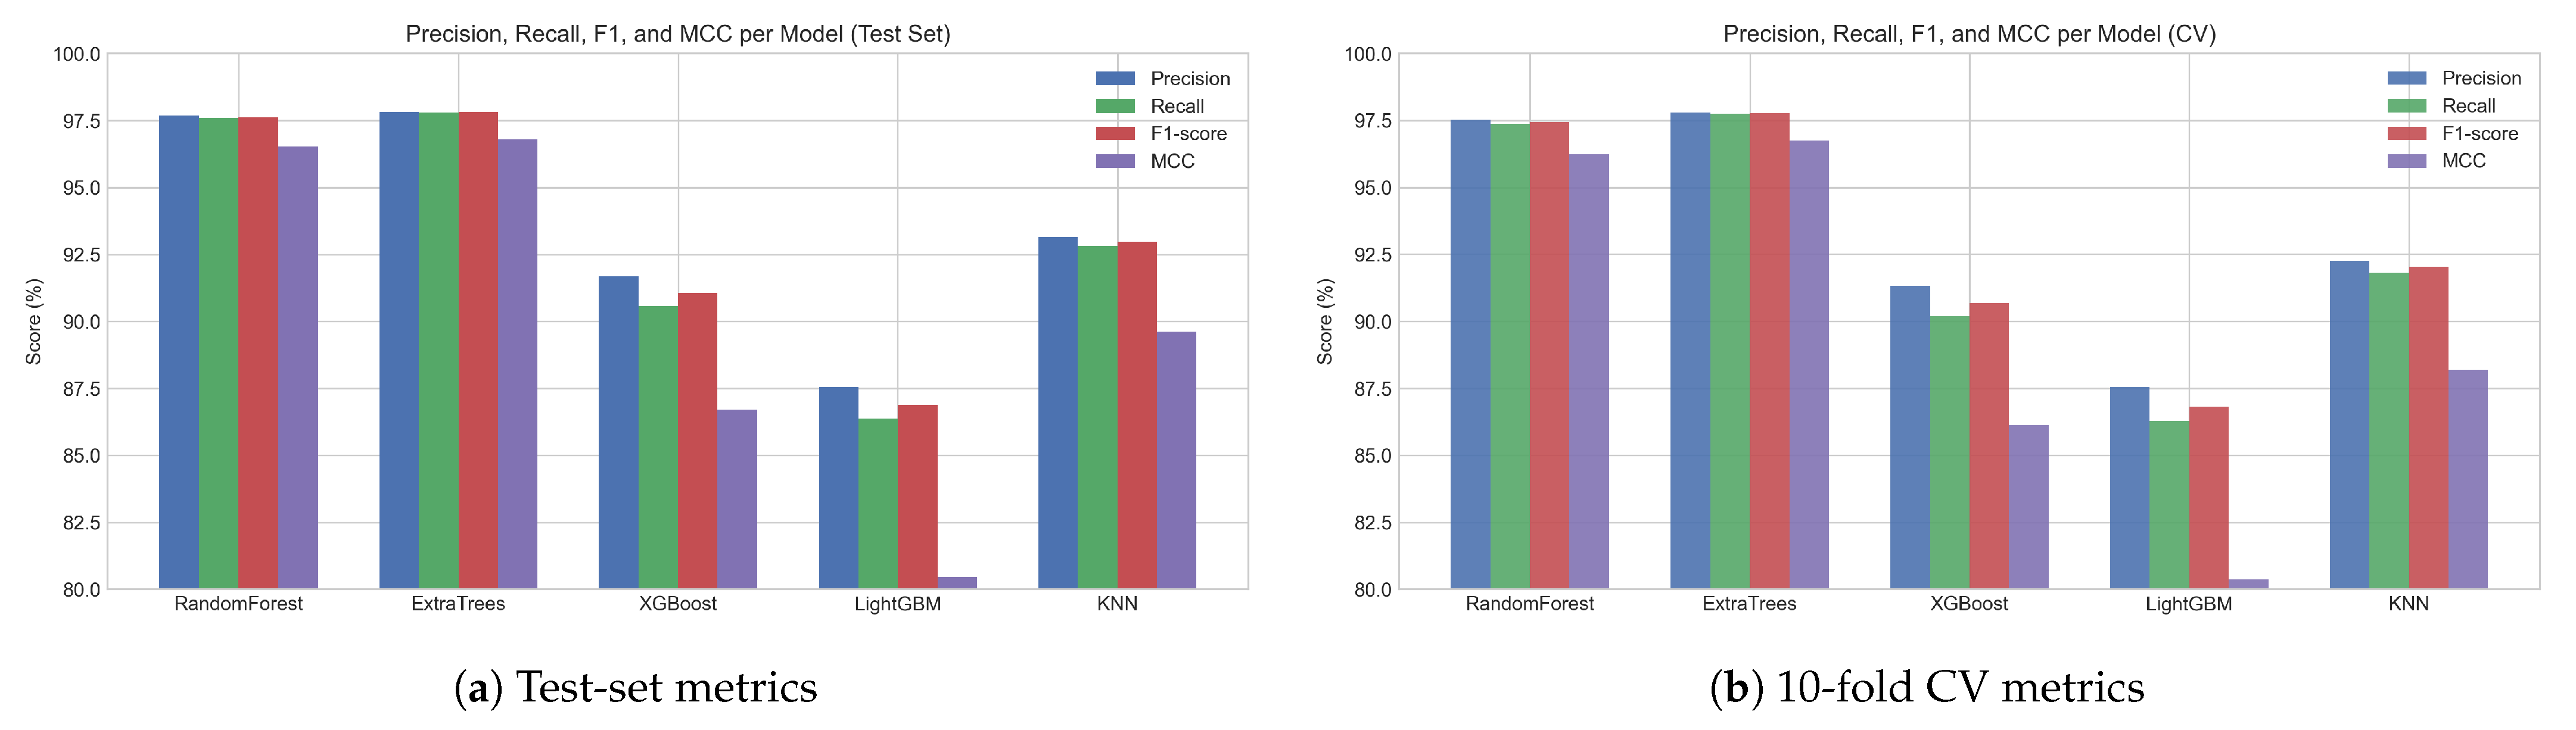
Table 8 summarizes the test-set performance and the best results are in bold. Extra Trees achieved the best overall performance (accuracy 97.91%, F1 0.9781, MCC 0.9680). Random Forest followed closely (accuracy 97.73%, MCC 0.9652). This confirms that bagging-based ensembles are strong baselines for high-dimensional handcrafted features in this dataset. kNN achieved 93.23% accuracy with an MCC of 0.8961 and trained very quickly (12.77 s). This offers an efficiency advantage but with a clear performance gap to the tree ensembles. XGBoost and LightGBM performed worse in this feature setting, with lower recall and MCC, suggesting a weaker separation of the swing-related phases.
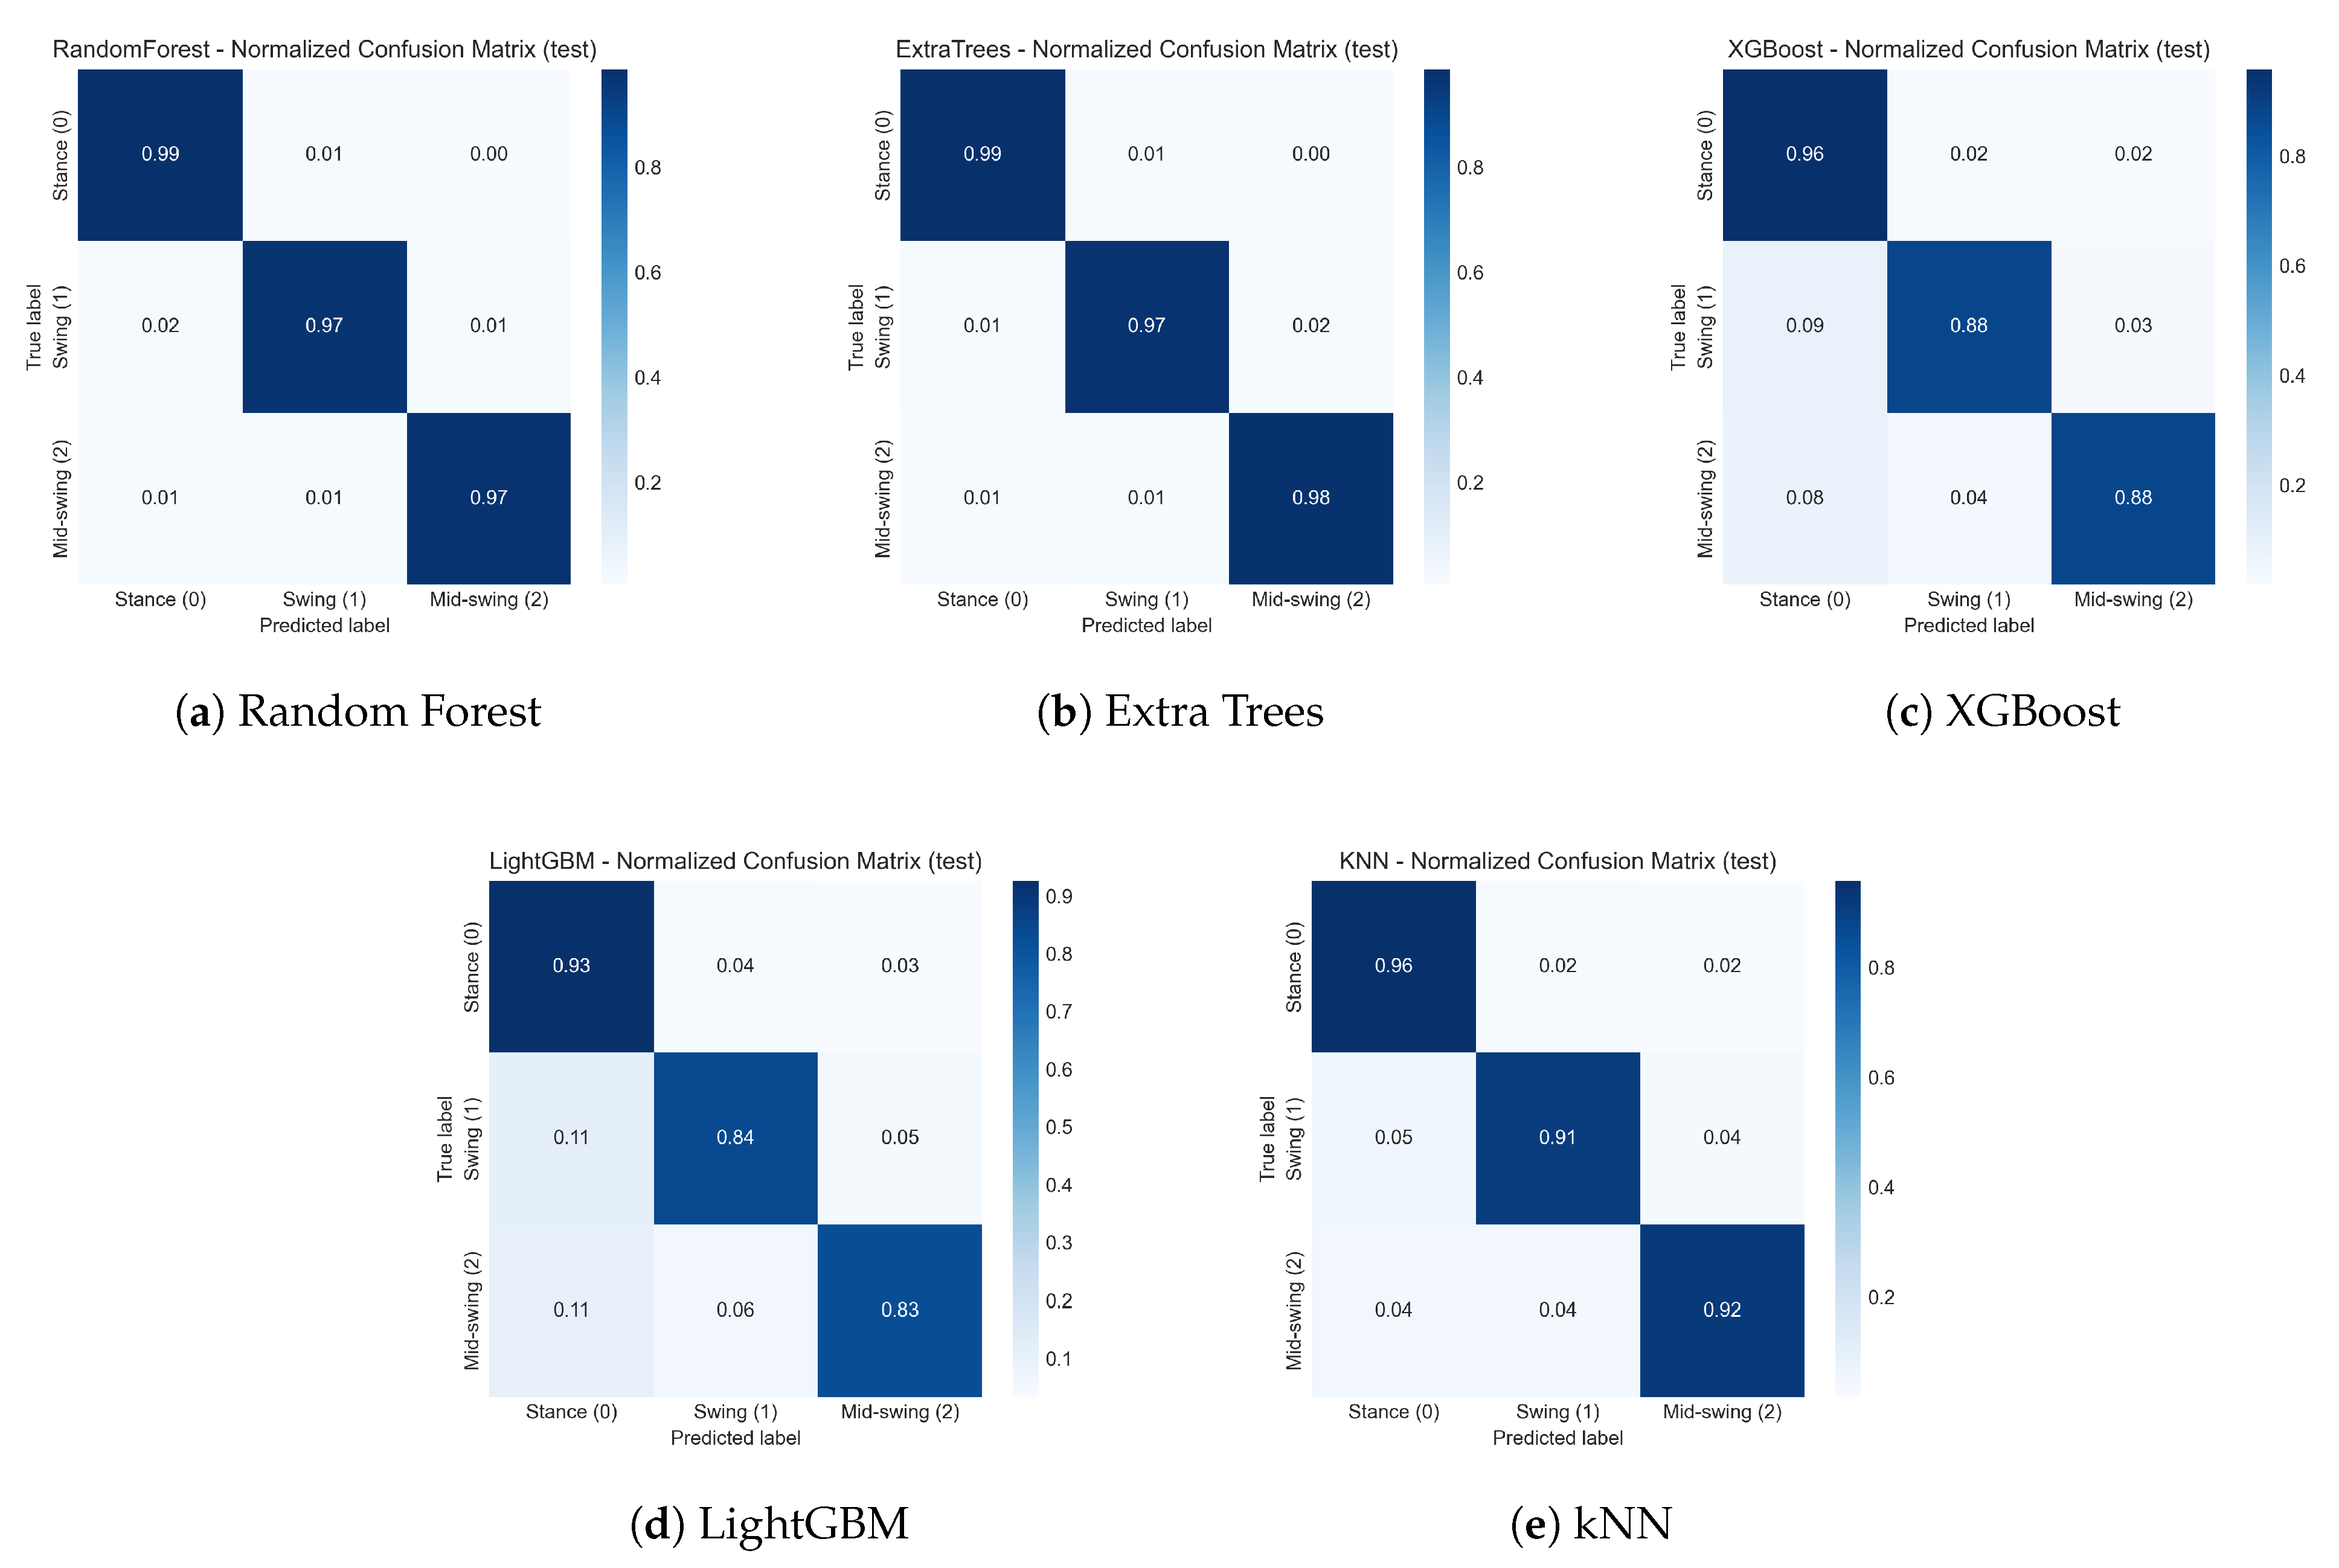
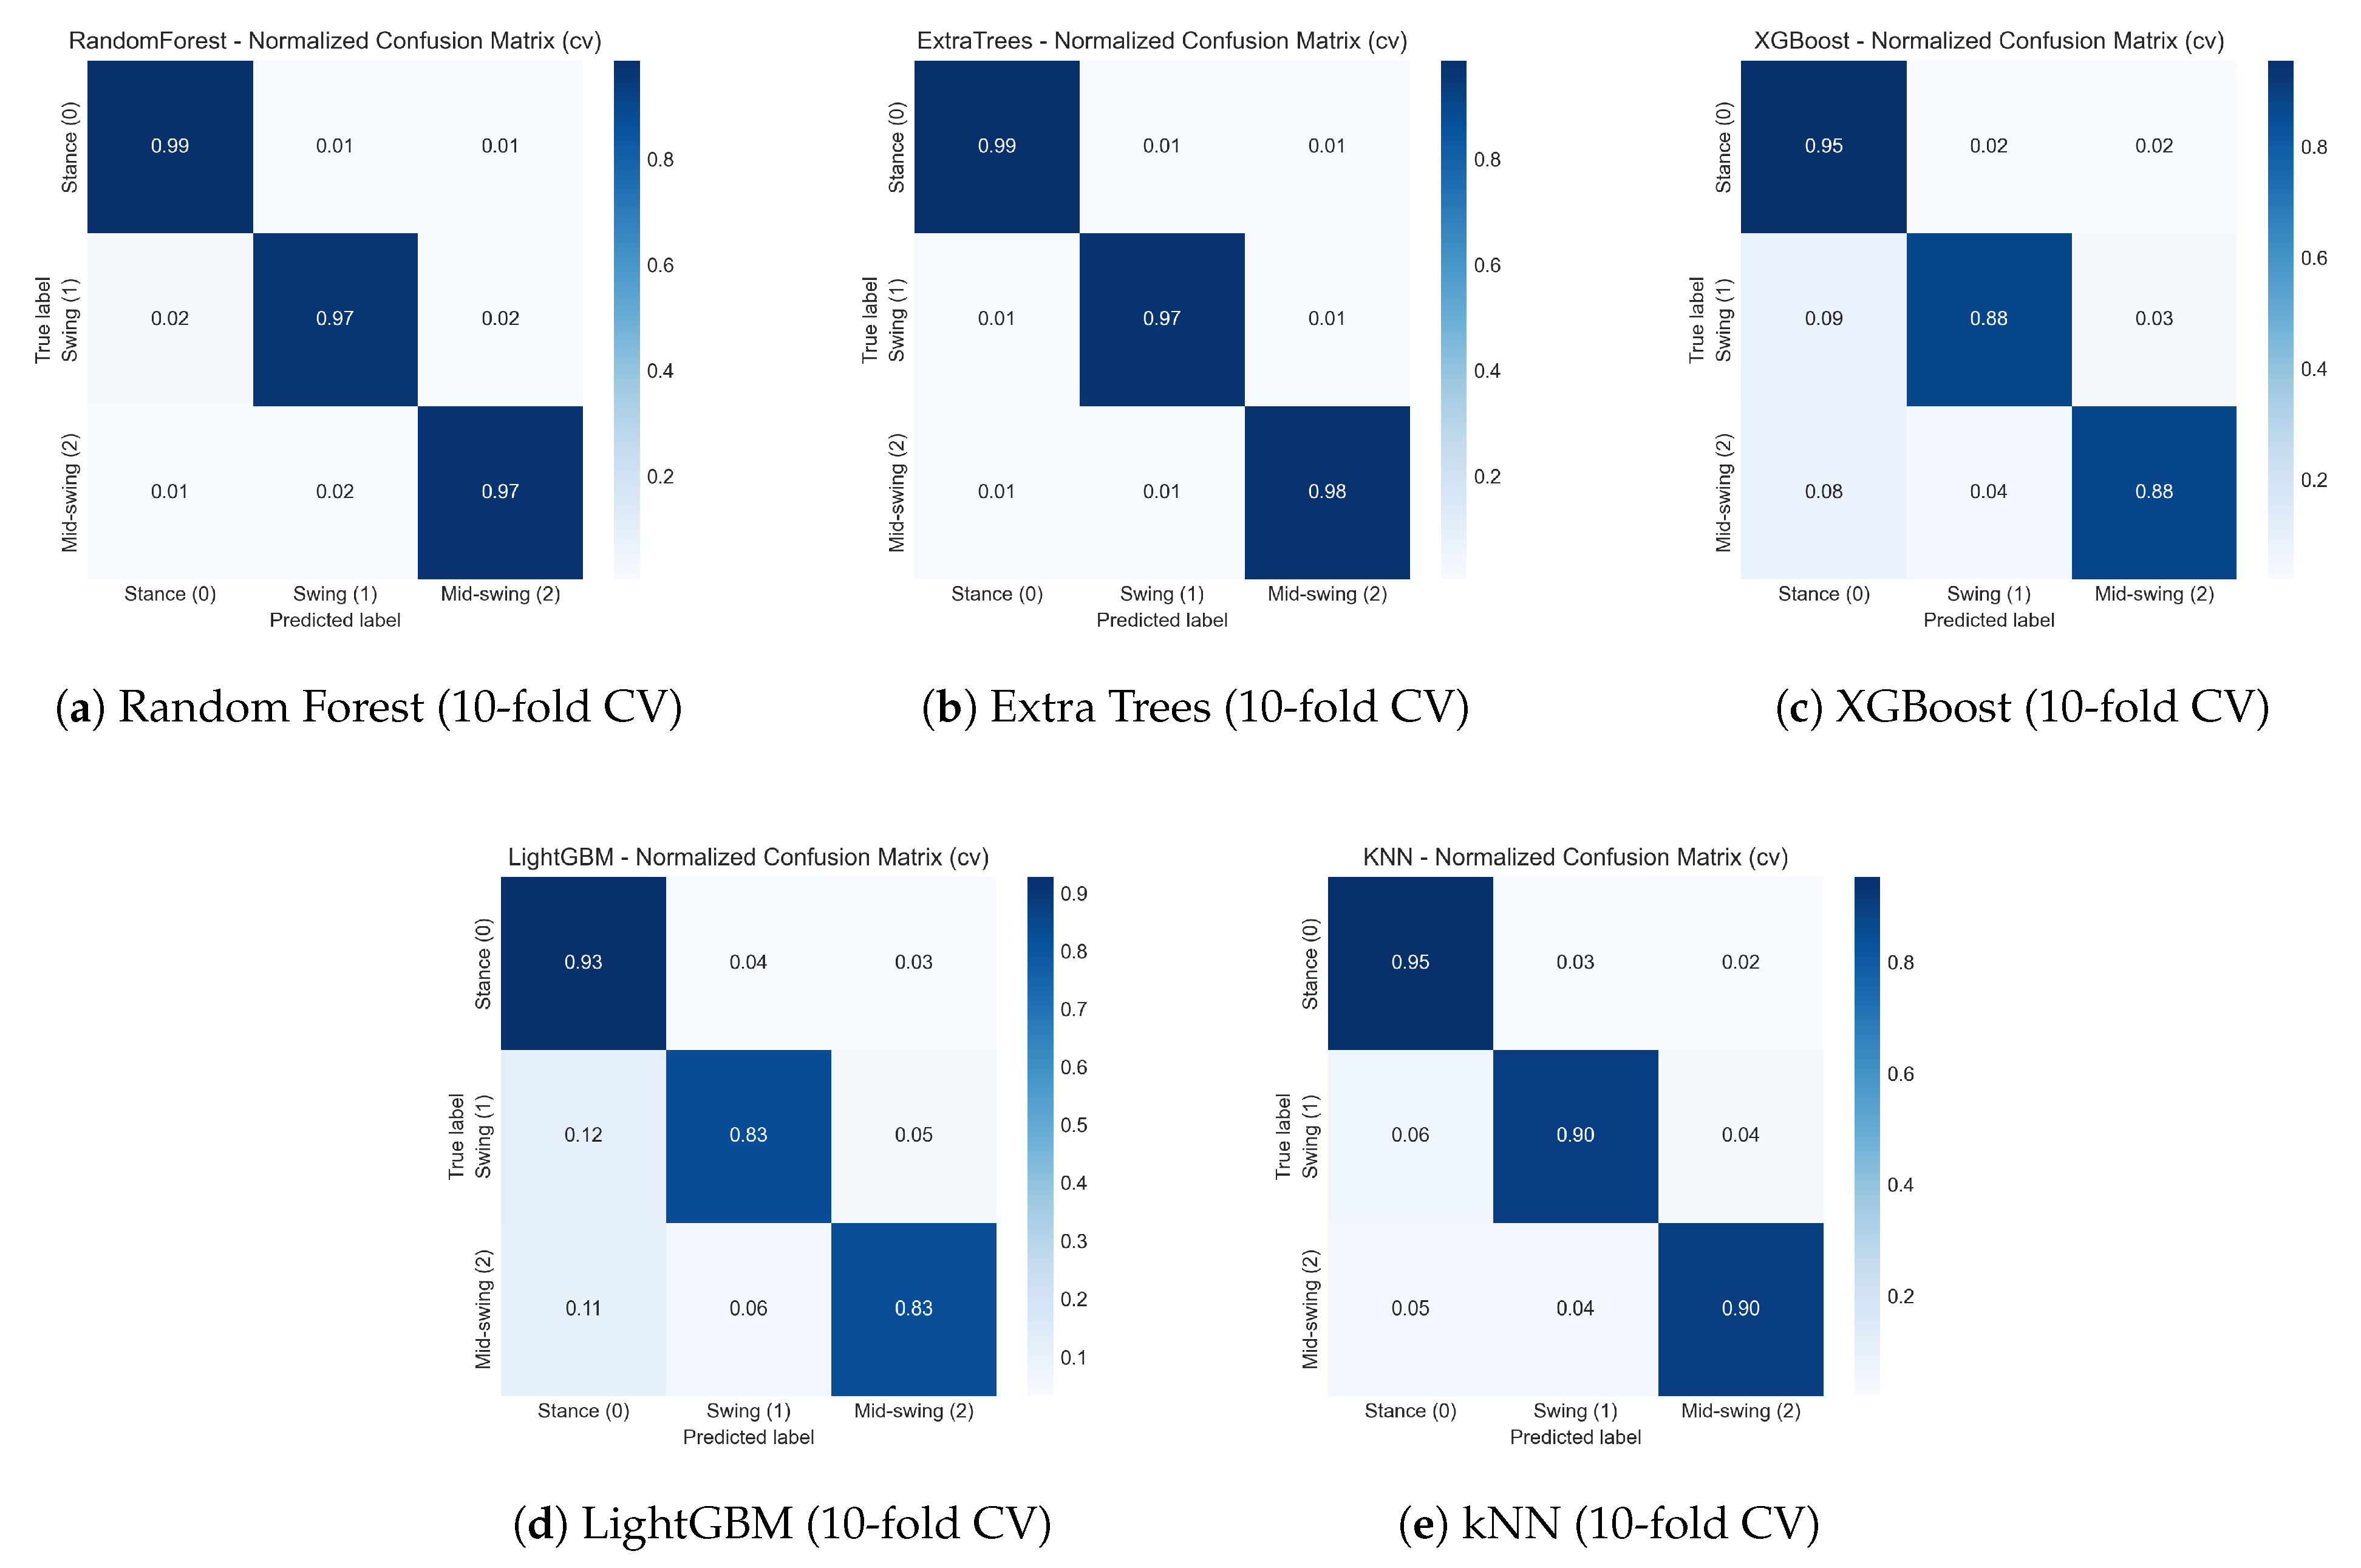
Figure 5 visualizes the normalized confusion matrices. Random Forest and Extra Trees show a strong diagonal structure, indicating stable class separation. Across all models, the largest error concentration is between swing and mid-swing. This is expected because these two phases are adjacent in time and share similar dynamics. XGBoost and LightGBM show more off-diagonal mass, which is consistent with their lower MCC. kNN preserves a relatively clear diagonal but shows more swing–mid-swing confusion than the tree ensembles.
4.2. 10-Fold Cross-Validation
To reduce dependence on a single split, stratified 10-fold cross-validation was performed.
Table 9 reports the mean value of each performance metric across folds and the best results are in bold. The cross-validation ranking is consistent with the test-set outcome. Extra Trees achieved the best mean performance (accuracy 0.9787, MCC 0.9676), which is followed by Random Forest; kNN remained above 92% accuracy, while XGBoost and LightGBM performed less well.
Figure 6 shows the averaged confusion matrices across folds. Extra Trees keeps the strongest diagonal dominance and the most consistent class separation. Random Forest behaves similarly but shows slightly higher swing–mid-swing confusion. kNN preserves strong stance separation but shows more confusion within swing-related classes. XGBoost and LightGBM show more off-diagonal mass across multiple class pairs, which is consistent with their lower MCC.
4.3. Comparative Visualizations of Accuracy and Training Time
Figure 7 compares accuracy and training time across models. Extra Trees offers the most favorable trade-off, achieving the highest accuracy while training considerably faster than Random Forest. kNN exhibits the shortest training time but at the cost of lower accuracy. In contrast, XGBoost and LightGBM incur longer training times while achieving lower accuracy in this setting, suggesting that boosting provides limited additional benefit under the current feature representation.
Figure 8 compares the precision, recall, F1-score, and MCC across models. Extra Trees achieves the highest values across all metrics, which is followed by Random Forest. kNN remains competitive but below the bagging ensembles. XGBoost and LightGBM show reduced recall and MCC, which is consistent with larger confusion in swing-related classes.
4.4. Discussion
The strong performance of Extra Trees and Random Forest is consistent with the characteristics of the input representation. The feature vector is high dimensional and includes partially redundant descriptors extracted from multiple sensors. Bagging-based tree ensembles are well suited to such settings because they reduce variance through averaging, capture nonlinear interactions, and do not require feature scaling. In particular, Extra Trees introduces additional randomness in split selection, which can further mitigate overfitting when predictors are highly correlated. Gradient-boosted tree models (XGBoost and LightGBM) can achieve excellent performance in many structured learning tasks; however, in high-dimensional handcrafted feature spaces, they may become more sensitive to noisy or weakly informative predictors and to hyperparameter choices. Under the present feature representation and tuning budget, their lower recall and MCC suggest greater difficulty in separating swing and mid-swing, which is consistent with increased confusion among swing-related phases. kNN remains computationally efficient and competitive, but distance-based classification can be less discriminative when class boundaries are subtle and the underlying manifolds overlap.
The results should be interpreted in the context of the adopted windowing and labeling strategy. Windows were generated with 50% overlap; consequently, adjacent windows share substantial signal content and are highly correlated. Because both train–test splitting and cross-validation were performed at the window level, neighboring windows may appear in different folds, which can lead to optimistic performance estimates relative to trial-wise or subject-independent evaluation. Accordingly, the reported metrics reflect performance under the current dataset and evaluation protocol. In addition, windows containing mixed labels or phase transitions were excluded to reduce ambiguity and establish a clean baseline comparison across models. While this improves label consistency, it also yields an easier classification setting than real-time deployment, where transitions are unavoidable. In practical scenarios, boundary regions around heel-strike and toe-off are expected to increase confusion, particularly between swing and mid-swing. Finally, in order to evaluate the robustness under the evaluated conditions, we observe that the results indicate that tree-based ensembles are relatively robust to moderate feature redundancy and sensor noise within the evaluated dataset. However, the reported performance was obtained under controlled acquisition and preprocessing conditions, including synchronized sensor streams, fixed sampling frequency, and consistent sensor placement. Generalization beyond these conditions may be affected by factors such as sensor drift, placement variability, or changes in walking speed and context. A more comprehensive assessment of robustness would require additional experiments (e.g., controlled noise injection, simulated drift, or deliberate sensor misplacement). Although such analyses are outside the scope of this study, the present results establish a stable baseline under well-defined data acquisition assumptions.
4.5. Comparison with Existing Literature
Compared with previous ML-based gait-phase detection studies
Table 10, the performance of the proposed models is competitive and often superior within the IMU-based paradigm.
Farah and Baddour [
27] reported a J48 accuracy of 97.5% on thigh-mounted IMU data, closely aligning with the performance of our Random Forest and Extra Trees classifiers. Pazar et al. [
29] found Random Forest to be the best-performing model 95.49% for textile-based ankle sensors, though their dataset was significantly smaller and more constrained in walking speeds.
Nazari et al. [
30] demonstrated that deep learning outperformed traditional ML models for EMG-based gait intention detection though with higher sensitivity to noise and electrode placement. In contrast, our IMU-based approach avoids these biosignal inconsistencies and achieves higher accuracy without requiring deep neural architectures.
Khamparia et al. [
31] reported Random Forest accuracies as high as 98.9% for freeze and non-freeze detection in Parkinson’s patients. Although their task is binary and not directly comparable, the strong performance of Random Forest is consistent with our findings. Pasinetti et al. [
9] proposed a modified Random Forest variant based on depth-camera inputs, achieving 87.3% accuracy. Their lower accuracy reflects the inherent challenges of monocular depth imaging and the limited number of detectable gait phases.
4.6. Comparison with Micro-Doppler Radar
Wearable sensing is not the only approach for gait analysis, and non-invasive remote technologies such as micro-Doppler radar have been explored to analyze human motion without on-body sensors. Micro-Doppler radar captures motion-induced frequency modulations related to limb dynamics and has been successfully applied to human activity classification and gait-based recognition tasks using classical machine learning and radar-specific features [
41,
42,
43]. These approaches offer advantages in terms of user comfort and unobtrusive monitoring, particularly in fixed and controlled environments. However, radar-based systems typically address coarse activity recognition or subject identification rather than discrete gait-phase segmentation, and their performance can be affected by subject orientation, environmental clutter, and sensor placement. In contrast, the wearable-sensor framework adopted in this study directly measures limb kinematics and foot–ground interaction, enabling a precise detection of heel-strike and toe-off events and supporting low-latency phase recognition. As a result, wearable sensing remains better suited to real-time closed-loop applications such as prosthetic and exoskeleton control, while micro-Doppler radar represents a complementary solution for unobtrusive gait monitoring and screening in controlled settings.
4.7. Limitations and Future Work
Several limitations should be considered when interpreting these results. First, model evaluation relied on window-level stratified train–test splitting and cross-validation. Because windows were generated with 50% overlap, adjacent samples share substantial signal content and are therefore highly correlated. This dependence can inflate performance estimates relative to stricter protocols (e.g., trial-wise splitting or subject-independent evaluation). Accordingly, the reported metrics should be interpreted as benchmark performance under the current protocol rather than as definitive evidence of generalization to unseen users. Second, the dataset includes a limited number of participants and was collected under controlled laboratory conditions. These factors constrain external validity and may limit generalization to broader populations and to pathological gait patterns. Expanding the cohort size and diversity, and validating on more heterogeneous acquisition settings, would strengthen robustness claims. Third, although bilateral recordings are available, this study used only right-leg signals to reduce model complexity and enable controlled comparisons. This design choice prevents any analysis of inter-limb asymmetries and bilateral coordination, which are important in clinical gait assessment and prosthetic applications. Incorporating bilateral features is therefore a relevant extension of this work. Fourth, windows spanning mixed or transitional gait phases were excluded to provide clean supervision during training. While this improves label consistency for controlled benchmarking, it simplifies the task compared with real-world deployment, where transitions are unavoidable. A more deployment-oriented evaluation should explicitly account for transitions (e.g., via an additional transition class, soft labeling, or boundary-focused error analysis around heel-strike and toe-off events). Finally, the present study focuses on classical and ensemble machine-learning models evaluated under preprocessing and labeling assumptions. Although the results indicate that gait-phase recognition is feasible from these signals, conclusions about real-time prosthetic control require additional validation. In particular, future work should prioritize subject-independent protocols (e.g., leave-one-subject-out cross-validation) and compare against temporal models, including sequence-based and deep learning approaches, within the same standardized pipeline.
5. Conclusions
This study presented a structured and reproducible framework for discrete gait-phase recognition using multimodal lower-limb wearable sensor data. The proposed pipeline integrates automatic gait-phase relabeling based on refined heel-strike and toe-off detection, window-based feature construction from synchronized sEMG, IMU, pressure, and footswitch signals, and the benchmarking of established machine-learning classifiers under a unified evaluation protocol. Five classifiers were trained on the same window-based representation and evaluated using both a held-out test set and stratified cross-validation.
Across all evaluation metrics, tree-based ensemble methods—particularly Extra Trees and Random Forest—consistently achieved the most reliable performance for three-phase gait classification. These models delivered high accuracy and strong agreement measures with stable performance across validation settings. This behavior is consistent with the suitability of bagging-based ensemble methods for high-dimensional, correlated, and nonlinear wearable sensor data, allowing effective learning without extensive feature scaling. In contrast, distance-based and boosting-based methods showed reduced robustness under the same representation and tuning budget, particularly when distinguishing swing-related gait phases.
Overall, the results demonstrate that accurate gait-phase recognition can be achieved under idealized labeling and window-level evaluation conditions by combining reliable automatic relabeling, consistent feature construction, and classical machine-learning models. The proposed framework should therefore be interpreted as a strong baseline and an upper performance bound under the present experimental protocol, providing a transparent reference for future work toward more robust and deployment-ready gait analysis systems.