1. Introduction
Efficient heating and cooling of buildings is of paramount importance for contemporary societies, as it directly impacts energy consumption, environmental sustainability, and economic costs. With buildings accounting for a significant portion of global energy use, optimizing thermal performance has become a central focus in both engineering and architectural design. In an extensive review by Chenari et al. [
1] various energy-efficient methods are reported. In an effort to reduce energy consumption, traditional methods are being revisited, such as the so-called Arabic wind catchers, which have been used for centuries in Middle East to passively cool building interiors. Arabic wind catchers consist of a vertical shaft with openings at the top, designed to capture prevailing winds. These openings allow air to flow into the building, providing both ventilation and cooling. The air circulates in the interior, lowering temperatures without the need for mechanical cooling systems. Passive cooling in wind catchers is achieved through a combination of a vertical temperature gradient, created mainly by solar heat, and the pressure spatial differences generated by the blowing winds. The temperature variation causes air movement, with hot air masses rising, and cooler air being directed downward. Meanwhile, wind pressure helps draw cooler air into the building or expelling interior air when suction pressures prevail at the openings, promoting natural ventilation. This combination of forces significantly reduces the need for mechanical cooling, providing an energy-efficient solution. Egyptian architect Hassan Fathy revitalized the traditional wind catcher, integrating it into modern architectural practice as an effective passive cooling strategy for hot arid climates [
2]. Comprehensive reviews of wind catcher applications are found in Saadatian et al. [
3] and Hughes et al. [
4], whereas the review by Jomehzadeh et al. [
5] focuses on the performance of wind catchers with regard to indoor air quality.
The cooling performance of a wind catcher is influenced by multiple parameters, including the shaft height, the size, number, and orientation of its openings, and its alignment with respect to the prevailing wind direction. As highlighted in the review work by Khan et al. [
6], the ventilation effectiveness of a building is governed not solely by the wind catcher, but by the combined influence of the wind catcher and the building’s window openings. Additionally, the temperature distribution of the building walls due to solar heat, the thermal properties of the building materials, and the temperature and pressure differences between the interior and exterior of the building all play crucial roles in determining the effectiveness of the wind catcher. In the numerical work of Cook [
7], it is shown how the buoyancy forces due to vertical temperature gradients are opposed by the wind forces, influencing the indoor air motion accordingly.
Many publications appear in the available literature, either experimental or computational, exploring various parameters related to the performance of wind catchers. For example, based on wind tunnel experiments, it was found (Montazeri & Azizian [
8]) that the internal airflow rate of a one-sided wind catcher attached to a building with an opening at its back side, is maximized for a zero-degree angle relative to the prevailing wind direction. Increasing the wind angle, the flow rate is reduced up to an angle of 68° at which the flow is minimized, while it changes direction for higher angles. In the latter case, the opening of the catcher becomes a flow outlet due to the prevailing low pressures in the wake of the wind catcher. The same authors in another publication (Montazeri & Azizian [
9]), examining a model of a two-sided wind catcher model, found the internal flow rate to maximize at an angle of 90°, being 20% higher than for the zero-angle orientation angle. In Montazeri [
10], the internal flow rate of multi-opening wind catchers was investigated both numerically and experimentally. The study found that increasing the number of openings reduces the sensitivity of the flow rate to wind direction. Based on the climatic conditions in Jordan, Badran [
11] proposed a shorter wind catcher compared to traditional designs, suggesting that a 4 m tall tower with a square cross-section of 0.57 m per side can lower the indoor temperature from 36 °C to 25 °C. Dehghani-Sanij et al. [
12] proposed a wind catcher with a rotating top, which can be aligned with the prevailing wind direction as well as a solar chimney at low wind speed sites. In Alsailani et al. [
13], the focus is on the maximization of the internal flow of a wind catcher, proposing several shapes and guide vanes of the catcher’s inlets for the reduction in the flow recirculation zone at the catcher bend duct. In Chohan et al. [
14], a traditional UAE (United Arab Emirates) two-floor house (Al Zarouni House) was computationally examined, including two X-blade wind catchers, concluding that they perform best from October to March, causing a maximum reduction in the interior temperature of 7 °C. Recently, the influence of the wind catchers in the natural ventilation of a two-story house was computationally examined, including various openings (Tantasavasdi et al. [
15]). In a computational work by Foroozesh et al. [
16], a one-sided wind catcher is examined, in which water droplets are sprayed in order to enhance the cooling performance, achieving a maximum interior temperature reduction of 17.4 °C. The same work includes an extensive list of relevant studies, providing a valuable source of information on wind catchers including water evaporation as an effective means for internal temperature reduction.
In Bahadori’s work [
17], a system comprising several wind towers, a domed roof, and a basement water tank was examined. In this configuration, incoming air is cooled as it passes over the free surface of the water tank and then exits near the top of the domed roof, where a local pressure minimum exists, generated by the accelerated flow of the external air over the curved surface. In a subsequent study (Bahadori [
18]), the same author proposed an alternative wind catcher design in which evaporative cooling is achieved by spraying water into the catcher’s shaft through a series of clay conduits. Later, in an experimental investigation (Bahadori et al. [
19]), the cooling performance of traditional wind catchers was found to be inferior to two modified configurations: one employing wetted cloth curtains suspended along the entire height of the tower, and another incorporating wetted pads placed directly at the air inlets.
Recent research has increasingly focused on hybrid passive ventilation systems, which integrate wind-driven airflow with components such as solar chimneys, wind catchers, and evaporative cooling units. Purely wind-driven systems fail on calm days, and purely buoyancy-driven systems are weak at night or on overcast days when solar heating is significantly reduced, as the temperature difference between indoor and outdoor air is minimized. A hybrid system ensures continuous and stable ventilation by having one force (buoyancy force) available to compensate when the other is weak (pressure force). For instance, when wind is low, solar chimney maintains the airflow rate as it is shown in the numerical work of Yue et al. [
20].
In a recent comprehensive review, Li et al. [
21] discussed the integration of wind catchers with earth-air heat exchangers, heat pipes, and phase-change materials (PCMs). For instance, in Egypt, Mourad et al. [
22] combined a wind catcher with a geothermal heat exchanger; in this configuration, air from the wind catcher shaft is routed through an underground channel to be cooled before entering the building. Similarly, Sakhri et al. [
23] investigated a system where air is supplied via a wind catcher while outdoor air simultaneously enters the interior through a 60 m long horizontal tube buried 1.5 m underground. This setup increased thermal comfort levels by up to 50%, particularly when windows remained open. Furthermore, the influence of PCM on the performance of a two-sided wind catcher was experimentally examined by Abdo et al. [
24]. In their study, the PCM was integrated into both the walls of the acrylic test chamber and the inlet duct of the wind catcher. Their findings demonstrated a reduction in the chamber temperature of approximately 3 °C. While further research is required to optimize these systems, the integration of PCM demonstrates significant potential for enhancing the thermal performance of wind catchers. In another approach, horizontal heat pipes installed in the vertical shaft of a wind catcher enhance heat exchange between the incoming and outgoing air streams. In summer, they help cool the incoming air before it enters the building, whereas in winter, they transfer heat from the exhaust air to the fresh air, warming it prior to entry. This idea was examined by Mahon et al. [
25] both experimentally and numerically, proving that this passive system can reduce the building’s heating and cooling demand.
Investigations of wind catchers have traditionally focused on airflow behavior under isothermal conditions, primarily quantifying velocity fields, pressure distributions, and ventilation rates, while typically neglecting internal heat loads. However, omitting heat loads alters the governing physics of the problem since in the absence of temperature gradients, buoyancy forces are absent and indoor air motion becomes purely wind-driven. However, in reality, internal heat gains give rise to spatial temperature gradients that induce buoyancy-driven flow, modify internal pressure distributions, and interact with wind-induced ventilation, resulting in mixed-mode behavior that cannot be captured under isothermal assumptions. The present study addresses this limitation by explicitly incorporating internal heat loads into the evaluation of wind catcher performance. More particularly, the model was placed within the test section of an open-circuit wind tunnel, and its cooling performance was evaluated through temperature measurements taken by thermocouples. The study examined five different wind speeds, five orientations, and two configurations for the back-end of the wind catcher cavity, namely open and closed, simulating fifty cases in total. It was found that the catcher’s cooling performance depends on the vertical temperature gradient within its shaft as well as on the pressure distribution at the openings, which varies with wind direction. Notably, the cooling performance increased when the wind catcher’s opening was positioned on the leeward side of the catcher’s shaft, due to both a suction-driven flow mechanism and a favorable vertical temperature gradient. To the best of our knowledge, this behavior has not been reported previously, most likely because existing experimental studies do not incorporate internal heat loads and therefore do not capture the coupled wind–buoyancy mechanism observed here.
2. Materials and Methods
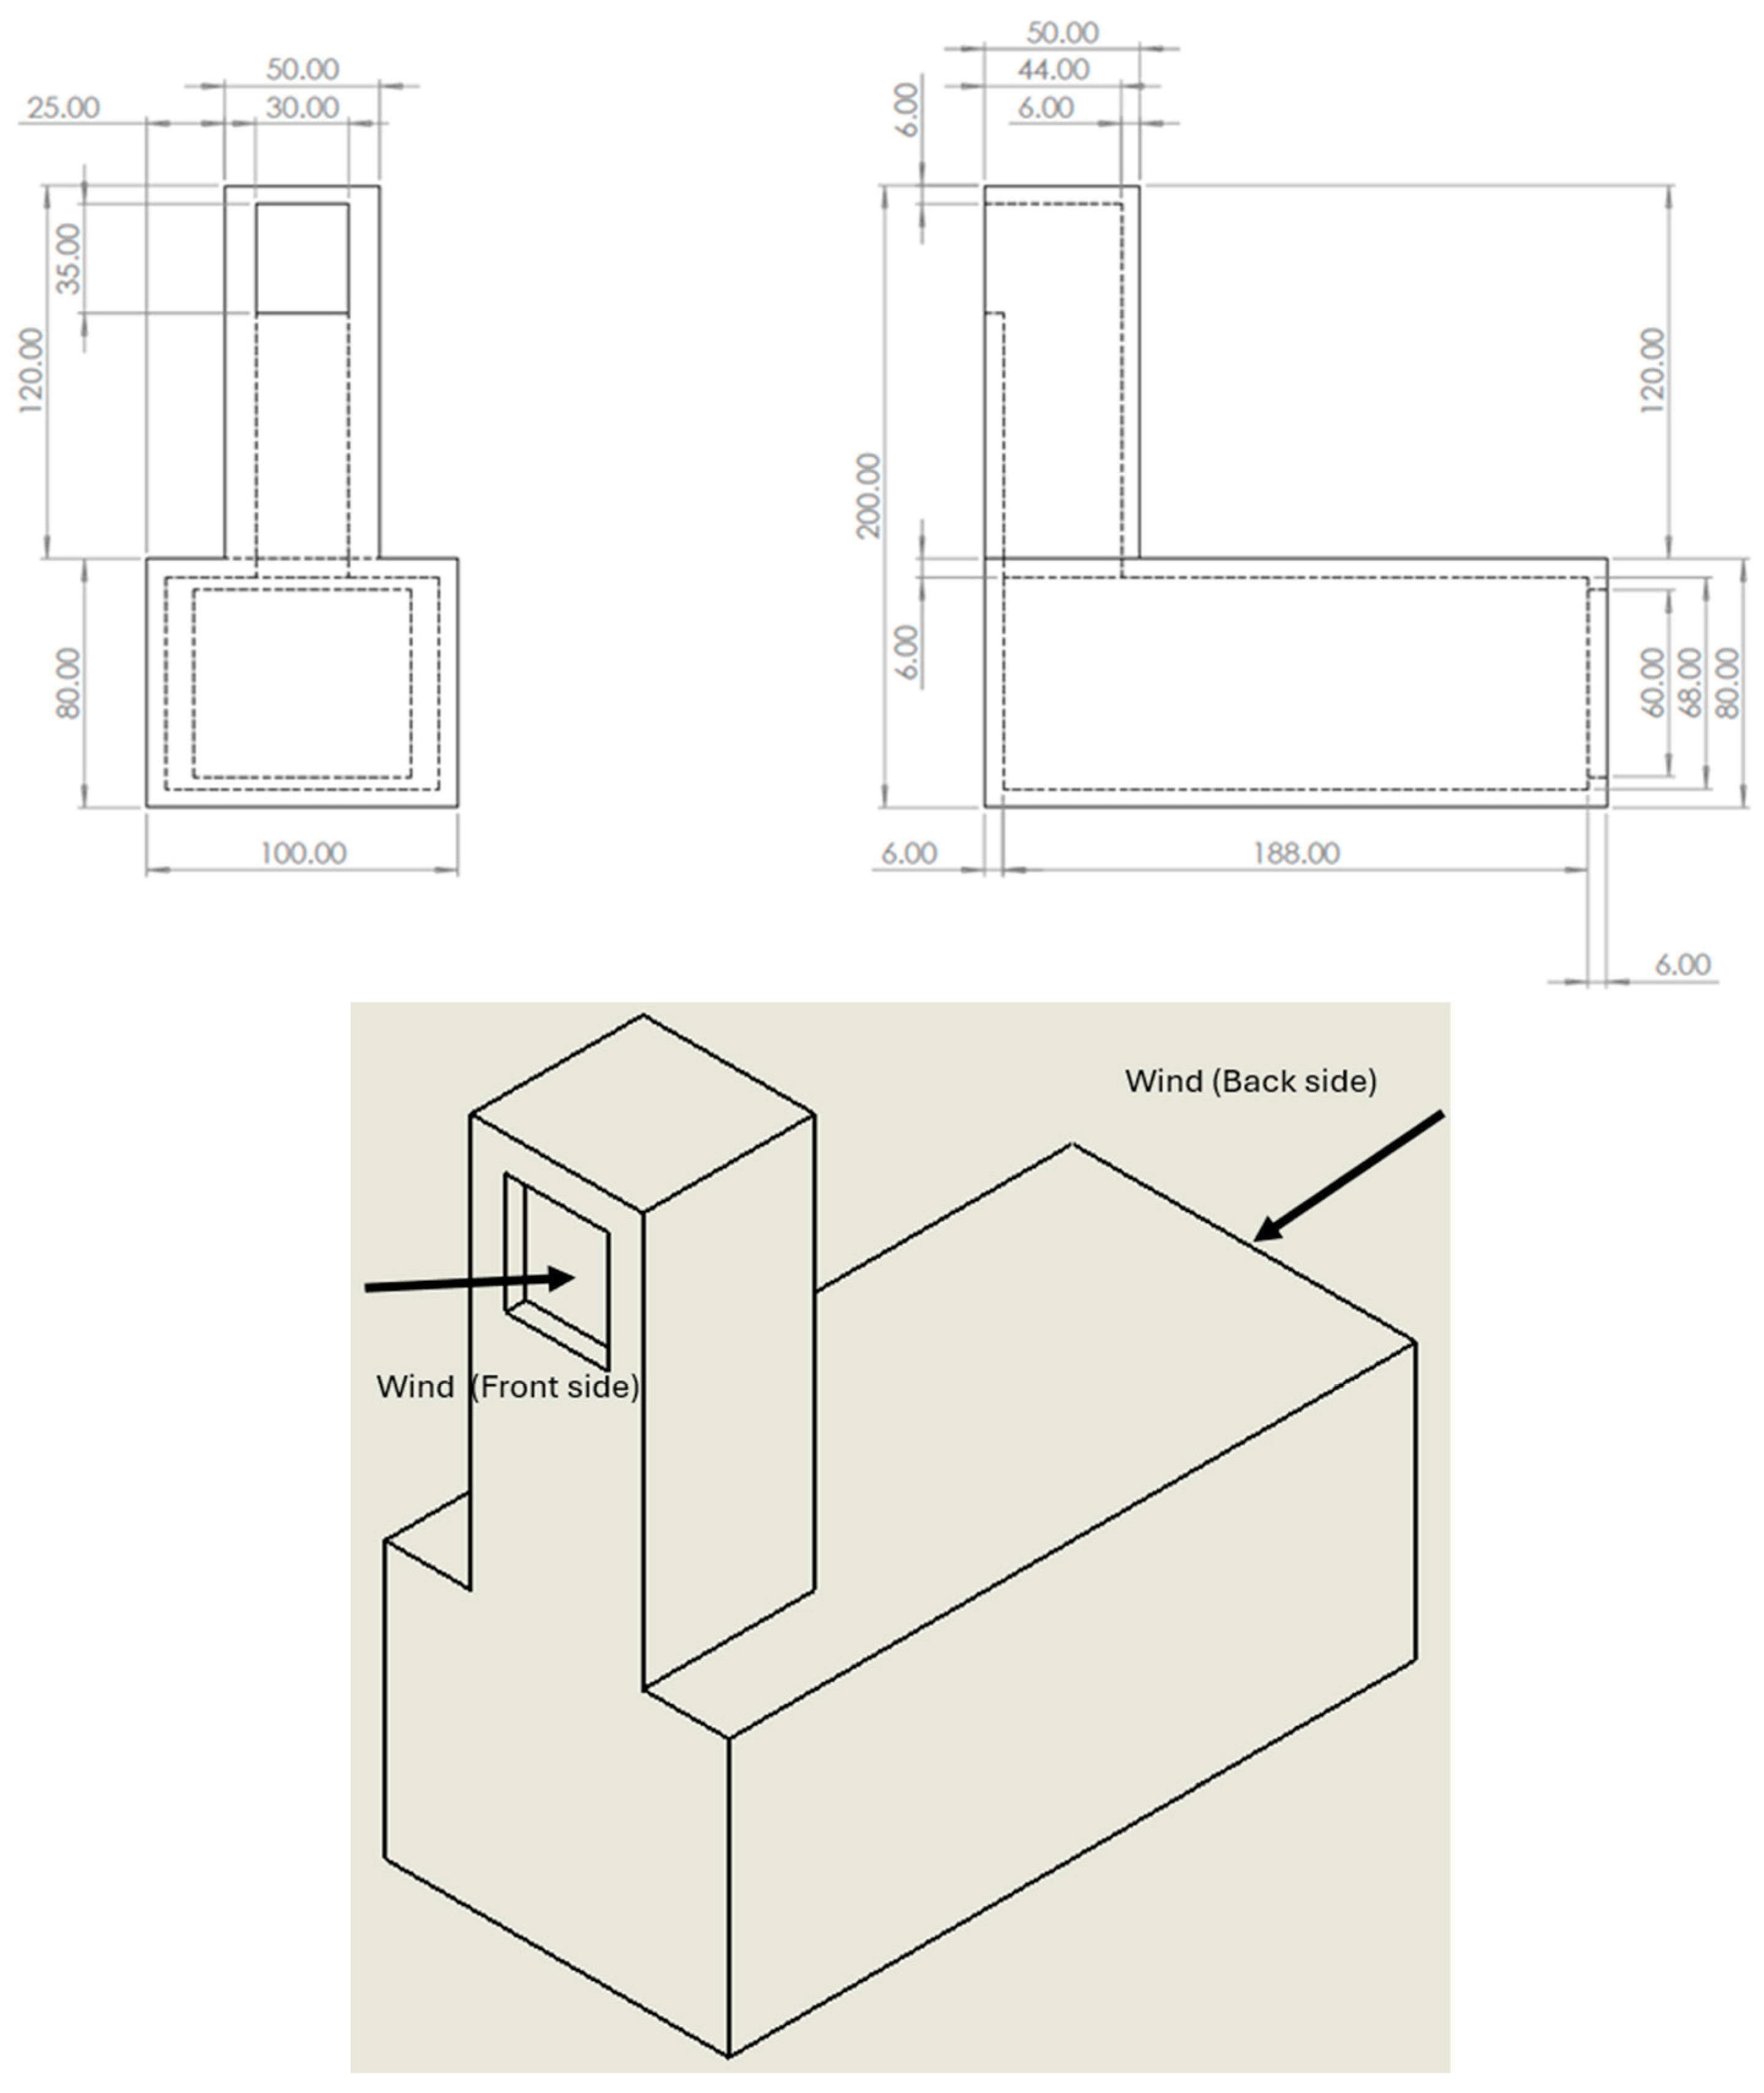
A model of a wind catcher was constructed from wood due to its favorable thermal insulation properties, ensuring the building envelope functioned as an effective thermal insulator. This minimized heat conduction through the walls, allowing the thermal influence of the external wind tunnel airflow to be neglected. Consequently, the temperature variations recorded by the thermocouples can be attributed solely to the air exchange driven by the wind catcher. Furthermore, the low thermal expansion coefficient of wood ensured that the internal geometry of the wind catcher remained rigid and dimensionally stable throughout the testing procedure. Finally, the model was treated with a moisture-resistant coating to prevent hygroscopic expansion and maintain surface integrity. The model consisted of a vertical shaft 120 mm in height with an internal cross-section of 38 mm
38 mm. One of the four vertical faces of the shaft had an opening, measuring 30 mm (horizontal)
35 mm (vertical). The shaft was connected to a horizontal cavity, also made of wood, representing an interior space. The cavity was 200 mm in length, with a cross-section of 88 mm (horizontal)
68 mm (vertical), including an opening at its end, simulating a window, measuring 70 mm (horizontal)
60 mm (vertical). The walls of the model were 6 mm thick.
Figure 1 illustrates the geometric details of the model, including a three-dimensional schematic showing the wind interception at the front and back of the wind catcher. The chosen dimensions of the model are related to a real building through a scale factor. Namely, if the typical height of a residential building is considered to be 4 m ([
26], p. 17), this size is 58.8 times larger compared to the 68 mm height of the model cavity. Therefore, assuming a scale factor of 58.8, the corresponding height of a real wind catcher would be 58.8
0.12 = 7.05 m, the side of its square cross-section would be 58.8
0.038 = 2.23 m, and its opening 1.76 m (horizontal) by 2.05 m (vertical). By comparison, in Bahadori et al. [
19], a full scale wind catcher is examined with a net catcher height of 8 m, a cross-section of 1 m by 1 m, and an opening of 1.5 m, whereas in Ghadiri & Ibrahim [
27], a 5 m tall catcher is studied with a 1.5 m side square cross-section and top openings of 1.5 m by 1.5 m.
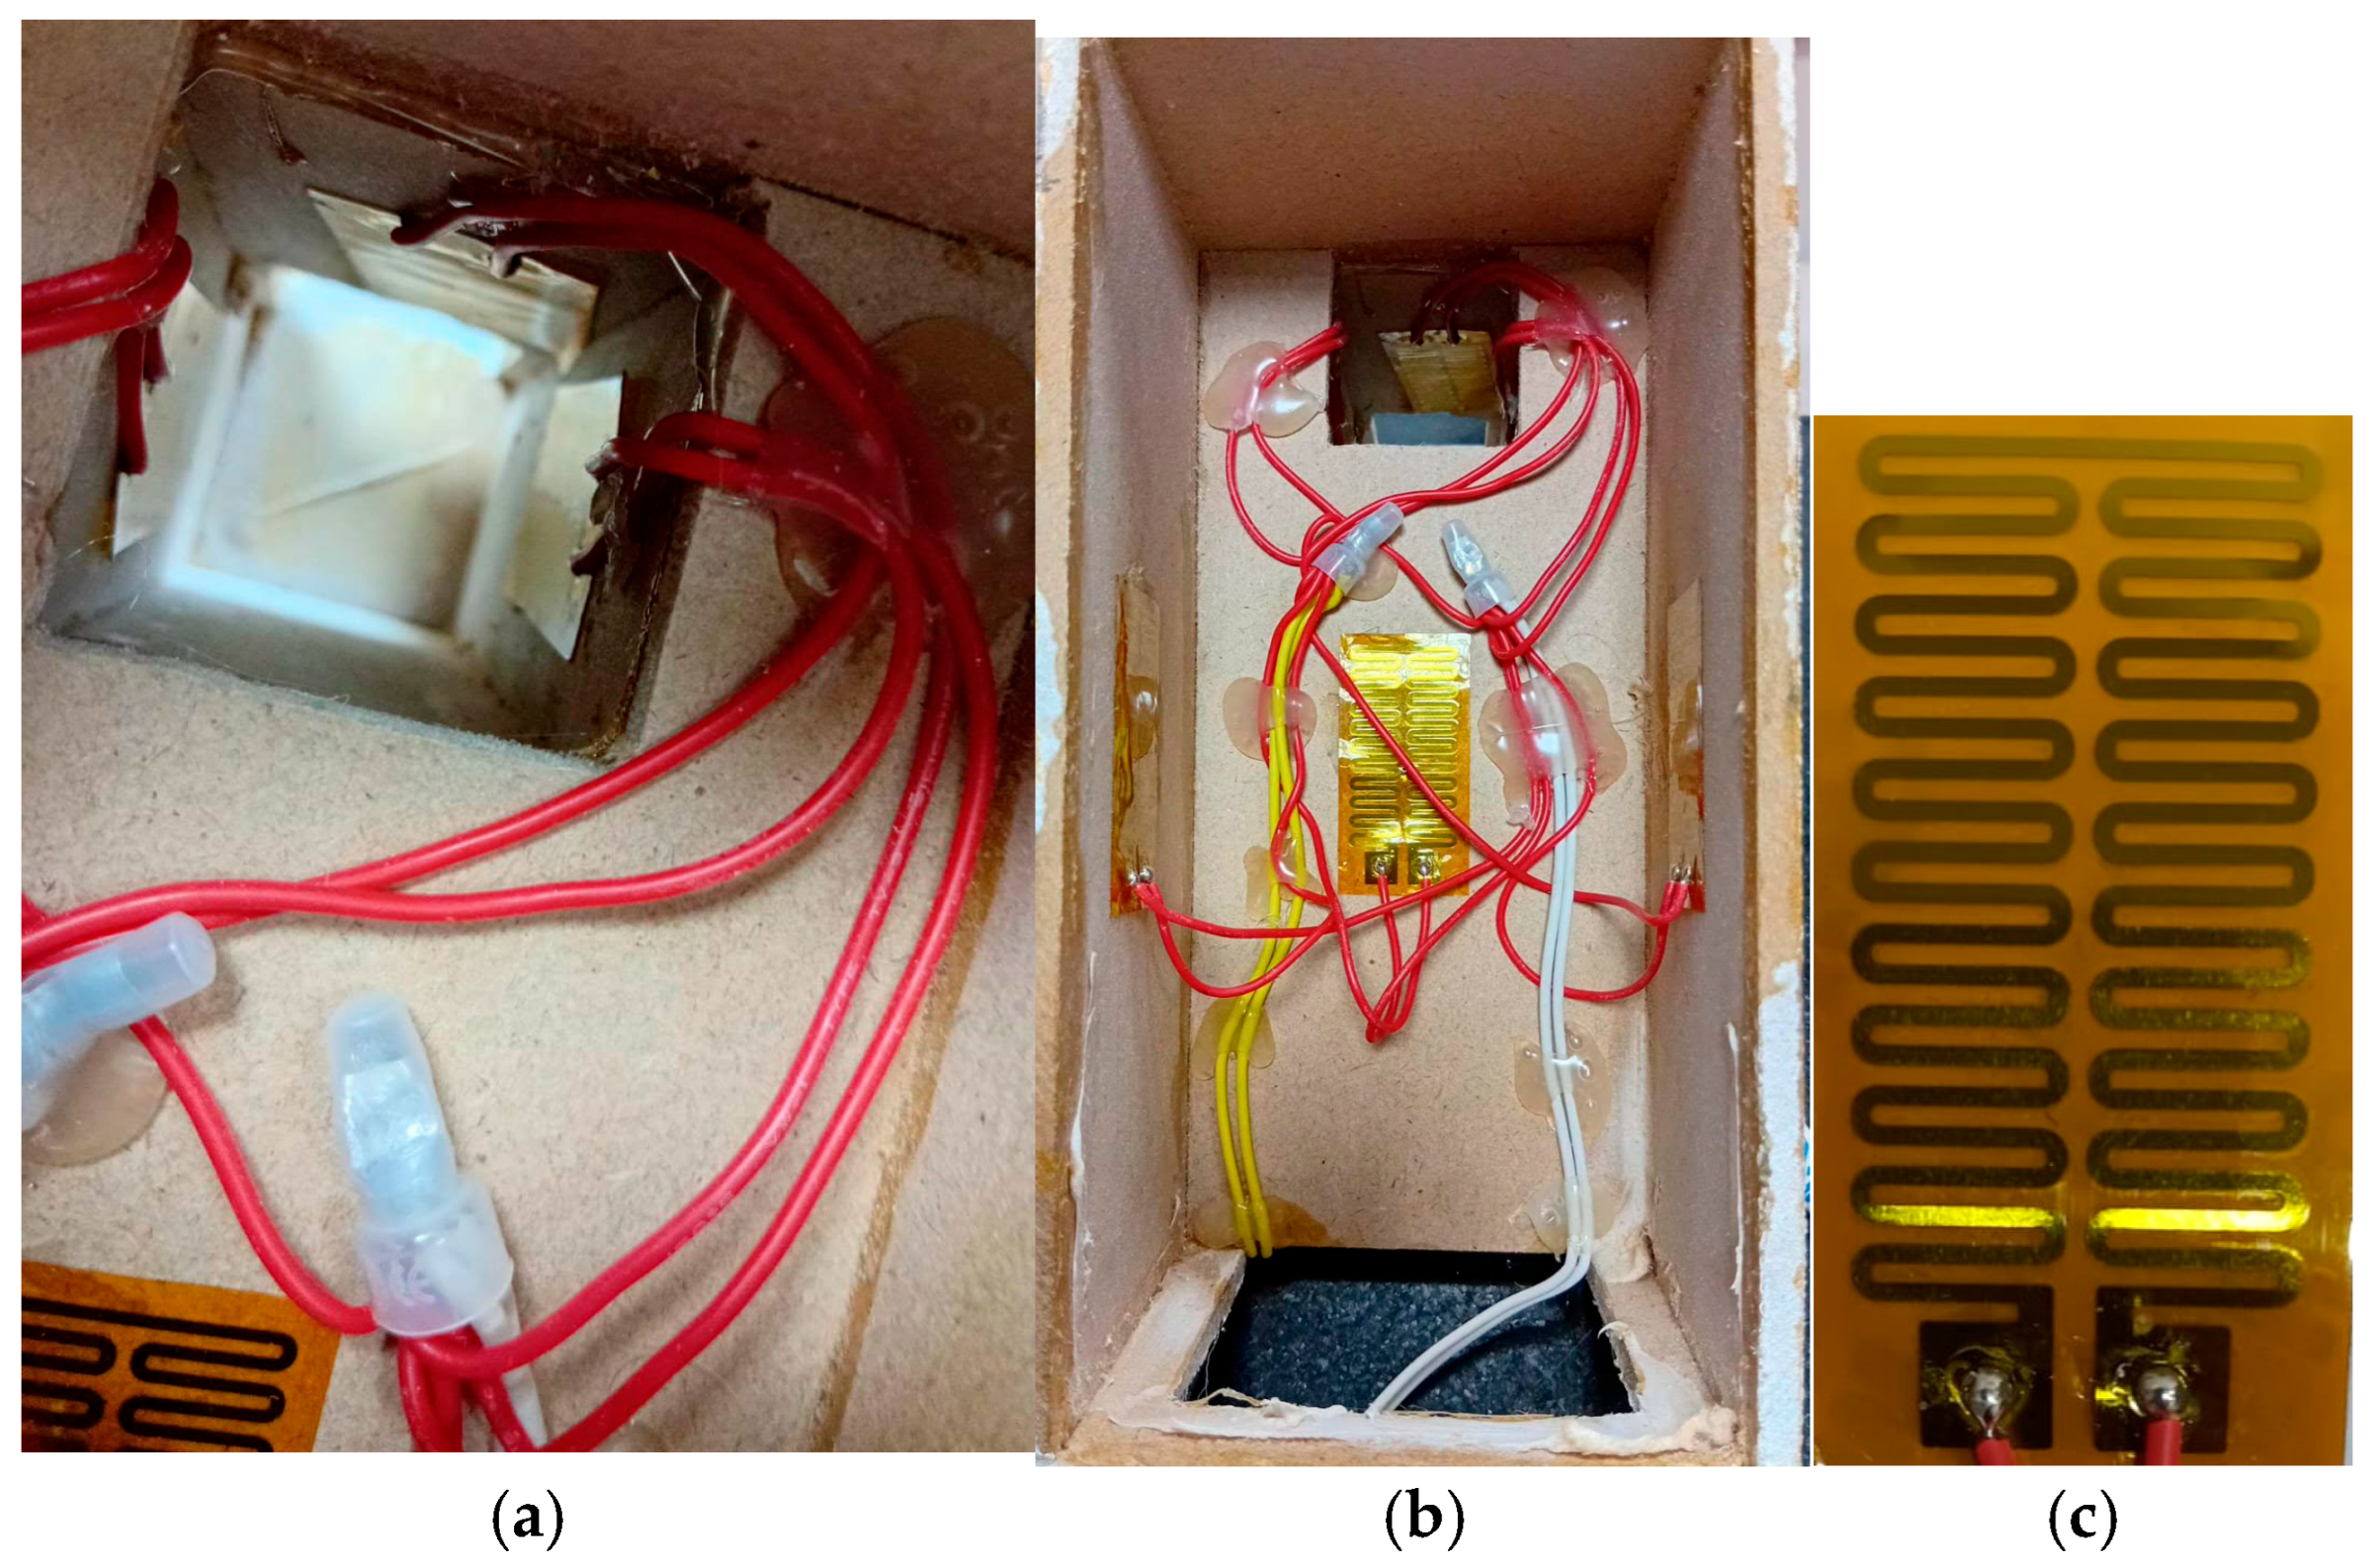
Six flexible polyamide resistors (50 mm by 25 mm, R = 22 Ω each) were employed to simulate the building’s internal heat load, distributed between the vertical shaft and the horizontal cavity. In the vertical shaft (
Figure 2a), three resistors were mounted 5 mm below the inlet, oriented with their longitudinal axes vertical. The photo was taken from the base of the shaft. One resistor was affixed to the wall containing the inlet opening, while the other two were placed on the adjacent side walls. The fourth wall was left unheated, assuming it was shielded from direct thermal exposure by the building structure. The remaining three resistors were installed in the horizontal cavity on the two vertical side walls and the ceiling. This configuration assumes these surfaces are exposed to solar radiation, while the floor is considered adiabatic (thermally insulated). These resistors were oriented with their longer dimension parallel to the cavity’s longitudinal axis, centered on their respective walls (
Figure 2b). It is noted that the resistor at the center of
Figure 2b is attached to the ceiling of the cavity model (a close up image is shown in
Figure 2c).
The resistors were connected to an adjustable AC voltage source (Variac), and the voltage was maintained at a constant V = 10.5 V. Consequently, the total heat load (Q) applied to the interior of the structure was calculated as follows:
The applied voltage was chosen to ensure that the resistors’ temperature did not exceed 90 °C, thereby preventing any damage to the model, while allowing spatial temperature variations to be detected by the temperature sensors. Based on the model’s total internal surface area of 792 cm
2, the heat load per unit internal wall area is calculated as 30.06/0.0792 ≈ 380 W/m
2. This value is higher than the typical heat loads reported for residential buildings in Bahrain. For example, Salem et al. [
28] analyzed a two-story building with a floor area of 127 m
2 and windows covering 3.2% of the wall surface, in six Middle Eastern cities, including the capital of Bahrain. Their results indicate a mean heat load in the hottest month of July of approximately 100 W/m
2 for an indoor temperature of 22 °C (based on Figures 4 and 5 in [
28]). It has to be stressed that in wind-tunnel model testing, exact thermal similitude cannot be achieved because dimensionless parameters such as the Grashof (
Gr) and Richardson (
Ri) numbers, which govern the Nusselt (
Nu) number, scale strongly with the characteristic length. However, in natural convection,
Nu depends on
Gr by a power-law correlation, where the exponent typically varies between 1/4 and 1/3 depending on the flow regime (see [
29]) and is also proportional to the characteristic length. Consequently, the convective heat transfer coefficient is weakly dependent on both geometric scaling and the wall-to-air temperature difference if natural convection is considered. Moreover, as discussed in paragraph 4, the calculated heat transfer coefficient is comparable to values reported in the literature.
The temperature of the resistor surface was measured with a digital infrared thermometer (MESTEK, IR02C), by manually scanning its surface, varying between 80 °C and 100 °C. The temperature in the model was measured using two K-type thermocouples, one positioned at the entrance of the vertical shaft (denoted as T1) on the vertical wall opposite to the catcher’s opening central point, and the other, denoted as T2, in the middle of the cavity at the bottom (floor) side, 20 mm downstream from the resistors. Both thermocouples were connected to a portable digital thermometer (Perfect Prime TC9815), which provided temperature readings with a resolution of 0.1 °C. To verify the reliability of the recorded data, a sensitivity test was performed by moving the temperature measurement point from the bottom wall to the mid-height of the cavity. At the examined wind speed of 9.04 m/s, the results remained qualitatively consistent, confirming that the measurement location did not alter the comparative conclusions of the study.
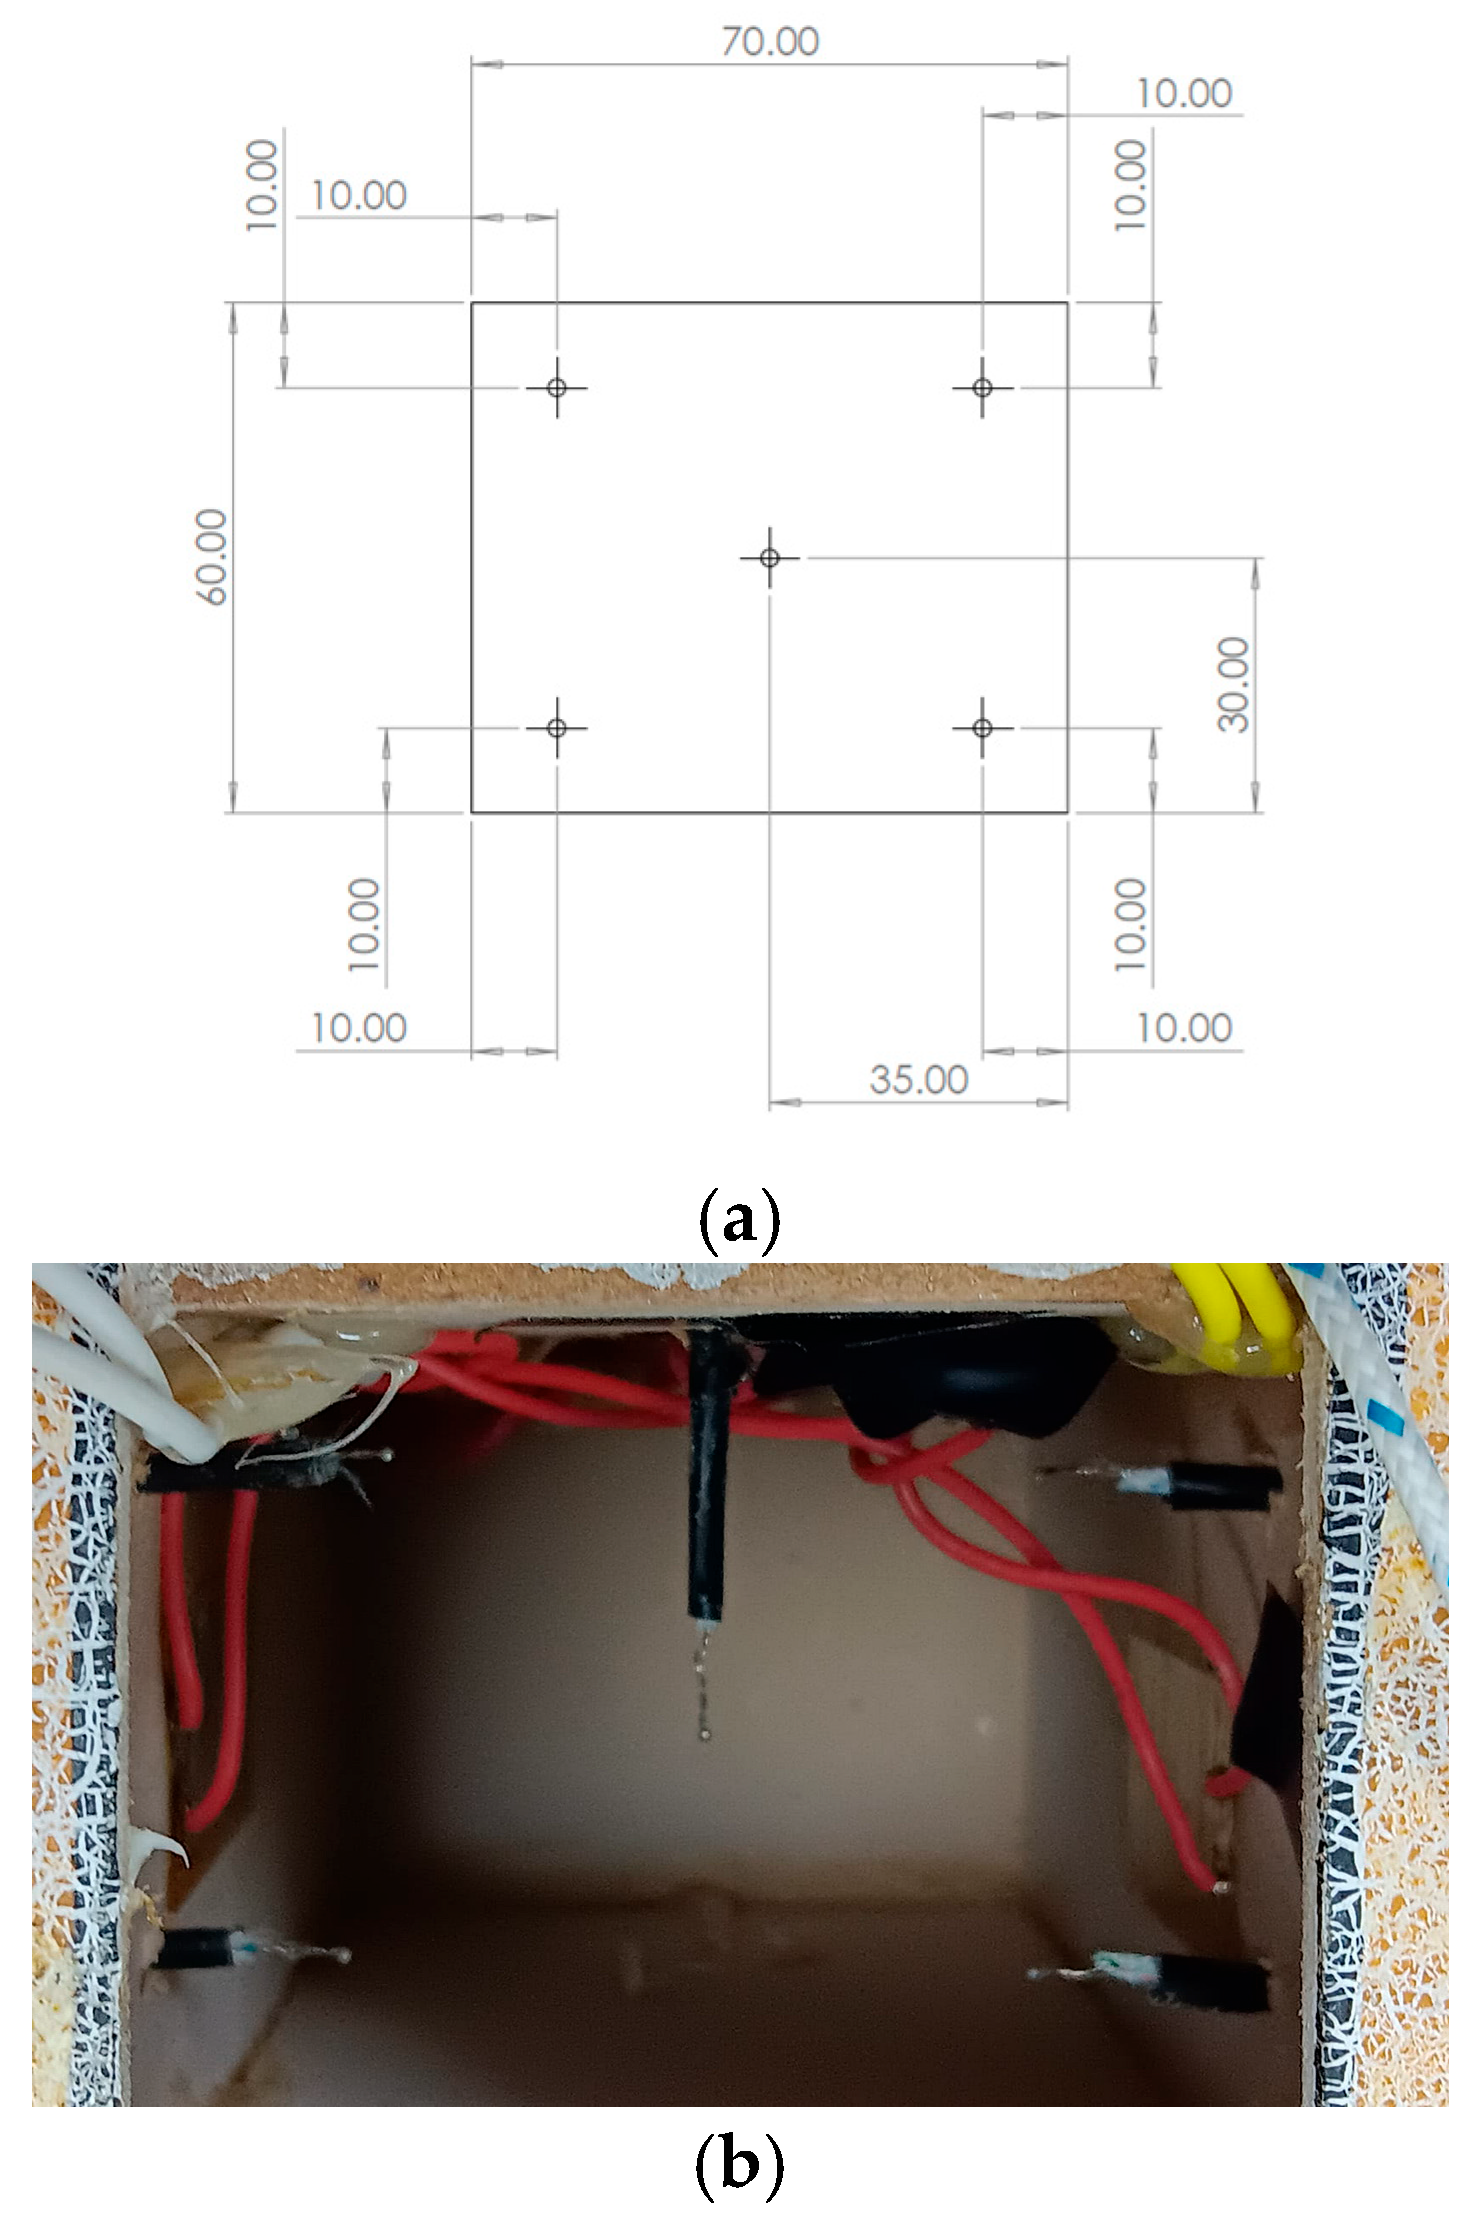
To account for the spatial temperature distribution within the wind catcher, five thermocouples were also installed across a vertical cross-section, positioned 20 mm downstream from the resistors toward the cavity exit. The locations of these sensors are shown in
Figure 3a, in which the dimensions of 70 mm (width) by 60 mm (height) refer to the cavity window size. The thermocouples are shown in
Figure 3b, and they are indexed with the numbers 1 through 5. Positions 1 and 2 comprise the upper horizontal row (close to the cavity ceiling) with number 1 being on the left side, position 3 marks the geometric center, and positions 4 and 5 form the lower horizontal row (close to the floor).
The wind catcher model was placed in the test section of a subsonic, open-circuit wind tunnel at Bahrain Polytechnic, with a cross-sectional area of 305 mm
305 mm with a minimum reliable operating velocity of approximately 3 m/s. To ensure stable flow conditions, measurements were initiated at a wind speed of 4 m/s. Although this velocity is higher than typical low outdoor wind speeds observed near the ground in many urban environments, it ensures stable operation, a uniform velocity distribution, and acceptable turbulence intensity within the test section. Moreover, as the wind catcher shaft opening is typically located above the building roof level, the corresponding wind speeds are generally higher than 4 m/s, as reported in field measurements from urban environments (e.g., [
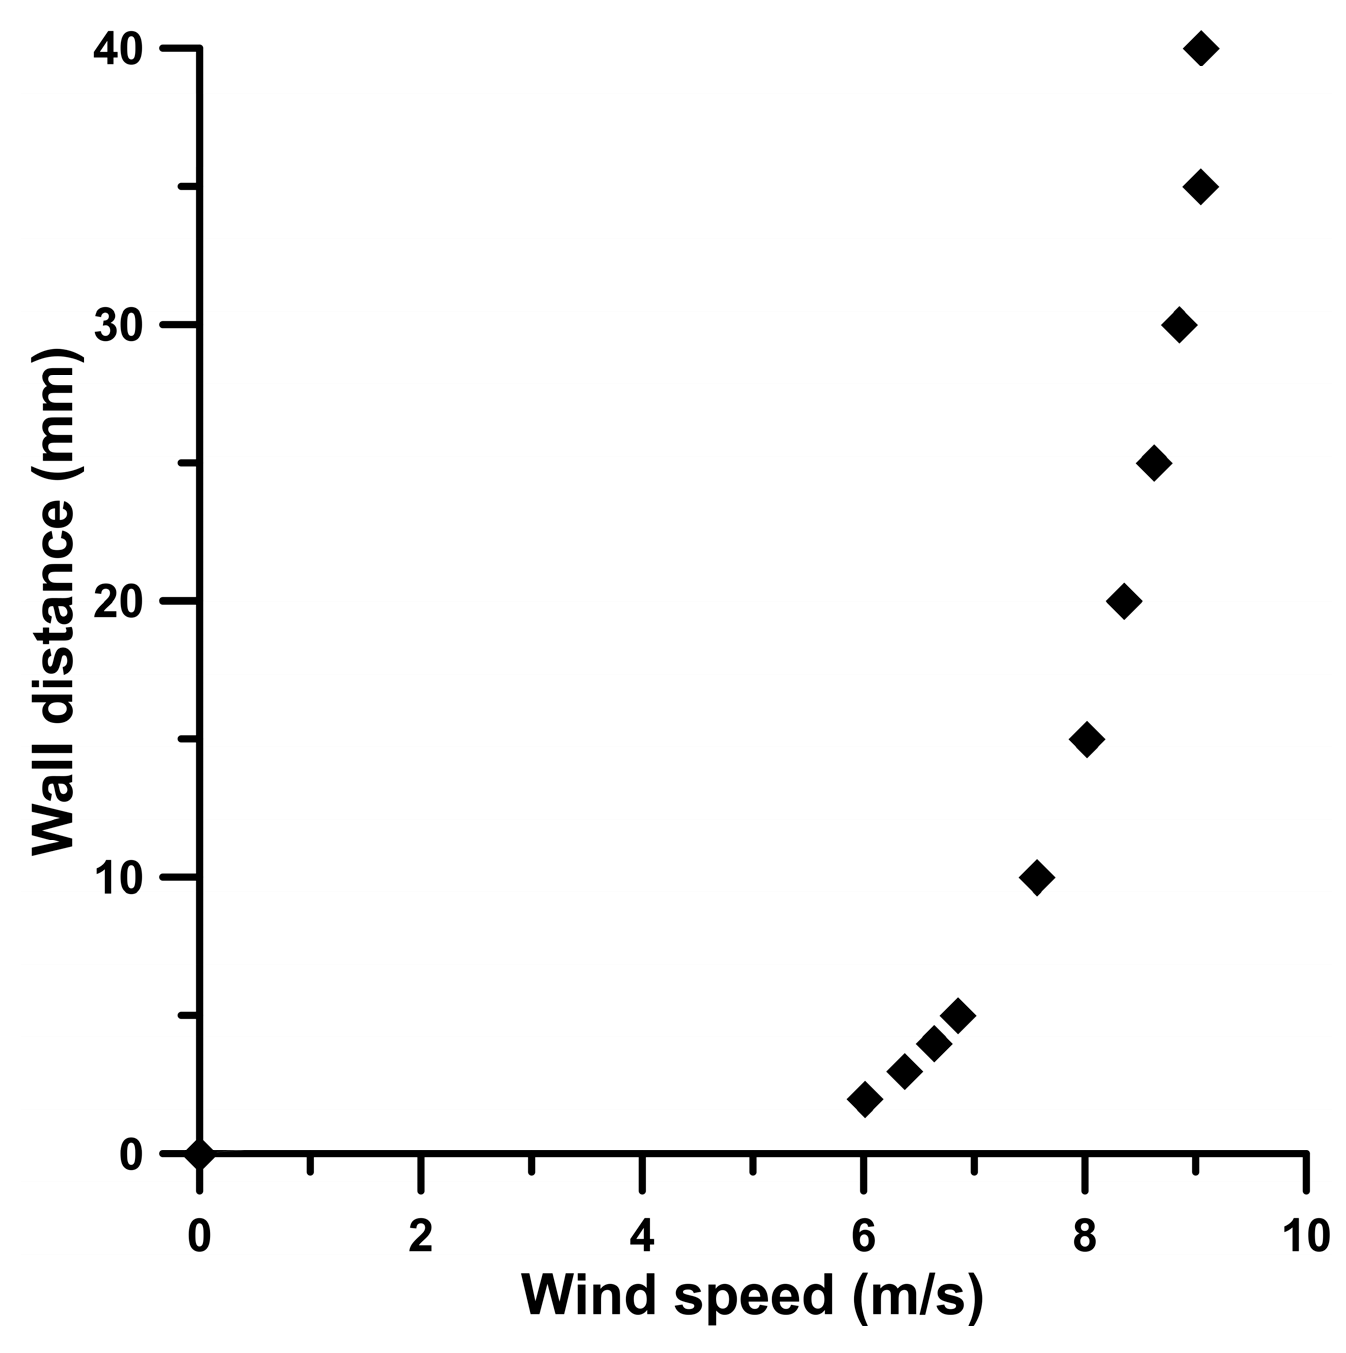
30]). The velocity boundary layer over the floor of the wind tunnel, measured at the mid-length of the test section where the model was placed, is shown in
Figure 4. Measurements were taken using a Pitot–static tube with an external diameter of 2 mm at the highest examined free-stream speed of 9.04 m/s. The boundary layer thickness for the lowest wind speed (4 m/s) is estimated at 46.5 mm, calculated using the 1/7th power law for turbulent flow. This is comparable to the 40 mm thickness observed at 9.04 m/s. Consequently, the air velocity reaches its free-stream value within 46 mm from the tunnel’s bottom surface in all examined cases. Given that the window opening extends vertically from 10 mm to 70 mm, and the center of the catcher’s opening is positioned at 176.5 mm (see
Figure 2), the vertical variation in inlet velocity across these openings is mild.
Five different orientations of the model relative to the incoming free stream were investigated—0° (head-on wind, normal to the catcher’s opening, see also
Figure 1), 45°, 90°, 135°, and 180° (opening in the lee side of the catcher’s shaft)—and five free-stream velocities: 4.04 m/s, 5.71 m/s, 8.08 m/s, and 9.04 m/s. The airflow was regulated by adjusting the rotational speed of the wind tunnel’s fan motor and was measured using a Pitot-Static tube located at the entrance of the test section. The dynamic pressure fluctuations of the free stream were within ±1% of the mean and the free stream temperature during testing was 19 °C, with a maximum variation of 0.5 °C.
The blockage ratio (projected model area to the cross sectional area of the wind tunnel) took a maximum value of 23.66% (at 90° model orientation), causing an increase in the free stream velocity of 0.25
0.2366 = 5.9% according to Barlow et al. [
31] (p. 374, Equation 10.22).
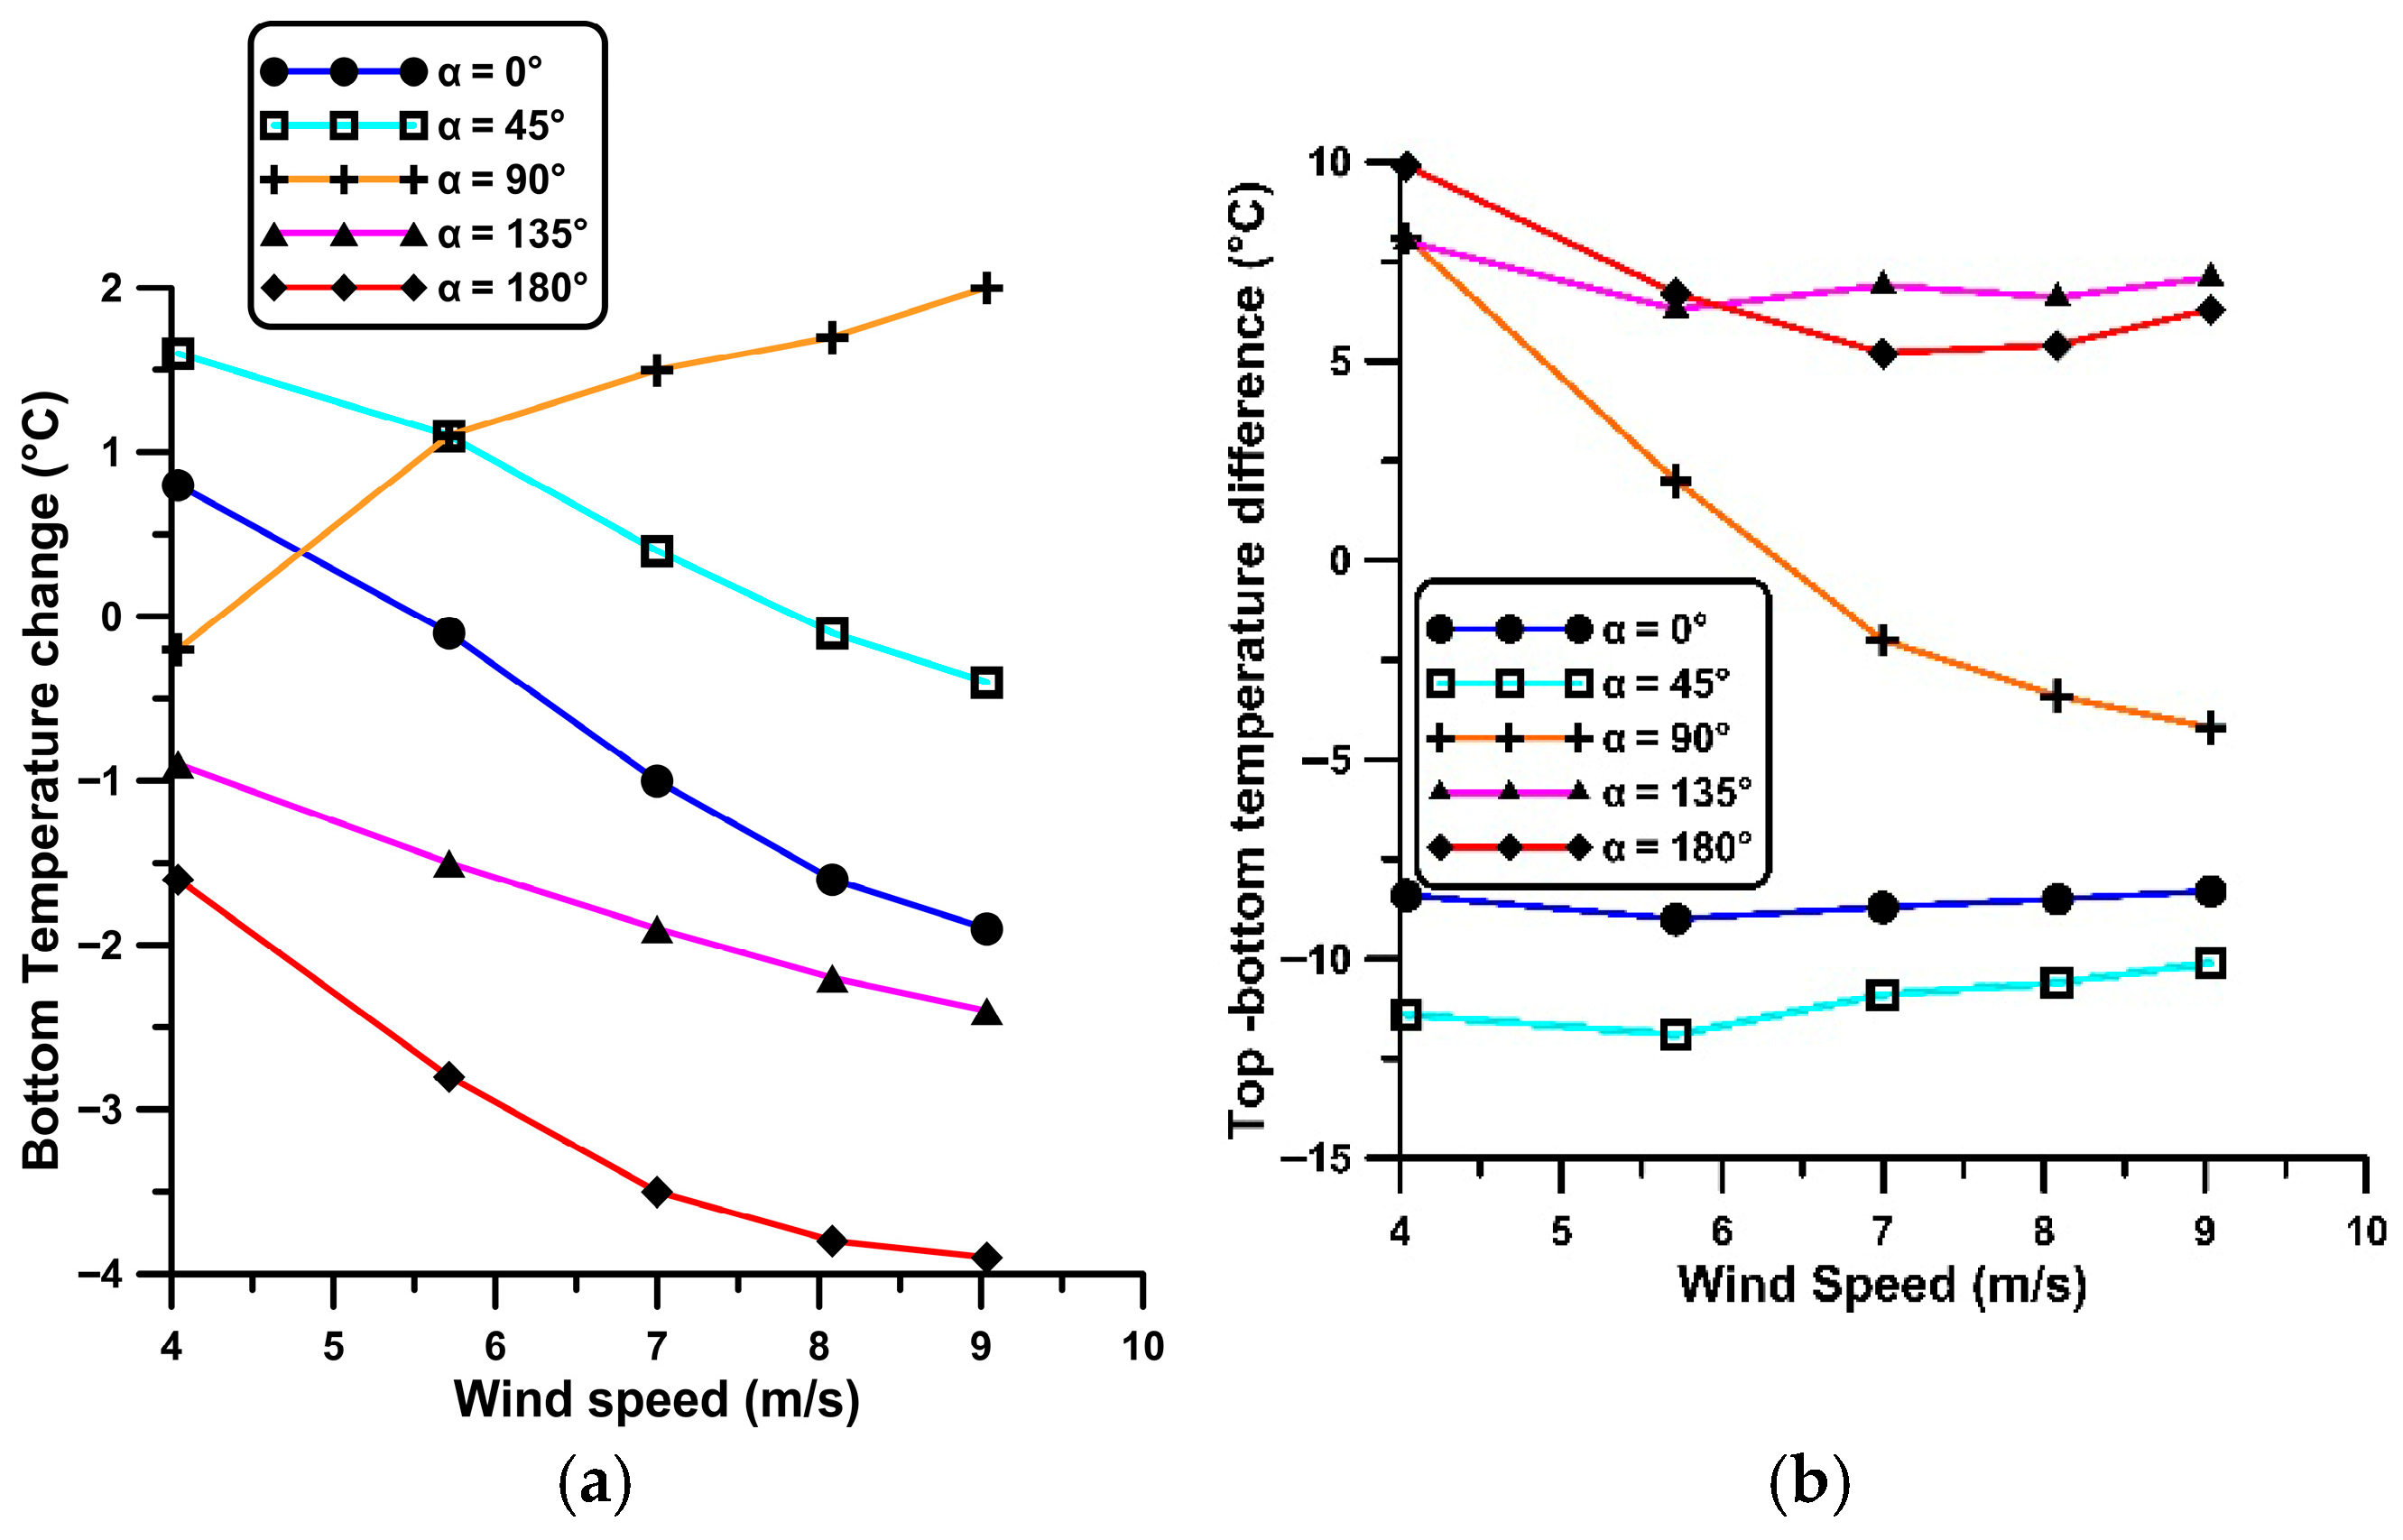
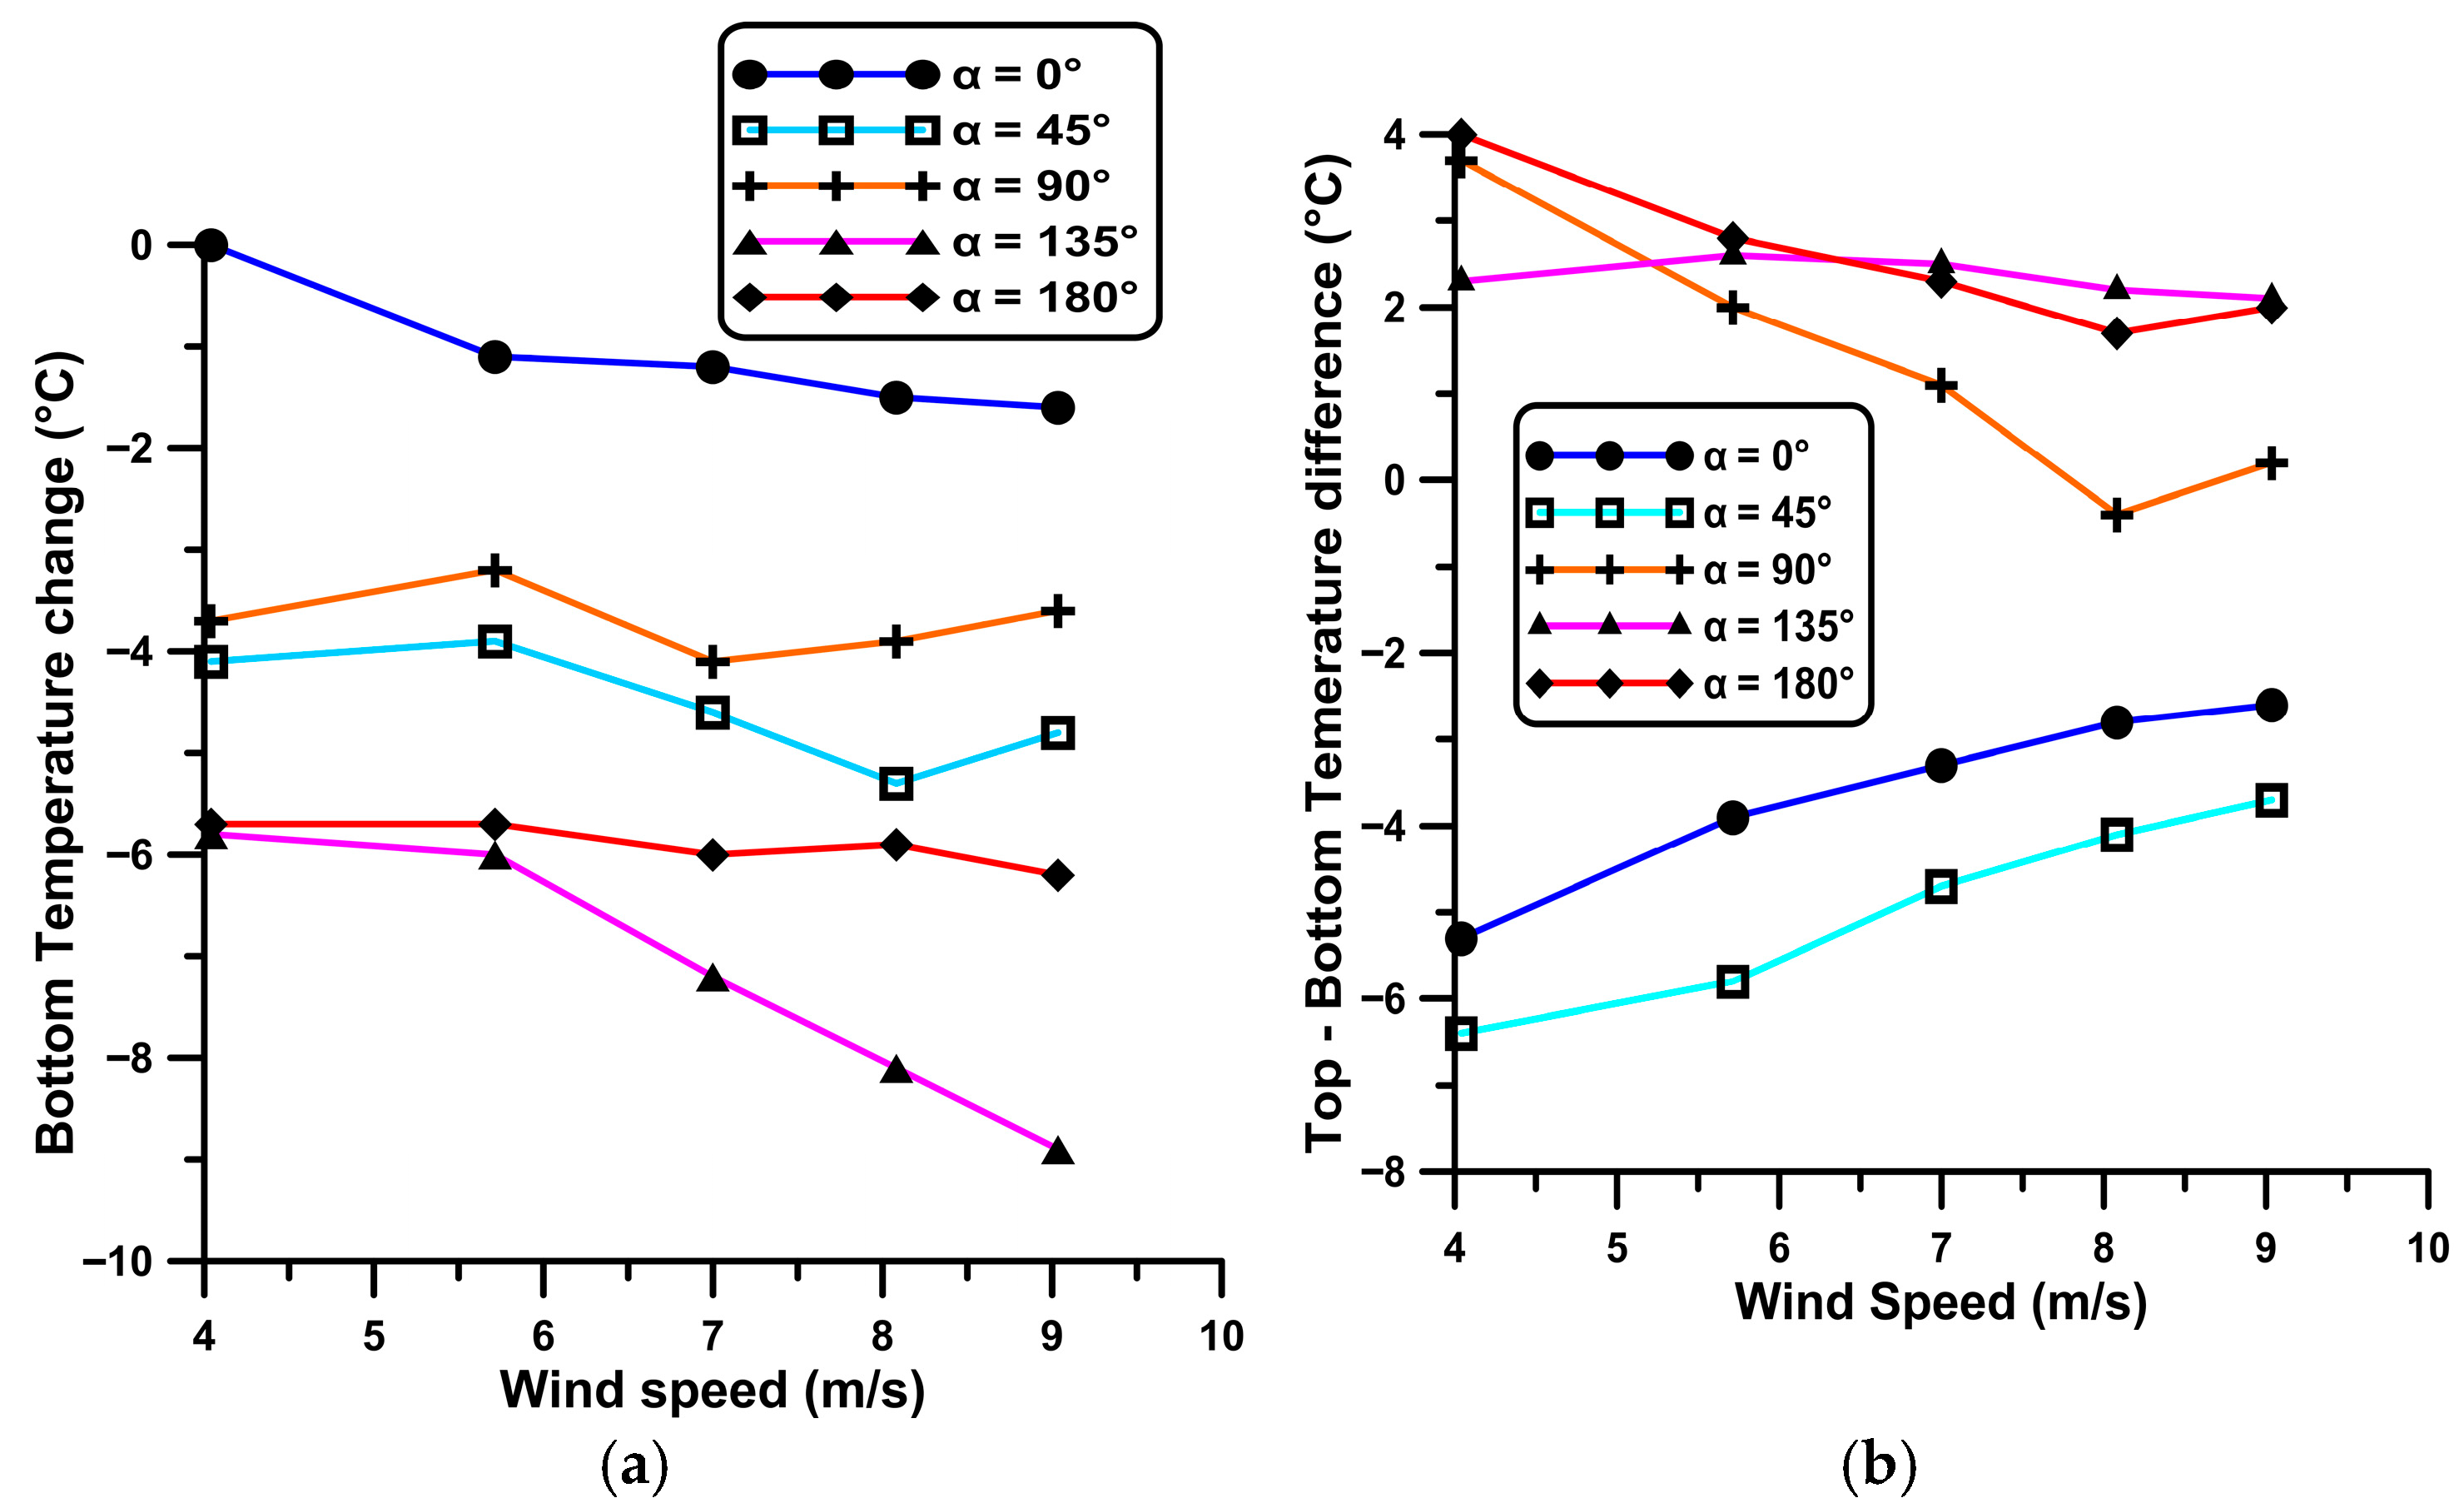
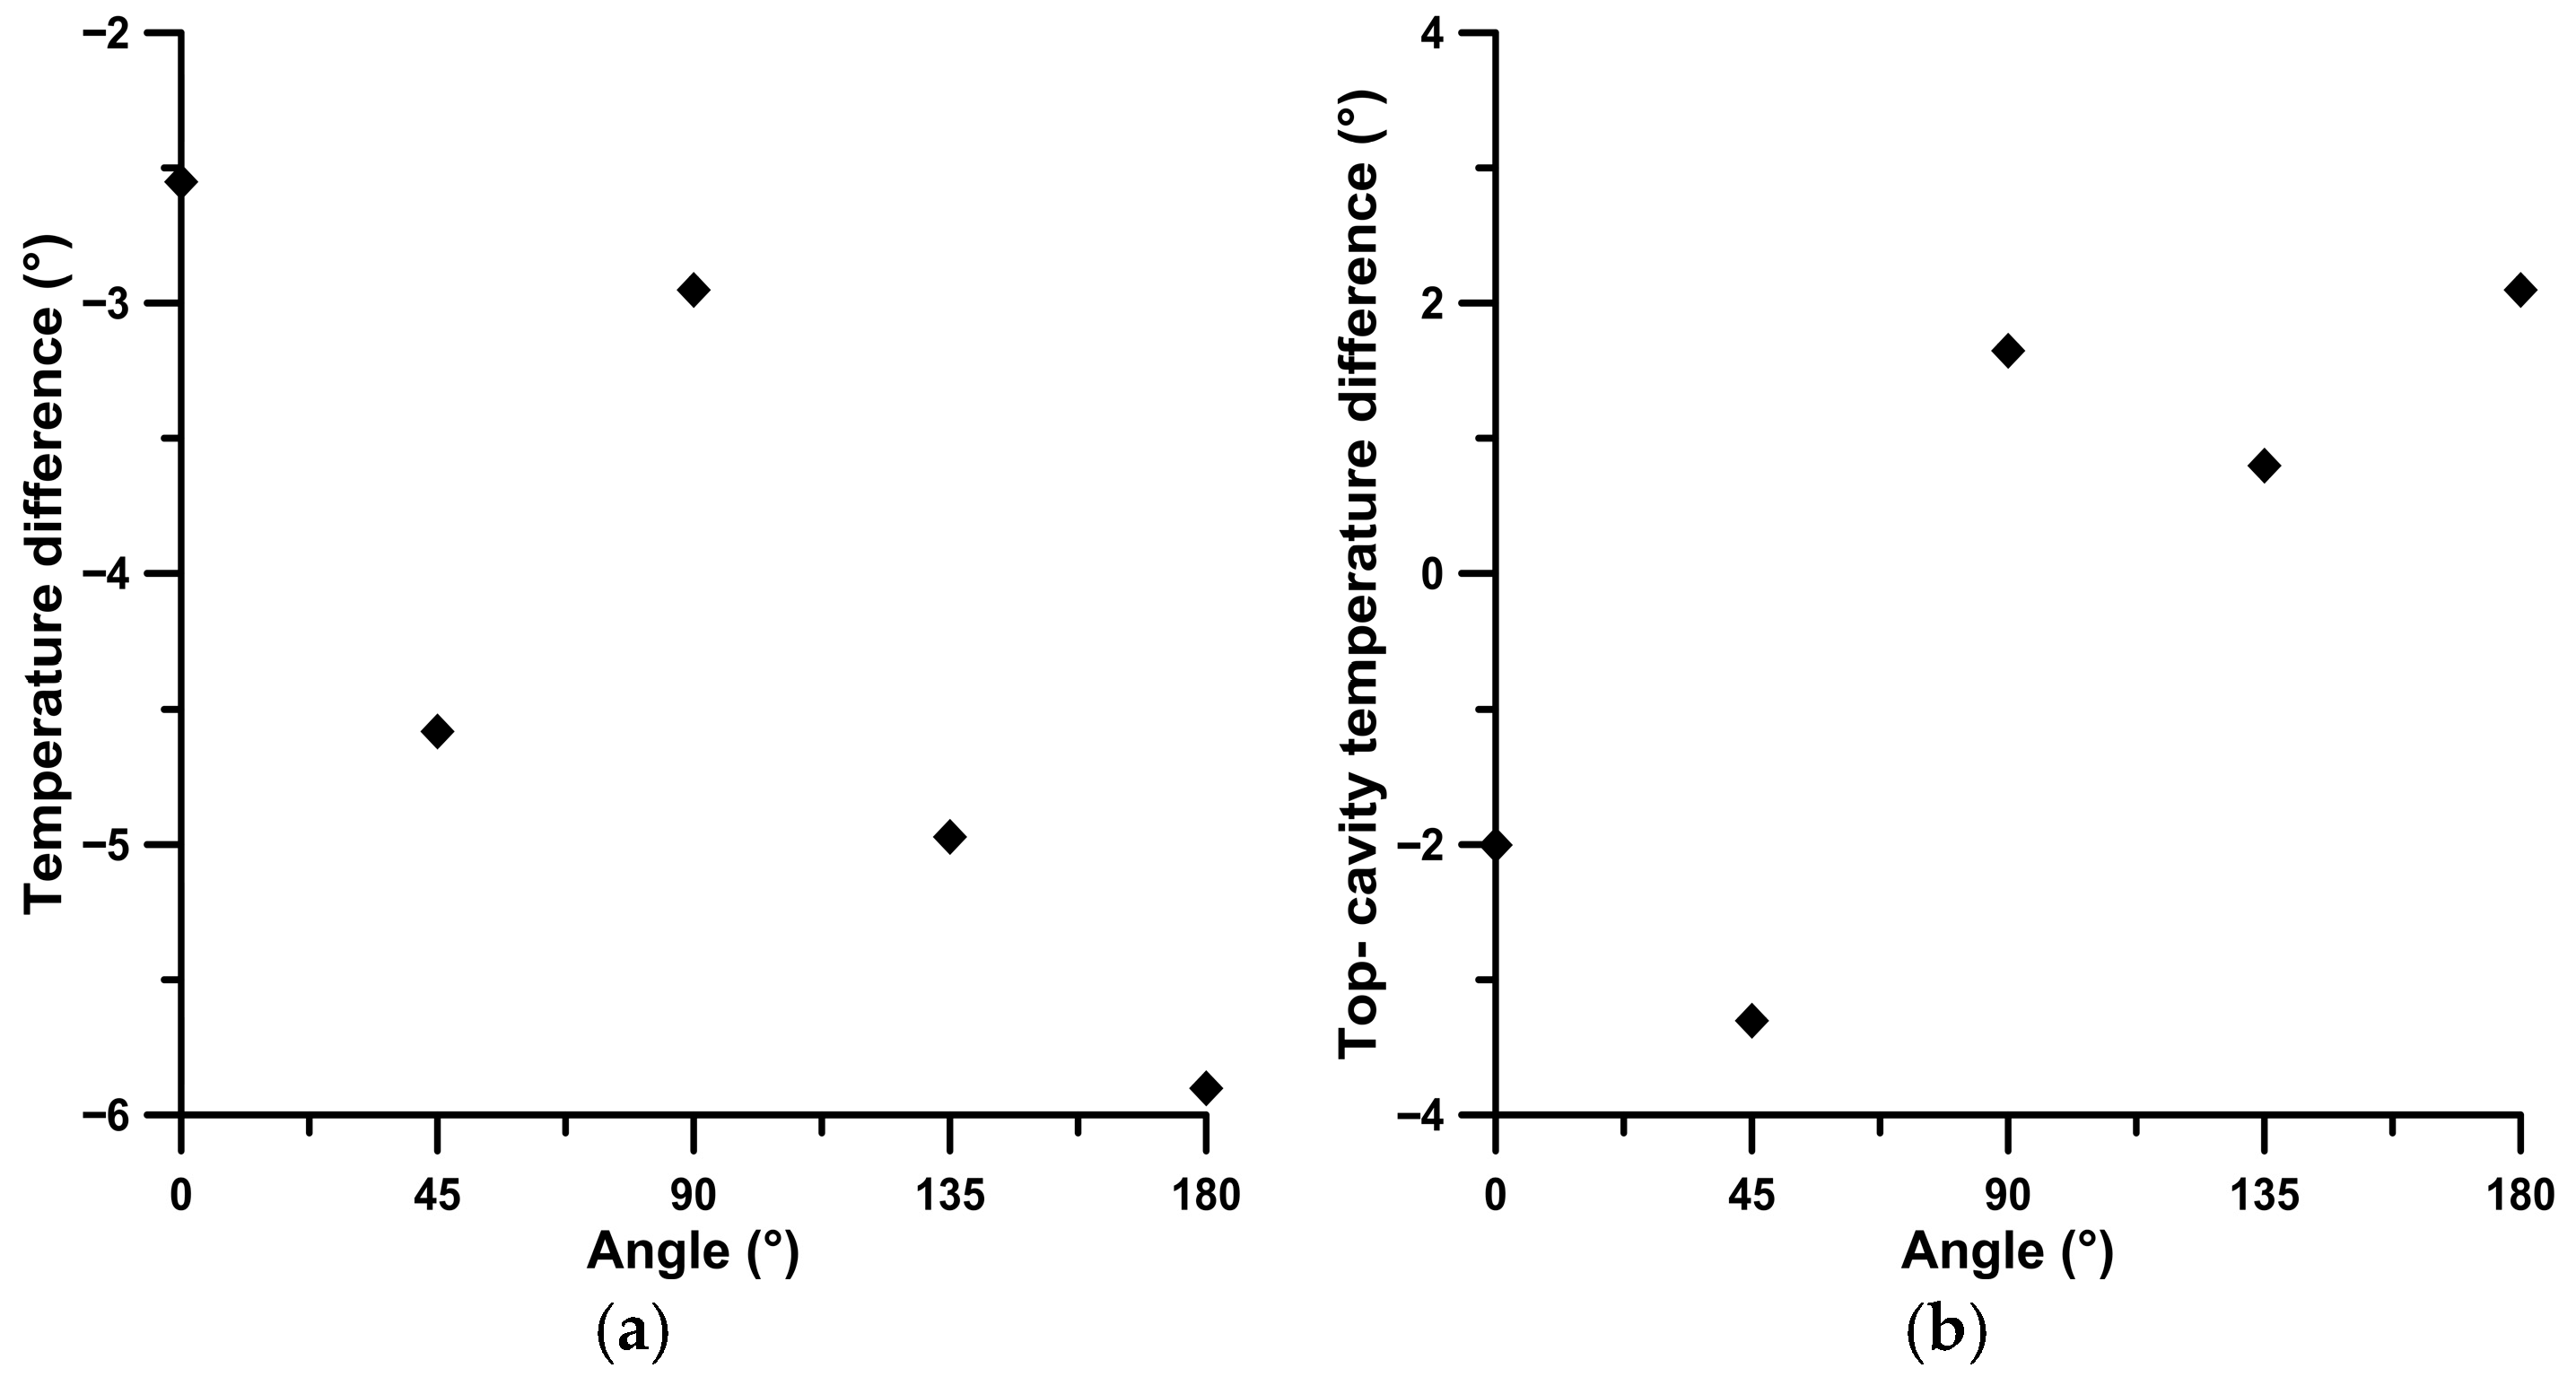
For each combination of model orientation and free-stream velocity, two configurations were tested—one with the cavity at its back side open and the other being closed—simulating the case of a window at the back side of a building being open and closed, respectively. In total, 50 tests were conducted. For each case, the resistors were connected to the power source, and once the two temperatures, T1 (at the catcher’s opening) and T2 (at the middle of the cavity), were at 42 °C and 26 °C, respectively, with a deviation of 0.5 °C, the wind tunnel was turned on. After two minutes of airflow, the two temperatures were recorded. This approach enabled the assessment of the wind catcher’s cooling performance by evaluating the temperature change at the floor level (final T2 temperature minus initial T2 temperature), so that essentially cooling referred to a negative T2 temperature change. An estimate of the vertical temperature gradient was also found based on the temperature difference T1–T2 at the end of the 2 min interval. The experiments for each configuration were repeated to verify the consistency of the results. The repeated measurements showed temperature variations of no more than 0.5 °C, indicating good repeatability.
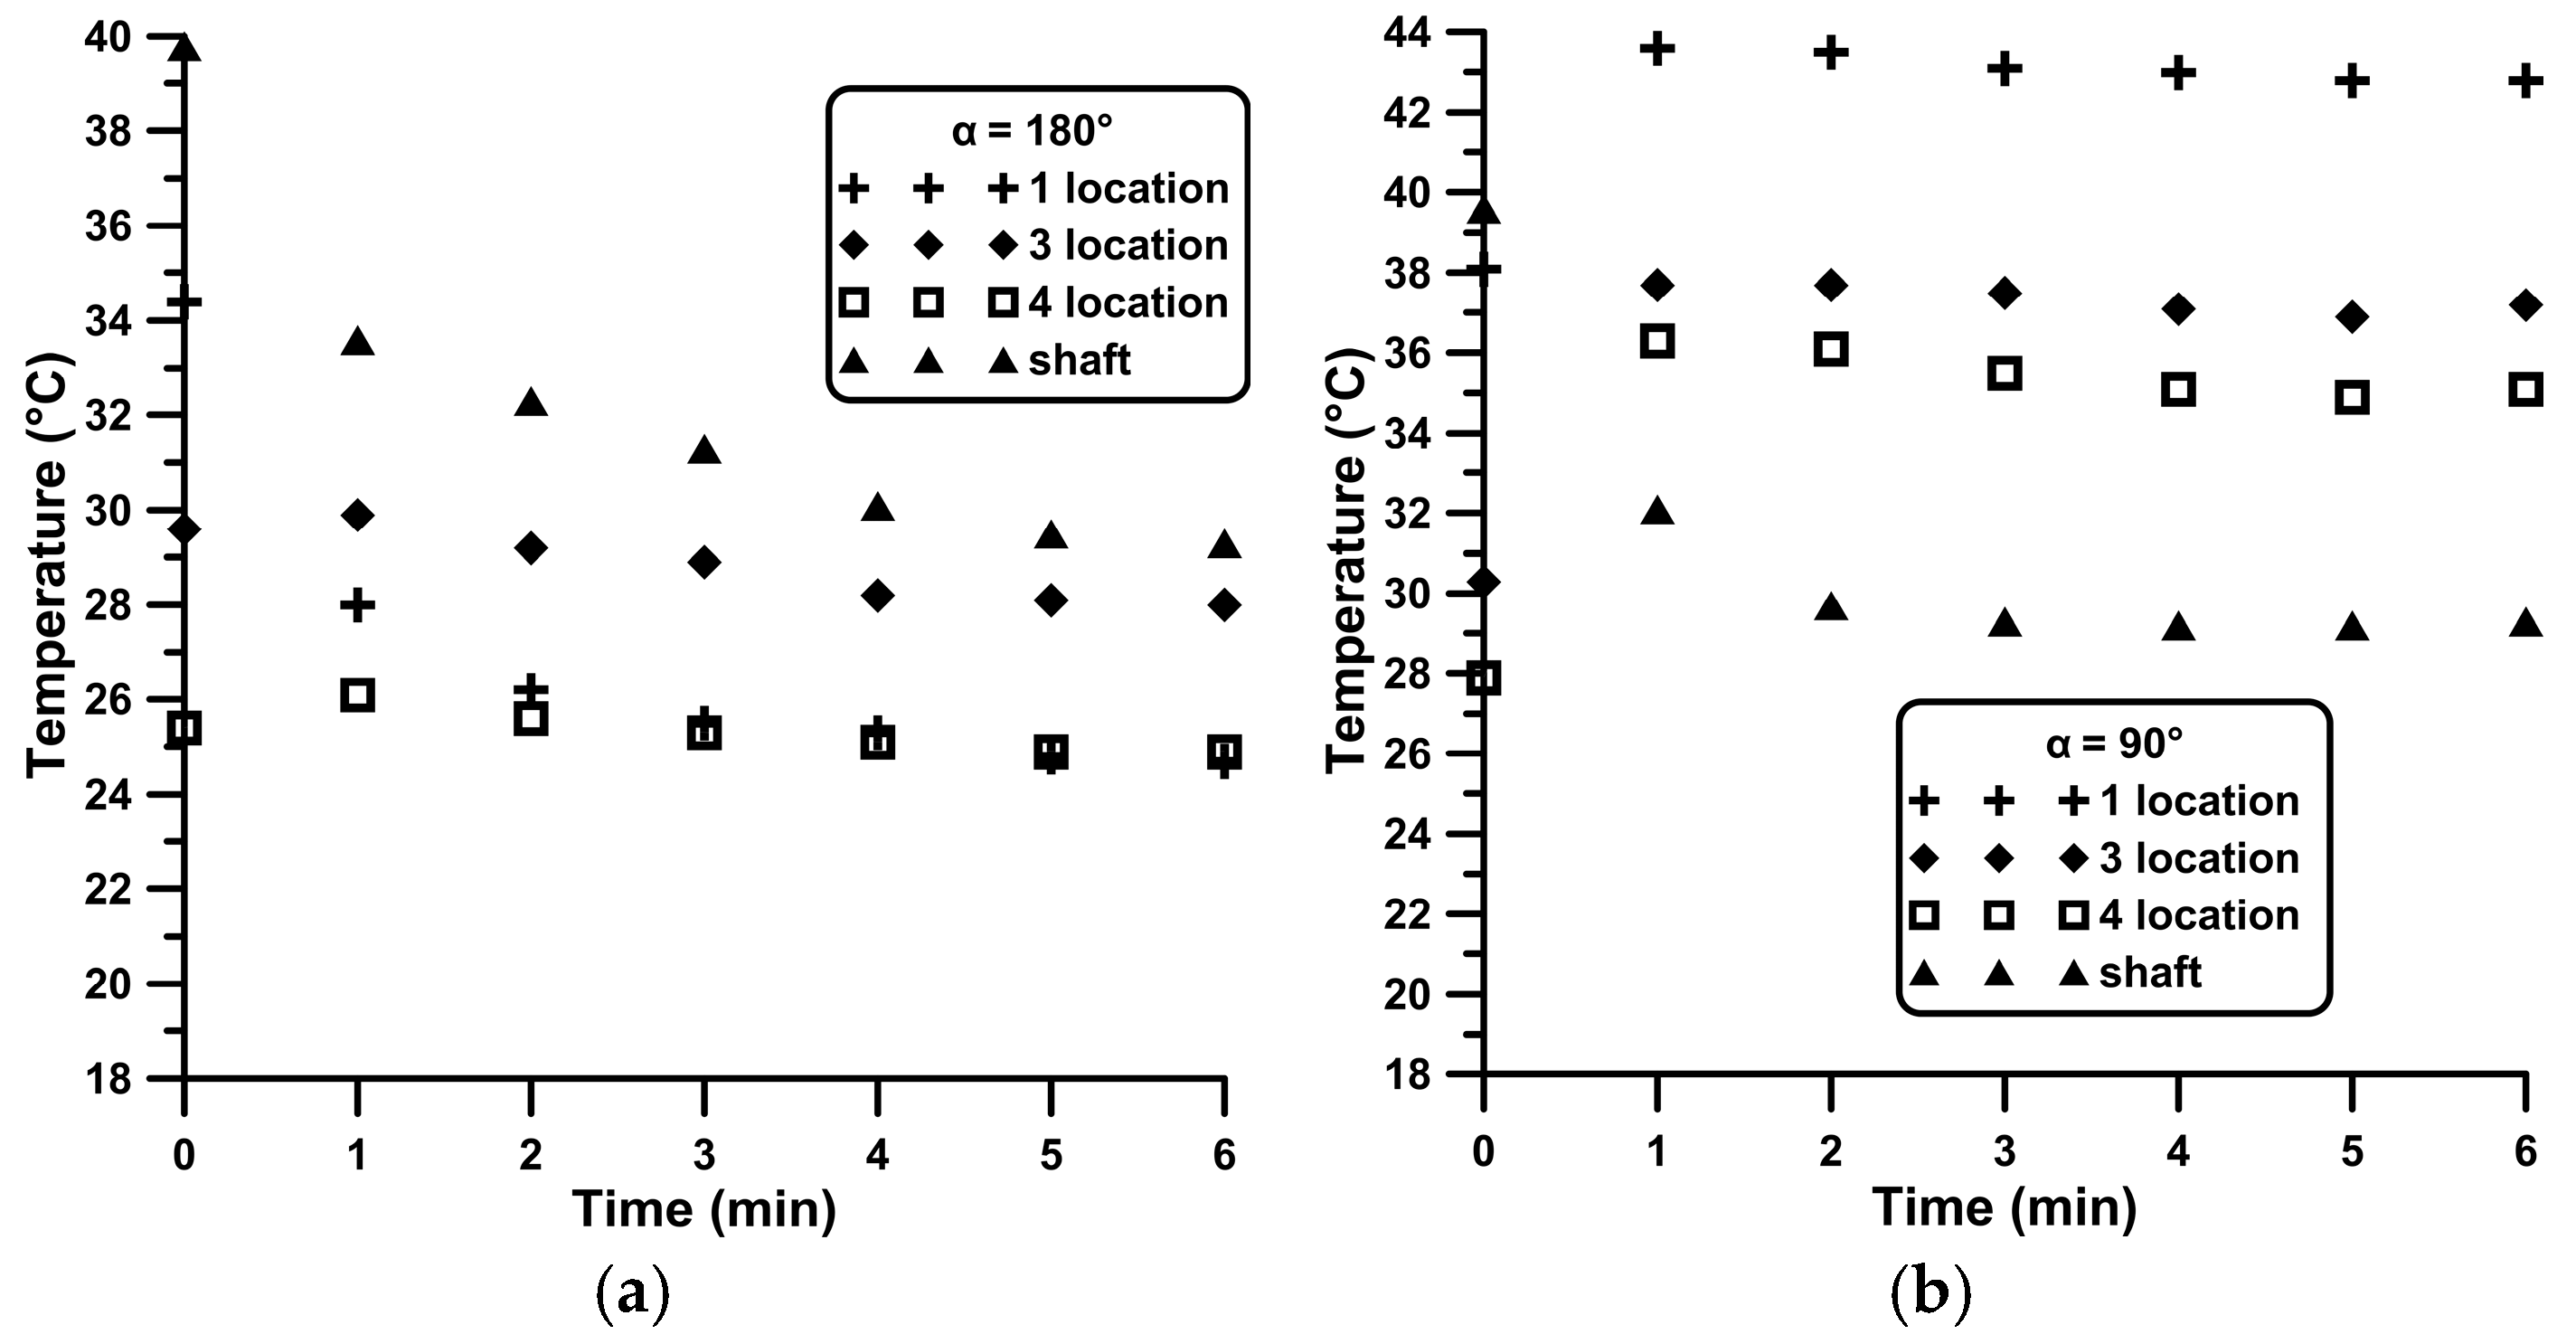
In the configuration utilizing five thermocouples, only the highest wind speed of 9.04 m/s was examined. In this case, the wind tunnel was turned on once the catcher shaft temperature reached 39 °C ± 0.5 °C. Typically, a vertical thermal gradient was observed, with temperatures at the ceiling (sensors 1 and 2) consistently exceeding those at the floor (sensors 4 and 5). Thermal symmetry was maintained relative to the vertical centerline of the window for the 0° and 180° orientations, for which the maximum temperature deviation between symmetrical sensors (1 vs. 2 and 4 vs. 5) was 0.3 °C. In other orientations, this difference increased to a maximum of 3 °C. Regarding temporal stability, the system reached a steady state following a transient period of about 5 min.
4. Discussion
The model examined in this study represents the simplest form of a wind catcher, featuring only a single opening and lacking internal partitions within the vertical shaft. However, wind catchers typically include multiple openings and various internal partitions, which facilitate airflow by allowing fresh air to enter through one port and exit through another. This detail plays a significant role in their thermal performance. Of course, one-sided wind catchers do exist, although this is not a rule (Montazeri [
10]). In the current study, for the closed-cavity configuration, the optimal cooling effect was observed when the wind catcher opening was positioned in the wake of the structure. In this scenario, the lower local external pressure effectively drew out the interior air, enhancing ventilation mainly through a suction mechanism. Similar observation was performed in Montazeri & Azizian [
8], in which the orientation of α = 180° was found to be working effectively, with the catcher functioning as a suction device. Natural convection, in this case, plays a smaller role. In fact, at α = 180°, in the closed-cavity case, the removed heat due to natural convection was estimated to be about 15% of the total heat load in the present study. More particularly, the removed heat by convection from the vertical walls of the wind catcher shaft, is given by the following formula:
where the exposed area
A = 0.038
3
0.08 = 0.009 m
2, considering that the three heated walls of 0.038 m width are 0.08 m long (as the part of the catcher’s opening is excluded). The average temperature of the wall where the heaters were installed was
= 90 °C and the mean temperature of the air
= 27.35 °C (based on the top and bottom air temperatures) at α = 180°. The heat transfer coefficient was calculated using the formula for vertical plates for natural convection (Table 9.1, Equation (9–19), Cengel, and Ghajar [
29]), assuming a minimal interaction between the boundary layers of the three walls:
where the Rayleigh number
and the Grashof number is
β, where
= 0.08 m (the length of each of the four sides of the shaft),
β is the air thermal expansion coefficient, and
is the air kinematic viscosity at the average temperature (
= 58.67 °C. Based on the above,
and the heat transfer coefficient
7.67 W/m
2·K. Therefore, based on (2), the heat removed by natural convection is 4.38 W or 14.60% of the total heat load. It is noted that the heat transfer coefficient is weakly dependent on the model size as well as the variation in the temperature difference (
according to (3). In computational and experimental work by Carreto-Hernandez et al. [
32], where a spray humidification system was applied in a 3.85 m high wind tower, the Grashof number varied from 10
9 to 10
10 and the Nusselt number had values up to 200 (Figure 12 in [
32]). The latter values, much higher compared to this work are mainly due to the small scale of the model. However, the heat transfer coefficient values in [
32] are comparable with the present ones, not exceeding 11 W/m
2·K (Figure 15 in [
32]).
It is also important to highlight that the incoming air stream used in the experiments had a temperature of 19 °C. As reported in Chohan et al. [
14], the optimal performance of wind catchers in the UAE occurs when ambient nighttime temperatures range between 16 °C and 24 °C, causing a maximum interior temperature reduction of 7 °C. In comparison, the current study demonstrated a maximum temperature reduction of 4 °C in the closed-cavity configuration and up to 6 °C in the open-cavity case.
It should be noted that in all fifty cases examined, the temperatures at the moment the wind tunnel was activated were
T1 = 42 °C and
T2 = 26 °C, with a maximum deviation of 0.5 °C. The higher value of
T1 compared to
T2 was due to the closer proximity of the thermocouple to the three resistors in the catcher’s shaft. The initial value of
T2 was selected to be higher than the temperature of the free stream. Although these initial temperatures were selected arbitrarily, they were kept constant across all tests to ensure meaningful comparisons. The conclusions in this study are drawn based on temperature measurements taken after a 2 min operation period of the wind tunnel. When this period was increased to 4 min, the trends remained the same. Furthermore, when the location of temperature measurement was changed to the middle of the cavity (from the bottom wall to mid-height) for the highest wind speed case (9.04 m/s), the trends remained the same. As it is shown in the computational work of Foroozesh et al. [
16],
Figure 3, the temperature field is quite uniform from the middle of the cavity till its exit, explaining why the change of the location did not alter the results. Moreover, the spatial temperature distribution was also evaluated for the highest examined free-stream velocity of 9 m/s by taking measurements at five points along a vertical cross-section of the cavity located 20 mm downstream of the resistors. In the open-cavity configuration, the temperature field remained quite uniform, with point-to-point variations not exceeding 2 °C. Conversely, the closed-cavity configuration exhibited temperature non-uniformities up to 5 °C, particularly at the 90° orientation. Despite these localized variations, the spatial mean temperature yielded conclusions regarding cooling performance consistent with single-sensor data. Moreover, it was clarified that for the open-cavity case, the 180° orientation corresponds to the maximum cooling performance, instead of the 135° one. The temperature non-uniformities have been predicted by several published works (Nejat et al. [
33]; Sangdeh & Nasrollahi [
34]; Shayegani et al. [
35]), and future work aims to expand the number of temperature measurement points, enabling a more accurate assessment of the wind catcher’s thermal performance.