1. Introduction
The stability of seed traits across diverse environments is crucial for developing reliable, high-performing cultivars. Genotypes exhibiting lower sensitivity to environmental variation tend to show more consistent trait expression, translating into predictable agronomic performance and quality outcomes [
1,
2]. Low variability is therefore a key criterion in stability assessment, and breeders aim to identify cultivars that deliver reproducible performance across multiple locations and production conditions [
3,
4].
A variety of statistical approaches have been proposed to assess stability, including the mean-to-standard deviation ratio [
5,
6], regression-based parameters, and variance-based indices [
1,
7]. In contemporary breeding research, multi-environment trials (METs), often combined with approaches such as AMMI and GGE biplot analyses, are widely used to evaluate adaptability and stability across heterogeneous environments [
8,
9,
10]. These methods facilitate the identification of genotypes that maintain consistent performance or exhibit specific adaptation patterns.
Recent studies demonstrate the applicability of stability assessment across crops. Faba beans have been evaluated using the Stability Index to identify genotypes with consistent performance [
11], while peas and common vetch have been assessed for seed quality stability under different production systems using a combination of stability indices and multivariate approaches [
12]. Similarly, maize seed quality traits, including protein and oil content, have been examined using Stability Index-based and multi-environment analyses [
13]. Other crops, such as proso millet [
14], Bambara groundnut [
15], wheat [
16], and sorghum [
17], have also been widely investigated for genotype × environment (G × E) interactions and stability.
Seed quality traits, including protein, oil, and fiber content, are of increasing importance in cotton due to their nutritional and industrial value. Bolek et al. [
18] reported significant variation in protein and oil content among cotton genotypes, while Malalha et al. [
19] demonstrated pronounced G × E effects on cotton seed oil content across environments. Hussain et al. [
20] further highlighted the influence of environmental variability on seed composition traits in cereal crops. These findings underscore the importance of integrating seed quality evaluation with stability metrics when assessing cultivar performance.
Despite extensive research on cotton fiber traits, the stability of seed quality traits in commercial upland cotton cultivars cultivated under Greek agro-ecological conditions remains largely unexplored. The objective of this study was to evaluate the stability of major cotton seed quality traits in commercial upland cotton cultivars grown across representative cotton-producing regions of Greece, using the Stability Index in combination with multi-environment field data. Additionally, trait relationships were explored through correlation analysis and principal component analysis to provide a descriptive assessment of trait consistency and trade-offs across environments. We hypothesized that seed quality traits differ in their stability across environments and cultivars, and that multi-environment evaluation would reveal trait-specific responses and trade-offs rather than uniform stability patterns.
2. Materials and Methods
2.1. The Plant Material and Experimental Design
The genetic material consisted of five commercial upland cotton cultivars: DP-332 and DP-377 (proprietary of Monsanto Co., St. Louis, MO, USA), ST-402 (proprietary of Pioneer Hi-Bred, Johnston, IA, USA), and Celia and Elsa (proprietary of Bayer Crop Science, St. Louis, MO, USA). These cultivars were evaluated for seed quality traits across four major cotton-growing regions in Greece: Thessaly, Macedonia, Thrace, and Sterea Ellas (Central Greece). The five upland cotton cultivars included in the study were selected based on their prevalence in commercial cotton production within the surveyed regions at the time of sampling. These cultivars were among those most frequently cultivated in the study areas, allowing seed samples to be collected under real production conditions. The selection was not intended to represent specific agronomic advantages or performance rankings, but rather to reflect commonly grown commercial material. This approach ensured that the stability analysis was conducted on representative cultivars relevant to current cotton production systems.
In each region, which represents a distinct environmental condition, ten independent commercial fields per cultivar were sampled to represent prevailing production conditions (totaling 200 fields). The study was conducted under commercial farming conditions. Each field had an area greater than 1 ha, reflecting typical commercial-scale cotton production systems in Greece. Fields were managed according to standard local agronomic practices, including fertilization, irrigation, and pest control, as applied by local growers.
From each field, four independent cotton seed samples (approximately 1 kg each) were collected at commercial harvest maturity. The four samples per field were used to ensure representative sampling, and the mean value of the four subsamples was calculated and used for all subsequent laboratory and statistical analyses. Each field was considered as one experimental unit. The samples were ginned to separate the seeds from the fiber, and the resulting seeds were used for all laboratory analyses.
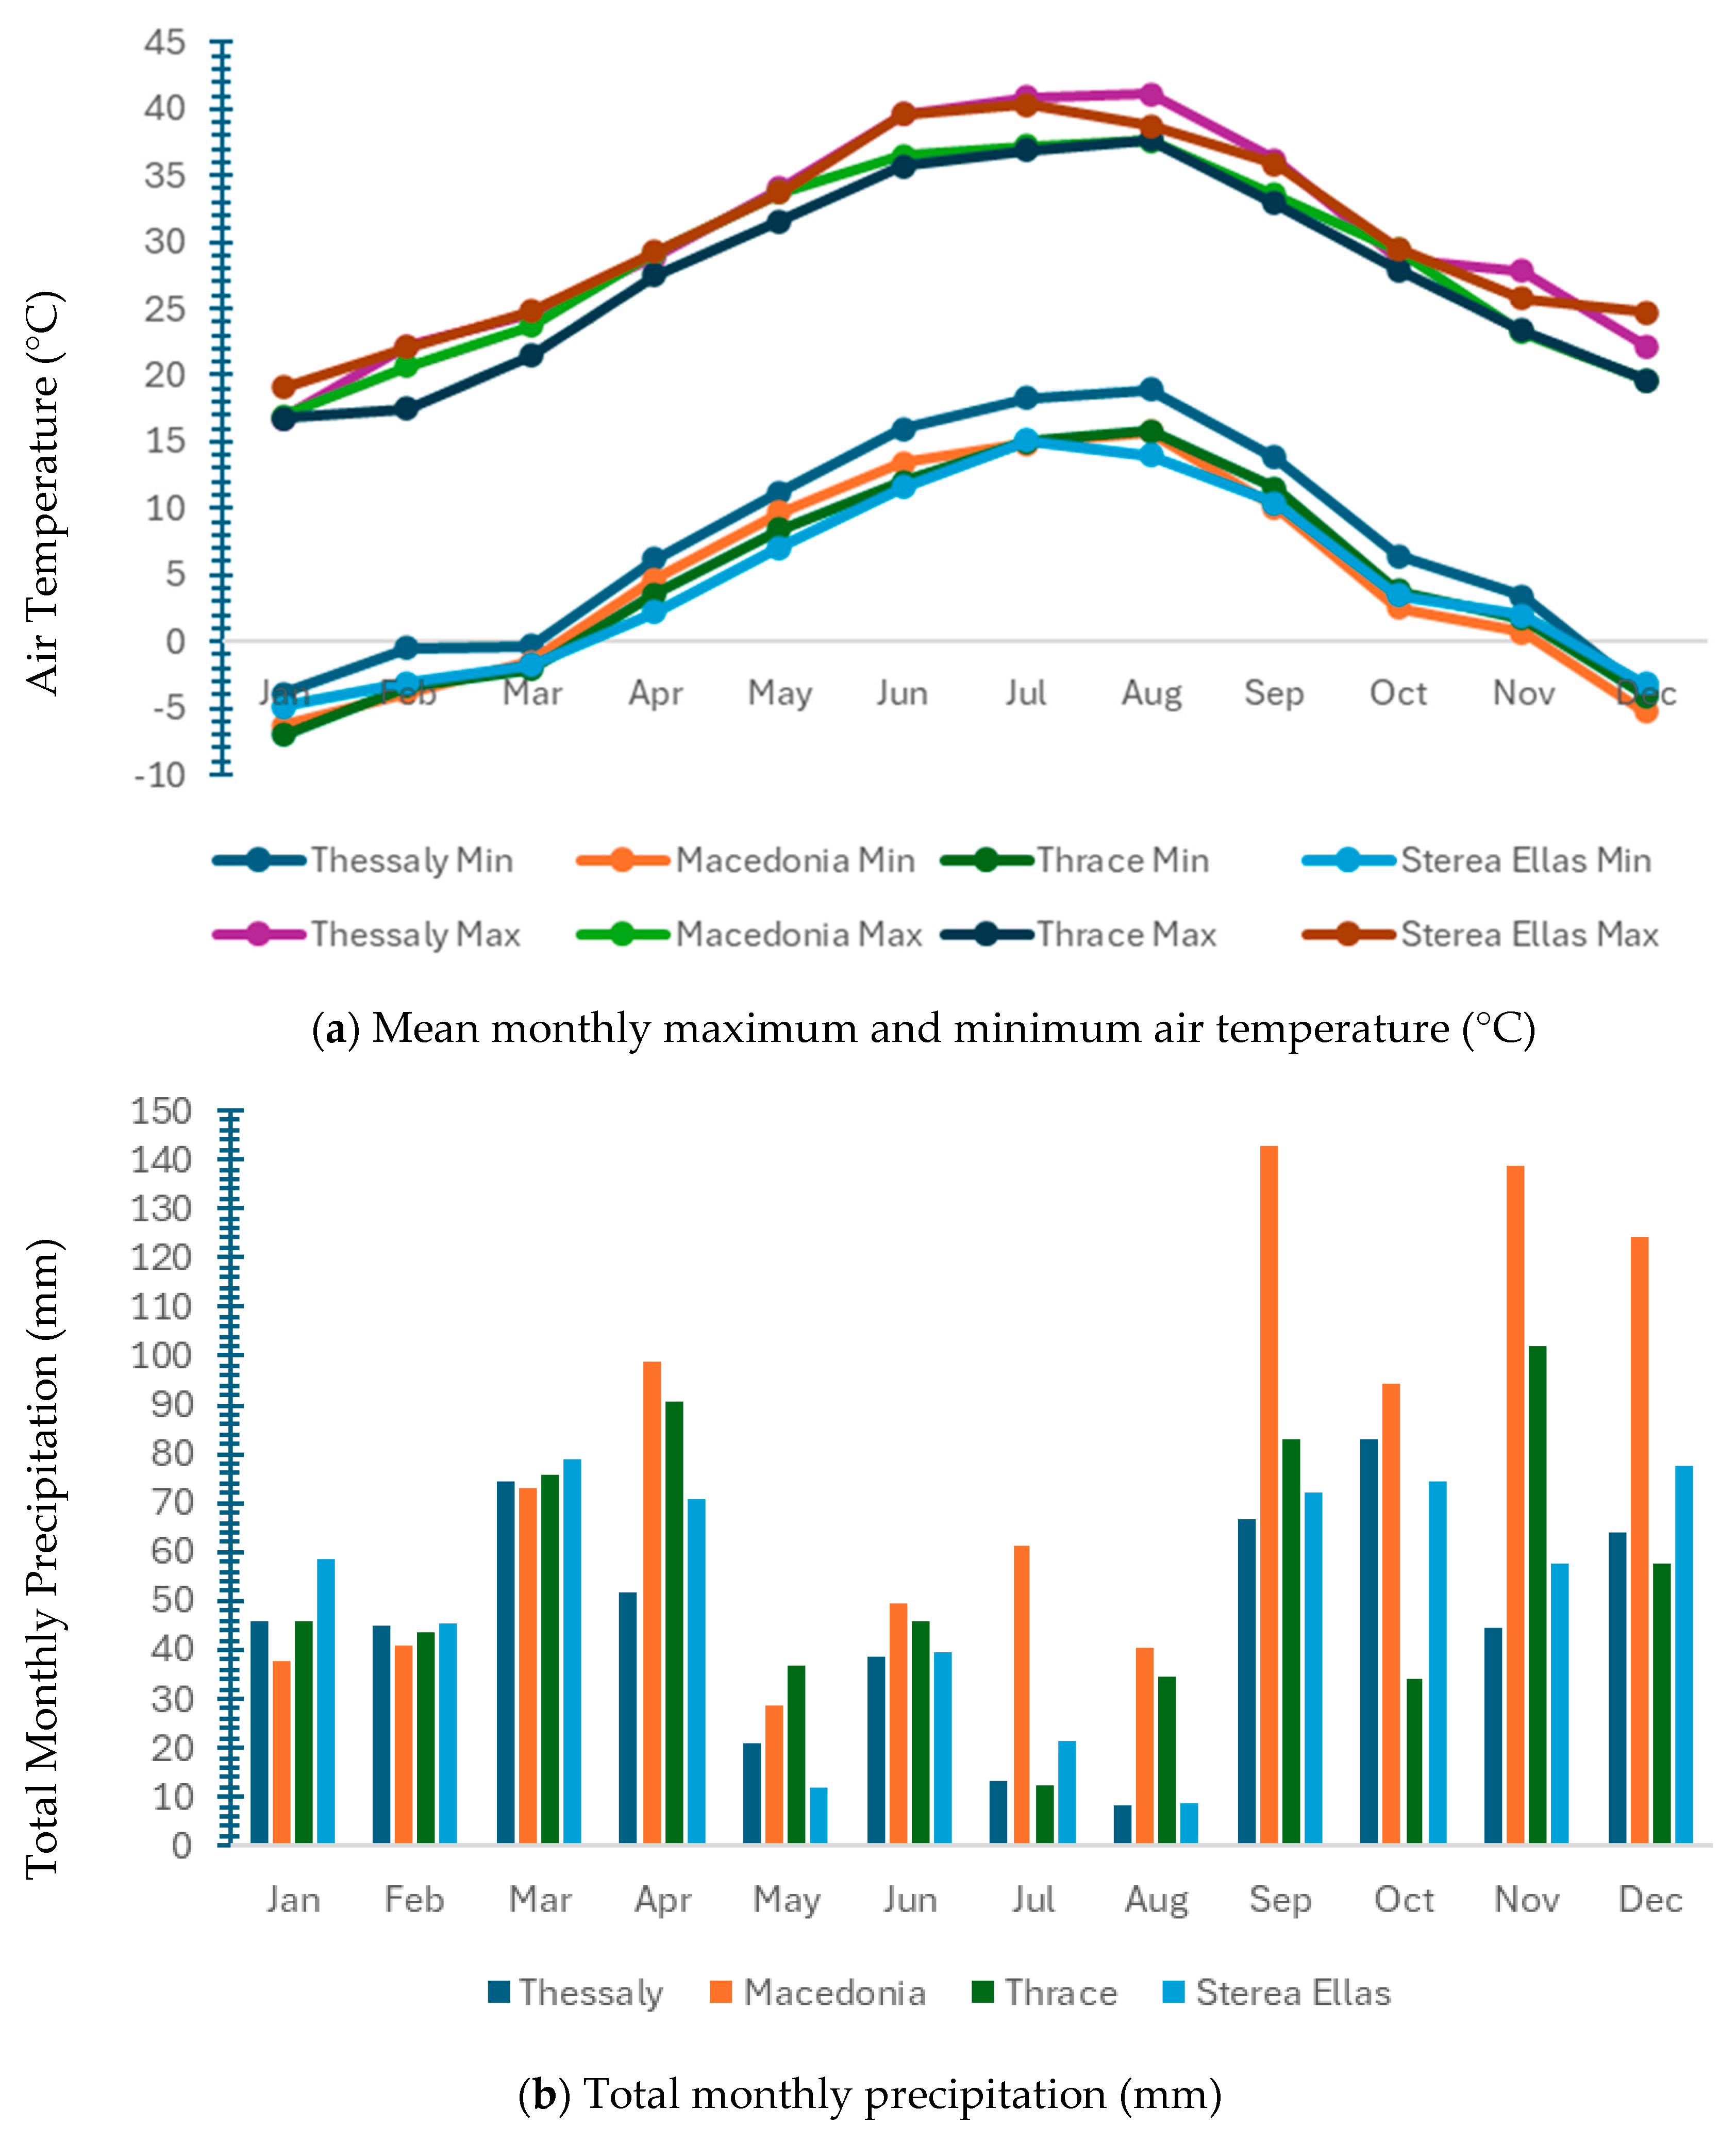
Environmental differences among the study regions were primarily driven by variations in temperature and rainfall patterns. These differences are evident in the monthly extremes, as reflected by minimum and maximum air temperatures (
Figure 1a), as well as in the distribution of total monthly precipitation (
Figure 1b). Such climatic variability likely influences the environmental conditions experienced in each region.
In addition to climatic variability, soil characteristics contribute to the environmental conditions experienced by cotton crops. According to regional soil maps and internationally recognized classifications, agricultural soils in the studied regions are predominantly associated with fluvisols and cambisols, with the occurrence of luvisols and calcisols depending on local geomorphology and parent material. Soil classification is provided at the regional scale based on the World Reference Base for Soil Resources (WRB), as no site-specific soil analyses were conducted in the present study [
21,
22].
The four study regions represent major cotton-producing areas of Greece and were considered as distinct environments based on their contrasting climatic conditions. Climatic differentiation among the regions was mainly associated with differences in temperature extremes and precipitation patterns, as illustrated in
Figure 1.
Thessaly was characterized by higher summer maximum temperatures and comparatively lower precipitation during the growing season, whereas Macedonia exhibited lower minimum temperatures and increased rainfall, particularly during autumn and winter months. Thrace showed cooler temperature profiles and relatively higher precipitation during spring and autumn, while Sterea Ellas displayed intermediate temperature conditions with lower summer rainfall.
These consistent differences in temperature and precipitation regimes justify the treatment of the studied regions as distinct environments in the multi-environment analysis.
2.2. Seed Trait Measurements
Seed quality in cotton is commonly evaluated using basic compositional parameters such as 1000-seed weight, crude protein, oil, ash, crude fiber, and moisture content, as these traits are directly related to nutritional value, processing efficiency, storage behavior, and industrial utilization of cotton seed. These parameters provide a practical and widely applied basis for assessing seed quality across genotypes and environments. Seed traits were analyzed using standard laboratory protocols as follows: 1000-seed weight was determined by counting and weighing. Protein content was estimated via the Kjeldahl method (AOAC 984.13, 2005) [
23], oil content was measured by Soxhlet extraction (AOAC 920.39, 2005) [
23], ash content was determined by incineration at 600 °C (AOAC 942.05, 2005) [
23], and crude fiber was determined according to AOAC 978.10 (2005) [
23]; although this method does not quantify total dietary fiber, that trait remains widely used for comparative evaluation of cotton seed and feed-related materials, and moisture content was assessed by oven drying at 105 °C to constant weight (AOAC 925.10, 2005) [
23]. All laboratory analyses were conducted at the Laboratory of Animal Technology, University of Thessaly.
2.3. Statistical Analysis
A combined analysis of variance (ANOVA) across environments was conducted to evaluate the effects of environment, genotype, and their interaction on seed quality traits. The four geographical regions were considered as environments, and the five cotton cultivars as genotypes.
Within each environment, ten independent fields per genotype were sampled and treated as replications, with each field constituting the experimental unit. Seed quality traits were measured on four subsamples per field, and the mean value per field was used for all statistical analyses.
In the combined ANOVA, environments and genotypes were considered fixed effects, while replications were treated as random effects nested within genotype × environment combinations, following Steel et al. [
24]. The sources of variation included environment (E), replications within environments, genotype (G), and the genotype × environment interaction (G × E).
Significance of effects was assessed at p ≤ 0.05. When a significant genotype × environment interaction was detected, trait stability across environments was further evaluated using the Stability Index as a descriptive measure of consistency. Statistical analyses were performed using IBM SPSS Statistics version 29 (IBM Corp., Armonk, NY, USA).
Relationships among seed traits were evaluated using Pearson’s correlation coefficients. Principal component analysis (PCA) was applied as an exploratory multivariate tool to examine relationships among traits and to visualize overall variability patterns across genotypes and environments. PCA was used for descriptive purposes and not for genotype discrimination. Both correlation analysis and PCA were performed using JMP 18 (Statistical Discovery LLC, Cary, NC, USA). Statistical significance was considered at
p < 0.05. Descriptive statistics (mean, minimum, maximum, standard deviation, and median) for all seed quality traits across the complete dataset are provided in
Supplementary Table S1.
2.4. Stability Index
The stability of each seed trait was estimated using the Stability Index (SI) as proposed by Fasoula [
6], which quantifies the consistency of trait expression across environments and cultivars. The Stability Index for each trait was calculated as:
where
is the mean value and
is the standard deviation across environments or cultivars. Higher SI values indicate greater stability, whereas lower values reflect greater sensitivity to environmental variation. Stability was calculated for each trait for region, cultivar, and cultivar × region combinations.
Stability was calculated for each trait across environments for each cultivar and for genotype × environment combinations only.
3. Results
3.1. Combined ANOVA
Table 1 presents the significance of genotype (G), environment (E), and genotype × environment (G × E) effects on six cotton seed quality traits.
Genotype effects were significant (p ≤ 0.01 or p ≤ 0.001) for all traits, indicating differences in trait expression among cultivars. Environmental effects were significant for oil content, ash content, and crude fiber content, whereas 1000-seed weight, crude protein content, and moisture content were not significantly affected by environment.
The genotype × environment interaction was significant for all traits (p ≤ 0.05 to p ≤ 0.001), indicating that the relative performance of cultivars varied across environments. Replications within environments were not significant for any of the examined traits.
3.2. Seed Trait Stability Across Environments and Cultivars
Stability indices (SI) were calculated for six seed quality traits (1000-seed weight, crude protein, oil, ash, crude fiber, and moisture content) across four environments and five cultivars.
Mean SI values across environments are presented in
Table 2. In Thessaly, SI values ranged from 87 for 1000-seed weight to 631 for crude fiber. In Macedonia, SI values ranged from 144 for 1000-seed weight to 486 for moisture. In Thrace, SI values ranged from 158 for 1000-seed weight to 683 for crude fiber, while in Sterea Ellas SI values ranged from 130 for 1000-seed weight to 596 for crude fiber.
Across cultivars (
Table 3), Elsa showed the highest SI values for crude fiber (1557), 1000-seed weight (385), and crude protein (298). Celia showed lower SI values for moisture (680) and crude fiber (509). The remaining cultivars (DP-332, DP-377, and ST-402) exhibited intermediate SI values across most traits, with 1000-seed weight ranging from 153 to 188 and crude protein from 156 to 305.
Stability Index values for each cultivar within each environment are presented in
Table 4. In Thessaly, Elsa showed SI values of 426 for crude protein and 3768 for crude fiber, while ash showed lower SI values (252). In Macedonia, DP-377 exhibited an SI value of 729 for 1000-seed weight, while crude protein and ash showed SI values of 142 and 147, respectively. Across all environments and cultivars, SI values for 1000-seed weight and oil content were generally higher than those observed for crude fiber and moisture.
3.3. Correlation Among Seed Traits
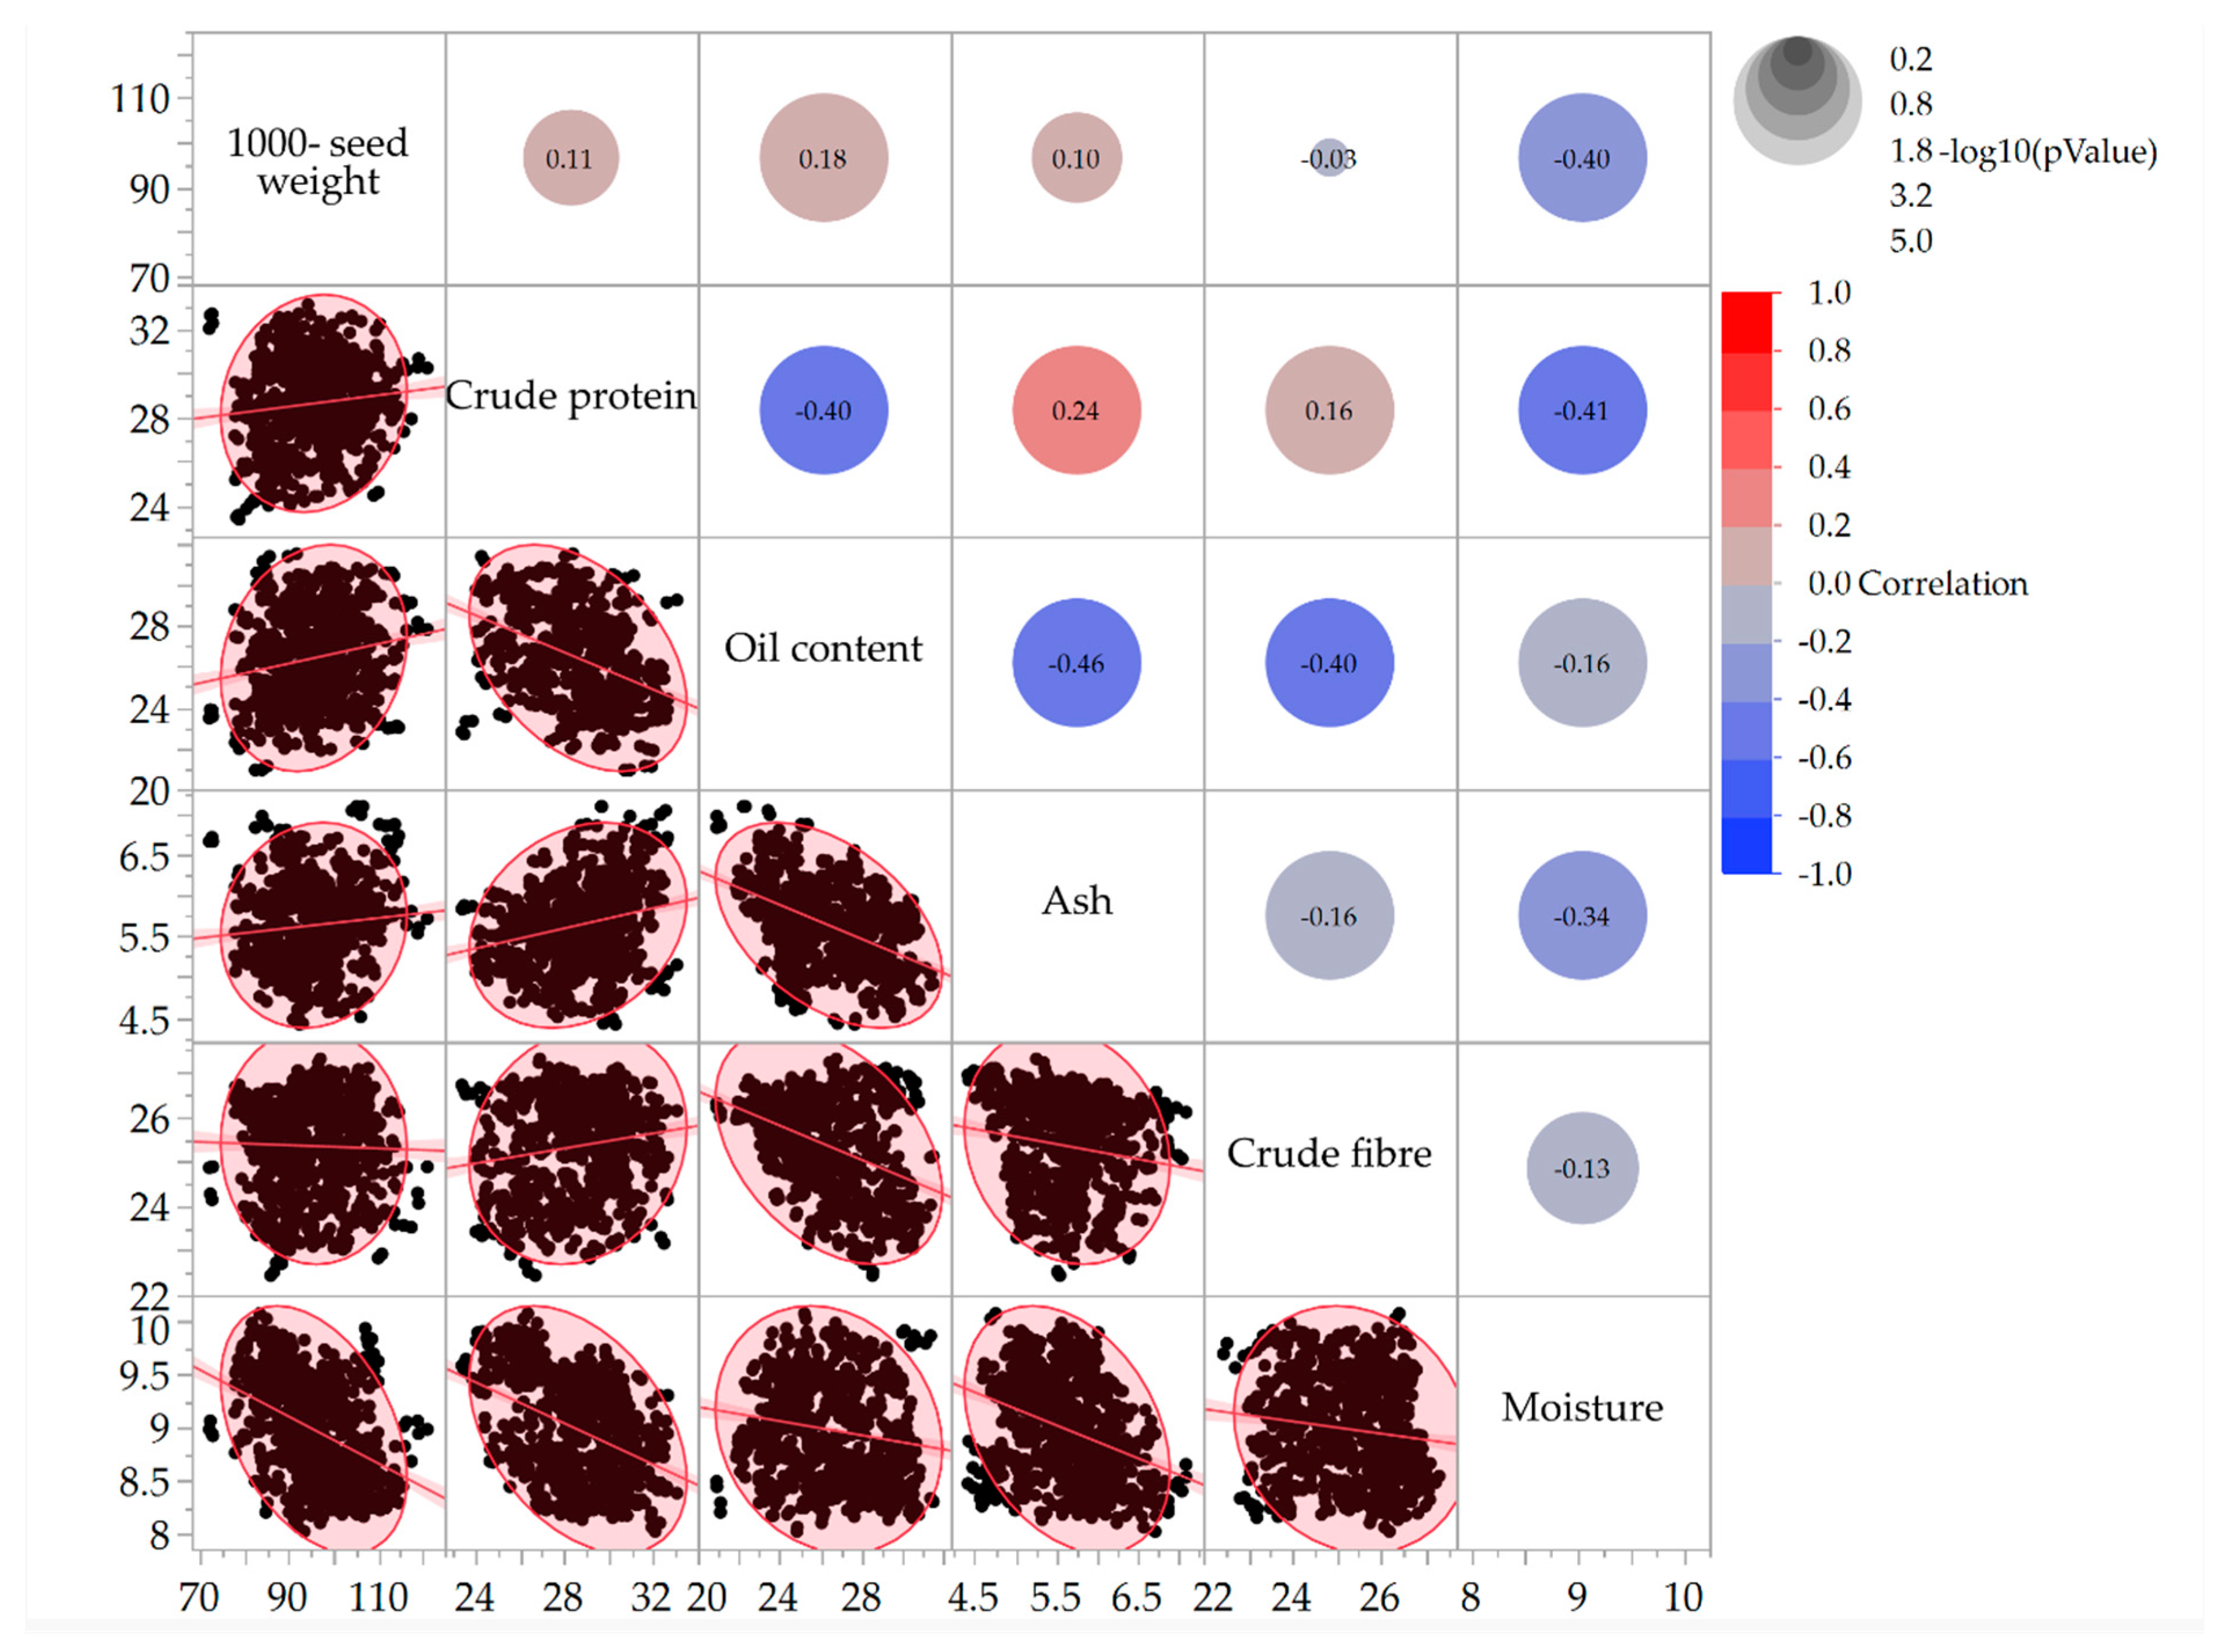
Pearson correlation coefficients among the six seed traits are shown in
Figure 2 and
Table S2. Significant positive associations were observed between 1000-seed weight and oil content (r = 0.18,
p < 0.01), as well as between crude protein and ash content (r = 0.24,
p < 0.01). Negative correlations were detected between 1000-seed weight and moisture content (r = −0.40,
p < 0.01) and between crude protein and oil content (r = −0.40,
p < 0.01), indicating potential trade-offs among seed size, composition, and moisture content.
Crude fiber showed weak correlations with most other traits, suggesting limited co-variation with the remaining seed quality parameters. Overall, the correlation analysis highlights coordinated patterns of trait variation and trade-offs among seed characteristics, without implying causal or genetic relationships.
3.4. Exploratory Analysis
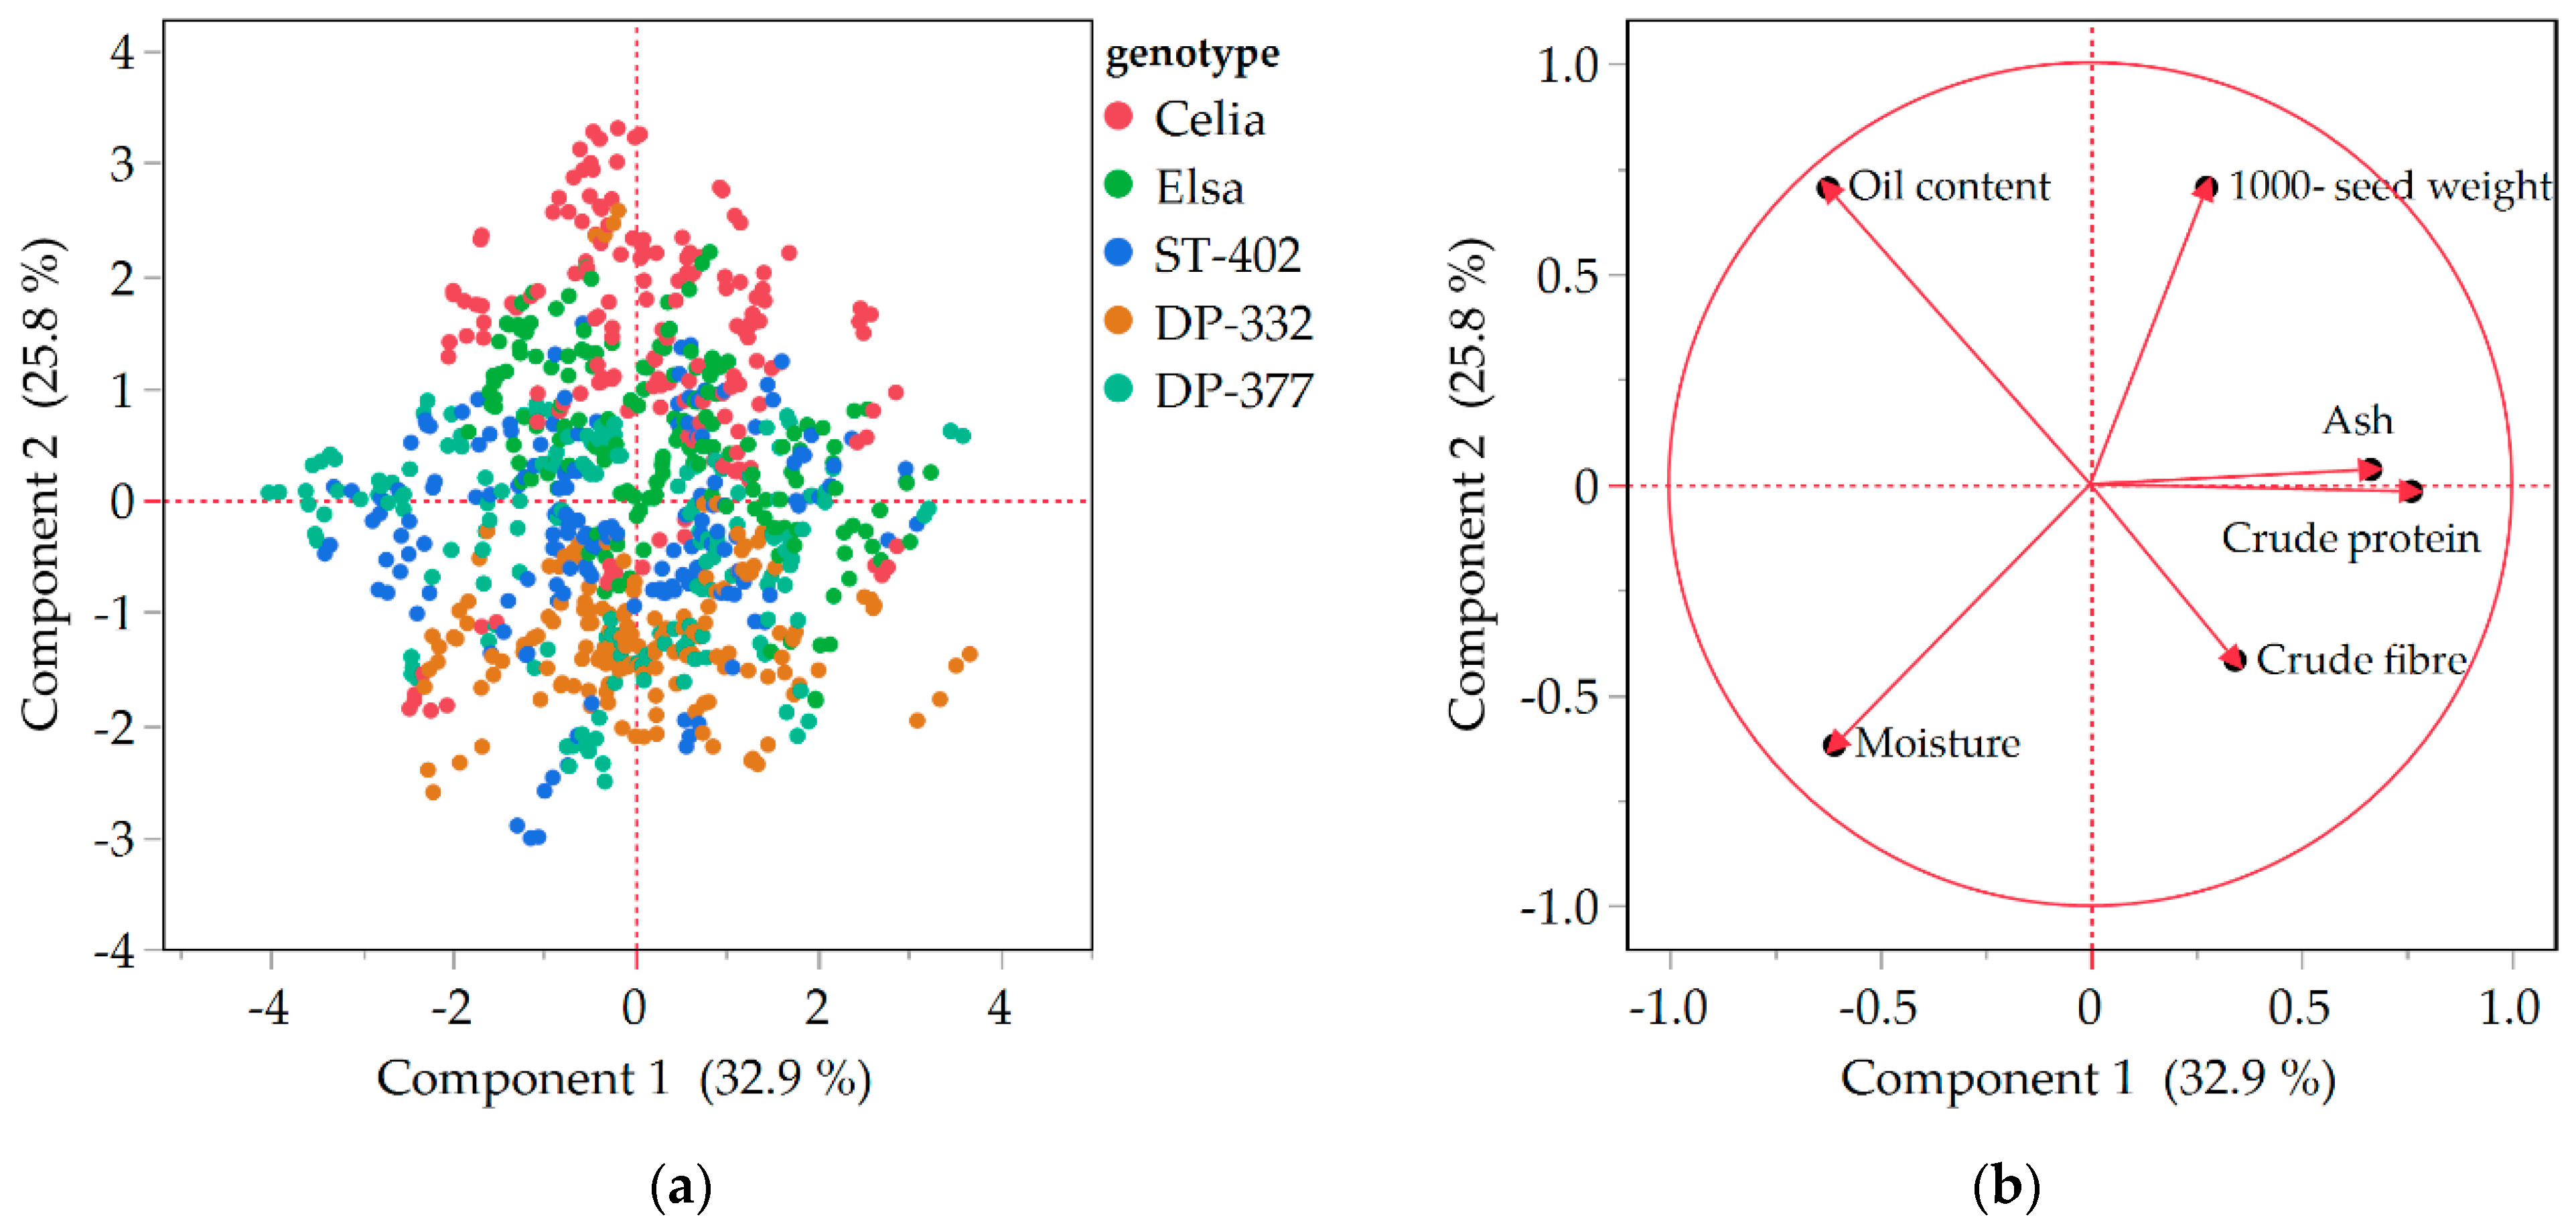
Principal component analysis (PCA) was conducted to examine multivariate relationships among the six seed quality traits and to summarize overall variation patterns. The first two principal components explained 58.7% of the total variation, with PC1 accounting for 32.9% and PC2 for 25.8% (
Figure 3).
PC1 was mainly associated with crude protein and ash content, which showed positive loadings on this component. PC2 was primarily associated with 1000-seed weight and oil content, while moisture and crude fiber showed negative loadings.
The score plot showed substantial overlap among genotypes along both PC1 and PC2. A tendency for differentiation along PC2 was observed for cultivars Celia and DP-332. Celia was associated with higher values of 1000-seed weight and oil content and lower values of moisture and crude fiber, whereas DP-332 showed the opposite tendency.
The loading plot indicated that crude protein and ash contributed mainly to PC1, while 1000-seed weight, oil, moisture, and crude fiber contributed primarily to PC2.
4. Discussion
The evaluation of seed trait stability across multiple environments and cultivars revealed considerable variation in trait performance, reflecting both genetic and environmental influences. Traits such as 1000-seed weight and oil content exhibited higher Stability Index (SI) values across environments, indicating greater consistency of expression, whereas traits like crude fiber and moisture content were more variable across environments, highlighting pronounced genotype × environment (G × E) interactions. These patterns are consistent with previous studies on cotton fiber traits, where highly stable traits, such as fiber uniformity and maturity, were associated with qualitative inheritance, while more variable traits showed quantitative inheritance and multi-gene control [
2,
5,
25]. Gong et al. [
26] similarly reported that cotton kernel oil content is influenced by both genotype and environment, emphasizing the importance of multi-environment evaluation. From an applied processing perspective, oil content and seed size are key determinants of oil extraction efficiency and economic yield in cotton seed processing, as oil content largely defines the amount of extractable oil and influences processing outcomes in food and industrial applications [
27]. Greater stability of these traits across environments is therefore advantageous for industrial oil production, as it supports more predictable processing performance and product quality, as reported in studies on oilseed crops and cotton seed utilization. For example, recent multi-environment studies in oilseed crops like safflower have shown that stability of oil content across environments is meaningful for reliable processing outcomes and cultivar selection for oil yield under variable conditions [
28].
In our study, based on the Stability Index, cultivar Elsa consistently exhibited higher SI values for 1000-seed weight and crude protein, whereas crude fiber and moisture were highly variable, reflecting strong genotype × environment (G × E) interactions rather than absolute genetic control. This pattern highlights Elsa’s potential for selection in breeding programs for traits with relatively consistent expression, while caution is required for traits that are more environmentally responsive. Conversely, cultivars Celia, DP-332, DP-377, and ST-402 showed intermediate to low SI values depending on the trait, emphasizing that selection for stable performance must consider both the trait and the cultivar. These findings parallel fiber studies where cultivar-specific stability patterns were observed across environments, highlighting the importance of genotype selection in breeding for uniform quality [
4,
29].
Correlation analysis among seed traits revealed both positive and negative associations, indicating potential trade-offs in trait expression rather than causal or genetic relationships. For example, the negative correlation between crude protein and oil content suggests that selection for higher protein may be accompanied by reduced oil content under certain conditions. The positive correlation between 1000-seed weight and oil content indicates that improvement of both traits simultaneously is feasible, supporting indirect selection strategies. Similar correlation patterns have been reported in cotton fiber studies, where trait co-variation informs multi-trait selection approaches [
25,
30].
Environmental effects were particularly pronounced for crude fiber and moisture, consistent with earlier observations in fiber traits where some quality characteristics were predominantly influenced by environmental conditions rather than genotype alone [
29]. These responses are also consistent with the climatic variability among the studied regions, particularly differences in temperature extremes and precipitation patterns during the seed filling period, which are known to affect moisture retention and structural carbohydrate accumulation, as supported by recent studies on cotton [
31] and other seed crops [
32].
In contrast, traits showing higher SI values across environments reflect greater consistency of expression, whereas traits exhibiting high variability are likely influenced by multiple genes and environmental modulation, i.e., quantitative traits [
2,
5,
33]. Malalha et al. [
19] reported significant G × E effects on cotton seed oil in northern Cameroon, while Amer et al. [
34] observed associations between oil content and fiber traits in Egyptian cotton. Li et al. [
35] showed that oil content is polygenic and that protein content is influenced by major genes, and Wu et al. [
36] highlighted relevant QTLs, supporting molecular breeding efforts for seed quality improvement. Li et al. [
37] further demonstrated moderate heritability of seed oil, seed index, and lint traits with limited G × E interaction, reinforcing the potential for concurrent improvement under appropriate selection strategies. These studies provide context for the present findings but do not imply direct genetic inference from the current dataset.
Principal component analysis (PCA) complemented the Stability Index results by providing a multivariate overview of seed trait relationships. The first two principal components explained 58.7% of the total variation, with PC1 primarily associated with crude protein and ash content, indicating coordinated variation of these traits. PC2 captured variation in 1000-seed weight and oil content, with moisture and crude fiber loading in the opposite direction, highlighting trade-offs among these traits. PCA was used descriptively and did not aim to discriminate genotypes or infer causality.
Genotypes Celia and DP-332 showed separation along PC2 but overlapped on PC1, indicating differences mainly in traits related to seed weight, oil, moisture, and crude fiber, while sharing similar protein and ash profiles. This pattern reflects differential trait responses across environments rather than clear genetic grouping. The remaining genotypes showed substantial overlap across both components, suggesting that multivariate trait variation is influenced by both genotype and environment. Observed differences likely reflect genotype-specific responses to local environmental conditions, consistent with the strong G × E effects detected in the ANOVA and Stability Index analyses. The PCA results therefore reinforce the conclusion that crude fiber and moisture are more environmentally responsive, while 1000-seed weight and oil content exhibit more consistent behavior across environments.
Studies in other crops confirm the value of multi-environment evaluation and G × E analysis. In faba beans, stable genotypes such as Tanagra have been identified across environments [
11], while vetch and peas exhibit stable seed quality under different production systems [
12]. In maize, seed size and protein content can be improved through selection, whereas moisture is more environmentally influenced [
13], supporting environment-specific breeding strategies.
Overall, the combined use of the Stability Index, correlation analysis, and PCA provides a robust framework for evaluating cultivar performance under field conditions. 1000-seed weight and oil content showed higher consistency across environments, whereas crude fiber and moisture were more variable, reflecting strong G × E interactions. Protein and ash exhibited intermediate stability and primarily contributed to PC1. These findings underscore the importance of multi-environment trials and the need for cautious interpretation of stability metrics, when identifying cultivars with reliable seed quality performance, in agreement with previous cotton studies [
25].
A limitation of the present study is that trait stability was assessed using a descriptive index without variance partitioning or multi-year validation; therefore, interpretations are restricted to the evaluated environments and should not be extended to genetic control, heritability, or long-term stability. In addition, functional oil properties such as fatty acid composition, oxidative stability, and processing performance were not evaluated. Nevertheless, the assessment of cotton seed compositional traits and their stability across diverse environments provides a valuable basis for understanding the consistency of key quality attributes relevant to food, feed, and industrial utilization. Future studies integrating multi-year evaluations of trait stability with functional and processing-related characteristics would further enhance the applied relevance of cotton seed quality research.
In conclusion, seed quality traits differed in their responsiveness to environmental conditions. Traits with higher consistency across environments may be targeted through selection, whereas more variable traits require environment-specific strategies. The integration of Stability Index and PCA offers complementary, descriptive insight into trait behavior, supporting informed cultivar selection and breeding decisions aimed at improving cotton seed quality across diverse environments.
5. Conclusions
This study evaluated the stability of six key seed quality traits in five upland cotton cultivars across four distinct environments in Greece. Traits such as 1000-seed weight, oil, and crude protein showed greater consistency of expression across environments, whereas crude fiber and moisture were more strongly influenced by environmental conditions and genotype × environment interactions. Cultivar Elsa consistently exhibited higher Stability Index values for 1000-seed weight and crude protein, highlighting its potential as a reliable cultivar for use in breeding programs, while crude fiber and moisture displayed substantial variability.
Correlation analysis revealed both positive and negative associations among seed traits, indicating potential trade-offs that should be considered in multi-trait selection strategies. In particular, the negative association between protein and oil content suggests that improvement of one trait may be accompanied by changes in the other, whereas the positive association between 1000-seed weight and oil content supports the possibility of simultaneous improvement.
Exploratory principal component analysis highlighted major trait groupings and trade-offs, confirming that crude protein and ash content clustered together, while seed weight and oil content were inversely related to moisture and crude fiber. This multivariate perspective complements stability and correlation analyses by providing descriptive insight into overall trait relationships rather than genotype discrimination.
Overall, these results demonstrate the value of combining Stability Index assessments, correlation analysis, PCA, and multi-environment trials to evaluate cultivar performance under diverse conditions. The findings provide practical guidance for cotton breeding programs aiming to improve seed quality while accounting for environmental variability and genotype × environment interactions.




 ,
,