Abstract
Detecting Escherichia coli on food preparation and processing surfaces is critical for ensuring food safety and preventing foodborne illness. This study focuses on detecting E. coli contamination on common food processing surfaces using UV-C fluorescence imaging and deep learning. Four concentrations of E. coli (0, 105, 107, and 108 colony forming units (CFU)/mL) and two egg solutions (white and yolk) were applied to stainless steel and white rubber to simulate realistic contamination with organic interference. For each concentration level, 256 droplets were inoculated in 16 groups, and fluorescence videos were captured. Droplet regions were extracted from the video frames, subdivided into quadrants, and augmented to generate a robust dataset, ensuring 3–4 droplets per sample. Wavelet-based denoising further improved image quality, with Haar wavelets producing the highest Peak Signal-to-Noise Ratio (PSNR) values, up to 51.0 dB on white rubber and 48.2 dB on stainless steel. Using this dataset, multiple deep learning (DL) models, including ConvNeXtBase, EfficientNetV2L, and five YOLO11-cls variants, were trained to classify E. coli concentration levels. Additionally, Eigen-CAM heatmaps were used to visualize model attention to bacterial fluorescence regions. Across four dataset groupings, YOLO11-cls models achieved consistently high performance, with peak test accuracies of 100% on white rubber and 99.60% on stainless steel, even in the presence of egg substances. YOLO11s-cls provided the best balance of accuracy (up to 98.88%) and inference speed (4–5 ms) whilst having a compact size (11 MB), outperforming larger models such as EfficientNetV2L. Classical machine learning models lagged significantly behind, with Random Forest reaching 89.65% accuracy and SVM only 67.62%. Overall, the results highlight the potential of combining UV-C fluorescence imaging with deep learning for rapid and reliable detection of E. coli on stainless steel and rubber conveyor belt surfaces. Additionally, this approach could support the design of effective interventions to remove E. coli from food processing environments.
1. Introduction
Escherichia coli is a major indicator of fecal contamination and a significant cause of foodborne illness worldwide. In the U.S., E. coli varieties accounted for the highest proportion of outbreaks (22.68%) among 192 reported from 2010 to 2024 [1,2]. Typically, E. coli is transmitted to fruits, vegetables, and leafy greens through the feces of birds, domestic animals, and wild animals such as deer [3,4,5,6,7]. During postharvest operations, including transportation and handling of produce from production sites to processing facilities, the potential contamination of E. coli bacteria on fruit, vegetable, and leaf surfaces presents a risk of human infection. These foodborne pathogens pose significant health risks, including hemorrhagic colitis and gastroenteritis. Contamination can occur across diverse environments, including kitchens, food processing plants, healthcare facilities, and public spaces, where pathogens may persist. Common materials in these settings include stainless steel and white rubber, often used in processing equipment, conveyor belts, and contact surfaces. Effective monitoring and rapid detection of E. coli on these surfaces are crucial for preventing cross-contamination and ensuring public safety.
Conventional microbiological detection methods, such as culture-based assays and molecular techniques, provide reliable identification but are often time-consuming, requiring anywhere from several minutes for rapid molecular assays to several hours for standard culture-based tests. They can also be labor-intensive and are generally impractical for real-time monitoring [8,9]. Optical sensing approaches, including fluorescence imaging, have emerged as promising alternatives due to their rapid, non-destructive, and wide-area inspection capabilities. Among these, UV-C fluorescence imaging is particularly effective for detecting biological contaminants by exploiting their intrinsic fluorescence signatures when illuminated with short-wavelength ultraviolet light. The integration of UV-C illumination with fluorescence imaging has emerged as an effective, rapid, and non-invasive method for detecting microbial biofilms formed by bacteria and fungi on diverse surfaces [10,11,12]. Exposure to UV-C wavelengths (approximately 254–280 nm) excites intrinsic biomolecules within microbial cells, including aromatic amino acids such as tryptophan and tyrosine, as well as cellular coenzymes, resulting in characteristic autofluorescence that enables label-free identification of microbial contamination [13,14]. Although UV-C fluorescence imaging has technical limitations, its surface-specific excitation and emission properties make it a promising approach when challenges such as improper response to background interference, low bacterial concentrations, and surface heterogeneity are addressed.
Furthermore, the integration of fluorescence imaging with DL techniques enhances detection accuracy by classifying fluorescence patterns associated with varying levels of contamination [3]. Three object detection networks using DL algorithms, namely SSD-MobileNetV2, EfficientDet, and YOLOv4 detected E. coli automatically, with the last of these demonstrating superior performance with mean average precision (mAP) of 98% [15]. Prior works summarized in a review article indicates that convolutional neural networks (CNNs), often combined with transfer learning, have been widely applied to laboratory-generated datasets for bacterial classification tasks. These studies reported successful discrimination of various bacterial species, including foodborne pathogens and antibiotic-resistant strains, with classification accuracies spanning 81% to 100% [16]. Separately, a study utilizing VGG16 architecture incorporated transfer learning, fine-tuning, and data augmentation strategies to identify superficial fungal infections, resulting in a substantial performance gain from 84.38% to 97.19% following augmentation [17]. Additionally, fluorescence-image-based fungal detection using the YOLOv8 framework achieved a mean average precision (mAP) of 91.64% [12]. Recently, another method using fluorescence images and YOLOv8 was developed to detect surface contamination under variable ambient lighting conditions, achieving a mAP of 69.20% under optimal conditions and 62.20% under noisy conditions [18]. However, most existing workflows do not incorporate advanced denoising or interpretable AI techniques, leaving model decisions opaque and potentially unreliable for food safety monitoring.
DL performance improves notably when fluorescence images are denoised prior to model training [19]. Fluorescence imaging commonly contains noise originating from sensor limitations, tissue autofluorescence, and non-uniform illumination, all of which can mask biologically relevant information. Standard background correction methods generally address average noise levels and are often insufficient for removing structured noise caused by spatially varying illumination or autofluorescence. Such artifacts contain complex spatial frequency components that simple background subtraction methods cannot adequately suppress, which may lead to incorrect feature learning by DL models [20]. Therefore, advanced denoising techniques are required to improve the signal-to-noise ratio (SNR), preserve important image structures, and provide high-quality inputs for robust model training [21]. A range of denoising approaches, including wavelet-based filtering, non-local means, Discrete Wavelet Transform (DWT), and deep learning-based methods, have been shown to effectively reduce noise while maintaining essential spatial features. Among these, DWT is particularly well suited for fluorescence imaging due to its multi-resolution representation, which separates images into frequency sub-bands and enables selective suppression of noise-dominated high-frequency components [22,23,24]. Previous studies have reported that DWT improves the visibility of intracellular structures in noisy confocal fluorescence images [25], improves deep learning-based image restoration and CNN classification performance [26,27]. In addition, DWT improves the contrast of biological components by suppressing structured background artifacts resulting from uneven UV excitation [13,28,29].
Despite the benefits of denoising, understanding the predictions of DL models remains a challenge due to their complex architecture and large number of parameters. Detection frameworks such as YOLO typically operate as black-box models, limiting direct interpretability of internal decision processes. As a result, explainable artificial intelligence (XAI) methods are increasingly adopted to provide insight into model behavior [30]. Eigen-Class Activation Mapping (Eigen-CAM) is one such technique that offers class-agnostic visual explanations by identifying influential image regions through principal component analysis of feature maps, thereby supporting improved interpretation of model predictions [31]. This approach has been applied across diverse domains [32]: localizing pathological regions in medical imaging [33,34], highlighting key features for object recognition in autonomous driving [35,36], and supporting classification and anomaly detection in agricultural applications [37,38].
Despite these advances, several limitations remain. Most prior studies have focused solely on detecting the presence of E. coli, with limited efforts to classify bacterial concentration levels on food-contact surfaces. Detection accuracy is often reduced in real-world scenarios due to low bacterial concentrations, heterogeneous surfaces, and variable lighting conditions. Moreover, many DL workflows do not incorporate advanced denoising or interpretable AI methods, leaving model predictions opaque and potentially unreliable for practical food safety monitoring. Taking these gaps into account, this study aimed to advance E. coli identification techniques by developing a robust, end-to-end workflow that goes beyond simple detection, enabling both the detection and classification of E. coli concentration levels on stainless steel and white rubber surfaces, even in the presence of other biological confounding materials. The specific objectives of this study were to:
- Capture fluorescence images of droplets of E. coli (four concentrations, 0–108 CFU/mL), egg white, and egg yolk on stainless steel and white rubber surfaces using the SafetySpec CSI-D+ system.
- Construct a workflow pipeline for dataset preparation using denoising and augmentation, and train multiple DL models to classify E. coli concentration levels.
- Validate the proposed workflow using independent datasets to assess its accuracy and robustness, and utilize Eigen-CAM visualizations to interpret model predictions and highlight key regions influencing classification outcomes.
2. Materials and Methods
2.1. Workflow Pipeline
The workflow began with UV-C fluorescence video capture of E. coli and egg substances on stainless steel and white rubber surfaces using a second-generation SafetySpec CSID+ handheld device (SafetySpect, Inc., Grand Forks, ND, USA). During operation, the device uses 275 nm illumination to excite autofluorescence from intrinsic biomolecules within bacterial cells, resulting in differences in fluorescence intensity and spatial patterns. The working distance from the imaging lens to the target was 150 mm (gain = 164, exposure = 41). Frames were extracted from the collected videos and converted to grayscale images. These raw frames were then enhanced using wavelet-based denoising transform [37], where various wavelet families and decomposition levels were tested. Based on Peak Signal-to-Noise Ratio (PSNR) evaluation, the optimal wavelet was determined. The PSNR served as a metric to evaluate signal enhancement in processed images relative to the unprocessed originals. Afterward, using inverse discrete wavelet transform (IDWT), enhanced images were reconstructed and stored for downstream processing, including quadrant division and augmentation. Several deep learning-based classification models were trained with these processed images to identify different concentration levels of E. coli as well as to separate the E. coli contaminations from common organic contaminants from surfaces like stainless steel and white rubber. In the last stage, selected test images were analyzed using Eigen-CAM to create heatmaps that visually explain how the model made its predictions. Figure 1 represents the overall workflow, and the individual steps are described in detail in the subsequent sections.
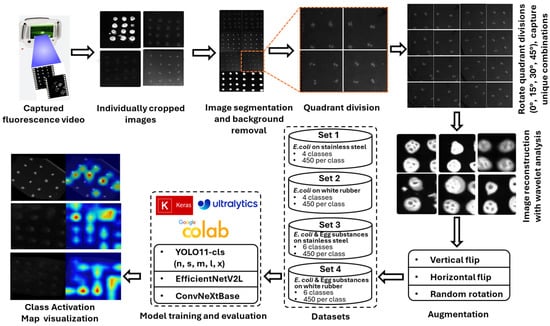
Figure 1.
Workflow pipeline for E. coli concentration classification on stainless steel and white rubber surfaces, illustrating image preprocessing, classification, and explainability using class activation map visualization.
2.2. Sample Cell Preparation and Inoculation
A non-pathogenic E. coli strain (ATCC 35218) was chosen for this study because it has been validated as a safe and reliable surrogate for Salmonella spp. previously [39]. The strain was initially cultured on tryptic soy agar plates and incubated at 35 °C for 24 h. A single colony was then transferred aseptically into 10 mL of tryptic soy broth (TSB) and incubated under the same conditions for another 24 h. To expand the culture, 10 µL of this suspension was inoculated into a fresh 10 mL TSB tube and incubated again at 35 °C for 24 h. After growth, the culture was centrifuged at 6000 rpm for 5 min, the supernatant discarded, and the bacterial pellet resuspended in sterile distilled water. This resuspension process was repeated once. Under these conditions, the final E. coli concentration reached about 109 CFU/mL. The actual cell density was confirmed by performing serial dilutions, plating, incubation, and colony counting. Various required concentrations of E. coli cells were selected based on the prior works [3,40], such as 0, 105, 107, and 108 CFU/mL, which were achieved through further dilution of the initial stock suspension. In previous study [2], inoculation levels ranging from 105 to 108 CFU/mL were tested. Concentrations that were too close together produced unclear boundaries because E. coli cells were suspended in liquid suspension, and some cells could be clustered together. Therefore, sufficiently separated concentrations were selected to allow reliable classification. In these experiments, 105 was identified as the lowest detectable concentration by the CSID+ system, 107 represented a mid-level concentration, and 108 was included to represent the highest observable contamination. The intermediate level of 106 was often misclassified as 105 or 107 and was therefore omitted, reducing the number of classes while still including the weakest and strongest observable dilutions.
Aliquots of E. coli suspensions at varying concentrations were deposited onto stainless steel and rubber surfaces as 16 individual drops (10 µL each) per 3.8 cm2, resulting in 16 groups (256 droplets) per concentration. In a similar manner, two other organic substances, egg white and egg yolk, were introduced to test whether E. coli could be distinguished from other biological materials. Although no specific rationale dictated their choice, egg components provided convenient biological material for deposition using the same pipetting protocol. Egg white and yolk were separated and whipped in undiluted form to reduce internal adhesion before deposition. Undiluted forms were used because such concentrations commonly occur in food processing facilities, whereas diluted forms could represent an infinite range of concentrations beyond the scope of this study. All suspensions deposited onto the target surfaces were air-dried with mild heating for a minimum duration of 2 h prior to imaging.
2.3. Dataset Preparation
The second-generation CSI-D+ handheld imaging system (Figure 2), was used in this study. Unlike the earlier version of this device, which relied on static imaging with fixed tripods, the handheld system introduces variability in angle, motion, and distance, providing a more realistic acquisition pipeline for real-world deployment scenarios. The CSID+ device uses discrete 275 nm UV-C LEDs to illuminate the field of view and captures 12-bit, 1280 × 960-pixel two-dimensional fluorescence images. A total of 5.28 min of fluorescence video was acquired using this imaging device under 275 nm UV-C illumination. During each video session, droplets containing E. coli and other organic contamination were inoculated on different surfaces in a structured 4 × 4 grid layout, allowing controlled comparisons across material types and bacterial concentrations. A custom-built annotation tool was developed to extract individual frames from the recorded videos, isolating meaningful snapshots for dataset generation. Across all video frames, 108 unique images were extracted, with resolution dimensions ranging from approximately 240 × 230 to 350 × 310 pixels. Each image corresponded to a group of distinct droplets, representing either a specific concentration of E. coli or egg white or egg yolk applied to two different surface types: stainless steel and white rubber. These images were manually verified for relevance and then segmented by surface type and fluid condition into four experimental datasets: E. coli on stainless steel, E. coli on white rubber, egg-based solutions on stainless steel, and egg-based solutions on white rubber.
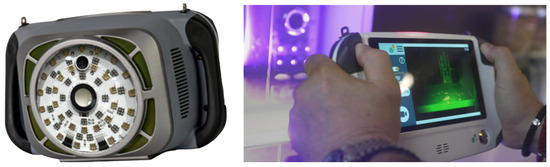
Figure 2.
The second-generation CSI-D+ system was used to collect fluorescence videos of E. coli droplets, as well as egg white and egg yolk droplets, deposited on stainless steel and white rubber surfaces.
To isolate fluorescent regions, each image underwent background removal using an OpenCV-based preprocessing workflow. After background subtraction and noise suppression using threshold-based masking, each original image was divided into four non-overlapping quadrants. To prevent information leakage, dataset splitting was performed at the original image level prior to quadrant extraction and augmentation, ensuring that all quadrants and their augmented variants from a given image were assigned exclusively to either the training or testing set. Subsequently, these quadrants were then subjected to rotational augmentation at 0°, 15°, 30°, and 45°, generating four unique combinations of droplets, with approximately three to four droplets per quadrant. This process expanded each original image into 16 variants (4 quadrants × 4 rotations), resulting in 780 images for Set 1 (E. coli on stainless steel), 620 for Set 2 (E. coli on white rubber), 1140 for Set 3 (egg white/yolk on stainless steel), and 970 for Set 4 (egg white/yolk on white rubber). Set 1 included the classes EC-SS-0, EC-SS-5, EC-SS-7, and EC-SS-8, representing E. coli concentrations 0, 105, 107, and 108 CFU/mL, respectively. Set 2 contained EC-WR-0, EC-WR-5, EC-WR-7, and EC-WR-8, corresponding to the same concentration levels. To simulate biological interference, Set 3 extended Set 1 by adding egg white (EW-SS) and egg yolk (EY-SS) samples on stainless steel, and Set 4 extended Set 2 with egg white (EW-WR) and egg yolk (EY-WR) samples on white rubber. To ensure class balance, excess samples from overrepresented classes were randomly dropped. Geometric augmentations, including vertical flipping, horizontal flipping, and random rotation were applied using the Augmentor Python package (version 0.2.10) to reach 450 images per class. These processed images were then resized to 640 × 640 pixels to match the YOLO model input resolution. This uniform resizing ensures consistent feature extraction with minimal impact on image content. Finally, each set was split into training (80%), validation (10%), and testing (10%) partitions to support model training and evaluation. These datasets are summarized in Table 1.

Table 1.
Summary of datasets showing the number of original and augmented training images per class for E. coli at different concentrations (0, 105, 107, 108 CFU/mL) and egg white (EW) and egg yolk (EY) samples on stainless steel and white rubber surfaces.
2.4. Image Denoising
To further enhance the signal quality of the fluorescence images prior to training, a wavelet-based denoising pipeline was applied using two-dimensional discrete wavelet transform (2D DWT) via the PyWavelets library (version 1.5.0) [41]. Wavelet transforms decompose signals into localized waveforms at different frequency bands. This makes them especially effective for preserving fine image details while suppressing noise, which is essential given the subtle textural differences in bacterial fluorescence. Six wavelet families were explored in this study: biorthogonal (bior1.3), reverse biorthogonal (rbio1.3), Daubechies (db3), Coiflets (coif1), Symlets (sym2), and Haar [41].
Each transformation was performed at decomposition level 1. Both approximation and detail coefficients were extracted, where approximation coefficients are derived from low-pass filtering along both axes, and detail coefficients are computed from combinations of low- and high-pass filters capturing horizontal, vertical, and diagonal features. Image reconstruction using IDWT was carried out using only the detail coefficients. Preliminary analysis showed that biologically relevant fluorescent signals, particularly microbial edges and localized intensity variations, were predominantly represented in these components, whereas low-frequency approximation coefficients were largely influenced by background illumination and surface artifacts. While this approach may attenuate some low-frequency fluorescence information, it preserves the salient features critical for downstream detection and classification. Denoising quality was quantitatively assessed using PSNR as a relative measure of signal enhancement, since noise-free ground truth images were not available. Higher PSNR values corresponded with improved preservation of fluorescence features and enhanced classification performance.
2.5. Deep Learning Model Training
Several deep learning models, including YOLO11-cls [42], ConvNeXtBase [43], and EfficientNetV2L [44], were trained for high-speed classification of E. coli and egg-based contamination levels on fluorescence images captured under UV-C illumination. All models were pretrained on the same source dataset (ImageNet) and fine-tuned using identical training settings, including learning rate, batch size, number of epochs, and data augmentation strategies. This approach ensured a fair and consistent comparison of model performance across architectures.
Five variants (n, s, m, l, x) of YOLO11-cls were trained on all four datasets generated in this study to classify different E. coli concentrations on stainless steel and white rubber, as well as egg-based substances on the same surfaces. The models were implemented using PyTorch version 2.6.0 with CUDA 12.4 and TensorFlow Keras. Training was performed on Google Colab using an NVIDIA A100 GPU (System RAM: 83.5 GB; GPU RAM: 40 GB; Disk space: 235.7 GB). Each variant was trained for 70 epochs (with a patience of 10 epochs) using a batch size of 16. Input images were resized to 640 × 640 pixels and optimized using the AdamW optimizer with a learning rate of 0.001 and a momentum of 0.9.
To provide a comprehensive evaluation, classic machine learning models including Support Vector Machines (SVM), Random Forests (RF), and K-Nearest Neighbors (KNN) were also tested. Although these traditional methods are generally outperformed by modern CNNs on high-dimensional visual tasks, their inclusion offered a baseline against which to highlight the superior performance of deep learning approaches, particularly YOLO11, for fluorescence-based contamination detection.
Model performances were assessed using standard performance metrics: Precision, Recall, F1-score, and validation and testing Accuracy as defined in Equations (1)–(4).
The variables TP, TN, FP, and FN stand for the number of true positives, true negatives, false positives, and false negatives, respectively.
Furthermore, Eigen-CAM [45] was applied to identify the most important regions for predicting E. coli concentrations. By analyzing principal components of feature maps, it generates class-agnostic heatmaps that highlight biologically relevant fluorescence patterns while ignoring background noise. Integration with YOLO11 using the YOLO-V11-CAM toolkit allowed visualization of these activation regions, providing interpretable insights into the model’s decision-making and validating its focus [46,47].
3. Results
3.1. Image Denoising
In the first phase of the analysis, the effectiveness of various wavelet transformations in denoising fluorescence images of E. coli inoculated surfaces was evaluated. The denoising performance was quantified using the PSNR, with both approximation (low frequency) and detailed (high frequency) coefficients compared across six different wavelet families: bior1.3, coif1, db3, haar, rbio1.3, and sym2. The evaluation was performed across all four datasets: Set 1 (E. coli on Stainless Steel), Set 2 (E. coli on White Rubber), Set 3 (Egg White/Yolk on Stainless Steel), and Set 4 (Egg White/Yolk on White Rubber). The average PSNR values were computed for each wavelet at decomposition level 1, considering both types of coefficients.
As shown in Figure 3, the detailed coefficients at decomposition levels 1 to 5 produced consistently higher PSNR values than approximation coefficients. This pattern held true across all wavelet families and datasets, establishing that a single level of decomposition captures sufficient noise signal separation without over smoothing critical visual information. Following this observation, the analysis was narrowed to detailed coefficients at level 1, and the average PSNR values were compared across wavelets for each dataset (Figure 4). While wavelets like rbio1.3, coif1, and sym2 performed well in certain cases, the Haar wavelet consistently yielded the highest PSNR values across most sets: 48.2 dB for Set 1, 51.0 dB for Set 2, 37.4 dB for Set 3, and 36.9 dB for Set 4. Given its computational simplicity and strong performance for E. coli, Haar was selected as the optimal wavelet for the image reconstruction pipeline. Using only detail coefficients enhances edge and texture preservation, which benefits downstream classification based on local intensity patterns, even though global intensity information may be partially reduced.
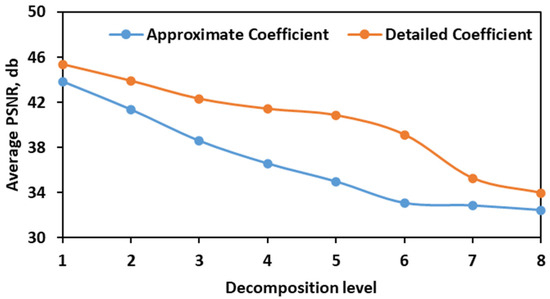
Figure 3.
Test results showing average PSNR values that were obtained when denoising fluorescence images consisting of E. coli bacterial population at the four different concentration levels.
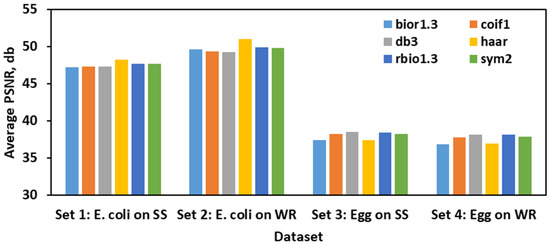
Figure 4.
Average PSNR values of detailed coefficients from six wavelet transforms evaluated for denoising fluorescence images of E. coli and egg substance droplets on stainless steel and white rubber surfaces.
3.2. Performance Evaluation of YOLO11-cls Models
The performance results of all YOLO11-cls variants are summarized in Figure 5. From the analysis, it was found that the validation accuracy was consistently high across Sets 2 to 4, suggesting that the models were capable of learning distinguishing features even under complex visual backgrounds involving additional organic material. YOLO11s-cls and YOLO11m-cls achieved the highest validation scores of 100% on Set2 and Set4, demonstrating strong capabilities for E. coli detection on white rubber, both in clean and organically contaminated conditions. YOLO11s-cls further achieved 95.00% in Set1 and 98.10% in Set3, while YOLO11m-cls recorded 97.80% in Set1 and 98.90% in Set3, reflecting their robustness in distinguishing between different E. coli concentration levels and from egg-based interference. YOLO11l-cls maintained consistently high validation accuracy with 90.00% in Set1, 98.30% in Set2, 99.60% in Set3, and 100% in Set4, and YOLO11x-cls showed 90.00% in Set1 and Set2, 95.60% in Set3, and 100% in Set4. YOLO11n-cls, the lightest model, achieved 88.30% in Set1, 99.40% in Set2, 99.30% in Set3, and 100% in Set4.
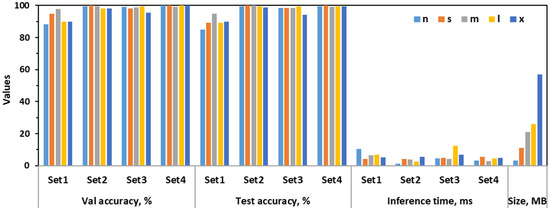
Figure 5.
Performance metrics for YOLO11 classification model variants were evaluated across four datasets, (i) Set 1—E. coli on Stainless Steel; (ii) Set 2—E. coli on White Rubber; (iii) Set 3—E.coli and Egg substances on Stainless Steel; (iv) Set 4—E.coli and Egg substances on White Rubber, to classify the different concentration levels on the stainless steel and rubber conveyor belt surfaces.
In terms of test accuracy, YOLO11m-cls was the top performer on Set1 with 95.00%, outperforming YOLO11s-cls and YOLO11l-cls (both at 89.40%) and YOLO11n-cls (85.00%), while YOLO11x-cls scored 90.00%. On Set2, YOLO11s-cls, YOLO11m-cls, and YOLO11x-cls all achieved 100% accuracy, while YOLO11n-cls and YOLO11l-cls were slightly lower with 99.40% each. For the more challenging Set3, where stainless steel surfaces included egg white and yolk, YOLO11l-cls and YOLO11n-cls achieved the highest accuracy at 99.60%, followed by YOLO11m-cls and YOLO11s-cls at 98.50%, and YOLO11x-cls at 94.10%. In Set4, involving white rubber and organic interference, YOLO11s-cls, YOLO11l-cls, and YOLO11x-cls again achieved 100%, while YOLO11n-cls and YOLO11m-cls followed closely with 99.60% and 99.30%, respectively.
In terms of inference time, which is critical for real-time applications, YOLO11n-cls was the fastest with times ranging from 1.20 ms (Set2) to 10.60 ms (Set1). YOLO11s-cls offered a favorable balance between speed and accuracy, with inference times between 4.10–5.40 ms. YOLO11m-cls was slightly slower with 2.80–6.60 ms, but still within an acceptable range for near-real-time use. YOLO11l-cls showed variable performance with a notable peak of 12.60 ms on Set3, reducing its efficiency in complex environments. YOLO11x-cls, despite being the slowest in general (up to 7.00 ms), did not offer accuracy benefits proportional to its latency.
Model size was another important factor for deployment. YOLO11n-cls, being only 3.20 MB, was ideal for resource-constrained systems, albeit with trade-offs in accuracy. YOLO11s-cls (11.00 MB) and YOLO11m-cls (20.90 MB) provided the best trade-off between size and performance, making them practical for embedded systems. YOLO11l-cls was larger (25.90 MB) but justified it with high accuracy in Sets 3 and 4. In contrast, YOLO11x-cls, the largest at 57.00 MB, underperformed on both Set1 and Set3, questioning its efficiency and suitability for practical applications.
The analysis clearly demonstrated that YOLO11s-cls and YOLO11m-cls were the most effective models for detecting E. coli droplets across different concentration levels and surface complexities. These models consistently maintained high classification accuracy, handled both clean and organically contaminated backgrounds, and effectively distinguished E. coli from egg white and yolk droplets. While YOLO11n-cls was lightweight and fast, it showed performance degradation in more challenging visual conditions. YOLO11x-cls, although resource-intensive, failed to outperform smaller models, making it inefficient for field use. Ultimately, YOLO11s-cls was identified as the most practical and robust model due to its consistently high accuracy across all datasets, moderate model size, and low inference latency. While these results are promising, further evaluation under more diverse and realistic conditions, including different surface materials, mixed food residues, uneven contamination patterns, and operational variability, will be necessary to fully assess its suitability for real-world food safety monitoring systems.
3.3. Comparison of YOLO11-cls with Other Models
In a comparative performance analysis on the best YOLO11-cls model, several deep learning and classical machine learning models were evaluated for their ability to differentiate E. coli droplets of varying concentrations on different surface materials, including stainless steel and white rubber, both with and without the presence of egg white or yolk. The objective was to assess whether models could distinguish E. coli from other organic materials and among different E. coli concentration levels.
Figure 6 shows that the YOLO11s-cls model demonstrated the most balanced performance across all evaluation criteria. It achieved the highest validation accuracy (98.28%) and a high-test accuracy (96.98%), while maintaining a small model size (11 MB) and a fast inference time (4.65 ms). Despite slightly higher standard deviations (5.64% for validation and 5.10% for testing), its combination of precision, speed, and lightweight architecture made it ideal for real-time, resource-efficient applications. In comparison, ConvNeXtBase achieved the highest test accuracy (97.41%) and a strong validation accuracy (97.73%) with lower standard deviations (2.92% and 2.34%, respectively), indicating robust and consistent performance. However, its large model size (334.19 MB) and longer inference time (8.45 ms) may hinder deployment on memory-constrained systems. EfficientNetV2L, while architecturally advanced, underperformed in this task, showing a validation accuracy of 89.35%, test accuracy of 83.75%, and the highest test standard deviation (8.99%), reflecting inconsistent classification performance. Furthermore, it had the largest model size (449.74 MB) and slowest inference time (15.58 ms) among all models tested. Among classical machine learning methods, Random Forest outperformed SVM, delivering both validation and test accuracies of 89.65%, with a compact model size (3.48 MB) and moderate stability (standard deviation of 4.33%). On the other hand, SVM yielded the lowest performance, with validation and test accuracies of 67.62% and a high standard deviation (8.54%), suggesting limited capacity to generalize across the different datasets.
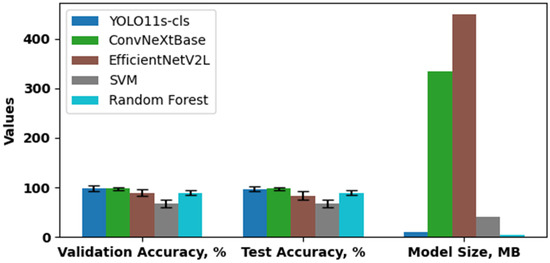
Figure 6.
Performance comparison of YOLO11s-cls, ConvNeXtBase, EfficientNetV2L, and classical machine learning models (Random Forest and SVM) in terms of validation and test accuracy, and model size.
Overall, the results confirmed that YOLO11s-cls provided the most effective solution for identifying E. coli concentrations in the presence of other organic contaminants across diverse surfaces. It offered the best trade-off between accuracy, inference speed, and model compactness, establishing its potential for practical deployment in food safety and contamination detection scenarios.
3.4. Error Mode Analysis
Figure 7 illustrates the normalized confusion metrics to understand the error modes in classifying different concentration levels of E. coli (0 CFU/mL: no_ecoli, 105 CFU/mL: low, 107 CFU/mL: medium, 108 CFU/mL: hot on stainless steel and white rubber surfaces, as well as on the same surfaces with egg white and egg yolk droplets. It was found that the YOLO11s-cls model exhibited partial confusion between the ‘no_ecoli ’ and ‘low’ classes on stainless steel surfaces. Specifically, 24% of the ‘no_ecoli’ images were misclassified as ‘low’, while 17.5% of the ‘low’ images were misclassified as ‘no_ecoli’ (Figure 7a). This suggested that at minimal contamination levels, the visual cues present in the fluorescence images on reflective stainless steel were insufficiently distinct, leading to classification errors. However, the model accurately identified all instances of the ‘medium’ and ‘hot’ concentration levels, indicating that higher E. coli loads exhibited stronger and more consistent fluorescence features.
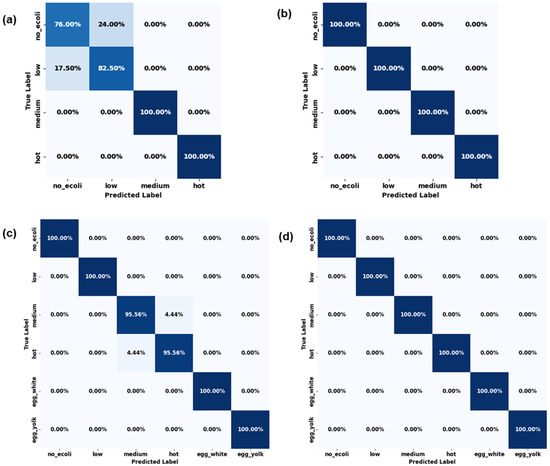
Figure 7.
Confusion matrices of the YOLO11s-cls model for classifying different E. coli concentrations on (a) stainless steel, (b) white rubber, and E. coli with egg substances on (c) stainless steel and (d) white rubber.
In contrast, the model’s performance on white rubber surfaces with E. coli-only droplets was flawless (Figure 7b). All four classes, including ‘no_ecoli’, ‘low’, ‘medium’, and ‘hot’, were classified with 100% accuracy. The uniform and non-reflective nature of the white rubber likely enhanced the visibility of fluorescence patterns, enabling the model to better discriminate even subtle differences in contamination levels. The complexity of the classification task increased when egg white and egg yolk droplets were introduced alongside the E. coli concentration classes. On stainless steel surfaces (Figure 7c), the model successfully distinguished all six classes, with perfect classification for ‘no_ecoli’, ‘low’, ‘egg_white’, and ‘egg_yolk’. However, minor confusion occurred between the ‘medium’ and ‘hot’ E. coli classes: 4.44% of the ‘medium’ samples were misclassified as ‘hot’, and 4.44% of the ‘hot’ samples were misclassified as ‘medium’. These results suggested that while the model effectively learned the distinct visual features of egg-derived substances, its ability to differentiate between adjacent E. coli concentrations was slightly reduced in the presence of more visually complex droplet conditions.
On white rubber surfaces under the same six-class scenario, the model again achieved perfect classification across all categories (Figure 7d). The presence of egg white and egg yolk did not interfere with the classification of different E. coli concentrations, demonstrating a high degree of robustness in the model’s performance on this surface, even under increased visual complexity.
In summary, the YOLO11s-cls model demonstrated strong capability in classifying both E. coli concentrations and other organic droplet types when applied individually and imaged under fluorescence conditions. The model’s performance was highly dependent on the surface material. While it performed near-perfectly on white rubber, it showed minor misclassification on stainless steel, particularly between closely related E. coli concentrations. The inclusion of egg substances did not affect classification performance on white rubber but introduced slight ambiguity on stainless steel. These findings demonstrate the significance of background surface properties in fluorescence-based droplet classification and underscored the model’s potential for practical applications in contamination detection across diverse material types.
The overall performance of the best-performing model (YOLO11s-cls), including Precision, Recall, F1-score, and Accuracy across all datasets, is summarized in Table 2. The model achieved its best performance on white rubber surfaces for both E. coli alone and mixed E. coli-egg contamination, where perfect classification metrics were obtained. The comparatively lowest performance was observed for E. coli on stainless steel, although metrics remained high (0.897), indicating reliable detection.
Table 2.
Precision, Recall, and F1-score of YOLO11s-cls model across datasets containing varying E. coli concentrations and egg substances on stainless steel and white rubber surfaces.
3.5. Visualizing the Classified Images
The classification behavior of the YOLO11-cls model was visually interpreted using Eigen-CAM heat maps. These were generated from test fluorescence images of droplets with no E. coli and with 108 CFU/mL E. coli on stainless steel and white rubber (Figure 8a). Additionally, Eigen-CAM was applied to egg white and egg yolk droplets on stainless steel and white rubber (Figure 8b). While the heat intensity does not represent E. coli concentration, it consistently aligns with fluorescence zones, confirming the model’s focus on biologically relevant areas during classification.
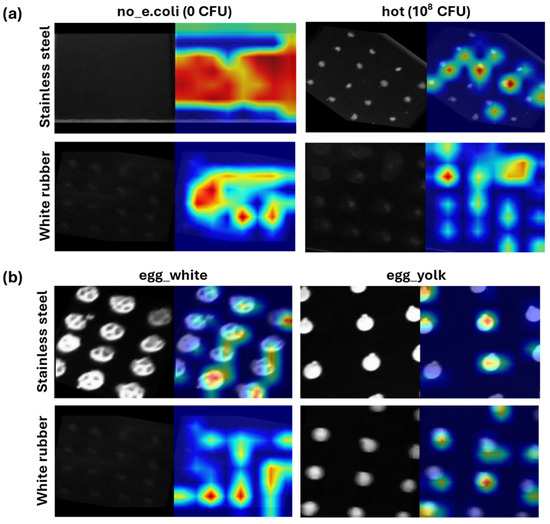
Figure 8.
Eigen-CAM heat maps (right) of the YOLO11-cls model applied to denoised fluorescence images (left) with: (a) no E. coli and 108 CFU/mL E. coli droplets on stainless steel and white rubber, and (b) egg white and egg yolk droplets on stainless steel and white rubber.
The Eigen-CAM visualizations illustrate how the YOLO11-cls model responded to different test conditions. Droplets with no E. coli cells on stainless steel showed no fluorescence, as expected, while faint fluorescence was detected on white rubber, likely due to residual surface moisture. Among the E. coli samples, 108 CFU/mL produced the strongest fluorescence response, consistent with its high bacterial load. Egg white and egg yolk droplets also elicited strong responses, suggesting possible interference from non-E. coli substances. The Eigen-CAM maps further highlighted the image regions that most influenced the model’s classification decisions. As a class-agnostic method, these maps may not indicate features uniquely specific to E. coli. Comparisons across contamination types suggest that the model relies on a combination of local fluorescence intensity, texture, and spatial distribution rather than droplet presence alone.
4. Discussion
This study demonstrated a workflow combining UV-C fluorescence imaging, wavelet-based denoising, and deep learning can detect E. coli contamination on stainless steel and white rubber surfaces, extending prior research on fluorescence-based bacterial detection. The approach was effective not only under clean conditions but also in the presence of organic interferences such as egg white and yolk, which could often confound optical detection systems. Across all experiments, the best-performing YOLO11-cls models achieved test accuracies up to 100% on white rubber and 99.6% on stainless steel with organic interference, whereas past work using deep learning approaches in produce contexts reported lower accuracies for analogous tasks [2,3]. Although these high accuracies on white rubber may partly reflect its favorable optical properties rather than solely model robustness. Performance on stainless steel remained strong but exhibited slightly higher variability, highlighting that surface-dependent optical differences can affect sensitivity and signal contrast. These observations suggest that deployment in diverse environments may require surface-specific calibration or fine-tuning to maintain optimal performance. Overall, these findings extend previous reports of fluorescence-based microbial detection by integrating wavelet-based preprocessing, modern deep learning, and explainable AI into a robust end-to-end workflow.
The denoising stage was critical to model performance. Haar wavelets consistently achieved the highest PSNR values, with 48.2 dB for stainless steel and 51.0 dB for white rubber surfaces, compared with lower values for other wavelet families. Even in the more challenging egg-contaminated datasets, Haar wavelets improved PSNR to 37.4 dB (stainless steel) and 36.9 dB (white rubber), demonstrating superior preservation of biologically relevant fluorescence features. These results confirmed that Haar-based denoising preserved fluorescence features while reducing structured background noise, which directly contributed to improved classification accuracy.
Building on these enhanced inputs, the performance of various deep learning models was evaluated. Among the tested models, YOLO11s-cls and YOLO11m-cls achieved the most favorable balance of accuracy, inference speed, and model size. YOLO11s-cls reached a peak test accuracy of 98.88% and maintained low inference times (4–5 ms), making it particularly well suited for real-time applications in food safety monitoring. By contrast, YOLO11x-cls, despite being the largest (57 MB), underperformed on stainless steel (90% accuracy) and introduced higher computational costs. Transfer learning models such as ConvNeXtBase also achieved high test accuracy (97.41%), but their large model size and longer inference times limited their practicality compared to YOLO11s-cls. Classical machine learning approaches such as Random Forests and SVMs fell short, with maximum accuracies of 89.65% and 67.62%, respectively, confirming the superior capability of deep learning for this task. The observed differences in performance across models can be attributed to several factors. YOLO11s-cls combines lightweight architecture with high feature extraction efficiency, enabling it to capture relevant fluorescence patterns consistently, which ex-plains its high accuracy and balanced standard deviations. ConvNeXtBase, while larger and slower, maintains stable performance due to its deeper architecture and capacity to model complex patterns, resulting in lower standard deviations. EfficientNetV2L, though architecturally advanced, may overfit or struggle with the specific fluorescence features in this dataset, leading to lower accuracy and higher variability. Classical methods like Random Forest and SVM rely on hand-crafted features and have limited ability to generalize across heterogeneous surfaces and contamination scenarios, causing lower performance and higher variability, particularly for SVM.
Surface type played a significant role in classification outcomes. On white rubber, all E. coli concentration classes (0, 105, 107, 108 CFU/mL) were classified with 100% accuracy, even when egg residues were present. In contrast, stainless steel posed greater challenges: at low contamination levels, 24% of “no_ecoli” samples were misclassified as “low” and 17.5% of “low” samples were misclassified as “no_ecoli” However, medium and high contamination levels (107 and 108 CFU/mL) were correctly identified with 100% accuracy. These results suggested that reflective surfaces such as stainless steel reduced the distinctiveness of low-level fluorescence signals from E. coli.
The inclusion of egg white and yolk droplets simulated realistic interference in food-processing environments. On stainless steel, the YOLO11s-cls model occasionally confused medium and high E. coli concentrations (4.4% misclassification each way), but it never confused bacterial contamination with egg-derived substances. On white rubber, all classes, including egg white and yolk, were classified with perfect accuracy. This indicated that the workflow effectively distinguished between bacterial and organic food residues, a notable advancement over earlier single-contaminant studies.
Finally, model interpretability using Eigen-CAM confirmed that YOLO11 focused on biologically relevant regions of fluorescence rather than background noise. The heatmaps consistently highlighted droplet areas containing E. coli or egg residues, reinforcing confidence in the model’s decision-making. Such interpretability tools are essential for building trust in AI-based contamination detection systems, particularly in food safety applications where accountability and transparency are critical.
Overall, the workflow demonstrated reliable detection of both the presence and absence of E. coli, even in the presence of egg residues on white rubber surfaces. Stainless steel posed more challenges, reflecting some difficulty in detecting low-level contamination. The combination of the UV-C fluorescence device and YOLO11s-cls model enables precise classification of E. coli concentrations by leveraging differences in fluorescence intensity, spatial distribution, and texture. Deep learning models have previously been applied for bacterial detection in images [48,49]; however, concentration levels in the presence of organic residues are classified by the presented workflow, achieving good accuracy on heterogeneous surfaces. Under controlled conditions, the workflow reliably distinguishes between 105, 107, and 108 CFU/mL. While the primary operational requirement in food safety is detecting contamination above regulatory action limits, the ability to differentiate medium and high concentrations provides additional information for risk assessment and process monitoring. These results also highlight that reflective surfaces such as stainless steel can reduce the distinctiveness of low-level fluorescence signals, whereas the workflow reliably detects E. coli presence above practical contamination thresholds. Taken together, these findings support the potential utility of the proposed system as a rapid, reliable screening tool for food safety applications, while also identifying surface-specific factors that may influence performance.
5. Conclusions
Detection of E. coli across varied surfaces and concentration levels, even in the presence of egg yolk and egg white, was achieved under controlled laboratory conditions in this study. The CSID+ system, coupled with wavelet denoising and a deep learning framework, enabled this performance. Several deep learning, transfer learning, and classical machine learning models were trained and evaluated to identify the most effective approach for this framework. To train these models, datasets were derived from continuous handheld video footage captured in varying surface types and with confounding egg substances, reflecting aspects of realistic handling conditions. However, the experiments were conducted under controlled laboratory settings with a limited range of surfaces, interferents, and inoculation patterns. Among the trained models, YOLO11s-cls offered the best balance of speed and accuracy, achieving up to 100% accuracy on most datasets, while transfer learning models such as ConvNeXtBase and EfficientNetV2L performed well but were less efficient. In contrast, classical machine learning models, including SVM and Random Forest, underperformed, underscoring the advantages of deep learning in this domain. Overall, the results confirm that combining UV-C fluorescence imaging, wavelet denoising, and YOLO11 deep learning models provides a reliable method for rapid detection of E. coli on the food-contact surfaces evaluated in this study (stainless steel and white rubber). Future studies will validate this workflow on other pathogens such as Salmonella and Listeria, test larger-scale deployment in operational food facilities, and explore adaptive imaging strategies to mitigate the reflectivity issues observed on stainless steel. In parallel, future work will expand datasets, incorporate additional confounding factors, address real-world noise, and adapt lightweight models for deployment on embedded devices, further enhancing robustness, generalization, and real-time applicability.
Author Contributions
Conceptualization, T.F.B., J.Q., M.K. and F.V.; methodology, T.F.B., P.K.Y. and F.V.; software, S.V., Z.I. and P.K.Y.; validation, T.F.B., M.A.R. and J.Z.; formal analysis, Z.I. and S.V.; investigation, T.F.B. and F.V.; resources, F.V.; data curation, T.F.B. and S.V.; writing—original draft preparation, Z.I., S.V. and P.K.Y.; writing—review and editing, T.F.B., Z.I., S.A.C.O. and Q.F.; visualization, P.K.Y.; supervision, T.F.B.; project administration, J.Q. and M.K.; funding acquisition, T.F.B. All authors have read and agreed to the published version of the manuscript.
Funding
This research was funded by USDA ARS Cooperative Agreement 58-8042-1-023.
Institutional Review Board Statement
Not applicable.
Informed Consent Statement
Not applicable.
Data Availability Statement
The image datasets presented in this article are not readily available due to proprietary restrictions of the sponsoring company. Requests to access the datasets should be directed to Thomas F. Burks (tburks@ufl.edu).
Acknowledgments
The authors are thankful to SafetySpect, Inc. for providing training and technical support for the CSI-D+ system used in this study, as well as to USDA ARS EMFSL for additional technical support. Appreciation is also extended to the University of Florida, Indian River Research and Extension Center (UF-IRREC) for hosting the data collection phase and providing samples.
Conflicts of Interest
Author Fartash Vasefi is an employee of SafetySpec. The remaining authors declare that the research was conducted in the absence of any commercial or financial relationships that could be construed as a potential conflict of interest.
Abbreviations
The following abbreviations are used in this manuscript:
| SS | Stainless Steel |
| WR | White Rubber |
| EW | Egg White |
| EY | Egg Yolk |
References
- NCEZID. National Center for Emerging and Zoonotic Infectious Diseases (NCEZID). NCEZID. CDC 2025. Available online: https://www.cdc.gov/foodborne-outbreaks/outbreaks/?CDC_AAref_Val=https://www.cdc.gov/foodborne-outbreaks/active-investigations/index.html (accessed on 26 June 2025).
- Vaddi, S.; Burks, T.F.; Iqbal, Z.; Yadav, P.K.; Frederick, Q.; Obellaneni, S.A.C.; Qin, J.; Kim, M.; Ritenour, M.A.; Zhang, J.; et al. Detecting Escherichia coli Contamination on Plant Leaf Surfaces Using UV-C Fluorescence Imaging and Deep Learning. Plants 2025, 14, 3352. [Google Scholar] [CrossRef] [PubMed]
- Yadav, P.K.; Burks, T.; Dudhe, K.; Frederick, Q.; Qin, J.; Kim, M.; Ritenour, M.A. Classification of E. coli Colony with Generative Adversarial Networks, Discrete Wavelet Transforms and VGG19. J. Radiol. Clin. Imaging 2023, 6, 146–160. [Google Scholar] [CrossRef]
- Solomon, E.B.; Yaron, S.; Matthews, K.R. Transmission of Escherichia coli O157:H7 from Contaminated Manure and Irrigation Water to Lettuce Plant Tissue and Its Subsequent Internalization. Appl. Environ. Microbiol. 2002, 68, 397–400. [Google Scholar] [CrossRef] [PubMed]
- Kim, S.; Asakura, H.; Kuri, A.; Watarai, M.; Shirahata, T.; Takeshi, K.; Tsukamoto, T.; Makino, S.I. Long-Term Excretion of Shiga Toxin-Producing Escherichia coli (STEC) and Experimental Infection of a Sheep with O157. J. Vet. Med. Sci. 2002, 64, 927–931. [Google Scholar] [CrossRef][Green Version]
- Besser, R.E.; Lett, S.M.; Weber, J.T.; Doyle, M.P.; Barrett, T.J.; Wells, J.G.; Griffin, P.M. An Outbreak of Diarrhea and Hemolytic Uremic Syndrome from Escherichia coli O157: H7 in Fresh-Pressed Apple Cider. JAMA—J. Am. Med. Assoc. 1993, 17, 2217–2220. [Google Scholar] [CrossRef]
- Janisiewicz, W.J.; Conway, W.S.; Brown, M.W.; Sapers, G.M.; Fratamico, P.; Buchanan, R.L. Fate of Escherichia coli O157:H7 on Fresh-Cut Apple Tissue and Its Potential for Transmission by Fruit Flies. Appl. Environ. Microbiol. 1999, 65, 1–5. [Google Scholar] [CrossRef]
- Hariri, S. Detection of Escherichia coli in Food Samples Using Culture and Polymerase Chain Reaction Methods. Cureus 2022, 14, e32808. [Google Scholar] [CrossRef]
- Bai, Z.; Xu, X.; Wang, C.; Wang, T.; Sun, C.; Liu, S.; Li, D. A Comprehensive Review of Detection Methods for Escherichia coli O157:H7. TrAC Trends Anal. Chem. 2022, 152, 116646. [Google Scholar] [CrossRef]
- Huang, Z.; Saito, Y.; Gao, T.; Al Riza, D.F.; Lu, R.; Cen, H.; Kondo, N.; Omwange, K.A. A Review of Fluorescence Imaging System Supported by Excitation-Emission Matrix for Fruit and Vegetable Quality Estimation. Food Control 2025, 169, 111040. [Google Scholar] [CrossRef]
- Lai, L.; Guo, Q.; Zou, W.; Huang, L.; Xu, S.; Qiao, D.; Wang, L.; Zheng, P.; Pan, Q.; Zhu, W. Space-Confined Nanozyme with Cascade Reaction Based on PCN-224 for Synergistic Bacterial Infection Treatment and NIR Fluorescence Imaging of Wound Bacterial Infections. Chem. Eng. J. 2024, 487, 150642. [Google Scholar] [CrossRef]
- Yadav, P.K.; Burks, T.; Qin, J.; Kim, M.; Dewdney, M.M.; Vasefi, F. Detection of Citrus Black Spot Fungi Phyllosticta Citricarpa & Phyllosticta Capitalensis on UV-C Fluorescence Images Using YOLOv8. Smart Agric. Technol. 2024, 9, 100615. [Google Scholar] [CrossRef]
- Labadie, M.; Marchal, F.; Merbahi, N.; Girbal-Neuhauser, E.; Fontagné-Faucher, C.; Marcato-Romain, C.E. Cell Density and Extracellular Matrix Composition Mitigate Bacterial Biofilm Sensitivity to UV-C LED Irradiation. Appl. Microbiol. Biotechnol. 2024, 108, 286. [Google Scholar] [CrossRef]
- Popović, V.; Newport, M.; Rahman, A.; Koutchma, T. Measuring the Performance of Conventional and Emerging Ultraviolet-C Light Sources for Bacterial, Fungal, and Mycotoxin Control. Food Control 2024, 165, 110640. [Google Scholar] [CrossRef]
- Chin, S.Y.; Dong, J.; Hasikin, K.; Ngui, R.; Lai, K.W.; Yeoh, P.S.Q.; Wu, X. Bacterial Image Analysis Using Multi-Task Deep Learning Approaches for Clinical Microscopy. PeerJ Comput. Sci. 2024, 10, e2180. [Google Scholar] [CrossRef] [PubMed]
- Nagro, S.A. A Systematic Literature Review of Deep Learning-Based Detection and Classification Methods for Bacterial Colonies. Int. J. Adv. Comput. Sci. Appl. 2022, 13, 185–202. [Google Scholar] [CrossRef]
- Cinar, I.; Taspinar, Y.S. Detection of Fungal Infections from Microscopic Fungal Images Using Deep Learning Techniques. Proc. Int. Conf. Adv. Technol. 2023, 11, 21–28. [Google Scholar] [CrossRef]
- Aliee, M.; Gorji, H.T.; Vasefi, F.; Yaggie, K.; Qin, J.; Baek, I.; Kim, M.S.; Chan, D.E.; Johnson, M.; Downs, Z.; et al. GLOW-DL: Generalized Light-Optimized Workflow with Deep Learning for Contamination Detection Using Fluorescence Imaging in Variable Conditions. J. Biosyst. Eng. 2025, 50, 240–254. [Google Scholar] [CrossRef]
- Mao, J.; He, H. Deep Learning in Fluorescence Imaging and Analysis. J. Intell. Med. 2024, 1, 42–62. [Google Scholar] [CrossRef]
- Waters, J.C. Accuracy and Precision in Quantitative Fluorescence Microscopy. J. Cell Biol. 2009, 185, 1135–1148. [Google Scholar] [CrossRef]
- Laine, R.F.; Jacquemet, G.; Krull, A. Imaging in Focus: An Introduction to Denoising Bioimages in the Era of Deep Learning. Int. J. Biochem. Cell Biol. 2021, 140, 106077. [Google Scholar] [CrossRef]
- Hussain, D.; Hyeon Gu, Y. Exploring the Impact of Noise and Image Quality on Deep Learning Performance in DXA Images. Diagnostics 2024, 14, 1328. [Google Scholar] [CrossRef] [PubMed]
- Pingping, W.; Jiahua, C. Fault Diagnosis of Spent Fuel Shearing Machines Based on Improved Residual Network. Ann. Nucl. Energy 2024, 196, 110228. [Google Scholar] [CrossRef]
- Pereira Neto, A.; Barros, F.J.B. Noise Reduction in Brain Magnetic Resonance Imaging Using Adaptive Wavelet Thresholding Based on Linear Prediction Factor. Front. Neurosci. 2025, 18, 1516514. [Google Scholar] [CrossRef] [PubMed]
- Hüpfel, M.; Kobitski, A.Y.; Zhang, W.; Nienhaus, G.U. Wavelet-Based Background and Noise Subtraction for Fluorescence Microscopy Images. Biomed. Opt. Express 2021, 12, 969. [Google Scholar] [CrossRef]
- Wang, Q.; Li, Z.; Zhang, S.; Chi, N.; Dai, Q. A Versatile Wavelet-Enhanced CNN-Transformer for Improved Fluorescence Microscopy Image Restoration. Neural Netw. 2024, 170, 227–241. [Google Scholar] [CrossRef]
- Zhao, X.; Huang, P.; Shu, X. Wavelet-Attention CNN for Image Classification. Multimed. Syst. 2022, 28, 915–924. [Google Scholar] [CrossRef]
- Čapek, M.; Blažíková, M.; Novotný, I.; Chmelová, H.; Svoboda, D.; Radochová, B.; Janáček, J.; Horváth, O. The Wavelet-Based Denoising of Images in Fiji, with Example Applications in Structured Illumination Microscopy. Image Anal. Stereol. 2021, 40, 3–16. [Google Scholar] [CrossRef]
- Chang, C.W.; Mycek, M.A. Total Variation versus Wavelet-Based Methods for Image Denoising in Fluorescence Lifetime Imaging Microscopy. J. Biophotonics 2012, 5, 449–457. [Google Scholar] [CrossRef]
- Ali, S.; Abuhmed, T.; El-Sappagh, S.; Muhammad, K.; Alonso-Moral, J.M.; Confalonieri, R.; Guidotti, R.; Del Ser, J.; Díaz-Rodríguez, N.; Herrera, F. Explainable Artificial Intelligence (XAI): What We Know and What Is Left to Attain Trustworthy Artificial Intelligence. Inf. Fusion 2023, 99, 101805. [Google Scholar] [CrossRef]
- Bany Muhammad, M.; Yeasin, M. Eigen-CAM: Visual Explanations for Deep Convolutional Neural Networks. SN Comput. Sci. 2021, 2, 47. [Google Scholar] [CrossRef]
- Liu, G.; Zhou, W.; Tian, L.; Chung, C.-T.; Jia, J.; Ying, C. Seg-Eigen-CAM: Eigen-Value-Based Visual Explanations for Semantic Segmentation Models. Appl. Sci. 2025, 15, 7562. [Google Scholar] [CrossRef]
- Liu, X.; Sun, L.; Zhang, X.; Ye, Y.; Zhao, B. HGNet: High-Order Spatial Awareness Hypergraph and Multi-Scale Context Attention Network for Colorectal Polyp Detection. arXiv 2025, arXiv:2507.04880. [Google Scholar]
- Almenwer, S.; El-Sayed, H.; Sarker, M.K. Classification Method in Vision Transformer with Explainability in Medical Images for Lung Neoplasm Detection. In Proceedings of the 2024 International Conference on Medical Imaging and Computer-Aided Diagnosis (MICAD 2024), Manchester, UK, 19–21 November 2024; Lecture Notes in Electrical Engineering 2025, 1372 LNEE. Springer: Singapore, 2025; pp. 85–99. [Google Scholar] [CrossRef]
- Li, X.; Deng, X.; Wu, X.; Xie, Z. RDAS-MODEL: An Efficient Model of Road Drivable Area Segmentation for Autonomous Driving. Meas. Sci. Technol. 2025, 36, 055103. [Google Scholar] [CrossRef]
- Li, D.; Wang, L.; Zhang, L. SDF-YOLO: A Multi-Scale Dynamic Feature Fusion Network for Enhanced Lightweight Object Detection in Autonomous Driving. TechRxiv 2025. [Google Scholar] [CrossRef]
- Praveen, S.; Jung, Y. CBAM-STN-TPS-YOLO: Enhancing Agricultural Object Detection through Spatially Adaptive Attention Mechanisms. arXiv 2025, arXiv:2506.07357. [Google Scholar]
- Jahin, A.; Soudeep, S.; Mridha, M.F.; Member, S.; Hossen, J.; Dey, N.; Jakir Hossen, M. Soybean Disease Detection via Interpretable Hybrid CNN-GNN: Integrating MobileNetV2 and GraphSAGE with Cross-Modal Attention. arXiv 2025, arXiv:2503.01284. [Google Scholar]
- Danyluk, M.D.; Friedrich, L.M.; Dunn, L.L.; Zhang, J.; Ritenour, M.A. Reduction of Escherichia Coli, as a Surrogate for Salmonella spp., on the Surface of Grapefruit during Various Packingline Processes. Food Microbiol. 2019, 78, 188–193. [Google Scholar] [CrossRef]
- Yadav, P.K.; Burks, T.; Vaddi, S.; Qin, J.; Kim, M.; Ritenour, M.A.; Vasefi, F. Detection of E. coli Concentration Levels Using CSI-D+ Handheld with UV-C Fluorescence Imaging and Deep Learning on Leaf Surfaces. In Proceedings of the Sensing for Agriculture and Food Quality and Safety XVI, National Harbor, MD, USA, 22–24 April 2024; Volume 13060, pp. 44–54. [Google Scholar] [CrossRef]
- Lee, G.R.; Gommers, R.; Waselewski, F.; Wohlfahrt, K.; O’Leary, A. PyWavelets: A Python Package for Wavelet Analysis. J. Open Source Softw. 2019, 4, 1237. [Google Scholar] [CrossRef]
- Jocher, G.; Qiu, J. Ultralytics YOLO11 2024. Available online: https://github.com/ultralytics/ultralytics (accessed on 3 May 2025).
- Liu, Z.; Mao, H.; Wu, C.Y.; Feichtenhofer, C.; Darrell, T.; Xie, S. A ConvNet for the 2020s. In Proceedings of the IEEE Computer Society Conference on Computer Vision and Pattern Recognition 2022, New Orleans, LA, USA, 18–24 June 2022; pp. 11966–11976. [Google Scholar] [CrossRef]
- Tan, M.; Le, Q.V. EfficientNetV2: Smaller Models and Faster Training. Proc. Mach. Learn. Res. 2021, 139, 10096–10106. [Google Scholar]
- Muhammad, M.B.; Yeasin, M. Eigen-CAM: Class Activation Map Using Principal Components. In Proceedings of the International Joint Conference on Neural Networks 2020, Glasgow, UK, 19–24 July 2020. [Google Scholar] [CrossRef]
- Shirvalkar, R. EigenCAM for YOLO V11 Interpretability 2024. Available online: https://github.com/rigvedrs/YOLO-V11-CAM (accessed on 5 May 2025).
- Choi, J.; Rajendran, M.; Cheol Suh, Y. Explainable Rip Current Detection and Visualization with XAI EigenCAM. In Proceedings of the International Conference on Advanced Communication Technology, ICACT 2024, Pyeong Chang, Republic of Korea, 4–7 February 2024; pp. 315–320. [Google Scholar] [CrossRef]
- Simon-Johannes, B.; Thomas, R.; Kerstin, T. Automated Colony Detection in Fluorescent Images Using U-Net Models. In Proceedings of the 2024 IEEE 22nd World Symposium on Applied Machine Intelligence and Informatics (SAMI) 2024, Stará Lesná, Slovakia, 25–27 January 2024; pp. 333–338. [Google Scholar] [CrossRef]
- Abougarair, A.J.; Oun, A.A.; Sawan, S.I.; Ma’arif, A. Deep Learning-Based Automated Approach for Classifying Bacterial Images. Int. J. Robot. Control Syst. 2024, 4, 849–876. [Google Scholar] [CrossRef]


Disclaimer/Publisher’s Note: The statements, opinions and data contained in all publications are solely those of the individual author(s) and contributor(s) and not of MDPI and/or the editor(s). MDPI and/or the editor(s) disclaim responsibility for any injury to people or property resulting from any ideas, methods, instructions or products referred to in the content. |
© 2026 by the authors. Licensee MDPI, Basel, Switzerland. This article is an open access article distributed under the terms and conditions of the Creative Commons Attribution (CC BY) license.