


Abstract
Recently, the application of the strength reduction method (SRM) to tunnel stability research has become a trend. The failure criteria for the SRM in tunnels often draw from those used in slopes. The applicability of the newly proposed energy mutation criterion from slopes to the tunnels is explored. Additionally, a new criterion—the variational criterion—is suggested for tunnels. The effectiveness of the aforementioned work is validated based on unlined tunnels, lined tunnels, and constructed tunnels. The results indicate that the energy or variational value can serve as a new indicator for tunnel stability. For the variational criterion, the applicability is not coincidental with respect to mesh densities, strength reduction factor intervals, geometric parameters, and mechanical parameters. In specific tunnels, the variational criterion exhibits several relatively distinct characteristics of simplicity, comprehensiveness, clarity, reliability, and uniformity. This criterion provides a theoretical basis and mechanical explanation for tunnel failure.
1. Introduction
Tunnel stability represents one of the critical issues in geotechnical engineering. The factor of safety serves as a key quantitative indicator for assessing stability. For determining the factor of safety of the geotechnical engineering, the strength reduction method (SRM) has been proposed [1]. Particularly in slopes, it has been demonstrated that results of the SRM are very close to those of the limit equilibrium method and the limit analysis method [2]. In tunnels, it currently lacks a safety factor to evaluate the overall stability of a tunnel [3,4]. The introduction of the SRM into tunnels has become a trend [5,6,7]. Some scholars employed the SRM as the primary approach for calculating the safety factor of tunnels [8,9,10,11,12,13,14]. Some researchers integrated SRM with limit analysis methods to derive safety factors for tunnel faces under various conditions, such as groundwater, rock bolt support, and complex structural planes [15,16,17,18,19,20]. Additionally, some researchers utilized the computational results of SRM as references in their studies or adopted experimental approaches to analyze the tunnel stability through the SRM [21,22].
The application of SRM lies in the selection of an appropriate failure criterion. Currently, the choice of failure criteria for SRM in tunnels often references practices from slopes. In slopes, three commonly used failure criteria include Criterion I: the displace-ment at the characteristic point mutation [1,23], Criterion II: the plastic zone penetration [24,25], and Criterion III: the numerical program non-convergence [26,27]. Furthermore, Criterion IV of energy mutation has been proposed in recent years [28,29]. Specifically, Criterion IV1 represents the gravitational potential energy loss mutation. Criterion IV2 denotes the dissipated energy increment mutation. Criterion IV3 signifies the kinetic energy increment mutation. Research indicates that Criterion IV demonstrates satisfactory applicability in slopes [30,31,32]. Based on these criteria, scholars have adopted Criterion I [33,34,35], Criterion II [36], and Criterion III [8,37] when applying the SRM to tunnels.
The core failure of the criterion lies in determining stability indices as well as identifying instability methods. Traditionally, the stability indices for tunnels or underground engineering are primarily divided into three categories. The instability is deemed to occur when these indices exceed a certain critical value. The first category comprises the stress, including indicators such as strength-to-stress ratio [9,38], stress concentration factor [39,40], brittle shear ratio [41,42], depth of yield zone [43,44], and depth of failure [45]. The second category consists of the strain, which cover indicators like Stacey’s extension strain [46], Sakurai’s critical strain [47], Aydan’s squeezing assessment strain [48], geometrically accumulated deformation [49], strain-strength [50], critical tensile strain [51,52], mean stress–volumetric strain [53], plastic damage index [54,55], and displacement or relative displacement [56]. The third category pertains to indicators considering the combined effect of stress and strain, including elastic energy [57], strain energy [58,59], dissipated energy [60,61,62,63], radiated energy [64], and elastic energy–dissipated energy ratio [65]. However, for different types of tunnels, conventional failure criteria require determining different stability indices and critical values. Thus, it is difficult to establish a unified framework for the conventional criteria.
Indeed, Criteria I, II, III, and IV of the SRM in tunnels fall within the category of conventional criteria, and there is also no unified standard for them. For the stability indices, the stability indicator of Criterion I—the displacement of characteristic points—falls within the category of strain. The stability indicator of Criterion II—the plastic zone—belongs to the stress category. The stability indicator of Criterion III—the convergence of the computational program—pertains to either stress or strain. The stability indicator of Criterion IV—the energy—is essentially the integral of the partial stress–strain product. The method of identifying instability is determining the mutation of the displacement curves in Criterion I. It is determining the penetration of some plastic zones in Criterion II. It is determining the occurrance of the computational program in Criterion III. It is determining the mutation of the energy curves in Criterion IV.
Some scholars have treated the tunnel as an integrated system and analyze its stability based on the principle of minimum potential energy [66,67,68]. The principle of minimum potential energy allows for a comprehensive consideration of the energy transformation processes within a structure. Its essential implication lies in the total potential energy of the structure attaining a minimum value. It implies that the sign of the second-order variational value of the total potential energy can serve as a unified criterion for identifying the stability or instability of various tunnels. Considering that, there is currently limited literature exploring the applicability of Criterion IV in tunnels when the SRM is used. The application of the variational method in tunnels has primarily focused on theoretical derivations [69,70]; limited studies have ventured into the exploration of numerical indicators. Moreover, there is currently a lack of more comprehensive stability indicators and unified identifying instability methods for tunnels. As noted by Heidarzadeh et al. [71], it can be explored by integrating the stress and strain using the FISH language coding in the finite difference procedure—FLAC3D software version 5.0. This study utilizes the FLAC3D software version 3.0 to investigate the performance of Criterion IV and propose the new failure criterion for tunnels based on the SRM.
This paper focuses on two main objectives: (1) to investigate the applicability of the energy mutation criterion in tunnels, and (2) to propose a new failure criterion—the variational criterion. The effectiveness of these works is subsequently verified through case studies involving unlined tunnels, lined tunnels, engineering tunnels, and complex loading tunnels. The structure of this paper is organized as follows. Section 2 introduces the SRM and various failure criteria. Section 3 validates the applicability and generality of both the energy mutation criterion and the variational criterion using unlined, lined, constructed, and complex loading tunnel examples. Section 4 provides a discussion of the findings. Finally, Section 5 presents the conclusions derived from this study. Based on this study, it provides a new stability indicator, the variational value, and a new identifying instability method, determining the sign of the variational value for tunnels. Through the variational value changing, it offers a unified mechanical explanation for the failure of specific tunnels.
2. Materials and Methods
2.1. Strength Reduction Method
The numerical model of a tunnel is established in the FLAC3D software. The strength parameters of the effective cohesion and the internal friction angles areconcerned. The initial strength parameters of the material are continuously reduced. The new strength parameters are substituted into the model to calculate until the model fails. The strength reduction factor (SRF) corresponding to the model failure is taken as the factor of safety of the model. As shown in Equation (1), the initial strength parameters (denoted as and ) are divided by the SRF (denoted as ) to obtain the new strength parameters (denoted as and ), respectively.
2.2. Conventional Failure Criteria
The criterion to determine the model failure is the failure criterion. As is stated above, there are mainly four types of criteria. They are Criterion I, Criterion II, Criterion III, and Criterion IV. (i) Criterion I, the displacement at the characteristic point catastrophe. In this criterion, the relationship curve between the displacement of monitoring points and the SRF is plotted. The SRF at the catastrophe point of the curve is defined as the safety factor. (ii) Criterion II, the plastic zone penetration. In this criterion, the SRF at the moment when there is a certain degree of plastic zone penetration is defined as the safety factor. (iii) Criterion III, the numerical program non-convergence. It is realized by the FOS command in the software FLAC3D in this paper. (iv) Criterion IV, the energy catastrophe. In this criterion, the relationship curves between various energy losses or increments and the SRFs are plotted, respectively. The SRF corresponding to the catastrophe point on the curve is defined as the safety factor of the model. Specifically, IV1 represents the gravitational potential energy loss catastrophe, IV2 represents the dissipated energy increment catastrophe, and IV3 represents the kinetic energy increment catastrophe. Relative calculation is shown in Equation (2).
where is the gravitational potential energy of the model; is the elastic energy of the model; is the kinetic energy of the model; is the dissipated energy of the model; represents the changes in various energy components of the model under a specific SRF compared to the initial state; is the density of the element; is the gravitational acceleration; is the settlement of the center of the element; is the stress tensor of the element; is the strain tensor of the element; is the velocity of the center of the element; represents the volume of the element; and represents the total volume of the model.
2.3. The Proposed Variational Criterion
Assuming that there exists a numerical model in the FLAC3D software, the loading conditions of the model are as follows: There is only the gravitational loading. The boundary conditions of the model are either prescribed stress boundaries or non-working boundaries. If the numerical model is regarded as a whole system, the stability of the model can be judged by the second-order variational value of the total potential energy (denoted as ) of the model. According to the definition, is the algebraic sum of the internal force work (denoted as ) and the external force work (denoted as ). When small virtual displacements compatible with the boundary constraints are applied on the model, remains unchanged. In mathematical expressions, the first-order variational value of is always equal to zero. That is, always takes the local maximum or minimum. As is known, the principle of minimum potential energy is universal. When the model is in a stable state, the local minimum of is taken. It means that the second-order variational value of is greater than zero. When the model is in an unstable state, the local maximum of is taken. It means that the second-order variational value of is less than zero. In conclusion, when the model is stable, the second-order variational value of is greater than zero. When the model is unstable, the second-order variational value of is less than zero. The relevant derivation formulas are given by Equations (3) and (4).
where represents the first-order variation; , , and are the strain energy, body force, and surface force, respectively; and are the initial displacement tensor and strain tensor, respectively; and are the first-order variational values of displacement tensor and strain tensor, respectively; and and are the area of the model boundary and the volume of the model body, respectively.
After expanding , and according to Taylor’s series and ignoring the second-order minute quantities, the first-order variational value expression of can be transformed into Equation (5).
The second-order variational value of can be calculated according to Equation (6).
For a certain model, the body force is constant. So, the second-order variational value of is zero. That is, there are and . Because the boundaries are with either the prescribed stress or the non-working effect, there are or . That is, there are or . So, Equation (6) can be transformed into Equation (7).
Whether the model is stable or not depends on the sign symbol of the variational value. To unify the order of magnitude of various variational values of different models, the mean variational value (denoted as ) is defined. The “variational value” mentioned in the following text is the mean variational value. As is shown in Equation (8), this value is obtained by dividing the total variational value by the volume of the model body. It does not change the sign symbol of the total variational value.
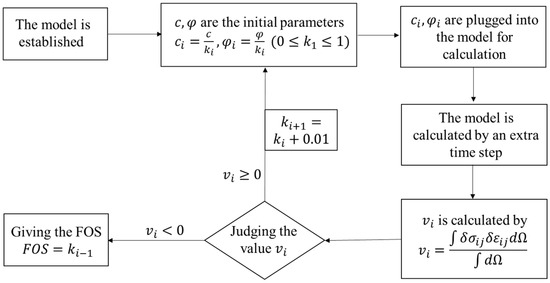
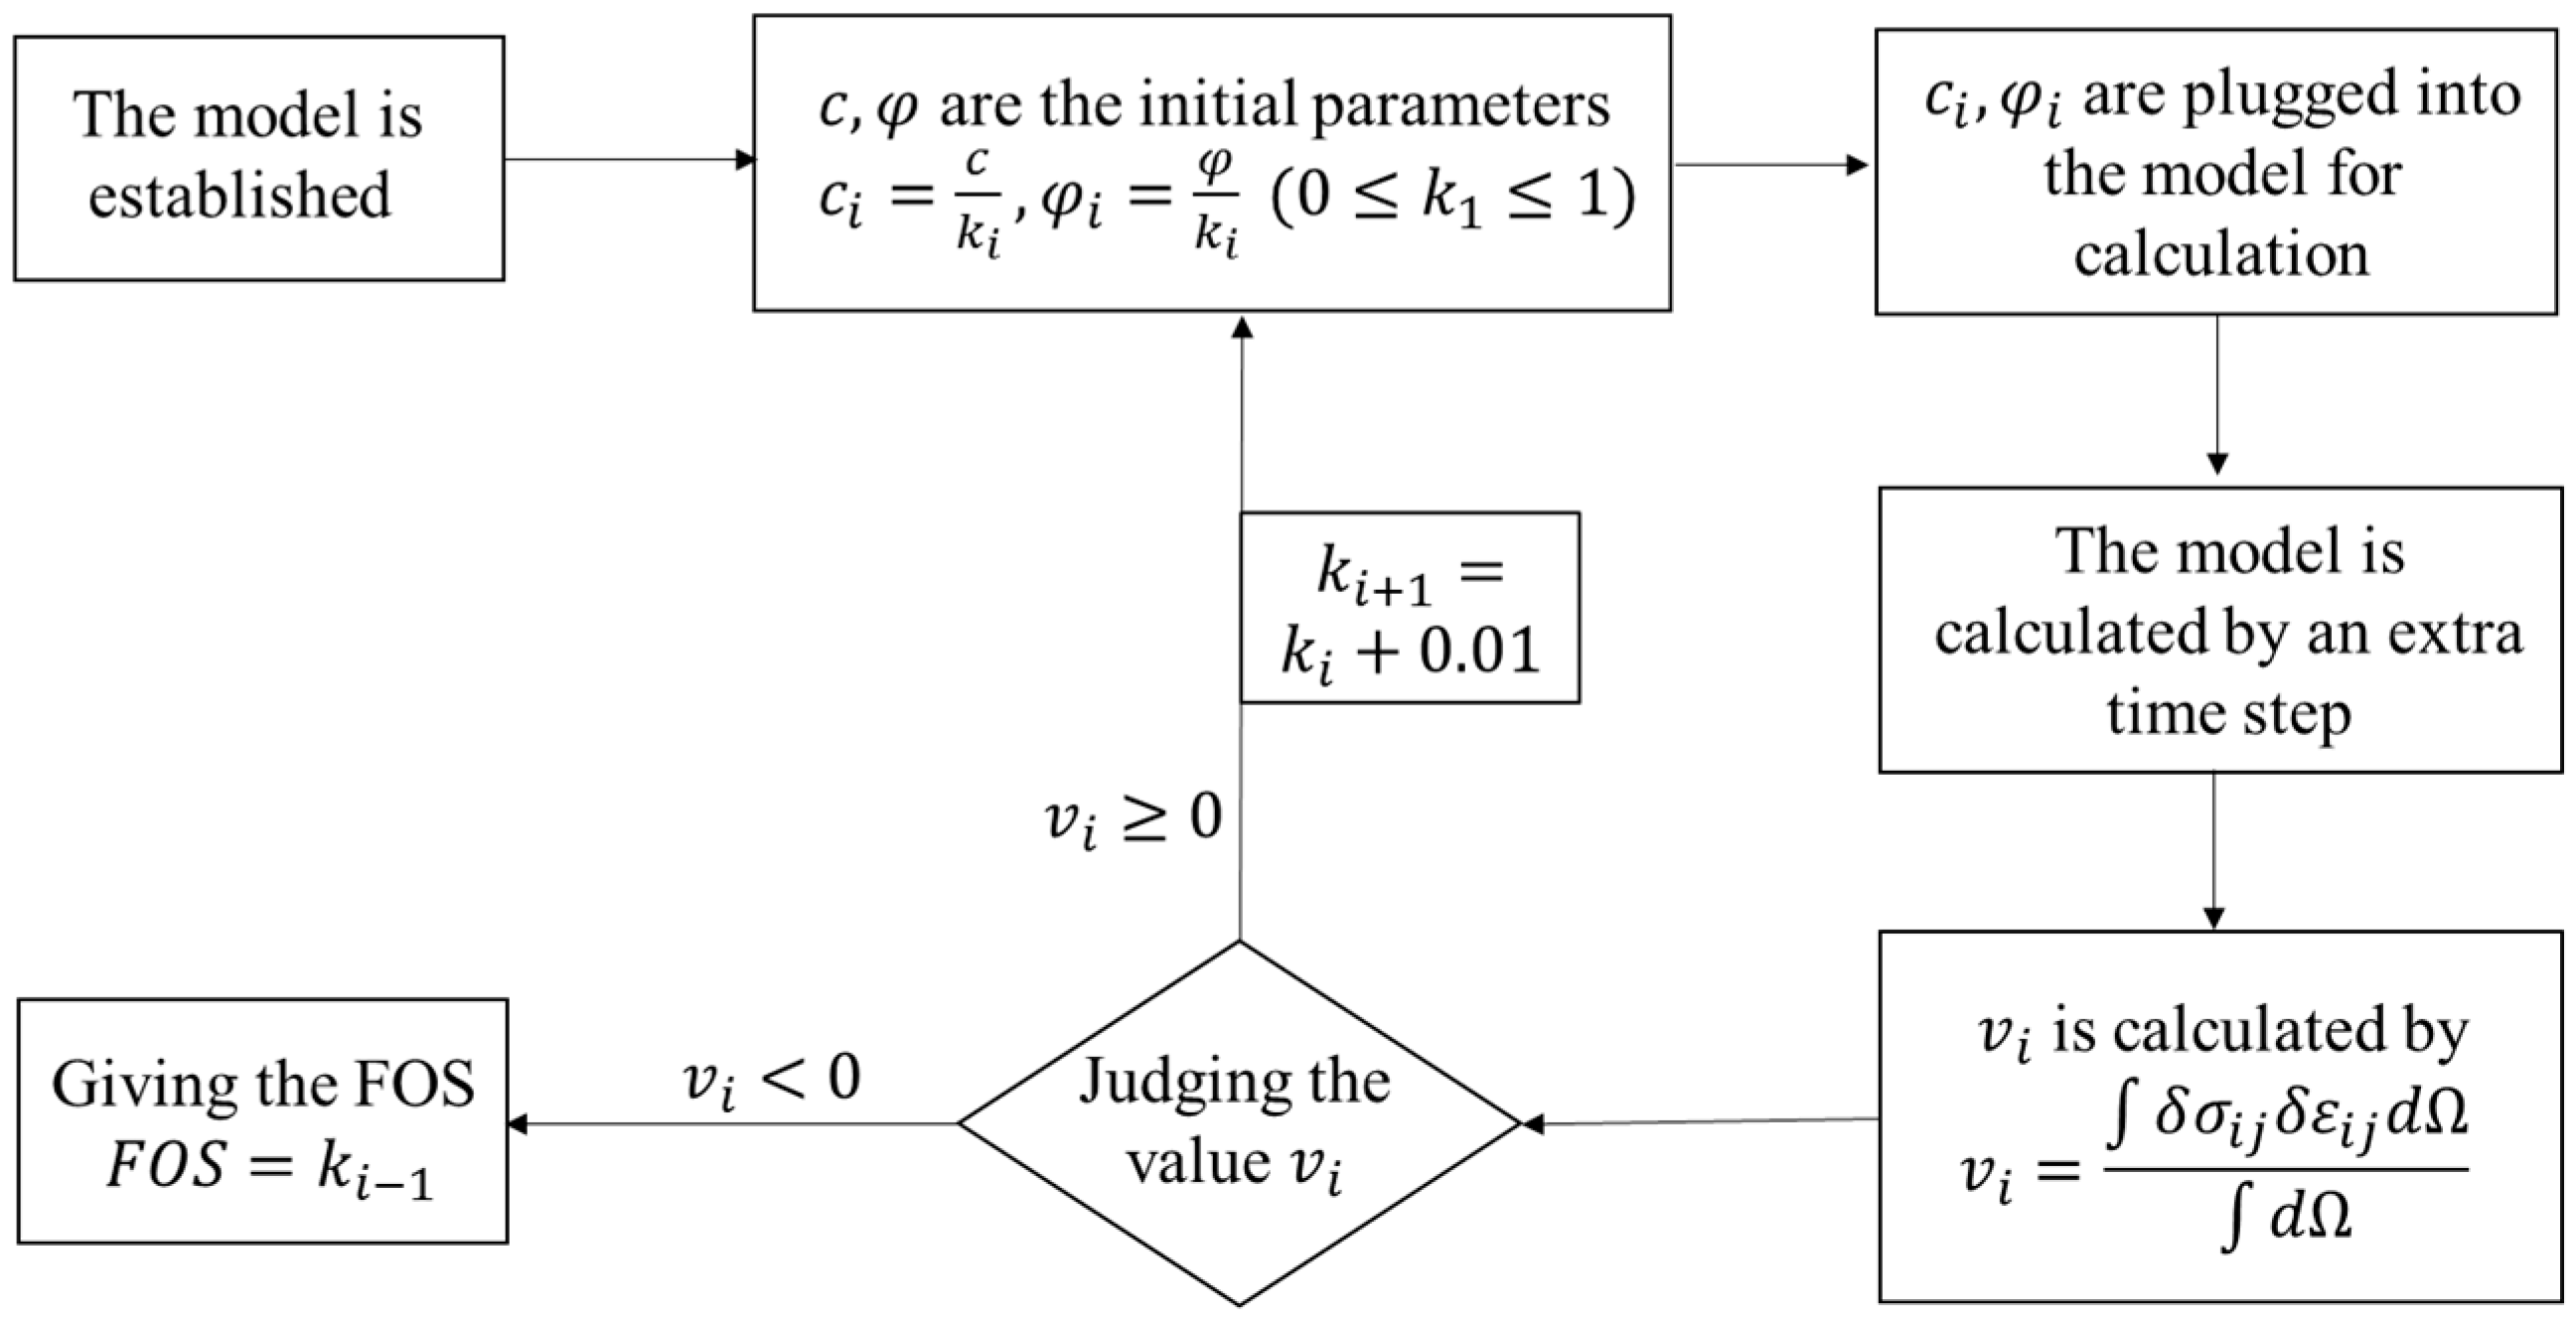
The variational value under each SRF can be calculated by the following method. At a certain SRF, the stress and strain values of each element are recorded and saved after the calculation is completed. Then, one more time step is conducted, and the stress and strain values of each element are recorded and saved again. Subtracting the previously recorded values from the later-recorded values, the differences can be taken as the first-order variational values of the stress and strain of each element. According to Equations (3)–(8), the variational value can be calculated. By repeating the above steps, the variational values under different SRFs can be obtained. Finally, the state of the model can be judged. If the variational value is positive, the model is stable. If the variational value is negative, the model is unstable. To ensure the safety, the SRF before failure occurring is determined as the FOS of the model. This is the proposed variational criterion in this paper. The special application process of the variational criterion is shown in Figure 1.
Figure 1.
Flow chart of the application of the proposed variational criterion.
3. Results
In this section, an unlined tunnel (Example 1), a lined tunnel (Example 2), and a tunnel under construction (Example 3) are employed to compare results of various failure criteria. By this way, the applicability and generality of the energy mutation criterion (Criterion IV) and the proposed variational criterion are verified.
3.1. Example 1: An Unlined Tunnel
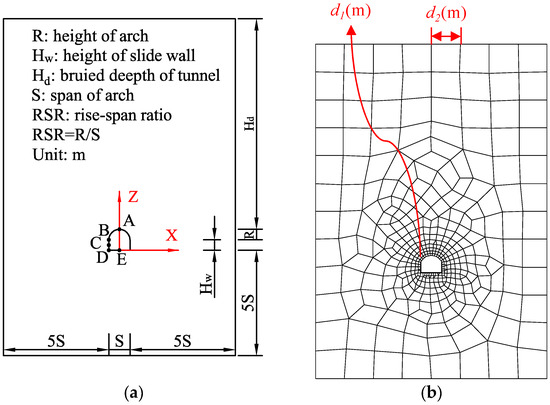
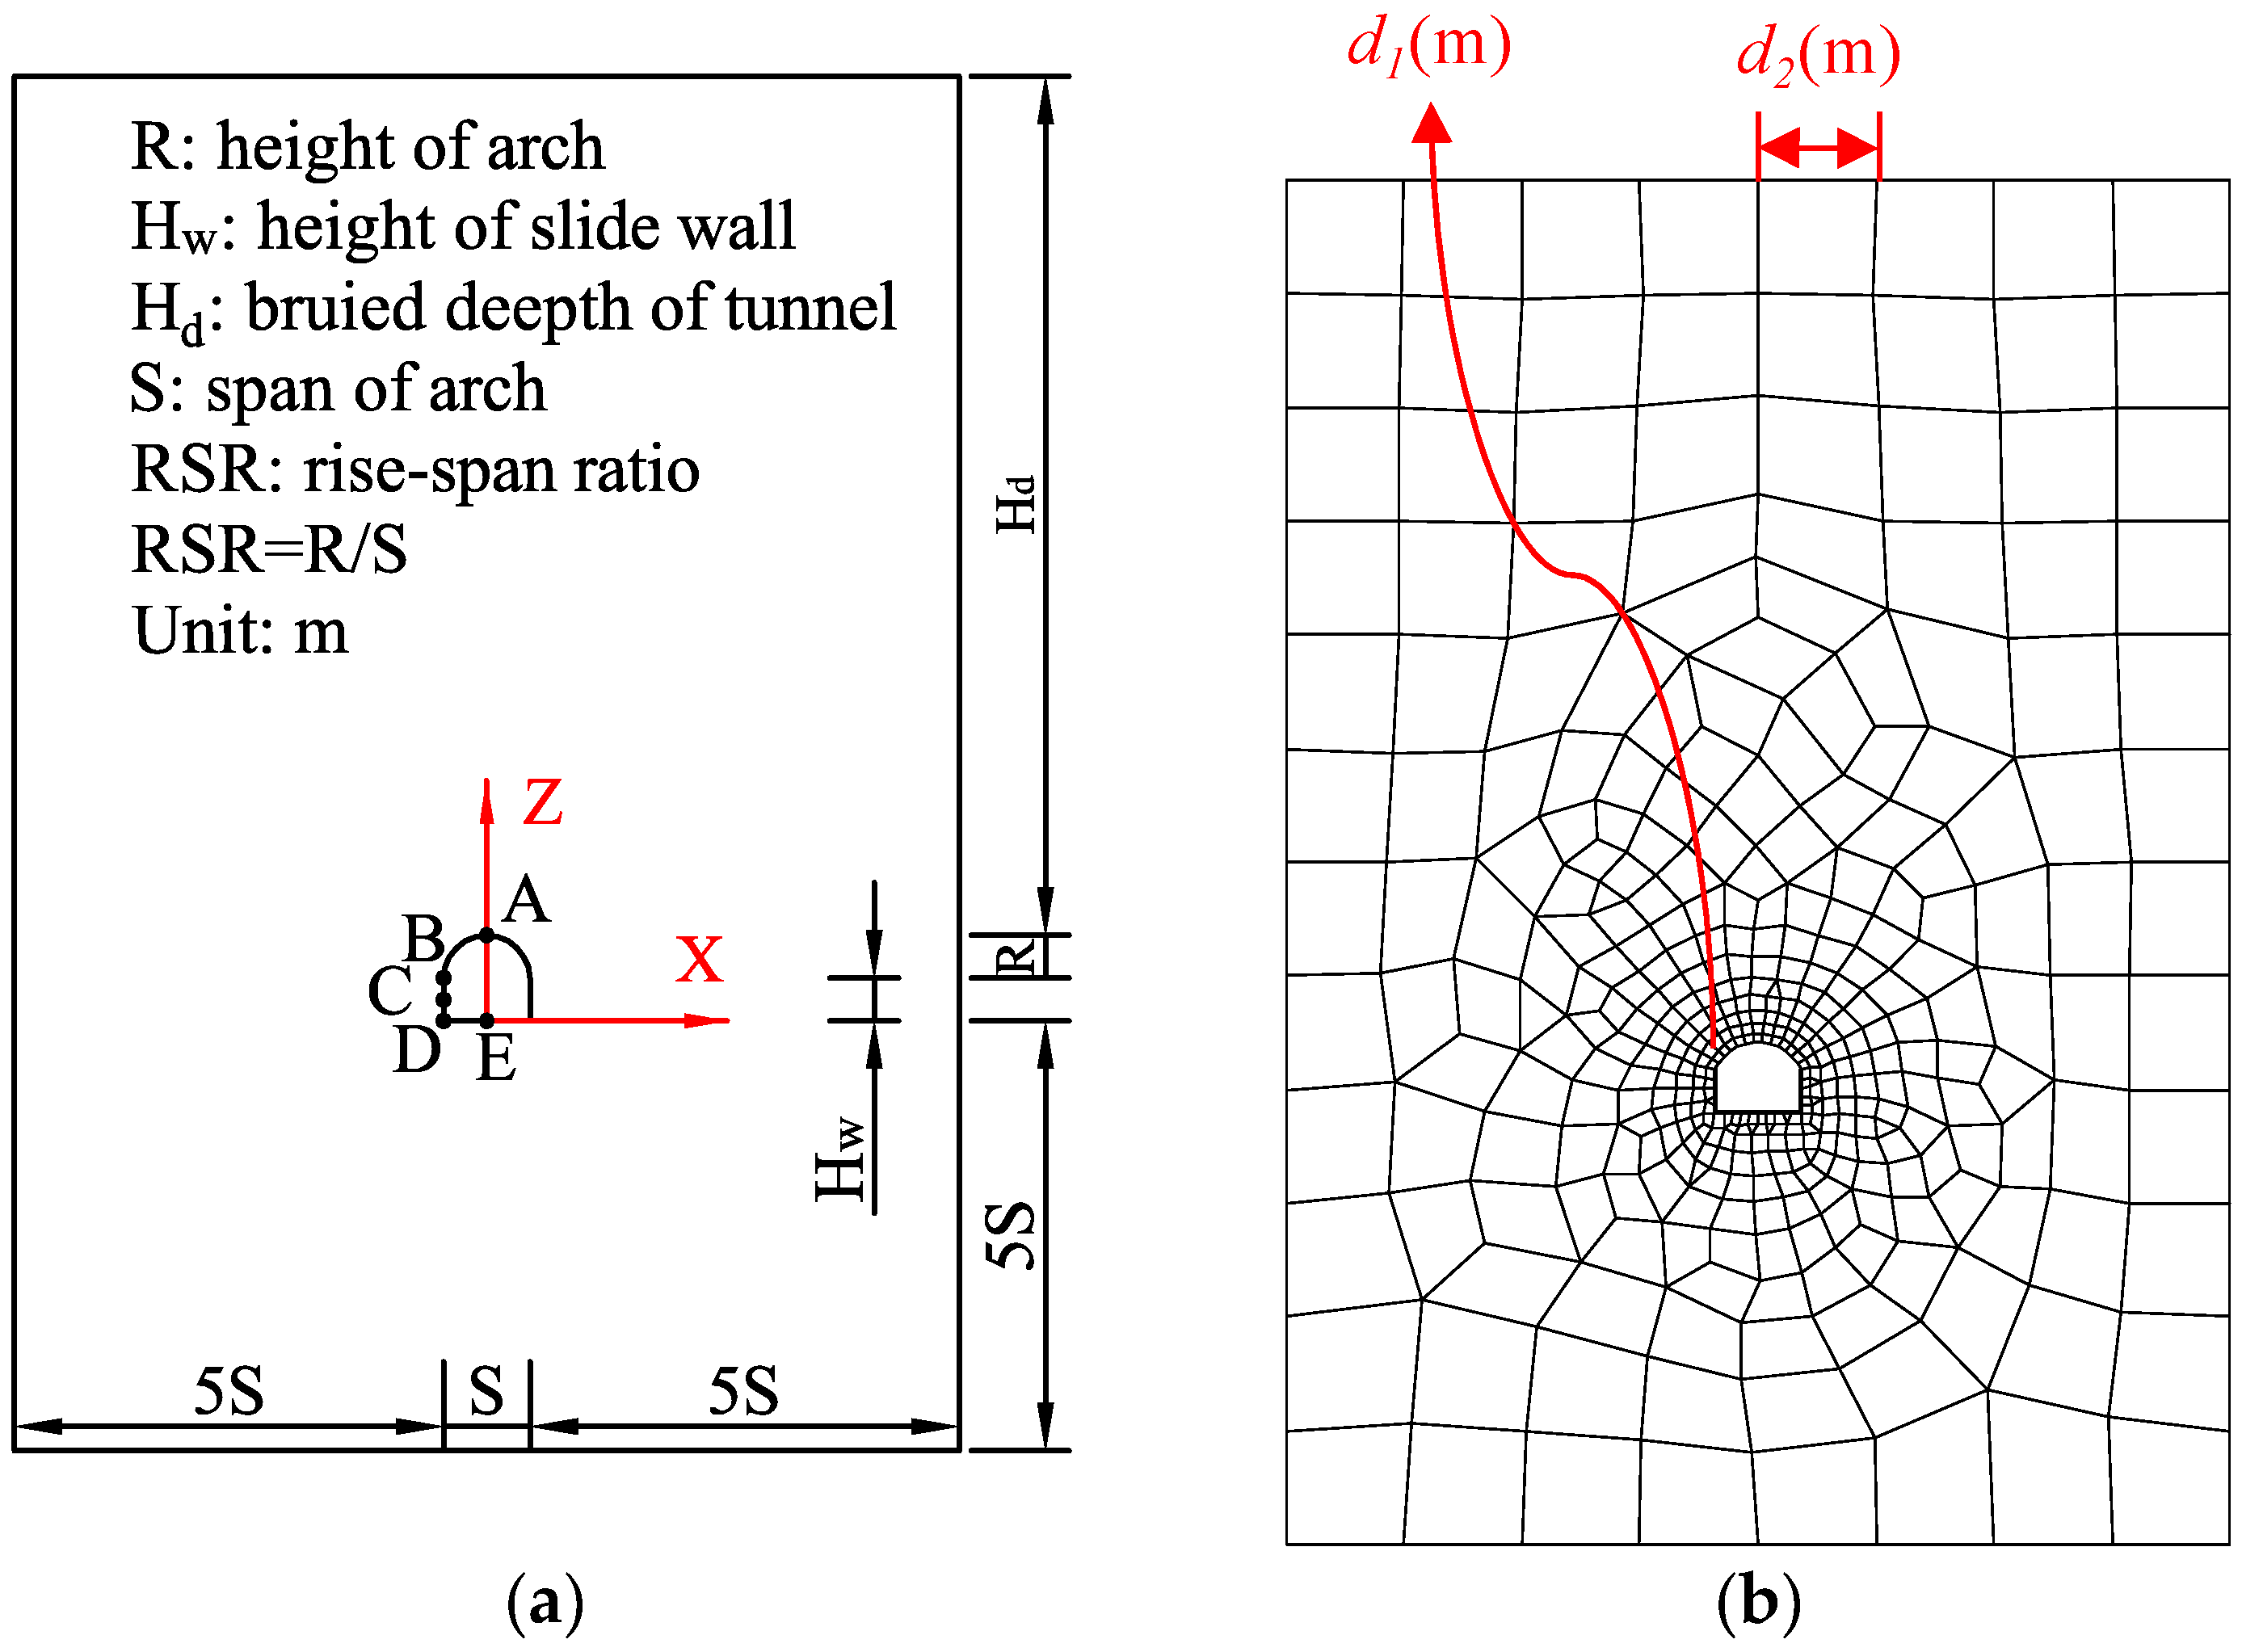
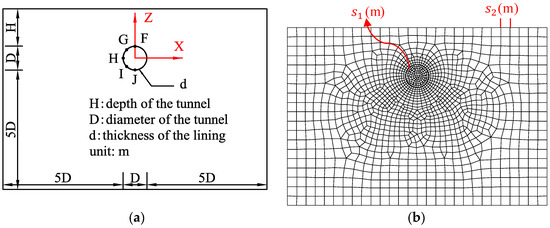
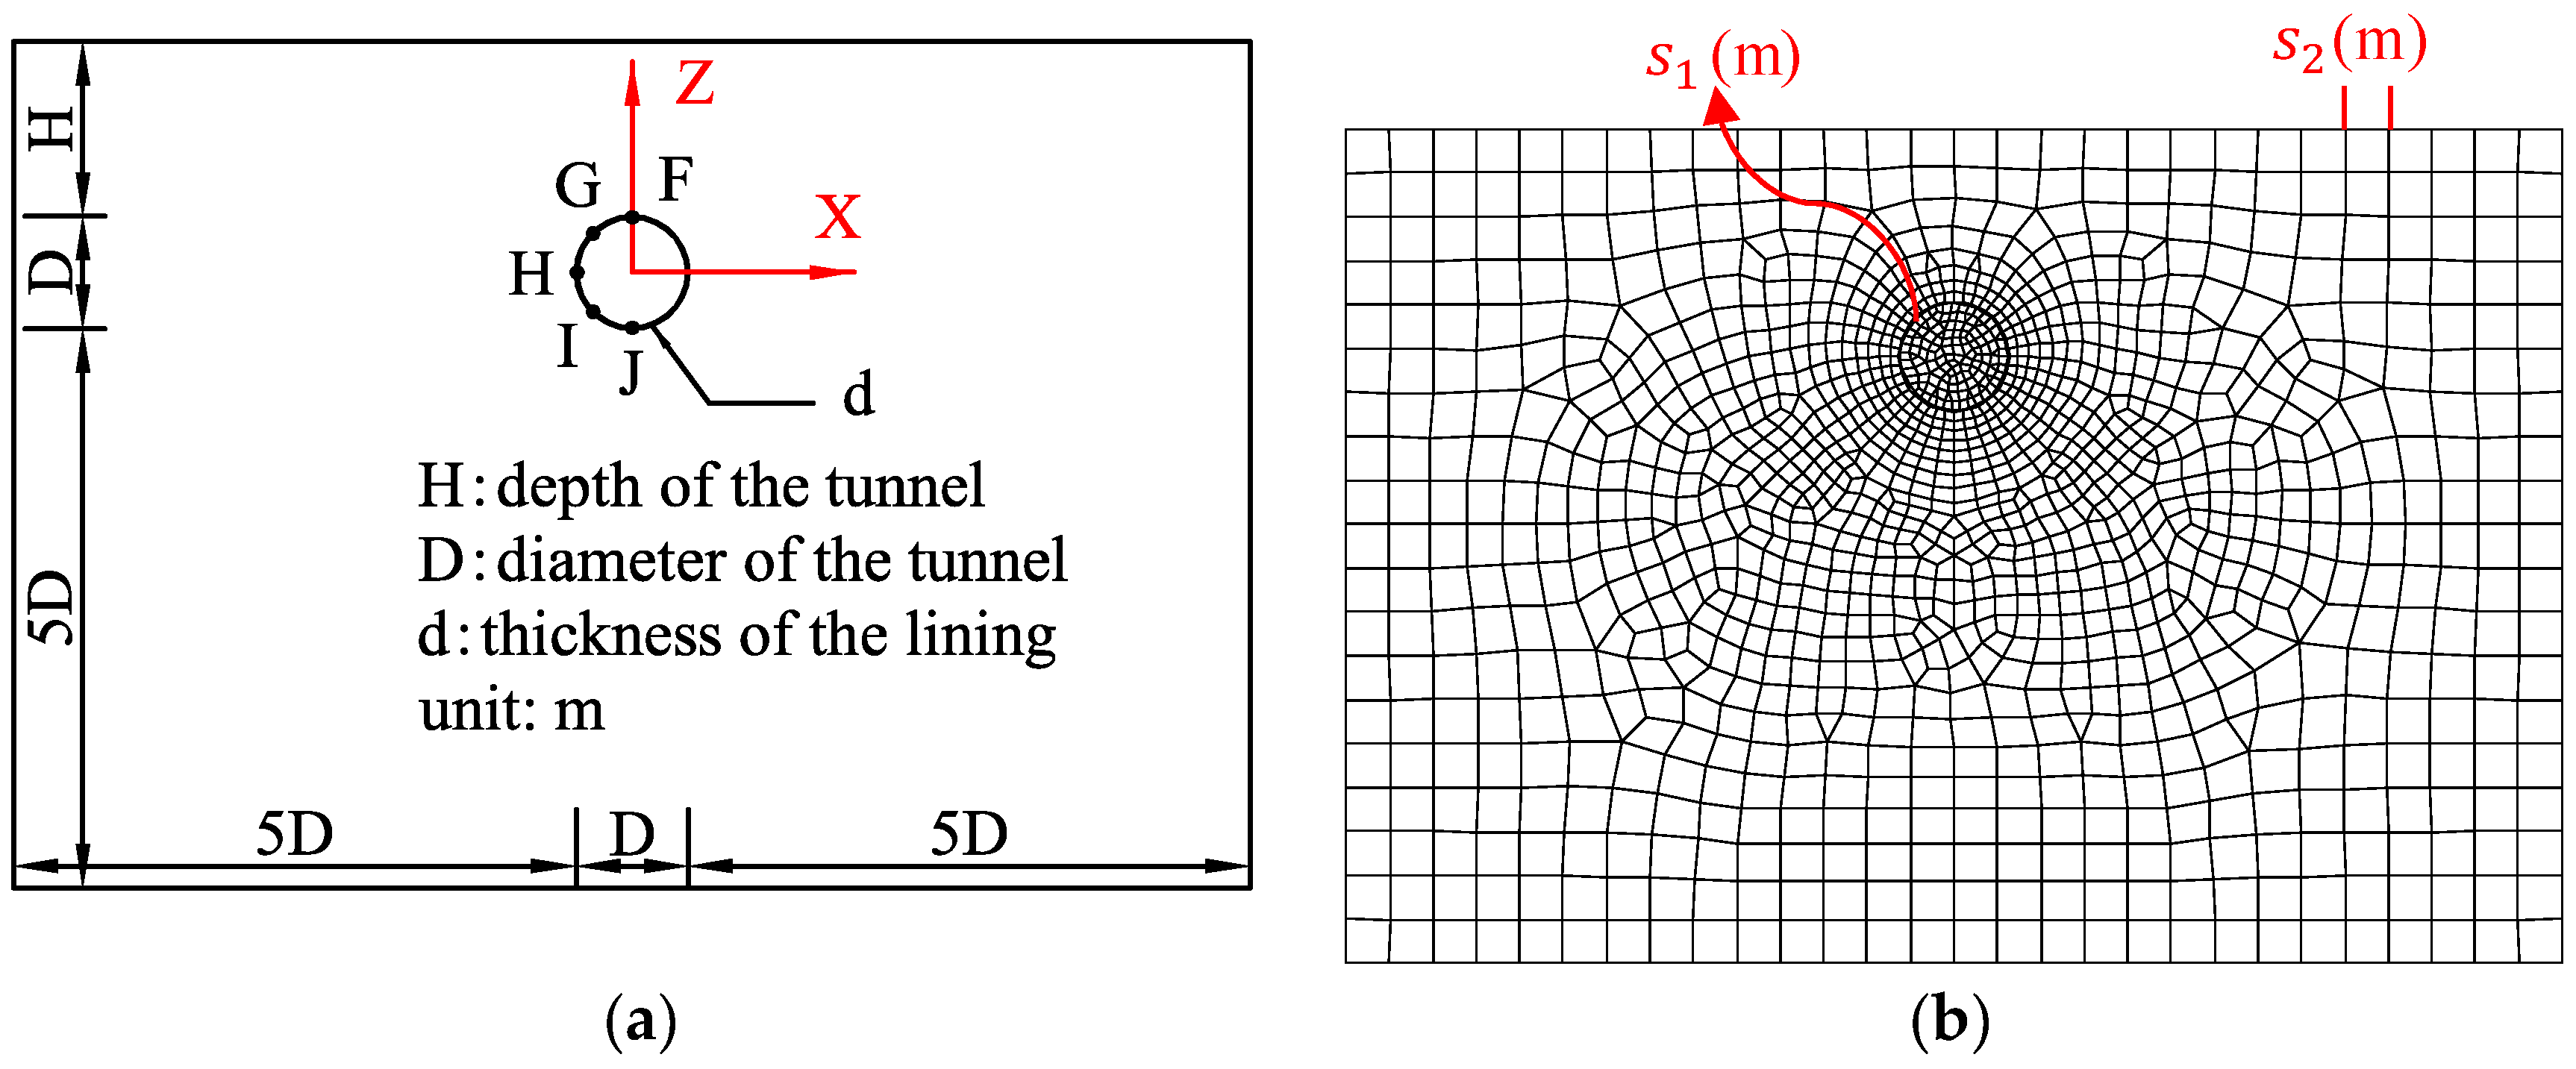
According to the paper [72], a numerical model of unlined tunnel () is established. The numerical model is established according to an actual unlined loess tunnel. The geometric dimensions of the tunnel and the locations of monitoring points are shown in Figure 2. The mechanical parameters of the soil are presented in Table 1. The soil material is modeled as the ideal elastoplastic material. The material follows the Mohr–Coulomb yield criterion and non-associated flow rule. The distance from the tunnel to the left side, right side, and bottom of the model is set at five times the span, respectively. The model is constrained in horizontal displacement on the left and right sides, fixed at the bottom, and free at the top. The longitudinal length of the tunnel is set to 1 m.
Figure 2.
Sketch and numerical model of the unlined tunnel. (a) Sketch of the unlined tunnel, the arrows and the red lines represent the coordinate axes; (b) numerical model of the unlined tunnel, the arrows and red lines indicate the mesh sizes in different regions of the model.
Table 1.
Mechanical parameters of the soil for the unlined tunnel.
3.1.1. Comparisons of Different Criteria for the Unlined Tunnel
Based on the above example, the SRM and various criteria are applied to determine the safety factor of the tunnel.
(1) Criterion I
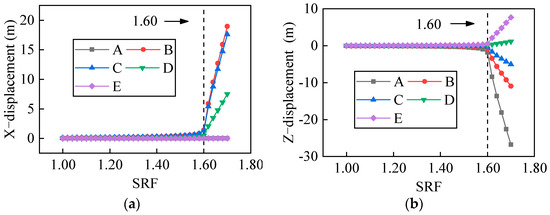
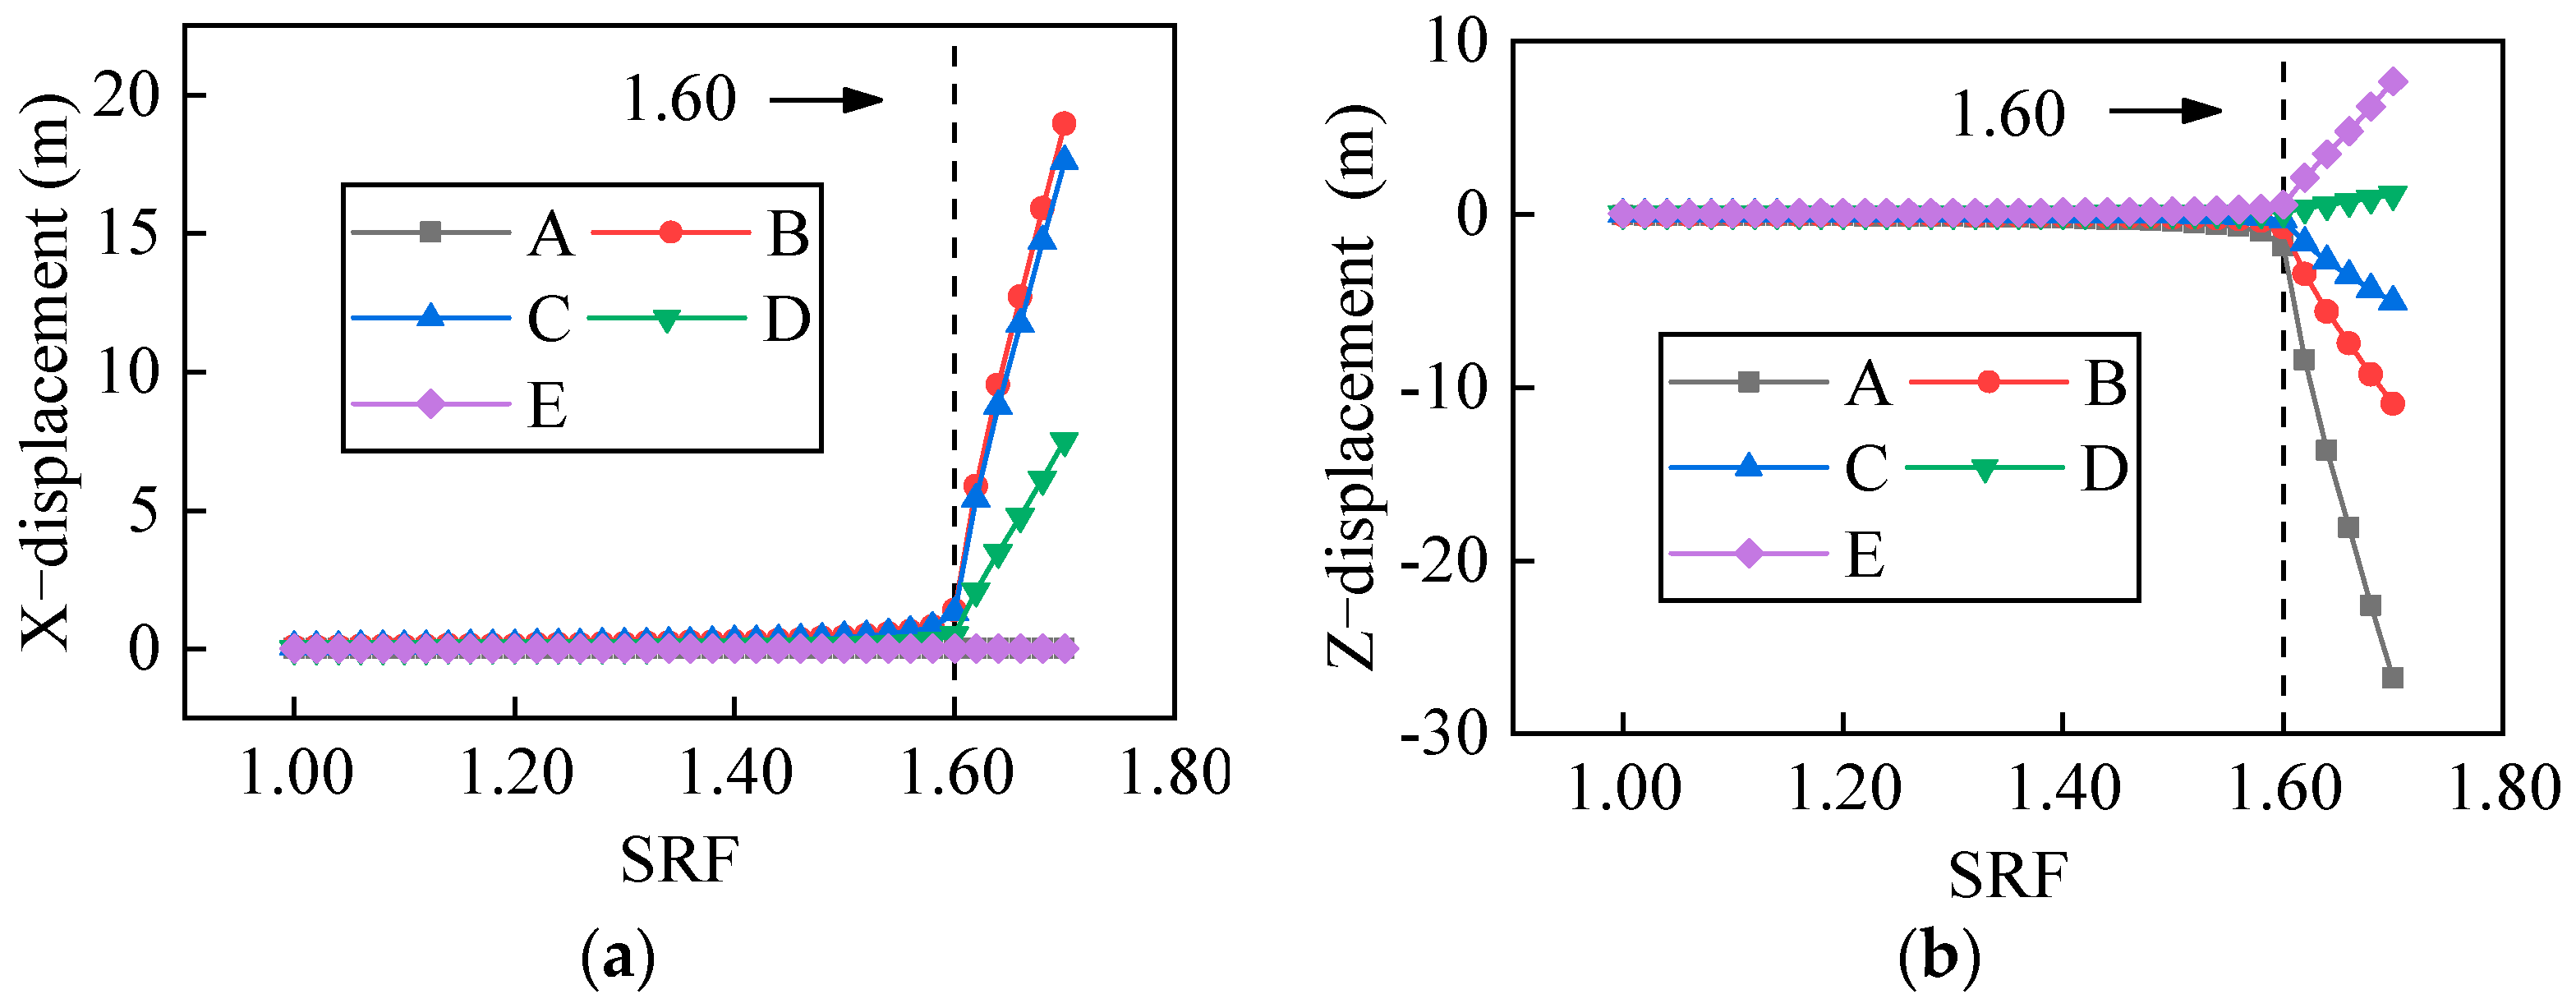
As shown in Figure 3, the mutation characteristics of displacement curves vary significantly across different monitoring points and displacement directions. In terms of the X-displacement, the arch shoulder and arch waist show the most pronounced mutations, while the arch springing exhibits slightly weaker mutations, and the arch crown and arch base show no mutations. Regarding the Z-displacement, the arch crown demonstrates the most significant mutations, followed by the arch shoulder and arch base, while the arch waist and arch foot exhibit the weakest mutations. Therefore, selecting appropriate monitoring points and displacement directions for this criterion involves a considerable workload. Moreover, the manual identification of mutations is prone to subjective errors.
Figure 3.
Curves between the displacements of the monitoring points and the SRFs for the unlined tunnel. (a) The X-displacement; (b) the Z-displacement.
(2) Criterion II
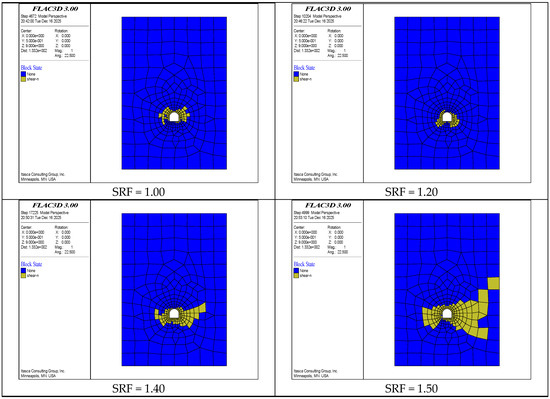
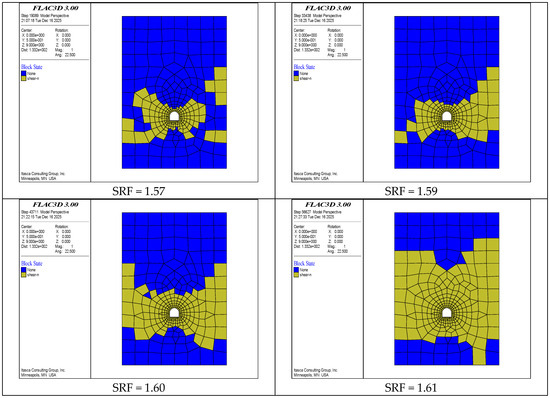
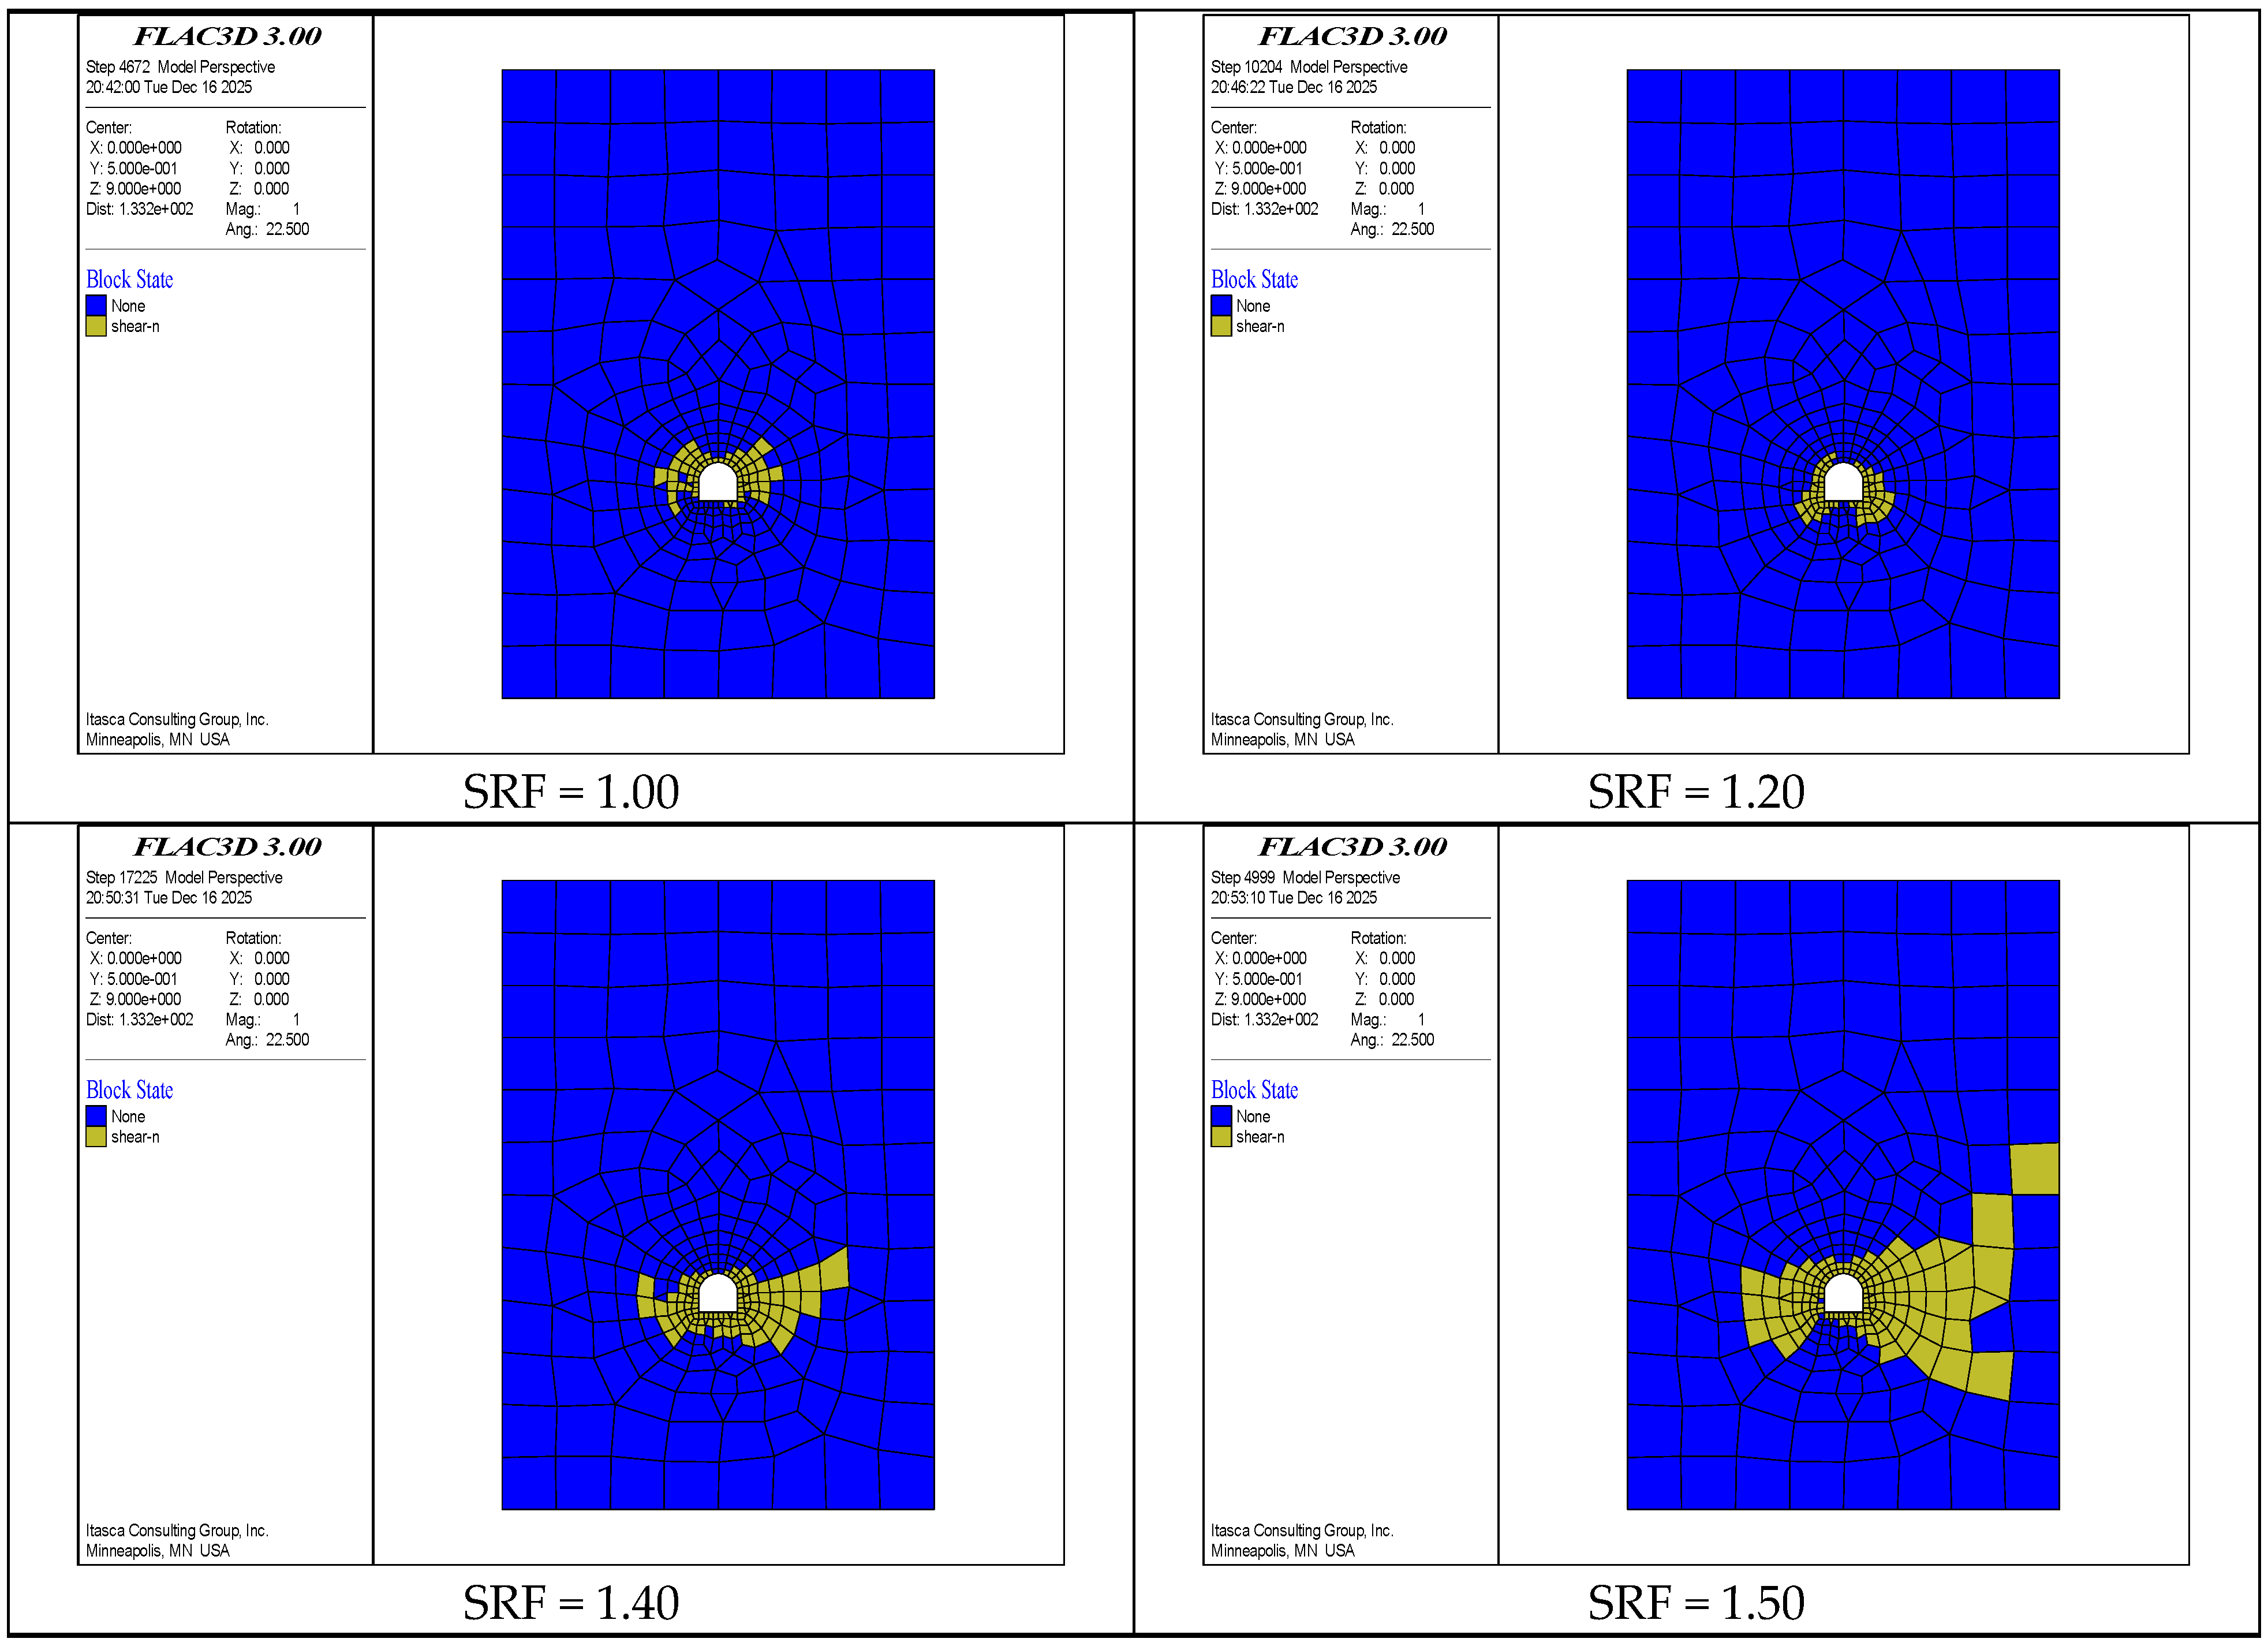
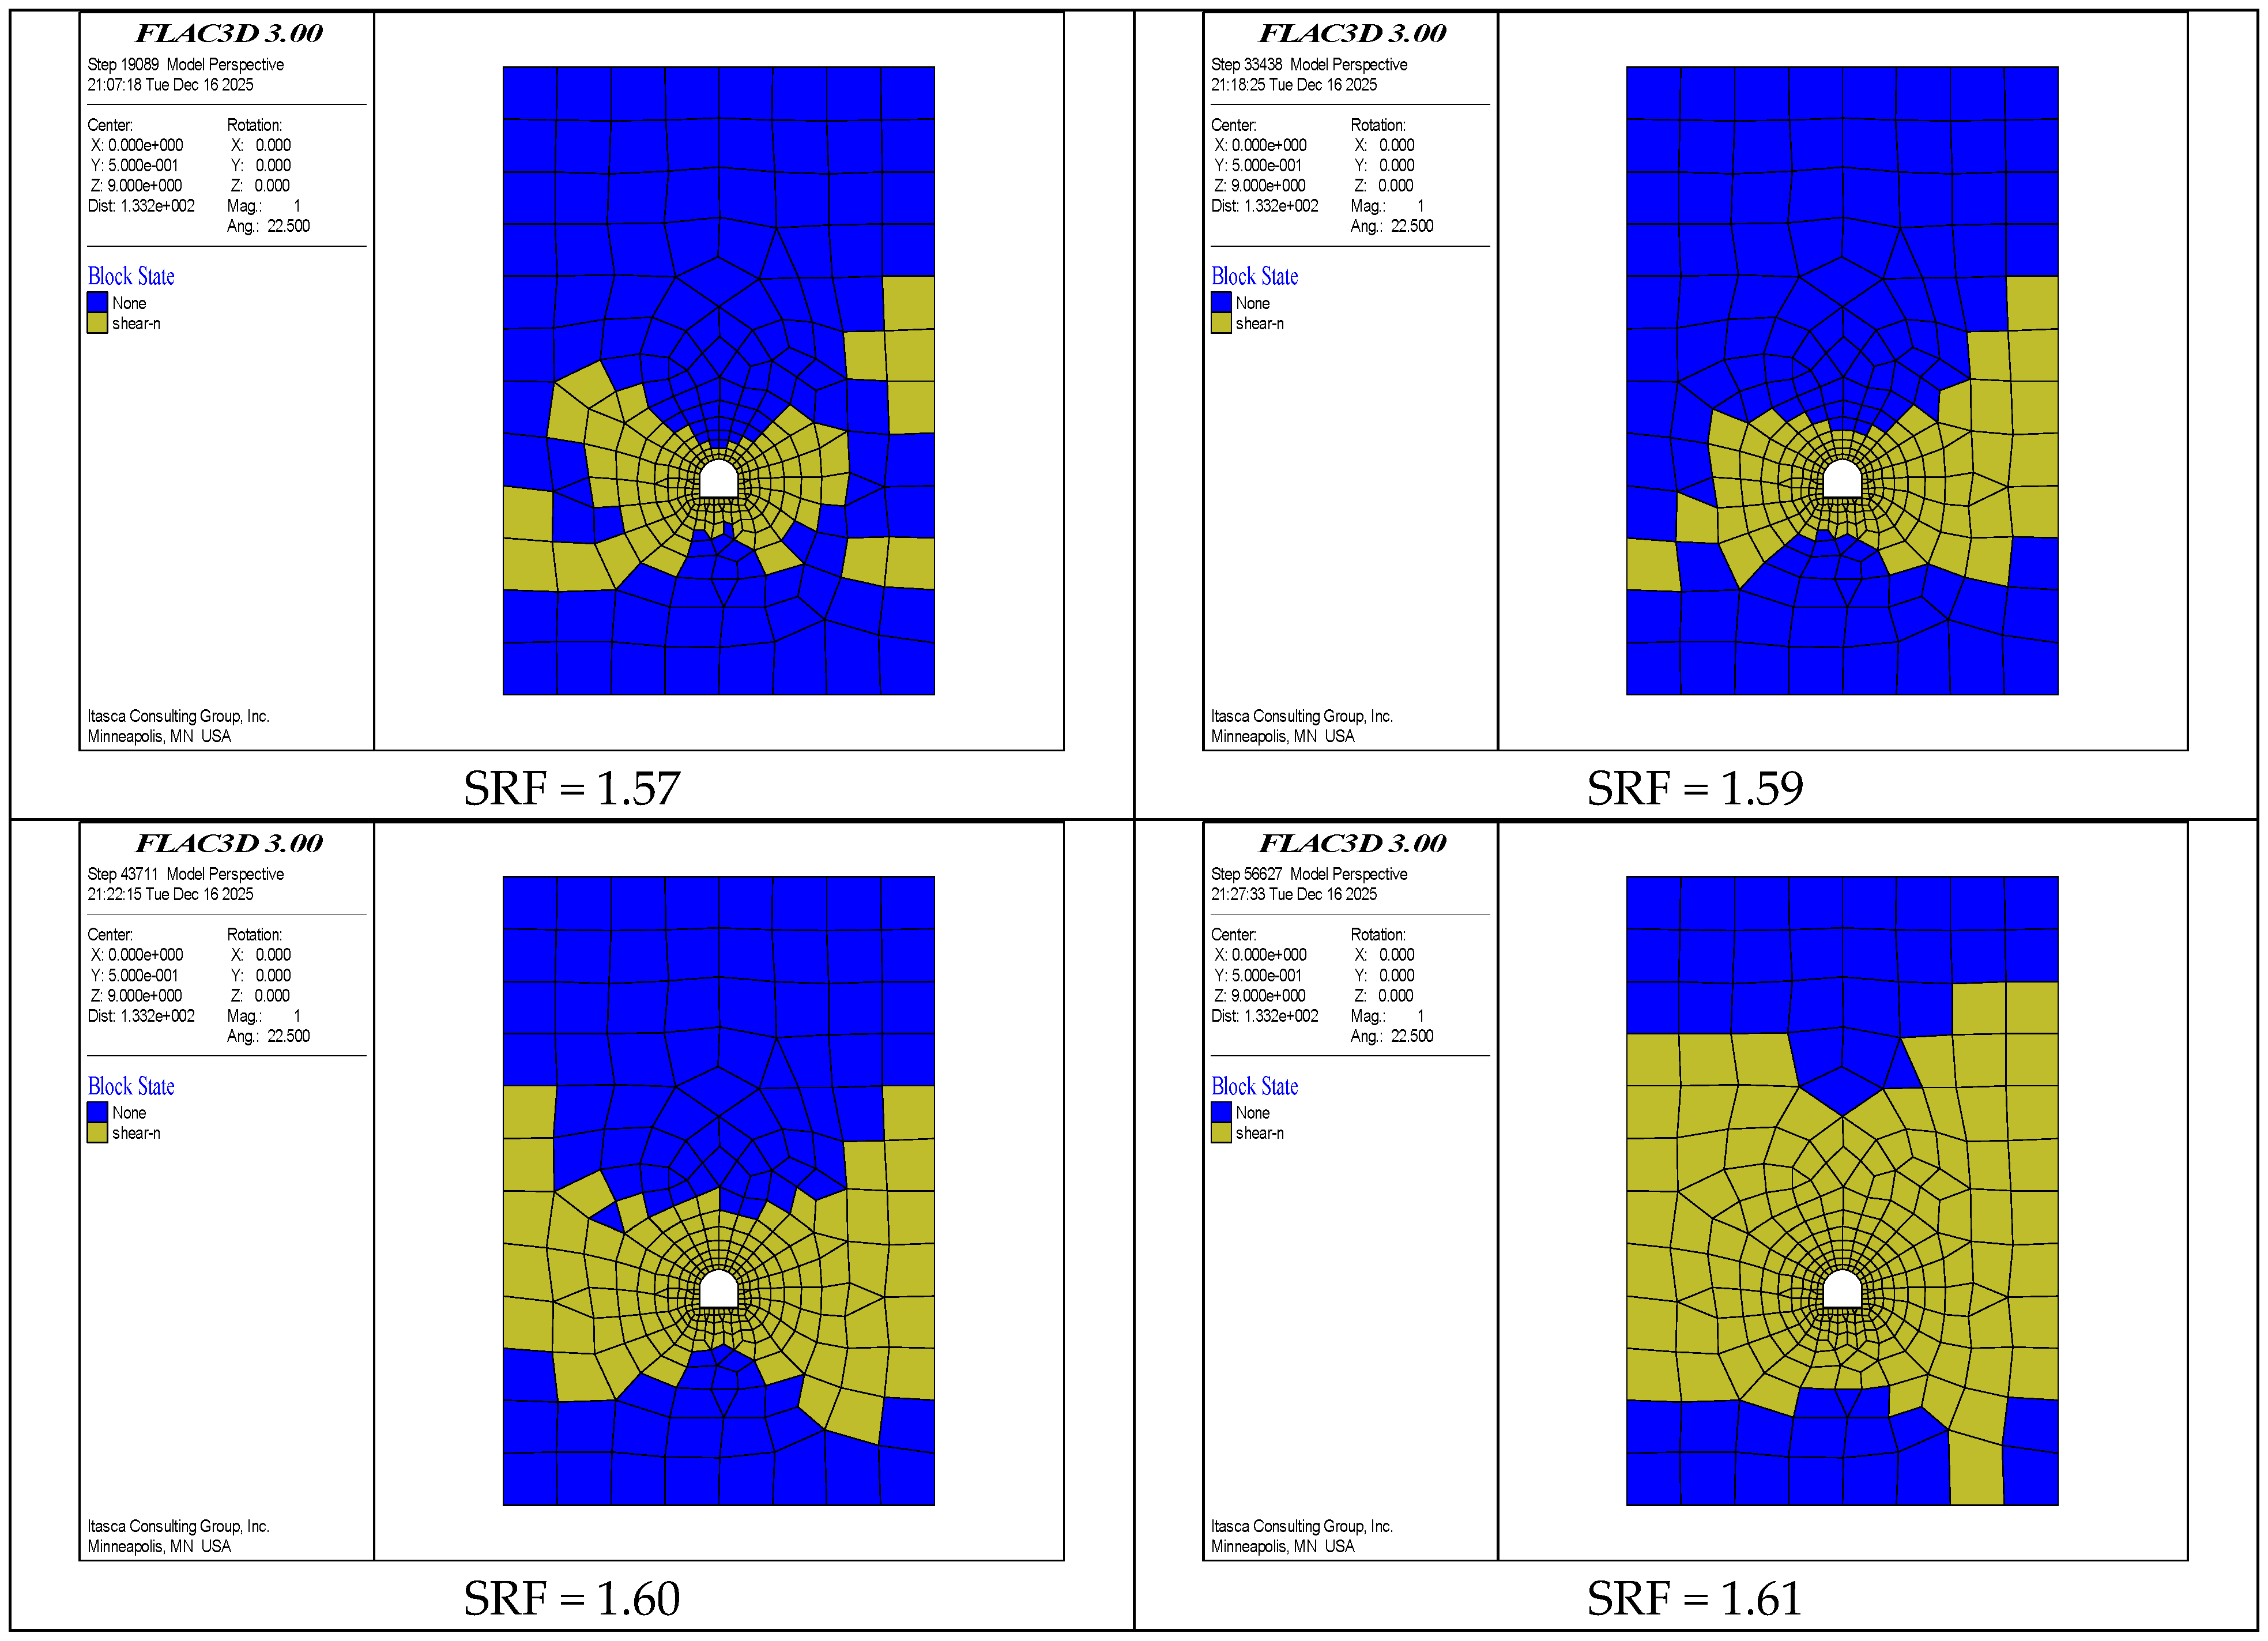
As shown in Figure 4, when the SRF increases, the plastic zone around the tunnel gradually expands. When the SRF reaches 1.59–1.61, the plastic zones on both sides of the tunnel become fully connected, creating conditions for an overall collapse. Particularly at the SRF of 1.61, a significantly large and continuous plastic zone emerges at the crown of the tunnel, indicating the onset of an overall collapse.
Figure 4.
Distribution of plastic elements (yellow elements) in the numerical model under different SRFs for the unlined tunnel.
(3) Criterion III
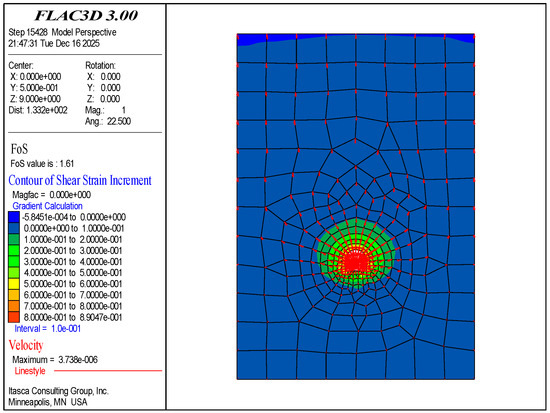
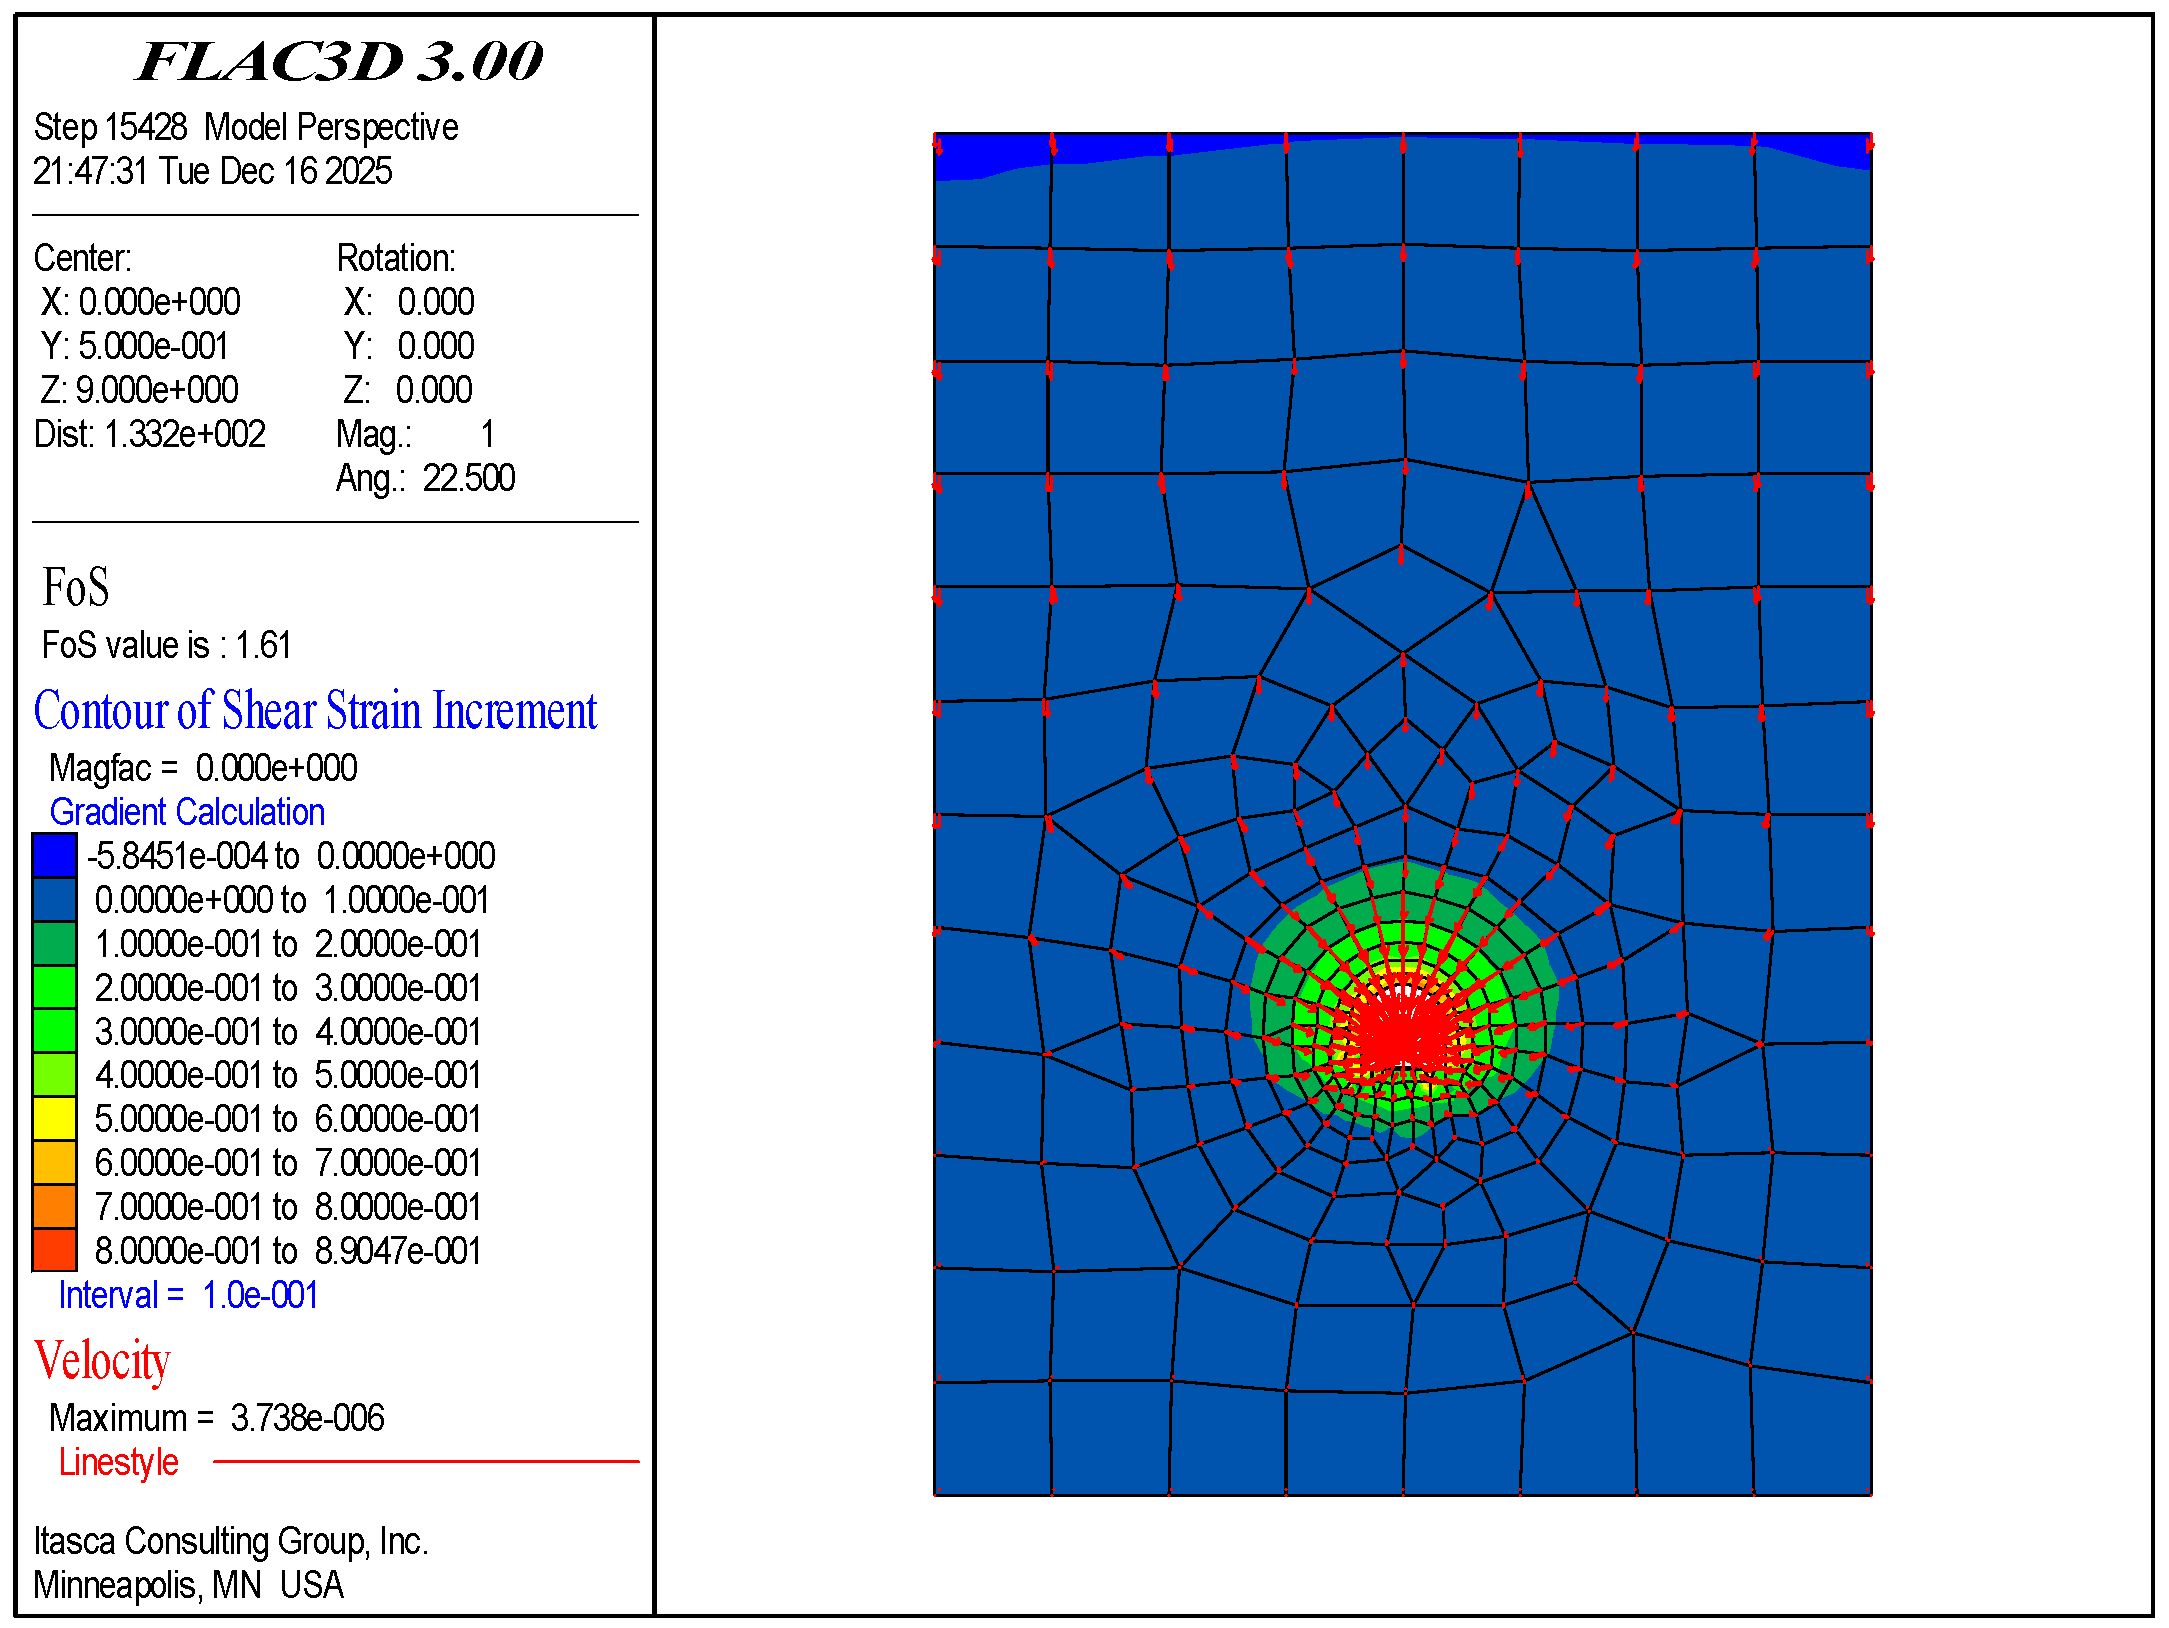
As shown in Figure 5, the FOS command directly yields a safety factor of 1.61 for the model. At this point, the shear strain increment of elements is relatively high across the entire model region. The nodal velocities in the overlying soil above the tunnel are significant, while those in the surrounding rock around the tunnel are even greater and more concentrated. It indicates the onset of overall instability.
Figure 5.
Results of the FOS command including the shear strain increment of elements and the velocity of nodes for the unlined tunnel.
(4) Criterion IV
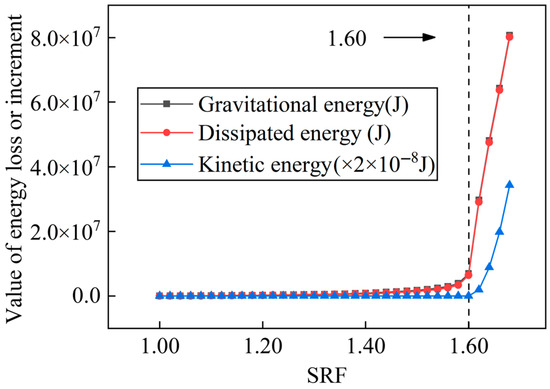
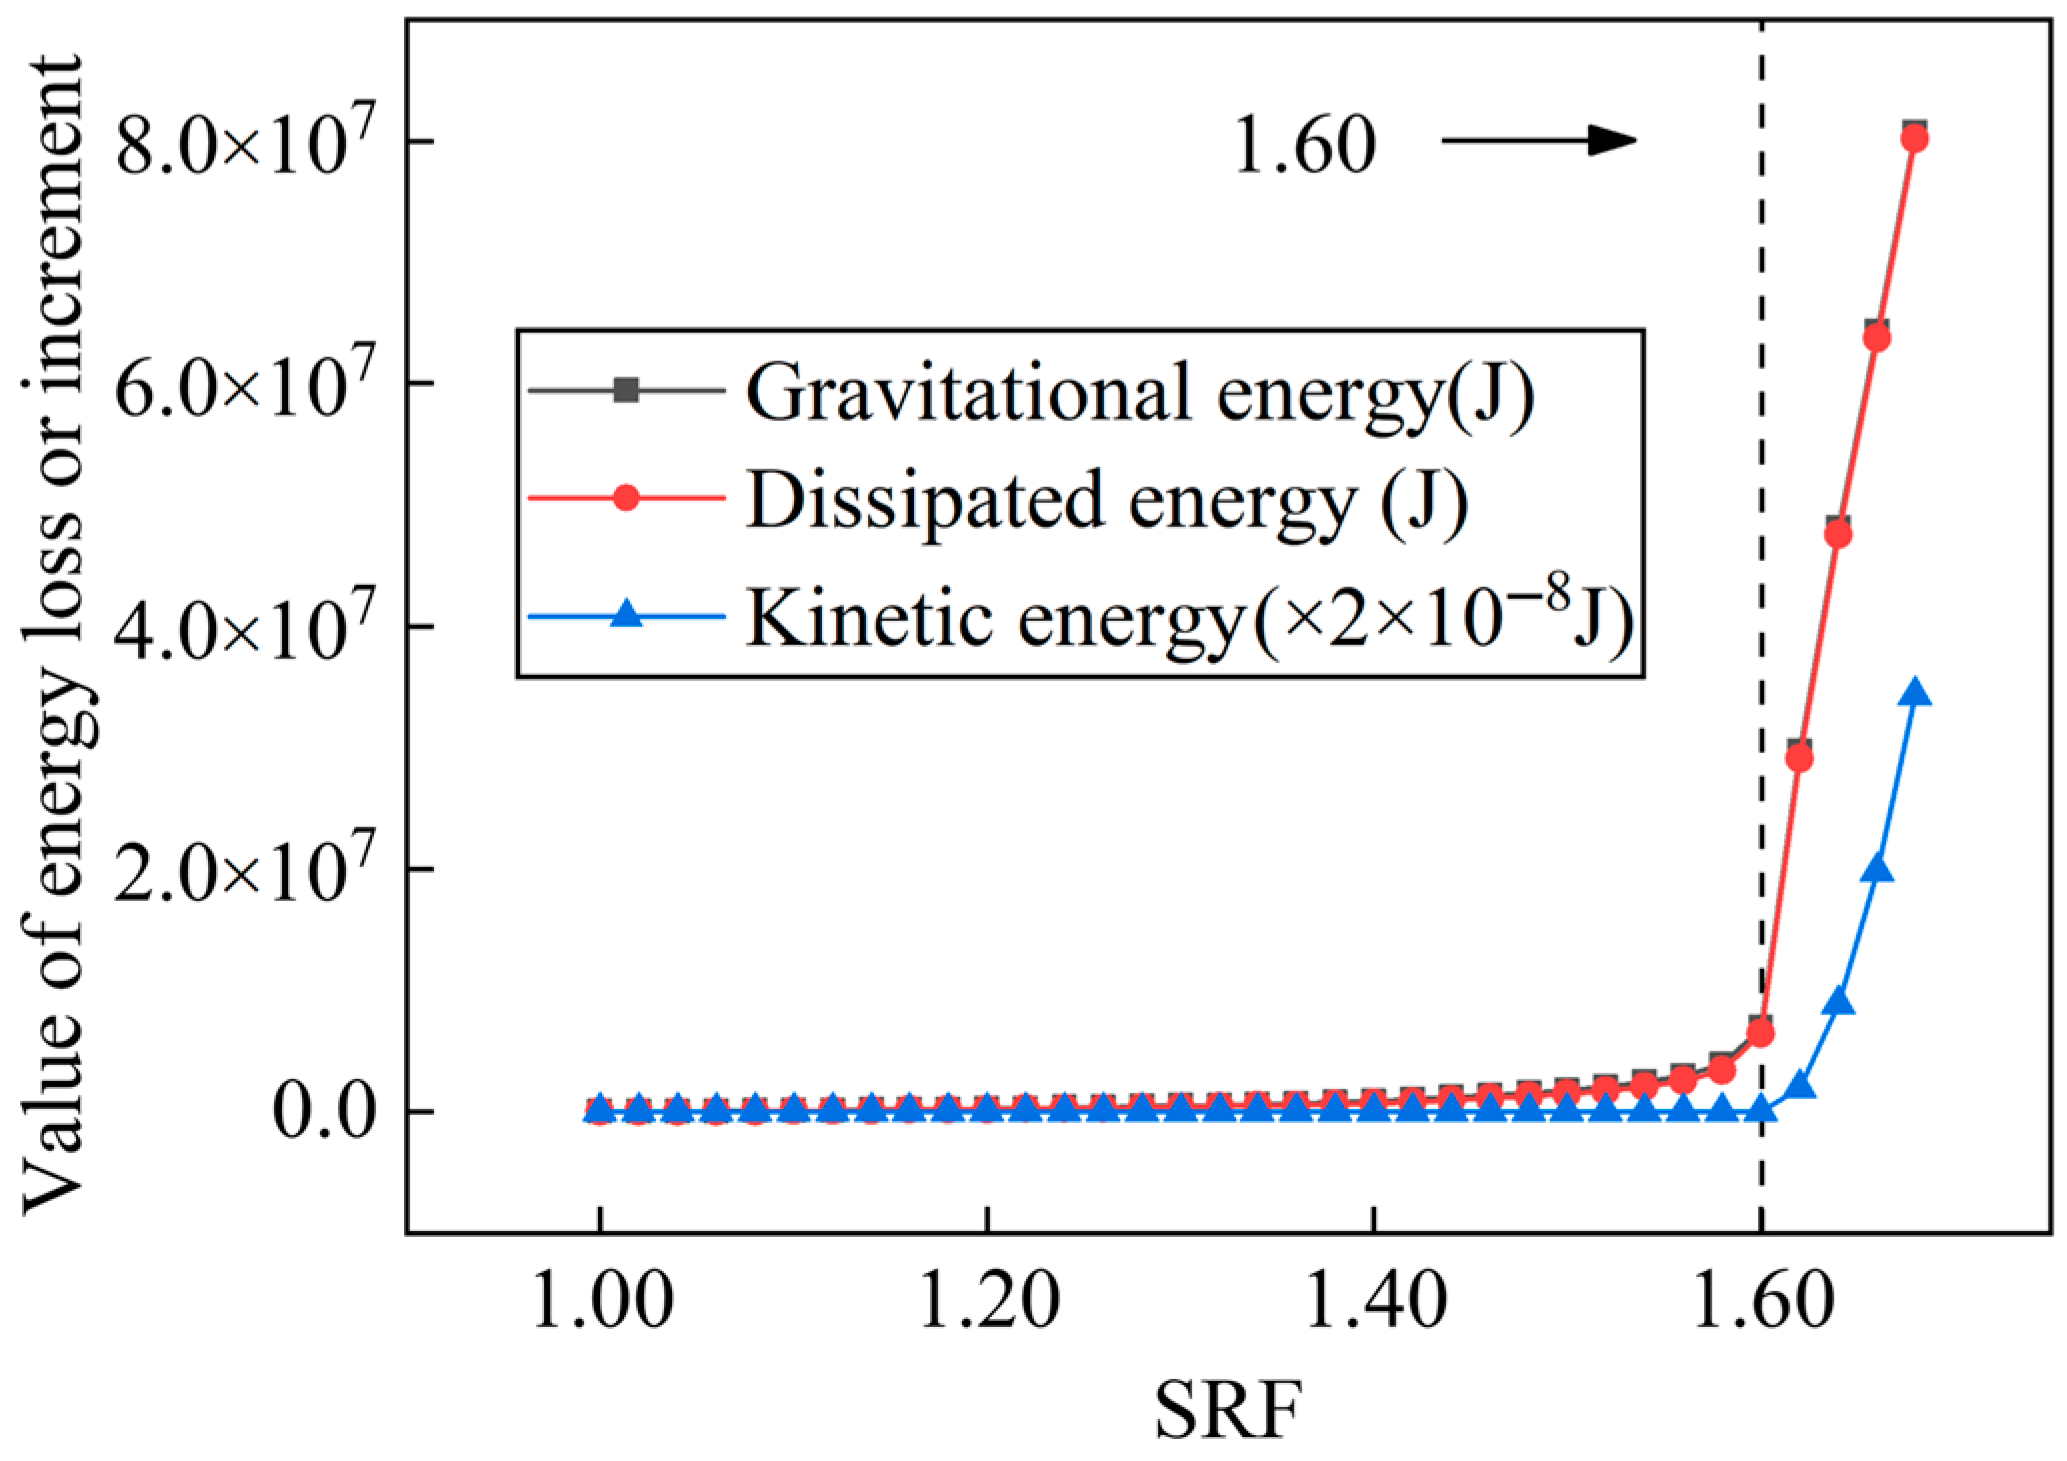
As shown in Figure 6, three types of energy curves exhibit similar mutation characteristics. Around the SRF of 1.60, all the curves undergo relatively obvious mutations. This is largely consistent with the patterns revealed by other criteria. It indicates that the energy criterion is well applicable for unlined tunnels.
Figure 6.
Curves between the various energy values and the SRFs for the unlined tunnel.
(5) Variational criterion
As shown in Table 2, when the SRF ranges from 1.00 to 1.60, the variational values of the model remain positive. It indicates that instability has not occurred. When the strength reduction factor reaches 1.61, the variational value of the model turns negative for the first time. It signals the onset of instability.
Table 2.
Variational values under different SRFs for the unlined tunnel.
(6) Comparisons
Results of different criteria are summarized in Table 3. As shown in Table 3, results of the three types of energy catastrophe criteria are close to those of the three commonly used failure criteria. The maximum absolute and relative errors between them are 0.01 and 0.6%, respectively. It indicates that for unlined tunnels, there exists a favorable correspondence between the three commonly used failure criteria and the three energy catastrophe criteria. It is consistent with observations in slopes. The result of the variational criterion is close to those of the six typical failure criteria. There are the maximum absolute and relative errors of 0.02 and 1.3%, respectively. It demonstrates that the variational criterion exhibits good consistency with the six typical failure criteria in unlined tunnels.
Table 3.
Factors of safety under different criteria for the unlined tunnel.
3.1.2. Analysis of Influencing Factors
As demonstrated earlier through the typical example (), the results of the FOS command (Criterion III) are close to those of other criteria (Criteria I, II, IV1, IV2, and IV3). However, applying Criteria I, II, IV1, IV2, and IV3 involves a substantial amount of work. To save time, the subsequent analysis will use results of the FOS command in place of those of the six conventional criteria (Criteria I, II, III, IV1, IV2, and IV3). The mesh densities, strength reduction factor intervals, geometric parameters, and mechanical parameters are changed. The generality of the variational criterion is verified by comparing results of the FOS command with those of the variational criterion under different conditions.
(1) Mesh densities
As shown in Table 4, under different mesh densities, results of the variational criterion consistently align closely with those of the FOS command. There is an average relative error of 1.2% between them, indicating good agreement. This demonstrates that the applicability of the variational criterion in unlined tunnels is not coincidental due to mesh densities.
Table 4.
Factors of safety under different mesh densities for unlined tunnels.
(2) Strength reduction factor intervals
As shown in Table 5, results with a strength reduction factor interval of 0.001 consistently remain close to those with an interval of 0.01. There is an average relative error of 0.9% between them, indicating good agreement. This demonstrates that the applicability of the variational criterion in unlined tunnels is not coincidental due to strength reduction factor intervals.
Table 5.
Factors of safety under different strength reduction factor intervals for unlined tunnels.
(3) Geometric parameters
As shown in Table 6, under different geometric parameters, results of the variational criterion consistently align closely with those of the FOS command. There is an average relative error of 1.3% between them, indicating good agreement. This demonstrates that the applicability of the variational criterion in unlined tunnels is not limited to specific geometric parameters.
Table 6.
Factors of safety under different geometric parameters for unlined tunnels.
(4) Mechanical parameters
As shown in Table 7, under different mechanical parameters, results of the variational criterion consistently align closely with those of the FOS command. There is an average relative error of 0.9% between them, demonstrating good agreement. This indicates that the applicability of the variational criterion in unlined tunnels is not coincidental due to specific mechanical parameters.
Table 7.
Factors of safety under different mechanical parameters for unlined tunnels.
3.2. Example 2: A Lined Tunnel
According to the paper [73], a numerical model of lined tunnel () is established. The geometric dimensions of the tunnel and the locations of monitoring points are shown in Figure 7. The mechanical parameters of the surrounding rock and the lining are presented in Table 8. Both the surrounding rock and the lining are modeled as ideal elastoplastic materials. The materials follow the Mohr–Coulomb yield criterion and non-associated flow rule. Herein, the surrounding rock is classified as Class III, while the lining is constructed using the C25 concrete. The distance from the tunnel to the left side, right side, and bottom of the model is set at five times the span, respectively. The model is constrained in horizontal displacement on the left and right sides, fixed at the bottom, and free at the top. The longitudinal length of the tunnel is set to 1 m.
Figure 7.
Sketch and numerical model of the lined tunnel. (a) Sketch of the lined tunnel, the arrows and the red lines represent the coordinate axes; (b) numerical model of the lined tunnel, the arrows and red lines indicate the mesh sizes in different regions of the model.
Table 8.
Mechanical parameters of the material for the lined tunnel.
3.2.1. Comparisons of Different Criteria for the Lined Tunnel
Based on the above example, the SRM and various criteria are applied to determine the safety factor of the tunnel.
(1) Criterion I
As shown in Figure 8, the characteristics of mutations in the curves vary across different monitoring points and displacement directions. For the X-displacement, the most pronounced mutation occurs at the arch waist, followed by a slightly weaker mutation at the arch shoulder, and the weakest at the arch foot, while no mutations are observed at the arch crown or arch bottom. Regarding the Z-displacement, the most significant mutations are noted at the arch crown and arch shoulder, with a relatively weaker mutation at the arch waist, and no mutations at the arch foot or arch bottom. It is evident that the effective application of this criterion requires the selection of appropriate monitoring points and displacement directions.
Figure 8.
Curves between the displacements of the monitoring points and the SRFs for the lined tunnel. (a) The X-displacement; (b) the Z-displacement.
(2) Criterion II
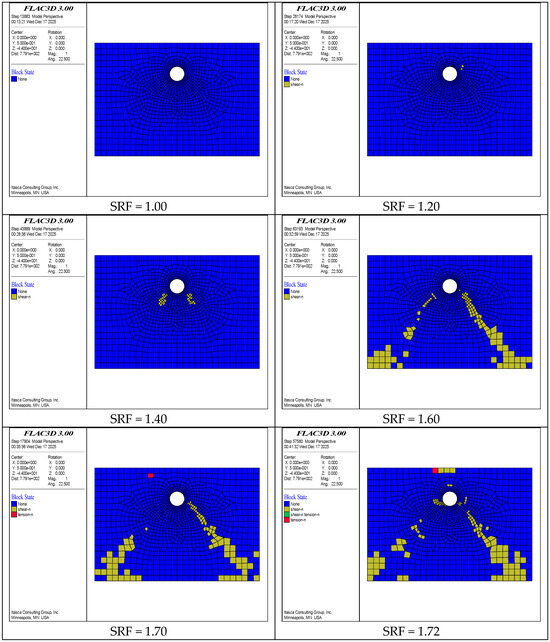
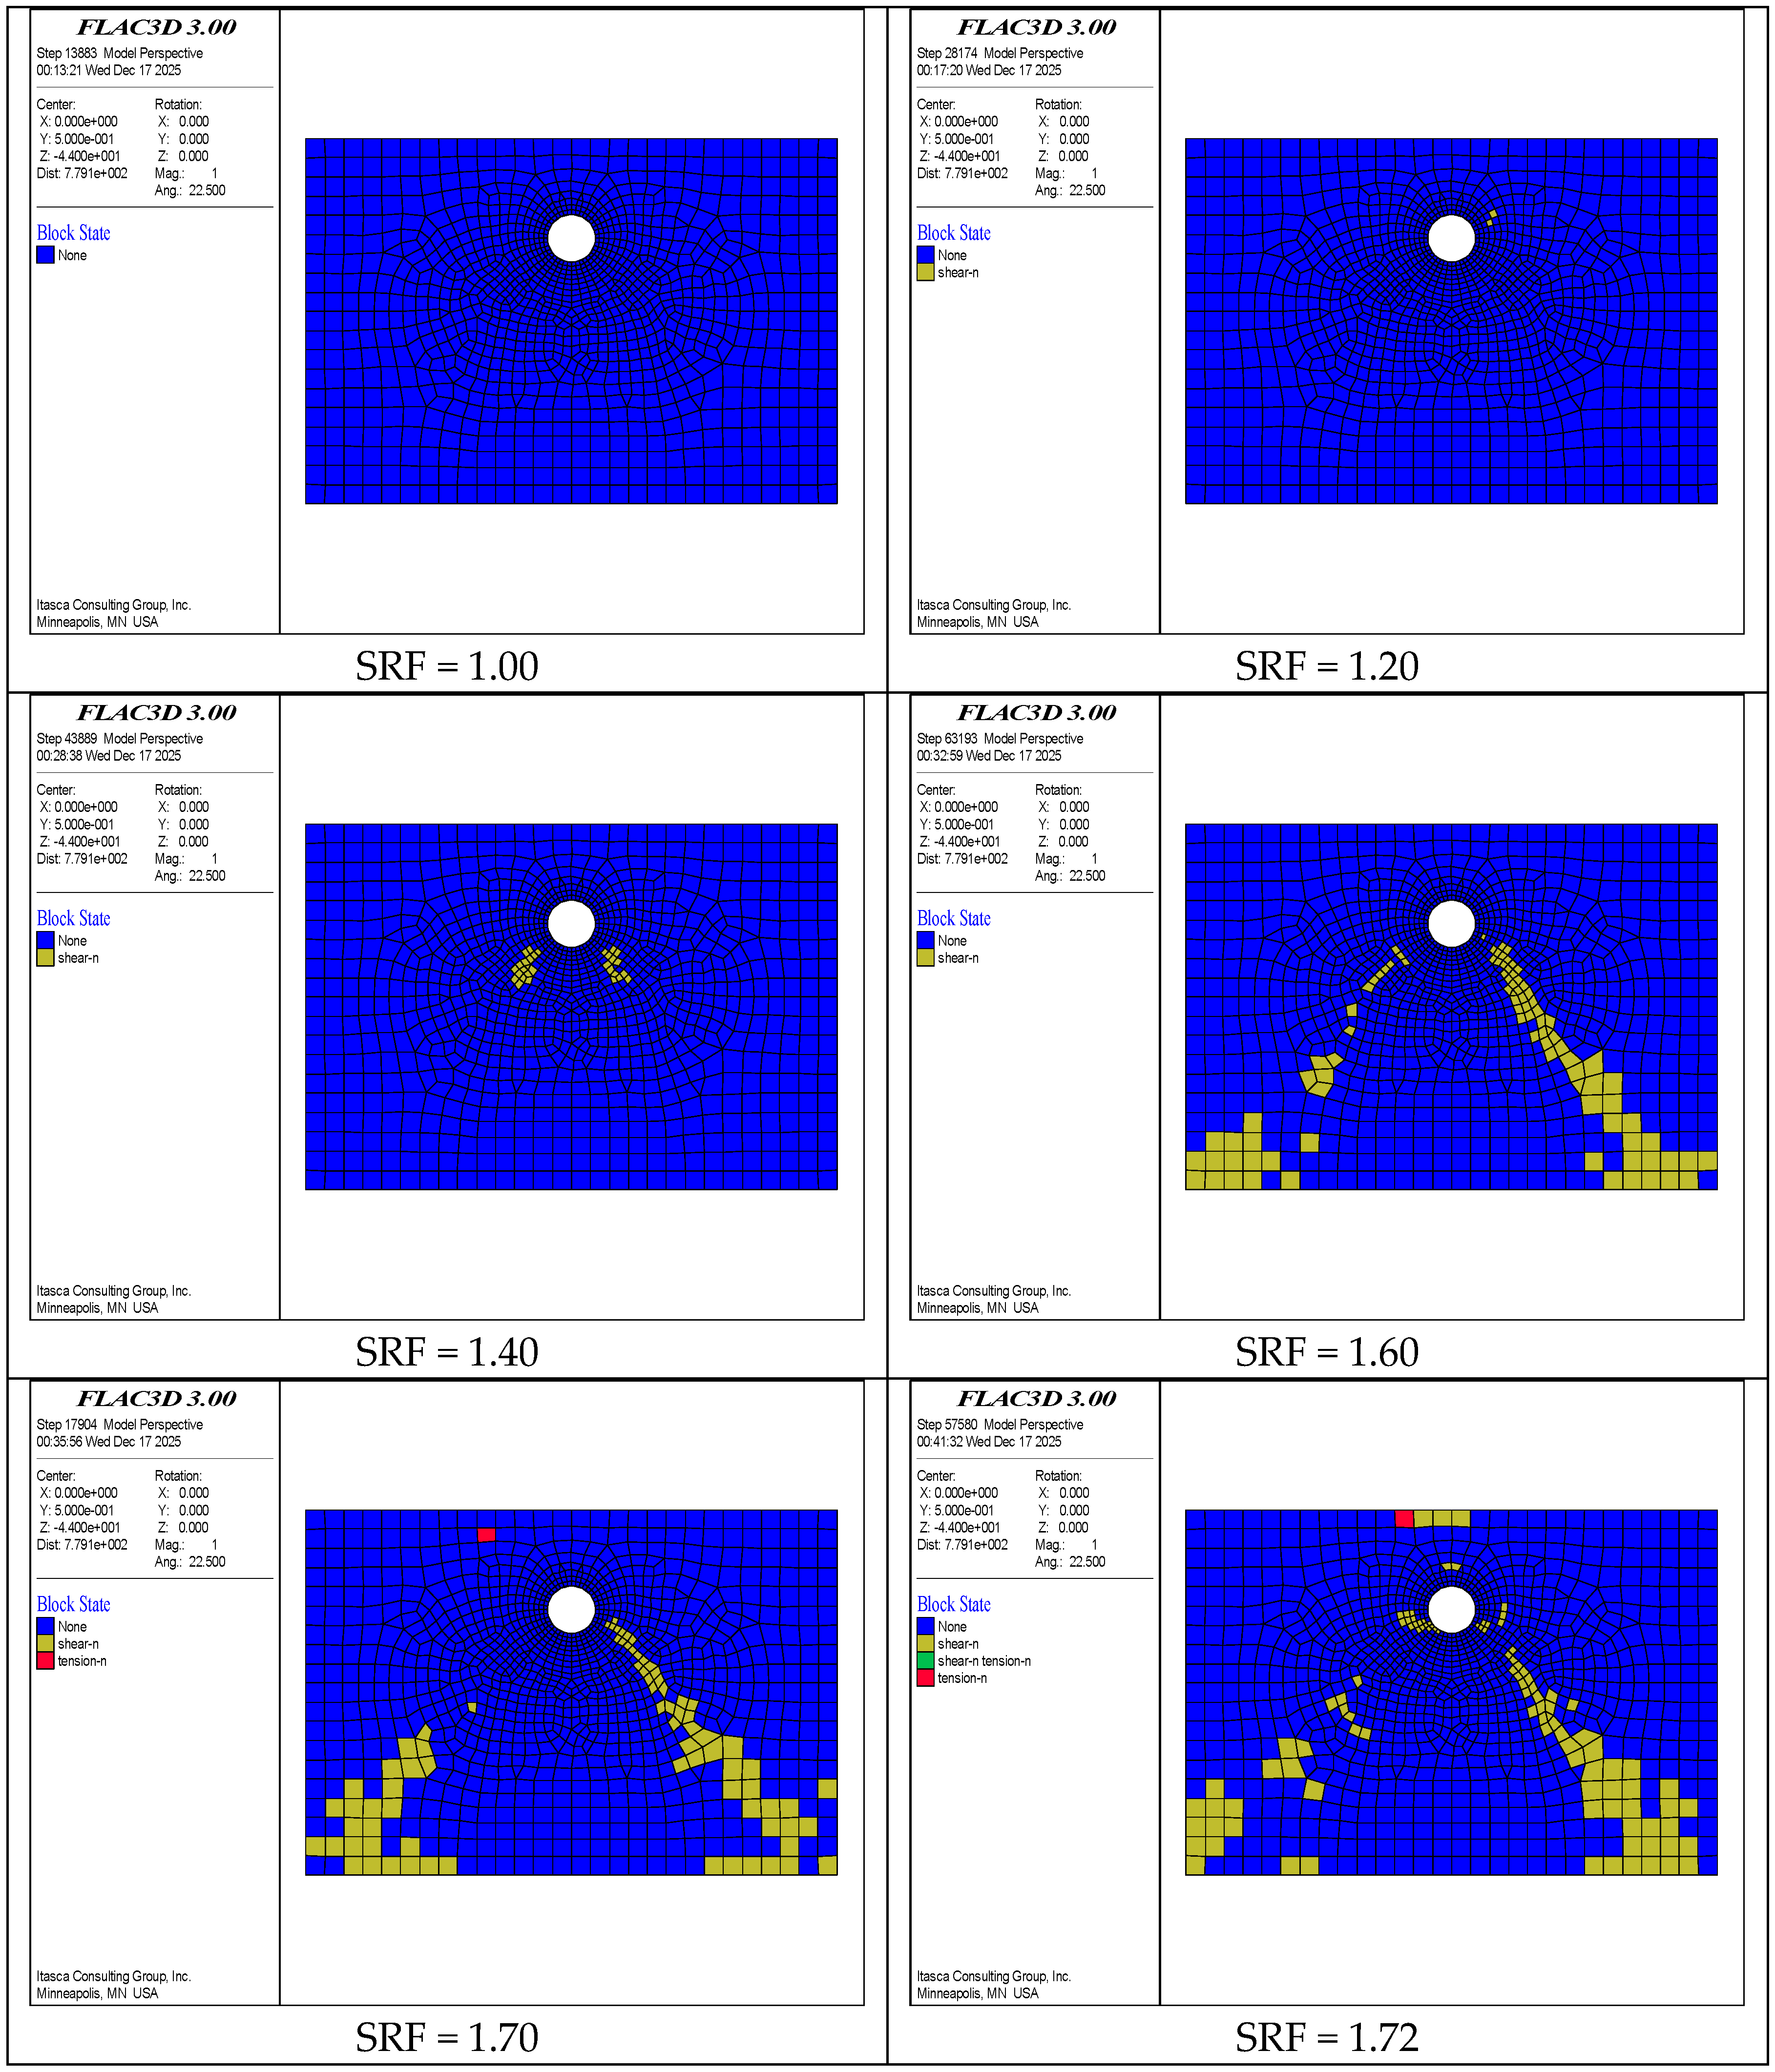
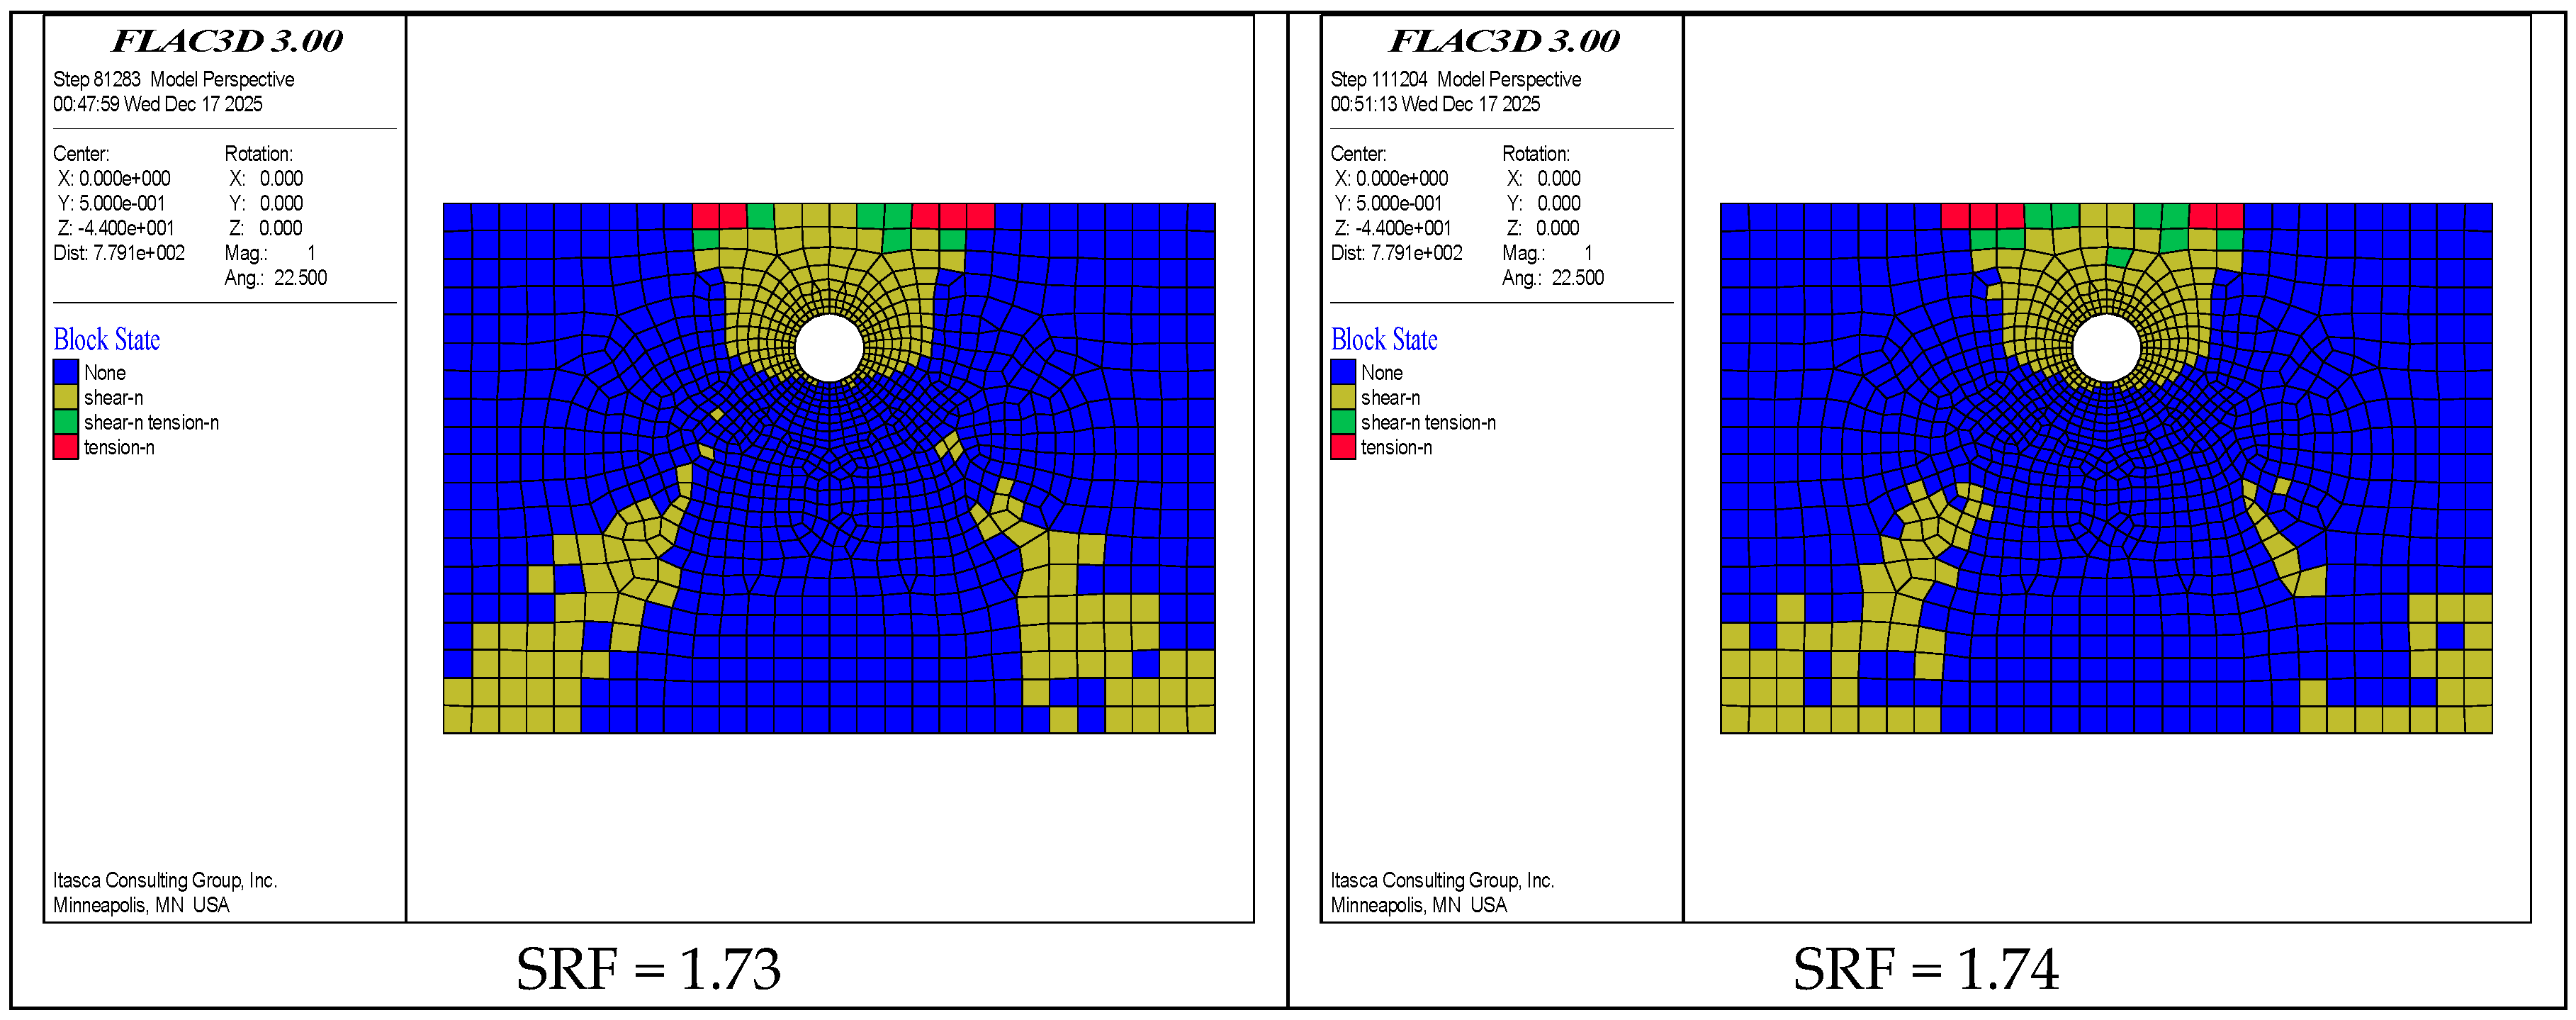
As shown in Figure 9, when the SRF ranges from 1.00 to 1.20, no significant plastic zones are generated around the tunnel. As the SRF increases to 1.40–1.60, a considerable number of shear failure elements develop at the left and right arch feet of the tunnel. These elements extend downward at approximately 45 degrees relative to the horizontal. With a further increase in the SRF to 1.70–1.74, tensile cracking elements begin to appear near the ground surface above the tunnel crown. Notably, when the SRF reaches 1.73, the number of failure elements at the tunnel crown increases abruptly. It means that there is a condition for the overall collapse.
Figure 9.
Distribution of plastic elements (red, green, and yellow elements) in the numerical model under different SRFs for the lined tunnel.
(3) Criterion III
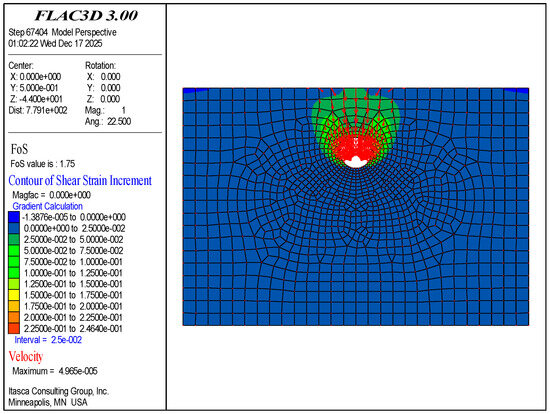
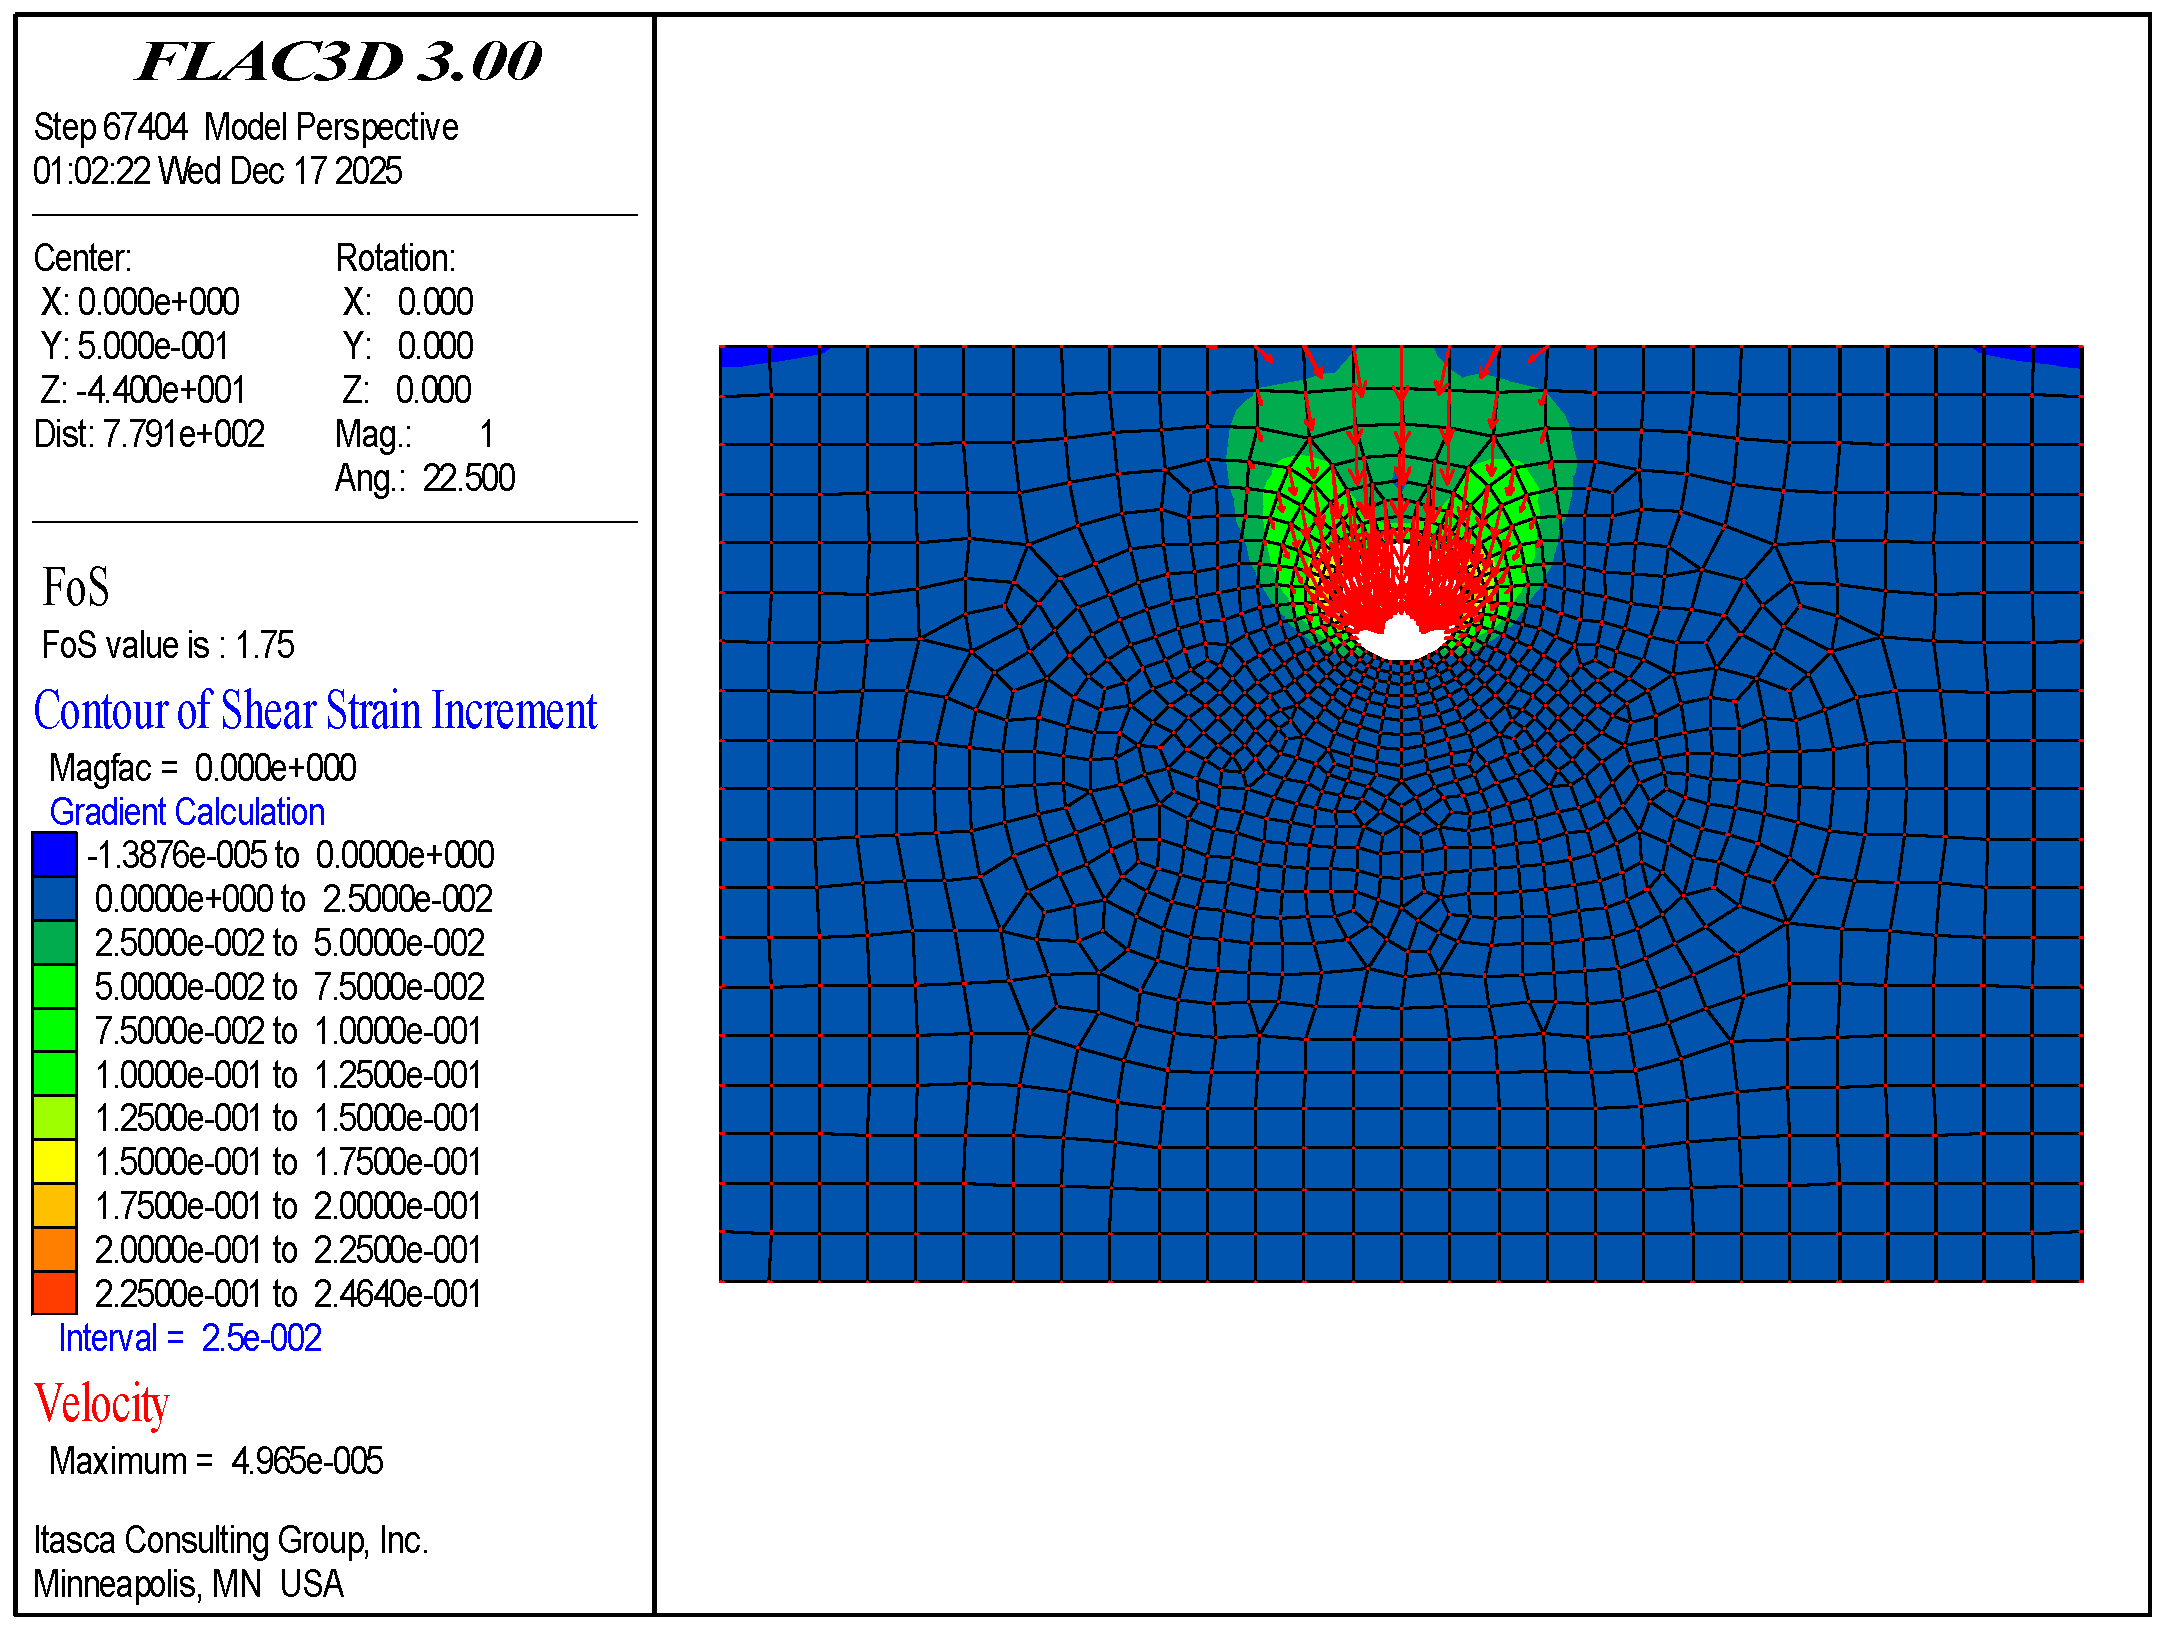
As shown in Figure 10, the FOS command indicates a safety factor of 1.75 for the tunnel. In the region from the tunnel crown to the ground surface, both the shear strain increment and velocity are relatively high. Among these, the velocity around the tunnel is particularly significant. It indicates the occurrence of overall collapse. This is generally consistent with the patterns revealed by other criteria.
Figure 10.
Results of the FOS command including the shear strain increment of elements and the velocity of nodes for the lined tunnel.
(4) Criterion IV
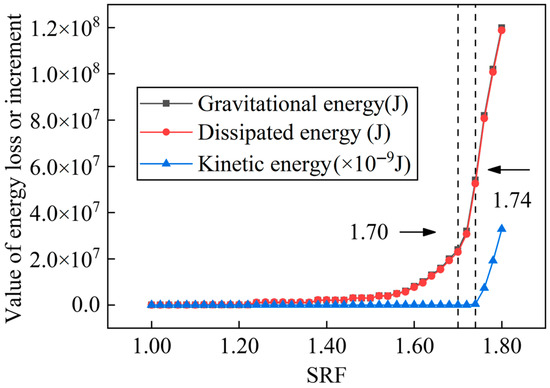
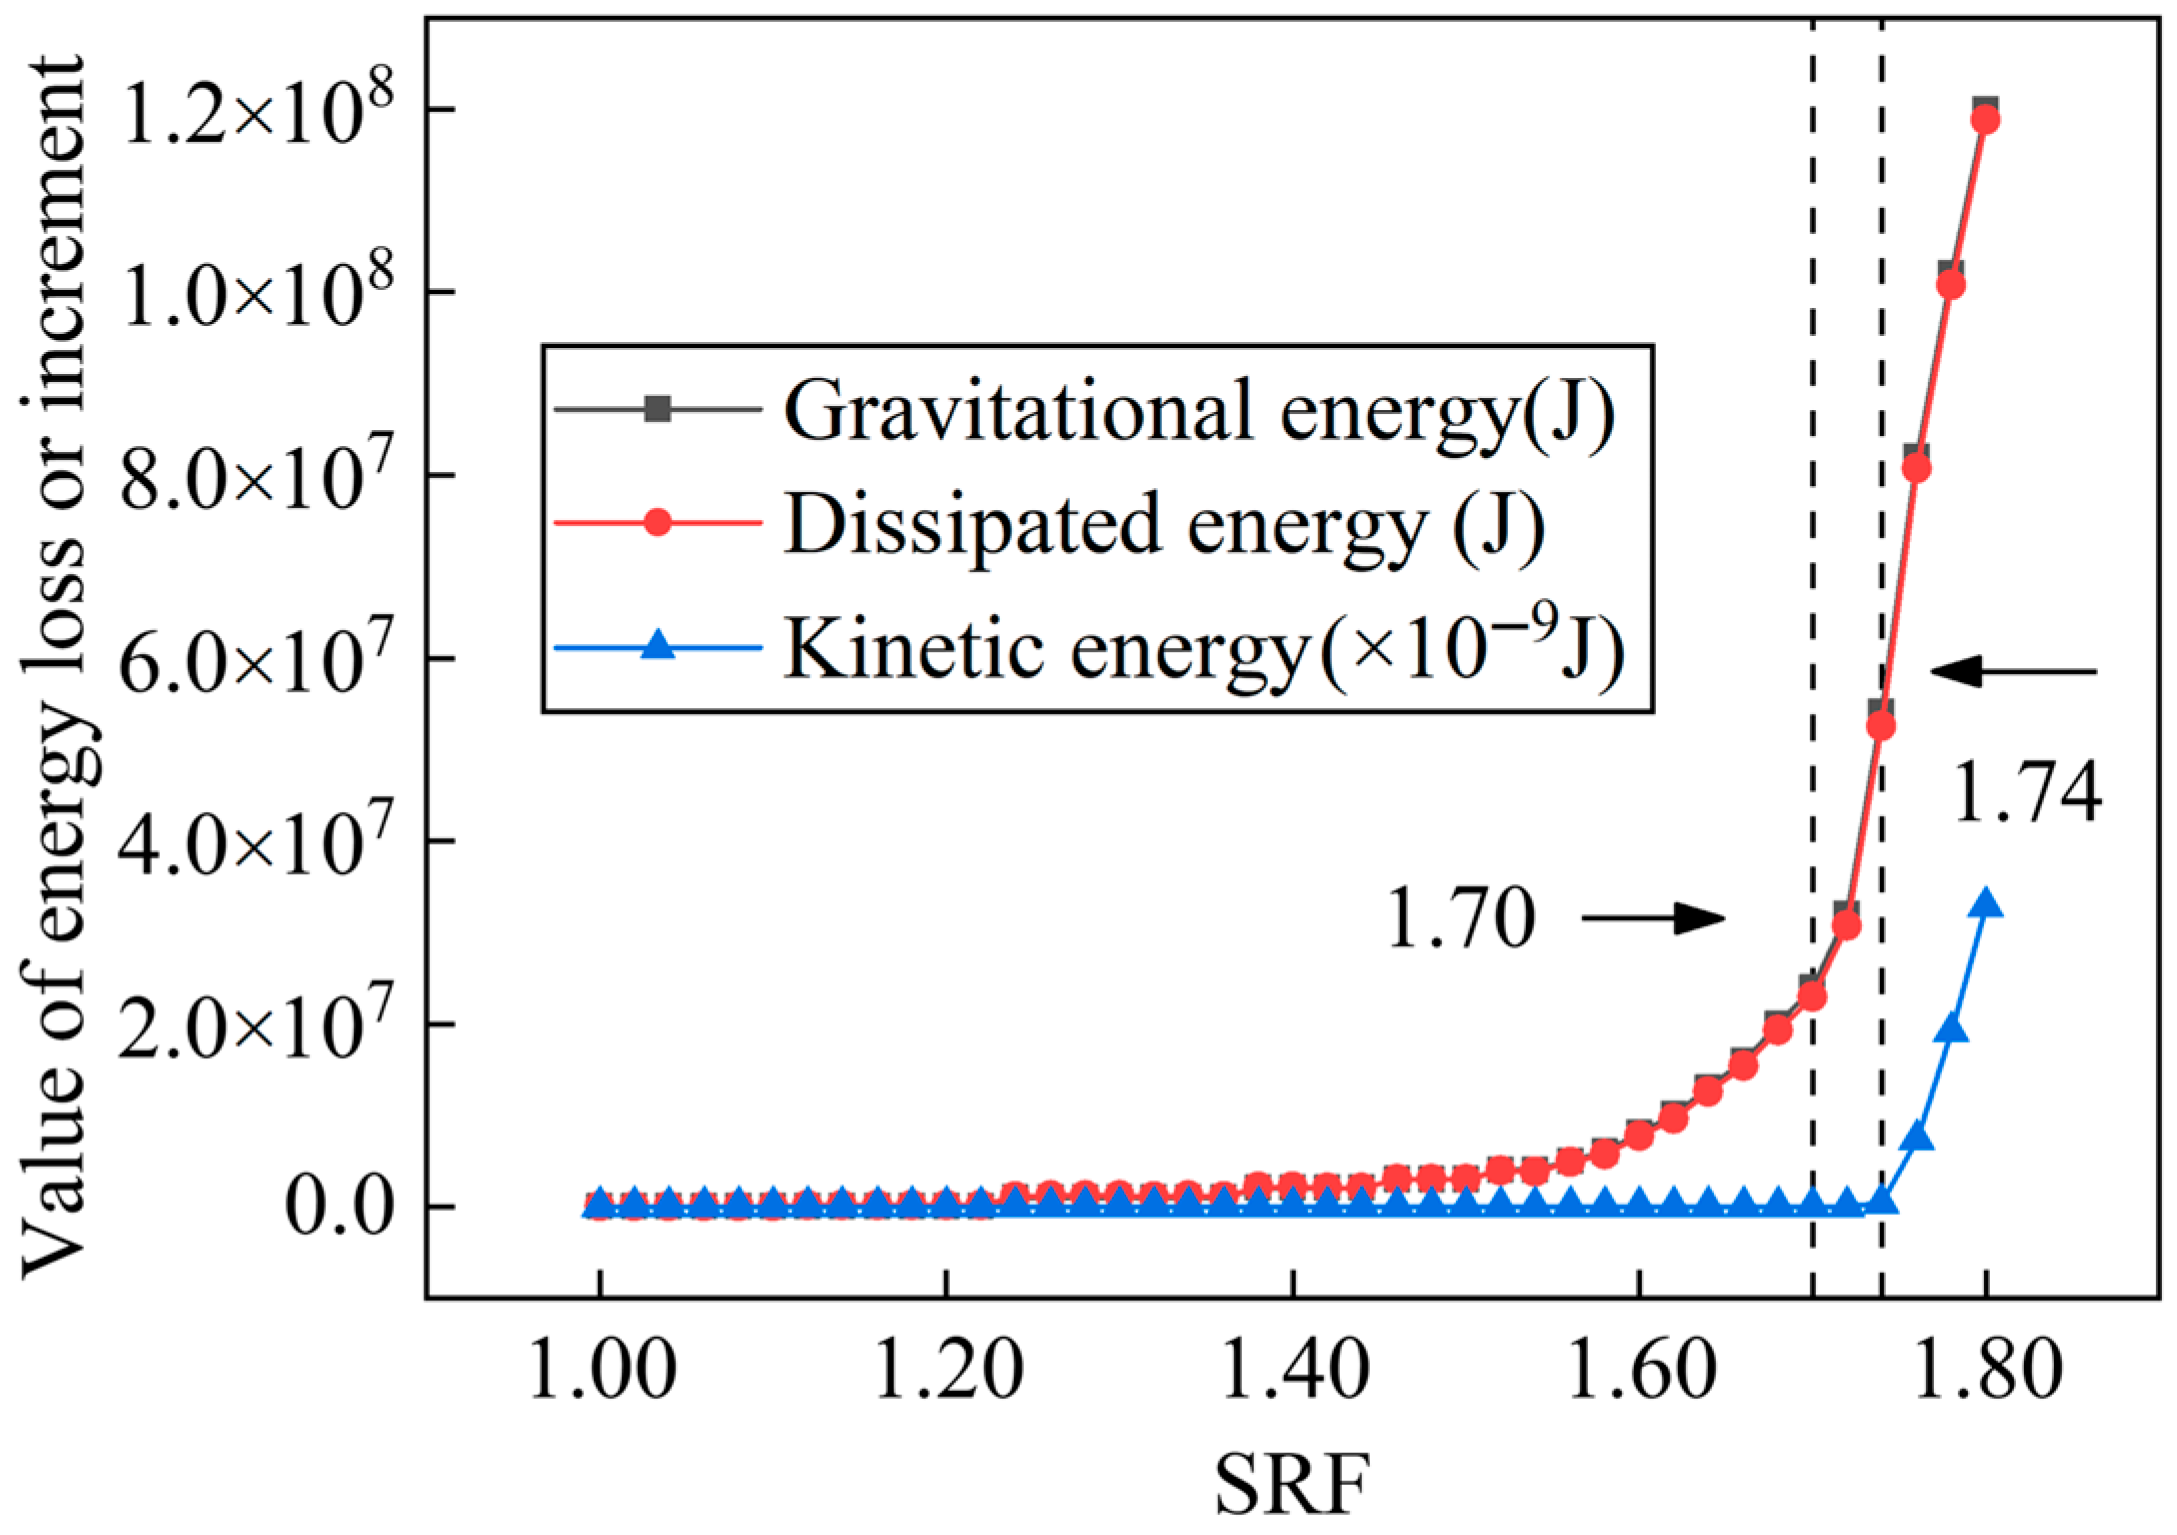
As shown in Figure 11, the gravitational and dissipated energy curves appear smooth near the mutation point, making it difficult to accurately identify the mutation point. In contrast, the kinetic energy curve exhibits a distinct mutation characteristic, with a clear and identifiable mutation point. This demonstrates a limitation of the energy catastrophe criterion: it requires manual identification of the mutation point, which can be challenging and less accurate for smooth curves.
Figure 11.
Curves between the various energy values and the SRFs for the lined tunnel.
(5) Variational criterion
As shown in Table 9, when the SRF ranges from 1.00 to 1.75, the variational values of the model remain positive. It indicates that instability has not occurred. When the SRF reaches 1.76, the variational value of the model turns negative for the first time. It signals the onset of instability.
Table 9.
Variational values under different SRFs for the lined tunnel.
(6) Comparisons
Results of different criteria are summarized in Table 10. As shown in Table 10, results of the three types of energy catastrophe criteria are close to those of the three commonly used failure criteria. The maximum absolute and relative errors between them are 0.05 and 2.9%, respectively. It indicates that for lined tunnels, there exists a favorable correspondence between the three commonly used failure criteria and the three energy catastrophe criteria. It is consistent with observations in slopes. Results of the variational criterion are close to those of the six typical failure criteria. There are the maximum absolute and relative errors of 0.05 and 2.9%, respectively. This demonstrates that the variational criterion exhibits good consistency with the six typical failure criteria in lined tunnels.
Table 10.
Factors of safety under different criteria for the lined tunnel.
3.2.2. Analysis of Influencing Factors
As demonstrated earlier through the typical example (), results of the FOS command (Criterion III) are close to those of other criteria (Criteria I, II, IV1, IV2, and IV3). However, applying Criteria I, II, IV1, IV2, and IV3 involves a substantial amount of work. To save time, the subsequent analysis will use the results of the FOS command in place of those of the six conventional criteria (Criteria I, II, III, IV1, IV2, and IV3). The mesh densities, strength reduction factor intervals, geometric parameters, and mechanical parameters are changed. The generality of the variational criterion is verified by comparing results of the FOS command with those of the variational criterion under different conditions.
(1) Mesh densities
As shown in Table 11, under different mesh densities, results of the variational criterion consistently align closely with those of the FOS command. There is an average relative error of 0.9% between them, indicating good agreement. This demonstrates that the applicability of the variational criterion in lined tunnels is not coincidental due to mesh densities.
Table 11.
FOSs under different mesh densities for lined tunnels.
(2) Strength reduction factor intervals
As shown in Table 12, results with a strength reduction factor interval of 0.001 consistently remain close to those with an interval of 0.01. There is an average relative error of 0.7% between them, indicating good agreement. This demonstrates that the applicability of the variational criterion in lined tunnels is not coincidental due to strength reduction factor intervals.
Table 12.
Factors of safety under different strength reduction factor intervals for lined tunnels.
(3) Geometric parameters
As shown in Table 13, under different geometric parameters, results of the variational criterion consistently align closely with those of the FOS command. There is an average relative error of 0.7% between them, indicating good agreement. This demonstrates that the applicability of the variational criterion in lined tunnels is not coincidental due to specific geometric parameters.
Table 13.
Factors of safety under different geometric parameters for lined tunnels.
(4) Mechanical parameters
As shown in Table 14, under different mechanical parameters, results of the variational criterion consistently align closely with those of the FOS command. There is an average relative error of less than 1.0% between them, indicating good agreement. This demonstrates that the applicability of the variational criterion in lined tunnels is not coincidental due to specific mechanical parameters.
Table 14.
Factors of safety under different mechanical parameters for lined tunnels.
In summary, for unlined and lined tunnels, a favorable correspondence exists between the three commonly used failure criteria and the three energy catastrophe criteria. It is consistent with observations in slopes. Furthermore, the variational criterion also demonstrates applicability in this context. This applicability is not coincidental due to mesh densities, strength reduction factor intervals, geometric parameters, and mechanical parameters.
3.3. Example 3: A Constructed Tunnel
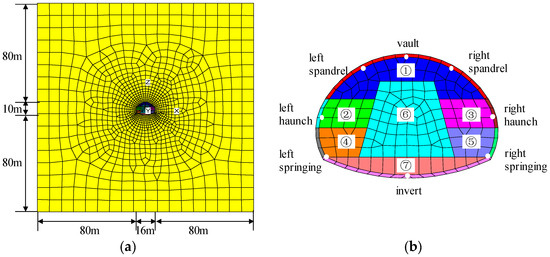
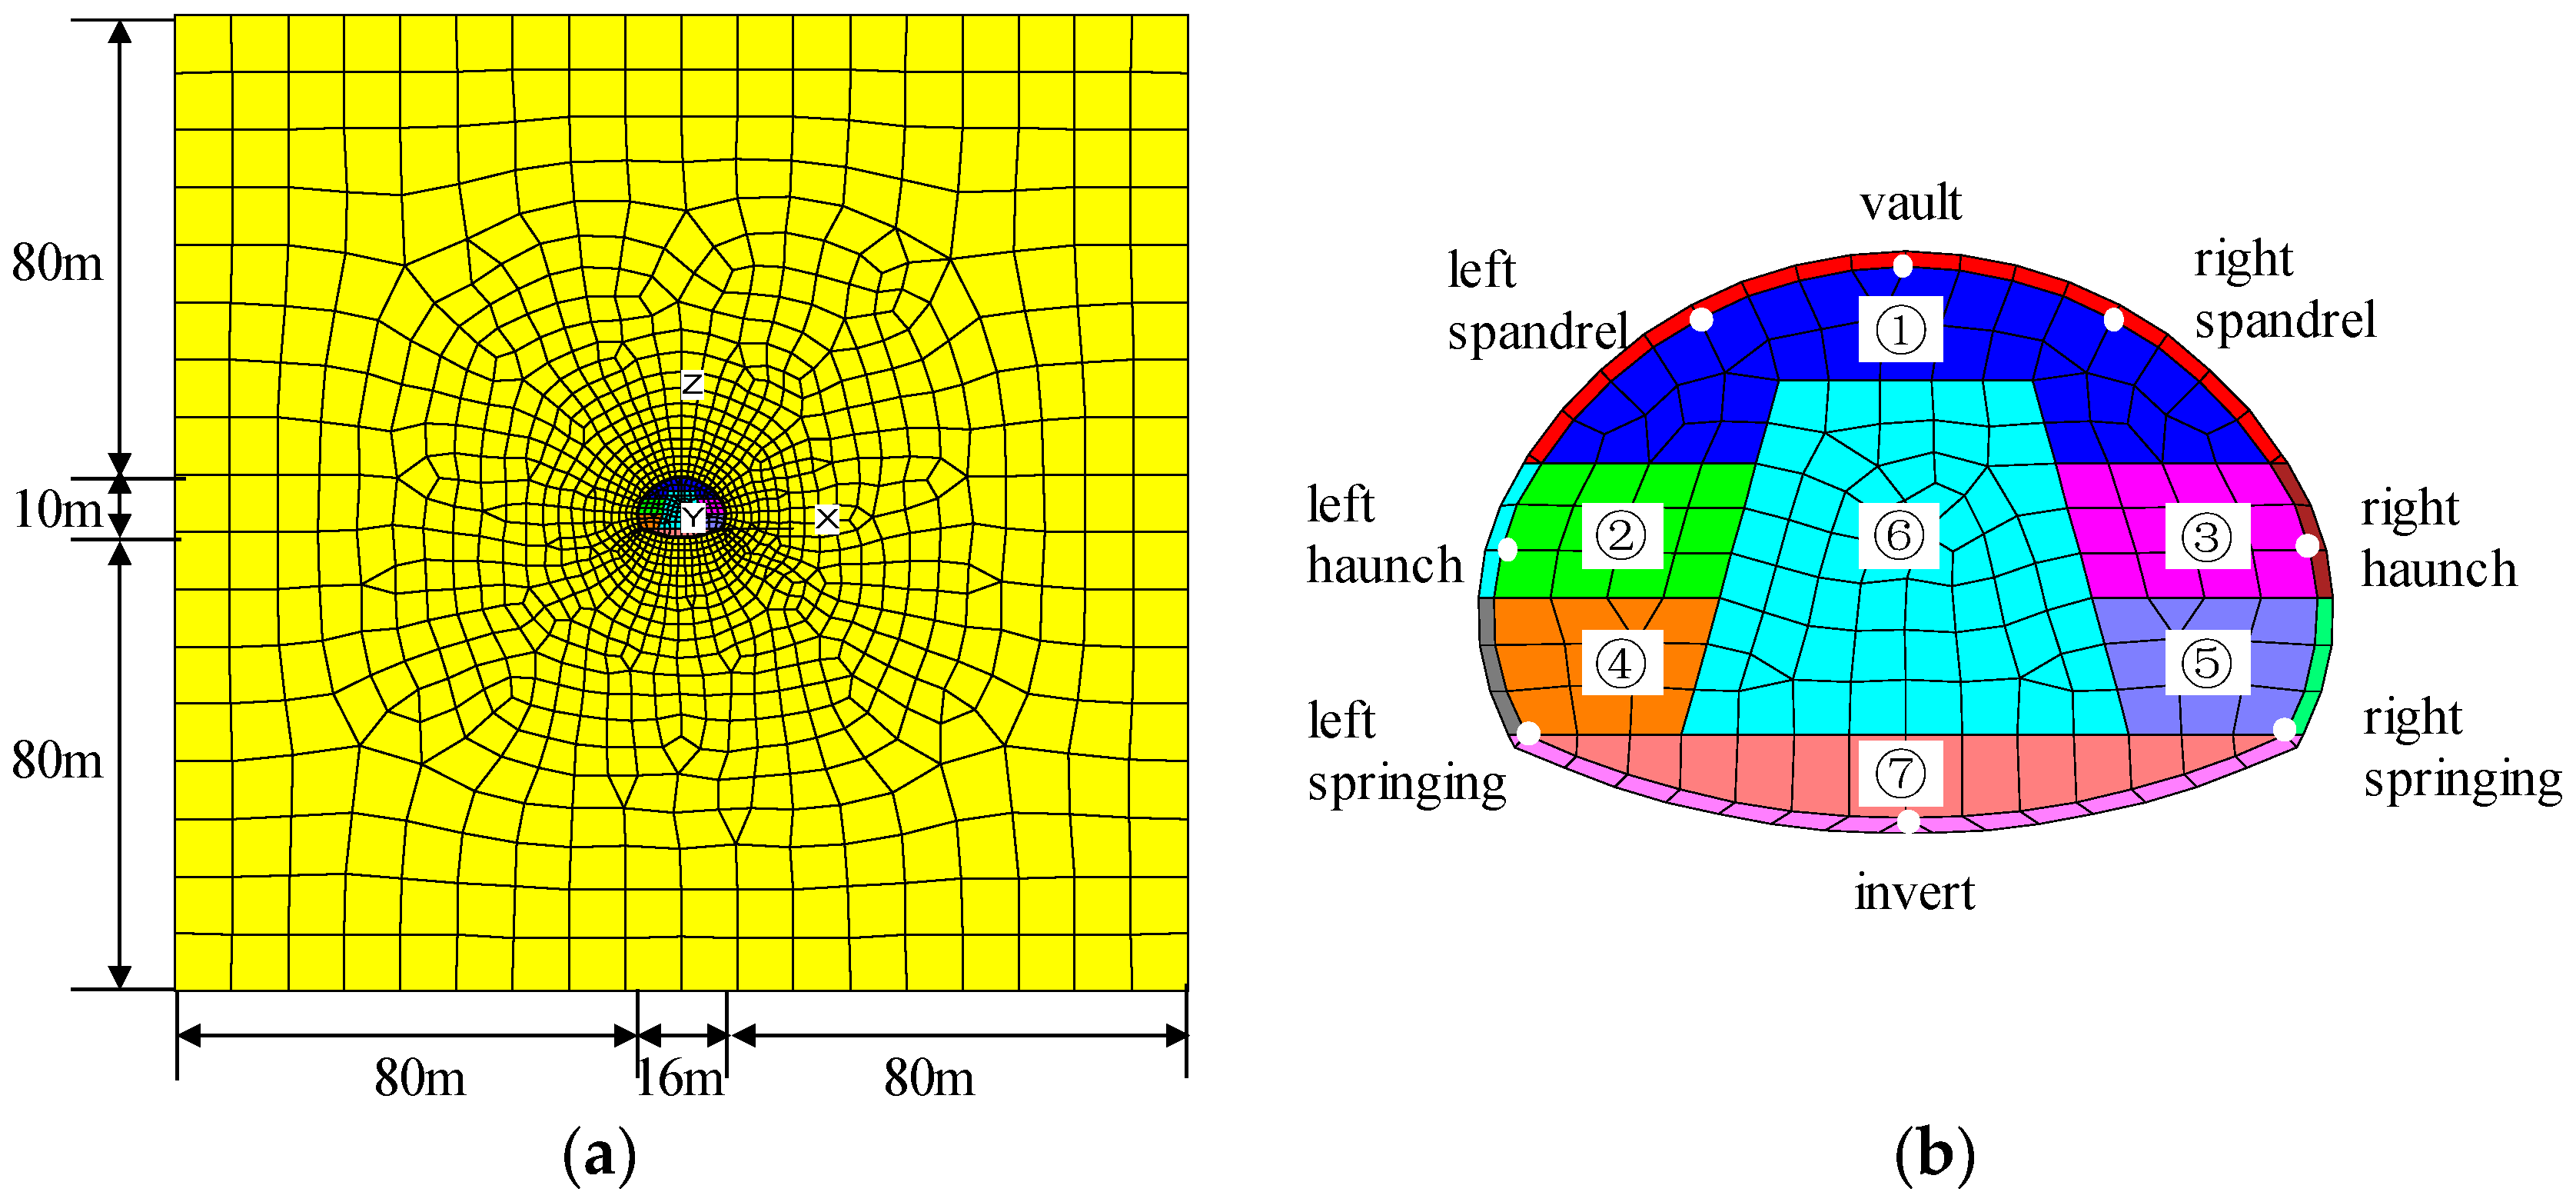
According to the paper [74,75], a numerical model of constructed tunnel using the annular excavation with the reserved core soil method is established. The geometric dimensions of the tunnel and the numerical model are shown in Figure 12. Both the surrounding rock and the lining are modeled as ideal elastoplastic materials. The materials follow the Mohr–Coulomb yield criterion and non-associated flow rule. The mechanical parameters of materials are presented in Table 15. In this context, the strength parameters of the surrounding rock are determined with reference to the research of Tang et al. [74]. The lining adopts C25 concrete, with its strength parameters determined based on the research of Xiao et al. [75]. The construction steps of the annular excavation with reserved core soil method are listed in Table 16. The distance from the tunnel to the left side, right side, and bottom of the model is set at five times the span, respectively. The model is constrained in horizontal displacement on the left and right sides, fixed at the bottom, and free at the top. The longitudinal length of the tunnel is set to 1 m.
Figure 12.
Overall and detailed drawings of the numerical model of the constructed tunnel. (a) Overall drawings of the model; (b) detailed drawings of the model, the tunnel interior is divided into seven excavation sections and these are represented by seven distinct colors and serial numbers.
Table 15.
Mechanical parameters of the material for the constructed tunnel.
Table 16.
Divisions of construction stages for the constructed tunnel.
3.3.1. Comparisons of Different Criteria Under the Typical Condition
Taking construction stage 3 as a typical condition, the SRM and various criteria are applied to determine the safety factor of the tunnel.
(1) Criterion I
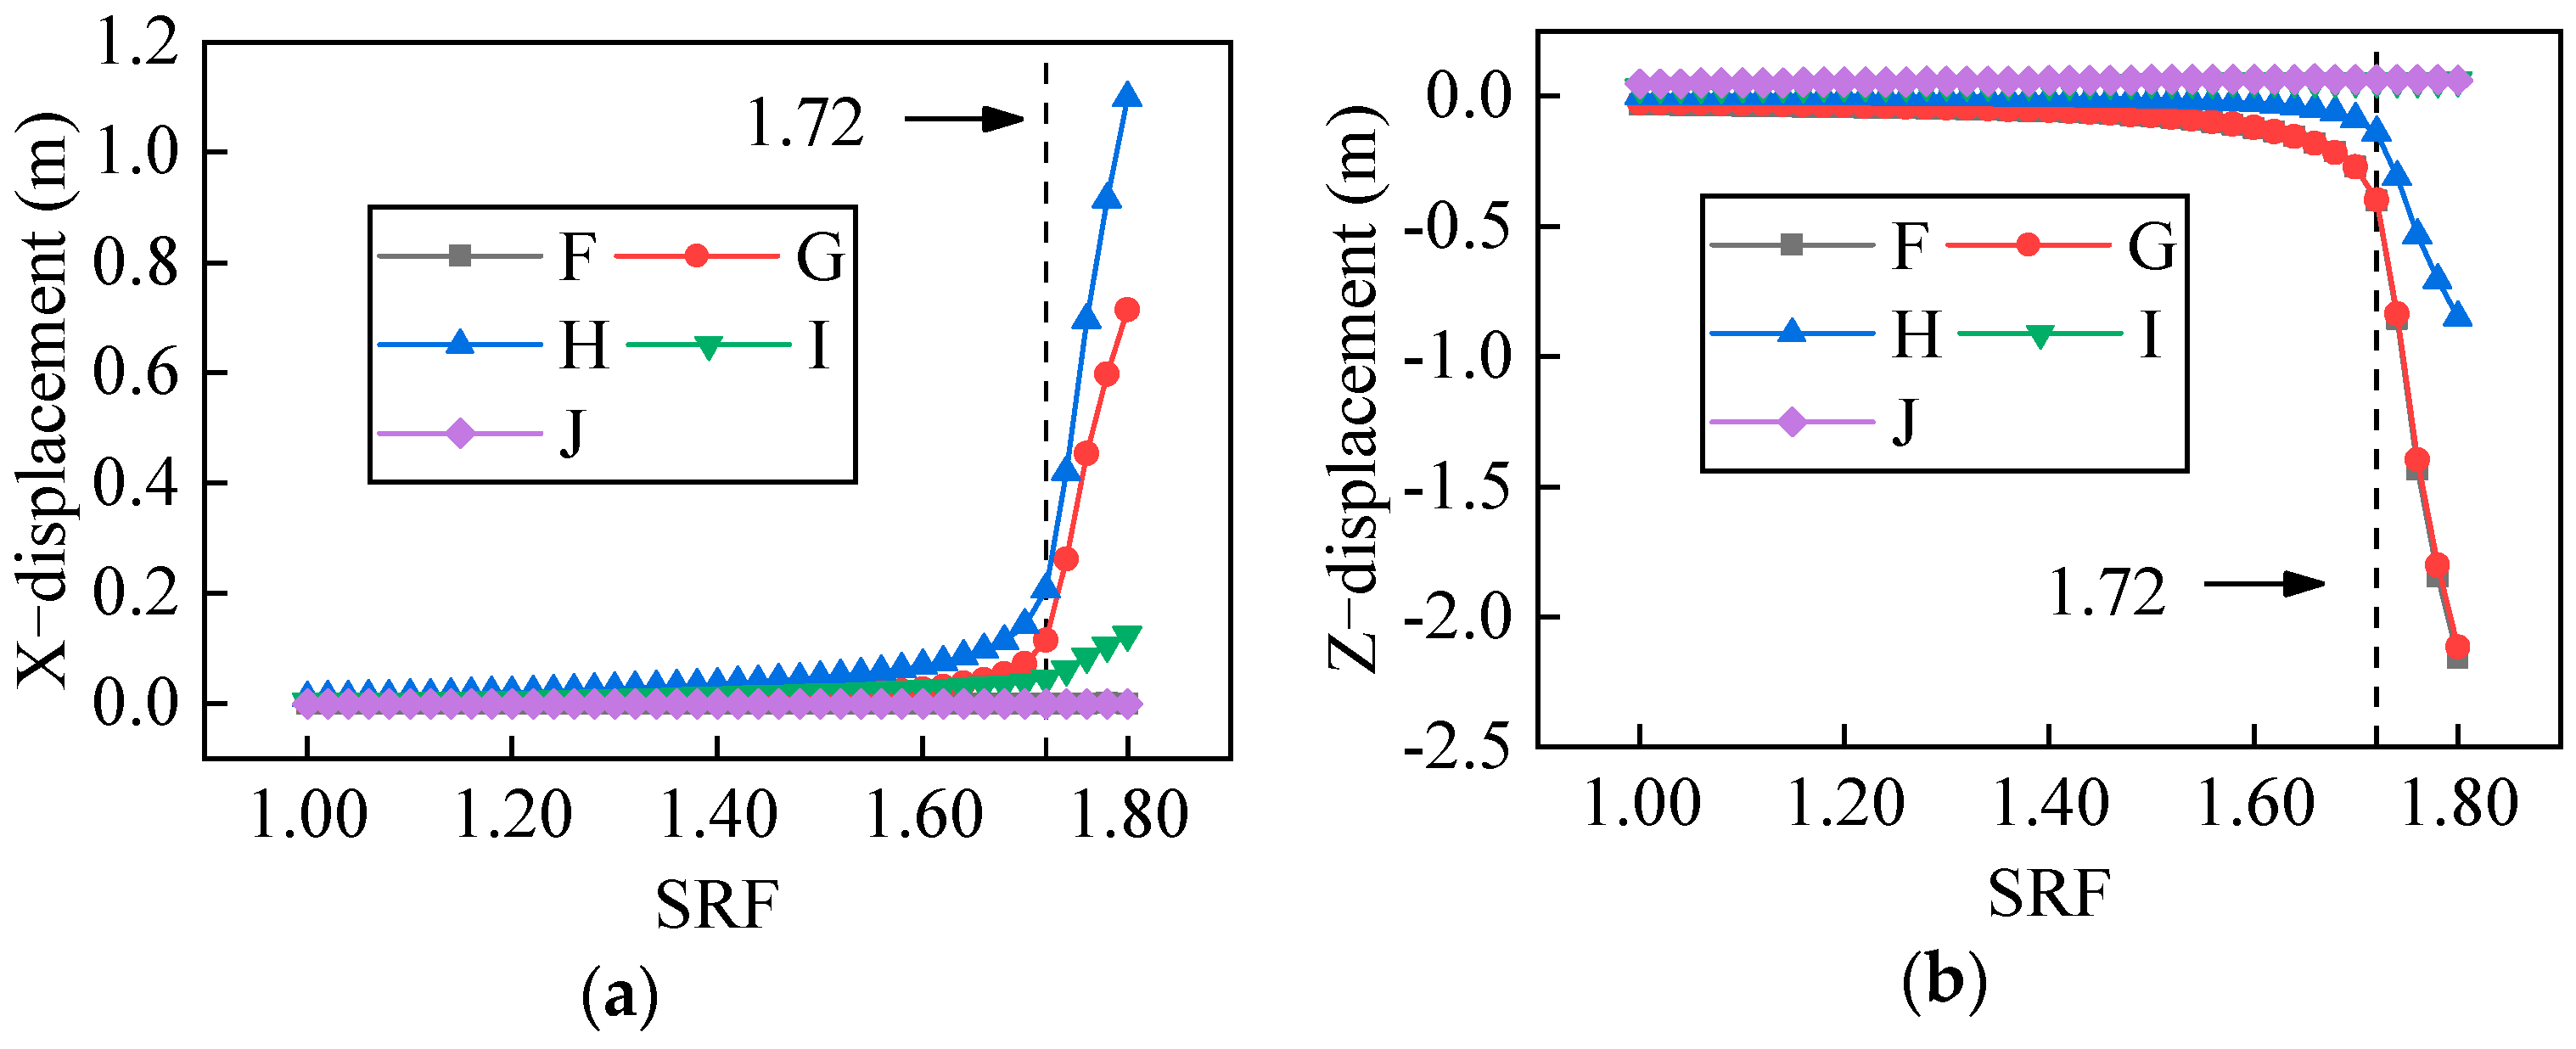
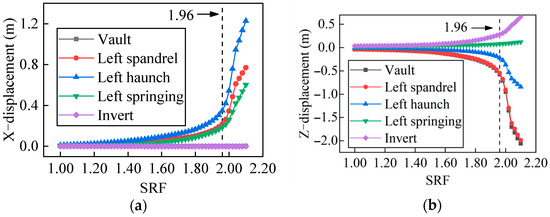
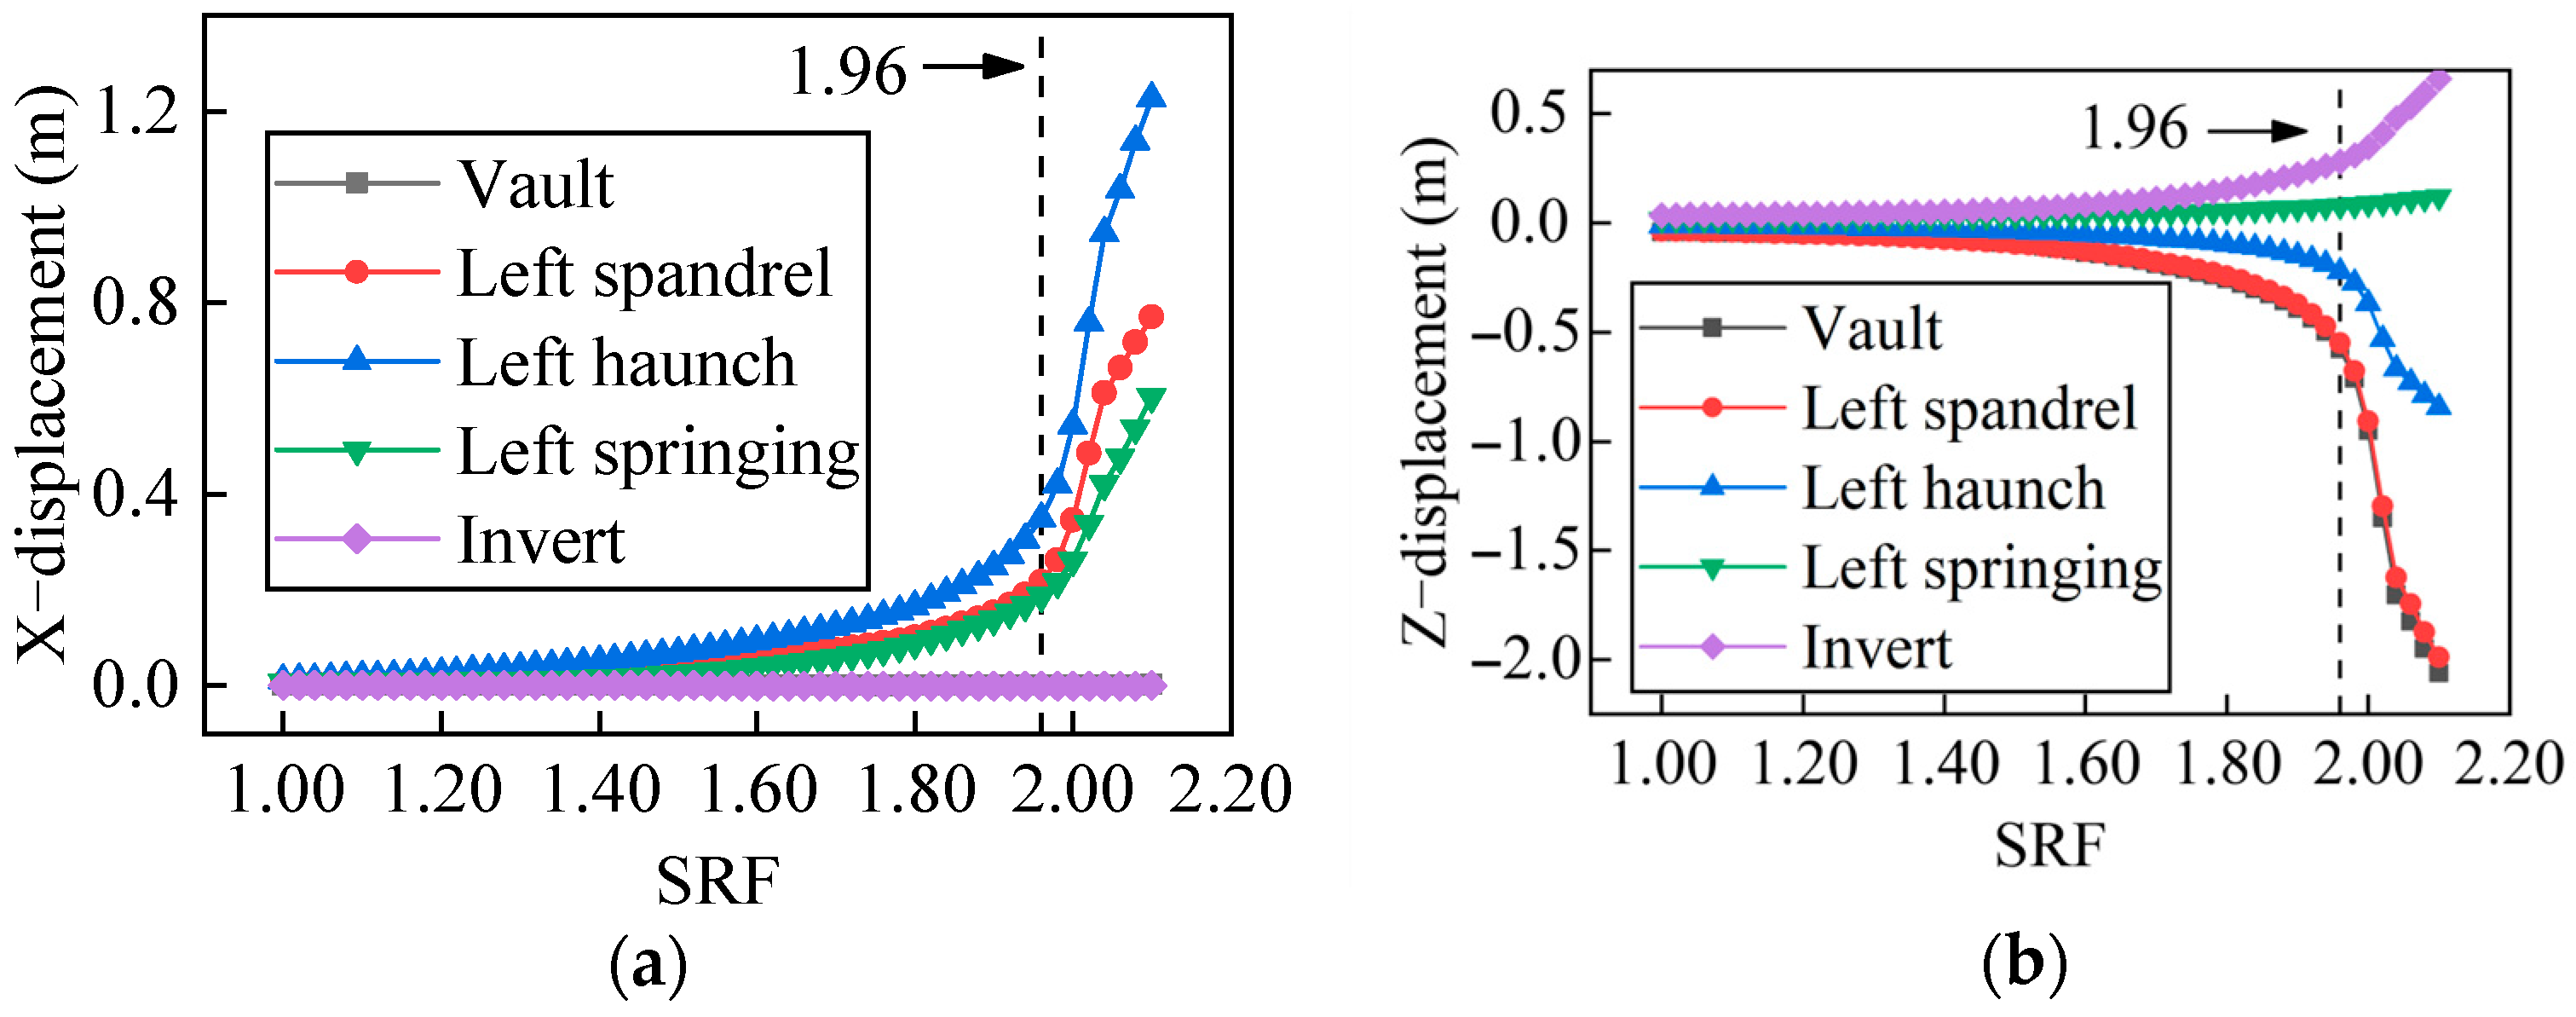
As shown in Figure 13, the characteristics of mutations in the curves vary across different monitoring points and displacement directions. Regarding the X-displacement, the most pronounced mutation occurs at the left haunch, followed by a slightly weaker mutation at the left spandrel, while no mutation is observed at the vault. For the Z-displacement, the most significant mutations are noted at the vault and left spandrel, with a relatively weaker mutation at the left haunch. Under this condition, a free face is not formed at the left springing and the invert. Therefore, the characteristics of their displacement curves are not analyzed. It is evident that the effective application of this criterion requires the selection of appropriate monitoring points and displacement directions.
Figure 13.
Curves between the displacements of the monitoring points and the SRFs for the constructed tunnel. (a) The X-displacement; (b) the Z-displacement.
(2) Criterion II
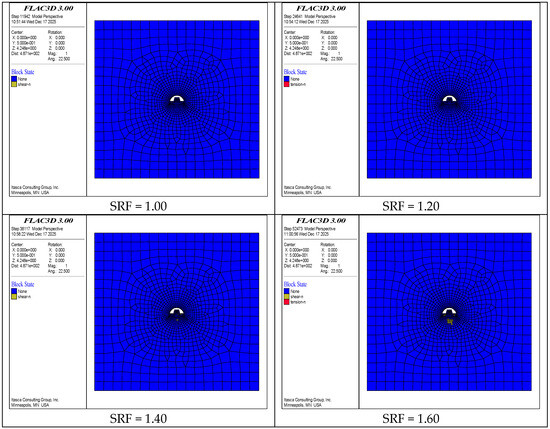
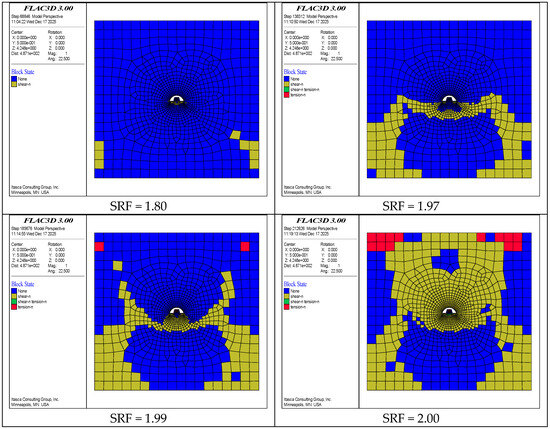
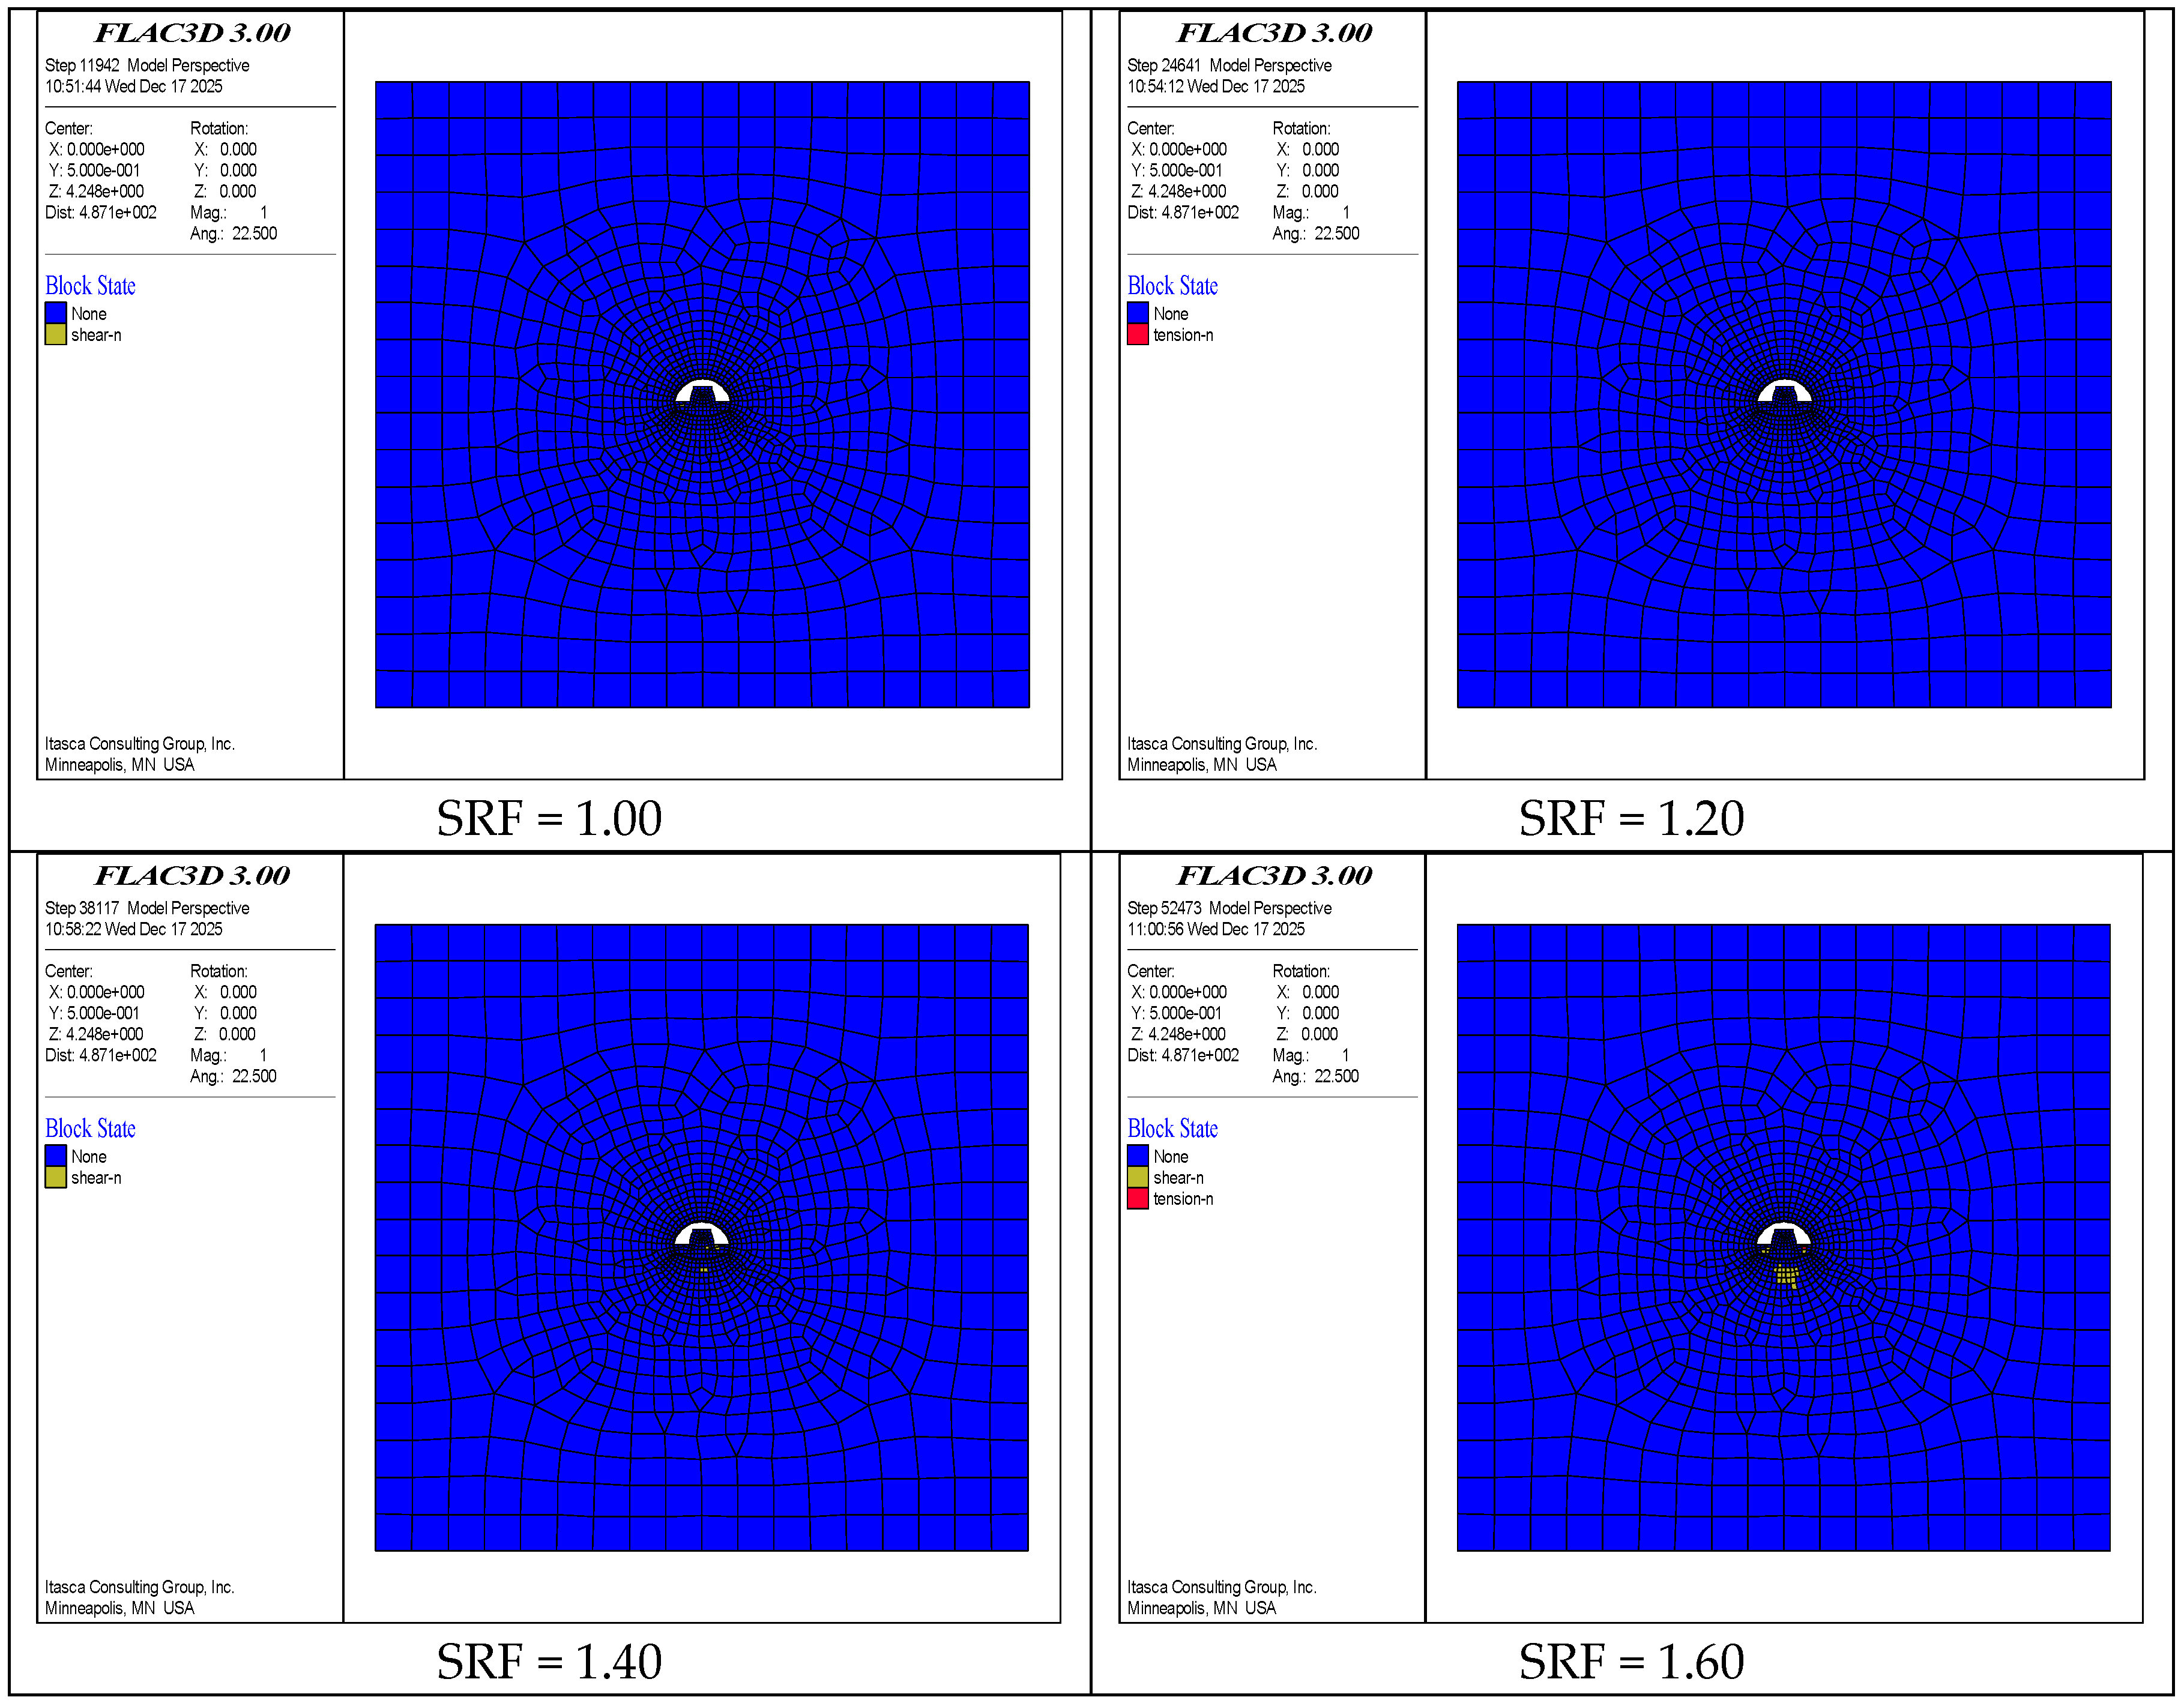
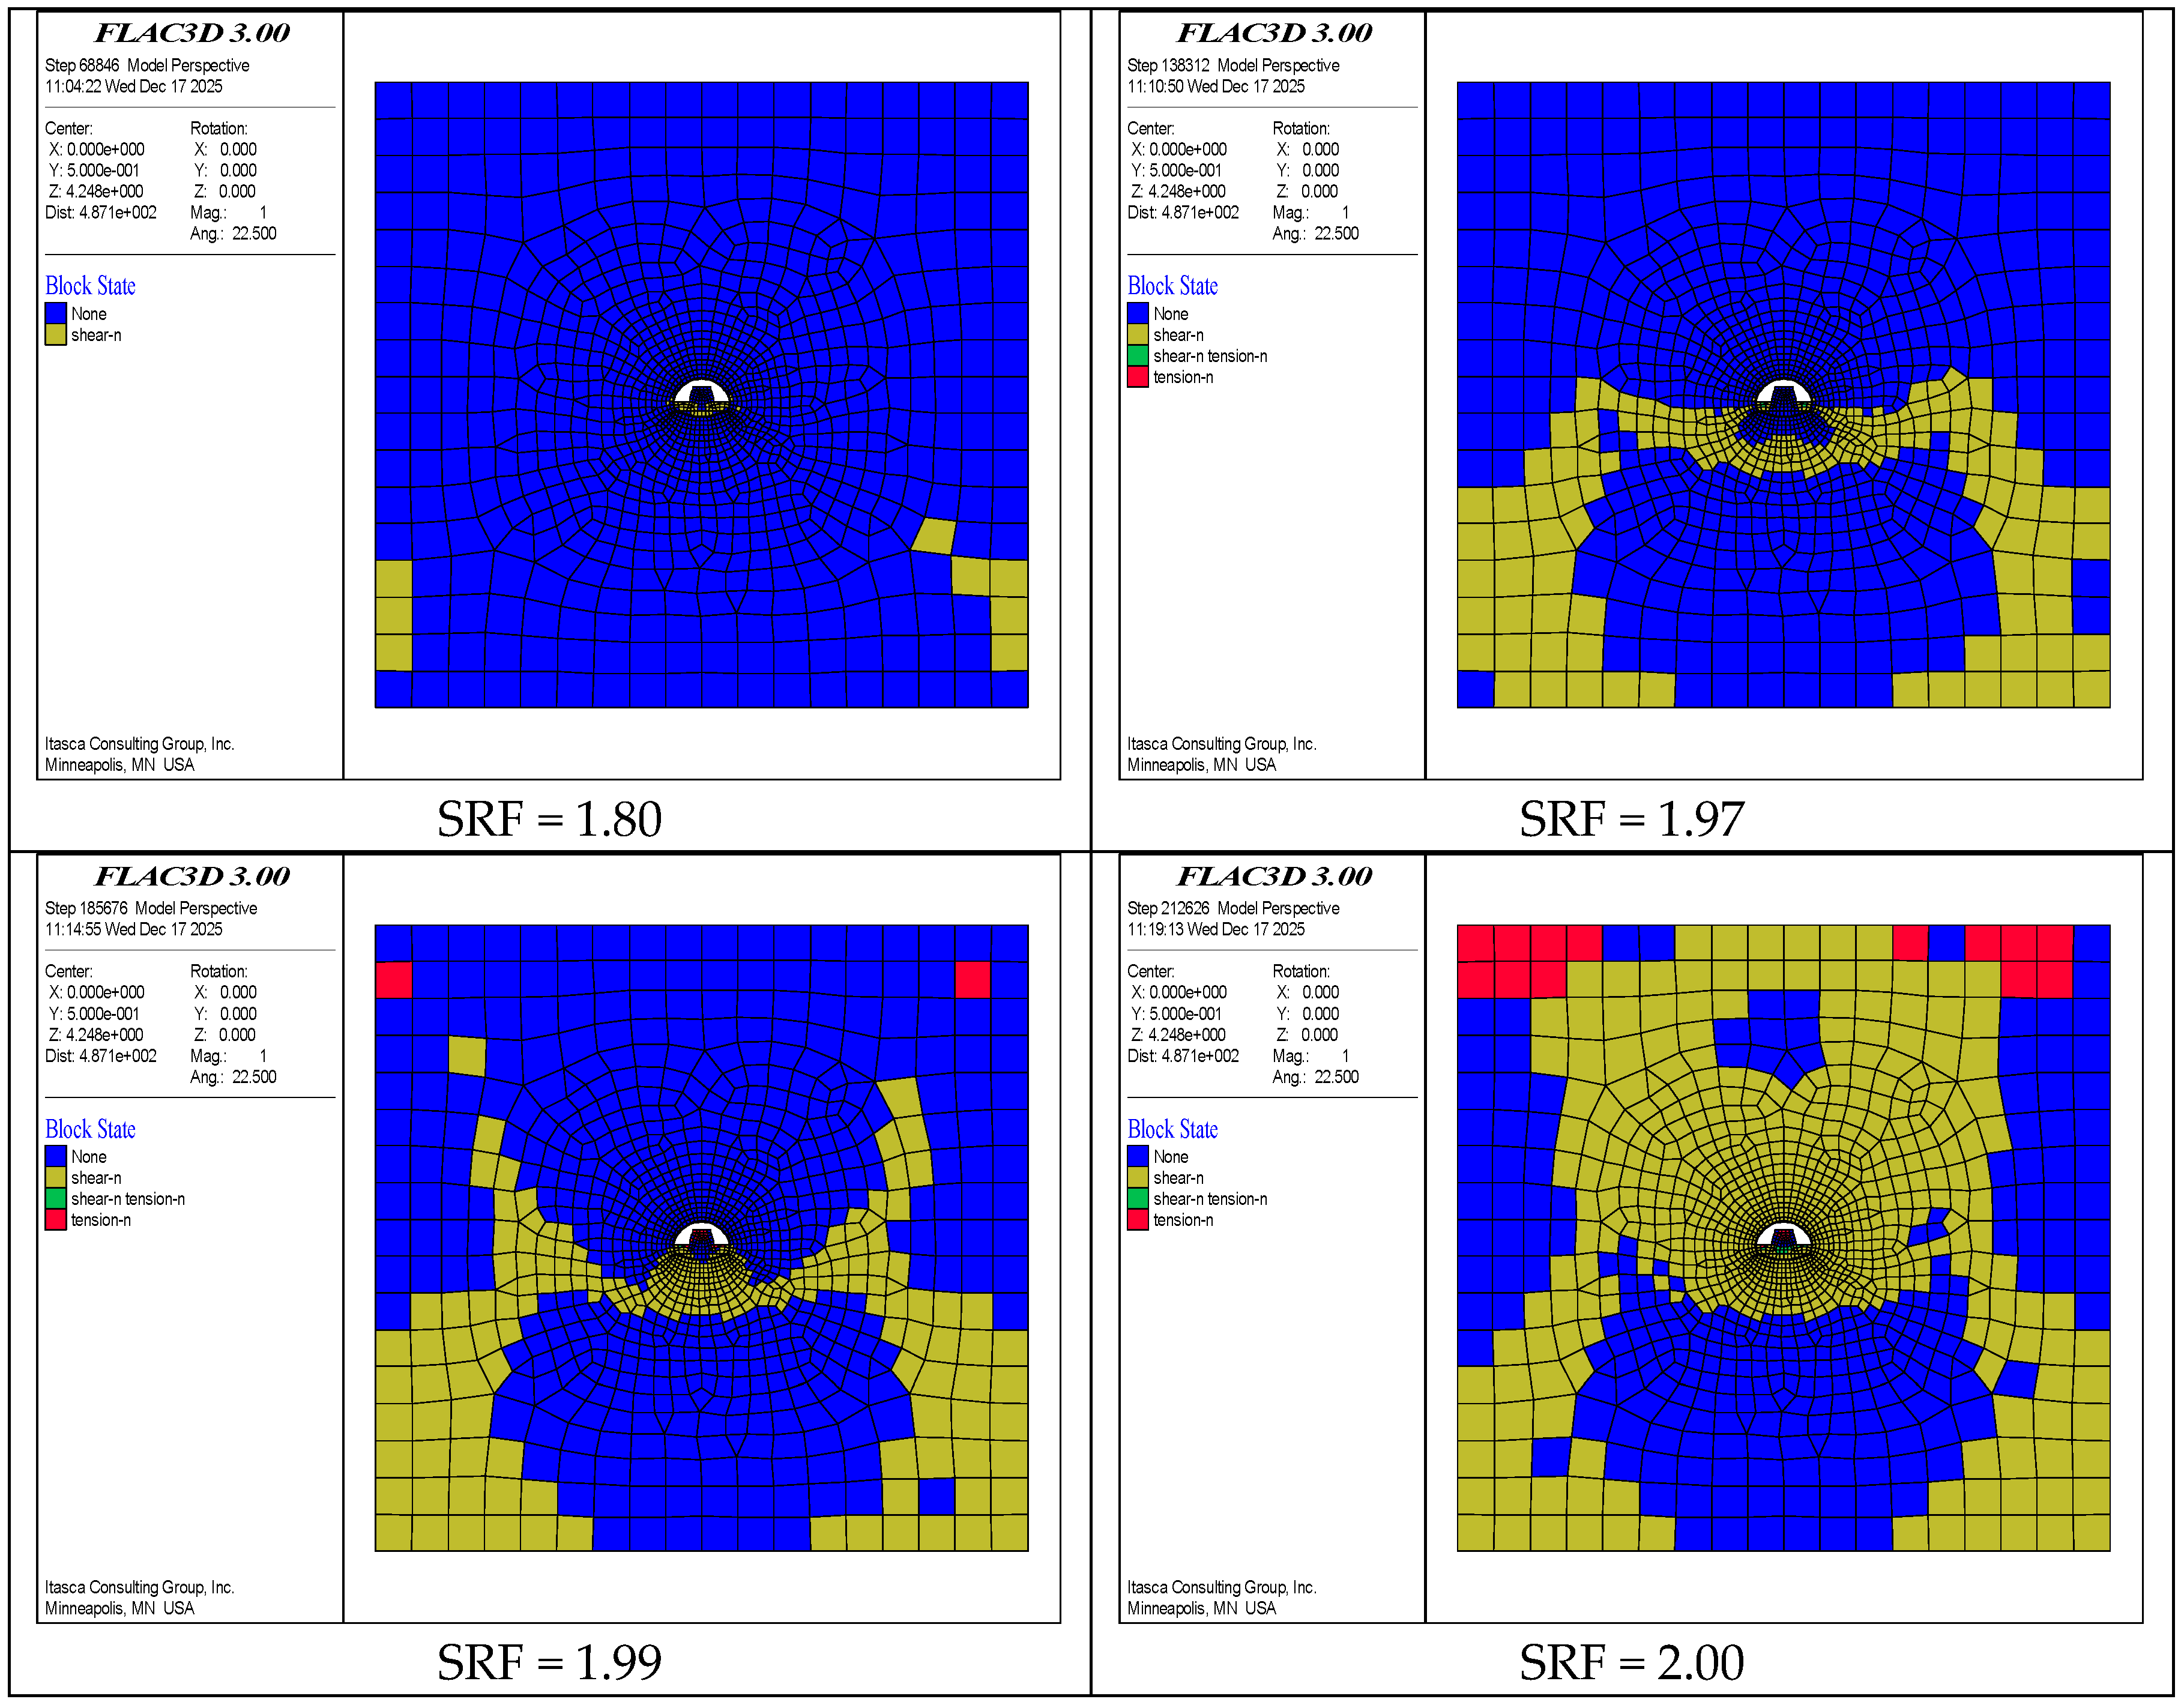
As shown in Figure 14, when the SRF ranges from 1.00 to 1.80, almost no failure elements appear around the tunnel. As the SRF increases to 1.97–1.99, a significant number of failure elements begin to develop at the left and right arch waists of the tunnel. These elements extend upward and downward along approximately a 45-degree angle relative to the horizontal. Concurrently, tensile failure elements start to emerge near the ground surface above the tunnel. When the SRF reaches 2.00, both tensile and shear failure elements above the tunnel increase substantially. It means that there is a condition for the overall collapse.
Figure 14.
Distribution of plastic elements (red, green, and yellow elements) in the numerical model under different SRFs for the constructed tunnel.
(3) Criterion III
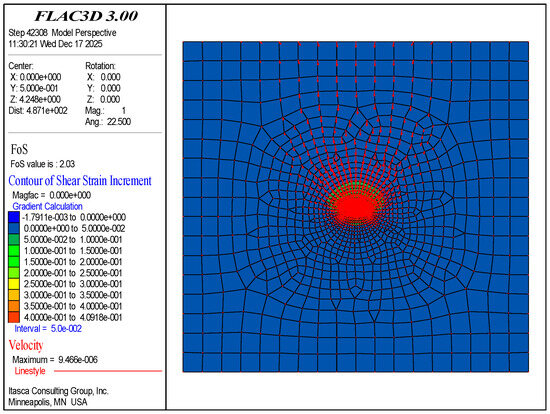
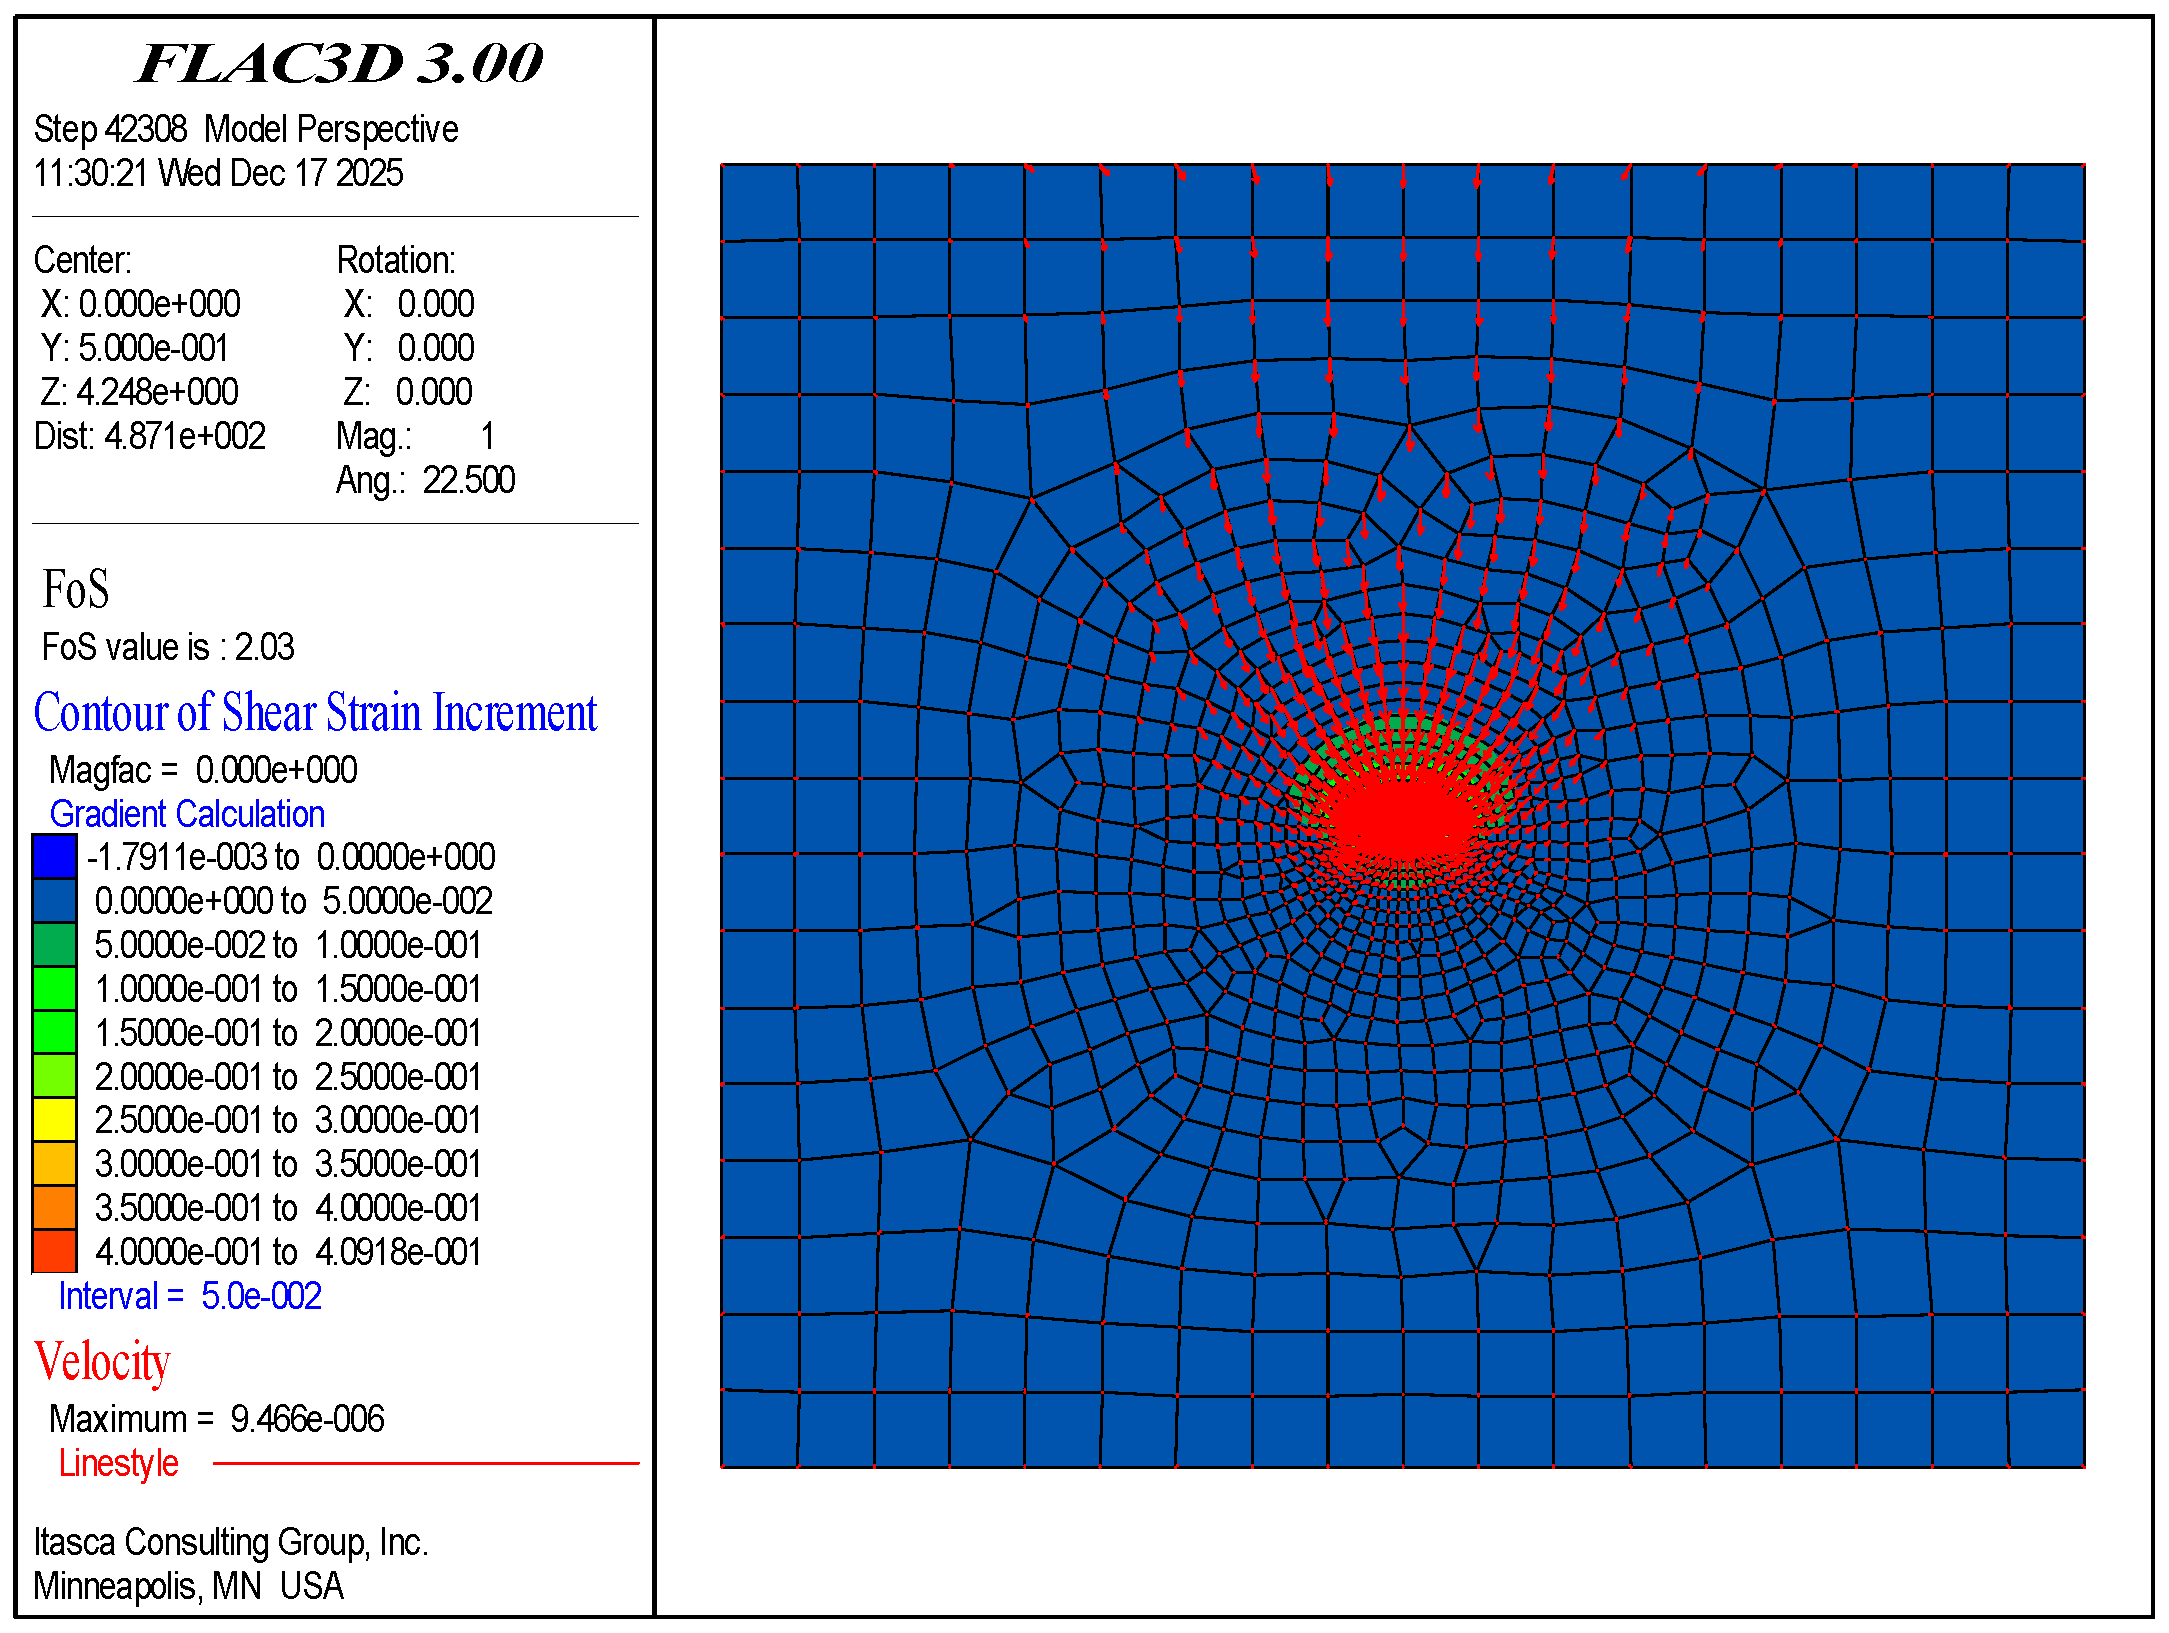
As shown in Figure 15, the FOS command yields a safety factor of 2.03 for the tunnel. When the model becomes unstable, significant node velocities are observed both surrounding and overlying regions of the tunnel. It aligns with the mechanism of overall collapse and is largely consistent with the patterns revealed by other criteria.
Figure 15.
Results of the FOS command including the shear strain increment of elements and the velocity of nodes for the constructed tunnel.
(4) Criterion IV
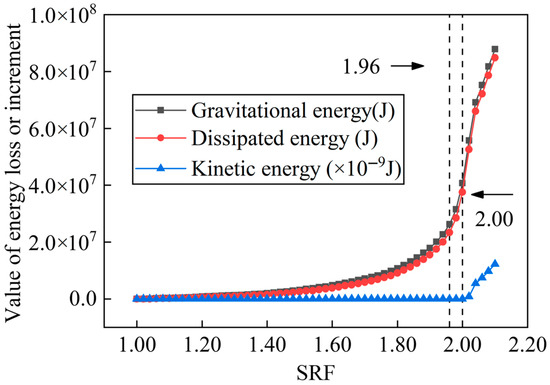
As illustrated in Figure 16, the mutation points in the gravitational and dissipated energy curves are not distinct, making them difficult to identify. In contrast, the mutation point in the kinetic energy curve is relatively pronounced and easier to recognize. This highlights a limitation of the energy catastrophe criterion: the identification of mutation points relies on manual interpretation, which may introduce human error, particularly when the curves are relatively smooth.
Figure 16.
Curves between the various energy values and the SRFs for the constructed tunnel.
(5) Variational criterion
As shown in Table 17, when the SRF ranges from 1.00 to 1.99, the variational values of the model remain positive. It indicates that the instability has not occurred. When the SRF reaches 2.00, the variational value of the model turns negative for the first time. It signals the onset of instability.
Table 17.
Variational values under different SRFs for the constructed tunnel.
(6) Comparisons
Results of different criteria are summarized in Table 18. As shown in Table 18, results of the three types of energy catastrophe criteria are close to those of the three commonly used failure criteria. There are maximum absolute and relative errors of 0.04 and 2.0%, respectively. This indicates that in engineering tunnels, a favorable correspondence exists between the three commonly used failure criteria and the three energy catastrophe criteria. It is consistent with observations in slopes. Furthermore, results of the variational criterion are close to those of the six typical failure criteria. There are the maximum absolute and relative errors of 0.04 and 2.0%, respectively. It demonstrates that the variational criterion exhibits good consistency with the six typical failure criteria in tunnels under construction.
Table 18.
Factors of safety under different criteria for the constructed tunnel.
3.3.2. Safety Factors Under All Conditions
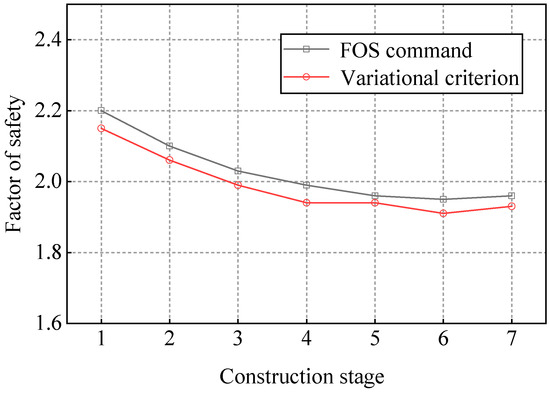
As is shown in Figure 17, the change curves of safety factors under different construction stages are plotted. (1) As construction progresses, the safety factor of the tunnel decreases. When the construction reaches its later stages, the safety factor remains essentially unchanged. This is likely because, during the initial excavation phase, the free surface area of the tunnel is small, and it results in a higher safety factor. During the intermediate excavation phase, the free surface area increases, and it leads to a lower safety factor. In the later excavation stages, a greater amount of primary support is applied. It effectively resists tunnel deformation and stabilizes the safety factor. (2) As the construction stages advance, there are maximum absolute and relative errors of 0.05 and 2.5% between results of the variational criterion and those of the FOS command. It indicates consistent agreement between the two. (3) Results of the variational criterion are generally lower than those of the FOS command. It suggests that the variational criterion is more sensitive to stability identification. Consequently, results of the variational criterion are more conservative and thus safer for engineering applications.
Figure 17.
Factors of safety of the tunnel under different construction stages.
In summary, the variational criterion is applicable for stability evaluation of engineering tunnels. The study reveals that, compared to indicators such as displacement and plastic zone, engineering tunnels exhibit greater sensitivity to changes in the variational value. This is further evidenced by the generally lower results of the variational criterion. Additionally, the variational value is not influenced by the complex geometric shapes or stress conditions of tunnels. It demonstrates broad application prospects.
3.4. Example 4: A Tunnel with Complex Loading Conditions
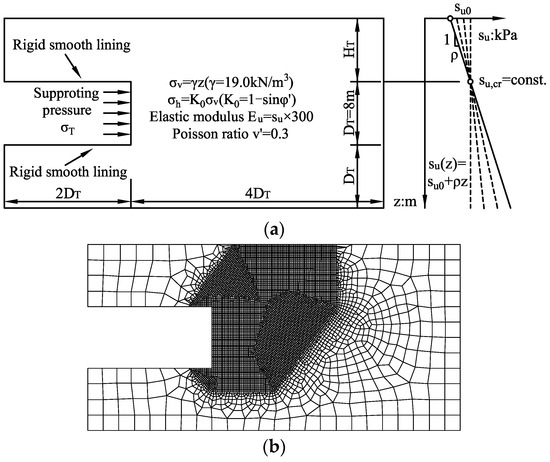
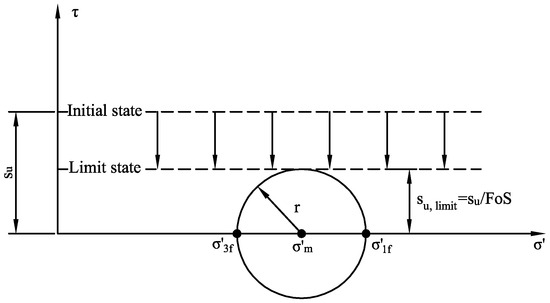
To further verify the applicability of the variational criterion, a tunnel example under complex loading conditions is selected. Tschuchnigg et al. [8] employed the SRM and limit analysis method to provide specific values for the undrained stability safety factor of a tunnel face under specific conditions. In their study, the SRM was implemented using total stress analysis based on the Plaxis 2D software-2011. The specific conditions refer to a tunnel burial depth equal to the tunnel diameter (), a tunnel face support pressure of 75 kPa (), and multiple combinations of effective cohesion and internal friction angle (different and ). Based on the above classical example, the verification is carried out. Noting that, in this example, the supporting pressure can be regarded as a prescribed stress boundary. Under the undrained condition, the saturated soil is treated as a special type of soil with non-zero cohesion and zero internal friction angle. Therefore, the derived variational value calculation formula and the proposed variational criterion remain applicable.
3.4.1. Establishment of the Numerical Model
The geometric dimensions of the tunnel are presented in Figure 18a. In addition to the mechanical parameters presented in Figure 18a, the remaining parameters are listed in Table 19 and Table 20. As shown in Figure 18b, a corresponding numerical model is established in the FLAC3D software based on the shown geometric dimensions. To achieve reliable computational accuracy and efficiency, a finer mesh with an element size of 0.2 m is adopted around the tunnel, while a coarser mesh with an element size of 2 m is used near the model boundaries. The application process of the SRM based on total stress analysis is illustrated in Figure 19.
Figure 18.
Sketch and numerical model of the complex loading tunnel. (a) Sketch of the tunnel, dashed lines represent the different values of ; (b) numerical model of the tunnel.
Table 19.
Undrained shear strength parameters ().
Table 20.
Effective shear strength parameters ().
Figure 19.
Mohr’s circle at failure (total stress analysis).
3.4.2. Verification of the Variational Criterion
Based on the above computational conditions, a FISH language code is developed to calculate the safety factor of the tunnel face using the variational criterion. The results are compared with those from the reference paper [8] to validate the applicability of the variational criterion. The relative results are summarized in Table 21. As shown in Table 21, results of the variational criterion in the FLAC3D are close to those of the convergence criterion in the PLAXIS and the limit analysis method. The average relative errors are 1.6% and 2.0%, respectively. It indicates that the variational criterion remains highly applicable and accurate for complex loading tunnels.
Table 21.
Results under different methods and relative errors among them.
4. Discussion
Based on the above analysis, it can be verified that Criterion IV is applicable. The energy value can be a new indicator for tunnel stability when the SRM is used. In tunnels, there are some drawbacks of Criteria I, II, and III which are similar to those in slopes [76,77,78]. Specifically, the validity of Criterion I is influenced by the location of monitoring points and the direction of monitoring displacements. Improper selection of these conditions will lead to incorrect results (Figure 3, Figure 8 and Figure 13). Criterion II requires an understanding of the failure mechanism of the tunnel. It carries certain uncertainties, as different types of tunnels have different failure mechanisms, leading to varied standards for defining plastic zone connectivity (Figure 4, Figure 9 and Figure 14). For Criterion III, there is currently no clear and unified standard for the computational program non-convergence. For instance, You et al. [37] used the finite difference program FLAC, while Tschuchnigg et al. [8] employed the finite element program PLAXIS. The convergence mechanisms of the two programs differ. In summary, there is a lack of unified stability indicators and identifying instability methods for the three criteria above. Criterion IV, to a certain extent, unifies the stability indicator—specifically, the various energies of the model. It also partially standardizes the identifying instability method by determining the mutation of the energy curves (Figure 6, Figure 11 and Figure 16). Furthermore, it is found that for engineering tunnels, Criterion IV and the proposed variational criterion demonstrate higher sensitivity in identifying instability compared with other criteria (Table 18 and Figure 17). However, Criterion IV also demonstrates some disadvantages. Some of the shortcomings have been pointed out by scholars [78]: (1) it requires integral calculations over all elements of the numerical model, resulting in high computational load and slow processing speed; (2) the identification of mutation of the energy curves relies on manual judgment, introducing subjective errors. Others are revealed in this paper: (i) the various energy values are calculated and analyzed separately (Equation (2); Figure 6, Figure 11 and Figure 16), and the complete stress–strain information of the model cannot be considered simultaneously; (ii) it is difficult to identify the mutation point when the curve is smooth (Figure 11 and Figure 16).
The proposed variational criterion inherits the advantages and addresses the disadvantages of Criterion IV. For inheriting the advantages, the variational criterion more effectively standardizes the stability indicator—specifically, the variational value. This criterion also better unifies the identifying instability method by examining the positive or negative of the variational value. For addressing the disadvantages, the variational value is calculated over a virtual time step. It requires minimal computational effort and delivers fast processing speed. By the variational criterion, it quantifies the qualitative identification of “mutation of the energy curve,” thereby reducing human errors. Furthermore, the variational value calculation formula incorporates all kinds of energies (Equations (3)–(8)). So, the variational value accounts for the complete stress–strain information of the model at the same time. Finally, in the variational criterion, there is no need to consider whether the energy curve is smooth or steep. Certainly, it is observed that results of the variational criterion are slightly influenced by the convergence criteria. This influence leads to approximately ±2% relative errors in the results. In this study, the convergence criteria generally adopt a limit time step number of 10,000 and a maximum unbalanced force ratio of 1.0 × 10⁻⁵. How to establish more reasonable convergence criteria to obtain more accurate results based on the variational criterion remains a further investigation.
Overall, displacement is the integral of strain, and Criterion I reflects the effect of strain in some elements of the model. Generally, plastic yielding is governed by the stress function, and Criterion II reflects the effect of stress in some elements of the model. The convergence criteria in general computational procedures are set based on stress or strain, and Criterion III reflects the effect of stress or strain in all elements of the model. Energy is the integral of the product of stress and strain, and Criterion IV (Criterion IV1, or Criterion IV2, or Criterion IV3) reflects the effect of partial stress–strain products in all elements of the model. None of these criteria can simultaneously account for the full stress–strain product effects across the entire model region. Consequently, it lacks a comprehensive indicator, and there is no unified standard for determining instability in tunnels. The variational criterion addresses these shortcomings.
In specific tunnels, the proposed variational criterion exhibits several relatively distinct characteristics. (1) Simplicity: It eliminates the setting for monitoring points, the analysis of plastic zone development, the determining of computational program non-convergence, and the calculating of energy values. (2) Comprehensiveness: The variational value accounts for the stress–strain conditions of all elements in the model simultaneously, overcoming the limitations of traditional criteria. (3) Clarity: It enables quantitative measurement of “instability”, reducing the subjectivity and ambiguity of other criteria. (4) Reliability: It is derived based on the principle of minimum potential energy, providing a solid mechanical basis. (5) Uniformity: It is independent of various conditions, applying the same computational method, procedure, and process to different geometric and mechanical conditions of tunnels. In summary, the variational criterion establishes a one-to-one correspondence between the tunnel stability and the sign of the variational value. This criterion provides a theoretical basis and mechanical explanation for tunnel failure. Therefore, the variational value can also be a new indicator for tunnel stability.
5. Conclusions
In this paper, the energy catastrophe (Criterion IV) of the strength reduction method (SRM) is introduced to tunnels. A new failure criterion of the SRM—the variational criterion—is proposed. By comparing with the monitoring point displacement mutation (Criterion I), the plastic zone penetration (Criterion II), and the numerical program non-convergence (Criterion III) through different tunnels, the applicability and generality of the Criterion IV and the variational criterion are validated. The main conclusions are as follows:
(1) Compared to indicators such as displacement and plastic zone, engineering tunnels exhibit greater sensitivity to changes in the energy or variational value. The energy or variational value can serve as a new indicator for tunnel stability. Results of the variational criterion are generally lower, making them more conservative and thus safer for engineering applications.
(2) The variational criterion is applicable to stability identification in unlined tunnels, lined tunnels, engineering tunnels, and complex loading tunnels. This applicability is not coincidental due to mesh densities, strength reduction factor intervals, geometric parameters, and mechanical parameters.
(3) In specific tunnels, the variational criterion exhibits the following relatively distinct characteristics. (a) Simplicity: It relies on only one indicator. (b) Comprehensiveness: It synthesizes the evolutionary trends of all elements. (c) Clarity: It enables quantitative measurement of “instability”. (d) Reliability: It is derived based on the principle of minimum potential energy. (e) Uniformity: It is independent of various geometric and mechanical conditions of tunnels.
Author Contributions
Conceptualization, L.Y.; methodology, C.H.; software, C.H.; validation, C.H.; formal analysis, C.H.; investigation, C.H.; resources, C.H.; data curation, C.H.; writing—original draft preparation, C.H.; writing—review and editing, C.H.; visualization, C.H.; supervision, C.S.; project administration, C.H.; funding acquisition, C.H. All authors have read and agreed to the published version of the manuscript.
Funding
This research was funded by the National Natural Science Foundation of China (41807228) and the Science Research Project of Hebei Education Department (ZC2025097).
Institutional Review Board Statement
Not applicable.
Informed Consent Statement
Not applicable.
Data Availability Statement
The data presented in this study are available on request from the corresponding author.
Acknowledgments
We want to express our thanks to the authors whose publications we cited and the efficient editor.
Conflicts of Interest
The authors declare that they have no conflicts of interest regarding the publication of this paper.
Correction Statement
This article has been republished with a minor correction to the Funding statement. This change does not affect the scientific content of the article.
References
- Zienkiewicz, O.C.; Humpheson, C.; Lewis, R.W. Associated and non-associated visco-plasticity and plasticity in soil mechanics. Geotechnique 1975, 25, 671–689. [Google Scholar] [CrossRef] [Scilit]
- Steiakakis, E.; Xiroudakis, G.; Lazos, I.; Vavadakis, D.; Bazdanis, G. Stability analysis of a multi-layered slope in an open pit mine. Geosciences 2023, 13, 359. [Google Scholar] [CrossRef] [Scilit]
- Assefa, E.; Tilahun, K.; Assefa, S.M.; Jilo, N.Z.; Pantelidis, L.; Sachpazis, C. Stability evaluation of tunnels in steeply dipping layered rock mass using numerical models: A case study. Sci. Rep. 2025, 15, 2046. [Google Scholar] [CrossRef] [Scilit] [PubMed]
- Zhang, C.Q.; Ye, J.P.; Liu, N.; Xie, Q.M.; Hu, M.M.; Li, L.Y. True triaxial modeling test of high-sidewall underground caverns subjected to dynamic disturbances. J. Rock Mech. Geotech. 2025, 17, 2109–2132. [Google Scholar] [CrossRef] [Scilit]
- Li, B.; Li, H. Prediction of tunnel face stability using a naive bayes classifier. Appl. Sci. 2019, 9, 4139. [Google Scholar] [CrossRef] [Scilit]
- Mi, M.; Tao, Z.; Pang, S.H.; Liu, K.Y.; Qin, K. Numerical Simulation Study on Deformation Mechanism of Tunnel–Landslide Orthogonal Systems and Early Warnings of Imminent Sliding. Appl. Sci. 2024, 14, 2790. [Google Scholar] [CrossRef] [Scilit]
- Wang, J.X.; Long, Y.X.; Cao, A.S.; Cui, T.; Lin, L.Y.; Gao, Y.B.; Liu, X.Z.; Li, H.B.Q. Middle Rock Pillar Stability Criteria for a Bifurcated Small Clear-Distance Tunnel. Appl. Sci. 2025, 15, 5634. [Google Scholar] [CrossRef] [Scilit]
- Tschuchnigg, F.; Schweiger, H.F.; Sloan, S.W.; Raissakis, I. Comparison of finite-element limit analysis and strength reduction techniques. Geotechnique 2015, 65, 249–257. [Google Scholar] [CrossRef] [Scilit]
- Liang, Z.Z.; Gong, B.; Li, W.R. Instability analysis of a deep tunnel under triaxial loads using a three-dimensional numerical method with strength reduction method. Tunn. Undergr. Space Technol. 2019, 86, 51–62. [Google Scholar] [CrossRef] [Scilit]
- Shiau, J.; Al-Asadi, F. Revisiting circular tunnel stability using Broms and Bennermarks’ original stability number. Int. J. Geomech. 2021, 21, 06021009. [Google Scholar] [CrossRef] [Scilit]
- Zhang, J.; Kuang, M.X.; Zhang, Y.H.; Feng, T.G. Evaluation and analysis of the causes of a landslide and treatment measures during the excavation of a tunnel through a soil-rock interface. Eng. Fail. Anal. 2021, 130, 105784. [Google Scholar] [CrossRef] [Scilit]
- Li, Q.F.; Li, R.Z.; He, W.G.; Gao, X.; Yao, X.P.; Yuan, Y.; Zhang, J.L. Characteristics of dynamic safety factors during the construction process for a tunnel-group metro station. Appl. Sci. 2022, 12, 4900. [Google Scholar] [CrossRef] [Scilit]
- Zhou, P.; Jiang, Y.F.; Zhou, F.C.; Gong, L.; Qiu, W.G.; Yu, J.W. Stability evaluation method and support structure optimization of weak and fractured slate tunnel. Rock Mech. Rock Eng. 2022, 55, 6425–6444. [Google Scholar] [CrossRef] [Scilit]
- Huang, H.W.; Yang, T.J.; Chen, J.Y.; Huang, Z.K.; Wu, C.; Man, J.H. Enhanced safety assessment on tunnel excavation via refined rock mass parameter identification. Undergr. Space 2025, 24, 142–161. [Google Scholar] [CrossRef] [Scilit]
- Pan, Q.J.; Dias, D. Upper-bound analysis on the face stability of a non-circular tunnel. Tunn. Undergr. Space Technol. 2017, 62, 96–102. [Google Scholar] [CrossRef] [Scilit]
- Li, Z.W.; Yang, X.L.; Li, T.Z. Face stability analysis of tunnels under steady unsaturated seepage conditions. Tunn. Undergr. Space Technol. 2019, 93, 103095. [Google Scholar] [CrossRef] [Scilit]
- Hou, C.T.; Yang, X.L. Three-dimensional face stability of tunnels in unsaturated soils with nonlinear soil strength. Int. J. Geomech. 2021, 21, 06021006. [Google Scholar] [CrossRef] [Scilit]
- Hou, C.T.; Pan, Q.J.; Xu, T.; Huang, F.; Yang, X.L. Three-dimensional tunnel face stability considering slurry pressure transfer mechanisms. Tunn. Undergr. Space Technol. 2022, 125, 104524. [Google Scholar] [CrossRef] [Scilit]
- Hou, C.T.; Zhong, J.H.; Yang, X.L. Three-dimensional stability assessments of a non-circular tunnel face reinforced by bolts under seepage flow conditions. Tunn. Undergr. Space Technol. 2023, 131, 104831. [Google Scholar] [CrossRef] [Scilit]
- Yang, Y.S.; Liao, H.; Zhu, J.Q. Stability Analysis of Three-Dimensional Tunnel Face Considering Linear and Nonlinear Strength in Unsaturated Soil. Appl. Sci. 2024, 14, 2080. [Google Scholar] [CrossRef] [Scilit]
- Kong, C.; Gao, X.Q.; Ren, S.B.; Gu, S.; Gu, Y. Physical model test of tunnel complex surrounding rock progressive failure based on strength-reduction similar materials. Eng. Fail. Anal. 2023, 149, 107255. [Google Scholar] [CrossRef] [Scilit]
- Liu, W.W.; Yin, X.; Feng, Q.; Ren, D.Z.; Zhang, Q.; Wang, H.B.; Zhu, T.T. A safety assessment method for tunnel jointed surrounding rock based on persistent homology theory. Bull. Eng. Geol. Environ. 2025, 84, 346. [Google Scholar] [CrossRef] [Scilit]
- Griffiths, D.V.; Lane, P.A. Slope stability analysis by finite elements. Geotechnique 1999, 49, 387–403. [Google Scholar] [CrossRef] [Scilit]
- Matsui, T.; San, K.C. Finite element slope stability analysis by shear strength reduction technique. Soils Found. 1992, 32, 59–70. [Google Scholar] [CrossRef] [Scilit]
- Kanungo, D.P.; Pain, A.; Sharma, S. Finite element modeling approach to assess the stability of debris and rock slopes: A case study from the Indian Himalayas. Nat. Hazards 2013, 69, 1–24. [Google Scholar] [CrossRef] [Scilit]
- Ugai, K. A method of calculation of total safety factor of slope by elasto-plastic FEM. Soils Found. 1989, 29, 190–195. [Google Scholar] [CrossRef] [Scilit]
- Dawson, E.M.; Roth, W.H.; Drescher, A. Slope stability analysis by strength reduction. Geotechnique 1999, 49, 835–840. [Google Scholar] [CrossRef] [Scilit]
- Tu, Y.L.; Liu, X.R.; Zhong, Z.L.; Li, Y.Y. New criteria for defining slope failure using the strength reduction method. Eng. Geol. 2016, 212, 63–71. [Google Scholar] [CrossRef] [Scilit]
- Huang, L.C.; Huang, S.; Lai, Z.S. On an energy-based criterion for defining slope failure considering spatially varying soil properties. Eng. Geol. 2020, 264, 105323. [Google Scholar] [CrossRef] [Scilit]
- Zhou, Y.; Lv, W.J.; Zhou, Z.H.; Tang, Q.Q.; Han, G.S.; Hao, J.S.; Chen, W.Q.; Wu, F.Q. New failure criterion for rock slopes with intermittent joints based on energy mutation. Nat. Hazards 2023, 118, 407–425. [Google Scholar] [CrossRef] [Scilit]
- Zhou, Z.H.; Zhou, Y.; Chen, Z.H. New energy criterion for rock slope excavation-induced failure based on catastrophe theory: Methodology and applications. Bull. Eng. Geol. Environ. 2024, 83, 140. [Google Scholar] [CrossRef] [Scilit]
- Cao, V.H.; Go, G.H. Stability analysis of random soil–rock mixture slope using an energy-based failure criterion and Monte Carlo simulation. Eng. Fail. Anal. 2025, 171, 109346. [Google Scholar] [CrossRef] [Scilit]
- Xia, C.C.; Xu, C.B.; Zhao, X. Study of the strength reduction DDA method and its application to mountain tunnel. Int. J. Comp. Methods Sing. 2012, 9, 1250041. [Google Scholar] [CrossRef] [Scilit]
- Sun, J.L.; Wang, F.; Wang, X.L.; Wu, X. A quantitative evaluation method based on back analysis and the double-strength reduction optimization method for tunnel stability. Adv. Civ. Eng. 2021, 2021, 8899685. [Google Scholar] [CrossRef] [Scilit]
- Kong, C.; An, B.X.; Zhang, J.R.; Feng, J.M.; Huang, G. Failure mechanisms and stability of honeycomb-shaped tunnel group based on strength reduction: A case study of Hongyancun tunnel. KSCE J. Civ. Eng. 2025, 100488. [Google Scholar] [CrossRef] [Scilit]
- Xia, C.C.; Zhao, X.; Zhang, G.Z.; Wang, C.B. Stability Analysis by Strength Reduction Method in Shallow Buried Tunnels. In Proceedings of the Tunneling and Underground Construction, Shanghai, China, 26–28 May 2014; pp. 321–331. [Google Scholar] [CrossRef] [Scilit]
- You, K.; Park, Y.; Lee, J.S. Risk analysis for determination of a tunnel support pattern. Tunn. Undergr. Space Technol. 2005, 20, 479–486. [Google Scholar] [CrossRef] [Scilit]
- Naung, N.; Sasaoka, T.; Shimada, H.; Hamanaka, A.; Wahyudi, S.; Pisith, M. Stability assessment of open stope under overlaying mined-out regions at Modi Taung Gold Mine, Myanmar. Int. J. Geosci. 2018, 9, 547–571. [Google Scholar] [CrossRef]
- Shnorhokian, S.; Mitri, H.S.; Moreau-verlaan, L. Stability assessment of stope sequence scenarios in a diminishing ore pillar. Int. J. Rock Mech. Min. Sci. 2015, 74, 103–118. [Google Scholar] [CrossRef] [Scilit]
- Abdellah, W.R.; Ali, M.A.; Yang, H.S. Studying the effect of some parameters on the stability of shallow tunnels. J. Sustain. Min. 2018, 17, 20–33. [Google Scholar] [CrossRef] [Scilit]
- Heidarzadeh, S.; Saeidi, A.; Rouleau, A. Use of probabilistic numerical modeling to evaluate the effect of geomechanical parameter variability on the probability of open-stope failure: A case study of the Niobec Mine, Quebec (Canada). Rock Mech. Rock Eng. 2019, 53, 1411–1431. [Google Scholar] [CrossRef] [Scilit]
- Saeidi, A.; Heidarzadeh, S.; Lalancette, S.; Rouleau, A. The effects of in situ stress uncertainties on the assessment of open stope stability: Case study at the Niobec Mine, Quebec (Canada). Geomech. Energy Environ. 2021, 25, 100194. [Google Scholar] [CrossRef] [Scilit]
- Purwanto, S.H.; Sasaoka, T.; Wattimena, R.K.; Matsui, K. Influence of stope design on stability of hanging wall decline in cibaliung underground gold mine. Int. J. Geosci. 2013, 4, 1–8. [Google Scholar] [CrossRef]
- Abdellah, W. Numerical modelling stability analyses of haulage drift in deep underground mines. J. Eng. Sci. 2015, 43, 71–81. [Google Scholar] [CrossRef] [Scilit]
- Oniyide, G.O.; Idris, M.A. Numerical modelling of the effect of temperature variation on stope stability in Bushveld Igneous Complex. Min. Miner. Depos. 2019, 13, 121–131. [Google Scholar] [CrossRef] [Scilit]
- Louchnikov, V. Simple Calibration of the Extension Strain Criterion for Its use in Numerical Modelling. In Strategic vs. Tactical Approaches in Mining; Potvin, Y., Ed.; Australian Centre for Geomechanics: Perth, WA, Australia, 2011; pp. 85–96. [Google Scholar] [CrossRef] [Scilit]
- Idris, M.A.; Saiang, D.; Nordlund, E. Stochastic assessment of pillar stability at Laisvall mine using Artificial Neural Network. Tunn. Undergr. Space Technol. 2015, 49, 307–319. [Google Scholar] [CrossRef] [Scilit]
- Ajalloeian, R.; Moghaddam, B.; Azimian, A. Prediction of rock mass squeezing of T4 tunnel in Iran. Geotech. Geol. Eng. 2017, 35, 747–763. [Google Scholar] [CrossRef] [Scilit]
- Kaiser, P.K. Ground Support for Constructability of Deep Underground Excavations—Challenge of Managing Highly Stressed Brittle Rock in Civil and Mining Projects. ITA Sir Muir Wood lecture of Intern; Tunneling Association at World Tunneling Congress: San Francisco, CA, USA, 2016; 33p, ISBN 978-2-9701013-8-3. [Google Scholar]
- Chang, Y. Applications of Strain Based Damage Criterion in Geotechnical Engineering. In Proceedings of the 12th ISRM International Congress on Rock Mechanics. Harmonising Rock Engineering and the Environment, Beijing, China, 18–21 October 2011; Qian, Q., Zhou, Y., Eds.; Taylor & Francis Group: Beijing, China, 2011. [Google Scholar] [CrossRef] [Scilit]
- Fujii, Y.; Kiyama, T.; Ishijima, Y. Condition insensitive damage indicator for brittle rock. Int. J. Rock Mech. Min. Sci. 1997, 34, 86. [Google Scholar] [CrossRef]
- Kwasniewski, M.; Takahashi, M. Strain-Based Failure Criteria for Rocks: State of the Art and Recent Advances. In Rock Mechanics in Civil and Environmental Engineering; Zhao, J., Labiouse, V., Dudt, J.P., Mathier, J.F., Eds.; Taylor & Francis Group: London, UK, 2010; pp. 45–56. [Google Scholar] [CrossRef] [Scilit]
- Le Roux, P.J.; Brentley, K.R. Simulation of Fracture Propagation Depth and Failure in Long Hole Open Stoping. In Geomechanics and Geodynamics of Rock Masses; Taylor & Francis Group: London, UK, 2018; ISBN 978-1-138-61645-5. [Google Scholar]
- Mohanto, S.; Deb, D. Prediction of plastic damage index for assessing rib pillar stability in underground metal mine using multi-variate regression and artificial neural network techniques. Geotech. Geol. Eng. 2019, 38, 767–790. [Google Scholar] [CrossRef] [Scilit]
- Huang, G.; Gong, L.; Sun, X.F.; Liang, Z.N.; Wang, X.Y. Numerical investigation on flexural performance of retrofitted tunnel lining with short bolts and steel-plate. Tunn. Undergr. Space Technol. 2020, 95, 103152. [Google Scholar] [CrossRef] [Scilit]
- Vlachopoulos, N.; Diederichs, M.S. Improved longitudinal displacement profiles for convergence confinement analysis of deep tunnels. Rock Mech. Rock Eng. 2009, 42, 131–146. [Google Scholar] [CrossRef] [Scilit]
- Tian, H.M.; Chen, W.Z.; Ma, C.S.; Yang, D.S.; Tan, X.J. Energy release analysis of a severe rockburst in a headrace tunnel crossing a tectonic stress zone. Shock Vib. 2019, 2019, 8959845. [Google Scholar] [CrossRef] [Scilit]
- Xie, L.T.; Yan, P.; Lu, W.B.; Chen, M.; Wang, G.H. Effects of strain energy adjustment: A case study of rock failure modes during deep tunnel excavation with different methods. KSCE J. Civ. Eng. 2018, 22, 4143–4154. [Google Scholar] [CrossRef] [Scilit]
- Tao, M.; Zhao, R.; Zhao, H.T.; Wang, Y.Q.; Cao, W.Z.; Wao, S.F. Failure characteristics and energy distributions of surrounding rock in hard rock tunnels subjected to different three-dimensional stress conditions. Trans. Nonferrous Met. Soc. China 2023, 33, 3487–3502. [Google Scholar] [CrossRef] [Scilit]
- Xie, H.P.; Li, L.Y.; Peng, R.D.; Ju, Y. Energy analysis and criteria for structural failure of rocks. J. Rock Mech. Geotech. 2009, 1, 11–20. [Google Scholar] [CrossRef] [Scilit]
- Xie, H.P.; Li, L.Y.; Ju, Y.; Peng, R.D.; Yang, Y.M. Energy analysis for damage and catastrophic failure of rocks. Sci. China Technol. Sci. 2011, 54, 199–209. [Google Scholar] [CrossRef] [Scilit]
- Sun, C.; Xu, Z.Y.; Zhang, J.J.; Pu, Y.B.; Tao, Q.; Zhou, Y.; Guan, X.B.; Liu, T.H. Study on the deformation energy evolution characteristics and instability prediction model of weak surrounding rock in tunnels. Appl. Sci. 2025, 15, 10478. [Google Scholar] [CrossRef] [Scilit]
- Xin, X.K.; Meng, Q.B.; Wu, J.Y.; Wu, Z.W.; Chen, L.; Song, Z.M. The evolutionary distribution law of rock energy and the study of energy balance mechanism in tunnel-surrounding rock. Int. J. Geomech. 2025, 25, 04025254. [Google Scholar] [CrossRef] [Scilit]
- Khademian, Z.; Ozbay, U. Modeling violent rock failures in tunneling and shaft boring based on energy balance calculations. Tunn. Undergr. Space Technol. 2019, 90, 62–75. [Google Scholar] [CrossRef] [Scilit]
- Xin, J.; Jiang, Q.; Li, S.J.; Chen, P.F.; Zhao, H.R. Fracturing and energy evolution of rock around prefabricated rectangular and circular tunnels under shearing load: A comparative analysis. Rock Mech. Rock. Eng. 2023, 56, 9057–9084. [Google Scholar] [CrossRef] [Scilit]
- Wang, G.; Fang, Q.; Du, J.M.; Yang, X.X.; Wang, J. Estimating volume loss for shield-driven tunnels based on the principle of minimum total potential energy. Appl. Sci. 2022, 12, 1794. [Google Scholar] [CrossRef] [Scilit]
- Fang, Q.; Wang, G.; Du, J.M.; Liu, Y.; Zhou, M.Z. Prediction of tunnelling induced ground movement in clay using principle of minimum total potential energy. Tunn. Undergr. Space Technol. 2023, 131, 104854. [Google Scholar] [CrossRef] [Scilit]
- Wang, G.; Fang, Q.; Wang, J.; Li, Q.M.; Zhou, M.Z. Ground movement prediction for twin tunnels with minimum total potential energy principle considering volumetric change of soil. Transp. Geotech. 2024, 49, 101452. [Google Scholar] [CrossRef] [Scilit]
- Di, H.G.; Huang, S.H.; Fu, L.L.; Wang, B.L. A variational method for calculating the longitudinal deformation of a shield tunnel in soft soil caused by grouting under tunnel. Eng. Comput. 2021, 36, 2733–2754. [Google Scholar] [CrossRef] [Scilit]
- Huang, S.F.; Chen, Z.B.; Xie, Y.M.; Lin, Z.Y. A variational approach to the analysis of excavation-induced vertical deformation in a segmental tunnel. Tunn. Undergr. Space Technol. 2022, 122, 104342. [Google Scholar] [CrossRef] [Scilit]
- Heidarzadeh, S.; Saeidi, A.; Rouleau, A. The damage-failure criteria for numerical stability analysis of underground excavations: A review. Tunn. Undergr. Space Technol. 2021, 107, 103633. [Google Scholar] [CrossRef] [Scilit]
- Zheng, Y.R.; Qiu, C.Y.; Zhang, H.; Wang, Q.Y. Exploration of stability analysis methods for surrounding rocks of soil tunnel. Chin. J. Rock Mech. Eng. 2008, 27, 1968–1980. (In Chinese) [Google Scholar]
- Abi, E.; Zheng, Y.R.; Feng, X.T.; Xia, Y.Z. Study of the safety factor for tunnel stability considering the stress release effect. Mod. Tunn. Technol. 2016, 53, 70–76. (In Chinese) [Google Scholar]
- Tang, X.S.; Zheng, Y.R.; Wang, Y.F. Application of FEM strength reduction method in stability analysis and control of tunnel construction. Mod. Tunn. Technol. 2020, 57, 45–55. (In Chinese) [Google Scholar]
- Xiao, Q.; Zheng, Y.R.; Chen, Q.; Feng, X.T. Study on lined tunnel design methods. Chin. J. Undergr. Space Eng. 2012, 8, 259–267. (In Chinese) [Google Scholar]
- Fang, H.W.; Chen, Y.F.; Xu, Y.X. New instability criterion for stability analysis of homogeneous slopes. Int. J. Geomech. 2020, 20, 04020034. [Google Scholar] [CrossRef] [Scilit]
- Fang, H.W.; Chen, Y.F.; Xu, G.W.; Hou, Z.K.; Wu, J.X. New instability criterion for stability analysis of homogeneous slopes with double strength reduction. Int. J. Geomech. 2020, 20, 04020162. [Google Scholar] [CrossRef] [Scilit]
- Sun, W.J.; Wang, G.X.; Zhang, L.L. Slope stability analysis by strength reduction method based on average residual displacement increment criterion. Bull. Eng. Geol. Environ. 2021, 80, 4367–4378. [Google Scholar] [CrossRef] [Scilit]

Disclaimer/Publisher’s Note: The statements, opinions and data contained in all publications are solely those of the individual author(s) and contributor(s) and not of MDPI and/or the editor(s). MDPI and/or the editor(s) disclaim responsibility for any injury to people or property resulting from any ideas, methods, instructions or products referred to in the content. |
© 2026 by the authors. Licensee MDPI, Basel, Switzerland. This article is an open access article distributed under the terms and conditions of the Creative Commons Attribution (CC BY) license.