Abstract
Thyroid nodule evaluation relies heavily on ultrasound imaging, yet it suffers from significant inter-operator variability. To address this, we present a preliminary validation of the Synergy-Net platform, an AI-driven Computer-Aided Diagnosis (CAD) system designed to standardize acquisition and improve diagnostic accuracy. The system integrates a U-Net architecture for anatomical segmentation and a ResNet-50 classifier for lesion characterization within a Human-in-the-Loop (HITL) workflow. The study enrolled 110 patients (71 benign, 39 malignant) undergoing surgery. Performance was evaluated against histopathological ground truth. The system achieved an Accuracy of 90.35% (95% CI: 88.2–92.5%), Sensitivity of 90.64% (95% CI: 87.9–93.4%), and an AUC of 0.90. Furthermore, the framework introduces a multimodal approach, performing late fusion of imaging features with genomic profiles (TruSight One panel). While current results validate the 2D diagnostic pipeline, the discussion outlines the transition to the ANTHEM framework, incorporating future 3D volumetric analysis and digital pathology integration. These findings suggest that AI-assisted standardization can significantly enhance diagnostic precision, though multi-center validation remains necessary.
1. Introduction
This research is part of the Anthem project (AdvaNced Technologies for Human centrEd Medicine). Its goal is to develop a technological platform to enhance cancer prevention, focusing specifically on thyroid cancer. Thyroid cancer is a common condition, affecting 2.6 men and 3.8 women per 100,000 individuals annually. It is the most frequent endocrine tumor, ranks eleventh among all cancers, and accounts for 1–2% of all malignancies. Its incidence increases with age, peaking between ages 40 and 50, and is rare before the age of 16. Despite its frequency, annual mortality is low (0.5/100,000) [1]. Thyroid carcinomas are more common in solitary nodules (20–24%) than in multinodular goiter (about 10%). Non-palpable lesions carry a similar malignancy risk as palpable ones of the same size. Most cases are asymptomatic and are detected during unrelated imaging exams or screenings, revealing thyroid nodules in over 50% of cases that are clinically silent [2]. Diagnostic imaging is thus essential in differentiating malignant from benign nodules. Papillary carcinoma (60–80%) is the most common histological type, followed by follicular carcinoma and then other forms. While differentiated tumors usually have a favorable prognosis, undifferentiated forms have significantly higher mortality [1,3]. The ability to perform an early diagnosis, establish an appropriate diagnostic protocol, and offer patients with thyroid cancer the most suitable treatment has been a major focus of international research for several years. This is particularly critical given that, since 1975, the incidence of thyroid cancer has tripled, accompanied by a substantial rise in healthcare costs [4,5]. In 2020 alone, thyroid cancer was the third most-common cancer among women in the United States, generating an estimated healthcare burden of approximately 20 billion USD [4,5]. In light of these considerations, the most recent international guidelines—issued in 2015 and 2016 by the American Thyroid Association (ATA), followed by the European Society of Endocrinology and the Italian Endocrinology Societies—have revised surgical recommendations for thyroid cancer, favoring partial thyroid resections (lobectomies) over total thyroidectomy when appropriate [6,7,8,9,10,11].
The continuous refinement of diagnostic techniques, the advent of molecular genetics, and the growing role of artificial intelligence are progressively reshaping both surgical indications and risk stratification. Artificial intelligence, in particular, has shown promise in supporting diagnosis and tailoring treatment strategies [5,12,13,14].
Our system belongs to the class of Computer-Aided Diagnosis (CAD) tools—computerized systems designed to support medical diagnosis. The data analyzed consist primarily of medical images and videos, along with structured tabular data. The strength of this project lies in collecting the most comprehensive set of biological, clinical, and diagnostic information about the tumor pathology. The aim is to move beyond a purely diagnostic interpretation of patient data and instead integrate it with a wide range of complementary information to train artificial intelligence systems effectively. The imaging examination is therefore processed within an automated analysis system—an AI model—that evaluates the image based on additional context that only a physician’s experience would traditionally provide. For instance, a simple ultrasound image of a given thyroid nodule may not be inherently diagnostic or could be difficult to interpret. The AI system could enrich that image, for example, by incorporating vascularization data of the lesion [12,13]. The system itself employs algorithms based on machine learning techniques, allowing it to infer that a certain chromatic density observed in the imaging may correspond to a specific diagnostic outcome. The primary endpoint of the project is to identify the genomic, biomolecular, clinical, and anamnestic indicators necessary to define which patients should be enrolled in a targeted population-based screening program. The secondary endpoint is to design a CAD system capable of effectively identifying one or more neoplastic lesions and providing accurate diagnostic support to the physician. The entire system relies on a clinical data management platform powered by predictive deep learning and machine learning models. The ultimate goal is to make this tool widely available and accessible across healthcare institutions, enabling automatic lesion recognition enriched with additional patient-specific data—from clinical history to genetic profiles—thus allowing the system to interpret a simple image with an “expert eye” thanks to its data integration capabilities.
This paper presents the validation of the Synergy-Net module and introduces the conceptual ANTHEM framework. Specifically, the novel contributions of this study are threefold:
- -
- Standardization of ultrasound acquisition through an AI-guided protocol that minimizes operator-dependent variability;
- -
- Implementation of a Human-in-the-Loop (HITL) workflow, where deep learning predictions (U-Net/ResNet) are iteratively refined by expert feedback to ensure clinical safety;
- -
- Design of a scalable multimodal architecture that establishes a pipeline for fusing imaging data with high-dimensional genomic features and digital pathology, paving the way for the next generation of personalized oncological diagnostics.
2. Background
2.1. Existing AI-Based Models for Thyroid Nodule Classification and Their Limitations
Several computer-aided diagnosis (CAD) systems based on artificial intelligence, machine learning, and deep learning have been developed to support clinicians in thyroid nodule evaluation, enhancing lesion recognition and providing additional diagnostic insights [12]. These systems demonstrate overall sensitivity and specificity of approximately 88% and 81%, respectively, for distinguishing benign from malignant nodules [6,12]. For example, the S-Detect system (Samsung Medison Co., Ltd.) has shown diagnostic performance comparable to experienced radiologists and superior to less-experienced physicians, particularly improving the sensitivity of junior operators [6,12]. Similarly, the AIBx software (version 1) retrieves similar lesions from a predefined dataset to aid classification and has demonstrated prognostic accuracy exceeding that of standard EU-TIRADS criteria [12].
Despite these encouraging results, several limitations remain. Ethical and legal concerns arise from algorithm-based decision-making, particularly in deep learning systems where interpretability is limited, raising questions about patient consent, transparency, and accountability for diagnostic errors [6]. Technical variability among ultrasound probes and machines can impact image quality and reduce AI performance, necessitating calibration or standardization measures [6]. Additionally, many studies have relied on surgical patient populations, which may overrepresent malignant nodules and limit the generalizability of AI algorithms to broader clinical cohorts [6].
To address these challenges, our experimental approach integrates multimodal data, standardized imaging protocols, and rigorous validation across diverse populations, aiming to overcome the current CAD systems’ limitations and improve personalized risk stratification and diagnostic accuracy.
2.2. Our Experimental Approach to Overcoming Current AI Limitations
The work carried out primarily involved the collection of a significant amount of patient data, with the goal of using this information to “train” the system. Before initiating the screening phase, the system was prepared and trained to recognize specific oncological images. While such recognition may seem intuitive for an experienced clinician, it is certainly not the case for a machine that is still “inexperienced.” In the future, this system could enable the identification of lesions that would otherwise remain undiagnosed through conventional methods, improve the diagnostic accuracy of certain techniques, help select which patients should undergo specific tests, and offer support to less experienced physicians. Altogether, this could lead to increasingly precise and earlier diagnoses. The fundamental requirement, however, is the continuous training of the system with ever-expanding data. The ultimate goal is to reach a stage where chemotherapy or surgical treatment is tailored precisely to the individual neoplastic lesion of each specific patient. In summary, the Synergy-Net Information System (IS) aims to function as an AI-based CAD platform designed to support physicians in managing various oncological pathologies—leveraging the full benefits offered by integrated analysis. With respect to thyroid cancer, the primary endpoint of the project was to identify the genetic, biomolecular, clinical, and anamnestic factors that define patients eligible for population-level screening. The secondary endpoint was to design an effective CAD system for the ultrasound-based diagnosis of thyroid nodular lesions.
Until now, the greatest challenge has been the ability to make a prognostic assessment during the initial study or observation phase—determining which patients should be referred for surgery, which for observation, and, when surgery is indicated, defining its type and extent. Currently, the prognosis for patients with thyroid carcinoma can only be reliably established after surgical intervention. The present and future challenge is therefore to define the risk level already during the diagnostic phase.
This would make it possible to direct high-risk patients toward surgery and personalize the extent of the surgical procedure, while referring low-risk patients to careful and active surveillance. (Figure 1).
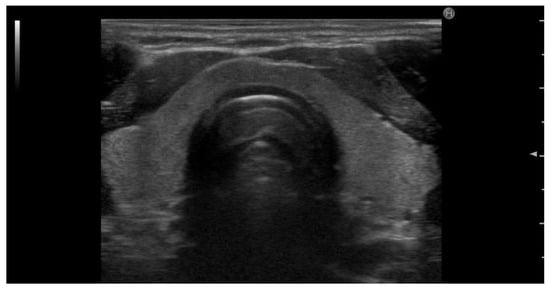
Figure 1.
Transverse ultrasound image of the neck showing the anatomical structures of the thyroid region. The image highlights the right and left lobes of the thyroid gland, the isthmus (Is), and central trachea. Also labeled are the sternocleidomastoid muscle (SCM), carotid artery (C), and jugular vein (JV), serving as key anatomical landmarks for orientation during thyroid ultrasound examination.
3. Materials and Methods
3.1. CAD System Classification
The Synergy-Net system falls within the scope of Computer-Aided Diagnosis (CAD) systems—computerized tools that support medical diagnosis. In general, CAD systems can work on images, tabular data (e.g., clinical, anamnestic), or a combination of both. In the case of the Synergy-Net project, the data analyzed consist mainly of images/videos and tabular data. Among these, biomedical images require a preliminary phase for their representation in terms of features that can be assimilated by an expert system.
3.2. Imaging Types and Pre-Processing
Medical imaging used for diagnostic purposes can be classified as either planar or tomographic. Planar images represent the body on a two-dimensional surface. Examples include radiographs, mammography, ultrasound, and scintigraphy. These images are composed of pixels. Tomographic images, on the other hand, consist of body sections (slices) and allow for three-dimensional reconstruction of anatomical structures. Examples include PET, SPECT, CT, and MRI. These images are composed of voxels. Tomographic imaging provides more comprehensive information than planar imaging, supporting both morphological and functional evaluation. However, the volume of data produced makes tomographic image analysis complex and resource-intensive. Even experienced radiologists may miss or fail to explore specific lesions. This is why CAD systems are essential in assisting radiologists with patient data analysis. A CAD system processes data using advanced mathematical computations and well-defined algorithms.
3.3. CAD Architecture and Processing Modules
The CAD system is composed of independent functional modules:
- Digitization Module: Acquires and stores biomedical images;
- Image Pre-processing Module: Performs operations to enhance image quality and reduce acquisition noise, often due to patient movement;
- Organ Segmentation Module: Divides the image into regions of interest and isolates the target organ;
- Lesion Detection/Segmentation Module: Identifies lesions within the organ of interest;
- Lesion Classification Module: Automatically classifies lesions as benign or malignant;
Deep Learning Specifications: Specifically, the Organ Segmentation Module is underpinned by a U-Net architecture [15] featuring a standard encoder–decoder path, which allows for precise localization of thyroid boundaries even in noisy ultrasound environments. The Lesion Classification Module leverages a ResNet-50 backbone [16], pre-trained on ImageNet and fine-tuned on our thyroid-specific dataset. To ensure clinical transparency and address the “black-box” nature of deep learning, the system incorporates an Explainability Module using Class Activation Maps (CAMs) [17]; these maps highlight the discriminative pixel regions that most influenced the AI’s malignancy prediction, providing the operator with visual feedback on the system’s reasoning.
3.4. Multimodal Data Integration
In addition to imaging data, Synergy-Net performs simultaneous analysis of information from multiple sources (data fusion). Other collected data types include genomic, anamnestic, clinical, laboratory, and surgical data. The integration of multiple data types from the same patient significantly increases the system’s versatility and clinical relevance.
Late Fusion Strategy: from a technical perspective, Synergy-Net employs a Late Fusion strategy to combine these heterogeneous data sources. Feature vectors extracted from the ultrasound images (via the Global Average Pooling layer of the CNN) are mathematically concatenated with the categorical genomic vectors derived from the TruSight One panel. This combined multimodal vector is then fed into a fully connected layer (Multi-Layer Perceptron) to produce the final diagnostic probability, allowing the genomic profile to weight the imaging prediction.
3.5. Patient Selection and Dataset Description
With respect to thyroid cancer, data were collected to validate and, if necessary, correct or confirm the acquisition process. The platform acquired 350 ultrasound scans, including:
- 243 images from 50 operated patients;
- 94 additional images from 40 operated cases;
- A pending dataset of full genome sequences from 18 patients
- An additional dataset of 50 ultrasound images for training the thyroid-specific CAD
In total, 110 patients undergoing total thyroidectomy or lobectomy plus isthmectomy for benign or malignant thyroid disease were included. These cases were collected from the General and Oncologic Physiopathology Surgery Unit at the University of Campania “Luigi Vanvitelli.”
Exclusion criteria: Histological diagnoses of anaplastic or medullary carcinoma due to insufficient sample size for statistical significance.
Patient demographics: 24 males (23%) and 82 females (77%), with a male-to-female ratio of 1:4; age range: 16–81 years; mean age: 46.6 years. (Table 1; Table 2).

Table 1.
Distribution of cases among benign pathologies.
Table 2.
Distribution of cases among malignant pathologies.
Dataset Management and Leakage Prevention: to ensure rigorous validation and prevent data leakage, a strict patient-level split was enforced. The dataset was divided into a Training Set (70%), a Validation Set (15%) for hyperparameter tuning, and a Test Set (15%) for final evaluation. Crucially, multiple images belonging to the same patient were never distributed across different sets. We explicitly acknowledge that the current dataset, originating from a single surgical center, may reflect a selection bias towards malignant pathologies compared to a general screening population.
Training Protocol
The deep learning models were implemented using the PyTorch framework (version 1). The training phase was conducted for 100 epochs using the Adam optimizer [18] with an initial learning rate of 10−4 and a weight decay of 1 times 10−4 to prevent overfitting. The loss function employed was Binary Cross-Entropy. To enhance model robustness and generalization capabilities, data augmentation techniques—including random rotation (+/−10°) and horizontal flipping—were applied exclusively to the training set.
3.6. Imaging Acquisition Protocol
All patients underwent preoperative thyroid ultrasound, and the images were stored in a dedicated database. Examinations followed a standardized protocol:
- Patient position: supine with neck hyperextended
- Probe: linear, 7.5–10 MHz
- Doppler: adjusted for low-flow detection
- Scanning planes: transverse and longitudinal
- Analyzed structures: isthmus (transverse), lobes (craniocaudal and mediolateral directions)
- Anatomical landmarks: carotid artery and trachea
- Measurements: longitudinal diameter, latero-lateral (L-L), anteroposterior (A-P)
- Lymph node stations: central and lateral cervical chains
- Pathological features: described according to malignancy criteria; EU-TIRADS used to determine FNAB eligibility
3.7. Clinical Workflow and Surgery
Each patient underwent a thorough clinical history assessment. Time between symptom onset and diagnosis was ~9 months; time to surgery was ~6 months. Surgeries included total thyroidectomy (±lymphadenectomy) or lobectomy with isthmectomy. Patients resumed oral intake on postoperative day one. All procedures were performed via extracapsular total thyroidectomy using hemostatic and synthesis devices (radiofrequency or ultrasound). No surgical sealants were used. Standardized Kocher midline minicervicotomy was employed
3.8. Genomic Data Collection and Consent
Out of the 110 patients enrolled in the study, 20 were selected to undergo full genome analysis. Prior to the procedure, each patient signed an informed consent form specific to the genetic testing process. The physician responsible for the blood sample collection thoroughly explained the purpose of the test, its limitations, and discussed in detail the potential risks and benefits associated with genetic analysis. Patients were thus fully informed about the nature of the procedure, including any possible medical or psychological implications of the test results—particularly unexpected findings. This comprehensive counseling ensured that all individuals understood the scope and consequences of the testing process and were able to provide truly informed consent. The collected samples were analyzed through a decoding process of original pathological profiles and complementary DNA microarrays using fractal analysis. The sequencing library was prepared using the TruSight One kit (Illumina), which covers 12 Mb of genomic content and includes over 4800 genes associated with specific clinical phenotypes. The kit requires an input of 50 ng of high-quality genomic DNA. The procedure relies on transposon-mediated tagmentation performed on beads and exon enrichment via biotinylated probes.
3.9. System Integration and Model Training
All data collected throughout the diagnostic process, hospitalization, and postoperative follow-up were integrated into the CAD system, enabling the exchange of clinical information across different areas of expertise (Translational Research) and allowing the system to be trained through the development of predictive models.
3.10. Software Architecture
- Front-End: for data upload, processing, and user feedback
- AI Models: perform segmentation/classification
- Orchestrator: formats input, calls model, returns output
The Front-End serves as the interface that provides access to the system’s functionalities.
Specifically, following an authentication phase, the system allowed users to:
- Upload data for analysis (e.g., one or more images)
- View the uploaded data
- Process the uploaded data (e.g., lesion segmentation/classification)
- View additional information generated during data processing
During the ongoing testing phase, the Front-End interface was also used to collect user feedback on the processing outcomes.
3.11. Evaluation Workflow
Following the segmentation procedure, for each Region of Interest (ROI) generated by the system, a structured evaluation was performed by the clinician. This evaluation included the following steps:
- The satisfaction level of the generated ROI was rated according to a qualitative scale with four levels: “excellent,” “good,” “sufficient,” and “insufficient.”
- If the result was rated as “good” or below, the evaluator was required to provide a justification using a free-text comment field, detailing the reasons behind the rating.
- If the ROI was deemed “sufficient” or “insufficient,” the evaluator was given the opportunity to manually draw the correct ROI directly within the system’s interface, thereby suggesting the expected output.
- In cases where the system-generated ROI was identified as a false positive—meaning the region should not have been segmented at all—it was explicitly flagged as such.
Additionally, the evaluator could provide further clarifications or context in a dedicated free-text field associated with that image, to document observations or concerns about the overall result. Similarly, after the classification step, for each classification result produced by the system (linked to a previously segmented or indicated ROI), a satisfaction rating was again required. This process included:
- A qualitative evaluation of the classification result using three possible outcomes: “correct,” “wrong pathology,” or “incorrect.”
- If the classification was rated as “wrong pathology,” the evaluator was required to select the correct diagnosis from a predefined, pathology-specific list developed during the initial phases of the project.
- If the classification was judged “incorrect” more generally, the evaluator was asked to provide an explanatory comment in a free-text field, elaborating on the rationale behind their assessment.
This dual-layered evaluation process (segmentation and classification) served both as quality control and as a feedback mechanism to support the iterative refinement of the AI models. The structured input from expert users was critical in identifying edge cases, reducing false positives and improving the precision of lesion recognition and diagnosis over time.
The Orchestrator module served as the component responsible for interfacing the user (i.e., the physician logged into the system) with the appropriate artificial intelligence model.
Specifically, the Orchestrator performed the following tasks:
- It prepared the input data in a format compatible with the requirements of the AI modules. For example, it encoded the image uploaded by the physician into a NumPy array with dimensions corresponding to the model’s expected input.
- It called the specific Python (version 1) function corresponding to the task requested by the physician (e.g., segmentation or classification).
- It retrieved and displayed the results generated by the AI processing system within the user interface.
This component ensured seamless integration between user interaction and the computational back-end, acting as a dynamic mediator that facilitated accurate, model-specific data handling and feedback delivery.
4. Results
Compared to the final histopathological diagnosis, the CAD system demonstrated the following performance metrics:
- Accuracy: 90.35%
- Sensitivity: 90.64%
- Specificity: 90.13%
- Positive Predictive Value (PPV): 86.02%
- Negative Predictive Value (NPV): 94.12%
- Area Under the Receiver Operating Characteristic Curve (ROC-AUC): 0.90
The optimal cut-off value was identified at TI-RADS grade 4. The sensitivity (S), specificity (SP), accuracy (A), and ROC curve values for benign and malignant thyroid lesions are shown in the following tables: (Table 3).
Table 3.
Performance indices (sensitivity (S), specificity (SP), accuracy (A), and AUC indicates Area Under the Curve for the CAD system according to each histopathological lesion type. 95% Confidence Intervals for accuracy range between ±2.4% and ±3.8% for cohorts with N > 5. Statistical significance was confirmed with p < 0.001. For the CAD system according to each histopathological lesion type.
The system’s diagnostic efficacy was evaluated across a diverse spectrum of histopathological diagnoses, encompassing both benign (Table 1) and malignant (Table 2) conditions.
In the benign cohort, the platform demonstrated exceptional robustness in identifying Goiter (AUC: 0.96), which represented the largest subgroup (59%). High performance was maintained even in complex multi-pathology cases, such as the ‘Goiter + Thyroiditis’ group (Accuracy: 95.3%).
The lower metrics observed in the Thyroiditis subgroup (AUC: 0.72) are primarily due to the small sample size (n°= 3) and the high sonographic overlap between inflammatory and suspicious patterns. Regarding malignant pathologies, the system achieved high sensitivity and specificity across all variants. Notably, the Follicular Variant showed the highest performance (AUC: 0.93), followed by Classic Papillary Carcinoma (AUC: 0.90), which constituted the majority of malignant cases (56%). Even for less frequent pathologies like Follicular Carcinoma (n° = 3), the accuracy remained high at 95.3%, suggesting that the multimodal integration effectively supports the detection of different malignancy patterns. These results, supported by statistical significance (p < 0.001), validate the system’s reliability as a standardized tool for thyroid nodule Characterization.
In addition to the qualitative assessment by clinicians, a quantitative evaluation of the segmentation performance was conducted. The U-Net model achieved a mean Dice Similarity Coefficient (DSC) of 0.89 ± 0.04 on the test set. This metric confirms the high accuracy of the automatic delineation of thyroid nodules compared to the ground truth masks provided by the radiologists, ensuring reliable input for the subsequent classification stage.
Regarding genetic analysis, the following results were obtained: (Table 4).
Table 4.
Main technical parameters of the TruSight One sequencing panel used for genomic analysis. The genomic characterization of the patient cohort was performed using the TruSight One sequencing panel (Illumina), whose technical specifications are summarized in Table 4. This comprehensive panel targets a cumulative region of 12 Mb, covering 4811 high-priority genes associated with clinical phenotypes. The high-resolution analysis is ensured by approximately 62,000 target exons and a robust library of 125,395 probes (80-mer length). This extensive genomic profiling allows for the detection of a wide array of variants, providing the high-dimensional data necessary for the multimodal integration with ultrasound-based deep learning features.
5. Discussion and Conclusions
This study described Synergy-Net, an ongoing project aimed at developing a technological platform to support early oncological diagnosis, based on the integration of interoperable communication and a clinical data management system powered by artificial intelligence. Due to its deeply interdisciplinary nature, the Anthem system has been designed as a modular CAD, in which each module collaborates with the others under the coordination of an orchestrator to provide the required processing.
This interdisciplinary structure has made it possible to work in parallel on different organs, leveraging shared architectures, solutions, and ideas, while also developing specific strategies tailored to each patient.
The downside is that the progress of the project has not been uniform, mainly due to varying requirements (e.g., specific conditions to be met for patient inclusion). As a result, while the AI algorithm design for some organs has been completed (or is near completion), for others, data collection is still underway.
Nevertheless, alongside efforts to complete the ongoing activities, the project team is already planning the next steps. Two main ideas will guide the project’s immediate future development:
- The first idea is to leverage modern ultrasound elastography as a low-cost, side-effect-free method for the early diagnosis of oncological diseases, applicable to all tumor types considered within the Anthem project.
- The second idea is to provide integrated prevention through data, by employing fusion techniques. The objective is to simultaneously analyze information from multiple sources in order to offer a comprehensive tool built upon the medical expertise of each specialist.
In comparison to commercially available AI solutions, such as S-Detect (Samsung) and AIBx (General Electric), our platform introduces a paradigm shift through its Human-in-the-Loop (HITL) architecture and multimodal integration. While traditional systems like S-Detect primarily rely on morphological analysis of ultrasound images (often achieving sensitivities around 85–88%), our system leverages the TruSight One genomic panel to refine indeterminate cases.
To facilitate clinical integration and build trust among users, Synergy-Net incorporates explainability modules such as Class Activation Maps (CAMs). These maps visually highlight the specific regions of the ultrasound image that contribute most to the malignancy score, allowing the clinician to correlate AI outputs with established B-mode semiotics, such as solid composition or taller-than-wide shape. This transparency is particularly crucial for less experienced operators, as it provides a formative feedback loop that enhances their diagnostic skills. Rather than acting as a ‘black-box’ predictor, the system serves as a Clinical Decision Support System (CDSS). By providing an objective risk stratification—fused with the definitive biological data from the TruSight One panel—the framework helps standardize the diagnostic process, reducing the subjectivity inherent in ultrasound interpretation and ensuring a safer, more consistent clinical decision-making pipeline
As demonstrated in our results, the integration of genomic data allows the system to maintain a high AUC of 0.90 for malignant pathologies (Table 2) and 0.96 for Goiter (Table 1), outperforming purely imaging-based tools in terms of specificity. Unlike ‘black-box’ commercial systems, the use of Class Activation Maps (CAMs) and the U-Net segmentation module provides clinicians with a transparent rationale for the AI’s suggestions, facilitating the clinical validation process rather than replacing it.
Although the Synergy system analyzed in this study demonstrates the feasibility of an AI-assisted standardized approach to thyroid ultrasound acquisition and lesion detection, its limitations—particularly in achieving consistent performance across a broad range of subjects and operator conditions—highlight the need for further methodological advancement. In response to these challenges, we propose the ANTHEM framework as an evolution of the Synergy project, aimed at enhancing diagnostic precision by integrating multi-dimensional imaging and pathological information.
It is important to distinguish between the core Synergy-Net engine validated in this study and the broader conceptual goals of the ANTHEM project. The results presented in Table 1 and Table 2—demonstrating high diagnostic accuracy through the fusion of 2D ultrasound and genomic data—represent the currently implemented and clinically validated version of our framework. Advanced features mentioned in this manuscript, such as 3D volumetric reconstruction, the transition to Vision Transformer (ViT) architectures for superior global feature attention, and the integration of Digital Pathology for automated histological correlation, are currently in the developmental or conceptual phase. These elements are part of the ANTHEM roadmap and were included to illustrate the scalability of the system; however, they did not contribute to the performance metrics reported in this study. Future research will focus on the experimental validation of these modules to further enhance the multimodal diagnostic pipeline.
Advanced features mentioned in this manuscript, such as 3D volumetric reconstruction, the transition to Vision Transformer (ViT) architectures for superior global feature attention, and the integration of Digital Pathology for automated histological correlation, are currently in the developmental or conceptual phase. These elements are part of the ANTHEM roadmap and were included to illustrate the scalability of the system; however, they did not contribute to the performance metrics reported in this study. Future research will focus on the experimental validation of these modules to further enhance the multimodal diagnostic pipeline.
ANTHEM extends the core principles of Sinergy by moving beyond traditional two-dimensional ultrasound interpretation toward three-dimensional (3D) volumetric analysis and multimodal integration. Recent research has demonstrated that 3D ultrasound reconstructions can improve the anatomical representation of complex structures such as the thyroid and surrounding vasculature, enabling richer spatial context for both segmentation and diagnostic tasks compared to conventional 2D imaging alone [19]. Automated AI-based segmentation has been successfully applied to 3D ultrasound volumes of the thyroid gland with promising qualitative and quantitative performance when compared to gold-standard imaging modalities like CT angiography [19].
In addition, cutting-edge deep learning architectures such as Vision Transformers (ViTs) have emerged as a powerful tool for capturing long-range contextual relationships in medical images, overcoming some of the intrinsic limitations of convolutional neural networks in modeling global image features [20]. Vision transformer-based models have been successfully applied to ultrasound classification and segmentation, showing competitive or superior performance in complex image analysis tasks [21].
These models, particularly when combined with advanced reconstruction techniques, offer the potential for real-time, high-resolution volumetric interpretation that can support more nuanced assessment of thyroid nodules [20,21].
Moreover, ANTHEM introduces integration with digital pathology, whereby histological whole-slide images from surgical specimens are incorporated into the diagnostic pipeline to augment imaging-based predictions [22]. Digital pathology enables detailed characterization of tissue architecture and molecular markers at a microscopic level, and when combined with imaging data, can enhance both disease phenotyping and prognostic stratification [22].
Taken together, ANTHEM represents a multimodal artificial intelligence ecosystem—leveraging 3D ultrasound reconstruction, advanced transformer-based deep learning models, and digital pathological data—to achieve more robust and precise thyroid lesion characterization. This evolution is expected not only to reduce operator dependency but also to provide clinicians with richer, more interpretable diagnostic information that can be correlated with histopathological outcomes. Future work will focus on comprehensive validation of ANTHEM in prospective clinical cohorts, as well as optimization of its computational performance and integration into clinical workflows (Figure 2).
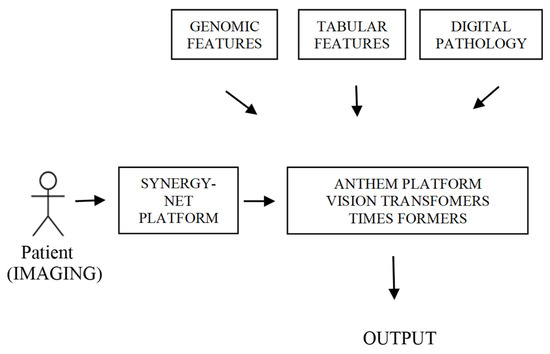
Figure 2.
Data flow diagram from patient diagnostics via imaging to final output. Patient data is processed by the Synergy Net Platform and the Anthem Platform; Vision Transformers, with contributions from Genomic Features, Tabular Features, and Digital Pathology, which flow into the final analysis to generate the output.
Author Contributions
Conceptualization, methodology, D.P.; data curation, D.P. and A.C.; writing—original draft preparation, D.P. and A.C.; writing—review and editing, D.P., A.C., M.A., F.M., P.L., G.M., F.T., R.S., P.B., M.S.F., S.T., A.F., M.D.D., F.C., P.D.M., S.A. and L.D.; visualization, D.P., A.C., M.A., F.M., P.L., G.M., F.T., R.S., P.B., M.S.F., S.T., A.F., M.D.D., F.C., P.D.M., S.A. and L.D.; supervision, D.P., A.C., M.A., F.M., P.L., G.M., F.T., R.S., P.B., M.S.F., S.T., A.F., M.D.D., F.C., P.D.M., S.A. and L.D.; project administration, D.P.; funding acquisition, D.P.; All authors have read and agreed to the published version of the manuscript.
Funding
This research was funded by ANTHEM (AdvaNced Technologies for Human-centrEd Medicine).
Institutional Review Board Statement
This study followed the ethical principles of the Declaration of Helsinki and the Institutional Review Board at “Policlinico” Hospital of the University of Campania “Luigi Vanvitelli” in Naples, Italy (Ethical code: 4442/18 and 10841/18 and approved on 25 May 2018).
Informed Consent Statement
Informed consent was obtained from all subjects involved in the study. Written informed consent has been obtained from the patient(s) to publish this paper.
Data Availability Statement
The datasets used and/or analyzed during the current study are available from the corresponding author on reasonable request.
Acknowledgments
The authors would like to acknowledge ANTHEM (AdvaNced Technologies for Human-centrEd Medicine) and Limongelli Paolo, University of Study of Campania “Luigi Vanvitelli” Naples, Italy, who had the intuition and the idea to investigate the application of artificial intelligence in clinical practice.
Conflicts of Interest
The authors declare no conflicts of interest.
References
- Siegel, R.L.; Giaquinto, A.N.; Jemal, A. Cancer statistics, 2024. CA Cancer J. Clin. 2024, 74, 12–49, Erratum in CA Cancer J. Clin. 2024, 74, 203. https://doi.org/10.3322/caac.21830. [Google Scholar] [CrossRef] [PubMed]
- Durante, C.; Grani, G.; Lamartina, L.; Filetti, S.; Mandel, S.J.; Cooper, D.S. The Diagnosis and Management of Thyroid Nodules: A Review. JAMA 2018, 319, 914–924, Erratum in JAMA 2018, 319, 1622. https://doi.org/10.1001/jama.2018.3696. [Google Scholar] [CrossRef] [PubMed]
- Lim, H.; Devesa, S.S.; Sosa, J.A.; Check, D.; Kitahara, C.M. Trends in Thyroid Cancer Incidence and Mortality in the United States, 1974–2013. JAMA 2017, 317, 1338–1348. [Google Scholar] [CrossRef] [PubMed]
- Kitahara, C.M.; Sosa, J.A. The changing incidence of thyroid cancer. Nat. Rev. Endocrinol. 2016, 12, 646–653. [Google Scholar] [CrossRef] [PubMed] [PubMed Central]
- De Falco, N.; Agresti, M.; De Falco, M.; Sperlongano, P.; Moccia, G.; Luongo, P.; Cece, A.; Bove, F.; Miele, F.; Allaria, A.; et al. Simultaneous Medullary and Papillary Thyroid Carcinomas: Personal Experience Report and Literature Review. J. Clin. Med. 2025, 14, 1382. [Google Scholar] [CrossRef] [PubMed]
- Haugen, B.R.; Alexander, E.K.; Bible, K.C.; Doherty, G.M.; Mandel, S.J.; Nikiforov, Y.E.; Pacini, F.; Randolph, G.W.; Sawka, A.M.; Schlumberger, M.; et al. 2015 American Thyroid Association Management Guidelines for Adult Patients with Thyroid Nodules and Differentiated Thyroid Cancer. Thyroid 2016, 26, 1–133. [Google Scholar] [CrossRef] [PubMed]
- Choi, Y.J.; Baek, J.H.; Park, H.S.; Shim, W.H.; Kim, T.Y.; Shong, Y.K.; Lee, J.H. A Computer-Aided Diagnosis System Using Artificial Intelligence for the Diagnosis and Characterization of Thyroid Nodules on Ultrasound: Initial Clinical Assessment. Thyroid 2017, 27, 546–552. [Google Scholar] [CrossRef] [PubMed]
- Zhou, L.; Zheng, L.L.; Zhang, C.J.; Wei, H.F.; Xu, L.L.; Zhang, M.R.; Li, Q.; He, G.F.; Ghamor-Amegavi, E.P.; Li, S.Y. Comparison of S-Detect and thyroid imaging reporting and data system classifications in the diagnosis of cytologically indeterminate thyroid nodules. Front. Endocrinol. 2023, 14, 1098031. [Google Scholar] [CrossRef] [PubMed] [PubMed Central]
- Du, L.; Liu, H.; Cai, M.; Pan, J.; Zha, H.; Nie, C.; Lin, M.; Li, C.; Zong, M.; Zhang, B. Ultrasound S-detect system can improve diagnostic performance of less experienced radiologists in differentiating breast masses: A retrospective dual-centre study. Br. J. Radiol. 2025, 98, 404–411. [Google Scholar] [CrossRef] [PubMed]
- Swan, K.Z.; Thomas, J.; Nielsen, V.E.; Jespersen, M.L.; Bonnema, S.J. External validation of AIBx, an artificial intelligence model for risk stratification, in thyroid nodules. Eur. Thyroid. J. 2022, 11, e210129. [Google Scholar] [CrossRef] [PubMed] [PubMed Central]
- Cao, C.L.; Li, Q.L.; Tong, J.; Shi, L.N.; Li, W.X.; Xu, Y.; Cheng, J.; Du, T.T.; Li, J.; Cui, X.W. Artificial intelligence in thyroid ultrasound. Front. Oncol. 2023, 13, 1060702. [Google Scholar] [CrossRef] [PubMed] [PubMed Central]
- Cece, A.; Agresti, M.; De Falco, N.; Sperlongano, P.; Moccia, G.; Luongo, P.; Miele, F.; Allaria, A.; Torelli, F.; Bassi, P.; et al. Role of Artificial Intelligence in Thyroid Cancer Diagnosis. J. Clin. Med. 2025, 14, 2422. [Google Scholar] [CrossRef] [PubMed]
- Serretiello, E.; Smimmo, A.; Ballini, A.; Parmeggiani, D.; Agresti, M.; Bassi, P.; Moccia, G.; Sciarra, A.; De Angelis, A.; Della Monica, P.; et al. Extracellular Vesicles and Artificial Intelligence: Unique Weapons against Breast Cancer. Appl. Sci. 2024, 14, 1639. [Google Scholar] [CrossRef]
- Palomba, G.; Fernicola, A.; Corte, M.D.; Capuano, M.; De Palma, G.D.; Aprea, G. Artificial intelligence in screening and diagnosis of surgical diseases: A narrative review. AIMS Public Health 2024, 11, 557–576. [Google Scholar] [CrossRef] [PubMed] [PubMed Central]
- Ronneberger, O.; Fischer, P.; Brox, T. U-Net: Convolutional Networks for Biomedical Image Segmentation. In Medical Image Computing and Computer-Assisted Intervention (MICCAI); Springer: Cham, Switzerland, 2015; pp. 234–241. [Google Scholar]
- He, K.; Zhang, X.; Ren, S.; Sun, J. Deep Residual Learning for Image Recognition. In Proceedings of the IEEE Conference on Computer Vision and Pattern Recognition (CVPR), Las Vegas, NV, USA, 27–30 June 2016; pp. 770–778. [Google Scholar]
- Zhou, B.; Khosla, A.; Lapedriza, A.; Oliva, A.; Torralba, A. Learning Deep Features for Discriminative Localization. In Proceedings of the IEEE Conference on Computer Vision and Pattern Recognition (CVPR), Las Vegas, NV, USA, 27–30 June 2016; pp. 2921–2929. [Google Scholar]
- Kingma, D.P.; Ba, J. Adam: A Method for Stochastic Optimization. arXiv 2014, arXiv:1412.6980. [Google Scholar]
- Arsenescu, T.; Chifor, R.; Marita, T.; Santoma, A.; Lebovici, A.; Duma, D.; Vacaras, V.; Badea, A.F. 3D Ultrasound Reconstructions of the Carotid Artery and Thyroid Gland Using Artificial-Intelligence-Based Automatic Segmentation-Qualitative and Quantitative Evaluation of the Segmentation Results via Comparison with CT Angiography. Sensors 2023, 23, 2806. [Google Scholar] [CrossRef] [PubMed] [PubMed Central]
- Vafaeezadeh, M.; Behnam, H.; Gifani, P. Ultrasound Image Analysis with Vision Transformers—Review. Diagnostics 2024, 14, 542. [Google Scholar] [CrossRef] [PubMed]
- Feres, J.; Noura, A.; Nawres, K. Automatic Classification of Thyroid Ultrasound Images Using Vision Transformers and GANs. Sci. Afr. 2023, 20, e01357. [Google Scholar] [CrossRef]
- Pantanowitz, L.; Sharma, A.; Carter, A.B.; Kurc, T.; Sussman, A.; Saltz, J. Twenty Years of Digital Pathology: An Overview of the Road Travelled, What is on the Horizon, and the Emergence of Vendor-Neutral Archives. J. Pathol. Inform. 2018, 9, 40. [Google Scholar] [CrossRef] [PubMed] [PubMed Central]


Disclaimer/Publisher’s Note: The statements, opinions and data contained in all publications are solely those of the individual author(s) and contributor(s) and not of MDPI and/or the editor(s). MDPI and/or the editor(s) disclaim responsibility for any injury to people or property resulting from any ideas, methods, instructions or products referred to in the content. |
© 2026 by the authors. Licensee MDPI, Basel, Switzerland. This article is an open access article distributed under the terms and conditions of the Creative Commons Attribution (CC BY) license.