Article

AI-Driven Modeling of the Energy Transition in the SPRING-F Group: A Hybrid Panel ARDL and Machine Learning Approach


Department of Economic Informatics and Cybernetics, Bucharest University of Economic Studies, 010552 Bucharest, Romania
*
Author to whom correspondence should be addressed.
Appl. Sci. 2026, 16(2), 1044; https://doi.org/10.3390/app16021044
Submission received: 29 December 2025 / Revised: 16 January 2026 / Accepted: 17 January 2026 / Published: 20 January 2026
(This article belongs to the Special Issue Holistic Approaches in Artificial Intelligence and Renewable Energy)

Abstract

This study analyses the dynamics of the energy transition within the SPRING-F group (Spain, Poland, Romania, Italy, the Netherlands, Germany, France) through a hybrid approach that combines econometric panel ARDL models with machine learning algorithms. The analysis is based on energy, economic, and technological indicators, including renewable energy consumption, energy intensity, CO2 emissions, GDP per capita, urbanization, trade openness, and R&D expenditure. The results of the exploratory analysis highlight the existence of clear structural differences between Western European and emerging Central and Eastern European economies. Based on the estimates made with the ARDL panel model, the long-term equilibrium relationships were confirmed. They indicated positive and significant effects of urbanization and economic growth on renewable energy consumption, as well as a negative impact of CO2 emissions. Regarding the short-term effects, the error correction coefficient suggests a moderate convergence towards equilibrium. Machine learning models highlight the superiority of nonlinear approaches, and SHAP analysis confirms the dominant role of CO2 emissions and the heterogeneity of national energy transition trajectories.

1. Introduction

Perhaps one of the most complex and urgent structural transformations of contemporary economies is the energy transition. This is very important for achieving sustainable development goals [1,2], for reducing greenhouse gas emissions [3,4], and also for ensuring long-term energy security [5,6,7]. An analysis at the European level can be a laborious and complex process because it is very influenced by structural differences between economies, first of all. On the other hand, the different levels of development of European economies, the significant differences in innovation capacity, and the degree of integration in energy and trade chains make this process require an approach that simultaneously captures several dimensions, such as economic, technological, and environmental, but also captures their dynamics over time.
In recent years, it has been observed that the specialized literature highlights the nonlinearity of the relationships formed between renewable energy consumption, economic growth, CO2 emissions, energy efficiency, and R&D investments [8,9,10,11]. Also, these relationships are heterogeneous and dependent on the specific context of each country [12]. Most of the time, these dynamics of these relationships have been analyzed through traditional econometric approaches and models. It is true that these approaches provide a solid framework for identifying long-term equilibrium relationships and short-term adjustment mechanisms. However, they also have important limitations that refer to the fact that they cannot capture the dynamic and complex interactions, but also the structural changes specific to these energy transition processes.
Given these limitations, the integration of Machine Learning (ML) methods in economic analysis offers the opportunity to improve the explanatory and predictive capacity of the models used. This study aims to analyze the energy transition in a selected group of European economies, referred to as SPRING-F, which includes both advanced Western European countries and emerging economies from Central and Eastern Europe (CEE). The countries considered are Spain, Poland, Romania, Italy, the Netherlands, Germany, and France. The SPRING-F group represents an ad hoc country grouping, constructed specifically for the analytical purposes of this study. It is not intended to define a formal economic or institutional bloc, but rather to capture structural heterogeneity and differentiated transition trajectories within the European energy transition process. This selection enables the investigation of convergence and divergence dynamics, as well as the role of economic, energy, and technological factors in shaping renewable energy adoption across economies with different levels of development, market integration, and institutional capacity. As such, the SPRING-F group provides a coherent and relevant comparative framework for examining both common long-term mechanisms and country-specific transition pathways.
From a methodological flow perspective, this study proposes a hybrid approach that uses the panel ARDL (Autoregressive Distributed Lag) model together with the ML algorithms Random Forest, XGBoost, and Elastic Net. The panel ARDL model has the role of identifying long- and short-term relationships between renewable energy consumption and its main determinants. Complementarily, ML models are used to evaluate predictive performance and also to capture nonlinear relationships and complex interactions between variables. In addition, the interpretability of ML models is achieved by analyzing SHAP values.
The main contribution of this study is that it coherently integrates econometric analysis with Artificial Intelligence (AI) techniques to analyze the energy transition in a comparable panel framework. The results obtained can support the formulation of differentiated public policies, adapted to the structural specificities of each economy in the SPRING-F group. In this research, the concept of “AI-driven” is not used to exclusively designate the predictive performance of ML models, but is used to describe an analytical framework augmented by AI. In other words, the novelty of the article does not consist in the isolated application of the ARDL panel model, ML algorithms, and interpretability methods, but in their integration into a coherent analytical framework, with complementary roles, oriented towards different research questions. Starting from this framework, this study aims to answer the following research questions (RQs):
  • RQ1: What are the long-term equilibrium relationships and short-term adjustment mechanisms between renewable energy consumption and its main economic, technological, and environmental determinants within the SPRING-F group?
  • RQ2: What determinants of the energy transition become relevant when nonlinear relationships and heterogeneous effects between countries are assumed?
  • RQ3: To what extent are the results obtained through the ARDL panel model confirmed, strengthened, or contradicted by ML-based analysis and interpretability methods?
The paper is structured as follows: Section 2 presents a review of the state of knowledge in the field. Section 2 is organized by the main research directions regarding the energy transition. Section 3 describes the SPRING-F group, the methodology and the data sources used in the analysis. Section 4 presents empirical results, starting with the exploratory data analysis, followed by the econometric results on the long- and short-run relationships and ending with the predictive performance and interpretability of the ML models. Finally, Section 5 summarizes the main conclusions of the study.

2. Literature Review

2.1. Energy Transition and Economic Growth

In the study by Vasa et al. [13], the authors consider that the green agenda, climate change, and sustainability policies are closely linked to the success of the energy transition. They also consider that the energy transition is not only determined by certain economic considerations, but also by climate pressures and by the level of environmental awareness. The authors use random effects panel models for the 27 European Union (EU) Member States, using data from the period 2013–2021. The results indicate that climate indicators and price shocks in the energy sector have a significant positive impact on the adoption of renewable sources. On the other hand, it was observed that there is a threshold of GDP per capita beyond which the economic incentives for the expansion of renewable energy diminish. This aspect underlines the nonlinearity between economic growth and the energy transition. Another study that analyzes the relationship between energy transition and economic growth was conducted by Sarsar and Echaoui [14]. The authors introduce a relatively new concept in this field, namely economic complexity. They use an extended sample of 124 countries for the period 2000–2020 and employ a robust panel estimation method that corrects heteroscedasticity problems. The results show that, in the absence of other factors, the energy transition has, on average, a negative impact on economic growth. The results also show that in countries with a high level of economic complexity, the negative effect of the energy transition on economic growth is significantly attenuated or even transformed into a positive effect.
Recent literature also indicates that the energy transition and environmental improvement in the EU depend not only on an increased use of renewable energy sources but also on resource efficiency, fiscal policy, and the existing institutional framework. Aydin and Erdem [15] point out that resource and energy efficiency, together with the use of renewable energy, contribute to environmental improvement, the effects are not uniform across Member States. Although energy and resource productivity support sustainability in countries such as the Czech Republic, Austria, or Poland, the effect of economic growth remains generally detrimental to the environment, suggesting that there are persisting structural pressures.
From a policy perspective, Degirmenci and Yavuz [16] point out that fiscal instruments and R&D spending have varying impacts on renewable energy use across EU Member States. While environmental taxes help boost green energy in developed countries like Germany and France, they can cause problems in other nations, highlighting the need for tailored and coordinated policies at the European level. The importance of R&D investments also varies depending on each country, highlighting that the energy transition is complex and depends on diverse structures. Complementing this idea, Behera et al. [17] emphasize that institutions have a very important role in supporting renewable energy. Green technology, green financing, and fiscal responsibility sharing stimulate the use of renewable energy, while political instability can hinder this process. These findings indicate that the success of the energy transition in the European Union depends on a well-thought-out strategy that combines energy, fiscal, and institutional policies tailored to each economy.

2.2. Energy Efficiency, Energy Intensity, and Green Transition

Regarding energy efficiency and energy intensity reduction, the literature highlights that these two factors are the main pillars of the green transition in the EU, with implications for energy security and the environment. Gökgöz and Güvercin [18] show that the expansion of renewable energy contributes to reducing dependence on energy imports and strengthening energy security in the EU, in parallel with improving energy efficiency and productivity. DEA and Malmquist analyses indicate a gradual convergence between Member States, in which technological progress and knowledge diffusion play a determining role.
From the perspective of Central and Eastern European economies, Brożyna et al. [19] highlight that the energy transition is strongly conditioned by the structural legacy of transition economies, characterized by high levels of energy intensity. Although increasing the share of renewable energy and improving energy efficiency can contribute to reducing greenhouse gas emissions, achieving European targets remains uncertain in the absence of coherent and sustained energy policies.
The role of European policies is highlighted by De Alegría Mancisidor and his collaborators [20], who indicate that the European Union’s approaches to renewable energy and energy efficiency have remained essential for economic competitiveness, having a significant impact on the trajectory of countries such as Spain.
At the sector level, Depoorter et al. [21] show that energy efficiency is not only influenced by technology, but also by geographical and management aspects, including the location of energy-consuming infrastructure (such as data centers) and the mix of renewable sources. These findings highlight the systemic nature of the energy transition and the need for tailor-made solutions for each region.
Lin et al. [22] demonstrate that countries in Europe have made significant progress in energy efficiency and greenhouse gas emission reductions, yet the effects of climate change continue to be felt, even with efficient energy use. This observation indicates that while improving energy efficiency and increasing the share of renewable energy are essential conditions, they are not sufficient to achieve the goal of climate neutrality.

2.3. Urbanization and Infrastructure in the Energy Transition

Urbanization and urban infrastructure play a very important role in the energy transition. Cities are becoming key spaces to implement decarbonization, energy efficiency, and renewable energy solutions. The concept of green infrastructure is frequently associated with the transition to a sustainable urban model [23,24], being defined as a network of natural and semi-natural spaces that provide ecosystem services and support adaptation to climate change [25].
Chatzimentor et al. [26] show that European research in the field of green infrastructure is predominantly focused on the urban environment, but underlines the need to integrate social dimensions and socio-ecological justice to support sustainable urban transitions.
Kozera et al. [27], in their study, show that urban transport has an important role in reducing emissions. From the perspective of public investment, cities are the main beneficiaries of European funds for green transport infrastructure. The authors conducted this study in Poland and showed that investments in public transport, in reducing emissions, and in renewable sources contribute to the better development of a low-emission urban economy. Thus, local policies are also very important in implementing the energy transition.
The transformation of energy infrastructure is also analyzed from a broader strategic perspective, with Kwilinski et al. [28] highlighting that the integration of renewables and the development of green infrastructure are dominant directions of the European Green Deal. The authors emphasize the role of sustainable financing and green investments in accelerating the modernization of energy infrastructure. This aspect is an important pillar for achieving long-term climate goals.
Regarding European cities, a study by Villamor et al. [29] shows the importance of municipalities in the energy transition. However, an important limitation is the dependence on fossil fuels. Also, the results obtained by the authors in their study show that the level of energy consumption is closely correlated with economic and social development, the size of the cities or climatic conditions being not as important. In addition to these conclusions, other authors [30] have demonstrated through their study that urbanization has an ambivalent effect on the environment. The authors’ results showed that increasing urbanization is associated with a deterioration in air quality, while expanding the use of renewable energy contributes to reducing CO2 emissions.

2.4. Innovation, R&D, and Energy Transition

The specialized literature consistently emphasizes that innovation and investment in research and development also represent an essential pillar of the energy transition, especially in the context of the ambitious objectives assumed by the European Union through the Paris Agreement and the European Green Deal.
In the study by Tagliapietra et al. [31], the authors show that achieving deep decarbonization requires a qualitative advance in the energy system based on an approach that integrates technological innovation, coherent policies, and regulatory frameworks to support them. A study that highlights in detail at the national level the role of technological innovation is carried out by Böhringer et al. [32]. The authors show that the main low-emission technologies are already available in the case of Germany. However, the main limitation is that their diffusion on the market is constrained by several barriers, both institutional and economic. Basically, the authors show that technological progress is not enough to accelerate the energy transition. Economic incentives are needed to support this acceleration, but also the development of an appropriate policy framework.
A complementary perspective is provided by the study by Hewitt et al. [33]. The authors consider the energy transition as a social process that is influenced by power relations, institutional structure, and the interests of the main actors. They conduct a case study on Spain and show that innovation can be stopped by important actors in the energy sector. To overcome these barriers, not only are innovative technological solutions sufficient, but also the capacity for political and institutional negotiation. Gasser et al. [34], in their study, approach a perspective on the financing of innovation. The authors show that the efficient driver of green innovation is public financing of R&D in the field of renewable energy. However, the authors observed that the distribution and efficiency of financing differ significantly between EU member states. For example, Nordic economies have a high level of R&D financing, but the dependence on European funds varies considerably between countries. This idea is also supported by the research of Ragwitz and Miola [35].

2.5. International Trade and Energy Transition

International trade is an essential channel to help diffuse clean energy technologies. It influences the pace of the energy transition and the structure of comparative advantages between economies. A study by Costantini and Crespi [36] shows that innovation is stimulated by stricter environmental policies. Their results support Porter’s hypothesis, according to which well-designed environmental regulations can generate competitive advantages by stimulating technological progress. Another study approaches a macroeconomic perspective [37]. The authors demonstrate that trade openness contributes to reducing CO2 emissions in Europe. On the other hand, economic growth, urbanization, and financial development amplify environmental pressures [37].
Trade liberalization has different effects on renewable energy consumption depending on the level of economic development, as Wang and Zhang [38] show in their study. An extension of this perspective is provided by Can et al. [39], which shows that green trade openness and renewable energy consumption contribute not only to climate goals, but also to improving human well-being in EU states.

2.6. Hybrid Approaches in Energy Economics: Econometric Models and Machine Learning Algorithms

Early literature on hybrid approaches in energy economics highlights the usefulness of combining statistical methods for dimensionality reduction with econometric techniques to identify the determinants of the energy transition. Papież et al. [40] analyze the development of renewable energy in 26 European Union countries over a period of approximately 20 years, using a combination of principal component analysis (PCA) and advanced variable selection methods (best subset regression and LARS). The authors’ results show that the initial structure of the energy mix plays an important, long-term, determining role. Thus, the existence of path dependencies in the energy transition is confirmed. This can be understood by the fact that countries that rely on fossil fuels tend to adopt renewable energy at a slower pace, while economies that depend on energy imports have a much faster development.
Li and Leung [41] examine the relationship between energy prices, economic growth, and renewable energy consumption in several European countries. The results show that when the economy is growing or when fossil fuels become more expensive, countries tend to use more renewable energy. In the short term, gas and coal prices quickly influence green energy decisions. In contrast, the study does not show that renewable energy directly leads to economic growth, suggesting that the energy transition occurs primarily in response to economic conditions.
Ren et al. [42] show that, in the European Union, economic growth generally leads to increased CO2 emissions, both in the short and long term. In contrast, the use of renewable energy contributes to reducing emissions. The study also highlights that emissions are influenced by developments in neighboring countries, suggesting that environmental policies need to be coordinated at the European level. Apostu et al. [43] in their study, look at how the energy transition in Central and Eastern European countries has evolved after joining the EU. The study shows that stricter rules imposed by the EU and foreign investment have helped these countries reduce their environmental impact. On the other hand, the authors say that recent problems related to energy security may slow down the transition.
Pavlova et al. [44] analyze the reasons for the use of natural gas in the EU, using an ARDL model. The results show that, in the long run, gas consumption is linked to the economy and the type of fuel used. In the short run, gas increases mainly when the use of other fuels decreases, and the effect of economic growth appears with a lag. The study suggests that gas is still a transitional solution in the decarbonization process.
Chen et al. [45] analyze how innovation in green technologies influences the energy transition, using both econometric methods and machine learning algorithms. The study shows that investments in R&D and the number of green patents clearly help the transition to clean energy. The authors emphasize that machine learning is useful for assessing the impact of these innovations and that more investment in green technology is needed to accelerate the energy transition.
The ML framework adopted in this study follows a general AI workflow successfully applied in various domains characterized by complex nonlinear relationships and heterogeneous data sources. Beyond energy economics, similar hybrid approaches combine predictive models with mechanism-based interpretation and explicit carbon-footprint considerations, illustrating how sustainability-related outcomes can be contextualized beyond purely statistical associations. Recent applied studies in material science and geospatial analysis highlight the importance of integrating explainable AI techniques with domain-specific mechanisms when interpreting emissions-related indicators and sustainability performance [46,47,48].

3. Methodology and Data Collection

The SPRING-F group was built to enable a coherent comparative analysis of the energy transition in European economies characterized by different levels of economic development, institutional maturity, and energy performance, but integrated within a common framework of public policies and regulations. The group includes Spain, Poland, Romania, Italy, the Netherlands, Germany, and France, economies that represent both the industrial and technological core of the European Union and states undergoing structural convergence. The selection of these countries is motivated by three main considerations. First, all economies analyzed are subject to the same European energy and climate directives, which reduces the heterogeneity induced by major regulatory differences and allows a clearer interpretation of economic and energy relationships. Second, the group captures the structural heterogeneity necessary to analyze differentiated energy transition trajectories, including economies with high levels of energy efficiency and R&D investment, alongside economies with higher fossil fuel dependence and lower technological capabilities.
From an analytical perspective, the SPRING-F group provides an appropriate framework for investigating the mechanisms of convergence and divergence in the European energy transition, allowing the identification of both common structural factors and national particularities. This mixed structure makes it possible to test long-term equilibrium relationships through econometric models, as well as to capture nonlinear interactions and heterogeneous effects through machine learning methods. Thus, the analysis carried out on the SPRING-F group contributes to a more nuanced understanding of the European energy transition and offers relevant implications for the formulation of differentiated public policies depending on the level of economic and energy development.
Table 1 summarizes the main economic and sustainability characteristics of the countries included in the SPRING-F group, highlighting clear structural differences between the European sub-regions analyzed. The economies of North-Western Europe (the Netherlands, Germany, and France) are characterized by a high level of economic development, an advanced innovative capacity, and a deep integration in international trade, aspects that are reflected in a faster and more coherent progress of the energy transition. The countries of Southern Europe (Spain and Italy) occupy an intermediate position, with diversified economies and a growing adoption of renewable sources, but with different rates of energy efficiency improvement. In contrast, the economies of Central and Eastern Europe (Poland and Romania) are in a slower structural transition process, marked by a higher dependence on fossil fuels and higher levels of energy intensity. These differences justify the comparative approach adopted in the study and provide an explanatory framework for the heterogeneity of the empirical results obtained subsequently.
Table 2 presents the variables used in the empirical analysis, including energy, economic, technological, and structural indicators. The selected variables capture key dimensions of the energy transition, such as renewable energy adoption, energy efficiency, emissions, economic development, urbanization, trade openness, and innovation capacity. Although the analyzed panel includes a limited number of cross-sectional units, the extended temporal dimension (2000–2024) allows the identification of dynamic relationships and long-term adjustment mechanisms. The specialized literature specifies that the panel ARDL model is appropriate for such data structures, being frequently used in macroeconomic and energy analyses with similar structures [87,88,89]. The ARDL model is based on temporal dynamics [90], not on estimators that rely on cross-sectional asymptotic models. Moreover, the ML component has an important complementary role because it is not based on classical asymptotic assumptions. This allows the assessment of the stability of the relationships through predictive performance and interpretability (SHAP). Apart from the variables GDP, TRD, and URB, which have complete data sets, for variables for which official data present a reporting gap, the values for the years 2023–2024 have been approximated using the average of the last three previously available years. This conservative imputation procedure reduces the influence of annual fluctuations and avoids the introduction of artificial dynamics or modelled forecasts. Our chosen method does not involve extrapolation or estimation based on predictive models, but represents a stable approximation, applied uniformly for all countries analyzed.
To analyze the dynamic relationships between the energy transition and its determinants within the SPRING-F group, the study uses the panel ARDL model. This method is appropriate in the context of panel analyses with relatively short time series and allows for the simultaneous estimation of long-term and short-term effects [89], even when the variables have different orders of integration, respectively, I(0) and I(1), provided that none of them is integrated at the second order [91]. The general form of the panel ARDL model used can be expressed as follows, according to Equation (1):
R N E C i t = ϕ i R N E C i ,   t 1 β 1 E I P E i ,   t 1 β 2 C O 2 i , t 1 β 3 G D P i ,   t 1 β 4 T R D i , t 1 β 5 U R B i , t 1 β 6 R D E i , t 1 + j = 1 p 1 γ i j Δ R N E C i , t j + k = 0 q 1 δ i k Δ X i , t k + ε i t
where in Equation (1), X is the vector of explanatory variables, ϕ i is the error correction coefficient (ECT), and ε i t is the error term. The coefficient ϕ i must be negative and statistically significant to confirm the existence of a long-run equilibrium relationship.
Although it is well known that the energy transition is a multidimensional process, RNEC is used as the main dependent variable due to its ability to reflect the effective adoption of renewable sources in the energy mix. Renewable energy consumption is frequently used in specialized literature as a central proxy of the energy transition because it captures the final result of decarbonization policies and investments in green technologies [92,93].
Before estimating the panel ARDL model, unit root tests for panel data, namely Levin–Lin–Chu (LLC), Im–Pesaran–Shin (IPS) and ADF–Fisher, are applied to verify the stationarity properties of the analyzed series. The LLC test assumes the existence of a common unit root across all cross-sections, being more restrictive, but offering high statistical power in homogeneous samples [94]. In contrast, the IPS test allows for heterogeneity between cross-section units, accepting that each country has its own adjustment parameter, which makes it more suitable for comparative analyses between different economies [95]. The ADF–Fisher test combines the statistics of the individual Augmented Dickey–Fuller tests for each country into an aggregate panel statistic, providing a flexible and robust approach for detecting non-stationarity [96,97].
The panel ARDL model allows the identification of (i) long-term equilibrium relationships, through the β coefficients; (ii) short-term dynamics through the differentiated variables; and (iii) the speed of adjustment towards equilibrium, through the ECT coefficient. A significant ECT coefficient indicates that deviations from long-term equilibrium are progressively corrected over time.
The ARDL panel estimation assumes the existence of a common long-term relationship between the analyzed variables, a hypothesis considered appropriate in the context of the SPRING-F group. The countries included in this group are integrated into a relatively homogeneous policy framework, given their membership in the EU, common decarbonization objectives and a similar set of regulations regarding the energy transition. For example, the European Green Deal [98] has as main pillars (i) renewable energy and efficiency; (ii) carbon pricing; (iii) circular economy; and (iv) clean industry and transport. In this context, the hypothesis of a long-term common structural mechanism is justified from an economic and institutional perspective. At the same time, this approach does not imply complete homogeneity in the adjustment dynamics or the intensity of the effects. Differences between countries in terms of development level, energy mix structure or innovation capacity can generate significant variations in the magnitude and shape of the estimated relationships. To capture these differences, cross-national heterogeneity is analyzed complementary through the machine learning component, where SHAP techniques allow the assessment of the importance of variables at the global and country levels. This approach provides a granular perspective on structural differences between economies, without compromising the stability of econometric estimates in a sample with a reduced cross-sectional size. Given the small number of cross-sectional units, the use of completely heterogeneous methods, such as Mean Group or common factor estimators, could lead to unstable estimates and significant losses of statistical power. Therefore, the hybrid framework proposed in our study represents a methodological compromise between econometric rigor and capturing heterogeneity relevant for energy transition analysis.
To complement the econometric analysis and assess the predictive capacity of the relationships between energy, economic and technological variables, the study uses three representative machine learning algorithms: Random Forest, Extreme Gradient Boosting (XGBoost) and ElasticNet. This combination allows for the comparison of the performance of nonlinear models with a penalized linear model, used as a reference. The selection of ML models follows a representative strategy. ElasticNet is used as a regularized linear model. It is considered the baseline and provides a transparent framework for comparison [99]. Random Forest and XGBoost are selected as nonlinear ensemble models [100], frequently used in applied studies in economics and energy [101,102,103]. They have the ability to capture complex interactions and nonlinear effects in medium-sized data sets. The hyperparameters of all ML models were set ex ante, based on values commonly adopted in the literature, and kept constant throughout the analysis. No extensive optimization or automatic tuning of the hyperparameters was applied, precisely to avoid the risk of overfitting in a panel sample with a reduced cross-sectional size and to ensure the robustness and comparability of the results.
To evaluate the predictive performance of ML models, the sample was divided into a training set and a testing set, using a strictly temporal strategy. Observations corresponding to the initial period were included in the training set, and observations from the final period were reserved exclusively for out-of-sample testing. This approach avoids mixing information over time and reflects a realistic forecasting scenario in the case of panel data with a reduced cross-sectional size. Country identifiers were not included as explanatory variables to prevent capturing hidden fixed effects and overestimating predictive performance. Also, lagged variables were not used in the machine learning models, as temporal dynamics are explicitly treated in the Panel ARDL model, and the role of ML is to capture nonlinear relationships and assess the relative importance of determinants.
Random Forest is an ensemble algorithm based on building a large number of decision trees, each estimated on a bootstrap sample of the data and a random subset of explanatory variables. The final prediction is obtained by averaging the individual predictions of the trees. This approach reduces the risk of overfitting and allows for capturing nonlinear relationships and complex interactions between variables [104,105,106]. In this study, Random Forest is used to identify the dominant drivers of renewable energy consumption and to assess the relative importance of the explanatory variables.
XGBoost is a gradient boosting algorithm that sequentially builds decision trees, with each new tree estimated to correct the prediction errors of previous models. The algorithm integrates regularization mechanisms that improve model stability and predictive performance, and is recognized for its efficiency in capturing nonlinear relationships and variable marginal effects [107,108,109]. In the study, XGBoost is used to obtain robust predictions and to analyze the heterogeneity of the effects of variables on the energy transition.
ElasticNet is a penalized linear regression model that combines LASSO (L1) and Ridge (L2) penalties. This combination allows for both the selection of relevant variables and a reduction in multicollinearity issues [110,111,112]. ElasticNet is used as a linear benchmark model, providing a benchmark against which to compare the performance of nonlinear models and highlighting the limitations of strictly linear approaches in energy transition analysis.
The performance of the models is evaluated using standard prediction metrics, namely R2, Root Mean Squared Error (RMSE), and Mean Absolute Error (MAE). Comparing these metrics allows identifying the model with the best predictive capacity and highlighting the advantages of nonlinear approaches over the penalized linear model.
To ensure the interpretability of the black-box models, the study uses the SHapley Additive exPlanations (SHAP) method [113,114]. This allows for the quantification of the contribution of each explanatory variable to the model prediction, both at the aggregate and individual levels, facilitating the identification of key drivers of the energy transition and differences between countries.
In this study, panel ARDL models and ML algorithms are used in a complementary, not redundant, manner. Panel ARDL is used to identify the long- and short-term relationships between the energy transition and its main determinants, providing economic interpretability, elasticities, and adjustment mechanisms. In contrast, the machine learning component is designed to extend these results by capturing nonlinear relationships, asymmetric effects, and the relative importance of variables in a predictive framework. Furthermore, the use of SHAP-based interpretability techniques allows for a detailed analysis of the contribution of each variable at the global and country levels, which cannot be obtained directly from the average coefficients of a panel econometric model. Thus, the machine learning component does not function as a simple validation tool, but as an analytical mechanism that reveals the structural heterogeneity and nonlinearities of the energy transition process within the SPRING-F group.
Thus, by integrating the two approaches, the hybrid framework proposed in our study offers both econometric rigor and analytical flexibility. It also contributes to a more complex understanding of the dynamics of the energy transition.

4. Results

4.1. Exploratory Data Analysis

The descriptive statistics in Table 3 highlight both the relative levels of the variables within the SPRING-F group, as well as the dispersion and shape of their distribution. To reduce problems related to sharp fluctuations and non-stationarity of economic and environmental time series, all variables were transformed into natural logarithms, this procedure stabilizing the variation, diminishes the influence of extreme values, and improves the interpretability of econometric results [115,116,117]. As for RNEC, the logarithmic values show a moderate mean and relatively low variability, suggesting a convergence between countries in terms of the share of renewable energy. EIPE and CO2 present small standard deviations and relatively narrow ranges, reflecting moderate differences in energy efficiency and climate performance. GDP has the largest relative variation among the logarithmic indicators, indicating structural economic disparities between the analyzed countries.
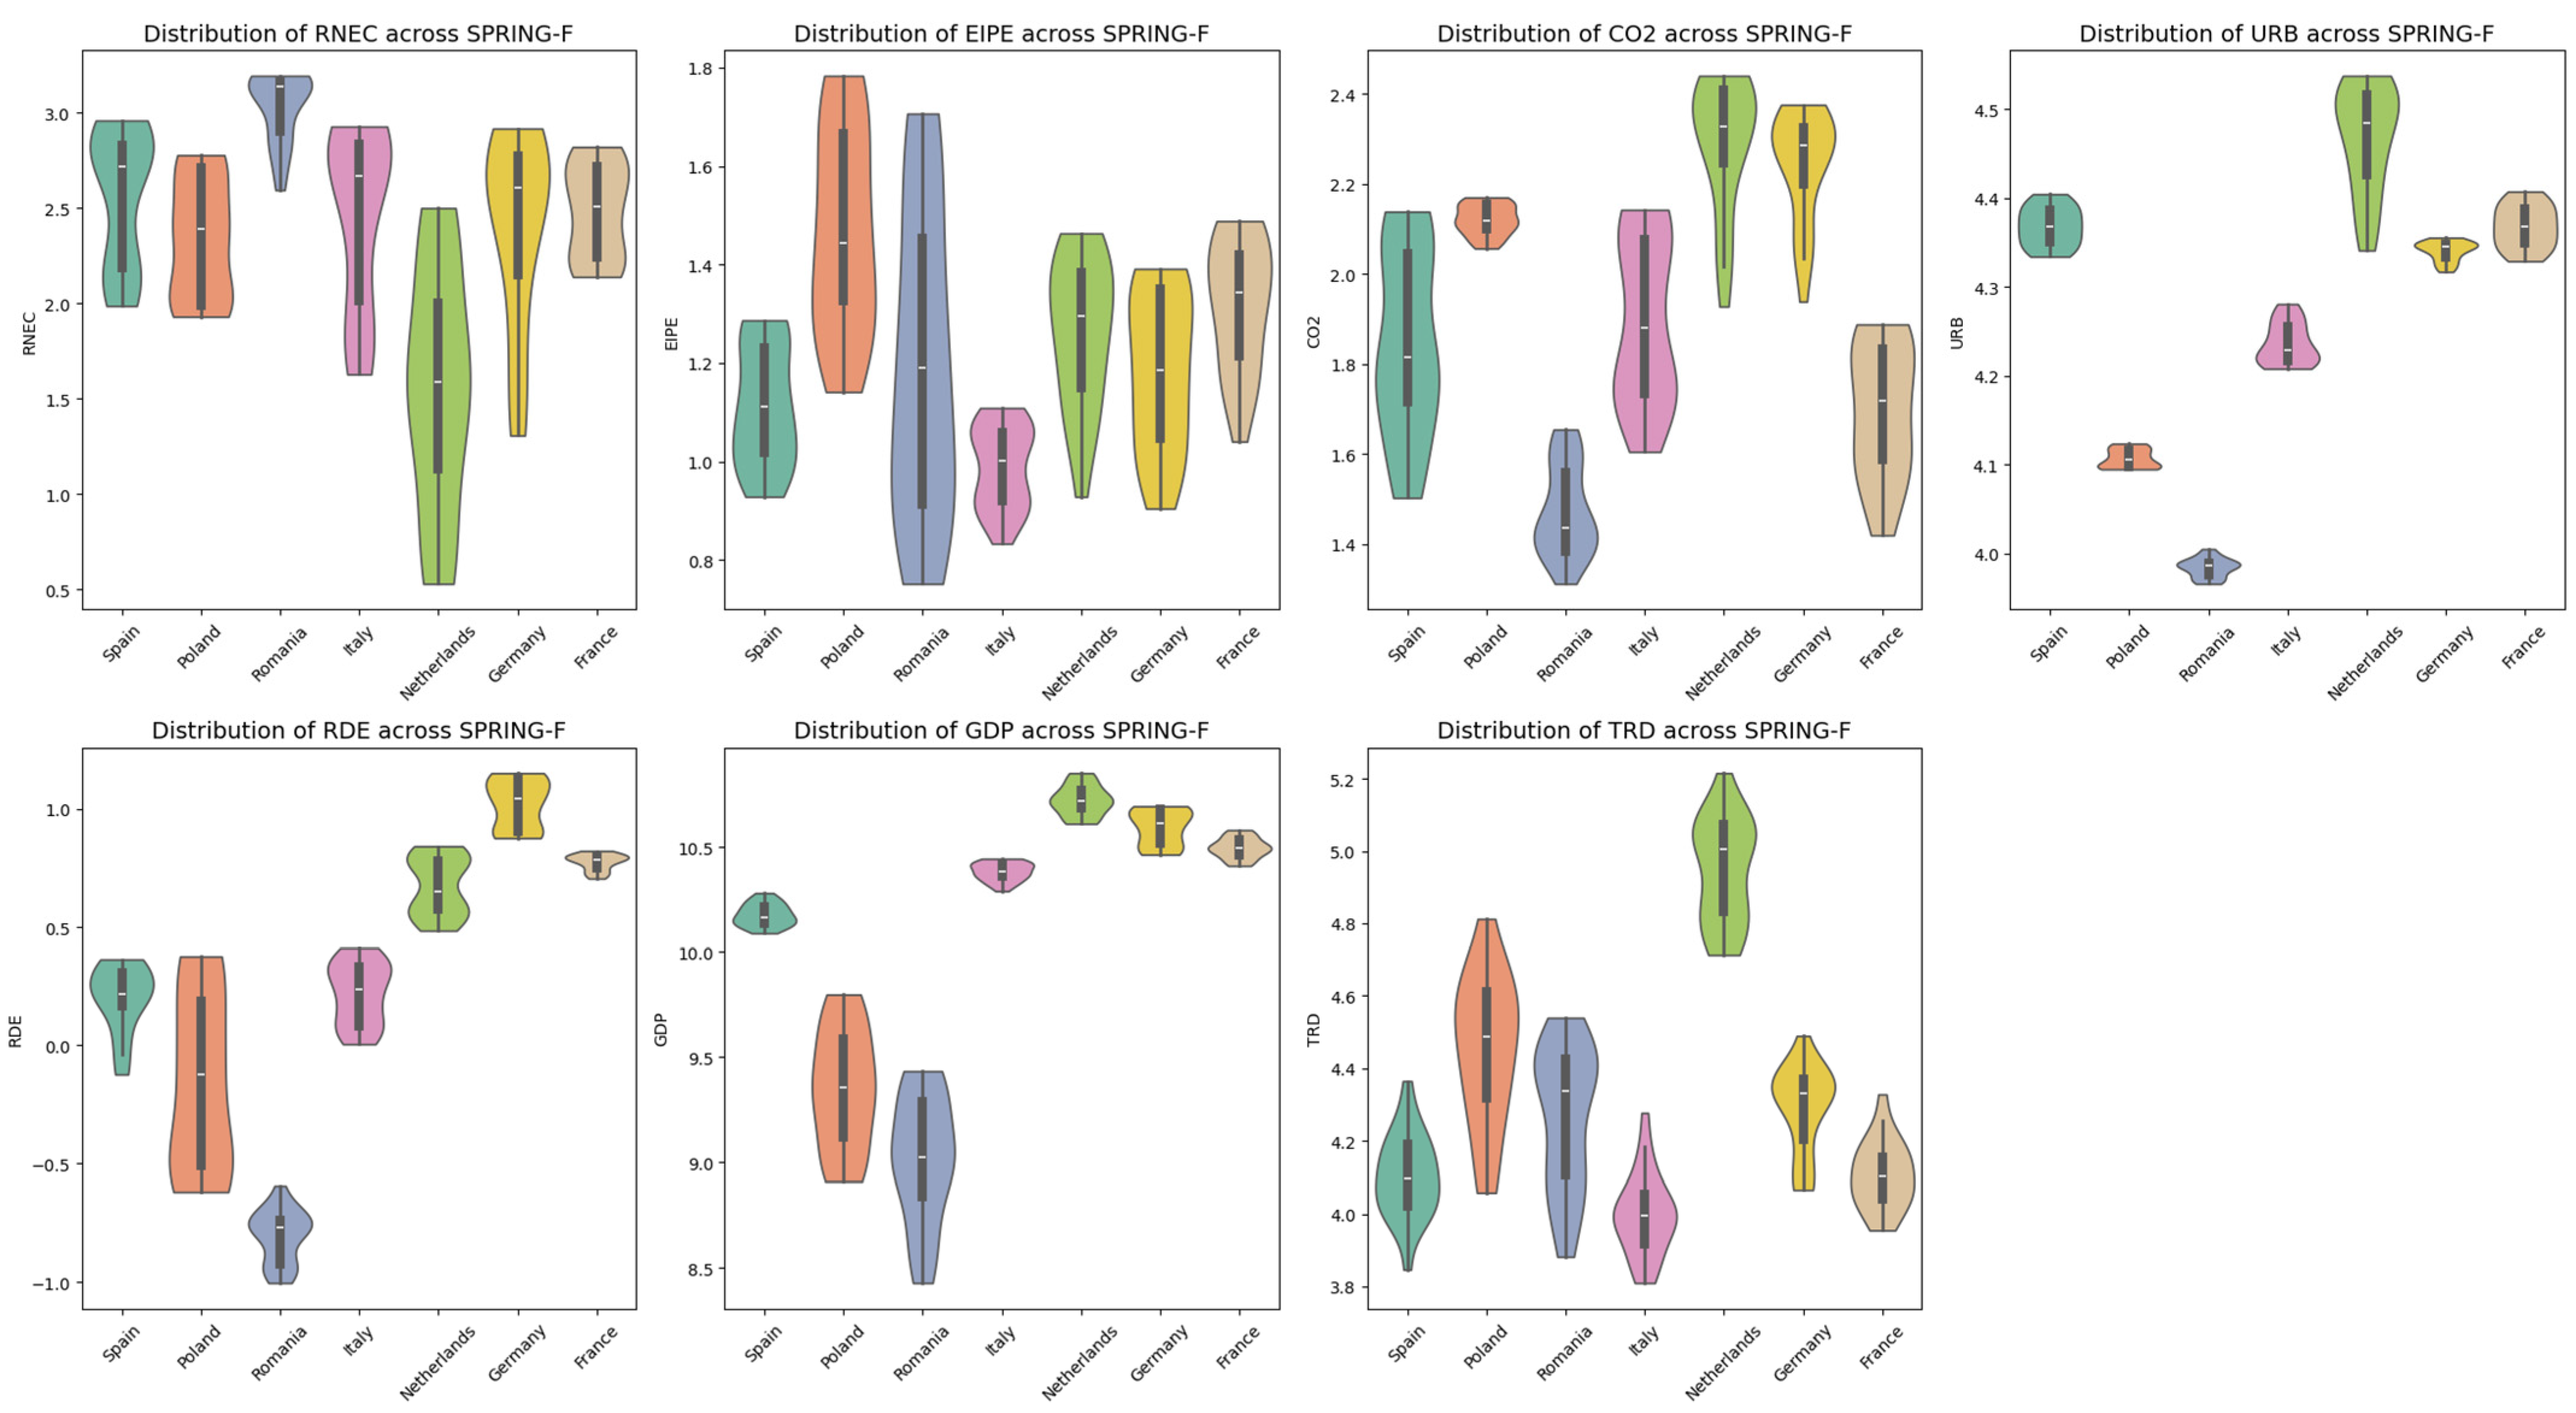
The violin plots in Figure 1 highlight clear structural differences between SPRING-F countries for all variables analyzed (log-transformed). The Netherlands, Germany, and France show consistently high levels of renewable energy consumption, R&D investment, GDP per capita, and trade openness, reflecting mature economies that are strongly integrated in the energy transition. Spain and Italy are positioned in an intermediate zone, with stable but less pronounced distributions. In contrast, Romania and Poland have low and often more dispersed distributions for most indicators—high energy intensity, low urbanization, low levels of R&D, volatile emissions, and modest trade openness—signaling structural gaps with Western European countries. Overall, the violin plots show the existence of two distinct blocs within SPRING-F. On the one hand, we observe advanced economies that are supporting a mature energy transition. On the other hand, there are also emerging economies, where progress remains slower and more uneven.
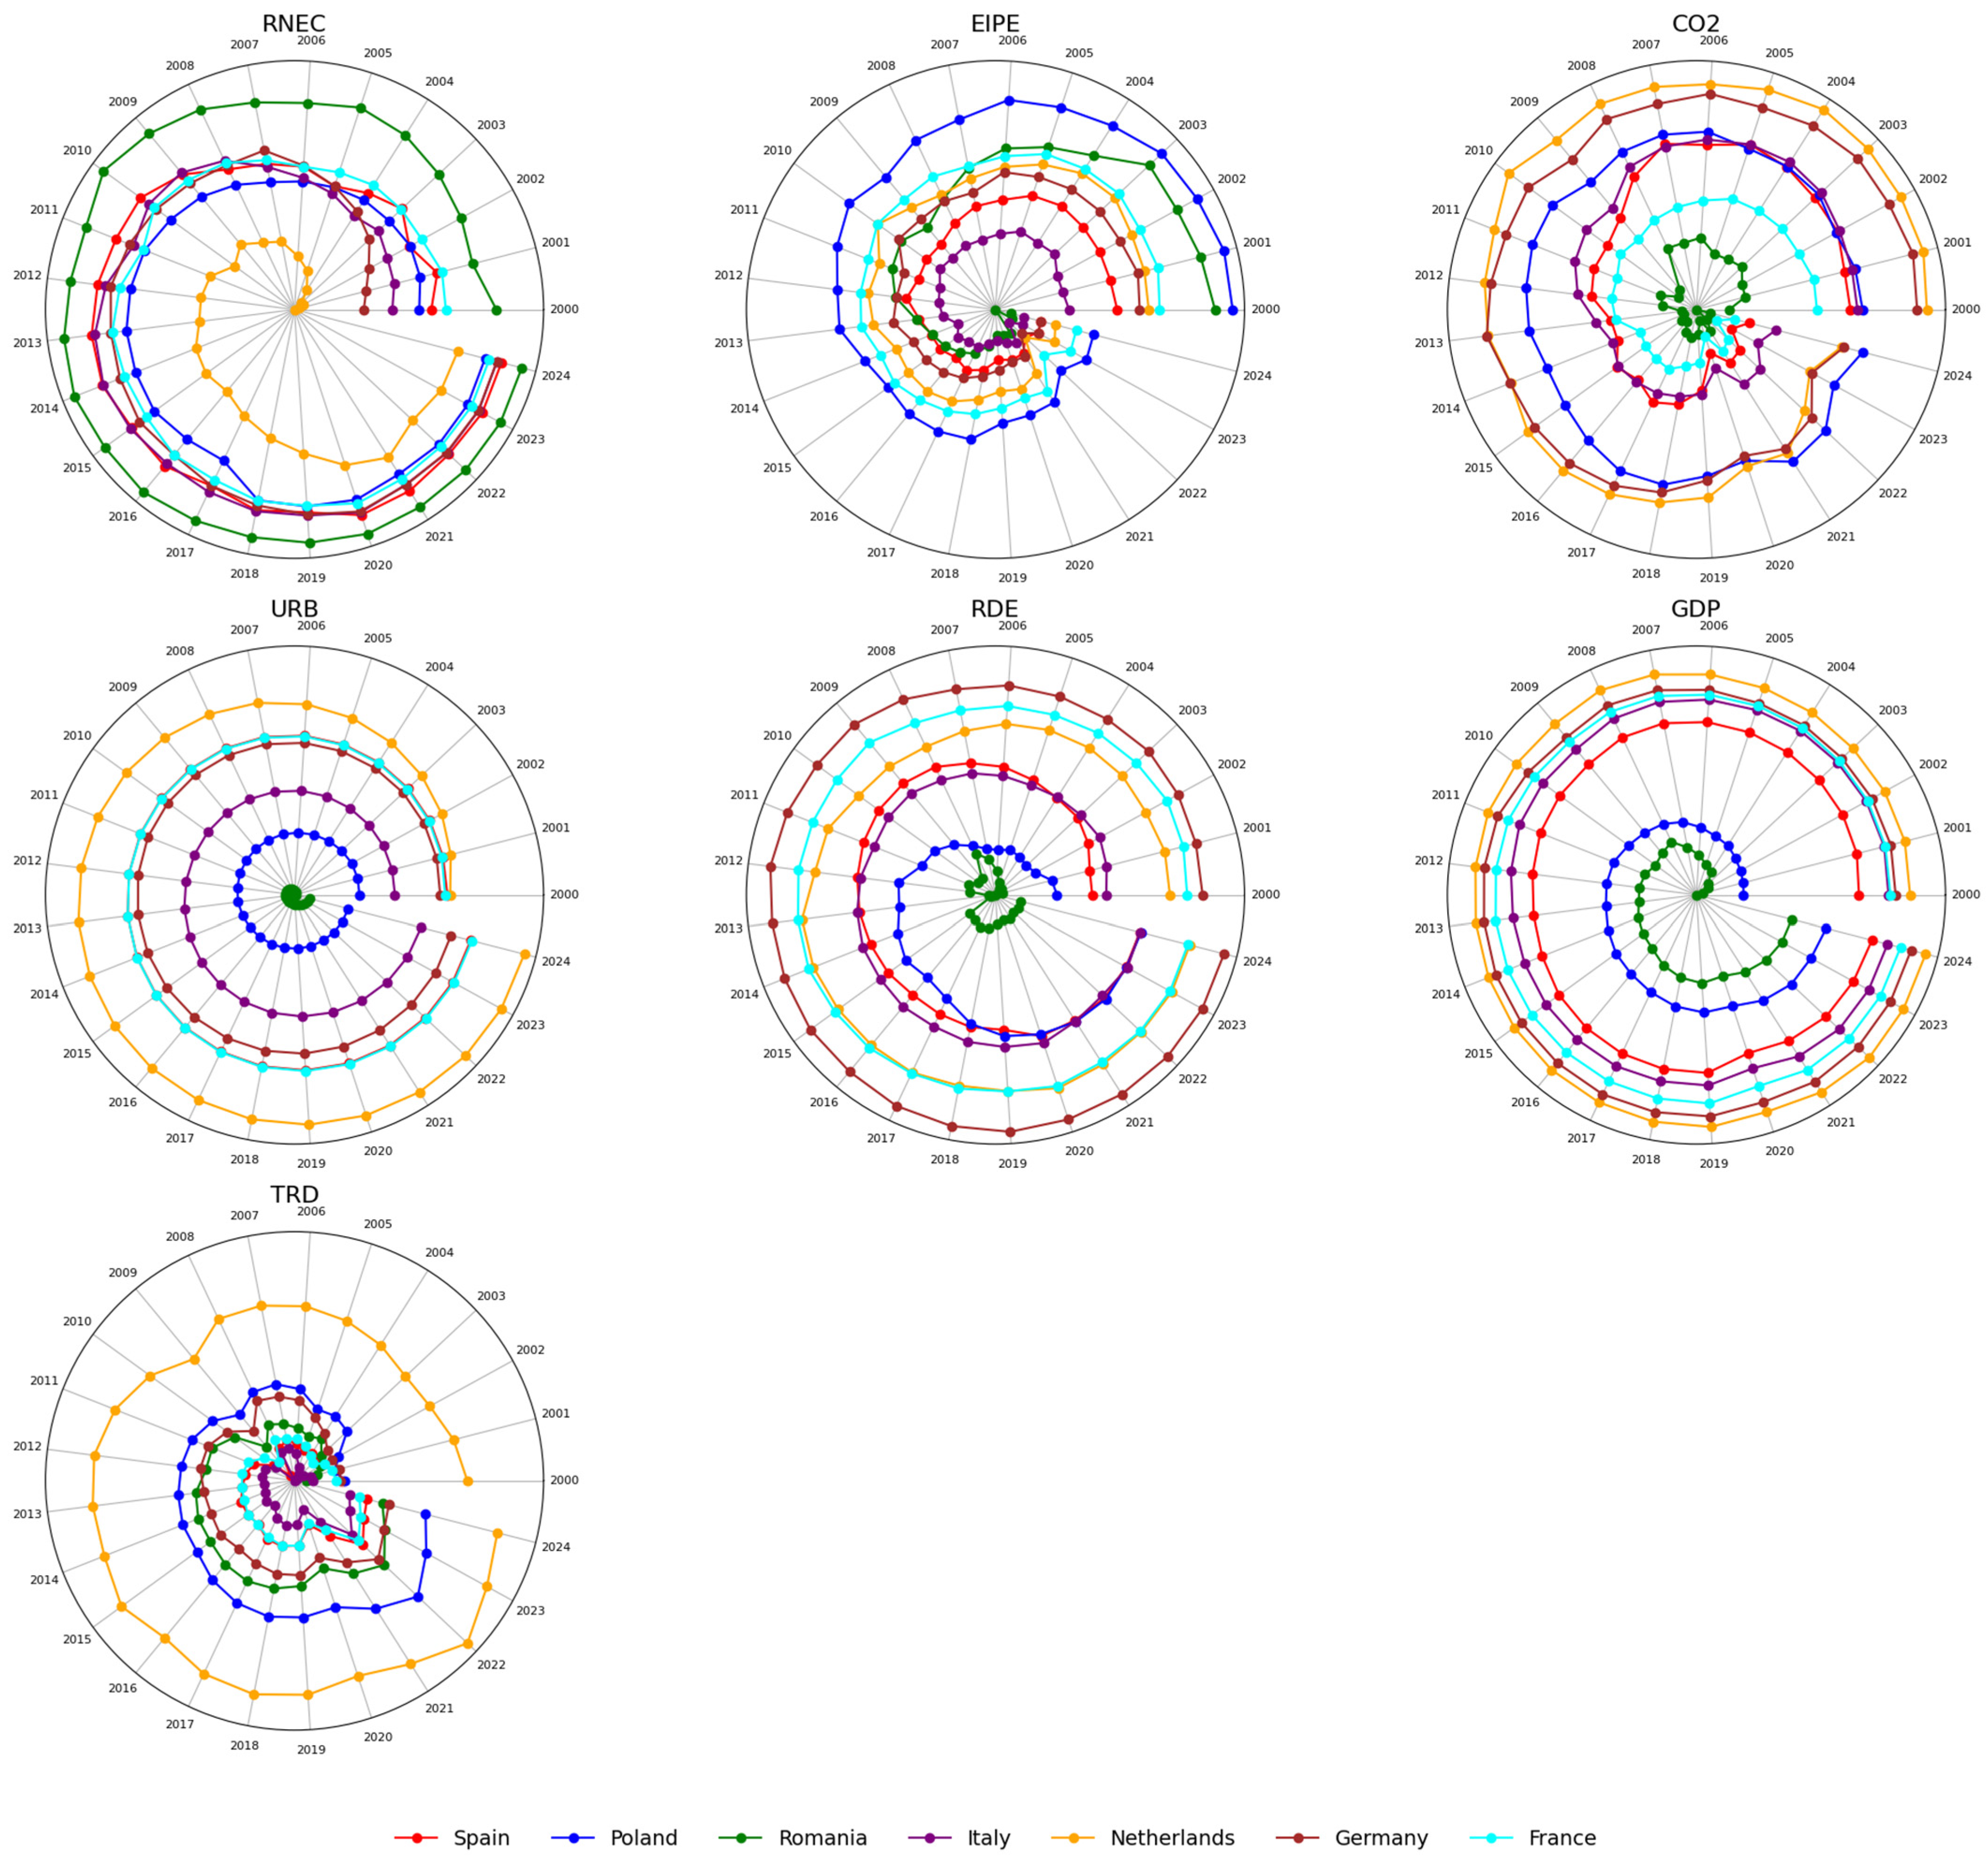
In Figure 2, we can see the evolution of the energy-economic indicators for the countries in the SPRING-F group during the analyzed period. The representation allows an intuitive visualization of the dynamics over time. We note that the RNEC suggests an accelerated energy transition, based on consistent investments in green resources in the Netherlands, Germany, and France. For Italy and Spain, the pace, although constant, is moderate. On the other hand, Poland and Romania remain visibly behind, which suggests greater structural dependencies on fossil fuels. Regarding the EIPE, persistent levels of energy inefficiency can be observed in Romania and Poland, while the countries of the Netherlands, Germany, and France show much more compact trajectories. This suggests that in Western countries, efficiency is higher and energy systems are modernized.
Moving further with the analysis, we note that in terms of CO2 emissions, the downward convergence phenomenon is observed in Western European countries. Germany, France, the Netherlands, and Italy start from high values in 2000, but the spiral tightens sharply after 2010, reflecting the reduction in emissions through consistent decarbonization policies. Romania and Poland have lower values at the start, but their trajectories are irregular, and in the case of Poland, even oscillating, which indicates a slow and inconsistent reduction, closely linked to the persistence of carbon-intensive industry and the coal-based energy mix.
In terms of URB, Western economies exhibit large and almost concentric spirals—a stable and high pace of urbanization, with minimal variations over time. Romania and Poland have much more compact and less extensive spirals, which confirms the structural differences between advanced and emerging economies in CEE. The evolution of RDE investments highlights one of the strongest contrasts: Germany, the Netherlands, and France have large and progressive spirals, growing steadily from the beginning of the period to the present, which reflects massive investments in innovation and technology—the foundation of the energy transition and productivity growth. Romania and Poland remain, throughout the series, very close to the center, confirming low levels of innovation and low technological absorption capacity.
The dynamics of GDP per capita clearly highlight the convergence process: the seven economies start from very different positions, but all show a progressive expansion outwards. However, the pace is different: the Netherlands, Germany, and France remain constantly on large spirals (high levels of well-being), Italy has a moderate growth, and Poland and Romania show a noticeably smaller but rapidly expanding spiral, reflecting the recovery of the economic gaps of the last two decades.
The TRD indicator highlights clear structural differences in the trade openness of SPRING-F countries. The Netherlands, Germany, and France show the highest values, confirming their deep integration into European and global production and distribution chains, which facilitates rapid access to technologies and equipment for the energy transition. Spain and Italy have an intermediate level of openness, with a gradual increase over time. Romania and Poland record the lowest TRD values, reflecting a more domestic economic orientation and a lower connection to international trade; this may contribute to slower rates of adoption of green technologies and a more modest capacity to integrate external innovations into the energy transition process.
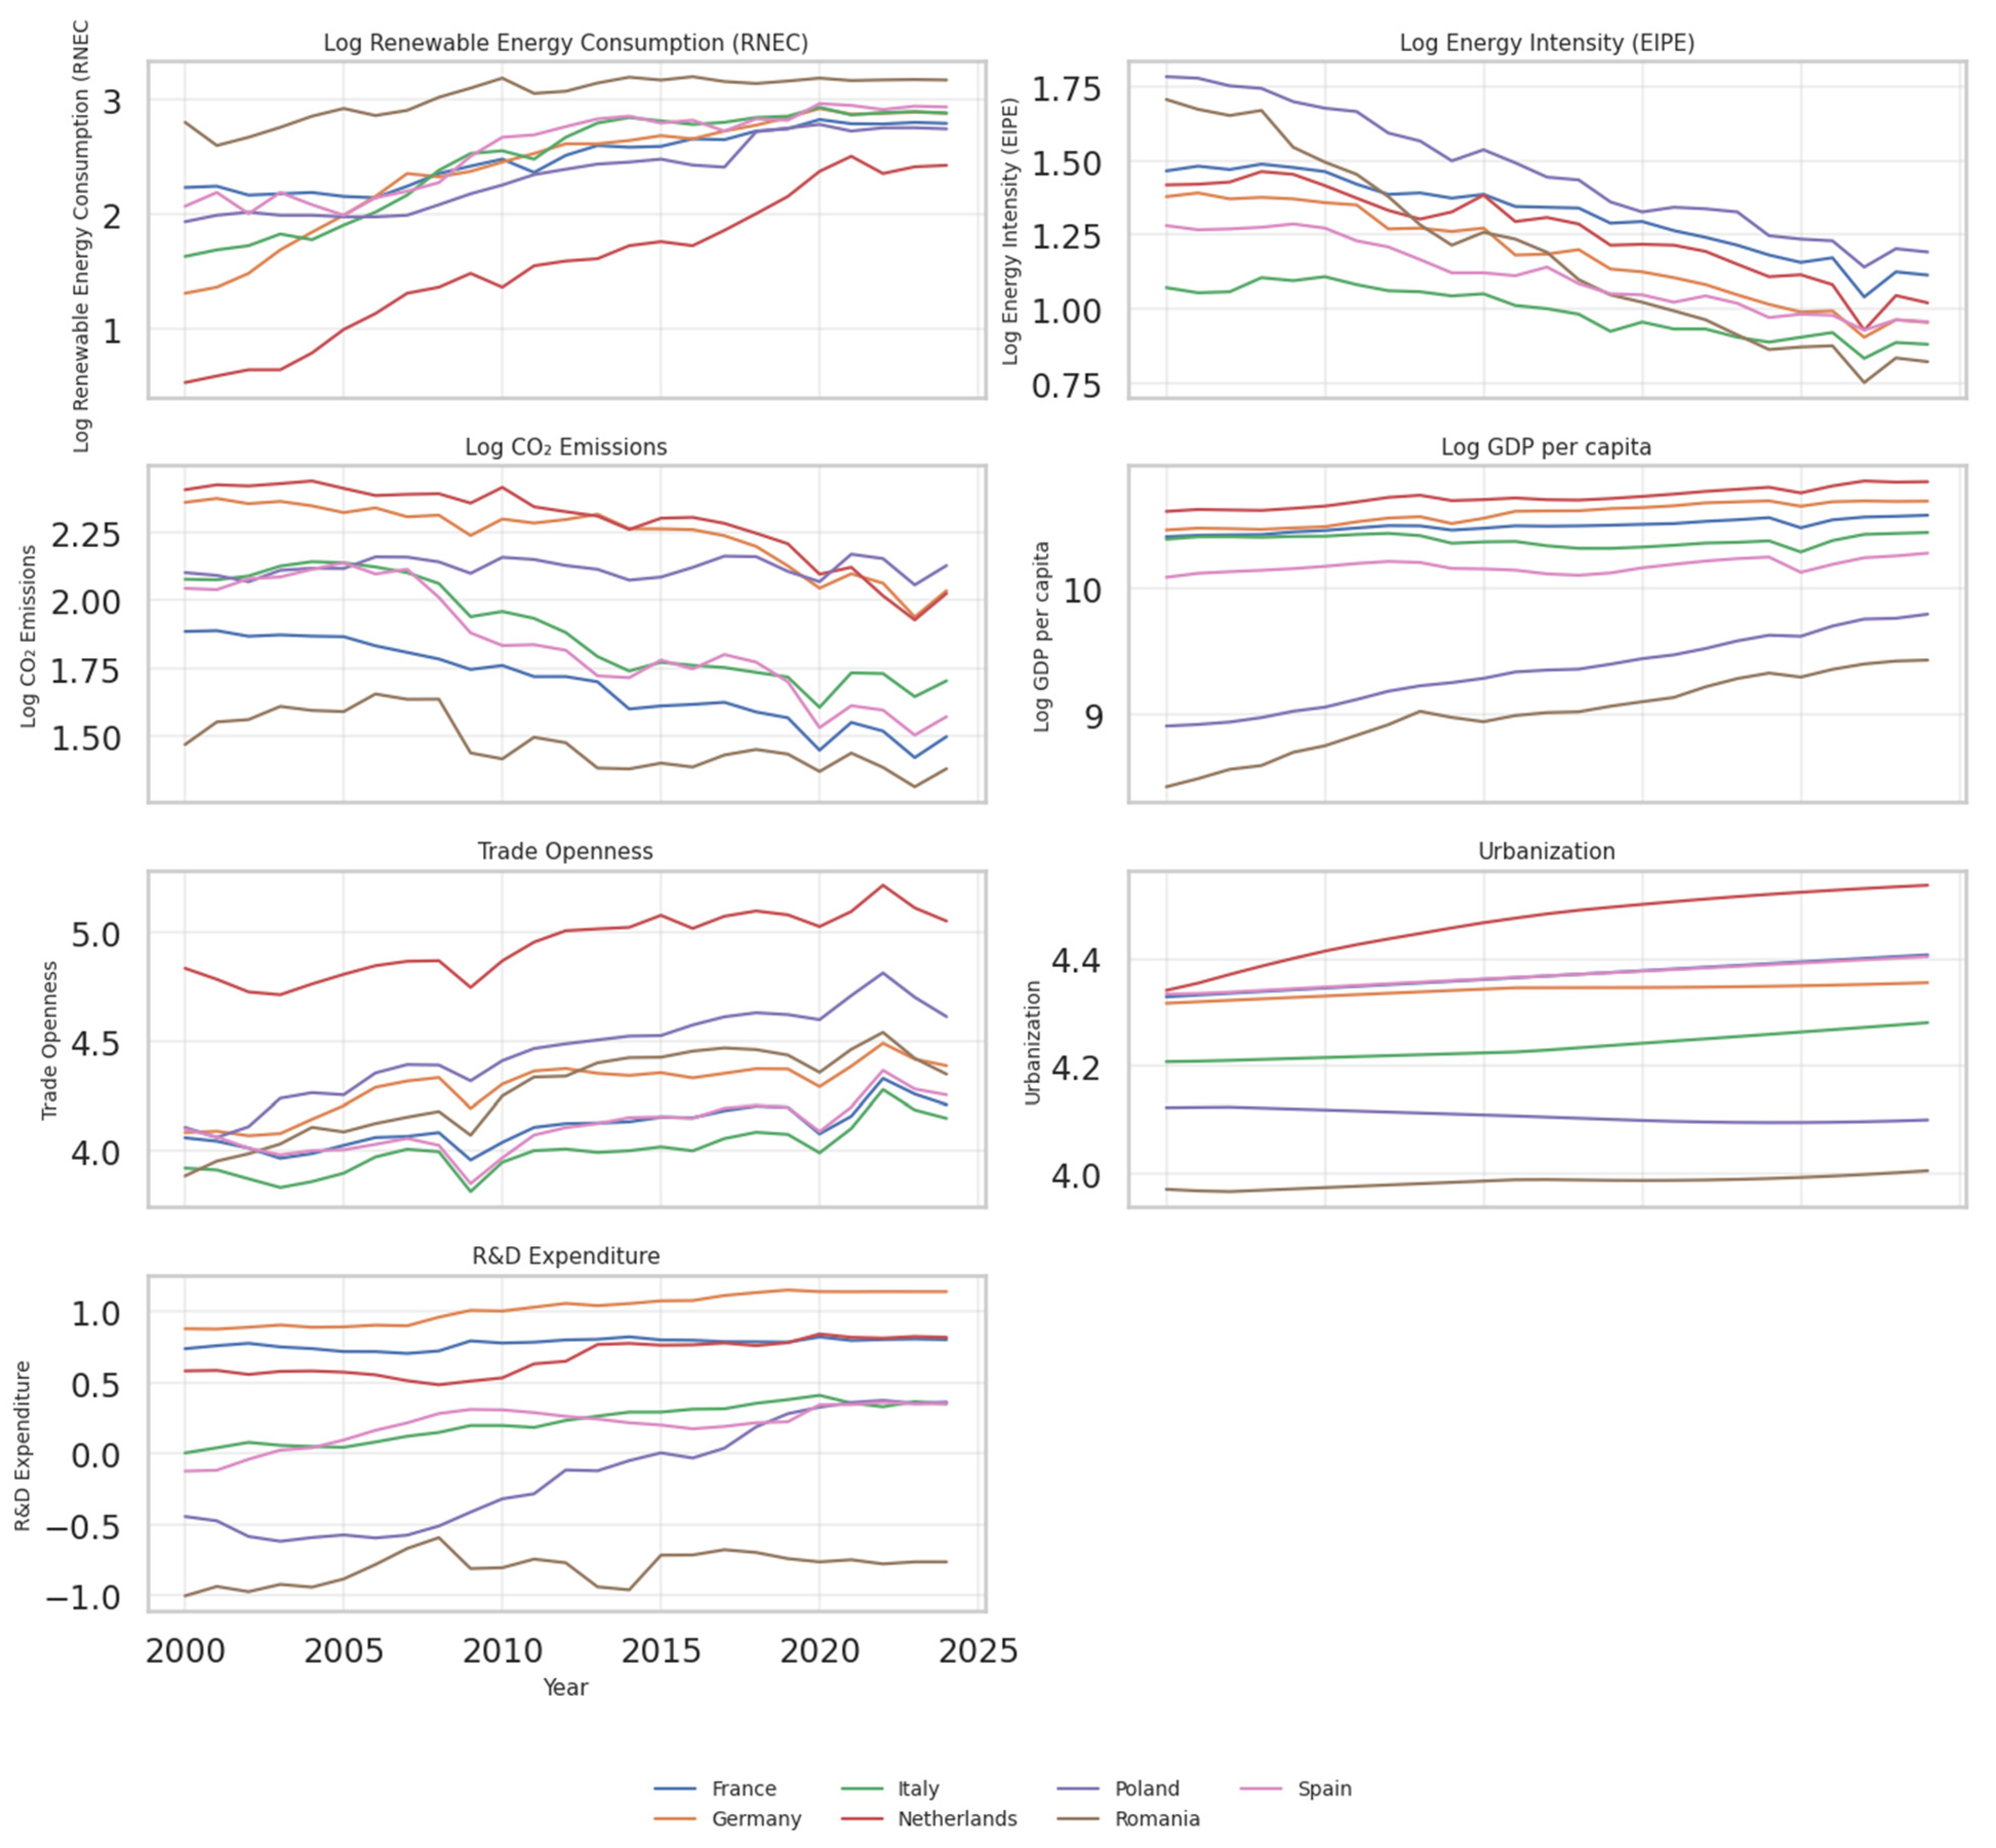
Overall, the figure highlights two distinct groups: Western European economies—characterized by high energy efficiency, emission reductions, high R&D investments, and strong progress in renewable energy—and emerging economies (Romania and Poland), where energy intensity remains high, emissions are slowly decreasing, R&D is low, and the energy transition is progressing at a moderate pace. The circular spirals thus capture, in an intuitive and elegant manner, the structural gaps, gradual convergence, and heterogeneity of energy dynamics within the SPRING-F group. Figure A1 in Appendix A provides standard time-series representations of all variables to complement the spiral plots and facilitate the visual inspection of convergence and divergence patterns.

4.2. Econometric Findings: ARDL Long-Run and Short-Run Dynamics

Table 4 presents the results of the stationarity tests, which are an important step before estimating the ARDL model. We observe that most variables exhibit non-stationary behavior at the level, but become stationary after the first differencing. At the level, the LLC test indicates the presence of a single root for all variables, except RNEC and TRD, which are significant already at the level. Individual unit root tests (IPS and ADF–Fisher) confirm the same trend: for most variables, the non-stationarity hypothesis cannot be rejected at the level, which suggests the presence of common trends over time within the countries in the SPRING-F group. After the first differencing, all tests consistently indicate stationarity at the 1% level, which demonstrates that the variables become integrated of order I, I(1). This mixed structure—a combination of I(0) and I(1) series—directly justifies the use of the ARDL model in the panel, as it can robustly handle variables with different integration orders, as long as none is I(2). Consequently, the tests confirm the suitability of the ARDL methodology for analyzing the short- and long-term dynamics of the energy transition in the SPRING-F countries.
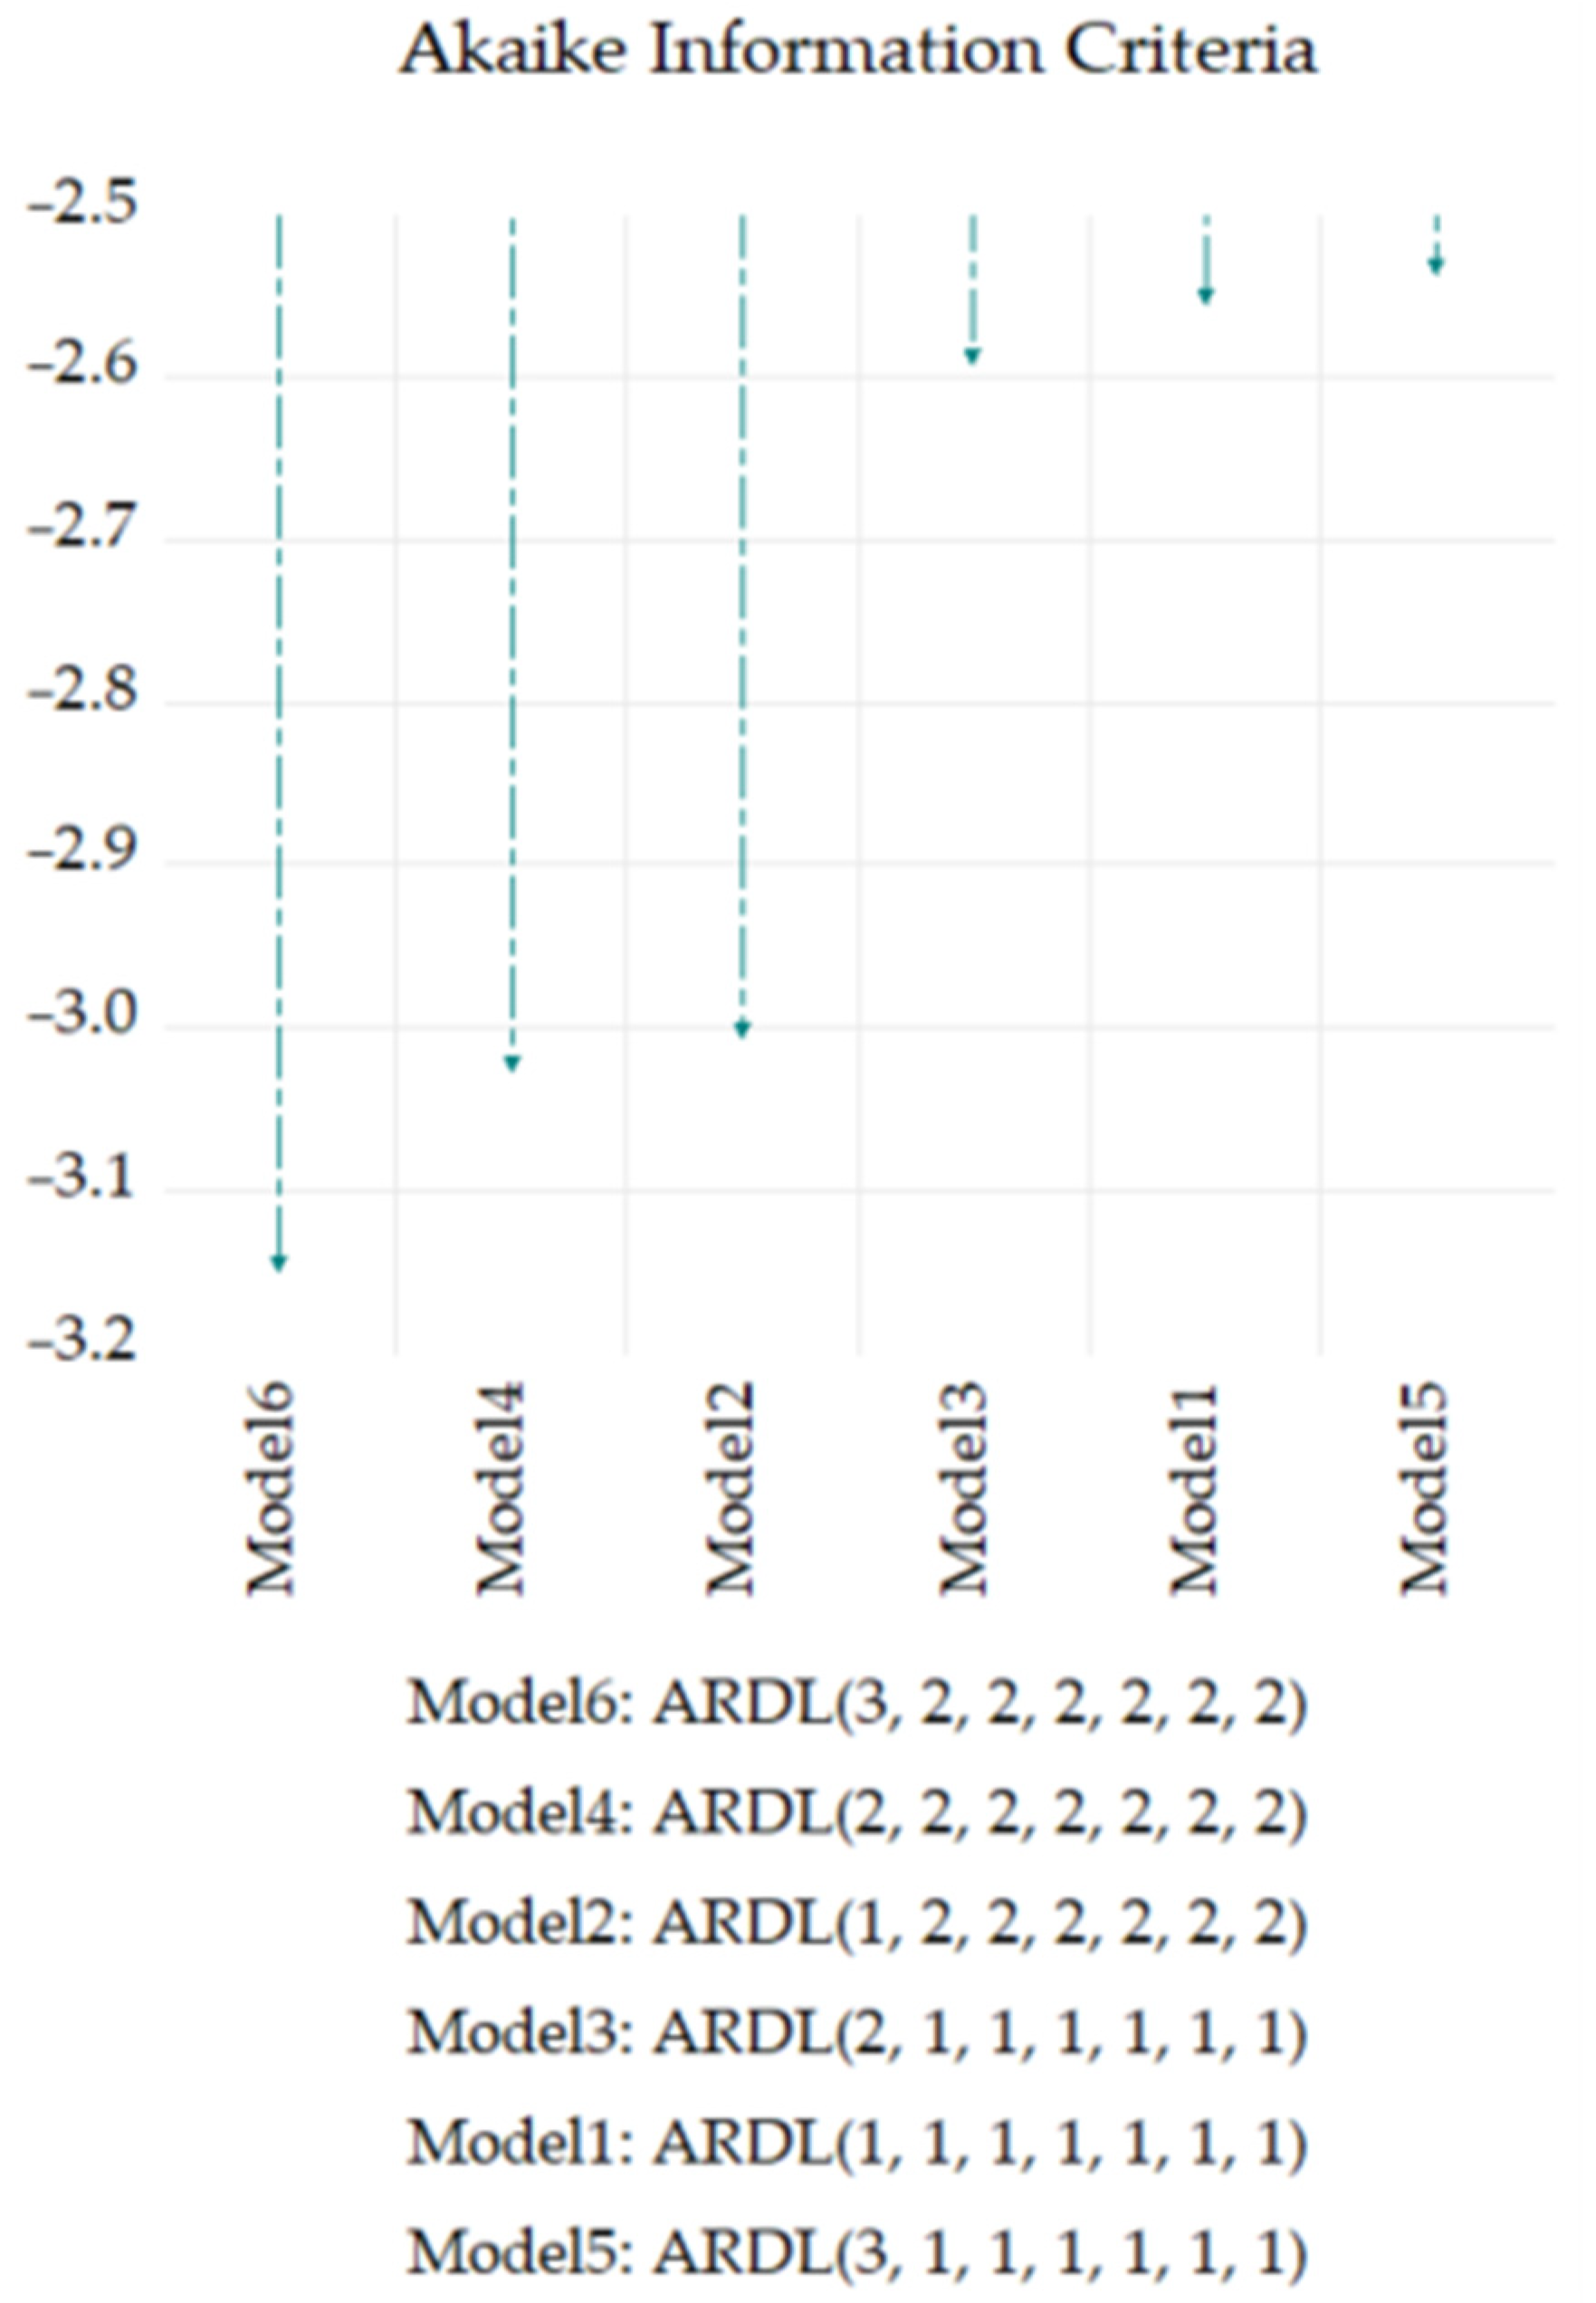
In order to construct the best-fitting ARDL model, the Akaike Information Criteria (AIC) was used to determine the appropriate lags. Several candidate specifications were estimated, with different combinations of lag orders for the dependent and explanatory variables, and the final model was chosen based on the lowest AIC value, as can be seen in Figure 3. This step is important because it reduces the risk of over-parameterization.
The results of the ARDL (3, 2, 2, 2, 2, 2, 2) model from Table 5 show how energy, economic, and technological indicators influence, in both the long and short term, the dynamics of renewable energy consumption in SPRING-F countries. Since all variables are expressed in logarithmic form, the coefficients in the long-term equation can be interpreted directly as elasticity. Thus, the results highlight a clear set of structural relationships. From the perspective of long-term dynamics, we observe that EIPE has a positive and significant coefficient (1.21). This suggests that a 1% increase in EIPE determines an approximately 1.2% increase in renewable energy use. From here, we can conclude that this effect indicates that energy-intensive economies are the ones that adopt renewable sources faster to compensate for their dependence on fossil fuels. Regarding CO2, it negatively influences RNEC, i.e., a 1% increase in CO2 leads to a 1.09% decrease in RNEC. This leads to the fact that countries with high emissions are still heavily dependent on conventional energy sources. We also observe that in the long run, TRD also has a negative, but statistically insignificant, effect. Within this model, we observe that URB has the strongest effect, indicating that urbanization can be considered a major determinant of the energy transition. We observe that a 1% increase in urbanization is associated with a 5.53% increase in renewable energy consumption. This aspect can most likely be explained by modernized infrastructure, energy efficiency and local environmental policies. The RDE sign, although statistically insignificant, indicates that investments in research can stimulate green energy, but there are differences between the countries in the SPRING-F group that attenuate the cumulative effect. Regarding economic growth, we observe that GDP positively influences RNEC. A 1% increase in GDP causes RNEC to increase by 2.61%, confirming the hypothesis in the literature regarding the decoupling between economic growth and emissions [118,119,120].
Regarding the short-term dynamics, the short-term equation includes both the immediate variations in the variables and the error correction coefficient. We note that the cointegration coefficient (ECT) is negative and statistically significant, which confirms the existence of a long-term equilibrium relationship. Its magnitude suggests that approximately 47% of the deviation from the long-term equilibrium is corrected in a single year, implying a moderately rapid convergence towards stable dynamics of the energy transition. The lag 1 of the RNEC variation is statistically significant at 10%, suggesting a self-regulation effect. Basically, sudden increases in RNEC are partially compensated for the following year. Regarding EIPE, the negative and statistically significant coefficient indicates that a rapid decrease in EIPE, hence better energy efficiency, causes an increase in RNEC in the same year. Also, RDE is statistically significant with a very strong effect. This suggests that investments in research and development have a strong but delayed effect, stimulating the growth of renewable energy one year after they are made. This is somewhat obvious because innovation and technology projects do not produce results instantly, but after an annual implementation cycle. The high values of the estimated coefficients for D(URB) and D(URB(−1)) in the short-run equation, accompanied by large standard errors and lack of statistical significance, reflect the extremely low annual variation in the degree of urbanization in the economies analyzed. Since urbanization is a slow structural process, the differentiation of logarithmic series leads to very small values of annual variations, which can generate numerically unstable coefficients, without economic relevance in the short run. Therefore, these results do not indicate specification or multicollinearity problems, but confirm that urbanization influences the energy transition predominantly in the long run, and not through annual adjustments.
From the perspective of model validation metrics, we observe that the ARDL model presents a very good adjustment, having an extremely low Root MSE (0.02), which indicates a small deviation between the estimated and observed values. Also, the S.E. of regression is identical to the standard deviation of the dependent variable (0.04), suggesting that the errors are well controlled and the model does not overestimate the variation. The low levels of the information criteria, AIC (−2.76), SC (−0.63), and HQC (−1.90), confirm that the selected model is efficient and does not suffer from overfitting, being preferred due to a good compromise between fidelity and simplicity. In addition, a high log-likelihood (360.23) supports the quality of the estimation and the robustness of the ARDL specification used.
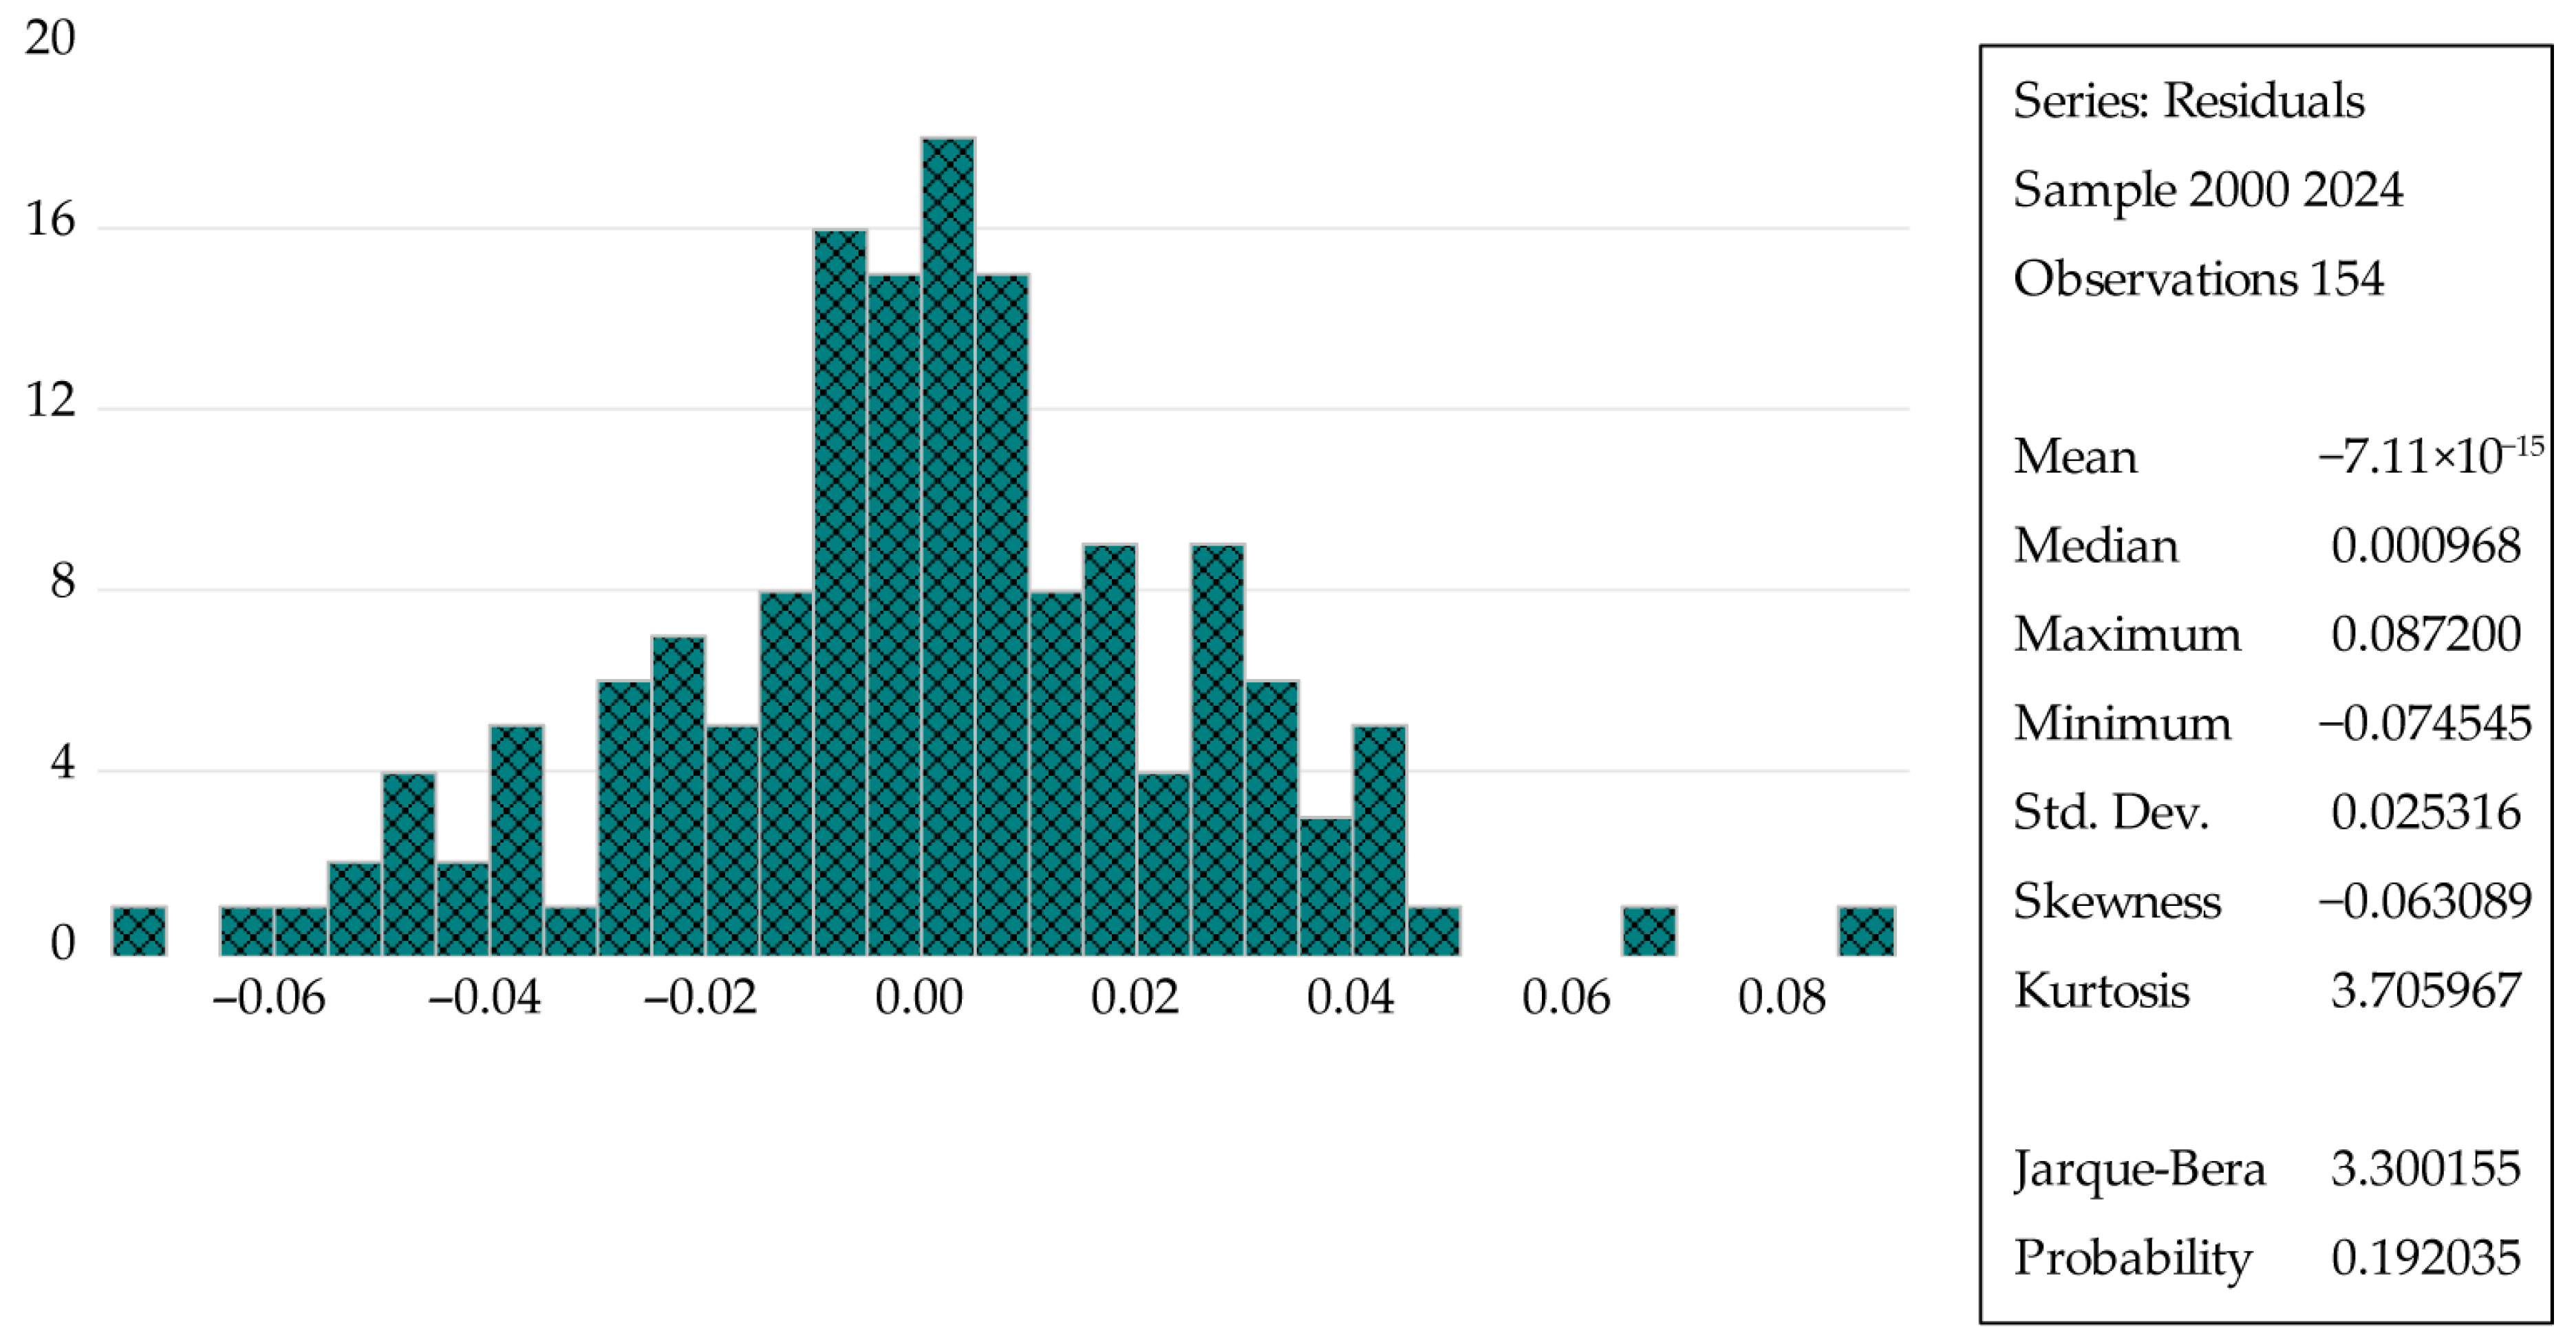
The histogram of the residuals from Figure 4 shows an approximately symmetrical distribution around zero, without major deviations or extreme tails, indicating that the model errors are well behaved. The mean of the residuals is practically zero, and the small value of the skewness coefficient (−0.06) confirms the absence of asymmetry. The kurtosis close to the reference value (approx. 3.7) suggests a moderately platykurtic distribution, but without severe problems. The Jarque–Bera test (JB = 3.30, p = 0.19) does not reject the normality hypothesis, meaning that the residuals can be considered compatible with a normal distribution. Overall, the residual diagnosis confirms the adequate specification of the ARDL model and the robustness of the estimation.
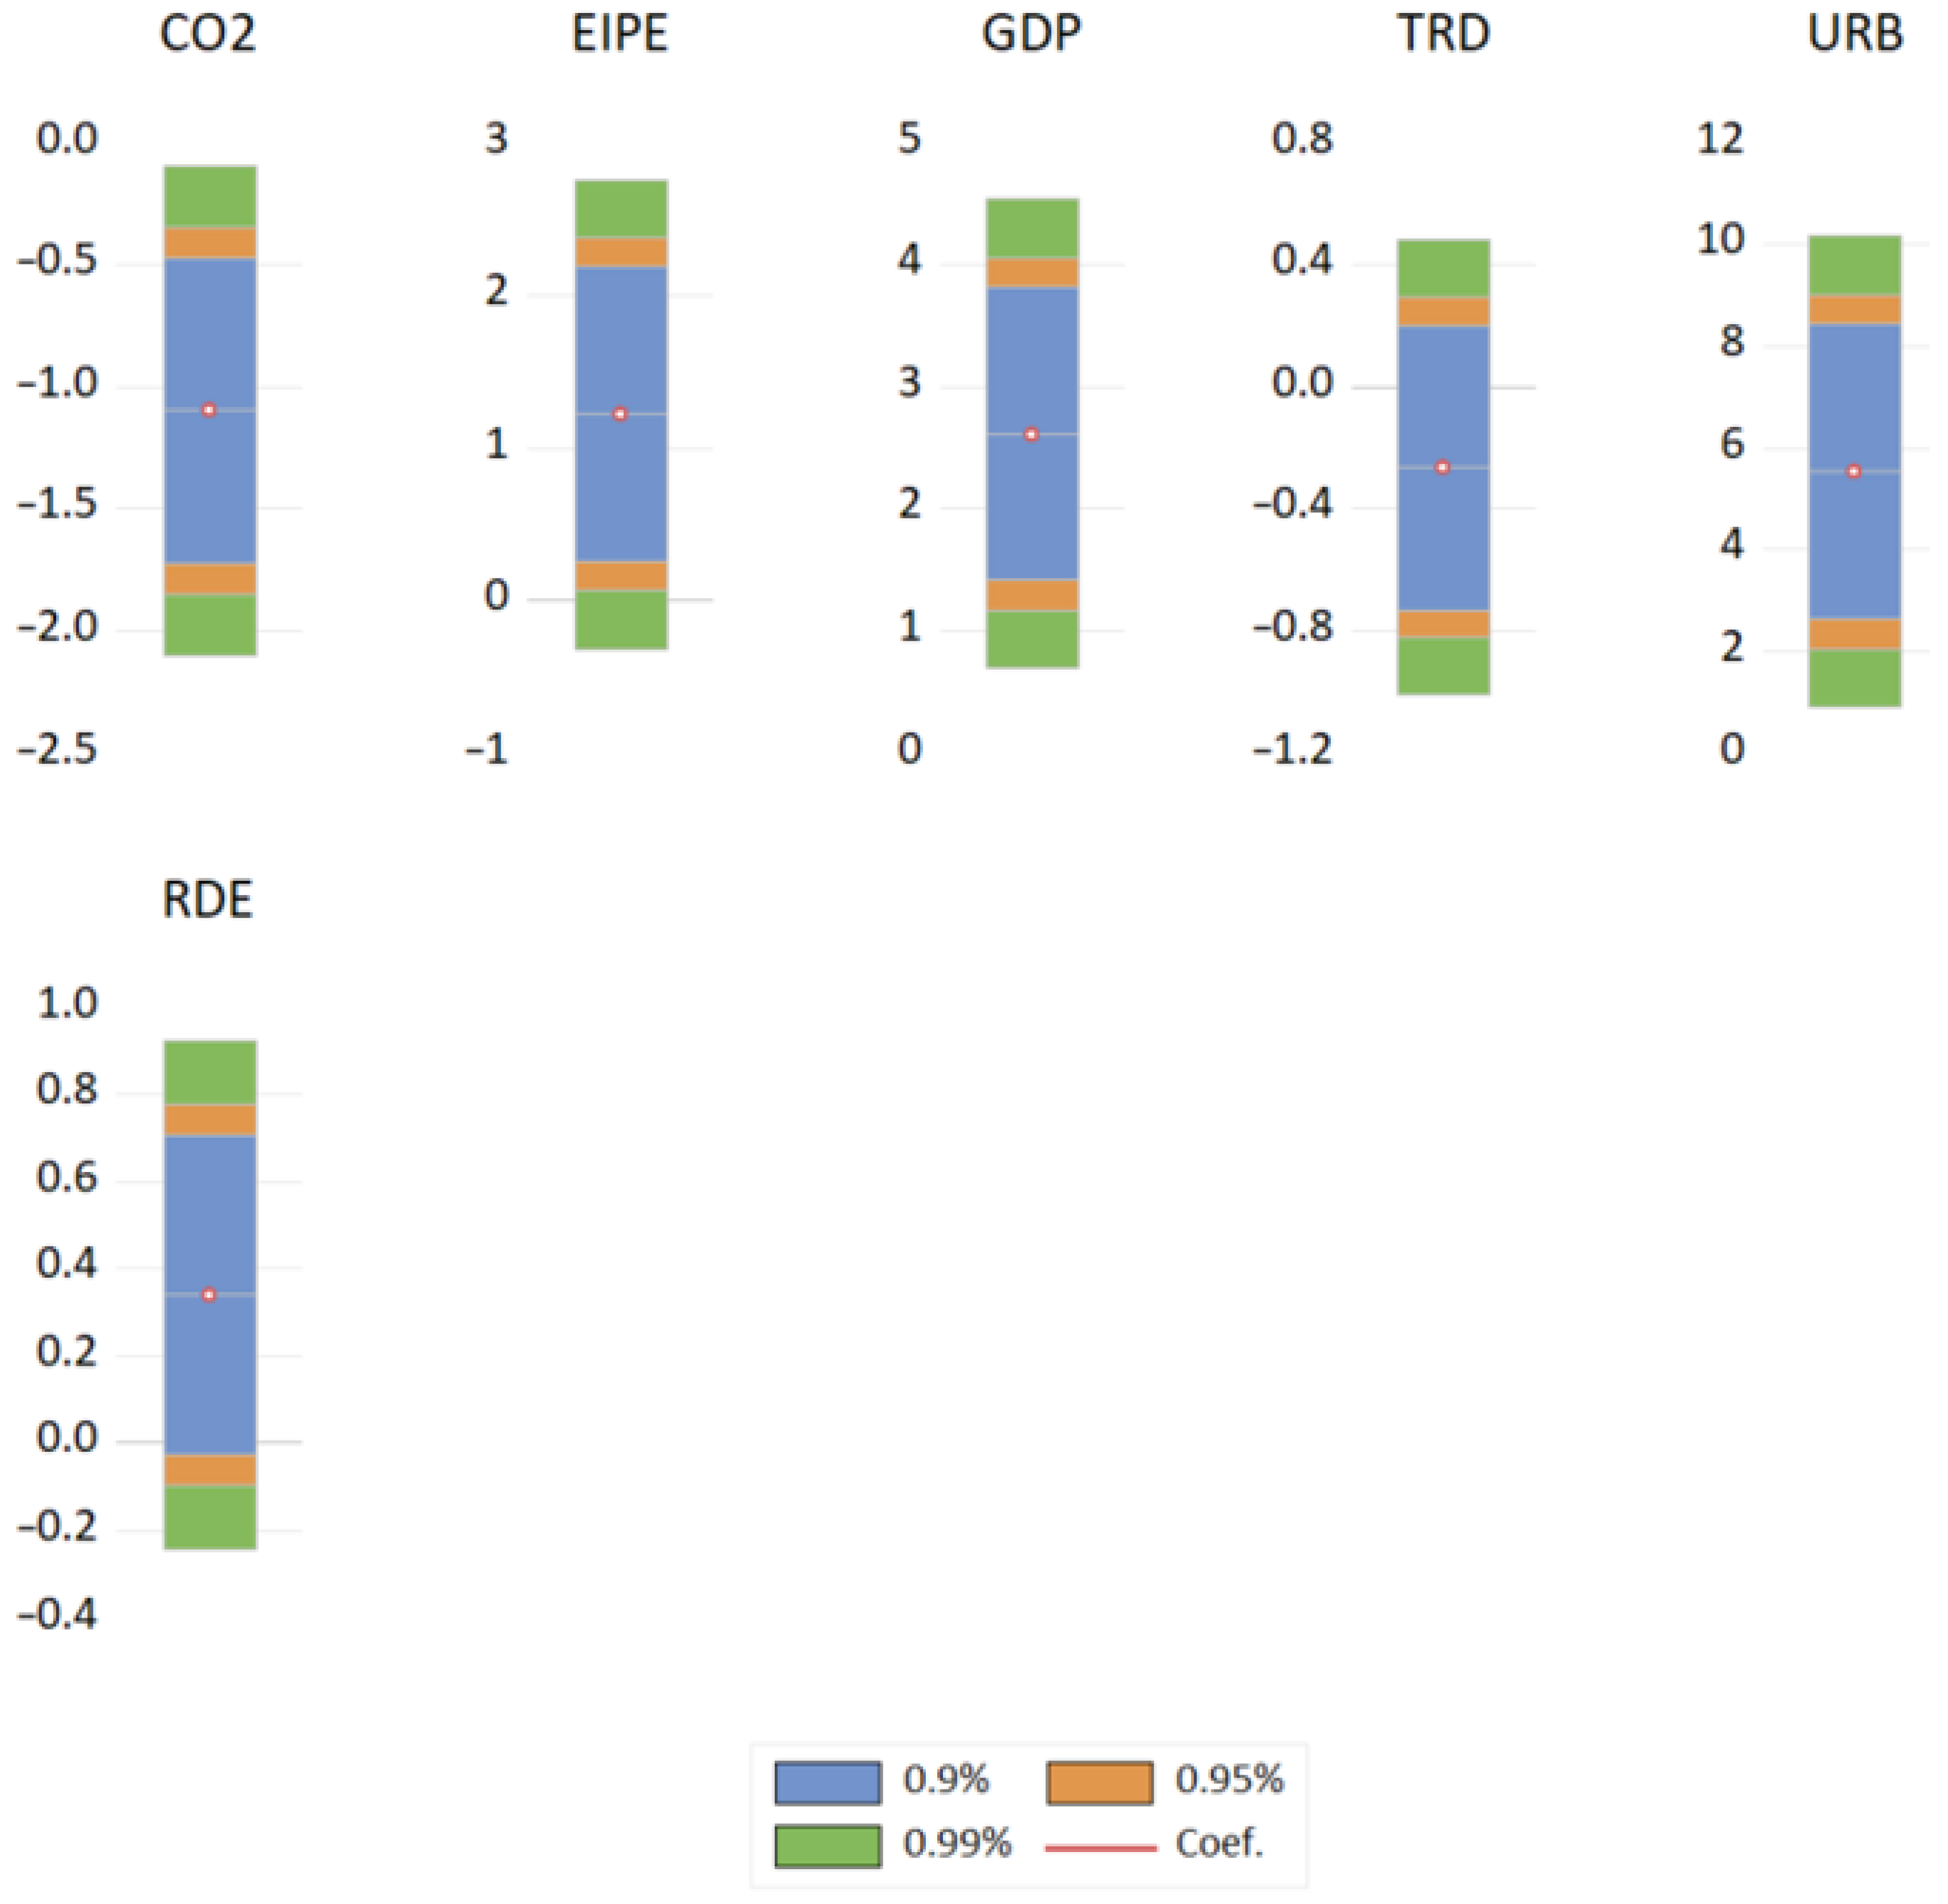
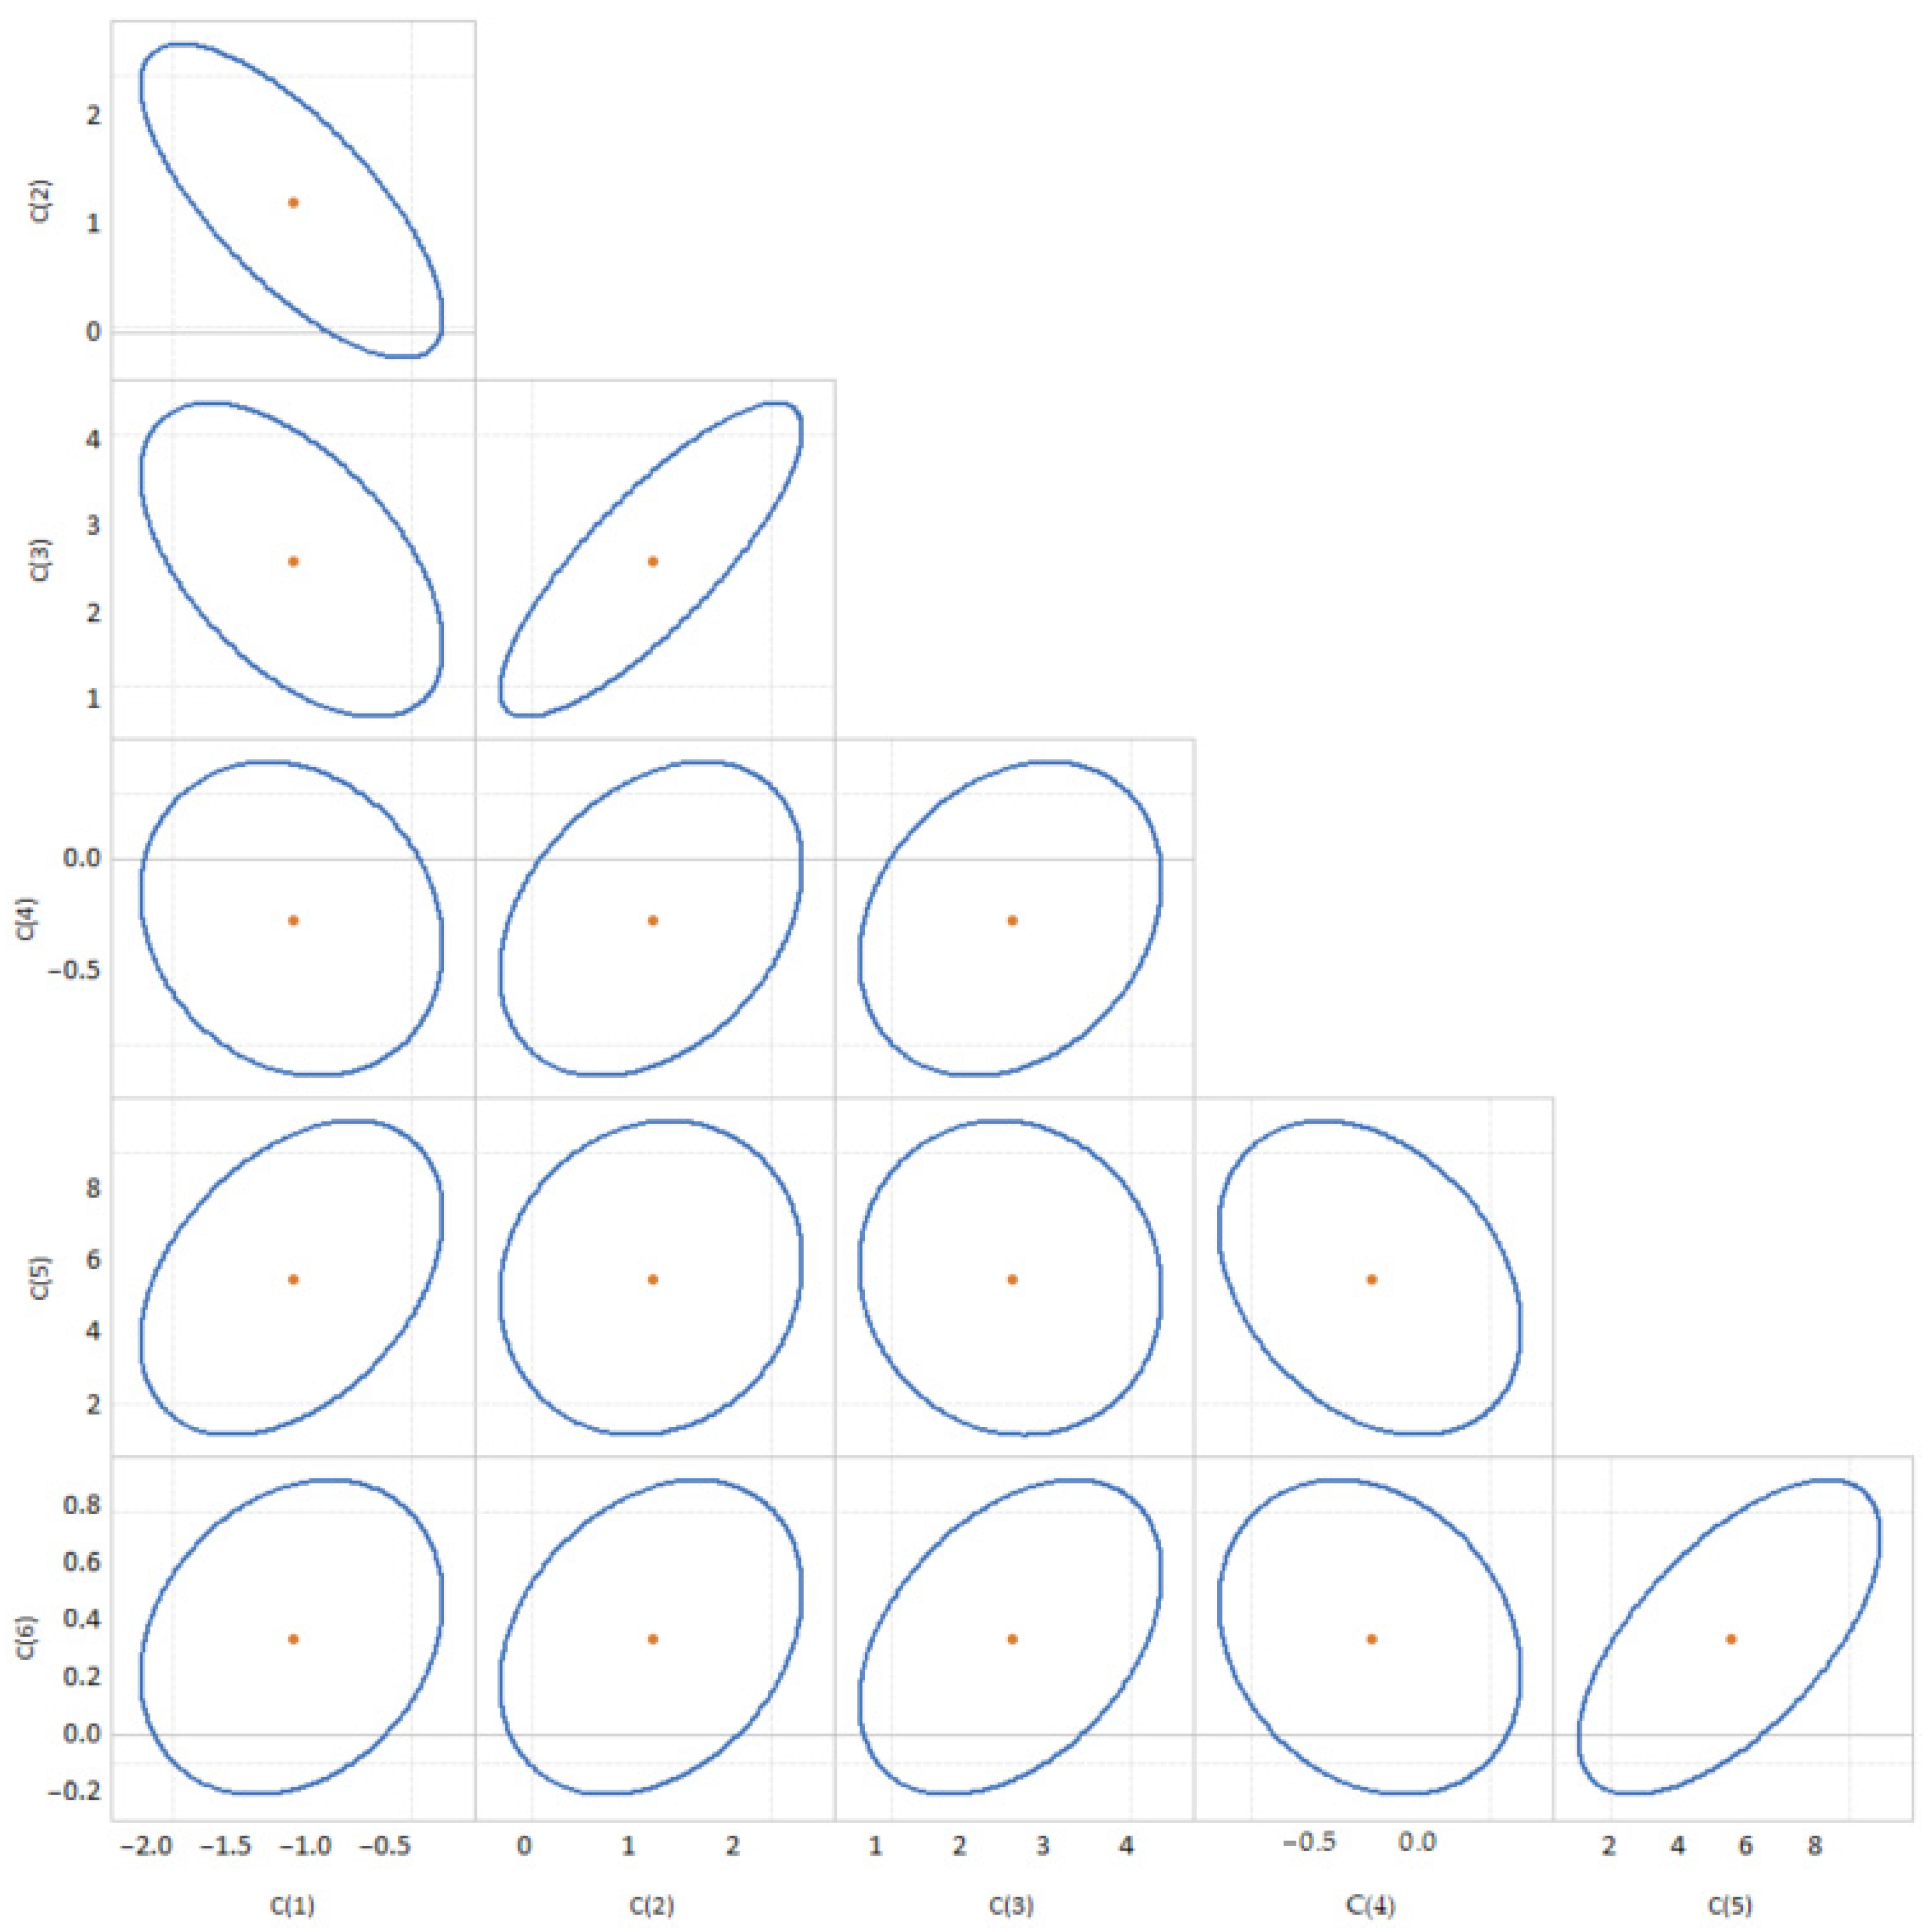
It is important to emphasize that panel ARDL models do not have a standardized battery of diagnostic tests equivalent to that used in time-series ARDL models. Consequently, the assessment of robustness is not based on the classical testing of all hypotheses on the residuals, but on checking the stability of long-term relationships and the consistency of the estimated parameters. In this sense, the robustness of the results is supported by several levels of evidence. First, the Kao residual cointegration test from Table A1 (Appendix A) confirms the existence of a long-term equilibrium between the analyzed variables. Second, the confidence intervals of the coefficients from Figure A2 (Appendix A) and the confidence ellipses from Figure A3 (Appendix A) highlight the univariate and multivariate stability of the parameters, indicating that the results are not sensitive to sample fluctuations or parametric instability. In addition, the scaled coefficients from Table A2 (Appendix A) allow the assessment of the relative importance of the determinants, strengthening the economic interpretation of the estimated effects. Finally, the distribution of the residuals, assessed by the Jarque–Bera test from Figure 4, does not indicate severe deviations from normality, providing additional support for the adequacy of the specification used. Overall, these diagnostics confirm the robustness and coherence of the long-run relationships identified by the Panel ARDL model.
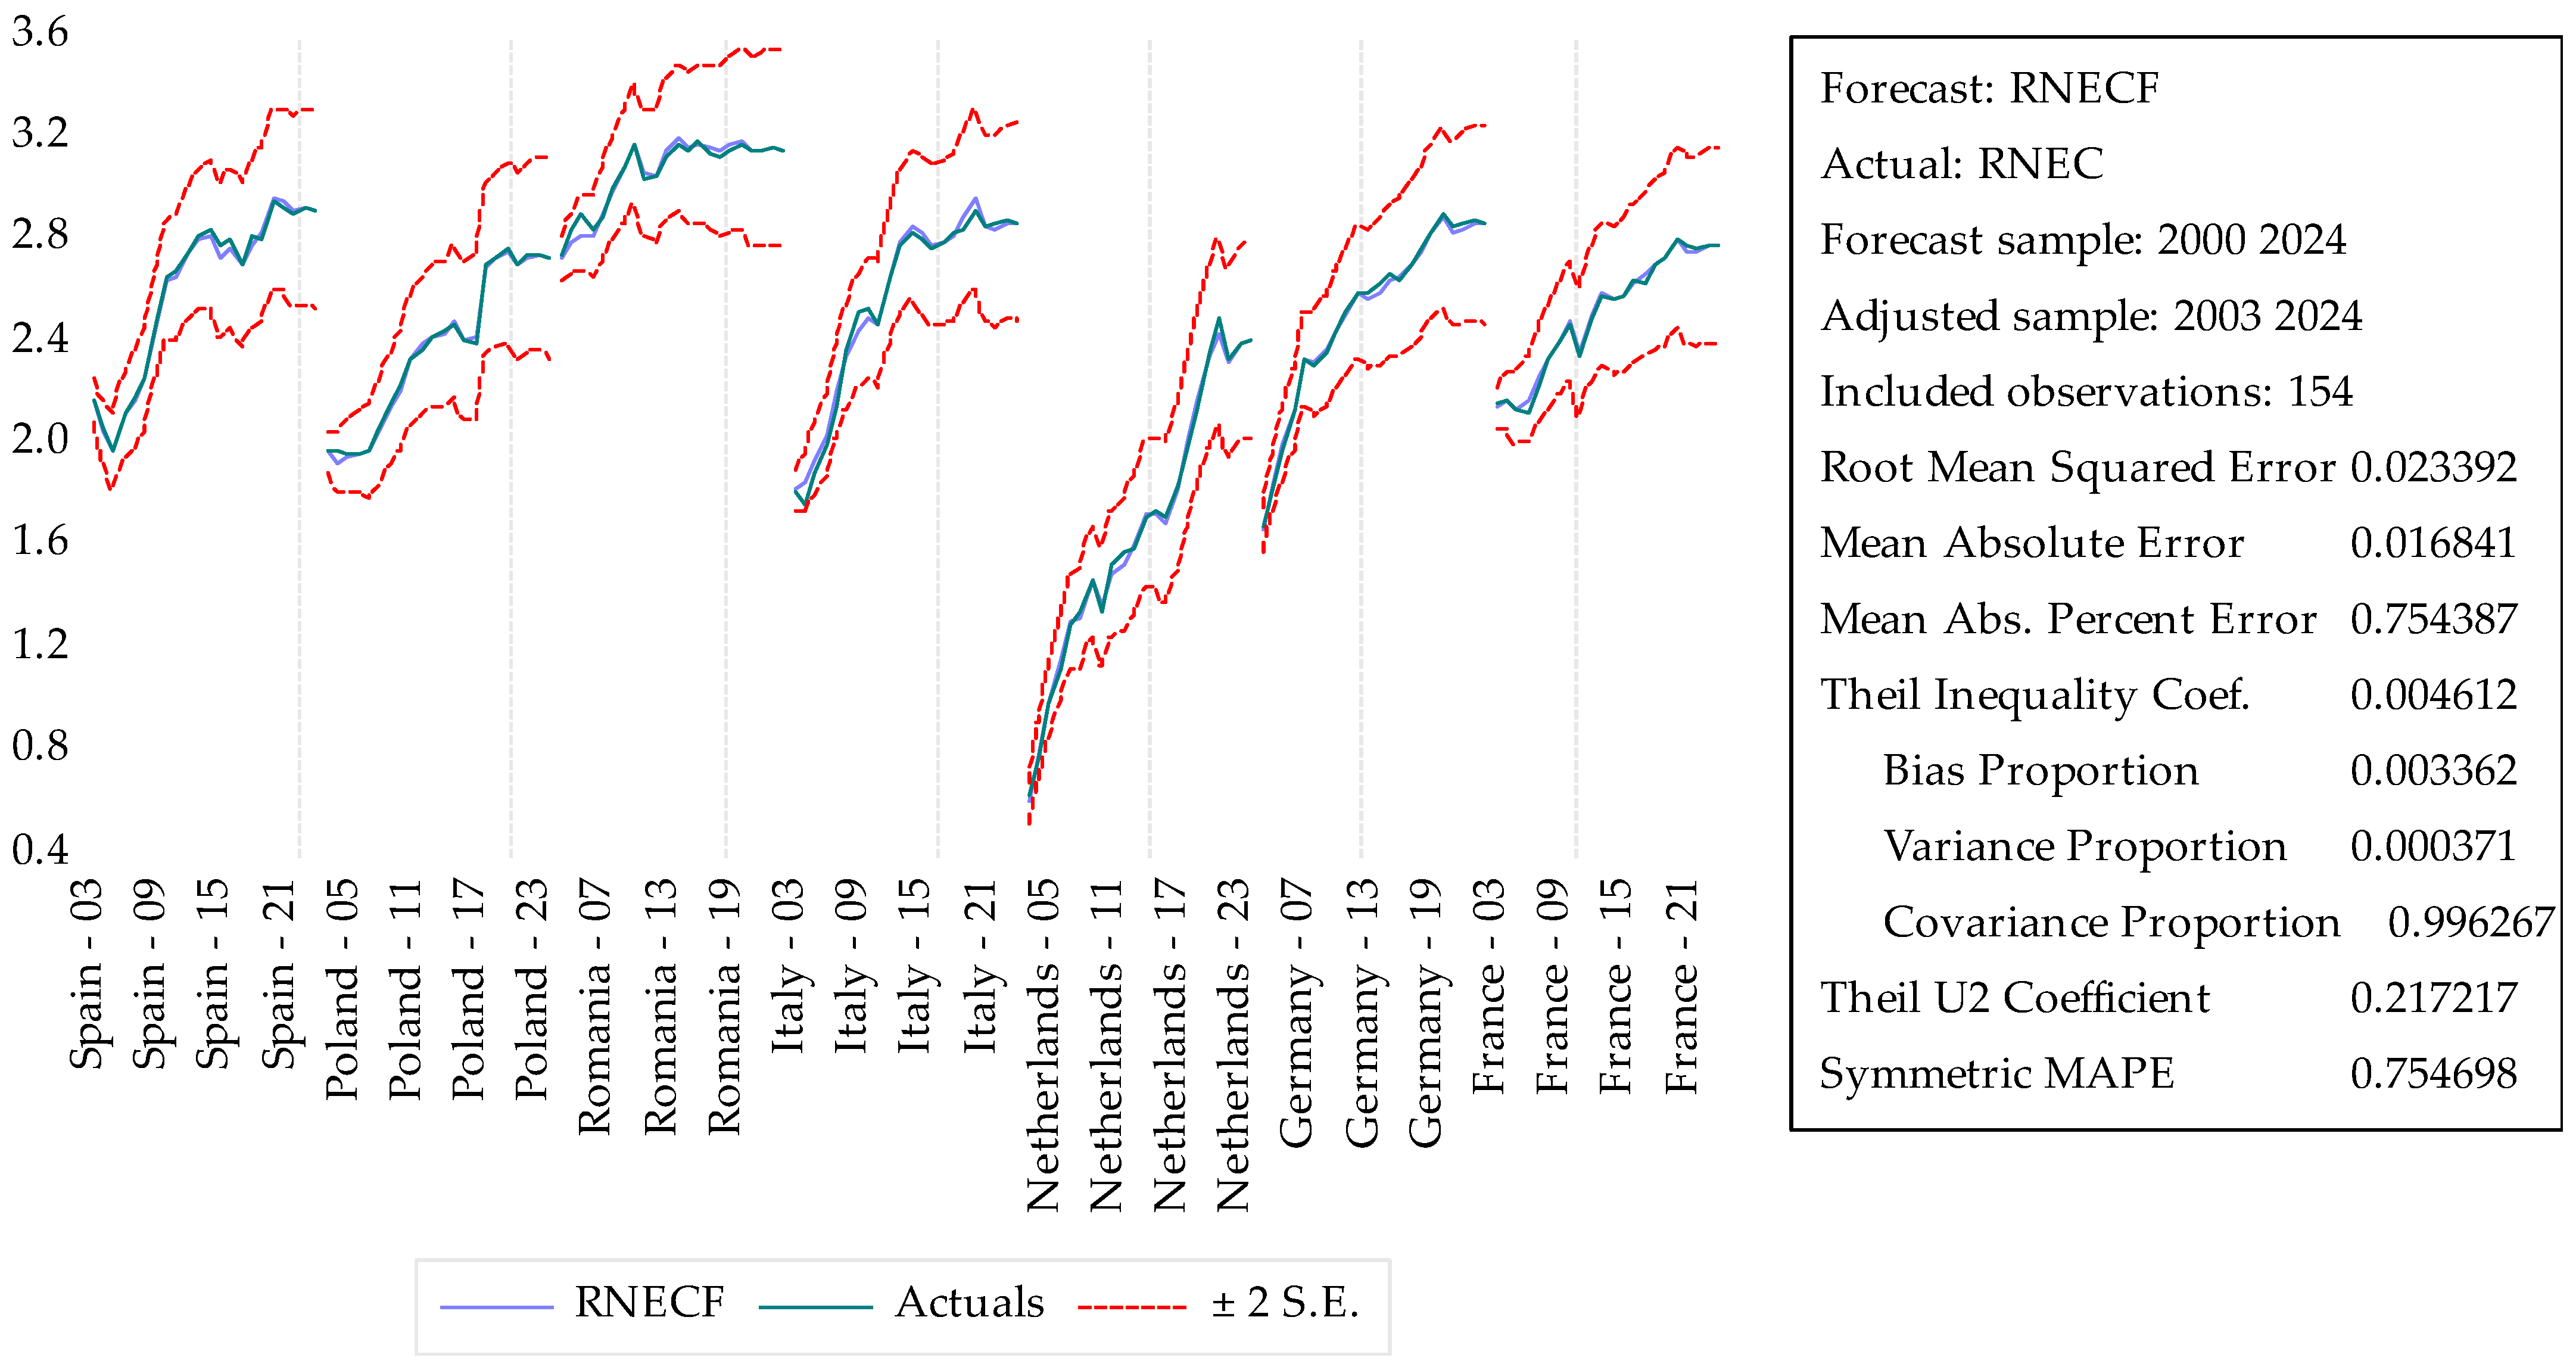
The graphs in Figure 5 compare the actual values with the forecast values for the 7 countries in the SPRING-F group. As we can see that the actuals and forecast lines are very close, it shows that the ARDL model reproduces the dynamics of renewable energy well. The dotted red bands show whether the predictions remain within reasonable statistical limits. Thus, we see that the model is well calibrated, without unstable deviations. The RMSE value of 0.0233 indicates a very small error, the MAE indicates that the average deviation is also minimal, and Theil’s U indicates a high performance of the model. Covariance Proportion indicates that the variation is captured almost entirely, and very low values of Bias indicate that the mode is not unstable. Thus, the forecasting test validates the robustness of the ARDL specification used in the analysis. The error indicators reported for the ARDL model are calculated on the dependent variable expressed in logarithmic form and are based on the in-sample fit of the model. These metrics have a diagnostic role, being used to assess the adequacy of the specification and the stability of the estimates, not for direct comparisons of predictive performance with ML models.
To test the robustness of the results obtained through the ARDL panel model and considering the multidimensional nature of the energy transition, an alternative specification was estimated in which CO2 emissions are used as the dependent variable. The results obtained are presented in Table A3 from Appendix B, the results being consistent with the basic model in terms of the sign and economic relevance of the main determinants, confirming the stability of the results. We note that the RNEC has a negative and statistically significant coefficient; increasing the share of renewables reduces CO2. Also, according to the EIPE coefficient, positive and statistically significant in the short term, it indicates that energy intensity increases emissions, economic growth leads to environmental pressures, and trade expressed through the TRD variable amplifies emissions as a scale effect. In addition, in the short term, URB reduces CO2. Also, the results obtained through the robustness test confirm the existence of a long-term equilibrium relationship, with a significant error correction coefficient and an adjustment speed of approximately 51%. In the long-term equation, renewable energy consumption has a negative and significant effect on CO2 emissions, while energy intensity and economic growth exert positive pressures on them. Urbanization contributes to reducing emissions, suggesting efficiency and infrastructure gains. Overall, the results are consistent with those of the main model, confirming the stability of the conclusions with respect to the choice of proxy used for the energy transition.

4.3. Machine Learning Findings: Predictive Performance and Feature Importance

To assess the ability of machine learning models to capture the dynamics of the energy transition in SPRING-F countries, three representative models were trained: Random Forest, XGBoost, and ElasticNet. These were selected to cover both nonlinear ensemble algorithms and a penalized linear model used as a baseline for comparison. Their predictive performance is summarized in Table 6. Thus, we observe that the results obtained highlight significant differences between the non-linear models (Random Forest and XGBoost) and the penalized linear model (ElasticNet). The R 2 coefficient values for Random Forest and XGBoost of over 0.96 and 0.97, respectively, indicate a very good capacity to capture the dynamic and complex relationships between energy and economic variables. On the other hand, we observe that for ElasticNet, the R 2 value is much lower, and the errors are higher, emphasizing that a linear approach would not have sufficiently captured the non-linear nature of the energy transition process. These results thus validate the use of nonlinear models in predictive analysis, the conclusions of the ARDL econometric section presented previously being reliable and robust. It is important to mention that in the case of the three ML models, the performance metrics are calculated on the same logarithmic scale of the dependent variable, but exclusively on the out-of-sample test set, obtained through a strict temporal division of the sample. The training set includes the observations from the initial period, and the testing set contains the observations from the final period, avoiding any possible temporal information leakage. No performance metrics are reported on the training data. Consequently, these values reflect the real predictive capacity of the models in a comparable framework across ML algorithms, but they are not directly comparable to the in-sample errors reported for the ARDL model.
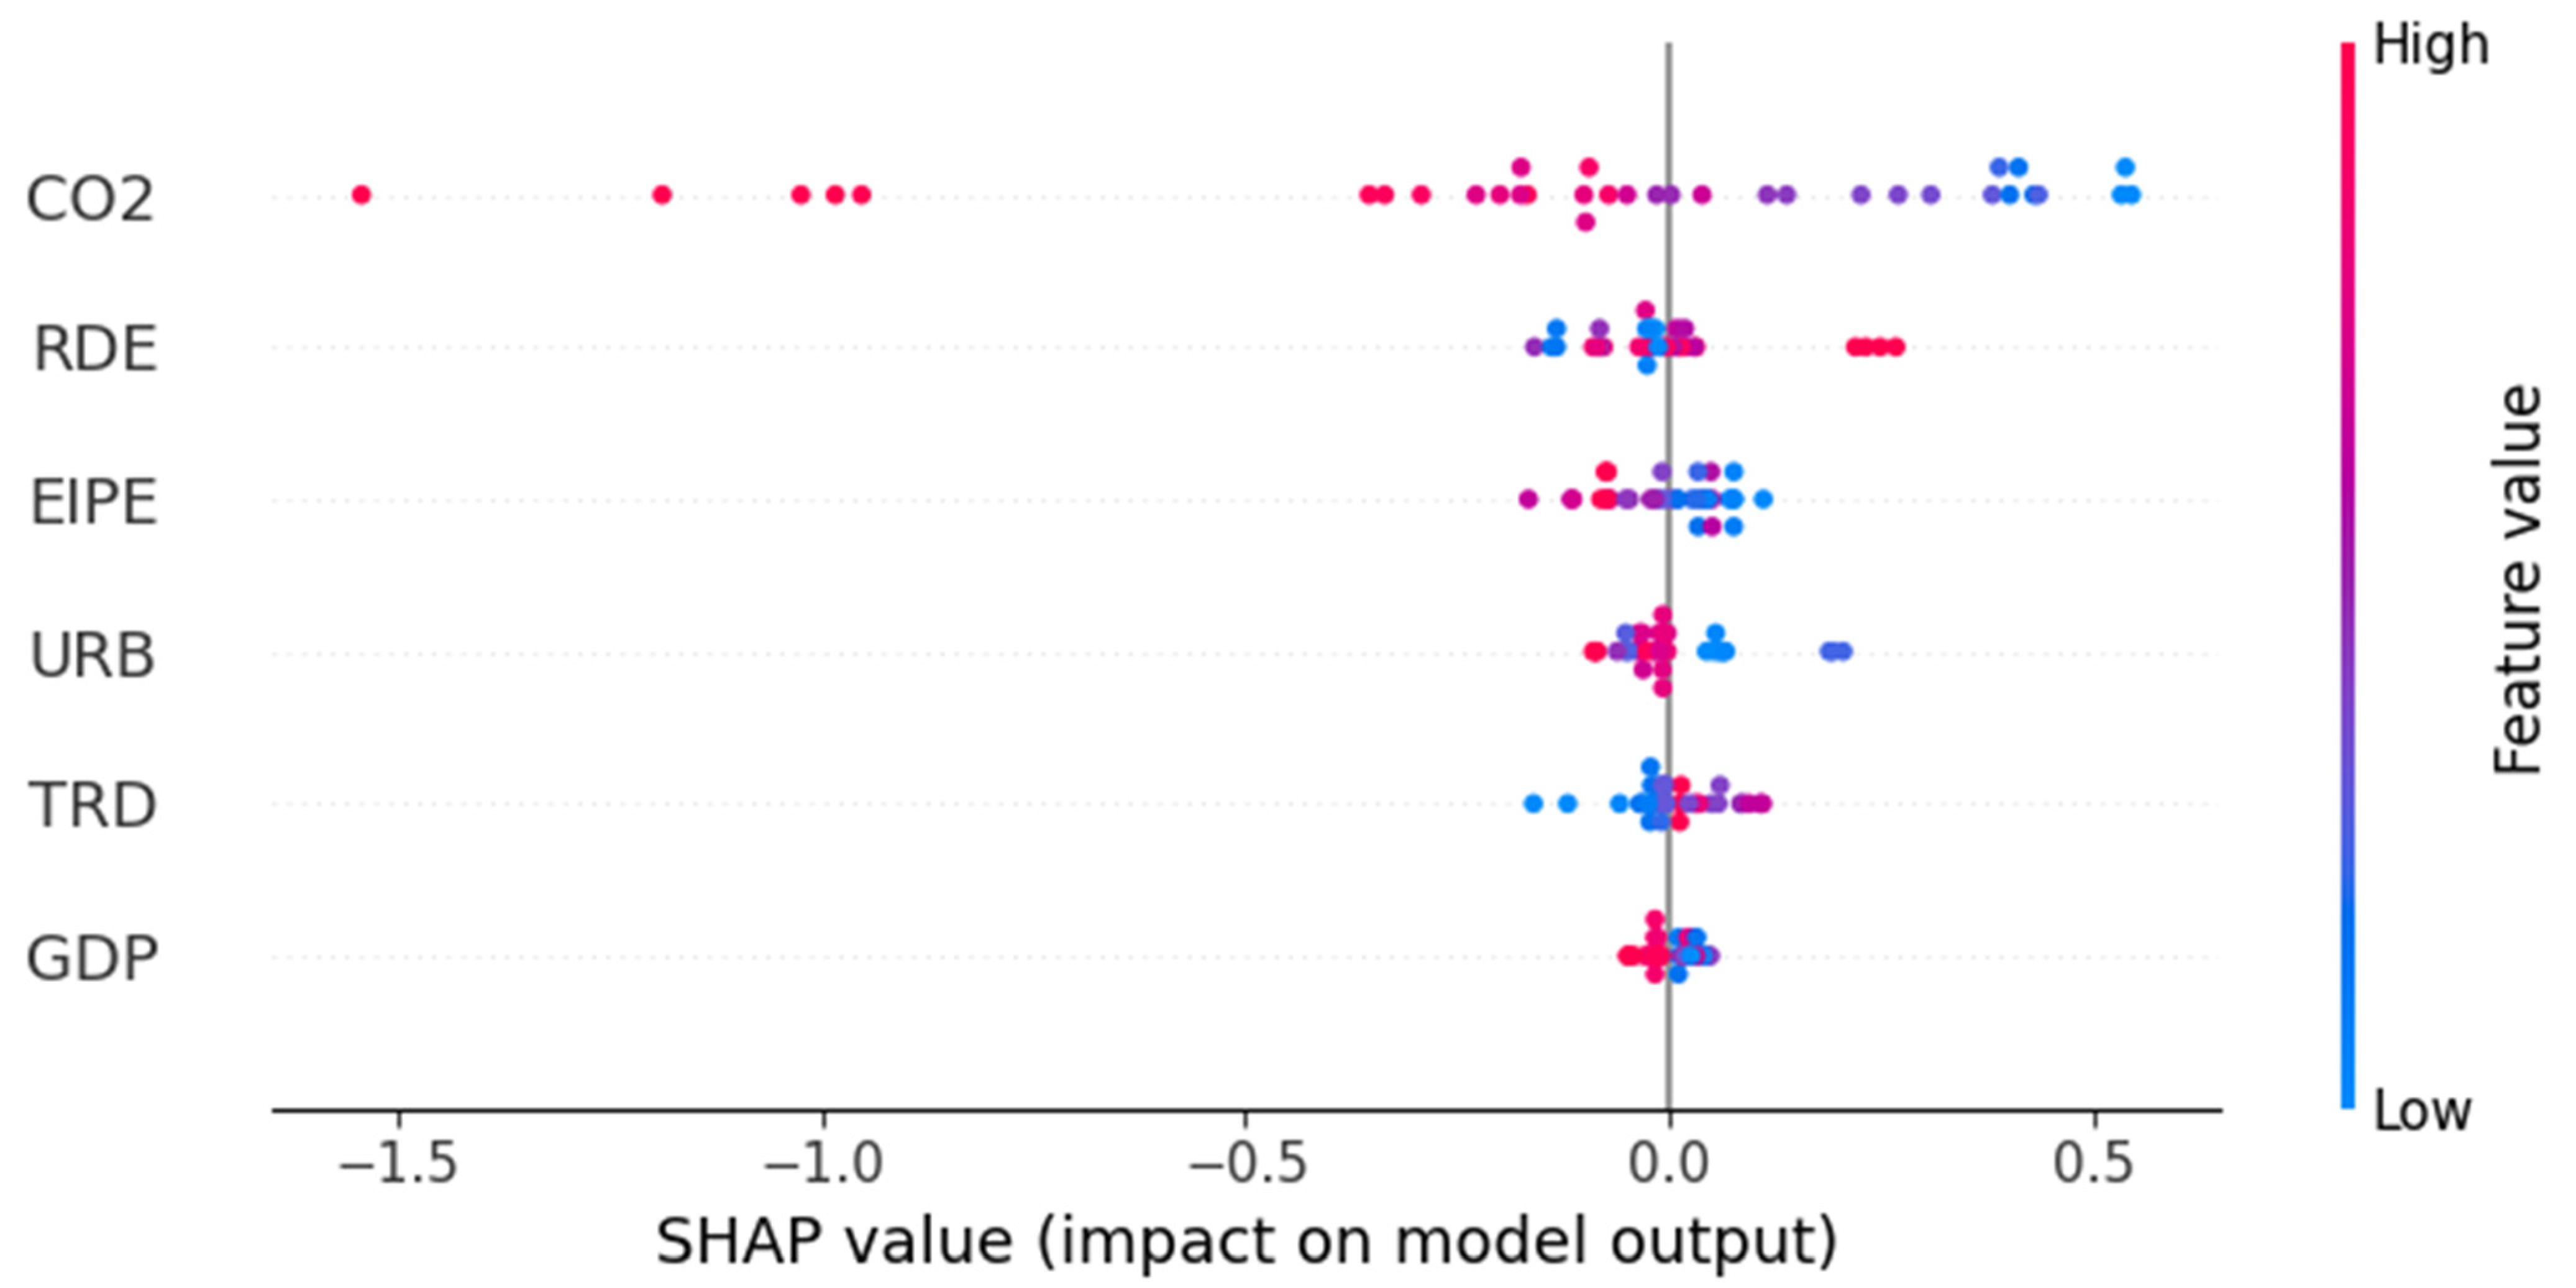
According to the SHAP results in Figure 6 for the Random Forest model, we see that CO2 is the dominant variable, so it has the largest impact on the prediction of RNEC. The red dots on the CO2 line indicate high emission values and are clustered, as seen in the negative area. This indicates that high CO2 levels reduce the energy transition. EIPE also has a moderate negative effect, which may indicate that economies with high energy consumption per unit of GDP are slower to decarbonize. The negative relationship observed in the case of EIPE reflects the fact that high levels of energy intensity are associated with short-term structural and technological rigidities. For example, dependence on conventional energy infrastructures and limited capacity to adapt quickly to renewable sources are such existing rigidities. These effects in the SHAP analysis are captured as local and conditional marginal contributions. They highlight operational constraints that can delay the energy transition even in economies on a long-term adjustment path.
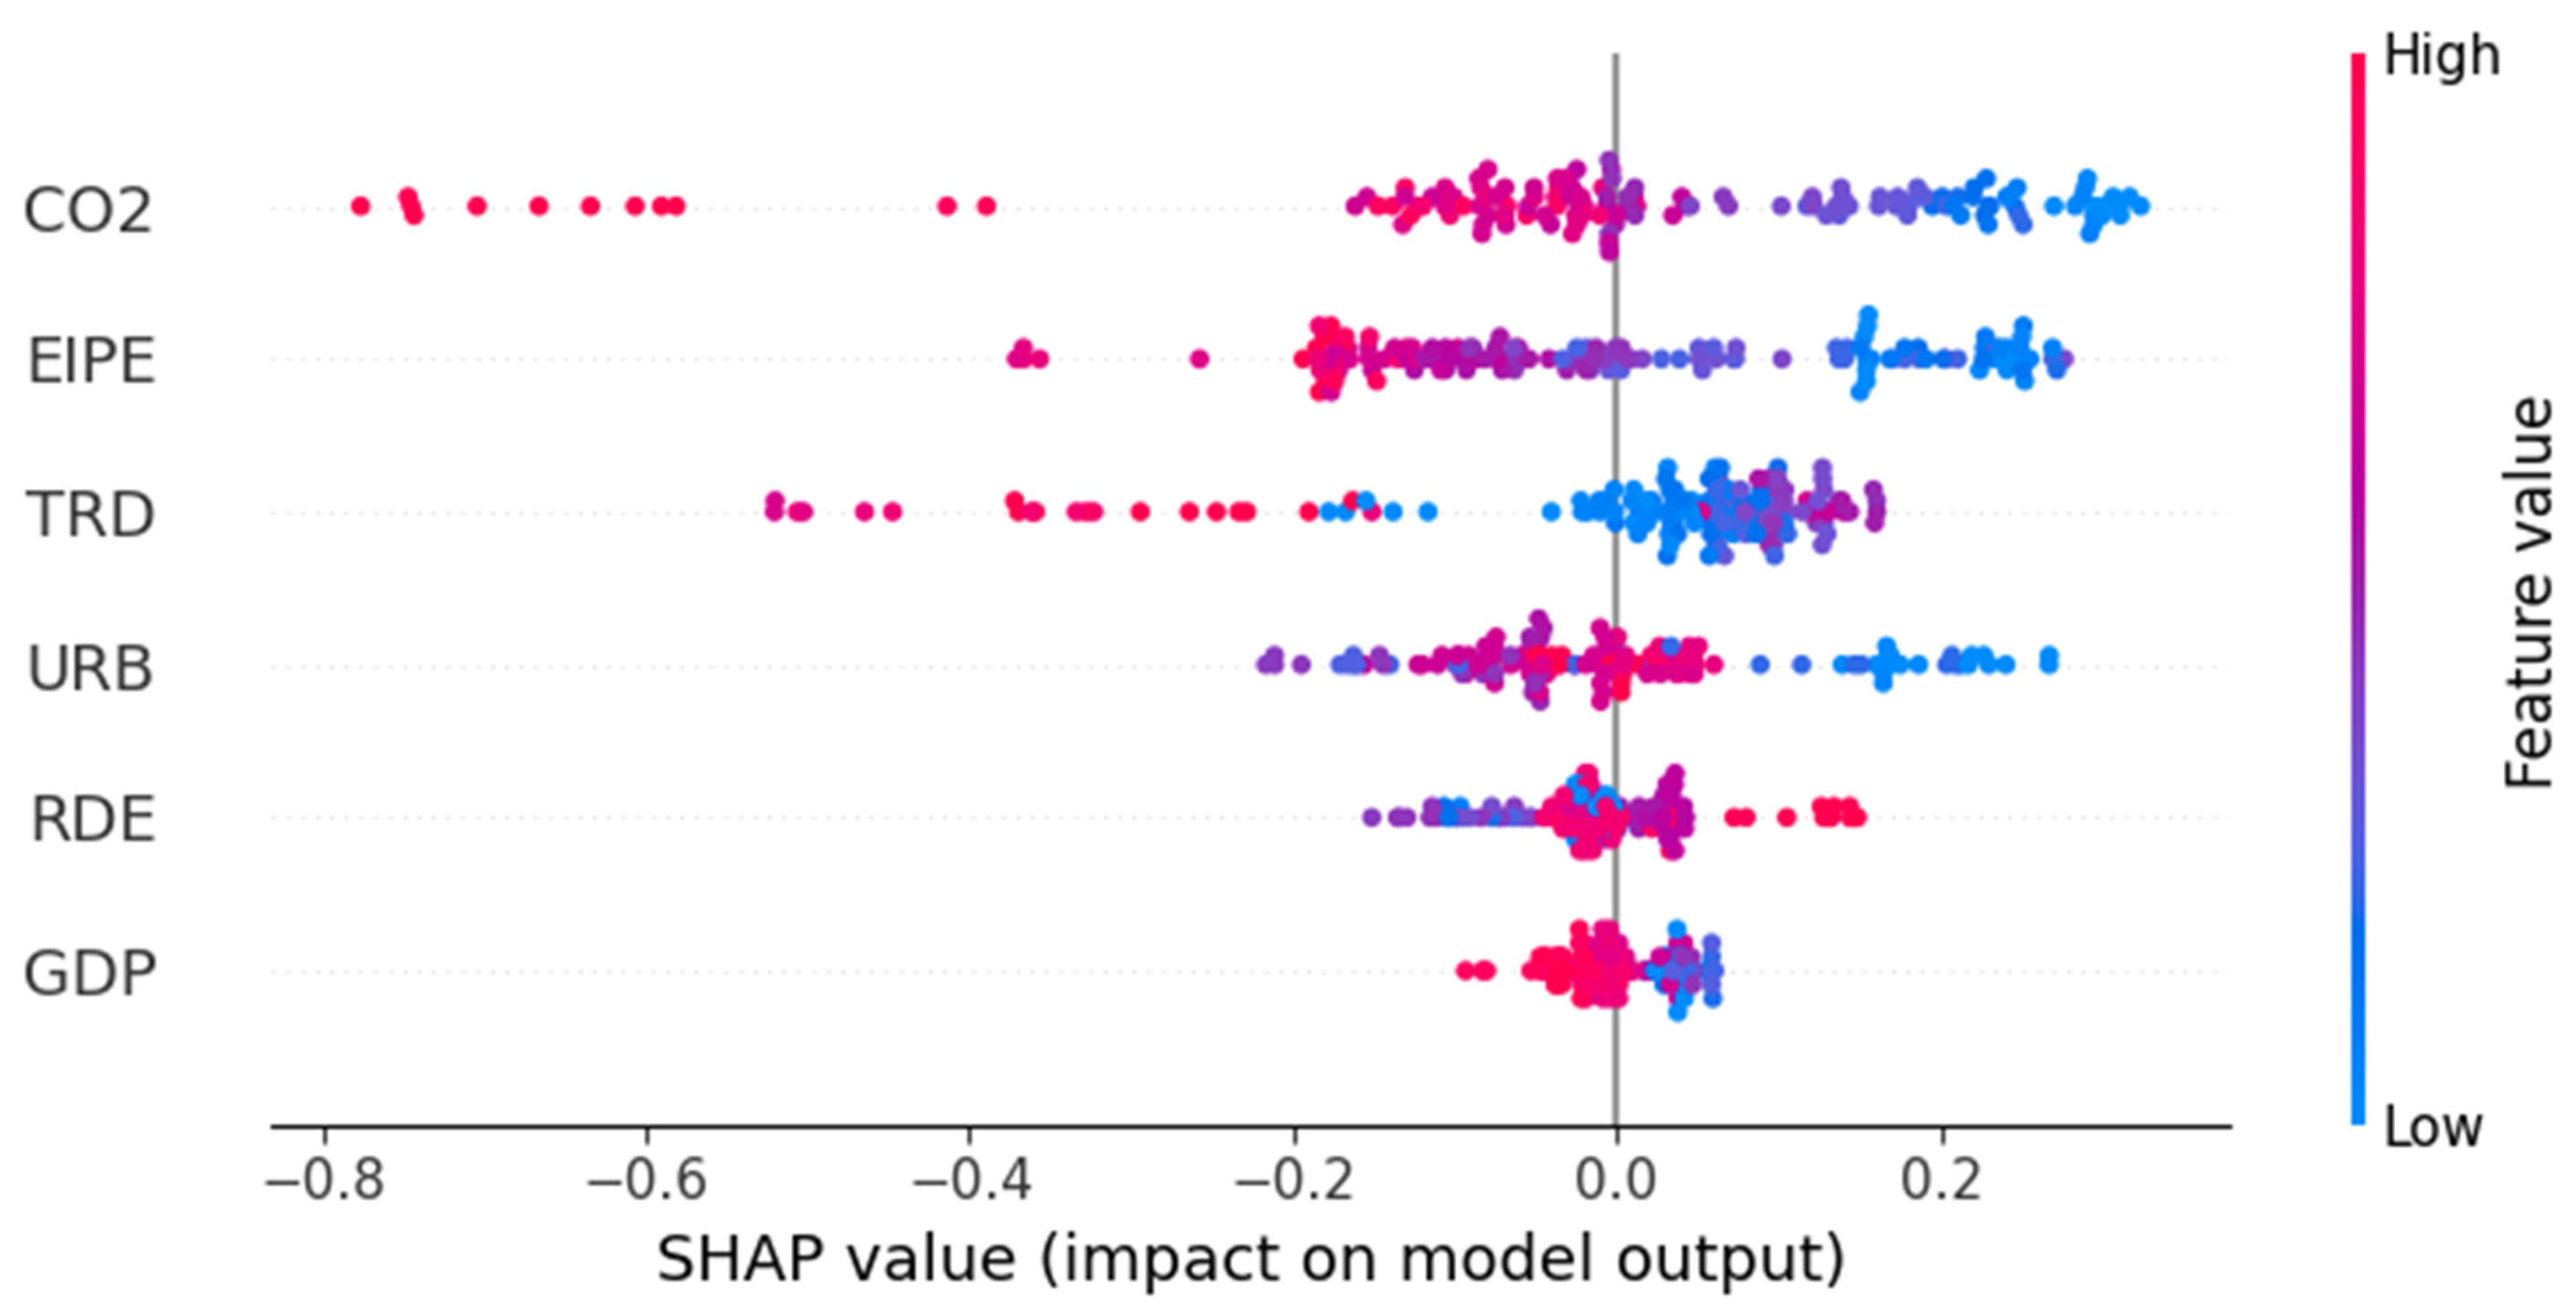
The SHAP structure in Figure 7 for XGBoost also confirms the major importance of CO2. However, we observe that the distribution of points is more compact. This indicates a more stable relationship and a model that is better trained. High values of CO2 (red) generate important negative influences, reducing RNEC. On the other hand, low values (blue) contribute positively. EIPE retains the same negative effect as in Random Forest, but the XGBoost model captures the variation more clearly: high energy consumption penalizes the green transition. RDE presents a still moderate positive impact, and the other variables (TRD, URB, GDP) remain secondary predictors, with reduced and partially nonlinear influences.
It can be seen that there are differences in the ranking of the variables between the Random Forest and XGBoost models. These were expected given the different learning mechanisms of the two algorithms. Random Forest is based on an ensemble of independent trees built through bootstrap aggregation, capturing average and robust relationships in the data, while XGBoost uses a sequential boosting procedure, which places greater emphasis on observations that are difficult to explain and on fine nonlinear interactions. Therefore, it is normal for XGBoost to give a higher relative importance to variables that explain specific residual variations. On the other hand, Random Forest rather reflects stable global influences. In conclusion, the differences do not indicate inconsistencies but represent the fact that the two models are complementary.
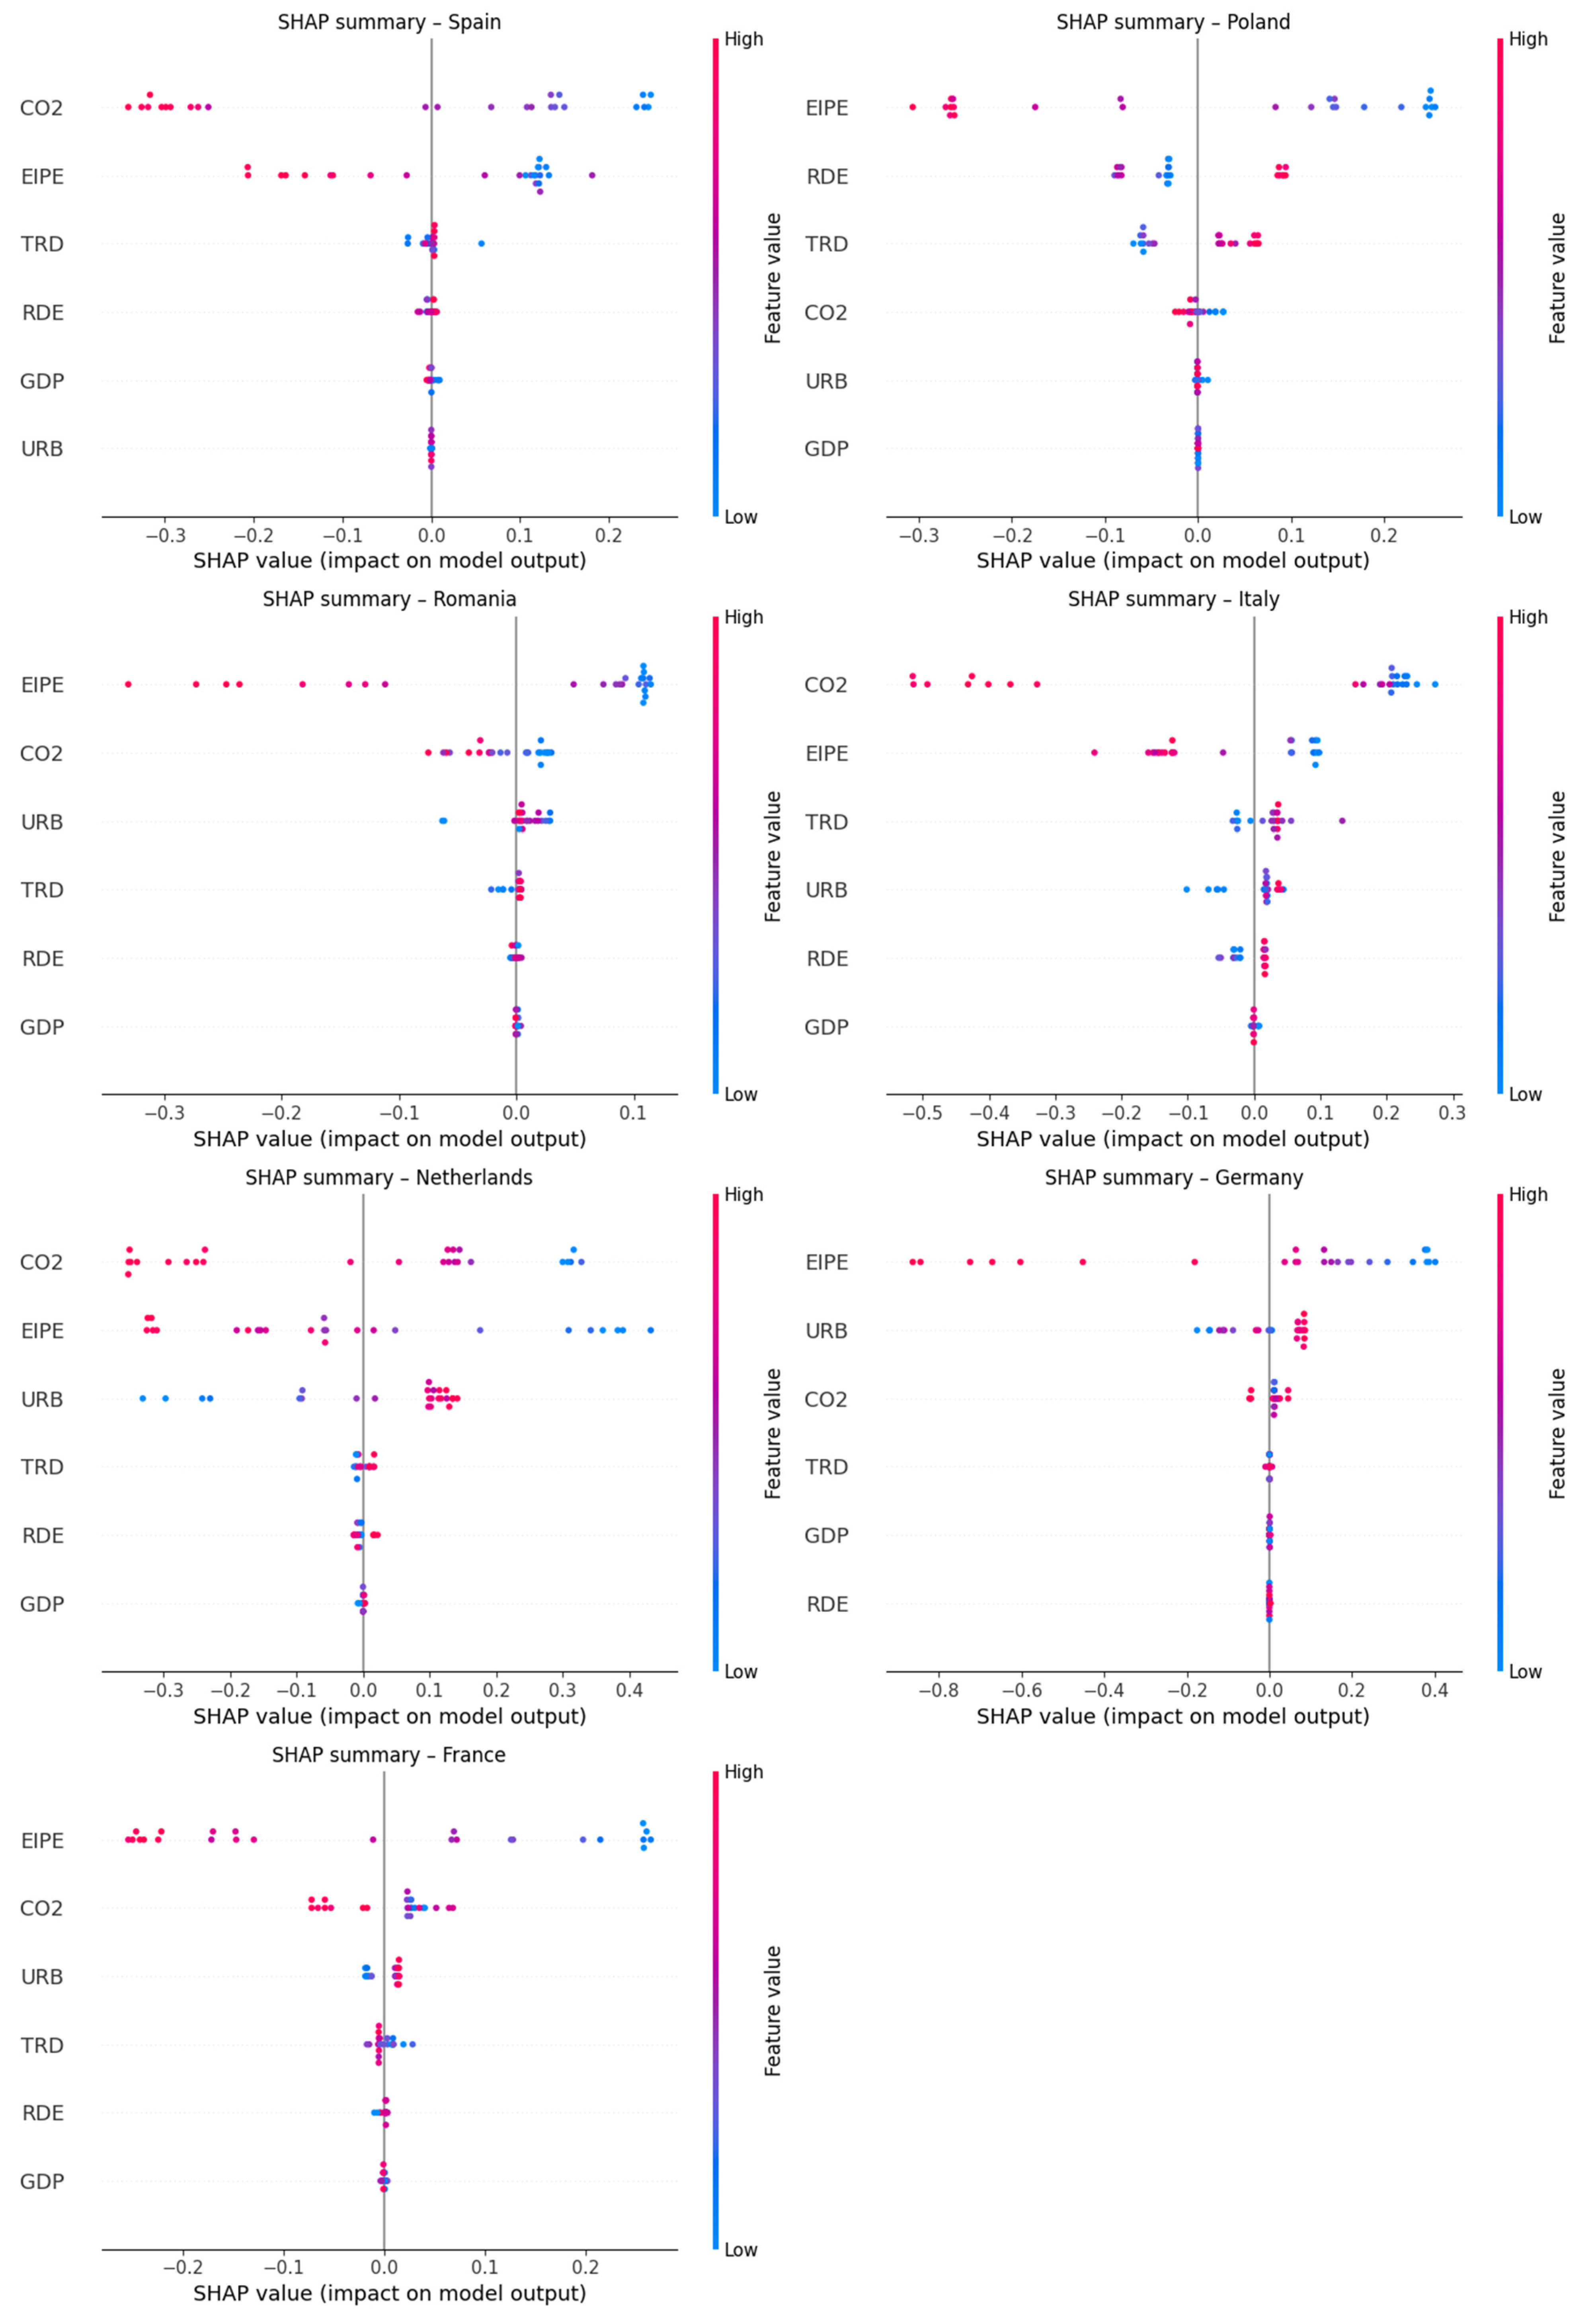
The SHAP analysis at the country level from Figure 8 highlights significant differences in the mechanisms through which explanatory variables influence the energy transition measured by RNEC. In Spain, Poland, and France, high CO2 emissions have a significant negative impact on RNEC, indicating that carbon intensity remains a major obstacle to energy progress. In Romania and Italy, energy investments (EIPE) and urban development (URB) have more consistent positive effects, suggesting that infrastructure modernization and urban expansion support the adoption of renewable resources. A distinct situation is observed in the Netherlands and Germany, where trade (TRD) and the level of economic development (GDP) generate strong variations in the prediction, reflecting the more advanced integration of the economy with European energy markets. Overall, SHAP confirms that, although CO2 remains the dominant negative determinant in most countries, the structure of positive factors differs significantly, indicating heterogeneous national trajectories of the energy transition within the SPRING-F group. An important observation to mention is the difference observed between the sign of the EIPE coefficient estimated in the ARDL panel model and the negative contribution highlighted by the SHAP analysis. These differences do not indicate an inconsistency of the results or a contradiction, but reflect different mechanisms of the energy transition analyzed on different time horizons and under distinct analytical assumptions. The result from the ARDL panel model captures a structural equilibrium relationship at the panel level. This indicates that economies characterized by high energy intensity, over time, are subject to greater pressure to adopt renewable sources so as to reduce dependence on fossil fuels. This effect is called the compensation effect. As for the SHAP analysis, it is derived from ML models and describes local marginal contributions, conditioned both by the effective values of the variables and by nonlinear interactions. In this sense, certain high levels of energy intensity are associated with technological rigidities and delays in the energy transition process, but only in the short term and in certain intervals of the data distribution. Thus, both econometric and ML algorithm-based results are complementary. They simultaneously highlight both long-term structural pressures and potential short-term operational constraints of the energy transition.

5. Conclusions and Policy Recommendations

This study analyzed the dynamics of the energy transition within the SPRING-F group. In this regard, a hybrid approach was used that combines the econometric panel ARDL model with machine learning algorithms. Based on the results obtained, we can clearly see that the energy transition in Europe is not a uniform process. It is clear that this transition differs strongly between Western European economies and those in CEE.
The study was built on the basis of three initially formulated research questions. Regarding RQ1, the ARDL panel analysis confirms the existence of long-term equilibrium relationships between renewable energy consumption and its main determinants. It also conforms to the existence of relatively rapid adjustment mechanisms following short-term shocks. From the perspective of RQ2, the results of the ML models highlight the fact that when nonlinear relationships and heterogeneous effects between countries are allowed, the determinants and their importance differ significantly. The SHAP analysis highlights the fact that energy intensity, urbanization, or emissions level have different roles depending on the national context. This aspect confirms the existence of different energy transition trajectories within the SPRING-F group. Regarding RQ3, the results obtained through ML models confirm and extend the conclusions of the panel ARDL model. The ARDL results capture long-term structural relationships, while the ML and SHAP analyses reveal local and nonlinear mechanisms that can lead to different short-term effects. This complementarity demonstrates the value of the proposed hybrid approach and supports the use of artificial intelligence as an inferential and interpretative extension of econometric analysis, not just as a predictive tool.
In the exploratory analysis, it was observed that there are two distinct groupings of countries. Germany, France, and the Netherlands (Western European economies) are characterized primarily by a high level of renewable energy consumption. Also, major investments in research and development were observed, and superior energy efficiency was supported by stable climate policies.
On the other hand, Romania and Poland are still in an early stage of transition development. This stage is marked by high energy intensity, lower investment in innovation, but also by a greater dependence on fossil fuels. In contrast, Spain and Italy, although recording visible progress, this is uneven, and the two countries occupy an intermediate position in the energy transition of the countries analyzed.
The ARDL panel model developed confirms the existence of long-term equilibrium relationships between renewable energy consumption and the economic, energy, and structural factors analyzed. On the one hand, it was observed that urbanization and economic growth have a positive and significant effect on renewable energy consumption. This effect suggests that as long as there is development of urban infrastructure and a high level of economic prosperity, these factors favor the adoption of green sources. It was also observed that economies with high emission intensity remain more dependent on conventional energy sources, given that CO2 emissions have a negative and statistically significant impact.
Regarding the short-term effects, according to the error correction coefficient, we can deduce that the adjustment towards the long-term equilibrium is relatively fast. This can be translated into the fact that energy policies can produce effects within a reasonable time frame. In addition, it has been observed that investments in research and development have a delayed positive effect. This aspect reinforces the idea that innovation has a very important role in the energy transition, but concrete results are observed over time.
In addition to the econometric analyses, the ML models confirm and complement the conclusions of the preliminary analyses. Random Forest and XGBoost proved to be much more efficient than the ElasticNet model. This shows that the relationships between the analyzed variables are predominantly nonlinear. The SHAP analysis carried out highlighted the fact that CO2 emissions play a dominant role, being one of the main factors that slow down the energy transition, but also the heterogeneity of national mechanisms. As has been observed, the energy transition is stimulated differently in the countries in the SPRING-F group. On the one hand, some are stimulated by economic development and trade, while in others, urban infrastructure and energy efficiency are more important. It is also important to note that the difference between the positive effect of EIPE estimated by ARDL and the negative contribution identified by SHAP highlights the existence of distinct long-term and short-term mechanisms. In the ARDL panel model, the positive coefficient of EIPE captures a long-term equilibrium structural relationship between energy intensity and renewable energy consumption, which can be interpreted as a compensation effect. In contrast, the SHAP analysis derived from ML models describes local marginal contributions conditioned by the effective values of the variables and the nonlinear interactions between them. From this perspective, high values of EIPE are associated with negative contributions to the RNEC prediction, indicating that, in the short term or in certain intervals of the data distribution, high energy intensity reflects technological rigidity and delays in the energy transition. This complementarity confirms the value of the hybrid approach, allowing for a more nuanced interpretation of the energy transition. Therefore, the difference in sign is not the result of a multicollinearity effect, but indicates the existence of a nonlinear and time-horizon-dependent relationship, which econometric and machine learning-based approaches capture from complementary perspectives.
From a practical perspective, the results suggest that European energy transition policies need to be tailored to the specificities of each country. Emerging economies, such as Romania and Poland, should prioritize reducing energy intensity, boosting investment in R&D, and modernizing urban infrastructure. At the same time, advanced economies can accelerate the transition by integrating advanced green technologies and strengthening regional energy markets. Furthermore, the results obtained indicate that although there is a common long-term mechanism of energy transition in the SPRING-F group, the various constraints or priorities set by each country at the national level differ significantly between the advanced Western European economies and the emerging Central and Eastern European countries. For the advanced Western European economies, where levels of urbanization, trade openness, and R&D investment are already high, public policies should focus on strengthening energy efficiency, accelerating technological innovation, and advanced integration of renewable sources into existing energy networks. The ARDL and ML results suggest that, in these economies, emission reductions and increasing the share of renewable energy are strongly correlated with R&D investments and market mechanisms, indicating the need for policies oriented towards innovation, flexibility, and infrastructure optimization. In contrast, for emerging economies in Central and Eastern Europe, the energy transition is constrained by a higher structural dependence on fossil fuels, lower levels of investment in innovation, and institutional rigidities. In these cases, policies should prioritize the modernization of energy infrastructure, reduce energy intensity, and increase the absorption capacity of green technologies, including through the use of European funds and foreign direct investment. Therefore, the results of this study support the need for differentiated energy transition strategies at the European level, combining common decarbonization objectives with policy instruments adapted to the level of economic development and institutional capacity of each economy.
Although the study provides a comprehensive analysis of the energy transition within the SPRING-F group, it is important to mention the limitations of the work that may open natural directions for future research. It is important to mention the limitations regarding the sample size, both in terms of the number of countries analyzed and the time period. In the study, the choice of the SPRING-F group was intentional, aiming to capture the heterogeneity between advanced and emerging economies in the European Union. Future research may extend the analysis to more countries or integrate a more detailed regional approach. Another limitation could be related to the set of variables used. Although the indicators in this study were selected to capture specific and important dimensions of the energy transition, there are other relevant factors that were not included. For example, energy prices, green fiscal policies, or governance indicators were not included and could bring new information to future research studies. It is important to note that these limitations do not reduce the relevance of the results obtained, but rather emphasize the exploratory and applied nature of the research. These limitations also open up new horizons for future research directions that contribute to the understanding of the energy transition in Europe. It is also important to mention that in the econometric model, the dependent variable RNEC generally captures the substitute dimension of energy sources, without fully covering other components of the energy transition, such as energy security, network infrastructure, or institutional changes. Future analyses could extend the proposed framework by using composite indices or integrated measures of the energy transition.
In conclusion, the combination of econometric models and machine learning algorithms provides a more complete picture of the energy transition and demonstrates the usefulness of hybrid approaches in the analysis of complex economic processes. The results obtained can constitute a relevant support for the formulation of differentiated, efficient, and long-term sustainability-oriented energy policies. Basically, the results show that the combined use of econometric models and artificial intelligence methods allows for a deeper understanding of the dynamics of the energy transition, demonstrating that AI can function as an inferential and interpretative extension tool, not just predictive.

Author Contributions

Conceptualization, I.N. and C.D.; methodology, I.N. and C.D.; software, I.N.; validation, I.N., C.D., N.C. and Ș.I.; formal analysis, I.N.; investigation, I.N., C.D. and Ș.I.; resources, I.N., C.D. and N.C.; data curation, I.N., C.D., N.C. and Ș.I.; writing—original draft preparation, I.N. and C.D.; writing—review and editing, I.N., C.D., N.C. and Ș.I.; visualization, I.N., C.D., N.C. and Ș.I.; supervision, I.N., C.D. and N.C.; project administration, I.N. and C.D.; funding acquisition, I.N., C.D. and Ș.I. All authors have read and agreed to the published version of the manuscript.

Funding

This paper was co-financed by Bucharest University of Economic Studies during the PhD program. This work was funded by the EU’s NextGenerationEU instrument through the National Recovery and Resilience Plan of Romania—Pillar III-C9-I8, managed by the Ministry of Research, Innovation and Digitization, within the project entitled “Place-based Economic Policy in EU’s Periphery—fundamental research in collaborative development and local resilience. Projections for Romania and Moldova (PEPER)”, contract no. 760045/23.05.2023, code CF 275/30.11.2022.

Institutional Review Board Statement

Not applicable.

Informed Consent Statement

Not applicable.

Data Availability Statement

The data used in this study are publicly available from the World Bank Open Data platform. No new data were created during this study. All variables were downloaded and processed by the authors and can be made available upon reasonable request.

Conflicts of Interest

The authors declare no conflicts of interest.

Abbreviations

The following abbreviations are used in this manuscript:
ARDLAutoregressive Distributed Lag
CEECentral and Eastern Europe
ECTError Correction Term
EIPEEnergy intensity level of primary energy
CO2Carbon dioxide emissions
GDPGross Domestic Product
RDEResearch and development expenditure
RNECRenewable energy consumption
TRDTrade openness
URBUrban population
LLCLevin-Lin-Chy unit root test
IPSIm-Pesaran-Shin unit root test
ADFAugmented Dickey–Fuller
R&DResearch and Development
EUEuropean Union
SPRING-FDenotes a group of European countries characterized by different levels of sustainability performance and economic resilience, selected to capture heterogeneous trajectories of the energy transition.
MLMachine Learning
XGBoostExtreme Gradient Boosting
SHAPShapley Additive exPlanations
AIArtificial Intelligence

Appendix A

Figure A1. Time-series evolution of key energy transition variables (2000–2024) across the SPRING-F countries.
Applsci 16 01044 g0a1
Table A1. Kao residual-based panel cointegration test.
TestStatisticp-ValueConclusion
Kao ADF−4.650.00Cointegration
Table A2. Long-run standardized coefficients and elasticities.
VariableCoefficientStandardized CoefficientElasticity at Means
CO2−1.09−0.59−0.88
EIPE1.210.470.61
GDP2.612.9010.99
TRD−0.26−0.15−0.47
URB5.531.549.82
RDE0.330.350.03
Figure A2. Confidence intervals of long-run panel ARDL coefficients. The colored bars indicate the confidence intervals at the 0.9, 0.95, and 0.99 levels. The red horizontal marker labeled “Coef.” represents the point estimate of the long-run coefficient.
Applsci 16 01044 g0a2
Figure A3. Confidence ellipse for long-run coefficient stability. The blue ellipses represent the joint confidence regions of the estimated coefficients, while the red dots indicate the corresponding point estimates.
Applsci 16 01044 g0a3

Appendix B

Table A3. Robustness check: Panel ARDL (3, 2, 2, 2, 2, 2, 2) with CO2 as dependent variable.
VariableCoefficientStd. Errort-StatisticProb.
Long run equation
EIPE1.170.0813.520.00 ***
RNEC−0.230.03−6.830.00 ***
TRD0.380.123.020.00 ***
URB−3.020.44−6.780.00 ***
RDE0.120.033.150.00 ***
GDP0.600.105.810.00 ***
Short run equation
Cointeq01−0.510.16−3.140.00 ***
D (CO2 (−1))−0.140.13−1.080.28
D (CO2 (−2))−0.240.10−2.280.02 **
D (EIPE)0.060.130.440.65
D (EIPE (−1))0.250.112.170.03 **
D (RNEC)−0.130.08−1.630.10 *
D (RNEC (−1))−0.090.03−2.720.00 ***
D (TRD)−0.010.06−0.160.86
D (TRD (−1))−0.240.10−2.330.02
D (URB)−209.21148.92−1.400.16
D (URB (−1))64.8183.870.770.44
D (RDE)0.040.170.250.79
D (RDE (−1))0.220.201.080.28
D (GDP)0.380.261.470.14
D (GDP (−1))0.440.351.260.21
C3.671.292.830.00 ***
Validation metrics
Root MSE0.01Mean dependent variable−0.01
S.D. dependent var0.05S.E. of regression0.02
Akaike information criterion−4.30Sum squared residuals0.03
Schwarz criterion−2.17Log likelihood494.63
Hannan-Quinn criterion−1.90
*, **, *** significant at 10%, 5%, and 1% level.

References

  1. Ruan, W.; Guo, Z.; Yang, J.; Gao, L.; Dong, Y.; Liu, Q. Assessing the Progress toward Achieving Energy- and Climate-related Sustainable Development Goals under Four Global Energy Transition Outlooks. Sustain. Dev. 2024, 32, 3695–3707. [Google Scholar] [CrossRef] [Scilit]
  2. Yang, G.; Zha, D.; Cao, D.; Zhang, G. Time for a Change: Rethinking the Global Renewable Energy Transition from the Sustainable Development Goals and the Paris Climate Agreement. Innovation 2024, 5, 100582. [Google Scholar] [CrossRef] [Scilit]
  3. Gan, N.; Zhao, S. Global Greenhouse Gas Reduction Forecasting via Machine Learning Model in the Scenario of Energy Transition. J. Environ. Manag. 2024, 371, 123309. [Google Scholar] [CrossRef] [Scilit]
  4. Adebayo, T.S.; Saeed Meo, M.; Özkan, O. Scrutinizing the Impact of Energy Transition on GHG Emissions in G7 Countries via a Novel Green Quality of Energy Mix Index. Renew. Energy 2024, 226, 120384. [Google Scholar] [CrossRef] [Scilit]
  5. Mauro, M.R. Energy Security, Energy Transition, and Foreign Investments: An Evolving Complex Relationship. Laws 2024, 13, 48. [Google Scholar] [CrossRef] [Scilit]
  6. Bashir, M.F.; Pata, U.K.; Shahzad, L. Linking Climate Change, Energy Transition and Renewable Energy Investments to Combat Energy Security Risks: Evidence from Top Energy Consuming Economies. Energy 2025, 314, 134175. [Google Scholar] [CrossRef] [Scilit]
  7. Hu, X.; Zhang, W.; Zhang, S.; Hao, Y.; Cong, J. The Impacts of the Global Energy Transition on China’s Energy Security in the Long-Term: Heterogeneous Evidence from the Supply and Consumption Sides. Renew. Energy 2025, 255, 123784. [Google Scholar] [CrossRef] [Scilit]
  8. Omri, A.; Alghanem, A. Environmental Innovation for a Low-Carbon Economy: The Role of R&D and Financial Sector Development. Sustain. Dev. 2025, sd.70323. [Google Scholar] [CrossRef] [Scilit]
  9. Xuan, V.N. The Nexus between Innovation, Renewable Energy Consumption, Foreign Direct Investment, GDP, and CO2 Emissions in the Context of Vietnam: New Evidence from the ARDL Approach. Energy Environ. 2025, 0958305X251322893. [Google Scholar] [CrossRef] [Scilit]
  10. Pata, U.K.; Luo, R.; Kartal, M.T.; Adebayo, T.S.; Ullah, S. Do Technological Innovations and Clean Energies Ensure CO2 Reduction in China? A Novel Nonparametric Causality-in-Quantiles. Energy Environ. 2025, 36, 2815–2835. [Google Scholar] [CrossRef] [Scilit]
  11. Huo, C.; Hameed, J.; Albasher, G.; Dar, A.A. Digital and Sustainable Synergies: Insights into Green Investment, Technological Innovation, and Low-Carbon Economies. Energy Environ. 2025, 0958305X251395638. [Google Scholar] [CrossRef] [Scilit]
  12. Gakuru, E.; Yang, S.; Yang, L.; Adegboyo, O.S. Mediating Macroeconomic Performance in Green Energy Policies and Foreign Direct Investment Nexus: Do Transmission Mechanism Heterogeneities on Clean Energy Poverty and Carbon Neutrality Matter? Energy Environ. 2025, 0958305X251367110. [Google Scholar] [CrossRef] [Scilit]
  13. Vasa, L.; Kubatko, O.; Sotnyk, I.; Piven, V.; Trypolska, G.; Pysmenna, U. Economic and Environmental Drivers of Renewable Energy Transition in the EU. Environ. Econ. 2024, 15, 232–245. [Google Scholar] [CrossRef] [Scilit]
  14. Sarsar, L.; Echaoui, A. Empirical Analysis of the Economic Complexity Boost on the Impact of Energy Transition on Economic Growth: A Panel Data Study of 124 Countries. Energy 2024, 294, 130712. [Google Scholar] [CrossRef] [Scilit]
  15. Aydin, M.; Erdem, A. Analyzing the Impact of Resource Productivity, Energy Productivity, and Renewable Energy Consumption on Environmental Quality in EU Countries: The Moderating Role of Productivity. Resour. Policy 2024, 89, 104613. [Google Scholar] [CrossRef] [Scilit]
  16. Degirmenci, T.; Yavuz, H. Environmental Taxes, R&D Expenditures and Renewable Energy Consumption in EU Countries: Are Fiscal Instruments Effective in the Expansion of Clean Energy? Energy 2024, 299, 131466. [Google Scholar] [CrossRef] [Scilit]
  17. Behera, P.; Behera, B.; Sethi, N. Assessing the Impact of Fiscal Decentralization, Green Finance and Green Technology Innovation on Renewable Energy Use in European Union Countries: What Is the Moderating Role of Political Risk? Renew. Energy 2024, 229, 120715. [Google Scholar] [CrossRef] [Scilit]
  18. Gökgöz, F.; Güvercin, M.T. Energy Security and Renewable Energy Efficiency in EU. Renew. Sustain. Energy Rev. 2018, 96, 226–239. [Google Scholar] [CrossRef] [Scilit]
  19. Brożyna, J.; Strielkowski, W.; Fomina, A.; Nikitina, N. Renewable Energy and EU 2020 Target for Energy Efficiency in the Czech Republic and Slovakia. Energies 2020, 13, 965. [Google Scholar] [CrossRef] [Scilit]
  20. De Alegría Mancisidor, I.M.; Díaz De Basurto Uraga, P.; Martínez De Alegría Mancisidor, I.; Ruiz De Arbulo López, P. European Union’s Renewable Energy Sources and Energy Efficiency Policy Review: The Spanish Perspective. Renew. Sustain. Energy Rev. 2009, 13, 100–114. [Google Scholar] [CrossRef] [Scilit]
  21. Depoorter, V.; Oró, E.; Salom, J. The Location as an Energy Efficiency and Renewable Energy Supply Measure for Data Centres in Europe. Appl. Energy 2015, 140, 338–349. [Google Scholar] [CrossRef] [Scilit]
  22. Lin, T.-Y.; Chiu, Y.; Chen, C.-H.; Ji, L. Renewable Energy Consumption Efficiency, Greenhouse Gas Emission Efficiency, and Climate Change in Europe. Geoenergy Sci. Eng. 2025, 247, 213665. [Google Scholar] [CrossRef] [Scilit]
  23. Lin, Z.-H.; Laffan, S.W.; Metternicht, G. Role of Green Infrastructure Planning in Achieving Sustainable Development Goals through an Environmental Efficiency Lens: An Integrated Literature Review. Ecol. Indic. 2025, 174, 113471. [Google Scholar] [CrossRef] [Scilit]
  24. Galagoda, R.U.; Jayasinghe, G.Y.; Halwatura, R.U.; Rupasinghe, H.T. The Impact of Urban Green Infrastructure as a Sustainable Approach towards Tropical Micro-Climatic Changes and Human Thermal Comfort. Urban For. Urban Green. 2018, 34, 1–9. [Google Scholar] [CrossRef] [Scilit]
  25. Zarei, M.; Shahab, S. Nature-Based Solutions in Urban Green Infrastructure: A Systematic Review of Success Factors and Implementation Challenges. Land 2025, 14, 818. [Google Scholar] [CrossRef] [Scilit]
  26. Chatzimentor, A.; Apostolopoulou, E.; Mazaris, A.D. A Review of Green Infrastructure Research in Europe: Challenges and Opportunities. Landsc. Urban Plan. 2020, 198, 103775. [Google Scholar] [CrossRef] [Scilit]
  27. Kozera, A.; Satoła, Ł.; Standar, A. European Union Co-Funded Investments in Low-Emission and Green Energy in Urban Public Transport in Poland. Renew. Sustain. Energy Rev. 2024, 200, 114530. [Google Scholar] [CrossRef] [Scilit]
  28. Kwilinski, A.; Khaustova, V.; Trushkina, N. Transformation of the Energy Infrastructure in the Context of the Implementation of the European Green Deal. In Systems, Decision and Control in Energy VI; Babak, V., Zaporozhets, A., Eds.; Studies in Systems, Decision and Control; Springer Nature Switzerland: Cham, Switzerland, 2024; Volume 561, pp. 59–79. [Google Scholar]
  29. Villamor, E.; Akizu-Gardoki, O.; Azurza, O.; Urkidi, L.; Campos-Celador, A.; Basurko, I.; Barcena Hinojal, I. European Cities in the Energy Transition: A Preliminary Analysis of 27 Cities. Energies 2020, 13, 1315. [Google Scholar] [CrossRef] [Scilit]
  30. Grodzicki, T.; Jankiewicz, M. The Impact of Renewable Energy and Urbanization on CO2 Emissions in Europe–Spatio-Temporal Approach. Environ. Dev. 2022, 44, 100755. [Google Scholar] [CrossRef] [Scilit]
  31. Tagliapietra, S.; Zachmann, G.; Edenhofer, O.; Glachant, J.-M.; Linares, P.; Loeschel, A. The European Union Energy Transition: Key Priorities for the next Five Years. Energy Policy 2019, 132, 950–954. [Google Scholar] [CrossRef] [Scilit]
  32. Böhringer, C.; Cantner, U.; Costard, J.; Kramkowski, L.-V.; Gatzen, C.; Pietsch, S. Innovation for the German Energy Transition-Insights from an Expert Survey. Energy Policy 2020, 144, 111611. [Google Scholar] [CrossRef] [Scilit]
  33. Hewitt, R.J.; Winder, N.P.; Hernández Jiménez, V.; Martínez Alonso, P.; Román Bermejo, L. Innovation, Pathways and Barriers in Spain and beyond: An Integrative Research Approach to the Clean Energy Transition in Europe. Energy Res. Soc. Sci. 2017, 34, 260–271. [Google Scholar] [CrossRef] [Scilit]
  34. Gasser, M.; Pezzutto, S.; Sparber, W.; Wilczynski, E. Public Research and Development Funding for Renewable Energy Technologies in Europe: A Cross-Country Analysis. Sustainability 2022, 14, 5557. [Google Scholar] [CrossRef] [Scilit]
  35. Ragwitz, M.; Miola, A. Evidence from RD&D Spending for Renewable Energy Sources in the EU. Renew. Energy 2005, 30, 1635–1647. [Google Scholar] [CrossRef] [Scilit]
  36. Costantini, V.; Crespi, F. Environmental Policies and the Trade of Energy Technologies in Europe. Int. J. Glob. Environ. Issues 2008, 8, 445. [Google Scholar] [CrossRef] [Scilit]
  37. Al-Mulali, U.; Ozturk, I.; Lean, H.H. The Influence of Economic Growth, Urbanization, Trade Openness, Financial Development, and Renewable Energy on Pollution in Europe. Nat. Hazards 2015, 79, 621–644. [Google Scholar] [CrossRef] [Scilit]
  38. Wang, Q.; Zhang, F. Free Trade and Renewable Energy: A Cross-Income Levels Empirical Investigation Using Two Trade Openness Measures. Renew. Energy 2021, 168, 1027–1039. [Google Scholar] [CrossRef] [Scilit]
  39. Can, B.; Ahmed, Z.; Ahmad, M.; Can, M. Do Renewable Energy Consumption and Green Trade Openness Matter for Human Well-Being? Empirical Evidence from European Union Countries. Soc. Indic. Res. 2022, 164, 1043–1059. [Google Scholar] [CrossRef] [Scilit]
  40. Papież, M.; Śmiech, S.; Frodyma, K. Determinants of Renewable Energy Development in the EU Countries. A 20-Year Perspective. Renew. Sustain. Energy Rev. 2018, 91, 918–934. [Google Scholar] [CrossRef] [Scilit]
  41. Li, R.; Leung, G.C.K. The Relationship between Energy Prices, Economic Growth and Renewable Energy Consumption: Evidence from Europe. Energy Rep. 2021, 7, 1712–1719. [Google Scholar] [CrossRef] [Scilit]
  42. Ren, X.; Cheng, C.; Wang, Z.; Yan, C. Spillover and Dynamic Effects of Energy Transition and Economic Growth on Carbon Dioxide Emissions for the European Union: A Dynamic Spatial Panel Model. Sustain. Dev. 2021, 29, 228–242. [Google Scholar] [CrossRef] [Scilit]
  43. Apostu, S.A.; Panait, M.; Balsalobre-Lorente, D.; Ferraz, D.; Rădulescu, I.G. Energy Transition in Non-Euro Countries from Central and Eastern Europe: Evidence from Panel Vector Error Correction Model. Energies 2022, 15, 9118. [Google Scholar] [CrossRef] [Scilit]
  44. Pavlova, O.; Pavlov, K.; Liashenko, O.; Jamróz, A.; Kopeć, S. Gas in Transition: An ARDL Analysis of Economic and Fuel Drivers in the European Union. Energies 2025, 18, 3876. [Google Scholar] [CrossRef] [Scilit]
  45. Chen, W.; Zou, W.; Zhong, K.; Aliyeva, A. Machine Learning Assessment under the Development of Green Technology Innovation: A Perspective of Energy Transition. Renew. Energy 2023, 214, 65–73. [Google Scholar] [CrossRef] [Scilit]
  46. Xi, W.; Ping, Y.; Tao, J.; Ye, X.; Fu, M.; Zhang, Y.; Xie, M. Enhanced Prediction of Copper-Polymetallic Deposits in the Kalatag Mining District Using Integrated SVM and GIS Technology. Earth Sci. Inform. 2025, 18, 11. [Google Scholar] [CrossRef] [Scilit]
  47. Xi, W.; Ping, Y.; Tao, J.; Liu, C.; Shen, J.; Zhang, Y. Predicting Copper-Polymetallic Deposits in Kalatag Using the Weight of Evidence Model and Novel Data Sources. Open Geosci. 2023, 15, 20220588. [Google Scholar] [CrossRef] [Scilit]
  48. Luo, B.; Su, Y.; Ding, X.; Chen, Y.; Liu, C. Modulation of Initial CaO/Al2O3 and SiO2/Al2O3 Ratios on the Properties of Slag/Fly Ash-Based Geopolymer Stabilized Clay: Synergistic Effects and Stabilization Mechanism. Mater. Today Commun. 2025, 47, 113295. [Google Scholar] [CrossRef] [Scilit]
  49. Hesselmans, M.; Stellinga, B.; El-Dardiry, R.; François, D.; Bijleveld, C. A History of Business-Related Policies in the Netherlands. In Good Business; Research for Policy; Springer Nature Switzerland: Cham, Switzerland, 2025; pp. 43–81. [Google Scholar]
  50. Kranenburg, A.; Groenleer, M. From Innovation to Integration: Institutional Design Challenges for Emerging Energy Storage Technologies in the Netherlands. Energy Res. Soc. Sci. 2025, 126, 104141. [Google Scholar] [CrossRef] [Scilit]
  51. Handel, B.; Kolstad, J.; Minten, T.; Spinnewijn, J. The Socioeconomic Distribution of Choice Quality: Evidence from Health Insurance in the Netherlands. Am. Econ. Rev. Insights 2024, 6, 395–412. [Google Scholar] [CrossRef] [Scilit]
  52. Maghsoudi Nia, E.; Qian, Q.K.; Visscher, H.J. Occupants’ Inquiries for Energy Efficiency Retrofitting in the Netherlands. Energy Build. 2024, 308, 113990. [Google Scholar] [CrossRef] [Scilit]
  53. Silva, N.; Fuinhas, J.A.; Koengkan, M.; Kazemzadeh, E.; Kaymaz, V. Renewable Energy Deployment in Europe: Do Politics Matter? Environ. Dev. Sustain. 2023, 26, 28751–28784. [Google Scholar] [CrossRef] [Scilit]
  54. De Gooyert, V.; De Coninck, H.; Ter Haar, B. How to Make Climate Policy More Effective? The Search for High Leverage Points by the Multidisciplinary Dutch Expert Team ‘Energy System 2050’. Syst. Res. Behav. Sci. 2024, 41, 900–913. [Google Scholar] [CrossRef] [Scilit]
  55. Suttipun, M.; Insee, K. R&D Intensity and Firm Performance of SME Firms in Thailand: The Moderating Role of Firm Size. Cogent Bus. Manag. 2024, 11, 2304370. [Google Scholar] [CrossRef] [Scilit]
  56. Berbée, P.; Braun, S.T.; Franke, R. Reversing Fortunes of German Regions, 1926–2019: Boon and Bane of Early Industrialization? J. Econ. Growth 2025, 30, 307–337. [Google Scholar] [CrossRef] [Scilit]
  57. Meijering, B.; Schunder, T. Regional Determinants of Product Innovations in Start-Ups Across Urban and Rural Regions in Germany. Growth Change 2025, 56, e70056. [Google Scholar] [CrossRef] [Scilit]
  58. International Energy Agency Energy System of Germany. Available online: https://www.iea.org/countries/germany (accessed on 20 November 2025).
  59. Krok, D. The Intricacies of France’s Mixed Economic Framework. EconMethodology Blog. 2023. Available online: https://www.econmethodology.org/france-mixed-economy/ (accessed on 20 November 2025).
  60. Hayward, J.; Wright, V. Tactical Privatisation: Changing the Mix in a Mixed Economy. In Governing from the Centre; Oxford University Press: Oxford, UK, 2002; pp. 188–220. [Google Scholar]
  61. Cole, A. State Reform in France: From Public Service to Public Management? Perspect. Eur. Politics Soc. 2010, 11, 343–357. [Google Scholar] [CrossRef] [Scilit]
  62. World Nuclear Association Nuclear Power in France. Available online: https://world-nuclear.org/information-library/country-profiles/countries-a-f/france (accessed on 12 December 2025).
  63. International Energy Agency Energy System of France. Available online: https://www.iea.org/countries/france (accessed on 12 December 2025).
  64. OECD Spain Economic Snapshot. Available online: https://www.oecd.org/en/topics/sub-issues/economic-surveys/spain-economic-snapshot.html#:~:text=Spain’s%20economy%20has%20grown%20steadily,global%20uncertainty%20in%202026%E2%80%9327 (accessed on 12 December 2025).
  65. International Monetary Fund. Communications Department Finance & Development, June 2025: Europe: How It Can Turn Adversity to Advantage. Financ. Dev. 2025, 62, 72. [Google Scholar] [CrossRef] [Scilit]
  66. Strategic Energy Europe. Spain Nears 54% Renewable Generation in September Driven by Solar Photovoltaics. Available online: https://strategicenergy.eu/spain-nears-54-renewable-generation-in-september-driven-by-solar-photovoltaics/# (accessed on 12 December 2025).
  67. European Investment Bank. The Digitalisation of Small and Medium-Sized Enterprises in Italy. Available online: https://www.eib.org/attachments/thematic/digitalisation_of_smes_in_italy_summary_en.pdf (accessed on 12 December 2025).
  68. Aiello, F.; Errico, L.; Rondinella, S. Innovative SMEs in Italy. Explaining Profitability Patterns in Inner Areas. J. Econ. Stud. 2024, 51, 306–322. [Google Scholar] [CrossRef] [Scilit]
  69. Salvati, L.; Zitti, M.; Carlucci, M. In-between Regional Disparities and Spatial Heterogeneity: A Multivariate Analysis of Territorial Divides in Italy. J. Environ. Plan. Manag. 2017, 60, 997–1015. [Google Scholar] [CrossRef] [Scilit]
  70. Esposito, L.; Romagnoli, G. Overview of Policy and Market Dynamics for the Deployment of Renewable Energy Sources in Italy: Current Status and Future Prospects. Heliyon 2023, 9, e17406. [Google Scholar] [CrossRef] [Scilit]
  71. Tatti, A.; Ferroni, S.; Ferrando, M.; Motta, M.; Causone, F. The Emerging Trends of Renewable Energy Communities’ Development in Italy. Sustainability 2023, 15, 6792. [Google Scholar] [CrossRef] [Scilit]
  72. Gaeta, M.; Nsangwe Businge, C.; Gelmini, A. Achieving Net Zero Emissions in Italy by 2050: Challenges and Opportunities. Energies 2021, 15, 46. [Google Scholar] [CrossRef] [Scilit]
  73. Kronenberg, J.; Bergier, T. Sustainable Development in a Transition Economy: Business Case Studies from Poland. J. Clean. Prod. 2012, 26, 18–27. [Google Scholar] [CrossRef] [Scilit]
  74. Wolnicki, M.; Kwiatkowski, E.; Piasecki, R. Jobless Growth: A New Challenge for the Transition Economy of Poland. Int. J. Soc. Econ. 2006, 33, 192–206. [Google Scholar] [CrossRef] [Scilit]
  75. Pepłowska, M.; Tokarski, S.; Olczak, P. Modelling the Impact of Hard Coal Mining Reduction on the Structure Energy Mix and Economy in an Inter-Industry Approach—A Case Study of Poland. Energies 2025, 18, 6021. [Google Scholar] [CrossRef] [Scilit]
  76. Domański, B. Industrial Change and Foreign Direct Investment in the Postsocialist Economy: The Case of Poland. Eur. Urban Reg. Stud. 2003, 10, 99–118. [Google Scholar] [CrossRef] [Scilit]
  77. Juszczyk, O.; Juszczyk, J.; Juszczyk, S.; Takala, J. Barriers for Renewable Energy Technologies Diffusion: Empirical Evidence from Finland and Poland. Energies 2022, 15, 527. [Google Scholar] [CrossRef] [Scilit]
  78. Kryszk, H.; Kurowska, K.; Marks-Bielska, R.; Bielski, S.; Eźlakowski, B. Barriers and Prospects for the Development of Renewable Energy Sources in Poland during the Energy Crisis. Energies 2023, 16, 1724. [Google Scholar] [CrossRef] [Scilit]
  79. Budzianowski, W.M. Target for National Carbon Intensity of Energy by 2050: A Case Study of Poland’s Energy System. Energy 2012, 46, 575–581. [Google Scholar] [CrossRef] [Scilit]
  80. Antosiewicz, M.; Fuentes, J.R.; Lewandowski, P.; Witajewski-Baltvilks, J. Distributional Effects of Emission Pricing in a Carbon-Intensive Economy: The Case of Poland. Energy Policy 2022, 160, 112678. [Google Scholar] [CrossRef] [Scilit]
  81. Alupoaiei, A.; Kubinschi, M.; Neagu, F. On the Macroprudential Policy Stance in an Emerging Economy. East. Eur. Econ. 2025, 63, 591–609. [Google Scholar] [CrossRef] [Scilit]
  82. Zeqiri, J.; Koku, P.S.; Dobre, C.; Milovan, A.-M.; Hasani, V.V.; Paientko, T. The Impact of Social Media Marketing on Brand Awareness, Brand Engagement and Purchase Intention in Emerging Economies. Mark. Intell. Plan. 2025, 43, 28–49. [Google Scholar] [CrossRef] [Scilit]
  83. Lazar, D.; Litan, C.M. Inequality, Growth, and Structural Transformation: New Evidence from a Post-Communist Economy. Comp. Econ. Stud. 2024, 66, 236–260. [Google Scholar] [CrossRef] [Scilit]
  84. Nica, I.; Georgescu, I.; Chiriță, N. Simulation and Modelling as Catalysts for Renewable Energy: A Bibliometric Analysis of Global Research Trends. Energies 2024, 17, 3090. [Google Scholar] [CrossRef] [Scilit]
  85. Delcea, C.; Nica, I.; Georgescu, I.; Chiriță, N.; Ciurea, C. Integrating Fuzzy MCDM Methods and ARDL Approach for Circular Economy Strategy Analysis in Romania. Mathematics 2024, 12, 2997. [Google Scholar] [CrossRef] [Scilit]
  86. Ionescu, Ș.; Georgescu, I.; Nica, I.; Delcea, C. Exploring Financial Contagion and the Energy Kuznets Curve in the Context of Romania’s Transitions to a Circular Economy. Proc. Int. Conf. Bus. Excell. 2025, 19, 5328–5342. [Google Scholar] [CrossRef] [Scilit]
  87. Menegaki, A.N. The ARDL Method in the Energy-Growth Nexus Field; Best Implementation Strategies. Economies 2019, 7, 105. [Google Scholar] [CrossRef] [Scilit]
  88. Georgescu, I.; Nica, I.; Chiriță, N.; Kinnunen, J. Economic Dynamics of Informal Output in Romania: An ARDL Approach to Policy, Growth, and Institutional Sustainability. Sustainability 2025, 17, 10920. [Google Scholar] [CrossRef] [Scilit]
  89. Georgescu, I.; Nica, I.; Delcea, C.; Chiriță, N.; Ionescu, Ș. Assessing Regional Economic Performance in Romania Through Panel ARDL and Panel Quantile Regression Models. Sustainability 2024, 16, 9287. [Google Scholar] [CrossRef] [Scilit]
  90. Wang, L. Research on the Dynamic Relationship between China’s Renewable Energy Consumption and Carbon Emissions Based on ARDL Model. Resour. Policy 2022, 77, 102764. [Google Scholar] [CrossRef] [Scilit]
  91. Pesaran, M.H.; Shin, Y.; Smith, R.P. Pooled Mean Group Estimation of Dynamic Heterogeneous Panels. J. Am. Stat. Assoc. 1999, 94, 621–634. [Google Scholar] [CrossRef]
  92. Przychodzen, W.; Przychodzen, J. Determinants of Renewable Energy Production in Transition Economies: A Panel Data Approach. Energy 2020, 191, 116583. [Google Scholar] [CrossRef] [Scilit]
  93. Khan, I.; Zakari, A.; Ahmad, M.; Irfan, M.; Hou, F. Linking Energy Transitions, Energy Consumption, and Environmental Sustainability in OECD Countries. Gondwana Res. 2022, 103, 445–457. [Google Scholar] [CrossRef] [Scilit]
  94. Levin, A.; Lin, C.-F.; James Chu, C.-S. Unit Root Tests in Panel Data: Asymptotic and Finite-Sample Properties. J. Econom. 2002, 108, 1–24. [Google Scholar] [CrossRef] [Scilit]
  95. Im, K.S.; Pesaran, M.H.; Shin, Y. Testing for Unit Roots in Heterogeneous Panels. J. Econom. 2003, 115, 53–74. [Google Scholar] [CrossRef] [Scilit]
  96. Dickey, D.A.; Fuller, W.A. Distribution of the Estimators for Autoregressive Time Series with a Unit Root. J. Am. Stat. Assoc. 1979, 74, 427–431. [Google Scholar] [CrossRef] [Scilit] [PubMed]
  97. Maddala, G.S.; Wu, S. A Comparative Study of Unit Root Tests with Panel Data and a New Simple Test. Oxf. Bull. Econ. Stat. 1999, 61, 631–652. [Google Scholar] [CrossRef] [Scilit]
  98. European Commission. The European Green Deal. Available online: https://commission.europa.eu/strategy-and-policy/priorities-2019-2024/european-green-deal_en (accessed on 9 June 2024).
  99. Tay, J.K.; Narasimhan, B.; Hastie, T. Elastic Net Regularization Paths for All Generalized Linear Models. J. Stat. Softw. 2023, 106, 1–31. [Google Scholar] [CrossRef] [Scilit]
  100. Karunakaran, C.; Niranjan, V.; Setlur, A.S. Random Forest and XGBoost-Based Ensemble Models for Colorectal Cancer Exome Variant Classification and Web Application Deployment for Early Prediction. Comput. Struct. Biotechnol. Rep. 2025, 2, 100063. [Google Scholar] [CrossRef] [Scilit]
  101. Dunn, A.; English, E.; Hood, K.; Mason, L.; Quistorff, B. Economic Measurement Lost in a Random Forest? A Case Study of Employment Data. AEA Pap. Proc. 2025, 115, 68–72. [Google Scholar] [CrossRef] [Scilit]
  102. Kohlscheen, E. Forecasting Oil Prices with Random Forests. Empir. Econ. 2024, 66, 927–943. [Google Scholar] [CrossRef] [Scilit]
  103. Lu, J.; Li, J.; Zhao, G.; Liu, K.; Yang, J. Energy-Efficient Power Marketing Optimization Using XGBoost for Enhanced Market Performance. Sustain. Comput. Inform. Syst. 2026, 49, 101243. [Google Scholar] [CrossRef] [Scilit]
  104. Sowmya, R.B.; Kruthi, H.J.; Sanjana, M.N.; Vidhya Shree, N.S.; Keerthan Kumar, T.G. Crop Recommendation System Leveraging Weather Forecast Data Using Random Forest. In Proceedings of the 2025 3rd International Conference on Data Science and Network Security (ICDSNS), Tiptur, India, 25–26 July 2025; IEEE: Piscataway, NJ, USA, 2025; pp. 1–8. [Google Scholar]
  105. Breiman, L. Random Forests. Mach. Learn. 2001, 45, 5–32. [Google Scholar] [CrossRef] [Scilit]
  106. Antoniadis, A.; Cugliari, J.; Fasiolo, M.; Goude, Y.; Poggi, J.-M. Random Forests. In Statistical Learning Tools for Electricity Load Forecasting; Statistics for Industry, Technology, and Engineering; Springer International Publishing: Cham, Switzerland, 2024; pp. 99–111. [Google Scholar]
  107. Chen, T.; Guestrin, C. XGBoost: A Scalable Tree Boosting System. In Proceedings of the 22nd ACM SIGKDD International Conference on Knowledge Discovery and Data Mining, San Francisco, CA, USA, 13–17 August 2016; ACM: New York, NY, USA, 2016; pp. 785–794. [Google Scholar]
  108. Niazkar, M.; Menapace, A.; Brentan, B.; Piraei, R.; Jimenez, D.; Dhawan, P.; Righetti, M. Applications of XGBoost in Water Resources Engineering: A Systematic Literature Review (Dec 2018–May 2023). Environ. Model. Softw. 2024, 174, 105971. [Google Scholar] [CrossRef] [Scilit]
  109. Karbassiyazdi, E.; Fattahi, F.; Yousefi, N.; Tahmassebi, A.; Taromi, A.A.; Manzari, J.Z.; Gandomi, A.H.; Altaee, A.; Razmjou, A. XGBoost Model as an Efficient Machine Learning Approach for PFAS Removal: Effects of Material Characteristics and Operation Conditions. Environ. Res. 2022, 215, 114286. [Google Scholar] [CrossRef] [Scilit] [PubMed]
  110. Zou, H.; Hastie, T. Regularization and Variable Selection Via the Elastic Net. J. R. Stat. Soc. Ser. B Stat. Methodol. 2005, 67, 301–320. [Google Scholar] [CrossRef] [Scilit]
  111. Meng, K.; Gai, Y.; Wang, X.; Yao, M.; Sun, X. Transfer Learning for High-Dimensional Linear Regression via the Elastic Net. Knowl. Based Syst. 2024, 304, 112525. [Google Scholar] [CrossRef] [Scilit]
  112. Gillariose, J.; Joseph, J.; Chesneau, C. Lasso and Ridge Regression: A Comprehensive Review of Applications and Developments in Machine Learning. Int. J. Data Sci. Anal. 2026, 21, 7. [Google Scholar] [CrossRef] [Scilit]
  113. Makumbura, R.K.; Mampitiya, L.; Rathnayake, N.; Meddage, D.P.P.; Henna, S.; Dang, T.L.; Hoshino, Y.; Rathnayake, U. Advancing Water Quality Assessment and Prediction Using Machine Learning Models, Coupled with Explainable Artificial Intelligence (XAI) Techniques like Shapley Additive Explanations (SHAP) for Interpreting the Black-Box Nature. Results Eng. 2024, 23, 102831. [Google Scholar] [CrossRef] [Scilit]
  114. Miao, K.; Houssou Hounye, A.; Su, L.; Pan, Q.; Wang, J.; Hou, M.; Xiong, L. Exploring Explainable Machine Learning and Shapley Additive exPlanations (SHAP) Technique to Uncover Key Factors of HNSC Cancer: An Analysis of the Best Practices. Biomed. Signal Process. Control. 2024, 89, 105752. [Google Scholar] [CrossRef] [Scilit]
  115. Luetkepohl, H.; Xu, F. The Role of Log Transformation in Forecasting Economic Variables. SSRN J. 2009. [Google Scholar] [CrossRef] [Scilit]
  116. West, R.M. Best Practice in Statistics: The Use of Log Transformation. Ann. Clin. Biochem. 2022, 59, 162–165. [Google Scholar] [CrossRef] [Scilit]
  117. Nica, I.; Georgescu, I.; Kinnunen, J. An Autoregressive Distributed Lag and Environmental Kuznets Curve Approach: Linking CO2 Emissions and Electricity Access in India. Sustainability 2024, 16, 11278. [Google Scholar] [CrossRef] [Scilit]
  118. Naz, F.; Tanveer, A.; Karim, S.; Dowling, M. The Decoupling Dilemma: Examining Economic Growth and Carbon Emissions in Emerging Economic Blocs. Energy Econ. 2024, 138, 107848. [Google Scholar] [CrossRef] [Scilit]
  119. Lojanica, N.; Pantović, D.; Dimitrijević, M.; Obradović, S.; Nancu, D. The Effects of Renewable Energy, Economic Growth, and Trade on CO2 Emissions in the EU-15. Energies 2025, 18, 4363. [Google Scholar] [CrossRef] [Scilit]
  120. Saglam, M.S.; Yilanci, V.; Kongkuah, M. Decoupling Economic Growth and Carbon Emissions: A Time-Varying Analysis of the Environmental Kuznets Curve Hypothesis in France (1890–2019). Environ. Dev. Sustain. 2025. [Google Scholar] [CrossRef] [Scilit]
Figure 1. Distributional analysis across countries.
Applsci 16 01044 g001
Figure 2. Temporal dynamics and cross-country patterns.
Applsci 16 01044 g002
Figure 3. Lag-order selection using Akaike Information Criterion. The dots indicate the AIC values for each ARDL specification, while the green vertical arrows highlight the relative differences in AIC across competing models, facilitating the identification of the optimal lag structure (minimum AIC).
Applsci 16 01044 g003
Figure 4. Distribution of ARDL model residuals and normality assessment.
Applsci 16 01044 g004
Figure 5. ARDL in-sample forecasts for RNEC across SPRING-F.
Applsci 16 01044 g005
Figure 6. SHAP summary plot for Random Forest model.
Applsci 16 01044 g006
Figure 7. SHAP summary plot for XGBoost model.
Applsci 16 01044 g007
Figure 8. Country-level SHAP summary plots for the XGBoost model (SPRING-F countries).
Applsci 16 01044 g008
Table 1. Economic structure and sustainability features of the SPRING-F countries.
European SubregionCountryEconomic ProfileSustainability Features
North-Western EuropeNetherlandsOpen and competitive economy [49]; Innovation-oriented [50]; High incomes [51]; Stable and highly rated, but also with strong trade.Advanced renewable energy deployment; high energy efficiency; strong climate policies; high R&D intensity [52,53,54,55]
GermanyLarge, diversified industrial economy; export-oriented; strong manufacturing base; high technological capacity [55,56,57]Leader in renewable energy transition; strong environmental regulations; high R&D expenditure; consistent emission reduction efforts [58]
FranceDeveloped mixed economy; strong public sector involvement; high productivity; strategic industrial policies [59,60,61]Significant nuclear and renewable energy mix; stable decarbonization trajectory; strong institutional climate framework [62,63]
Southern EuropeSpainService-oriented economy; medium-high income; increasing openness; tourism and industry driven [64,65]Rapid growth of renewable energy (solar and wind); improving energy efficiency; moderate emission reduction [66]
ItalyDiversified economy with strong SMEs; moderate growth; regional economic disparities [67,68,69]Steady renewable energy adoption; progress in energy efficiency; structural challenges in decarbonization [70,71,72]
Central and Eastern EuropePolandTransition economy; coal-dependent energy structure; medium income; growing industrial base [73,74,75,76]Slower renewable energy adoption; high carbon intensity; ongoing structural energy transition [77,78,79,80]
RomaniaEmerging economy; lower income levels; structural transformation in progress [81,82,83]Improving renewable energy use; high energy intensity; increasing alignment with EU climate objectives [84,85,86]
Table 2. Indicators used in the empirical analysis.
AcronymIndicatorDescriptionSource
RNECRenewable energy consumption (% of total final energy consumption)Share of renewable sources in total final energy useWorld Bank
EIPEEnergy intensity level of primary energy (MJ/$2021 PPP GDP)Energy use per unit of economic outputWorld Bank
CO2 Carbon   dioxide   ( C O 2 )   emissions   excluding   LULUCF   per   capita   ( t   C O 2 e/capita)Per capita carbon dioxide emissionsWorld Bank
GDPGDP per capita (constant 2015 US$)Level of economic developmentWorld Bank
TRDTrade (% of GDP)Degree of trade opennessWorld Bank
URBUrban population (% of total population)Level of urbanizationWorld Bank
RDEResearch and development expenditure (% of GDP)Investment in innovation and technologyWorld Bank
Table 3. Descriptive statistics.
StatisticsRNECEIPECO2GDPTRDURBRDE
Mean2.401.211.9310.104.304.260.27
Std. dev.0.570.220.310.630.320.150.60
Minimum0.530.751.318.423.803.96−1.01
Q1 (25th percentile)2.0791.041.699.604.064.11−0.01
Median2.521.212.0310.384.204.330.34
Q3 (75th percentile)2.811.372.1510.564.454.370.78
Maximum3.1941.782.4410.855.214.531.152
Skewness−1.070.38−0.23−0.970.95−0.50−0.58
Kurtosis4.032.621.862.623.102.172.27
Jarque–Bera41.485.2410.9828.9626.7512.5513.98
Table 4. Panel unit root tests.
At levels
TestRNECEIPECO2GDPTRDURBRDE
Unit root (Common unit root process)
LLC−3.9 ***
(0.00)
−0.97
(0.21)
1.04
(0.85)
−1.16
(0.12)
−3.20 ***
(0.00)
1.66
(0.95)
−1.19
(0.11)
Unit root (Individual unit root process)
IPS−0.50
(0.30)
2.90
(0.99)
2.14
(0.98)
1.19
(0.88)
−0.44
(0.32)
−1.93 **
(0.02)
0.30
(0.61)
ADF—Fischer Chi-square21.42 *
(0.09)
2.81
(0.99)
13.65
(0.47)
6.34
(0.95)
12.45
(0.56)
53.09 ***
(0.00)
13.00
(0.52)
At first difference
Unit root (Common unit root process)
LLC−4.72 ***
(0.00)
−7.50 ***
(0.00)
−7.77 ***
(0.00)
−8.67 ***
(0.00)
−11.02 ***
(0.00)
−2.65 ***
(0.00)
−4.93 ***
(0.00)
Unit root (Individual unit root process)
IPS−4.40 ***
(0.00)
−7.76 ***
(0.00)
−9.14 ***
(0.00)
−7.84 ***
(0.00)
−10.42 ***
(0.00)
−3.29 ***
(0.00)
−4.65 ***
(0.00)
ADF—Fischer Chi-square45.71 ***
(0.00)
80.70 ***
(0.00)
96.21 ***
(0.00)
81.80 ***
(0.00)
110.64 ***
(0.00)
43.81 ***
(0.00)
49.42 ***
(0.00)
*, **, *** significant at 10%, 5%, and 1% level.
Table 5. Panel ARDL (3, 2, 2, 2, 2, 2, 2).
VariableCoefficientStd. Errort-StatisticProb.
Long-run equation
EIPE1.210.572.110.03 **
CO2−1.090.37−2.920.00 ***
TRD−0.260.27−0.940.34
URB5.531.733.170.00 ***
RDE0.330.211.550.12
GDP2.610.723.630.00 ***
Short-run equation
Cointeq01−0.470.23−2.010.04 **
D (RNEC (−1))−0.300.18−1.640.10 *
D (RNEC (−2))0.120.150.780.43
D (EIPE)−0.610.35−1.730.08 *
D (EIPE (−1))−0.050.32−0.160.86
D (CO2)−0.430.30−1.400.16
D (CO2 (−1))−0.440.34−1.290.20
D (TRD)0.210.161.280.20
D (TRD (−1))−0.220.14−1.550.12
D (URB)31.27207.280.150.88
D (URB (−1))27.74100.180.270.78
D (RDE)−0.030.56−0.060.94
D (RDE (−1))1.010.273.570.00 ***
D (GDP)−0.550.94−0.580.56
D (GDP (−1))0.280.420.660.50
C−23.5012.01−1.950.05 **
Validation metrics
Root MSE0.02Mean dependent variable0.04
S.D. dependent var0.07S.E. of regression0.04
Akaike information criterion−2.76Sum squared residuals0.09
Schwarz criterion−0.63Log likelihood360.23
Hannan-Quinn criterion−1.90
*, **, *** significant at 10%, 5%, and 1% level.
Table 6. Predictive performance of ML models.
ModelR2RMSEMAE
Random Forest0.960.1080.08
XGBoost0.970.1050.07
ElasticNet0.670.340.25
Disclaimer/Publisher’s Note: The statements, opinions and data contained in all publications are solely those of the individual author(s) and contributor(s) and not of MDPI and/or the editor(s). MDPI and/or the editor(s) disclaim responsibility for any injury to people or property resulting from any ideas, methods, instructions or products referred to in the content.