Article

A Design Decision Support Method for Engineering Equipment Styling Based on the Mapping of Kansei Semantics to Objective Aesthetic Indicators

by
Aihua Qu
1,
Shuyong Duan
2 and
Jixing Shi
1,*
1
School of Architecture and Art Design, Hebei University of Technology, Tianjin 300401, China
2
State Key Laboratory of Smart Power Distribution Equipment and System, Hebei University of Technology, Tianjin 300401, China
*
Author to whom correspondence should be addressed.
Appl. Sci. 2026, 16(19), 9950; https://doi.org/10.3390/app16199950 (registering DOI)
Submission received: 8 September 2026 / Revised: 2 October 2026 / Accepted: 6 October 2026 / Published: 8 October 2026

Abstract

The styling design of engineering equipment is jointly constrained by functional requirements, structural characteristics, and professional application contexts. Therefore, design decisions need to consider both subjective Kansei preferences and objective form characteristics. However, Kansei semantics and objective aesthetic indicators belong to different evaluation spaces, making their direct integration difficult. To address this issue, a design decision method for engineering equipment styling based on the mapping between Kansei semantics and objective aesthetic indicators is proposed. After establishing subjective and objective indicator systems, an explanatory contribution mapping matrix between Kansei semantic sub-criteria and objective aesthetic indicators is constructed using the LMG relative importance analysis method. The subjective weights are then projected into the objective aesthetic indicator space, and the mapped subjective equivalent weights are fused with objective weights through the entropy-modified Dempster–Shafer (D-S) evidence theory to obtain a comprehensive decision model for styling scheme evaluation. A high-speed railway contact-wire inspection vehicle (HRCIV) is selected as a case study. The proposed method exhibits high consistency with the preference ranking of an independent participant group, with a mean rank deviation of 0.533 rank positions on a 1–15 scale. The results demonstrate that the proposed method enables interpretable mapping and unified fusion of heterogeneous subjective and objective information, providing quantitative support for styling design decisions for function-constrained engineering equipment.

1. Introduction

The styling design of engineering equipment is deeply coupled with stringent engineering functions and structural logic [1]. This characteristic means that such design cannot be separated from its professional application context and requires coordinated consideration of functional attributes, structural characteristics, and form quality [2]. Therefore, styling design decision-making for engineering equipment should reflect Kansei aesthetic preferences within professional contexts while also relying on quantifiable and reproducible objective aesthetic criteria [3,4].
In product design decision-making, Kansei semantics can represent user requirements [5], perceptual preferences [6], or consumption intentions [7]. Related studies have gradually evolved from Kansei word extraction and preference evaluation toward modeling the relationships between Kansei cognition and product form features [8]. Meanwhile, computational aesthetics quantifies the visual order of product forms through measurable indicators such as balance, symmetry, proportion, and rhythm, thereby providing an objective analytical basis for aesthetic evaluation of styling schemes [9,10,11,12]. As product design decision-making has increasingly shifted from experience-based judgment toward multi-source information-driven approaches, subjective–objective combination weighting methods have been widely adopted to integrate evaluation information from different sources [13,14]. Fu et al. [15] investigated Ming-style furniture design and employed SFAHP and CRITIC to determine the subjective and objective weights of user emotional requirements, respectively, followed by game-theoretic combination weighting to identify key Kansei requirements. Qian et al. [16] evaluated smart pet water fountain designs by combining AHP with an improved CRITIC method to obtain subjective and objective weights for subsequent scheme ranking and optimization. Lai et al. [17] investigated automobile exterior design evaluation by incorporating multi-source data, including self-reported responses, eye-tracking data, and electroencephalography data, and achieved comprehensive evaluation through subjective–objective weight fusion. Song et al. [18] evaluated design concepts for smart product-service systems by deriving subjective and objective weights using BWM and CRITIC, respectively, and integrating rough set theory for comprehensive scheme evaluation.
These studies demonstrate that subjective–objective combination weighting has become an important approach for integrating expert cognition with objective data. However, existing methods are generally established within a unified evaluation indicator system, where differences between subjective and objective information mainly arise from the sources of weighting information or the weighting procedures, while Kansei cognition and objective form principles are rarely represented as two relatively independent evaluation spaces [19]. Therefore, when the two types of information differ substantially in semantic connotations, indicator structures, and evaluation dimensions, how to establish interpretable cross-space relationships and achieve information fusion while preserving their respective characteristics remains an important issue in styling design decision-making for engineering equipment [20,21].
For highly specialized engineering equipment, styling design decisions need to reflect both Kansei cognition within the professional context and quantifiable objective aesthetic order [22]. It is therefore necessary to establish separate Kansei semantic and objective aesthetic indicator systems so that the semantic characteristics and information content of the two types of evaluation information can be preserved independently. To address the difficulty of directly relating and integrating these two evaluation spaces, this study uses a high-speed railway contact-wire inspection vehicle (HRCIV) as the research object and explores the interpretable relationships between Kansei semantics and objective aesthetic indicators, as well as their application to styling design decision-making. The main contributions of this study are summarized as follows:
(1)
An independent representation framework for subjective and objective information is established. Kansei semantics and objective aesthetic indicators are used to characterize subjective perception in professional contexts and objective form principles, respectively, thereby preserving the independence of the two types of evaluation information at both the semantic and data levels.
(2)
An explanatory contribution mapping method between Kansei semantics and objective aesthetic indicators is proposed. LMG relative importance analysis is employed to characterize the explanatory contributions between Kansei semantic sub-criteria and objective aesthetic indicators, enabling an interpretable cross-space transformation between heterogeneous evaluation information.
(3)
A mapping-driven subjective–objective fusion decision method is developed. Subjective equivalent weights and objective weights are integrated within a unified objective aesthetic indicator space, and the application results and stability of the proposed method are examined through the HRCIV case study.

2. Methodology

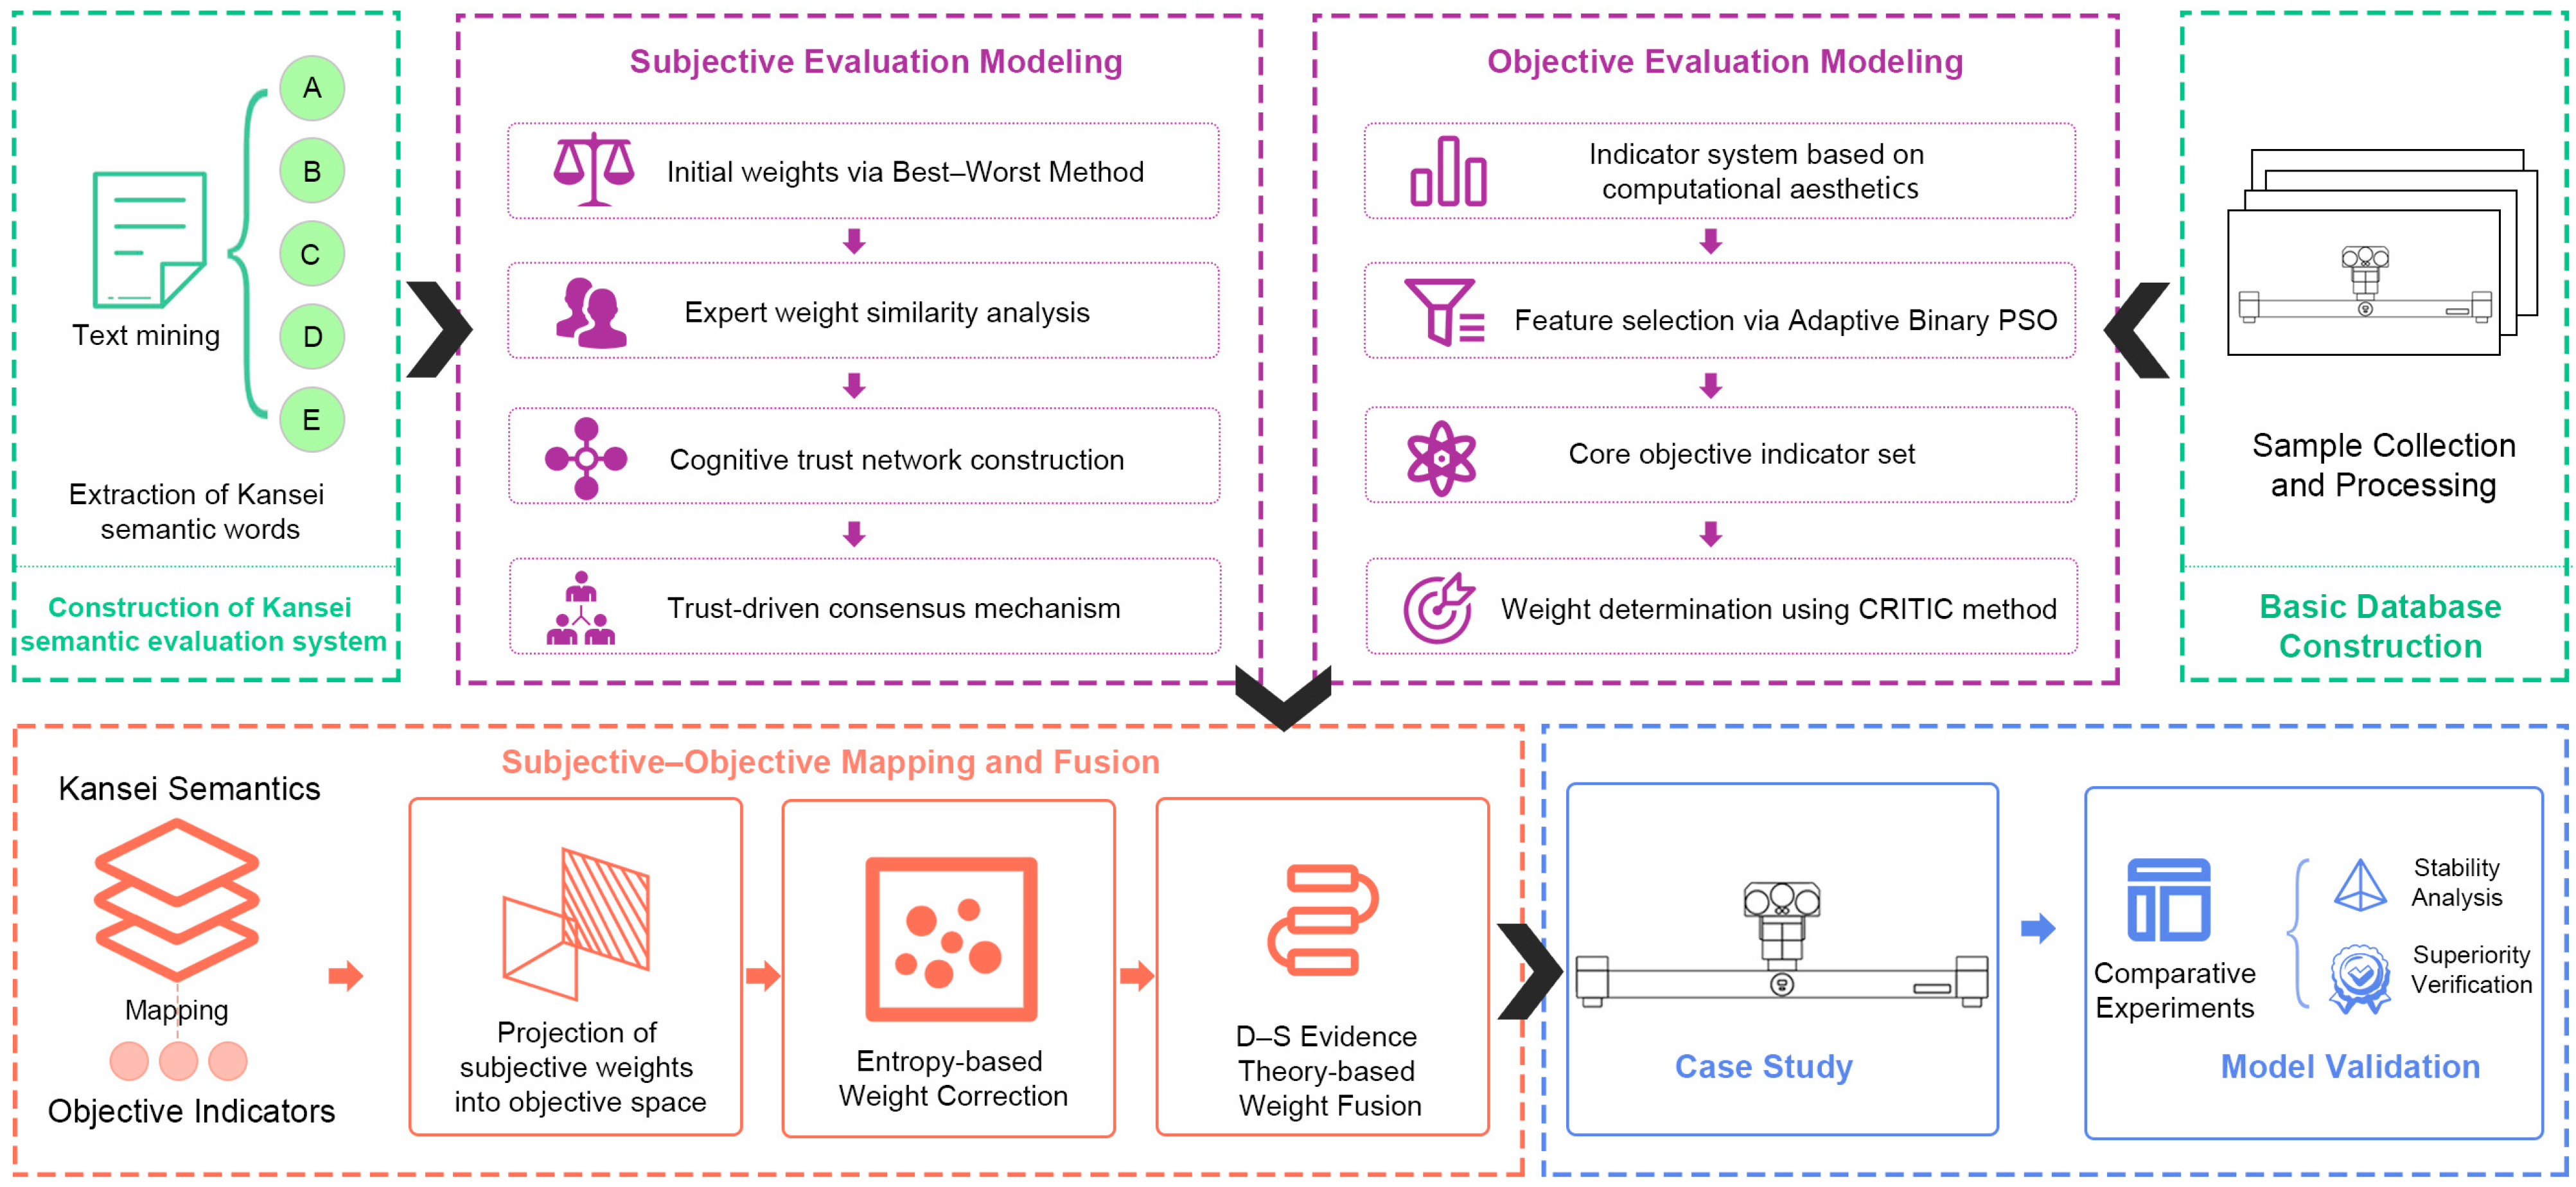
The engineering equipment styling design decision method developed in this study consists of four stages: evaluation system construction, subjective and objective weight determination, explanatory contribution mapping, and evidence fusion. First, separate evaluation systems are established for Kansei semantics and objective aesthetic indicators, and the corresponding weights are determined. Next, based on the explanatory contribution relationships, the Kansei semantic weights are projected into the objective aesthetic indicator space to obtain equivalent subjective weights. Finally, the equivalent subjective weights and objective weights are fused within the unified indicator space to obtain comprehensive decision weights for styling scheme evaluation and ranking. The overall procedure is shown in Figure 1.

2.1. Decision Indicator System Construction

The styling design decision indicator system is intended to jointly characterize subjective aesthetic preferences in professional application contexts and the objective aesthetic order embodied in sample forms. At the subjective level, a Kansei semantic indicator system is constructed by integrating text mining, semantic clustering, expert synthesis, and hierarchical decomposition. Kansei semantic terms relevant to the target product are extracted, clustered, and screened. Because the criterion-level semantics are relatively abstract, they are further decomposed into sub-criteria with explicit form-related meanings, thereby providing a semantic basis for the subsequent explanatory contribution mapping between Kansei semantics and objective aesthetic indicators.
At the objective level, computational aesthetics is used as the basis for constructing the objective aesthetic indicator system. Visual order related to balance, symmetry, proportion, rhythm, and centroid stability is transformed into quantifiable and comparable indicators. Unlike geometric parameters that directly describe local component features, objective aesthetic indicators characterize the overall formal order and aesthetic regularities of styling schemes, providing reproducible objective decision criteria for the ranking and selection of different styling alternatives.

2.2. Subjective and Objective Weight Determination

2.2.1. Trust-Driven BWM for Subjective Weight Determination

The Best–Worst Method (BWM), proposed by Rezaei [23], determines criterion weights by identifying the best and worst criteria and constructing the corresponding pairwise comparison vectors, thereby reducing the complexity of consistency checking. Suppose that the expert panel consists of K experts and that the subjective evaluation system contains n criteria. For each expert E k ( k = 1 , 2 , … , K ), the best criterion c B and the worst criterion c W are identified, and the best-to-others and others-to-worst comparison vectors, A B ( k ) and A W ( k ) , are constructed using a 1–9 scale.
To obtain the optimal weight vector W k , a linear programming model is formulated by minimizing the maximum deviation between the comparison vectors and the weight vector:
min ξ k     s . t . w k B − a B j ( k ) w k j ≤ ξ k ,   w k B − a B j ( k ) w k j ≥ − ξ k ,   ∀ j ∈ 1 , … , n     w k j − a j W ( k ) w k W ≤ ξ k ,   w k j − a j W ( k ) w k W ≥ − ξ k ,   ∀ j ∈ 1 , … , n     ∑ j = 1 n w k j = 1 ,   w k j ≥ 0
Solving Equation (1) yields the initial subjective weight vector W k ( 0 ) and the consistency deviation ξ k for each expert. A group consensus framework incorporating similarity-based cognitive trust and a negotiation feedback mechanism is then introduced. The Euclidean distance between expert weight vectors is used to characterize the consistency of their evaluation preferences. Accordingly, the cognitive similarity between experts E k and E l at iteration t is defined as:
Sim ( t ) E k , E l = 1 − d ( t ) E k , E l max a , b d ( t ) E a , E b
When the maximum distance is zero, the similarity is set to 1. Based on the similarity values, an expert cognitive trust matrix T is constructed, where T k l ( t ) = S i m ( t ) ( E k , E l ) denotes the trust strength and T k k ( t ) = 1 denotes self-trust. The relative authority weight λ k of each expert is determined by the degree of trust assigned to that expert by the group and is calculated by normalizing the in-degree of the trust network:
λ k ( t ) = ∑ l = 1 , l ≠ k K T l k ( t ) ∑ k = 1 K ∑ l = 1 , l ≠ r K T l r ( t )
The group average weight vector at iteration t is given by:
W _ ( t ) = ∑ k = 1 K λ k t W k ( t )
The individual consensus degree of expert E k is defined as C D k ( t ) = 1 − ∥ W k ( t ) − W _ ( t ) ∥ 2 . A consensus threshold of γ = 0.85 is adopted [24,25]. For the present case involving 10 experts and 14 sub-criteria, this threshold was selected to ensure a relatively high level of agreement while avoiding excessive convergence that could suppress individual expert judgments. If all experts satisfy C D k ( t ) ≥ γ , group consensus is reached and the iterative process terminates; otherwise, the negotiation adjustment stage is initiated. The weight vectors of experts who do not meet the consensus threshold are updated according to the trust feedback rule:
W k ( t + 1 ) = ( 1 − η ) W k ( t ) + η ∑ l = 1 , l ≠ k K T k l ( t ) W l ( t ) ∑ r = 1 , r ≠ k K T k r ( t )
where the adjustment step size η ranges from 0 to 1. This convex-combination update rule guides the weight vectors of low-consensus experts toward the weighted center of their highly trusted peers, thereby promoting group cognitive convergence while preserving individual professional judgments. However, such consensus-oriented adjustment may also reduce the influence of minority expert judgments to some extent, reflecting a trade-off between consensus formation and the preservation of individual opinions. After convergence, the final weight vectors of all experts are aggregated to obtain the group-consensus subjective weights of the sub-criteria:
w j sub = ∑ k = 1 K λ k ( T ) w k j ( T ) ,   j = 1 , 2 , … , m

2.2.2. CRITIC-Based Objective Aesthetic Weight Determination

To quantify the information contained in each objective indicator and determine its relative importance, the Criteria Importance Through Intercriteria Correlation (CRITIC) method [26] is employed to calculate the objective weights. Let the initial evaluation matrix be X = ( x i j ) N × p , where N denotes the number of inspection vehicle samples and p denotes the number of selected objective indicators. The positive and negative indicators are normalized as follows:
x i j ′ = x i j − min 1 ≤ i ≤ N { x i j } max 1 ≤ i ≤ N { x i j } − min 1 ≤ i ≤ N { x i j }
x i j ′ = max 1 ≤ i ≤ N { x i j } − x i j max 1 ≤ i ≤ N { x i j } − min 1 ≤ i ≤ N { x i j }
The standard deviation S j is calculated for indicator j to quantify its contrast intensity:
S j = 1 N − 1 ∑ i = 1 N ( x i j ′ − x _ j ′ ) 2
where x _ j ′ denotes the mean value of indicator j . A larger S j indicates that the indicator contains more information. The Pearson correlation coefficient r v j between indicators v and j is then calculated, and the conflict of indicator j with the other indicators is quantified as R j :
R j = ∑ v = 1 p ( 1 − r v j )
A lower inter-indicator correlation indicates lower information redundancy and greater independence. By integrating the contrast intensity and conflict, the information quantity C j of indicator j is calculated as:
C j = S j ⋅ R j = S j ∑ v = 1 p ( 1 − r v j )
The information quantity reflects the amount of objective information contained in each indicator, with a larger value indicating greater relative importance. Finally, C j is normalized to obtain the objective weight W j of the indicator j :
W j = C j ∑ v = 1 p C v ,   j = 1 , 2 , … , p

2.3. Information Mapping and Weight Fusion

2.3.1. Explanatory Contribution Mapping

To establish an interpretable relationship between the Kansei semantic evaluation space and the objective aesthetic indicator space, the Lindeman–Merenda–Gold (LMG) relative importance analysis based on explained-variance decomposition is introduced. The method quantifies the explanatory contribution of each objective aesthetic indicator to different Kansei semantic sub-criteria and thereby constructs an explanatory contribution mapping matrix. Let N , m , and p denote the numbers of evaluation samples, Kansei semantic sub-criteria, and objective aesthetic indicators, respectively. The subjective rating matrix Y for the samples and Kansei semantic sub-criteria and the objective aesthetic indicator matrix X are then constructed. For the j -th sub-criterion, a linear regression model is established using its subjective ratings as the dependent variable and the objective aesthetic indicators as the independent variables:
y i j = α j + ∑ v = 1 p β j v x i v + ε i j ,   i = 1 , 2 , … , N
where x i v denotes the value of the v -th objective aesthetic indicator for the i -th sample, β j v is the regression coefficient, α j is the intercept, and ε i j is the random error term. Let S denote any subset of the objective aesthetic indicator set, and let R j 2 ( S ) denote the coefficient of determination of the regression model containing only the indicators in S . Given S , the increase in explained variance resulting from the addition of indicator x v ( v ∉ S ) is defined as:
Δ R j 2 x v S = R j 2 S ∪ { x v } − R j 2 ( S )
This increment represents the marginal contribution of x v to the explanatory power of the model given the indicators already included in S . The relative importance of x v for the j -th sub-criterion is defined as the average increase in explained variance over all possible predictor orderings:
I v j LMG = 1 p ! ∑ π ∈ Π Δ R j 2 x v S v ( π )
where Π denotes the set of all permutations of the p objective aesthetic indicators, and S v ( π ) denotes the set of indicators preceding x v in permutation π . For the j -th Kansei semantic sub-criterion, LMG decomposition yields an explanatory contribution vector consisting of the contributions of the p objective aesthetic indicators:
I j LMG = I 1 j LMG , I 2 j LMG , … , I p j LMG T
To ensure comparability of the explanatory contributions across different sub-criteria, the LMG contributions are normalized column-wise:
ϕ v j = I v j LMG ∑ ν = 1 p I ν j LMG ,   ν = 1 , 2 , ⋯ , p ,   j = 1 , 2 , ⋯ , m
The explanatory contribution mapping matrix from the objective aesthetic indicators to the Kansei semantic sub-criteria is then constructed as:
B = ϕ v j p × m
The matrix satisfies the normalization constraint that each column sums to one:
∑ v = 1 p ϕ v j = 1 ,   j = 1 , 2 , … , m
The importance weight vector of the Kansei semantic sub-criteria obtained using BWM is expressed as:
w S = w 1 S , w 2 S , … , w j S , … , w m S T
Based on the explanatory contribution mapping matrix B , the subjective weights of the Kansei semantic sub-criteria are projected into the objective aesthetic indicator space, yielding the equivalent subjective weight vector:
w S → O = B ⋅ w S
where w S → O represents the redistribution of the importance of each Kansei semantic sub-criterion across the objective aesthetic indicators according to their explanatory contribution relationships. To eliminate numerical errors and satisfy the strict normalization constraint, the resulting weights are renormalized to obtain the final equivalent subjective weights:
w ˜ v S → O = w v S → O ∑ v = 1 p w v S → O ,   v = 1 , 2 , … , p

2.3.2. Entropy-Modified D-S Evidence Fusion

To fuse the equivalent subjective weights with the objective aesthetic weights, Dempster–Shafer (D-S) evidence theory [27] is employed to construct the weight fusion model. Because evidence sources may differ in their discriminatory information, information entropy is introduced to discount the evidence sources and reduce the influence of evidence with low discrimination on the fusion results. Let the frame of discernment consist of p objective aesthetic indicators. The weight vectors obtained from Equations (22) and (12) are regarded as the initial support degrees of the subjective evidence E S → O and the objective evidence E O , respectively. For evidence source E j , its information entropy e j and certainty degree d j are defined as:
e j = − 1 ln p ∑ v = 1 p w v ( j ) ln w v ( j )
d j = 1 − e j
where w v ( j ) is the weight assigned by the evidence source E j to the v -th indicator, with j ∈ { S , → O ,   O } . When the weights are uniformly distributed, e j approaches 1 and the discrimination is low; when the weights are highly concentrated, e j approaches 0 and the discrimination is high. The certainty degrees are normalized to obtain the discrimination weights α j :
α j = d j ∑ k ∈ { S → O , O } d k ,   j ∈ { S → O , O }
The initial basic probability assignments are then discounted using α j , reducing the influence of low-discrimination evidence. The discounted basic probability assignment of evidence source E j is defined as:
m j ( { C v } ) = α j ⋅ w v ( j ) ,   v = 1 , 2 , … , p
m j ( Θ ) = 1 − α j
where m j ( Θ ) is the residual probability mass assigned to the universal set Θ , representing the uncertainty of the evidence source E j . A smaller α j indicates lower evidence discrimination and therefore a larger uncertainty mass assigned to Θ .
Dempster’s rule of combination is applied to fuse the subjective and objective evidence. Let K denote the conflict coefficient between the two evidence sources. The fused basic probability assignments m ( { C v } ) for the singleton proposition and m ( Θ ) for the universal set are given by:
K = ∑ A ∩ B = ∅ m S → O ( A ) ⋅ m O ( B )
m ( { C v } ) = m S → O ( { C v } ) ⋅ m O ( { C v } ) + m S → O ( { C v } ) ⋅ m O ( Θ ) + m S → O ( Θ ) ⋅ m O ( { C v } ) 1 − K
m ( Θ ) = m S → O ( Θ ) ⋅ m O ( Θ ) 1 − K
where 1 − K is the normalization factor used to account for evidence conflict. Because m ( Θ ) represents the residual uncertainty after fusion, the pignistic probability transformation is applied to distribute this mass uniformly among the p indicators, yielding the preliminary fused weights:
W v = m ( { C v } ) + m ( Θ ) p ,   v = 1 , 2 , … , p
Finally, the preliminary fused weights are normalized to obtain the comprehensive weight vector:
W ˜ v = W v ∑ i = 1 p W i ,   v = 1 , 2 , … , p

3. Case Study: High-Speed Railway Contact-Wire Inspection Vehicle

3.1. Sample Selection and Data Standardization

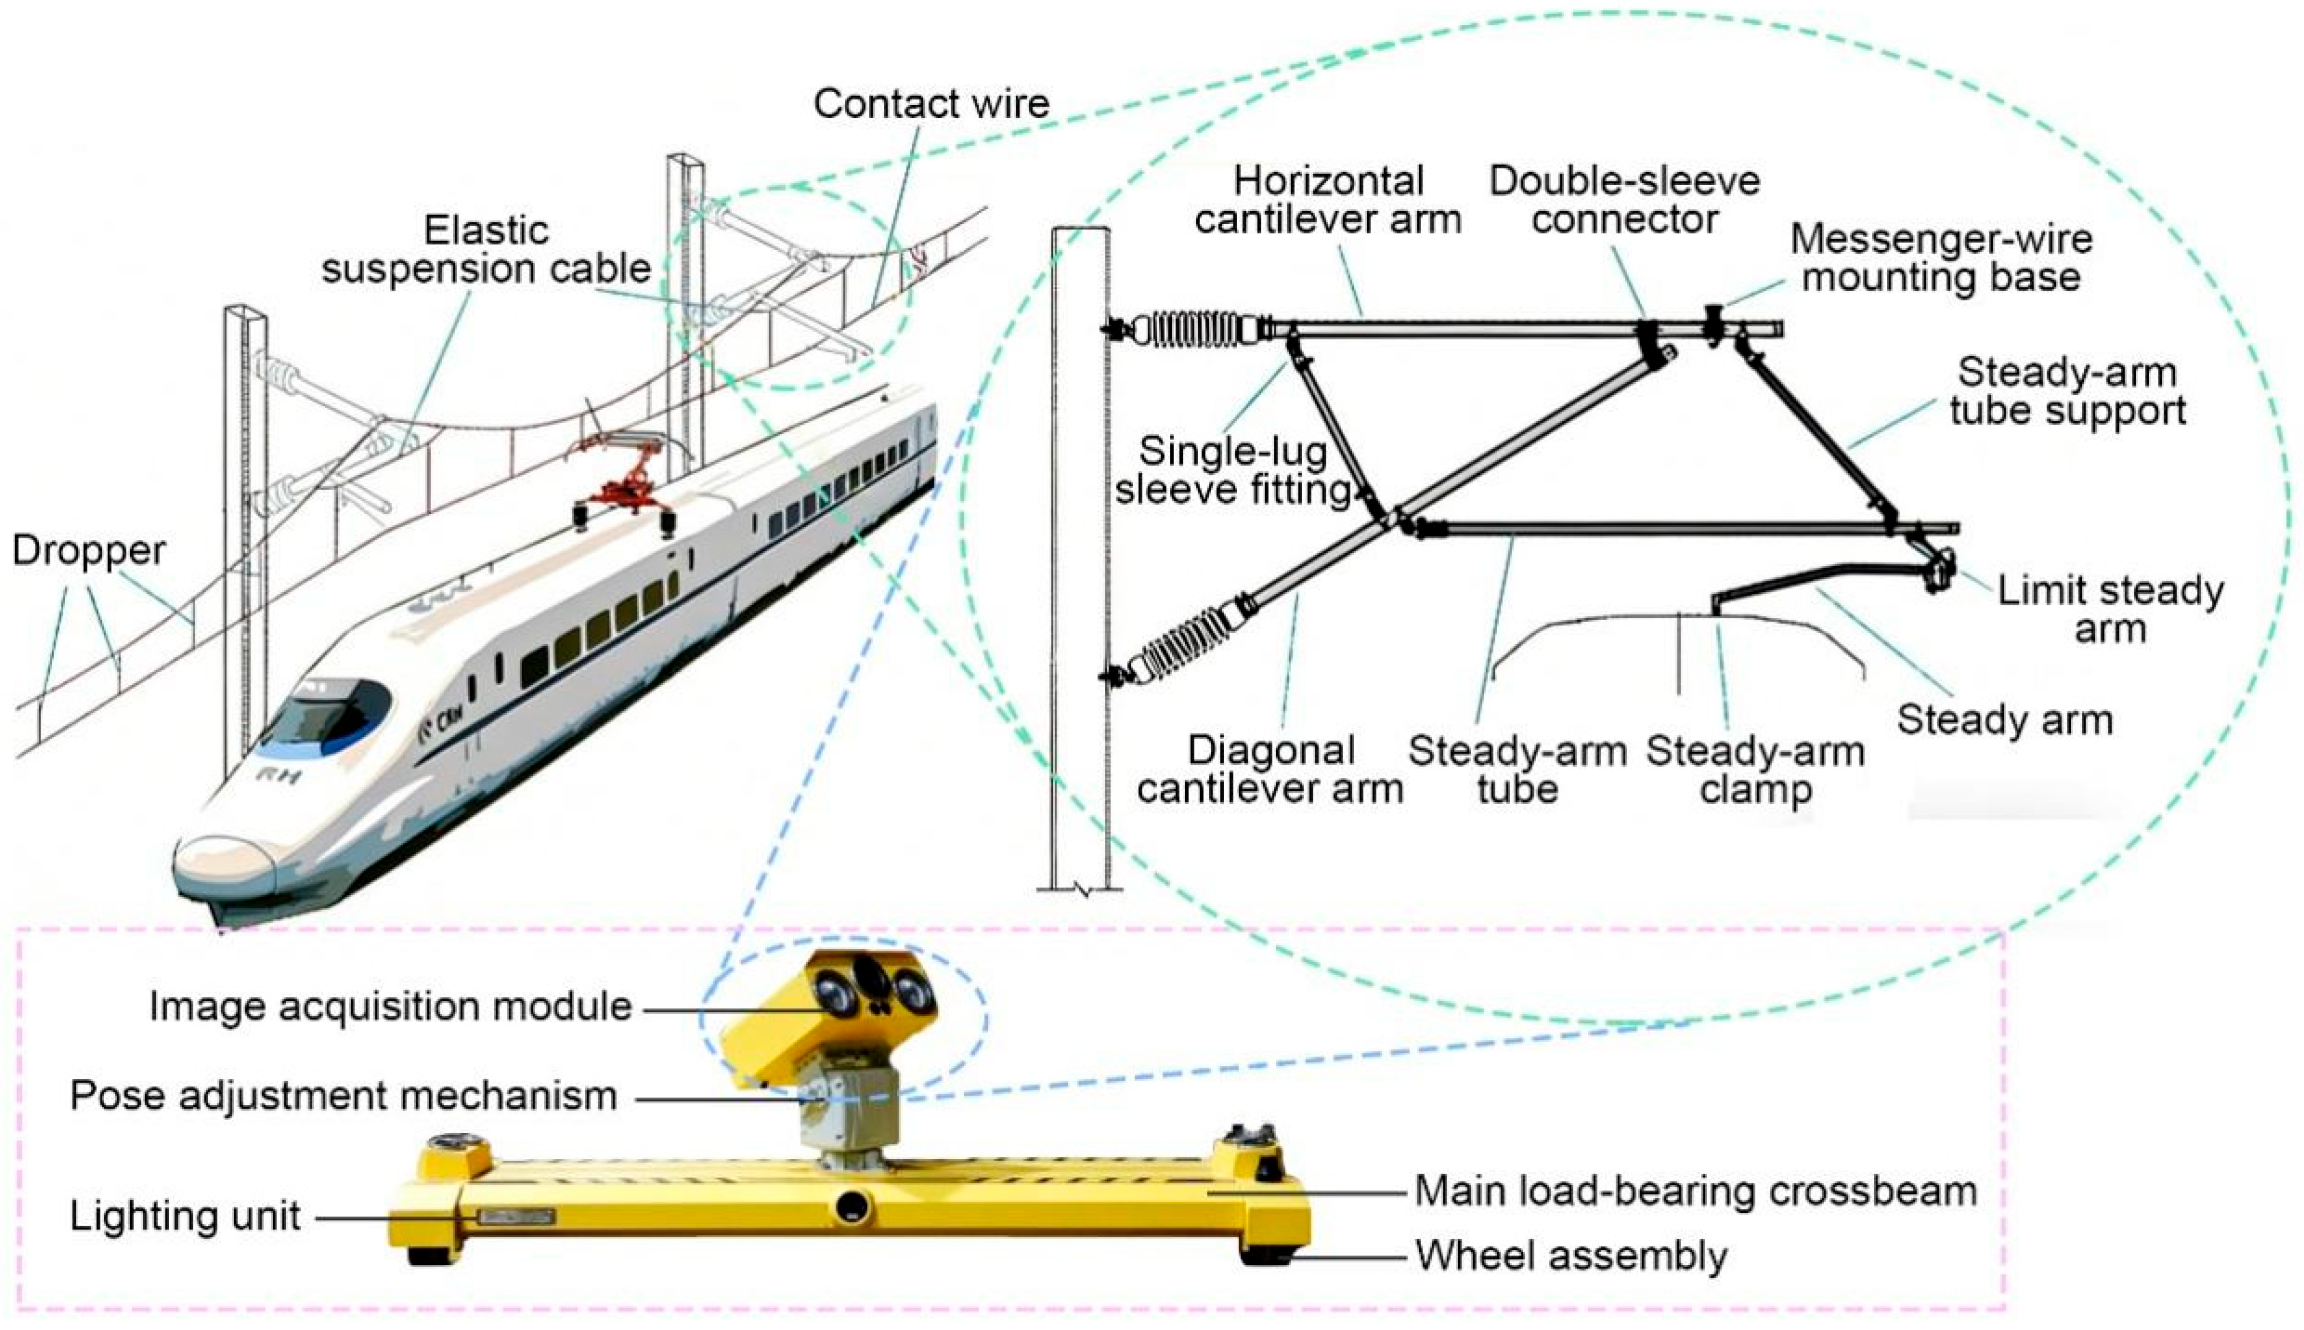
An HRCIV inspection vehicle is a specialized engineering vehicle used to monitor the operating condition of the railway catenary system, primarily performing dynamic inspection of geometric parameters and wear conditions. Its typical operating scenario is shown in Figure 2. Styling decisions for such vehicles require coordination among functional constraints, structural layout, and professional image expression. To address the lack of quantitative and interpretable support for styling decisions, the proposed method is applied in this section for empirical analysis.
Unlike mass-produced consumer products, HRCIVs are subject to railway safety certification, manufacturing costs, and engineering constraints, resulting in a limited number of publicly available and valid styling samples. Image samples were collected from the official website of China State Railway Group Co., Ltd. and relevant manufacturers. A total of 73 candidate images were initially collected to form the original sample pool. Photoshop 2020 was used for background removal, subject enhancement, and frontal-view correction. After blind review by three senior styling experts, samples with highly repetitive morphological characteristics or those inconsistent with the engineering constraints of the target equipment were excluded, leaving 15 inspection vehicle samples with sufficient morphological diversity and engineering representativeness, as shown in Table 1. Rhino 7.0 was then used to extract key contour and structural feature lines, while non-morphological factors such as color, material, and coating were excluded, providing standardized geometric data for subsequent calculation of objective aesthetic indicators. This standardization focuses on frontal two-dimensional form characteristics and does not capture three-dimensional perspective or dynamic viewing effects.

3.2. Subjective Evaluation System and Weight Determination

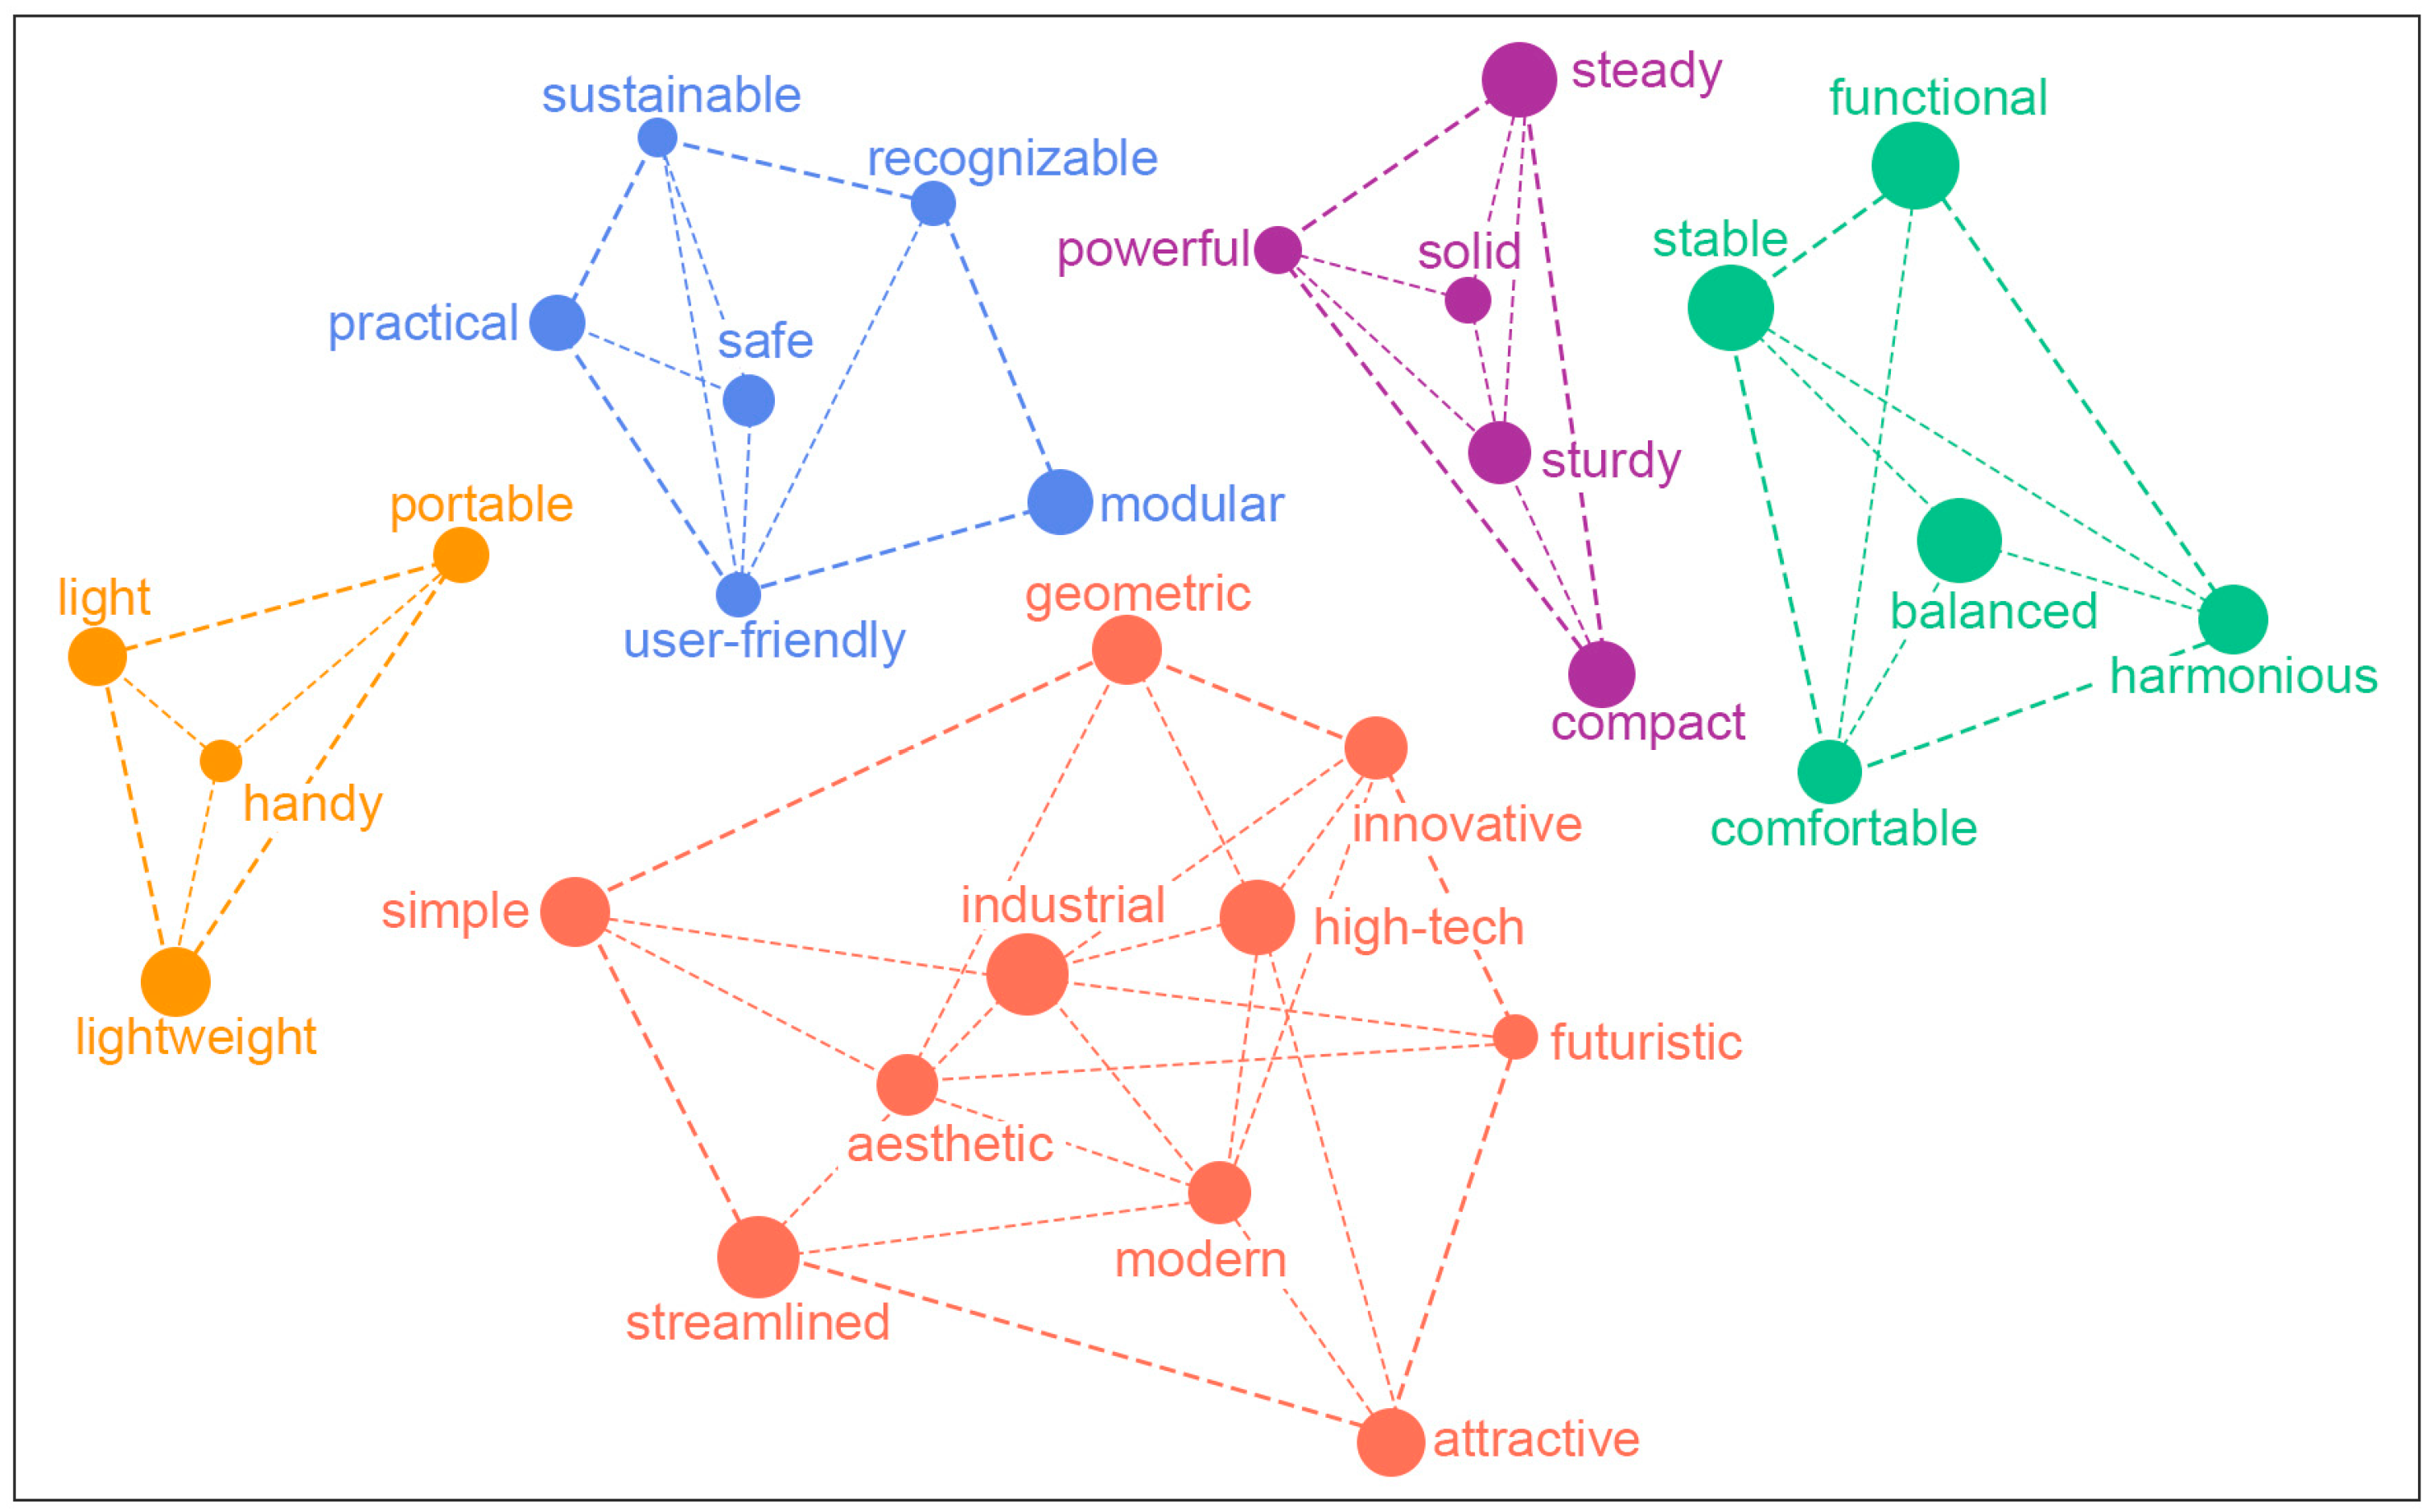
To construct the Kansei semantic evaluation system, academic literature and industry reports on rail-transit equipment styling published between 2015 and 2025 were collected using ROST, resulting in a domain-specific corpus of approximately 200,000 Chinese characters. Since the corpus was constructed from Chinese-language sources, the resulting Kansei semantic structure may, to some extent, be influenced by the linguistic and design context in which it was developed. After word-frequency analysis, co-occurrence analysis, and part-of-speech filtering, 30 candidate Kansei semantic terms were extracted. A semantic vector model and K-means clustering were subsequently used to identify semantic relationships among the terms, and t-distributed Stochastic Neighbor Embedding (t-SNE) [28] was employed for two-dimensional visualization of the clustering results, as shown in Figure 3.
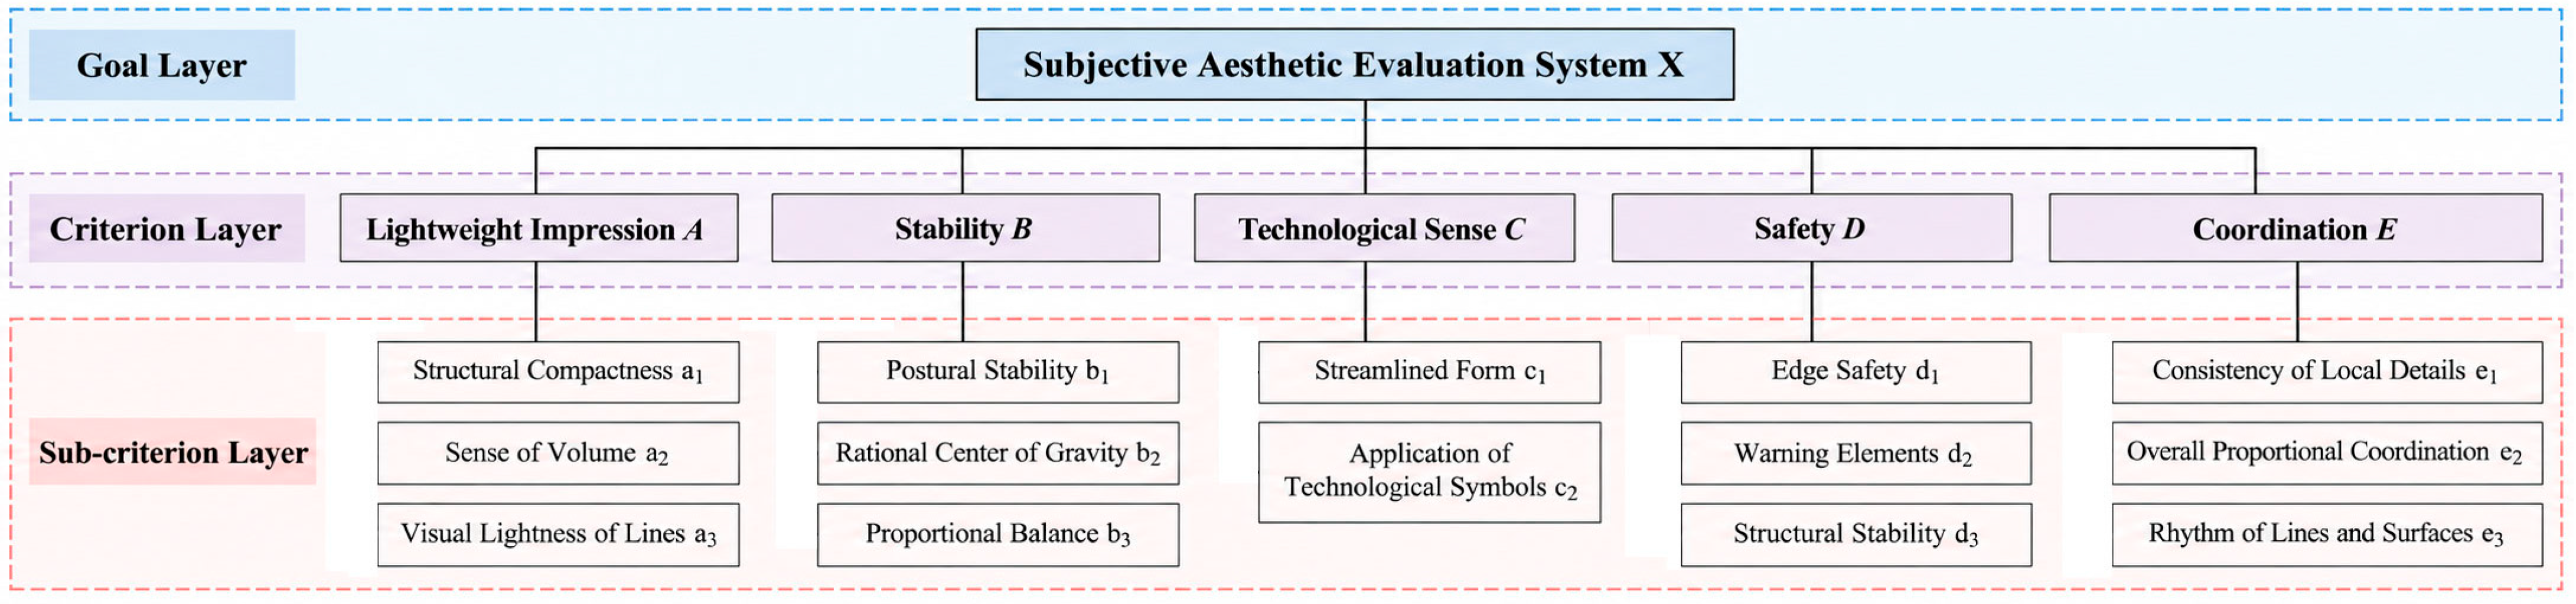
Based on the clustering results, 10 experts in inspection vehicle engineering and industrial design were invited to review and screen semantically similar terms in the context of specialized equipment design. Five criteria were identified: stability, lightweight impression, coordination, safety, and technological sense. These criteria were further decomposed into 14 Kansei semantic sub-criteria with explicit form-related meanings, as shown in Figure 4.
Based on the hierarchical evaluation system, the experts compared the relative importance of the criteria using a 1–9 scale, and the initial subjective weights were obtained using Equation (1). The local weights of the sub-criteria were multiplied by their corresponding criterion weights to obtain global weights. To reduce the influence of differences in expert cognition, the trust-driven negotiation feedback mechanism in Equations (2)–(6) was applied to iteratively adjust the weights. In this case study, all experts reached the consensus threshold of γ = 0.85 after six iterations. The resulting group-consensus weights are presented in Table 2 and used as the subjective preference input for subsequent explanatory contribution mapping and weight fusion.

3.3. Objective Evaluation System and Weight Determination

The objective evaluation system was established based on Ngo’s theory [29] and related studies on computational aesthetics [30]. Five aesthetic indicators were selected as the objective evaluation criteria: balance (BM), centroid stability (CDM), symmetry (SYM), proportion (PM), and rhythm (RHM). These indicators characterize visual balance, centroid distribution, symmetrical order, proportional coordination, and visual rhythm, respectively, providing clear physical meanings and interpretability. Morphological elements were segmented on the standardized front-view contour. A region was counted as one element if it was functionally independent and enclosed by a closed outline. Adjacent regions separated by a clear structural gap were treated as separate elements. Small features such as bolts and chamfers were not counted as independent elements.
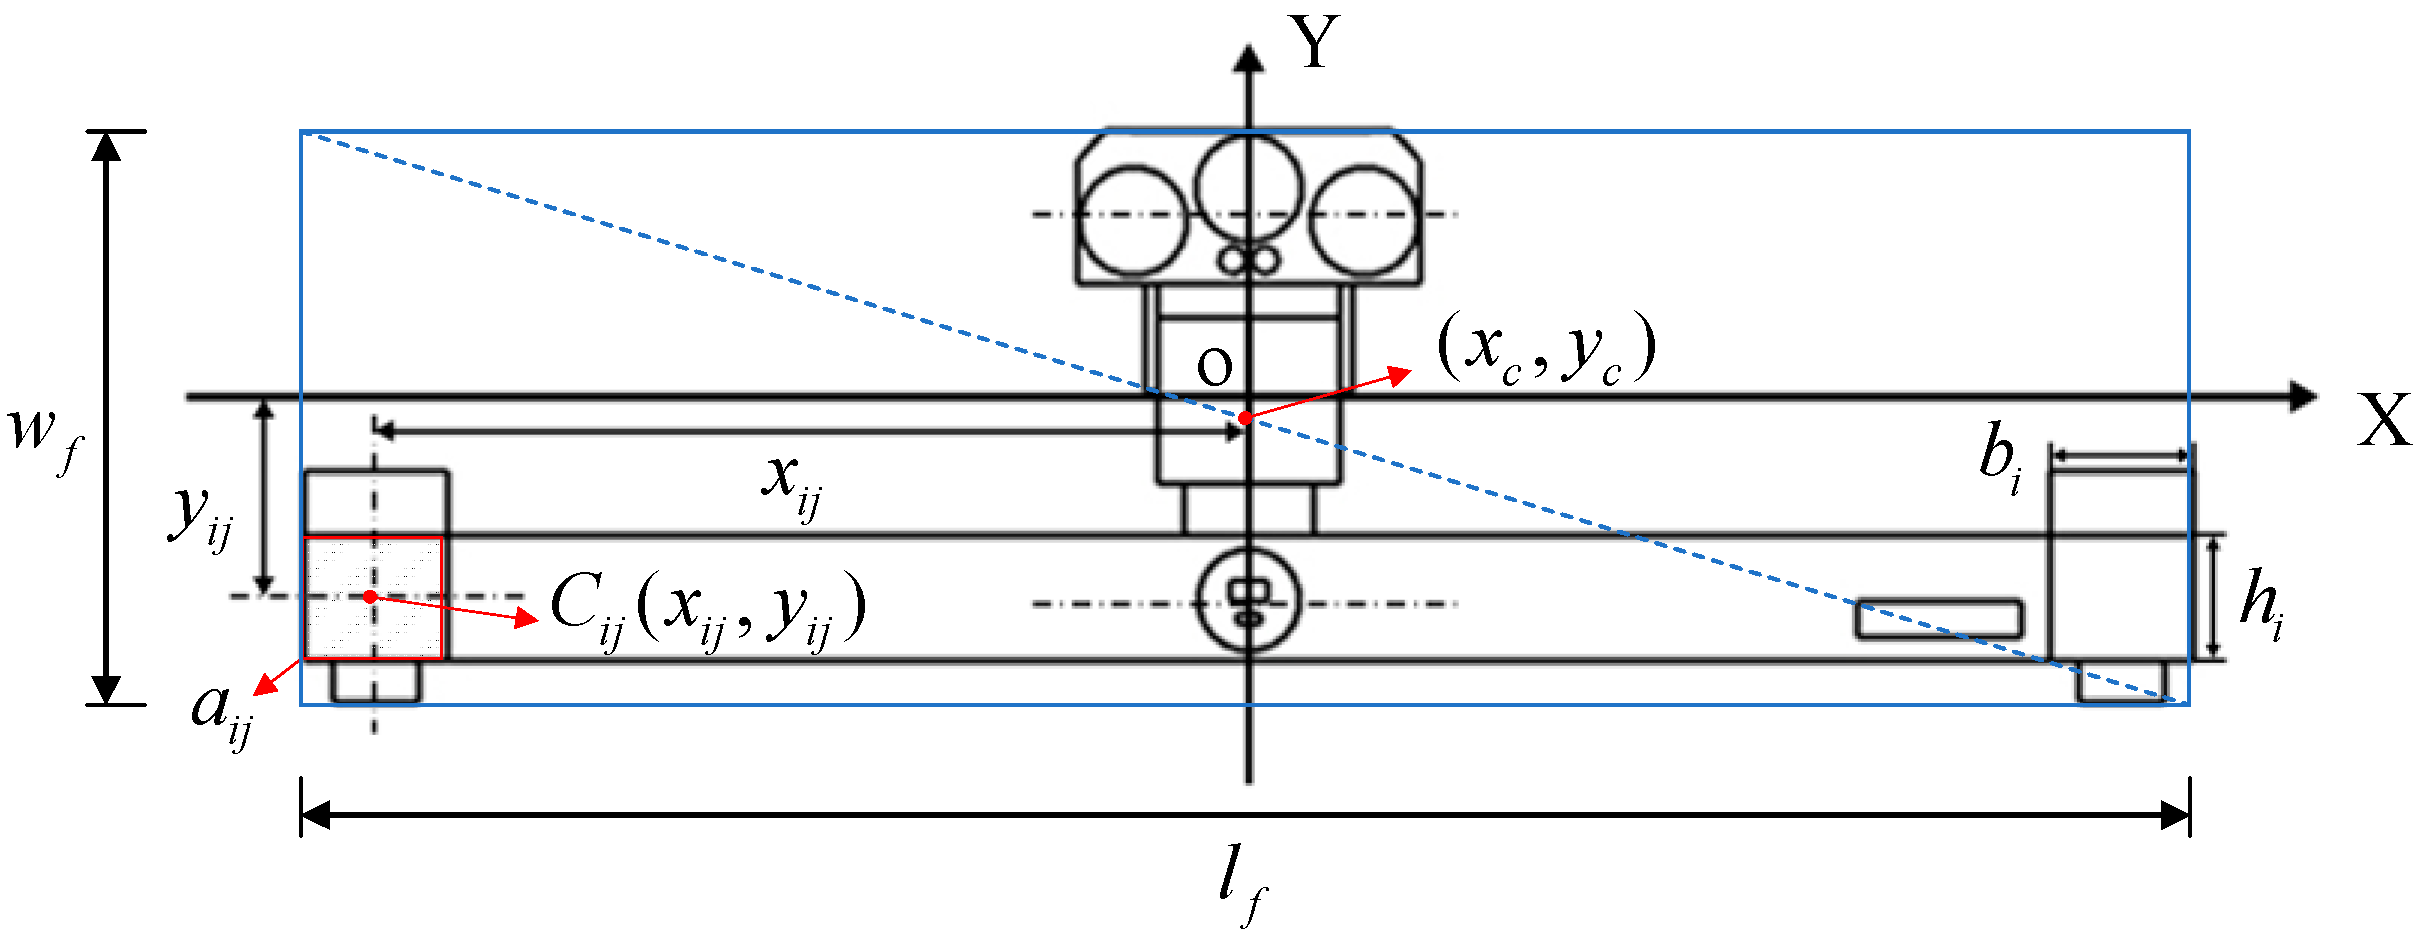
A two-dimensional coordinate system was then established on this contour, as shown in Figure 5. The origin was placed at the center of the minimum bounding rectangle of the whole vehicle. Here a i j denotes the area of an element, C i j ( x i j , y i j ) its centroid, b i and h i its width and height, and x i j and y i j the horizontal and vertical coordinates of the element centroid. Taking Sample B as an example, the element segmentation, geometric inputs, complete formulae and the worked calculation of the five indicators are provided in the Supplementary Material (Figure S1 and Table S3). The definitions of BM, CDM, SYM, PM and RHM are given in Equations (S1)–(S13).
Rhino 7.0 was used to trace the 15 standardized samples and calculate five objective aesthetic indicators: balance (BM), centroid stability (CDM), symmetry (SYM), proportion (PM), and rhythm (RHM). The results are presented in Table 3. In the CRITIC normalization process, BM, CDM, SYM, PM, and RHM were all treated as positive indicators; therefore, Equation (7) was applied to all five indicators. Based on the objective data matrix in Table 3, the information content of each indicator was calculated using the CRITIC method according to Equations (7)–(12), and the resulting values were normalized to obtain the objective aesthetic weights. These weights were subsequently used as the objective information input for explanatory contribution mapping and weight fusion.

3.4. Explanatory Contribution Mapping and Weight Fusion

Based on the subjective weights of the Kansei semantic sub-criteria obtained in Section 3.2 and the objective aesthetic weights obtained in Section 3.3, an explanatory contribution mapping between the Kansei semantic sub-criteria and objective aesthetic indicators was established. Ten additional evaluators with backgrounds in rail vehicle engineering or industrial design rated the 15 samples using a five-point Likert scale according to the 14 Kansei semantic sub-criteria in Figure 4. The inter-rater reliability of the 10 evaluators was assessed using a two-way random-effects model with absolute agreement and average measures. The ICC values across the 14 Kansei semantic sub-criteria ranged from 0.827 to 0.850, indicating good inter-rater reliability. The mean ratings were used to construct the sample–Kansei semantic sub-criteria rating matrix, while the objective aesthetic indicator matrix was formed from the five indicators in Table 3.
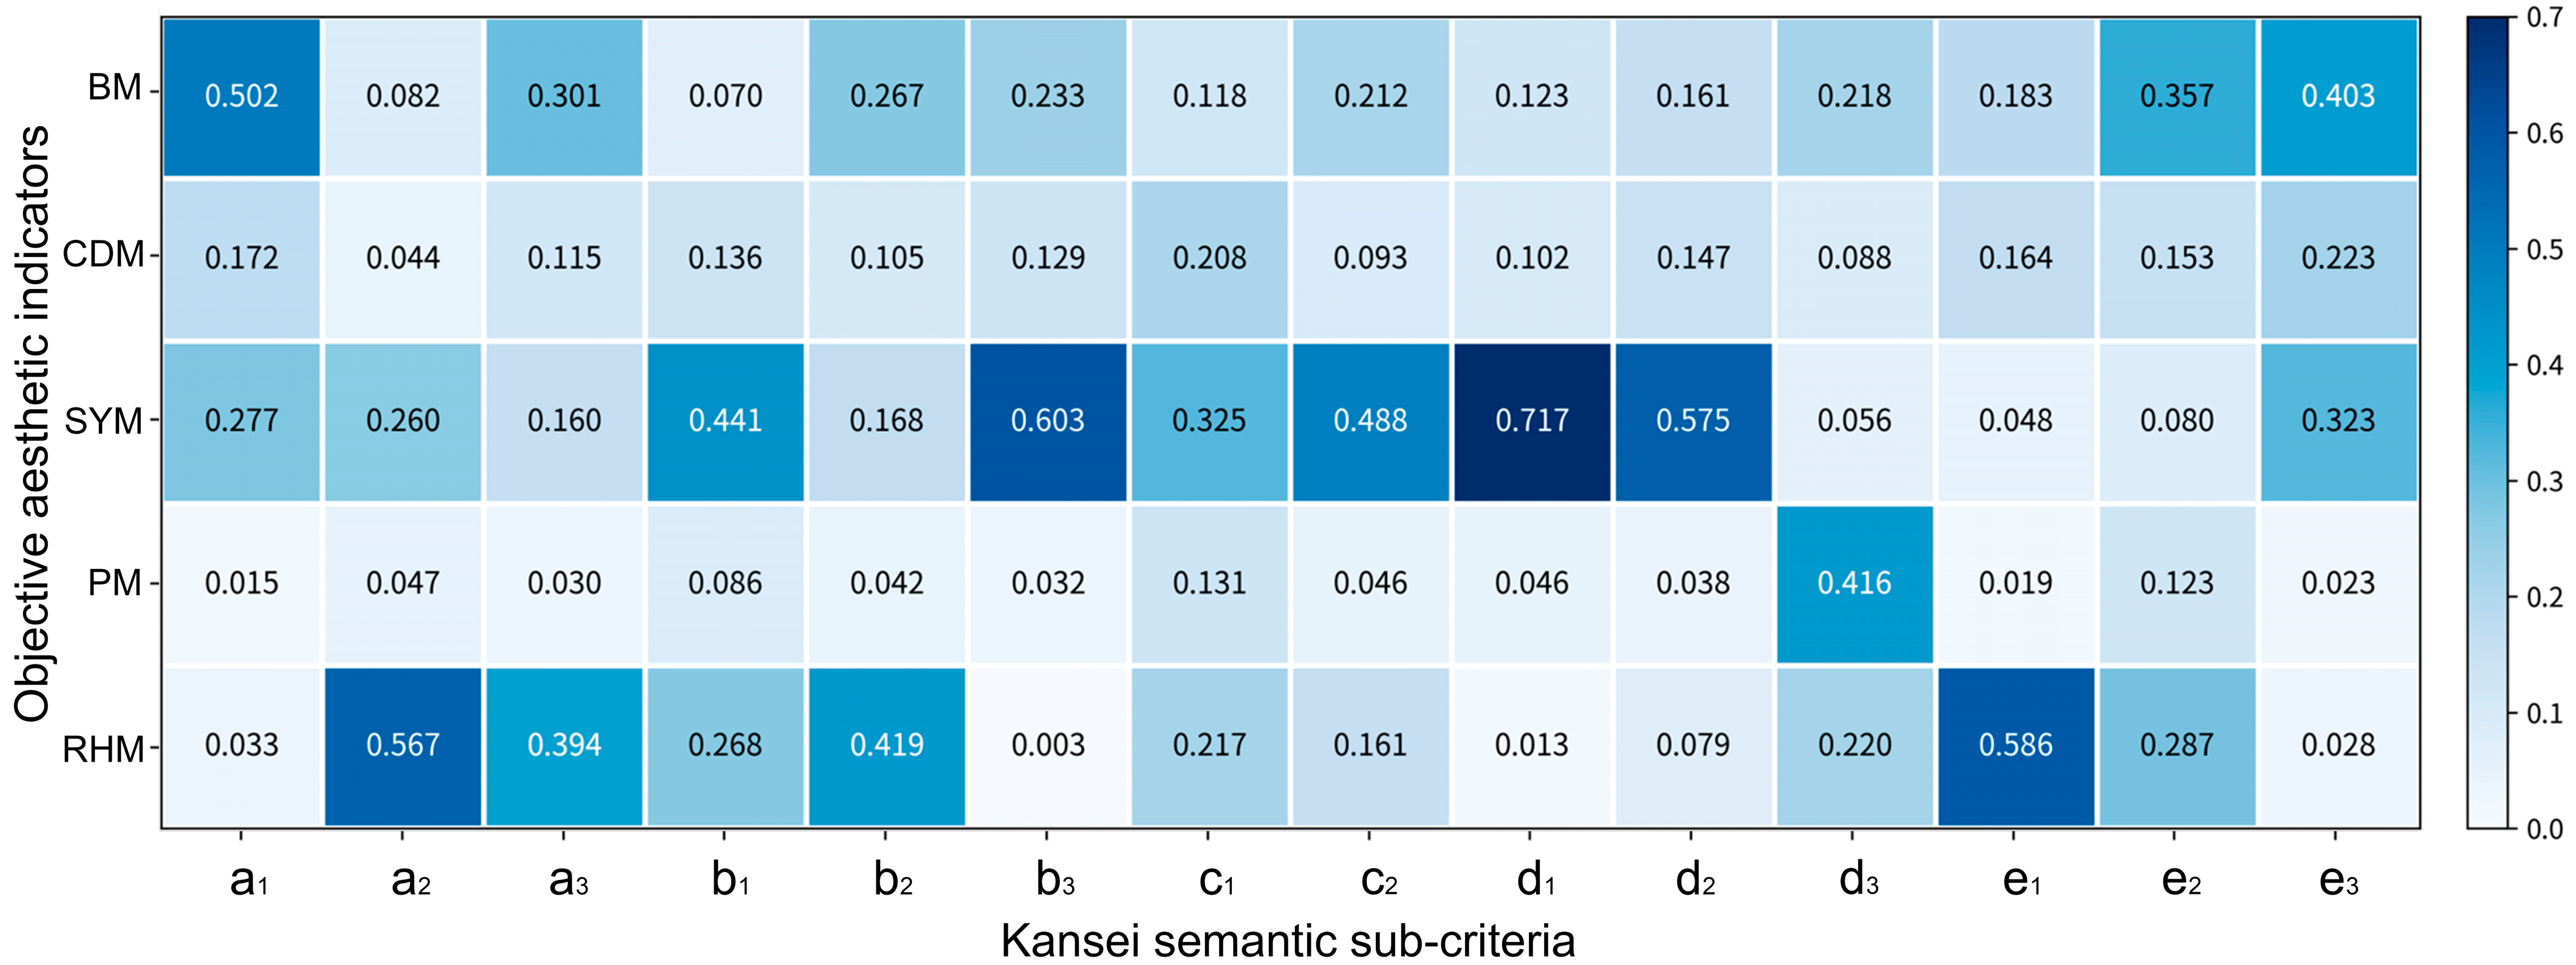
Multiple linear regression models were established using the Kansei semantic sub-criteria ratings as dependent variables and the five objective aesthetic indicators as independent variables. By calculating the pairwise Pearson correlations among BM, CDM, SYM, PM and RHM (see Table S4 in the Supplementary Material), it can be seen that the five indicators are not mutually independent: BM and CDM are relatively highly correlated (r = 0.892), most of the remaining correlations are below 0.53, and RHM showed relatively low correlations with the other indicators. LMG was therefore used to decompose shared variance and to obtain the relative explanatory contribution of each indicator. By calculation, the R 2 values of the sub-criterion models ranged from 0.28 to 0.82. It should be noted that, with N = 15 and p = 5 , ordinary R 2 may be overestimated; therefore, the small sample size represents a limitation of the LMG mapping stage. The ordinary R 2 , adjusted R 2 and overall F -tests of all 14 models are reported in Table S1, while the coefficient estimates and standard errors are provided in Supplementary Table S2. For sub-criteria with relatively low R 2 values, the normalized LMG contributions mainly represent the relative contributions of the objective aesthetic indicators within the variance explained by the corresponding regression model. After column-wise normalization of the original LMG contributions, the explanatory contribution mapping matrix was obtained and visualized as a heatmap in Figure 6.
Figure 6 shows that the explanatory contributions of the objective aesthetic indicators to different Kansei semantic sub-criteria differ clearly. The relationship is therefore not a simple one-to-one mapping, but a differentiated multi-indicator contribution pattern. For example, SYM contributes strongly to d 1 (Safety) and b 3 (Stability), with values of 0.717 and 0.603, indicating that the corresponding Kansei impressions are closely associated with morphological symmetry. BM contributes 0.502 and 0.403 to a 1 (Lightweight impression) and e 3 (Coordination), suggesting that overall visual balance helps explain perceptions such as volumetric impression and local coordination. At the same time, some objective indicators contribute to more than one sub-criterion, which points to a coupled relationship between form regularities and subjective perception. The explanatory contribution mapping matrix can therefore reveal the latent links between the two types of evaluation information and provide an interpretable basis for projecting subjective preferences into the objective aesthetic indicator space.
Based on the explanatory contribution mapping matrix, the subjective weights of the Kansei semantic sub-criteria were projected into the objective aesthetic indicator space to obtain the equivalent subjective weights, as shown in Table 4. The equivalent subjective weights and objective aesthetic weights were then fused using the entropy-modified D-S evidence fusion model. The discrimination weights of the subjective and objective evidence sources were 0.705 and 0.295, respectively, indicating that the expert group’s Kansei consensus provided greater information certainty in this case, while the objective aesthetic indicators served as supplementary correction. As shown in Table 4, symmetry exhibited the highest fused weight (0.266), while rhythm (0.217) and balance (0.202) also showed relatively high contributions. This indicates that, within the investigated samples and evaluation framework, overall order, visual balance, and rhythm play important roles in inspection vehicle styling evaluation. In contrast, centroid stability exhibited a relatively lower fused weight, suggesting that its marginal contribution to scheme evaluation may decrease once a basic sense of stability is achieved.
Based on the five objective aesthetic indicators and their corresponding fused weights, the aesthetic evaluation model for HRCIV styling is expressed as:
Y = 0.202X1 + 0.143X2 + 0.266X3 + 0.172X4 + 0.217X5
where X 1 – X 5 represent balance, centroid stability, symmetry, proportion, and rhythm, respectively. Under the tested D-S discrimination ratios, the fused weights varied within the ranges reported in Table 4. BM, CDM, and RHM showed relatively small variations, whereas SYM and PM were more sensitive to changes in the subjective–objective evidence ratio. The model overcomes the limitations of a single evaluation dimension by integrating subjective perception with objective form regularities, thereby providing a quantitative basis for subsequent styling optimization.


4. Decision Method Validation and Comparative Analysis

4.1. Robustness Validation of Explanatory Contribution Mapping

Given the relatively limited sample size, leave-one-out cross-validation (LOOCV) was employed to assess the robustness of the mapping model. In each iteration, one of the 15 samples was used as the test sample, while the remaining 14 samples were used to train the model and predict the score of the excluded sample. This procedure was repeated 15 times to evaluate the model’s generalization stability.
The predicted residual sum of squares (PRESS) and the cross-validated coefficient of determination Q 2 are defined as:
PRESS = ∑ i = 1 N y i − y ^ − i 2
Q 2 = 1 − PRESS ∑ i = 1 N ( y i − y _ ) 2
where y i is the observed subjective rating of the i -th sample, y ^ − i is its predicted value obtained from the model trained without that sample, y _ is the mean sample rating, and N is the total number of samples. A cross-validated Q 2 closer to the training R 2 indicates a lower risk of overfitting. Three Kansei semantic sub-criteria from different criteria were randomly selected for robustness testing, with the results shown in Table 5.
The results show that the Q 2 values of the three representative models remained above 0.6, with acceptable differences from the corresponding training R 2 . This indicates that these selected models are reasonably stable under the small-sample condition. However, they cannot by themselves establish the significance of all 14 mappings. Only five of the 14 models reach p < 0.05 on the overall F -test. Therefore, the mapping results are interpreted as case-specific associations rather than as independently confirmed predictive equations.

4.2. Ranking Robustness Under Alternative Ranking Methods

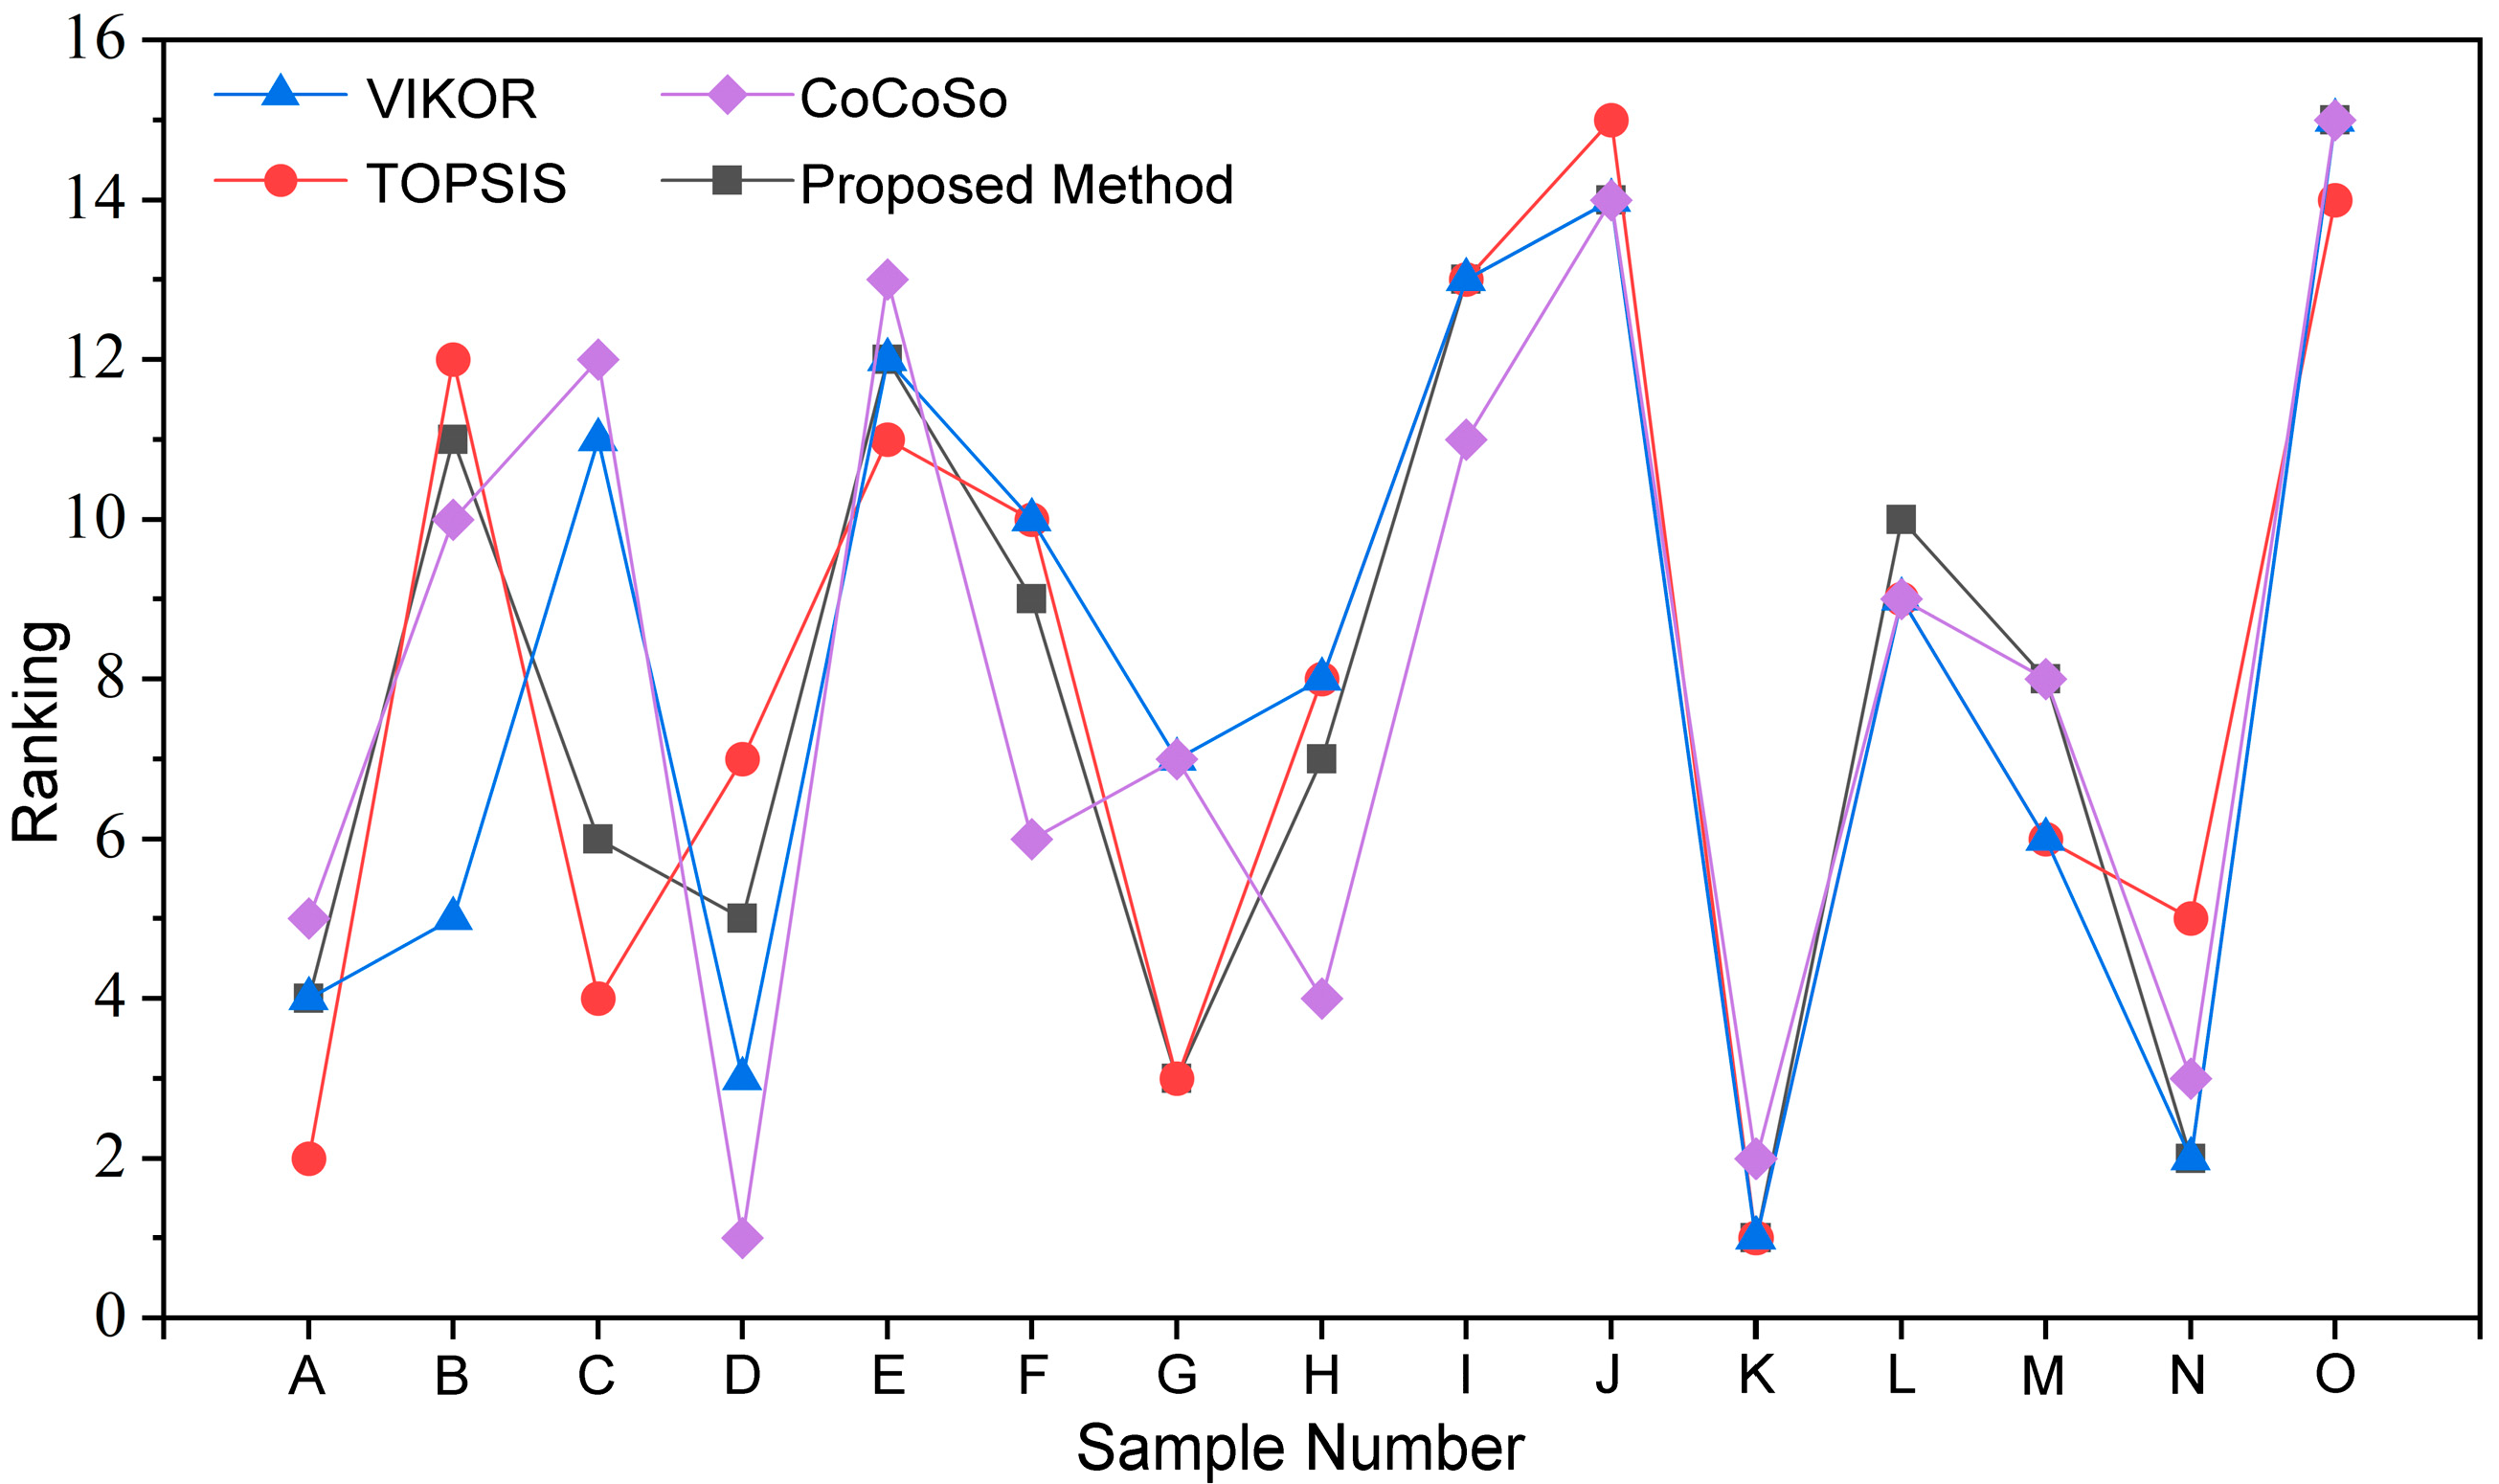
To examine the sensitivity of the evaluation results to the choice of ranking method, TOPSIS, VIKOR, and CoCoSo were introduced for comparison under the same evaluation data and weighting scheme. All three methods used the objective aesthetic indicator data of the 15 samples in Table 3 and the fused weights obtained from Equation (33). Specifically, TOPSIS ranks the alternatives according to their relative distances from the positive and negative ideal solutions; VIKOR considers both group utility and individual regret, with the compromise parameter set to v = 0.6 to place slightly greater emphasis on the overall performance of the alternatives across multiple aesthetic indicators; and CoCoSo ranks the alternatives by integrating weighted-sum and weighted-product measures, following the procedure adopted by Xu et al. [31]. The ranking results obtained by the different methods are shown in Figure 7.
Further, Spearman’s rank correlation coefficient and the mean absolute rank difference were used to quantitatively evaluate the consistency between the rankings obtained by the proposed method and those produced by the alternative ranking methods, as shown in Table 6. The Spearman’s ρ values between the proposed method and TOPSIS, VIKOR, and CoCoSo were 0.943, 0.843, and 0.829, respectively, while the corresponding mean absolute rank differences were 1.200, 1.467, and 1.867 rank positions. All comparison methods showed relatively high positive correlations with the proposed method, together with generally small average rank differences, indicating that, under the same evaluation data and weighting scheme, the ranking obtained by the proposed method exhibits relatively good robustness across different multi-criteria ranking methods.

4.3. Consistency Validation with Independent Group Preferences

To evaluate consistency with actual aesthetic preferences, the 15 standardized inspection vehicle samples were assessed using an independent five-point Likert questionnaire. The participants excluded the experts involved in previous indicator construction and weight determination. A total of 85 participants were recruited, including 32 rail vehicle engineers and 53 graduate students in industrial design. The survey was repeated after 14 days, yielding 76 and 78 valid responses. The 72 participants with valid responses in both rounds were retained. Cronbach’s α exceeded 0.85 and the test–retest Spearman correlation exceeded 0.9, indicating good reliability. The mean scores of the two surveys were used to establish the user aesthetic preference benchmark shown in Table 7.
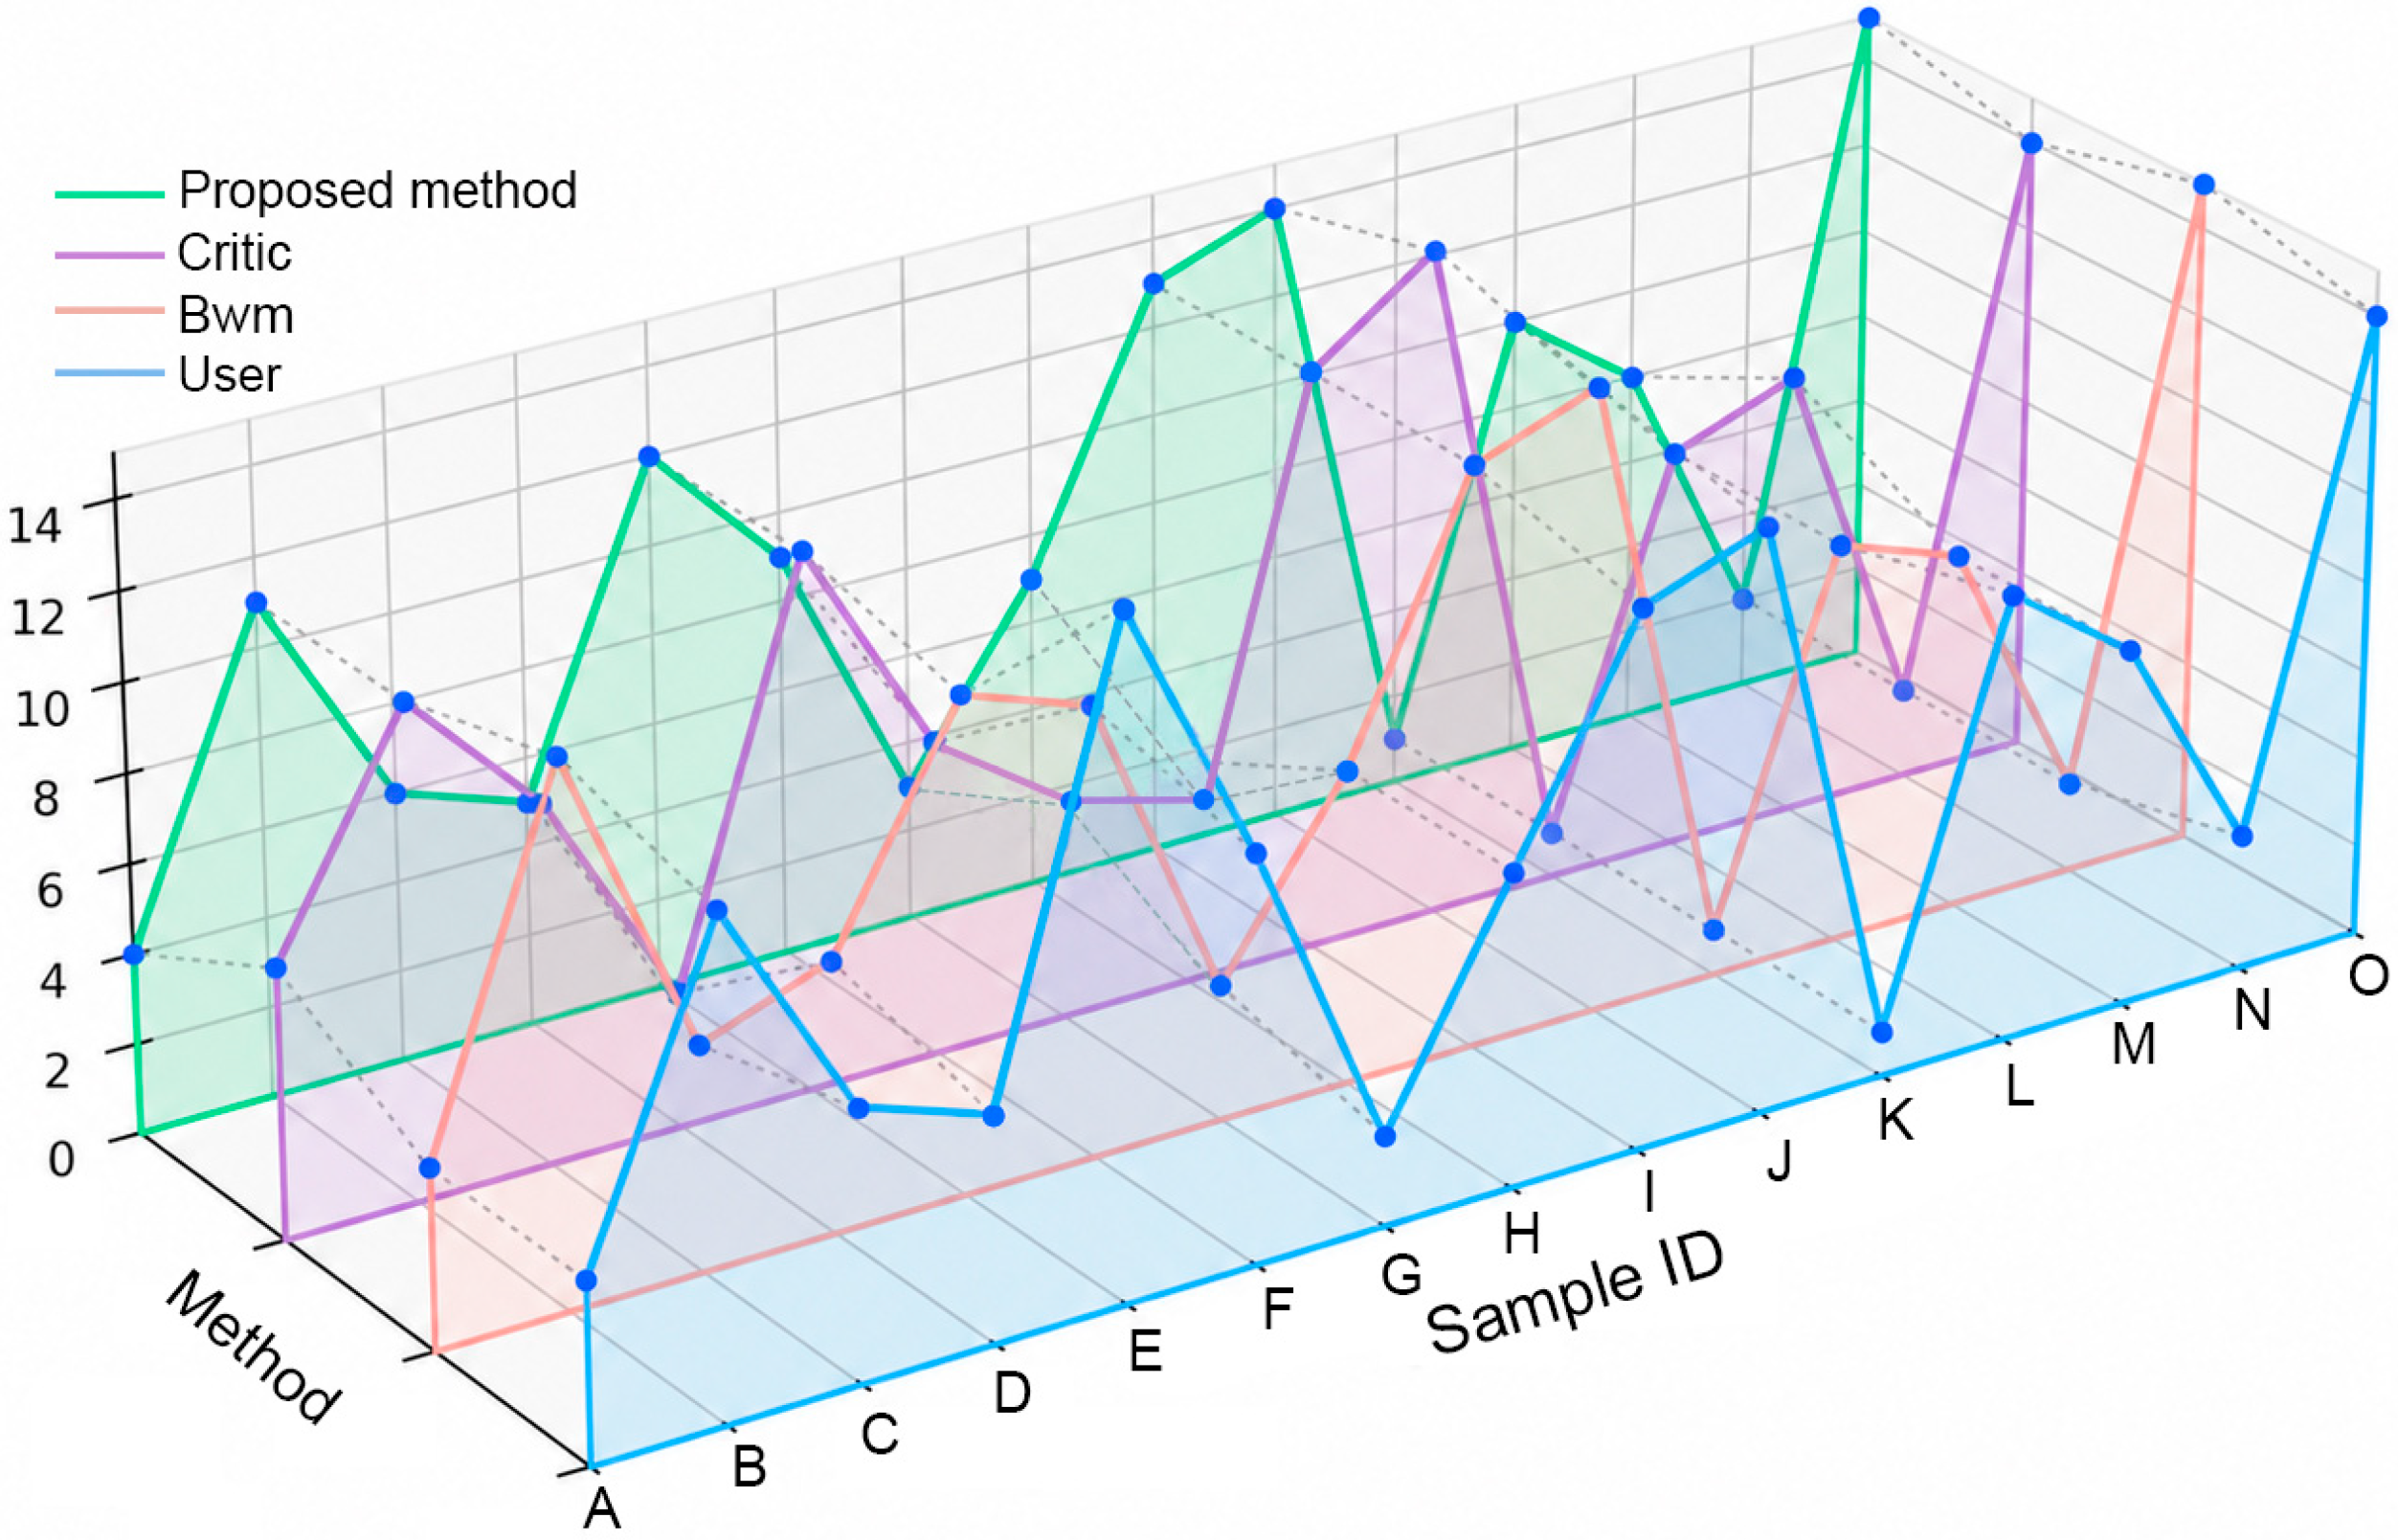
Based on this benchmark, rankings were obtained using the subjective BWM model, the objective CRITIC model, and the proposed fusion model, as shown in Figure 8. The proposed method was generally closer to the user preference ranking than the individual subjective or objective models.
To quantify the agreement between the rankings produced by each method and the independent user preference ranking, Spearman’s rank correlation coefficient, Kendall’s τ and mean rank deviation (MRD) were calculated. MRD is defined as
MRD = 1 n ∑ i = 1 n R i − U i
where n = 15 is the number of samples, U i denotes the rank of sample i derived from the independent user survey (the Rank column in Table 7), and R i denotes the rank assigned to sample i by a given method (BWM, CRITIC, or the proposed method). The results are presented in Table 8.
Table 8 shows that, in the present sample, the proposed method yielded higher Spearman’s rank correlation and Kendall’s τ, together with a lower mean rank deviation, than BWM or CRITIC alone. The Spearman and Kendall coefficients were 0.975 and 0.924, respectively, while the mean rank deviation was 0.533, suggesting a relatively high consistency with the user preference ranking.
Furthermore, the entropy-modified D-S model assigned discrimination weights of 0.705 and 0.295 to the subjective and objective evidence, respectively, resulting in fused weights that remained relatively close to the equivalent subjective weights. To examine the sensitivity of the ranking results to changes in this discrimination ratio, the D-S fusion procedure was retained while the subjective/objective discrimination ratios were further set to 0.50/0.50 and 0.30/0.70, and the fused weights and alternative rankings were recalculated, as reported in Table S5. Compared with the results obtained using the equivalent subjective weights alone ( ρ = 0.957 , τ = 0.886 , MRD = 0.800), the model-derived D-S fusion result ( ρ = 0.975 , τ = 0.924 , MRD = 0.533) shows that the inclusion of objective evidence modifies the final ranking. Under the 0.50/0.50 and 0.30/0.70 settings, ρ , τ , and MRD were 0.961, 0.848, and 0.933, and 0.939, 0.810, and 1.200, respectively. The top three alternatives remained K, N, and G across the tested settings, while several subsequent ranking positions changed as the proportion of objective evidence increased. Overall, within the present case and the tested parameter range, the proposed mapping–fusion method exhibited a certain degree of robustness and maintained relatively high consistency with the independent user preferences.

5. Conclusions and Future Work

To address the difficulty of directly integrating Kansei semantics with objective aesthetic indicators in engineering equipment styling design decisions, this study proposes a decision-making method based on Kansei semantic-objective aesthetic indicator mapping. The main conclusions are as follows:
(1)
Kansei semantics and objective aesthetic indicators exhibited differentiated multi-indicator explanatory relationships. The LMG analysis showed that the explanatory contributions of different objective aesthetic indicators varied across the Kansei semantic sub-criteria. For example, SYM contributed 0.717 and 0.603 to Safety and Stability, respectively, while BM contributed 0.502 and 0.403 to Lightweight Impression and Coordination. These results indicate that the relationship between Kansei cognition and objective styling characteristics is not a simple one-to-one correspondence, but rather a quantifiable multi-indicator coupling structure.
(2)
The fusion of the mapped subjective information and objective information produced differentiated comprehensive aesthetic weights. Among the final fused weights, SYM had the highest weight at 0.266, followed by RHM at 0.217 and BM at 0.202, while PM and CDM had weights of 0.172 and 0.143, respectively. Further sensitivity analysis of the D–S discrimination ratios showed that changes in the evidence ratio affected some indicator weights and subsequent rankings, while the main ranking structure remained relatively stable within the tested parameter range.
(3)
The effectiveness of the proposed method was validated using an HRCIV. The proposed method showed high consistency with the user preference ranking, with Spearman’s ρ and Kendall’s τ reaching 0.975 and 0.924, respectively, and the mean rank deviation decreasing to 0.533.
The mapping framework developed in this study may be extended to other types of engineering equipment; however, the numerical mapping relationships remain case-dependent because they were estimated from only 15 HRCIV samples. Therefore, when applied to a new equipment type, the mapping relationships should be re-estimated using the corresponding samples and evaluation indicators. Although LOOCV indicates a certain degree of stability in the present case, it cannot replace external validation across product types. In addition, the use of standardized 2D frontal representations does not fully capture three-dimensional and dynamic visual perception, while the exclusion of color, material, and finish (CMF) may omit some factors influencing Kansei impressions. Future work will expand the sample size and equipment types and incorporate parametric generation, broader objective and CMF attributes, and multimodal perceptual data to improve the applicability of the method.

Supplementary Materials

The following supporting information can be downloaded at: https://www.mdpi.com/article/10.3390/app16199950/s1, Figure S1: Element Segmentation and Numbering of Sample B; Table S1: Ordinary R 2 , adjusted R 2 , overall F and p-value for all 14 sub-criteria ( N = 15 , p = 5 , residual d f = 9 ); Table S2: Coefficient estimates and standard errors for the intercept and BM, CDM, SYM, PM, RHM; Table S3: Areas, centroids, widths and heights of the nine elements; Table S4: Pearson Correlation Matrix of the Five Objective Aesthetic Indicators; Table S5: Sensitivity Analysis of Ranking Results under Different Subjective–Objective Evidence Settings.

Author Contributions

Conceptualization, A.Q.; methodology, A.Q.; validation, A.Q.; formal analysis, A.Q.; investigation, A.Q.; resources, S.D.; data curation, A.Q.; writing—original draft preparation, A.Q.; writing—review and editing, S.D. and J.S.; visualization, A.Q.; supervision, S.D. and J.S.; project administration, S.D. and J.S.; funding acquisition, J.S. All authors have read and agreed to the published version of the manuscript.

Funding

This research was funded by Science Research Project of Hebei Education Department, China, grant number BJS2024006.

Institutional Review Board Statement

The study was conducted in accordance with the Declaration of Helsinki and approved by the Institutional Review Board of the School of Architecture and Art Design, Hebei University of Technology. The study involved anonymous, non-interventional aesthetic evaluation questionnaires, with no collection of sensitive or personally identifiable information (date of approval: 8 September 2026). No protocol number is issued by this Board for anonymous, non-invasive questionnaire studies.

Informed Consent Statement

Informed consent was obtained from all participants involved in the study.

Data Availability Statement

The data presented in this study are available from the corresponding author upon reasonable request.

Conflicts of Interest

The authors declare no conflicts of interest.

References

  1. Han, J.; Forbes, H.; Schaefer, D. An Exploration of How Creativity, Functionality, and Aesthetics Are Related in Design. Res. Eng. Des. 2021, 32, 289–307. [Google Scholar] [CrossRef] [Scilit]
  2. Huang, Z.; Guo, X.; Li, J.; Zhao, W.; Wang, J.; Li, Q. A Field-Based Knowledge Graph Assisted Conceptual Design for Structure Configuration of Engineering Equipment. J. Eng. Des. 2025, 36, 1279–1301. [Google Scholar] [CrossRef] [Scilit]
  3. Saadi, J.I.; Chong, L.; Yang, M.C. The Effect of Targeting Both Quantitative and Qualitative Objectives in Generative Design Tools on the Design Outcomes. Res. Eng. Des. 2024, 35, 409–425. [Google Scholar] [CrossRef] [Scilit]
  4. Liu, X.; Yang, S. Study on Product Form Design via Kansei Engineering and Virtual Reality. J. Eng. Des. 2022, 33, 412–440. [Google Scholar] [CrossRef] [Scilit]
  5. Tang, W.-Y.; Xiang, Z.-R.; Ding, T.-C.; Zhao, X.; Zhang, Q.; Zou, R. Research on Multi-Objective Optimisation of Product Form Design Based on Kansei Engineering. J. Eng. Des. 2024, 35, 1023–1048. [Google Scholar] [CrossRef] [Scilit]
  6. Yang, C.; Liu, F.; Ye, J. A Product Form Design Method Integrating Kansei Engineering and Diffusion Model. Adv. Eng. Inform. 2023, 57, 102058. [Google Scholar] [CrossRef] [Scilit]
  7. Wang, P.; Chu, J.; Yu, S.; Chen, C.; Hu, Y. A Consumers’ Kansei Needs Mining and Purchase Intention Evaluation Method Based on Fuzzy Linguistic Theory and Multi-Attribute Decision Making Method. Adv. Eng. Inform. 2024, 59, 102267. [Google Scholar] [CrossRef] [Scilit]
  8. Walter, I.; Pare, P.; Panchal, J. A Cognitive Approach for Modeling Customer Demand Dynamics for Optimal Product Release Strategies. J. Mech. Des. 2024, 146, 1–14. [Google Scholar] [CrossRef] [Scilit]
  9. Lin, H.; Deng, X.; Yu, J.; Jiang, X.; Zhang, D. A Study of Sustainable Product Design Evaluation Based on the Analytic Hierarchy Process and Deep Residual Networks. Sustainability 2023, 15, 14538. [Google Scholar] [CrossRef] [Scilit]
  10. Zhou, A.; Ma, J.; Zhang, S.; Ouyang, J. Optimal Design of Product Form for Aesthetics and Ergonomics. Comput.-Aided Des. Appl. 2023, 1–27. [Google Scholar] [CrossRef] [Scilit]
  11. Wang, Z.; Zhong, Y.; Chai, S.; Niu, S.; Yang, M.; Wu, G. Product Design Evaluation Based on Improved CRITIC and Comprehensive Cloud-TOPSIS—Applied to Automotive Styling Design Evaluation. Adv. Eng. Inform. 2024, 60, 102361. [Google Scholar] [CrossRef] [Scilit]
  12. Lu, P.; Tang, J.; Wu, F. Product Form Design and Evaluation Method Based on Improved Form Aesthetic Formula. Symmetry 2024, 16, 883. [Google Scholar] [CrossRef] [Scilit]
  13. Miao, Y.; Gao, X.; Jiang, W.; Xu, W. An Evaluation Model for Interactive Gaming Furniture Design Based on Parent-Child Behavior. PLoS ONE 2024, 19, e0302713. [Google Scholar] [CrossRef] [Scilit]
  14. Wu, C.; Zhu, T.; Li, Y.; Zhang, Z.; Wu, T. Balancing Multi-Source Heterogeneous User Requirement Information in Complex Product Design. Symmetry 2025, 17, 1192. [Google Scholar] [CrossRef] [Scilit]
  15. Fu, L.; Lei, Y.; Zhu, L.; Lv, J. An Evaluation and Design Method for Ming-Style Furniture Integrating Kansei Engineering with Particle Swarm Optimization-Support Vector Regression. Adv. Eng. Inform. 2024, 62, 102822. [Google Scholar] [CrossRef] [Scilit]
  16. Qian, T.; Li, Y.; Miao, H.-T. Multi-Criteria Decision-Making Approach for Design Evaluation and Optimization of Smart Pet Water Fountains. Appl. Sci. 2026, 16, 3255. [Google Scholar] [CrossRef] [Scilit]
  17. Lai, H.; Wu, Z.; Zhang, X.; Liao, H.; Zavadskas, E.K. A Method for Product Appearance Design Evaluation Based on Heterogeneous Data. Adv. Eng. Inform. 2023, 57, 102089. [Google Scholar] [CrossRef] [Scilit]
  18. Song, W.; Niu, Z.; Zheng, P. Design Concept Evaluation of Smart Product-Service Systems Considering Sustainability: An Integrated Method. Comput. Ind. Eng. 2021, 159, 107485. [Google Scholar] [CrossRef] [Scilit]
  19. Wang, J.; Cheng, F.; Chen, C. Optimization and Evaluation of Tourism Mascot Design Based on Analytic Hierarchy Process–Entropy Weight Method. Entropy 2024, 26, 585. [Google Scholar] [CrossRef] [Scilit]
  20. Cheng, Y.; Li, Y.; Zhang, N.; Chen, L.; Cao, J. A Knowledge Graph-Enabled Multi-Domain Mapping Approach Supporting Product Rapid Design: A Case Study of New Energy Vehicles. Adv. Eng. Inform. 2024, 62, 102779. [Google Scholar] [CrossRef] [Scilit]
  21. Yang, Y.; Lyu, L.; Yang, Q.; Liu, Y.; An, W. Trust-Based Consensus Reaching Process for Product Design Decision-Making with Heterogeneous Information. Adv. Eng. Inform. 2023, 56, 101934. [Google Scholar] [CrossRef] [Scilit]
  22. Yang, M.; Hu, H.; Gao, L.; Fang, Z.; Guo, X. Engineering Equipment Conceptual Design Methodology: Using Function Units Configuration and Schemes Iterative Solution. J. Eng. Des. 2024, 35, 89–125. [Google Scholar] [CrossRef] [Scilit]
  23. Rezaei, J. Best-Worst Multi-Criteria Decision-Making Method. Omega 2015, 53, 49–57. [Google Scholar] [CrossRef] [Scilit]
  24. Chao, X.; Dong, Y.; Kou, G.; Peng, Y. How to Determine the Consensus Threshold in Group Decision Making: A Method Based on Efficiency Benchmark Using Benefit and Cost Insight. Ann. Oper. Res. 2022, 316, 143–177. [Google Scholar] [CrossRef] [Scilit]
  25. Wu, T.; Liu, X. New Perspectives on Consensus Reaching Process in Large-Scale Group Decision-Making. In Large-Scale Group Decision-Making with Uncertain and Behavioral Considerations: Methods and Applications; Wu, T., Liu, X., Eds.; Springer Nature: Singapore, 2023; pp. 269–309. [Google Scholar] [CrossRef] [Scilit]
  26. Diakoulaki, D.; Mavrotas, G.; Papayannakis, L. Determining Objective Weights in Multiple Criteria Problems: The Critic Method. Comput. Oper. Res. 1995, 22, 763–770. [Google Scholar] [CrossRef] [Scilit]
  27. Dempster, A.P. Upper and Lower Probabilities Induced by a Multivalued Mapping. Ann. Math. Stat. 1967, 38, 325–339. [Google Scholar] [CrossRef] [Scilit]
  28. Li, T.; Li, Y.; Rampino, L. Construction of Semantic Pool and Acquisition of Semantic Categories for Automobile Styling Stance: A Domain Knowledge Perspective. Adv. Eng. Inform. 2023, 56, 101995. [Google Scholar] [CrossRef] [Scilit]
  29. Ngo, D.C.L.; Teo, L.S.; Byrne, J.G. Formalising Guidelines for the Design of Screen Layouts. Displays 2000, 21, 3–15. [Google Scholar] [CrossRef] [Scilit]
  30. Zhou, A.; Su, J.; Yan, S.; Ouyang, J.; Shi, C.; Yuwang, B. Nonlinear Information Dynamics Model of Synthetic Evaluation on Product Form Aesthetic. J. Mech. Eng. 2018, 54, 150–159. [Google Scholar] [CrossRef] [Scilit]
  31. Xu, W.; Cui, X.; Qi, R.; Lin, Y. A Novel Multi-Criteria Decision-Making Approach to Evaluate Sustainable Product Design. Sustainability 2025, 17, 9436. [Google Scholar] [CrossRef] [Scilit]
Figure 1. Framework of the Engineering Equipment Styling Design Decision Method Based on Kansei Semantic-Objective Aesthetic Indicator Mapping.
Applsci 16 09950 g001
Figure 2. Operating Scenario and Functional Constraints of a High-Speed Railway Contact-Wire Inspection Vehicle.
Applsci 16 09950 g002
Figure 3. Two-Dimensional Visualization of Kansei Semantic Clustering Results.
Applsci 16 09950 g003
Figure 4. Hierarchical Subjective Aesthetic Evaluation System for Inspection Vehicle Styling.
Applsci 16 09950 g004
Figure 5. Schematic Coordinate Definition of Geometric Parameters for Inspection Vehicle Form.
Applsci 16 09950 g005
Figure 6. Heatmap of Normalized Explanatory Contributions between Kansei Semantic Sub-Criteria and Objective Aesthetic Indicators.
Applsci 16 09950 g006
Figure 7. Comparison of Ranking Sequences across Evaluation Methods.
Applsci 16 09950 g007
Figure 8. Comparison of Model Rankings with User Preferences.
Applsci 16 09950 g008
Table 1. Standardized Samples of High-Speed Railway Contact-Wire Inspection Vehicles.
SampleApplsci 16 09950 i001Applsci 16 09950 i002Applsci 16 09950 i003
NumberABC
SampleApplsci 16 09950 i004Applsci 16 09950 i005Applsci 16 09950 i006
NumberDEF
SampleApplsci 16 09950 i007Applsci 16 09950 i008Applsci 16 09950 i009
NumberGHI
SampleApplsci 16 09950 i010Applsci 16 09950 i011Applsci 16 09950 i012
NumberJKL
SampleApplsci 16 09950 i013Applsci 16 09950 i014Applsci 16 09950 i015
NumberMNO
Note: The sample graphics are standardized contour drawings prepared by the authors in Rhino from publicly available styling references. Original manufacturer photographs are not reproduced.
Table 2. Weights before and after Trust-Driven Adjustment.
CriterionSub-CriterionInitial Weight (Mean)Final Weight
Lightweight impression A a 1 0.0400.039
a 2 0.0270.048
a 3 0.0240.011
Stability B b 1 0.0860.085
b 2 0.0990.115
b 3 0.0580.039
Technological sense C c 1 0.1010.050
c 2 0.0650.025
Safety D d 1 0.1180.136
d 2 0.0760.084
d 3 0.1620.233
Coordination E e 1 0.0340.034
e 2 0.0790.084
e 3 0.0300.018
Table 3. Aesthetic Indicator Values for All Samples.
Sample NumberObjective Evaluation Indicator Values
BMCDMSYMPMRHM
A0.5760.7790.6680.7100.437
B0.2290.6520.4990.8480.482
C0.6180.8410.6350.5640.427
D0.5430.8470.5100.8240.480
E0.2900.7060.5290.7230.435
F0.5500.8340.3850.8500.443
G0.5740.7910.6430.7730.430
H0.7380.9150.3210.7820.455
I0.3280.7660.3290.7580.457
J0.1890.6680.3380.6220.449
K0.6940.9370.9720.5140.458
L0.5640.7590.4750.6110.451
M0.6020.8360.5380.5860.445
N0.6100.8200.5870.8240.451
O0.1290.7070.2790.7510.447
Table 4. Objective, Equivalent Subjective, Fused Weights, and Sensitivity Ranges.
IndicatorObjective WeightEquivalent Subjective WeightFused WeightSensitivity Range Under Tested D-S Ratios
BM0.1760.2080.2020.186–0.202
CDM0.1600.1210.1430.143–0.163
SYM0.1740.3060.2660.200–0.266
PM0.2770.1420.1720.172–0.239
RHM0.2130.2230.2170.212–0.217
Note: The sensitivity range represents the minimum-maximum fused weight obtained by retaining the D-S fusion procedure and varying the subjective/objective discrimination ratio across 0.705/0.295, 0.50/0.50, and 0.30/0.70.
Table 5. Cross-Validation Results for Representative Sub-Criterion Regression Models.
Sub-CriterionR2PRESSQ2
a 3 0.8211.5600.694
e 2 0.7281.2450.725
b 2 0.7091.8820.612
Table 6. Spearman Rank Correlations between the Proposed Method and Benchmark Methods.
MethodSpearman ρ Mean Absolute Rank Difference
TOPSIS0.9431.200
VIKOR0.8431.467
CoCoSo0.8291.867
Table 7. User Aesthetic Preference Benchmark.
SampleFirst Survey ScoreSecond Survey ScoreMean ScoreRank
A4.4464.4894.4684
B2.7572.7302.74411
C4.3243.5843.9546
D3.7974.3254.0615
E2.5812.1502.36615
F3.4863.3983.4429
G4.5274.7594.6432
H3.6763.6353.6567
I2.5002.4862.49312
J2.3782.3962.38713
K4.7434.5684.6561
L2.9862.8592.92310
M3.2843.9683.6268
N4.6224.5234.5733
O2.2732.4862.38014
Table 8. Comparison of Ranking Validation Metrics.
MethodSpearman ρ Kendall τ Mean Rank Deviation
BWM0.9540.8670.933
CRITIC0.9070.7521.600
Proposed method0.9750.9240.533
Note: MRD is expressed in rank positions on a 1–15 ranking.
Disclaimer/Publisher’s Note: The statements, opinions and data contained in all publications are solely those of the individual author(s) and contributor(s) and not of MDPI and/or the editor(s). MDPI and/or the editor(s) disclaim responsibility for any injury to people or property resulting from any ideas, methods, instructions or products referred to in the content.