1. Introduction
The global agri-food sector generates substantial quantities of by-products and waste throughout processing operations, creating significant environmental and economic challenges. Fruit and vegetable processing industries are particularly responsible for large volumes of organic residues, including peels, pomace, seeds, and stems, which often remain underutilized despite their considerable nutritional and functional value. In recent years, increasing attention has been directed toward the concept of sustainable valorization, which aims to transform food processing residues into value-added ingredients that contribute to the development of circular and resource-efficient food systems [
1,
2]. Recent advances in circular bioeconomy strategies have further emphasized the recovery of bioactive compounds from fruit and vegetable by-products as a sustainable approach for reducing food waste while generating high-value functional ingredients. Vegetable processing residues are increasingly recognized as important sources of phenolic compounds, dietary fiber, natural pigments, and antioxidants suitable for food, nutraceutical, and pharmaceutical applications [
3,
4,
5,
6].
Among vegetable processing by-products, carrot (
Daucus carota L.) and celery (
Apium graveolens L.) peels represent abundant by-products generated during industrial preparation and fresh-cut processing. Although commonly discarded, these materials contain substantial amounts of biologically active compounds, including phenolic compounds, flavonoids, carotenoids, vitamins, and dietary fiber. Previous studies have demonstrated that vegetable peels frequently possess higher concentrations of phytochemicals than the corresponding edible tissues due to their protective physiological role against environmental stress and microbial attack [
7,
8]. Recent investigations have further confirmed that carrot and celery processing residues contain considerable quantities of antioxidant compounds and other bioactive metabolites, supporting their utilization as valuable raw materials within sustainable waste valorization strategies [
9,
10]. Consequently, the recovery and utilization of peel waste offer promising opportunities for improving the nutritional quality and functionality of food products while simultaneously reducing environmental burdens associated with waste disposal [
11,
12].
The growing consumer demand for natural ingredients and clean-label products has further stimulated interest in plant-derived antioxidants as alternatives to synthetic additives. Polyphenolic compounds are among the most important bioactive constituents present in vegetable by-products because of their ability to scavenge free radicals, inhibit oxidative reactions, and potentially exert health-promoting effects. The incorporation of vegetable waste materials into food formulations may therefore enhance antioxidant capacity and support the development of functional foods with added nutritional value [
13,
14]. Recent studies have highlighted that both extractable and non-extractable phenolic compounds present in vegetable residues significantly contribute to antioxidant activity, further increasing the potential of food by-products as sources of natural functional ingredients [
3,
4]. However, the effectiveness of such incorporation depends on the type and proportion of waste material used, as well as on interactions between different plant matrices [
15].
In addition to functional properties, color represents one of the most important quality attributes influencing consumer acceptance of food products. The incorporation of vegetable-derived ingredients may substantially modify visual appearance due to the presence of natural pigments, phenolic compounds, and oxidation products. Changes in color parameters may affect consumer perception regardless of improvements in nutritional quality, making it necessary to balance functional enhancement with acceptable sensory characteristics [
16,
17,
18]. Furthermore, processing operations such as drying, milling, and particle size reduction can influence pigment stability and promote oxidation reactions, potentially affecting the visual appearance of formulations enriched with vegetable by-products. Therefore, simultaneous evaluation of antioxidant-related properties and color attributes is essential when developing formulations based on vegetable processing residues [
19,
20].
Response Surface Methodology (RSM) has been widely applied as an efficient statistical and mathematical tool for optimizing food formulations and processing conditions involving multiple interacting variables. Compared to conventional one-factor-at-a-time approaches, RSM enables evaluation of both individual and combined effects of experimental factors while reducing the number of required experiments. This methodology has proven particularly valuable in studies focused on maximizing bioactive compound recovery and optimizing quality attributes of food products derived from agricultural residues [
21]. In recent years, RSM has become one of the most frequently applied optimization approaches in food science due to its ability to evaluate complex interactions among formulation variables and simultaneously optimize multiple quality attributes with a limited number of experimental trials [
22].
Therefore, the aim of the present study was to investigate the effects of incorporating carrot and celery peel waste on selected functional and color properties of the formulated samples. Total polyphenol content, antioxidant activity, crude fiber and ash were evaluated as indicators of functional and nutritional potential, while CIELab color parameters were used to characterize visual quality. Furthermore, Response Surface Methodology was employed to model the observed responses and identify optimal levels of carrot and celery peel waste substitution that maximize functional and nutritional properties while maintaining acceptable color characteristics. Through this approach, the study contributes to current efforts aimed at sustainable utilization of vegetable processing waste and development of value-added ingredients aligned with circular economy principles.
The resulting formulations were conceived as versatile powdered vegetable-based ingredients rather than for a single specific food matrix, with potential application in soups, stews, sauces, vegetable-based dishes, seasoning blends, and other savory food products.
2. Materials and Methods
2.1. Materials
Fresh celery root (Apium graveolens L.) and carrot (Daucus carota L.) samples purchased from a local market were used in this study. Hereafter, the term “celery” refers to celery root throughout the manuscript. Prior to processing, the samples were visually inspected, and any mechanically damaged or defective parts were removed. The vegetables were then washed under running water to remove surface impurities and soil residues and allowed to drain to remove excess water. The washed samples were manually peeled, separating the edible portions from the peeling residues. The peeling residues, consisting of the peel and outer root layers, were collected as a separate fraction for further processing. The edible portions of celery and carrot were cut into approximately 2 mm thick slices to ensure uniform sample thickness and facilitate even drying The edible portions and peeling residues were dried separately in a laboratory dehydrator (Gorenje, Velenje, Slovenia) at 65 °C for approximately 10 h, until reaching a final moisture content of approximately 12%. All analytical results are expressed per 100 g of the dried material as analyzed and were not recalculated to an absolute dry-matter basis. The drying conditions were selected on the basis of preliminary trials performed at different temperatures. Lower drying temperatures resulted in insufficiently dried, tough-textured material under the applied conditions, whereas higher temperatures caused excessive browning and signs of thermal deterioration. Therefore, 65 °C was selected as a practical compromise for obtaining adequately dried material. During drying, the samples were evenly distributed in a single layer on perforated dehydrator trays to ensure uniform air circulation and consistent dehydration. Upon completion of the drying process, the samples were cooled to room temperature in a desiccator to prevent moisture reabsorption from the environment. The dried samples were then stored in airtight containers in a dry and dark place until further analyses were performed. Both the dried vegetables and the by-products generated during peeling were ground using a mill IKA M20 (IKA-Werke GmbH & Co. KG, Staufen, Germany). Particle dimensions of the resulting powders were determined using an Insize Digita Outside Micrometer 0–25 mm/0-1# (INSIZE Co., Ltd., Suzhou, China). Individual particles were randomly selected from the milled samples and measured directly. The mean particle dimension was 0.672 ± 0.202 mm, with values ranging from 0.365 to 1.019 mm (n = 37). The resulting powders were vacuum-packed and stored at room temperature until further analysis.
2.2. Sample Preparation and Experimental Design
Carrot and celery were mixed in a 1:1 (w/w) ratio. Carrot and celery blend was selected because these are among the most commonly used root vegetables in culinary practice in this region of Europe, where they are frequently used as a base for a wide range of dishes. Response surface methodology (RSM) was applied to develop mathematical models describing the effects of carrot and celery peel waste substitution levels on the investigated responses.
Dried carrot and celery were partially replaced with their respective peel waste at three substitution levels: 0%, 50%, and 100% (w/w). These percentages refer to the substitution level within the respective carrot and celery fractions and not to the percentage composition of the final formulation. A three-level full factorial design (32) was selected because the study involved two formulation factors, each evaluated at three predefined substitution levels. For two factors, this design allows estimation of linear effects, the two-factor interaction, and quadratic effects and was therefore considered suitable for response surface modeling within the investigated formulation range. The resulting design comprised nine formulations: 0–0, 0–50, 0–100, 50–0, 50–50, 50–100, 100–0, 100–50, and 100–100 (carrot waste–celery waste, %).
For each experimental design point, one formulation was prepared, and the corresponding analytical determinations were performed in replicate using the same prepared formulation. Thus, repeated measurements represent analytical replicates and not independently prepared formulation replicates. The RSM analysis comprised nine distinct formulation combinations, with repeated analytical observations at the central design point (50% carrot peel waste and 50% celery peel waste) included in the Design-Expert analysis. These repeated observations account for the pure-error degrees of freedom reported in the ANOVA tables and should not be interpreted as independently prepared experimental replicates. The experimental response values used for the RSM analysis are provided in
Supplementary Table S1.
2.3. Extract Preparation
A 0.5 g portion of the ground samples was extracted with 10 mL of acidified methanol (methanol/2% HCl, 95:5, v/v). The extraction was performed using an ultrasonic bath DT 510 F SONOREX DIGITEC (BANDELIN electronic GmbH & Co. KG, Berlin, Germany) for 60 min. During ultrasonication, the tubes were covered with aluminum foil to prevent solvent evaporation and light exposure. After extraction, the samples were centrifuged for 1 min at 4500 rpm. The methanolic supernatant was then carefully separated and collected for further analysis. Each sample was extracted in three analytical replicates from the same prepared formulation.
2.4. Determination of Total Polyphenols
Polyphenols were determined according to the Folin–Ciocalteu method, with modifications, as previously described in detail [
23]. Gallic acid (Carlo Erba Reagents, Cornaredo, Italy) was used as a standard (calibration curve y = 1.5534x − 0.1115, R
2 = 0.9727), and results were expressed in mg of gallic acid equivalents per 100 g of sample.
2.5. Determination of Antioxidant Activity (DPPH)
An aliquot of extract (50 µL) was mixed with 2 mL DPPH radical solution (0.1 mM in ethanol). The absorbance of the mixture was monitored at 517 nm at 5 min intervals over a 30 min reaction period, and results were expressed as the mean of three replications. For the RSM analysis, DPPH radical scavenging activity determined at 30 min was used as the standardized endpoint response for all formulations. Pure ethanol was used as a blank.
A0—absorbance of DPPH radical solution,
A
t—absorbance after 30 min [
24].
2.6. Determination of Crude Fiber and Ash
Ash content was determined according to ISO 5984:2002 [
25] and crude fiber content was determined according to modified HRN EN ISO 6865:2001 [
26].
2.7. Color Determination
The color of the milled samples was determined using a Konica Minolta CR-300 colorimeter (Konica Minolta Inc., Tokyo, Japan) equipped with an attachment for granular materials. Results were expressed using CIE LAB and LCH color system as tri-stimulus values (L*: lightness, a*: greenness/redness and b*: blueness/yellowness) of the Hunter color scale, and as hue angle (H) and chroma (C). The H value represents the hue angle, with the following ranges used for color interpretation: 0–90° red-purple, 90–180° yellow, 180–270° blue-green, and 270–360° blue. The C value represents color intensity. All values were directly read from the instrument display. Measurements for each sample were performed in 5 replications. A white standard plate delivered with the instrument was used for calibration.
The total color difference (Δ
E) was calculated relative to the control sample containing no carrot or celery peel waste (0-0 formulation), according to the following equation:
2.8. Data Analysis
Data were analyzed using Design expert 6.0.8. software (Stat-Ease Inc., Minneapolis, MN, USA). Response surface methodology (RSM) was used to develop mathematical models based on a three-level factorial design. Carrot waste level (variable A) and celery waste level (variable B) were defined as independent variables because peel waste utilization was the focus of this investigation. Mathematical models were built in terms of coded values: variable A: 0%, 50%, 100%/−1, 0, 1 and Variable B: 0%, 50%, 100%/−1, 0, 1. Statistical significance of the regression coefficients was determined by analysis of variance (ANOVA), at 95% level. The desirability function was used to determine optimal waste levels to maximize functional and nutritional properties while minimizing color change in the final product.
3. Results and Discussion
3.1. Total Polyphenols
The effect of carrot and celery waste incorporation on total polyphenol content (TPC) was successfully described by a significant 2FI model (
p < 0.0001), with high coefficients of determination (R
2 = 0.9386, Adj R
2 = 0.9181, Pred R
2 = 0.8063), indicating good agreement between the experimental and predicted values (
Table 1 and
Table 2). The relatively small difference between adjusted and predicted R
2 values confirmed satisfactory predictive capability and model stability. The lack-of-fit test was highly significant (
p < 0.0001), indicating that the fitted polynomial did not fully account for all systematic variation in the response. Therefore, the model was further evaluated by considering alternative polynomial forms, predictive statistics, and response transformation. Increasing model complexity to a quadratic model did not resolve the significant lack of fit and resulted in substantially lower predictive performance (Predicted R
2 = 0.5046) compared to the selected 2FI model (Predicted R
2 = 0.8063).
The significant lack of fit should also be interpreted in the context of the replication structure of the experiment. Replicate determinations were analytical replicates performed on the same prepared formulation rather than independently prepared formulation replicates. Consequently, the estimated pure error was relatively small, increasing the sensitivity of the lack-of-fit test. Nevertheless, the significant lack of fit is acknowledged as a limitation of the model. The 2FI model was therefore retained as the most parsimonious model providing the best predictive performance among the evaluated standard models, but its predictions were interpreted cautiously and restricted to the investigated experimental domain.
Among the investigated factors, carrot waste (factor A) had a highly significant positive effect on TPC (p < 0.0001), while celery waste (factor B) showed no statistically significant influence (p = 0.5087). This finding suggests that carrot peel waste represented the dominant source of phenolic compounds in the investigated mixtures. In addition, the interaction term AB was significant (p = 0.0084), indicating that the combined effect of carrot and celery waste levels influenced the extraction or accumulation of phenolic compounds.
The positive influence of carrot peel waste on TPC may be related to the phenolic profile of carrot outer tissues, in which compounds such as chlorogenic acid, catechin, and rutin have been reported [
27,
28,
29]. Since individual phenolic compounds were not determined in the present study, their specific contribution to the observed increase in TPC cannot be established. In addition to the initial phenolic composition of the raw material, processing may affect phenolic stability and subsequent extractability from the plant matrix. Therefore, the observed TPC response likely reflects both the phenolic richness of the peel-derived material and the extractability of phenolic compounds under the applied extraction conditions. The observed interaction effect further suggests that the incorporation of celery waste modified the overall polyphenol response of the system, potentially due to interactions between plant matrices and extraction behavior [
30]. Additionally, the solvent used during extraction plays an important role, as reported in numerous studies [
31,
32]. In the present study, methanol was used since it has been most frequently identified as the most effective extraction solvent.
The drying procedure used in this study was performed in a laboratory-scale dehydrator and was not intended to simulate industrial processing; therefore, direct scalability of the applied conditions cannot be assumed. Different drying time–temperature combinations may also affect the retention of heat-sensitive bioactive compounds. Further studies at pilot or industrial scale would be required to optimize drying conditions and assess their effects on bioactive compound retention.
3.2. Antioxidant Activity (DPPH)
Although the DPPH reaction was monitored at 5 min intervals over the 30 min reaction period, the 30 min value was selected as a standardized endpoint for comparison among formulations and was used as the response variable in the RSM analysis. Therefore, the reported DPPH inhibition values should be interpreted as endpoint antioxidant activity under the applied assay conditions rather than as a complete characterization of radical scavenging kinetics. Antioxidant activity expressed as DPPH inhibition was adequately described by a linear model (
p = 0.0001), with coefficients of determination of R
2 = 0.8329, Adj R
2 = 0.7995 and Pred R
2 = 0.6050 (
Table 1 and
Table 2). Although the predictive capability of the model was moderate, it was superior to the 2FI and quadratic models, which exhibited substantially lower predictive performance. Therefore, the linear model was considered the most appropriate for describing the investigated response.
Both carrot waste (p = 0.0001) and celery waste (p = 0.0051) showed significant positive linear effects on antioxidant activity, indicating that higher substitution levels were associated with increased DPPH inhibition within the investigated experimental range. However, considering the moderate predictive capability and significant lack of fit of the model, these relationships should be interpreted cautiously.
The significant contribution of celery waste to antioxidant activity, despite its non-significant effect on total polyphenol content, further indicated that compounds other than total phenolics participated in the radical scavenging activity of the samples. Celery waste has been reported to contain bioactive constituents such as apigenin, luteolin, ascorbic acid, carotenoids, and volatile antioxidant compounds, which may contribute to antioxidant activity independently of total phenolic concentration [
33]. Moreover, previous studies have demonstrated that the antioxidant capacity of plant materials is strongly influenced not only by the concentration, but also by the chemical structure (for instance, the number of available hydroxyl groups), reactivity, and synergistic interactions of individual antioxidant compounds [
34,
35]. In addition, particle size reduction and processing treatments may enhance antioxidant activity by promoting the release of antioxidatively active compounds into the surrounding medium due to disruption of plant tissue structures and increased surface area [
36]. It has also been suggested that radical scavenging may partially occur at the surface of fine particles, while gradual release of antioxidant substances from disrupted plant matrices could further contribute to the measured antioxidant activity. However, intensive processing and exposure to oxygen may simultaneously induce oxidative degradation of sensitive antioxidant compounds, indicating that antioxidant behavior of plant materials depends on a complex balance between compound release and oxidative losses during processing [
37]. Similar observations were reported by Nićetin et al. [
38], who found a weak correlation between total polyphenol content and antioxidant activity determined by the DPPH assay in celery root, while other antioxidant assays showed stronger correlations. These findings suggest that DPPH activity depends not only on total phenolic concentration, but also on the structure and reactivity of individual antioxidant compounds present in the plant matrix.
3.3. Crude Fiber
Crude fiber content was successfully described by a significant quadratic model (
p < 0.0001), with high coefficients of determination (R
2 = 0.9668, Adj R
2 = 0.9430 and Pred R
2 = 0.8266), indicating excellent agreement between experimental and predicted values (
Table 1 and
Table 2). The relatively small difference between adjusted and predicted R
2 values further confirmed good predictive capability and model stability. Moreover, the non-significant lack-of-fit test (
p = 0.2615) indicated that the selected model adequately described variations in crude fiber content within the investigated experimental region.
Among the investigated factors, celery waste (factor B) exerted a highly significant positive effect on crude fiber content (p < 0.0001), indicating that increasing the proportion of celery peel waste substantially increased fiber levels in the formulated samples. In contrast, carrot waste (factor A) did not significantly affect crude fiber content (p = 0.1884). The quadratic term A2 was significant (p = 0.0082), suggesting the presence of curvature in the response and indicating that the effect of carrot waste on fiber content was not strictly linear. Neither the quadratic term B2 nor the interaction term AB significantly affected the response (p > 0.05).
The pronounced positive effect of celery peel waste on crude fiber content may be associated with the contribution of structural cell-wall components in the peel tissues, including cellulose, hemicellulose, lignin, and pectic substances. Vegetable processing by-products are widely recognized as valuable sources of dietary fiber and have considerable potential for development of fiber-enriched functional foods [
39,
40,
41,
42]. The absence of a significant linear effect of carrot waste suggests that replacement of carrot tissue with carrot peel did not substantially alter crude fiber levels within the investigated formulation range. This may indicate similar contents of insoluble structural carbohydrates in both tissues or may partially reflect limitations of the conventional crude fiber method. It has been reported that crude fiber determination primarily quantifies insoluble fiber fractions and may underestimate total dietary fiber because a substantial proportion of soluble fiber components can be lost during analysis [
43,
44]. Therefore, future studies involving the determination of total dietary fiber could provide a more comprehensive assessment of the nutritional contribution of carrot and celery processing residues.
3.4. Ash
Ash content was adequately described by a significant quadratic model (
p = 0.0026), with relatively high coefficients of determination (R
2 = 0.8949 and Adj R
2 = 0.8197), indicating a satisfactory fit to the experimental data (
Table 1 and
Table 2). The lack-of-fit test was not significant (
p = 0.1441), confirming that the selected model adequately represented the experimental data. However, the predicted R
2 value (0.2448) was considerably lower than the adjusted R
2, indicating limited predictive capability of the model. Evaluation of alternative model forms did not improve predictive performance, as the linear and 2FI models showed even lower predicted R
2 values (0.1253 and −0.4563, respectively). Thus, although the quadratic model provided the best predictive performance among the evaluated model forms, its relatively low predicted R
2 indicates that predictions should be interpreted cautiously and primarily within the investigated experimental domain. Additional experimental design points and independently prepared formulation replicates could provide a more robust basis for modeling this response.
Among the investigated factors, celery waste (factor B) exerted a highly significant negative effect on ash content (p = 0.0004), indicating that increasing incorporation of celery waste reduced the ash content of the formulations. In contrast, carrot waste had no significant effect on ash content (p = 0.7002). The interaction term AB significantly affected the response (p = 0.0437), whereas the quadratic terms A2 and B2 were not statistically significant (p > 0.05).
The significant decrease in ash content with increasing celery waste incorporation was somewhat unexpected, since vegetable by-products are generally considered valuable sources of minerals. Nevertheless, mineral distribution within plant tissues is highly dependent on plant species, tissue type, cultivar, and growing conditions. Previous studies have demonstrated considerable variation in mineral composition among different parts of celery plants, with ash content generally decreasing from leaves toward root tissues [
45]. Furthermore, carrot peel has been reported to contain higher concentrations of total inorganic cations than root flesh, predominantly due to its higher potassium content, while higher calcium concentrations were also observed in the peel [
46]. The observed reduction in ash content with increasing celery peel substitution may therefore reflect differences in the overall mineral composition of the peel and the corresponding celery fraction, although the contribution of individual mineral elements cannot be established from total ash determination alone. Detailed mineral profiling would be required to determine whether specific macro- or microelements are responsible for the observed response.
3.5. Response Surface Plots for Functional and Nutritional Properties
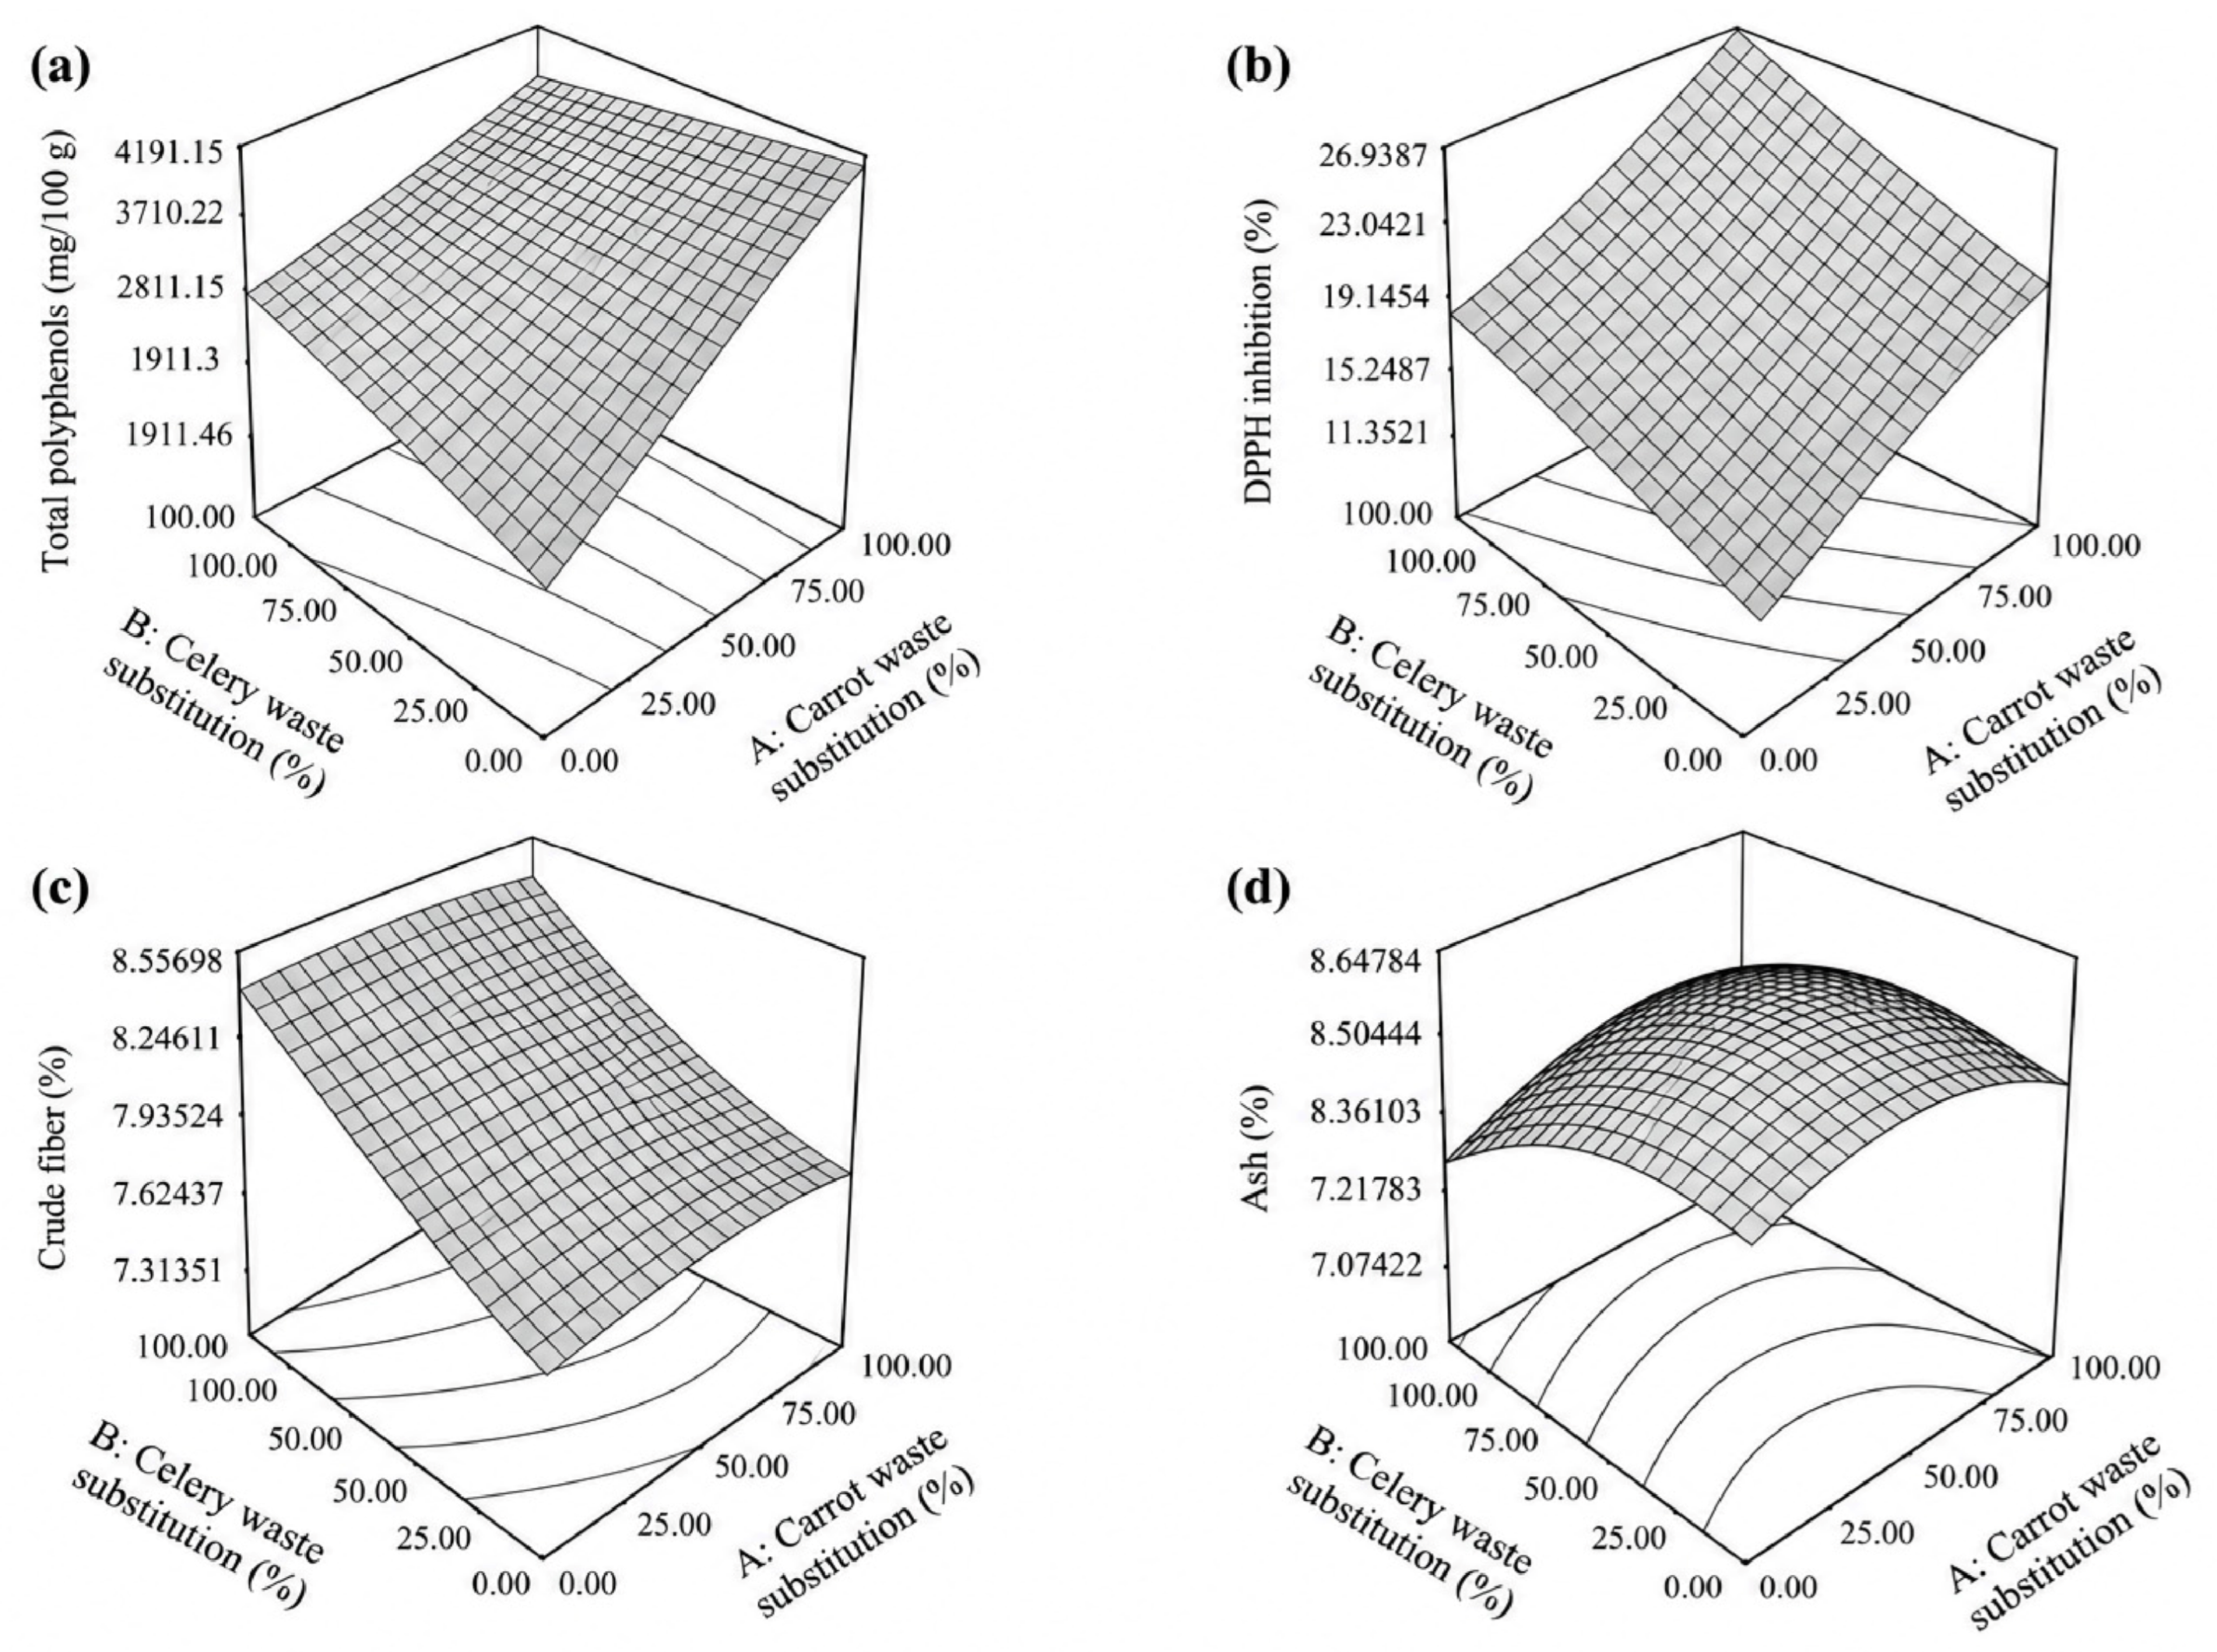
The response surface plots presented in
Figure 1 further illustrate the combined influence of the incorporation of carrot and celery peel waste on the functional properties of the formulations. The increase in TPC associated predominantly with carrot peel waste, together with the contribution of both peel materials to DPPH radical scavenging activity, indicates that the antioxidant response cannot be explained solely by changes in total phenolic content. This is particularly evident for celery peel waste, which significantly affected DPPH activity despite its non-significant effect on TPC. Such behavior may reflect differences in the composition and reactivity of antioxidant constituents present in the two plant matrices, since radical scavenging activity depends not only on the total concentration of phenolic compounds but also on their chemical structure and on the presence and interactions of other antioxidant constituents. Nevertheless, the generally similar trends in TPC and DPPH activity suggest that phenolic compounds contributed to the antioxidant potential of the formulations, in agreement with relationships reported for plant-based materials and vegetable by-products [
3,
47,
48].
The response surface plots also demonstrated that crude fiber content increased predominantly with increasing incorporation of celery peel waste, supporting the contribution of celery peel-derived material to the crude fiber content of the formulations. In contrast, ash content tended to decrease with increasing celery peel substitution, indicating that peel incorporation affected the overall inorganic fraction differently from the crude fiber response. These contrasting trends illustrate that the nutritional effects of vegetable by-product incorporation depend on both the botanical source and the specific compositional parameter considered. As discussed above, however, total ash and crude fiber determinations provide only general measures of the inorganic and fibrous fractions, respectively, and do not allow conclusions regarding individual mineral elements or total dietary fiber composition.
3.6. Color Parameters
Food color is influenced by numerous chemical, biochemical, microbial, and physical changes occurring during plant growth, maturation, postharvest handling, and processing. Consequently, color measurements are frequently used as rapid and reliable indicators of food quality attributes, including pigment composition, flavor characteristics, and other physicochemical properties, due to their simplicity and association with overall product quality. Changes in CIELab parameters are frequently associated with pigment degradation, enzymatic browning, and optical interactions among different plant pigments and matrix components formed during processing [
49].
3.6.1. L*
The L* color parameter was best described by a linear model (
p = 0.0008), with R
2, Adj R
2 and Pred R
2 values of 0.7628, 0.7154 and 0.4788, respectively (
Table 3 and
Table 4). Although the predicted R
2 of the selected linear model was relatively low (0.4788), alternative model forms did not improve predictive performance. The 2FI and quadratic models showed substantially lower predicted R
2 values of −0.1578 and −0.1627, respectively. Thus, the linear model was retained as the most appropriate and parsimonious model among those evaluated. Nevertheless, its predictive capability remains limited, and predictions should therefore be interpreted cautiously and primarily within the investigated experimental domain. Both carrot waste and celery waste had significant negative effects on the L* parameter, indicating that increasing the proportion of waste materials reduced sample lightness and resulted in darker products. This decrease in lightness may reflect differences in the intrinsic color and composition of the peel-derived and corresponding vegetable tissues, as well as differences in the contribution of naturally occurring pigments and other light-absorbing components to the mixed plant matrix. In addition, thermal drying may contribute to changes in color through pigment degradation and the development of non-enzymatic browning reactions, both of which have been associated with changes in CIELab parameters during hot-air drying of plant materials [
50]. However, since individual pigments and browning products were not quantified in the present study, their specific contribution to the observed decrease in L* cannot be established.
3.6.2. a*
The a* color parameter was successfully described by a reduced quadratic model obtained through forward regression (
p < 0.0001), with excellent adequacy statistics (R
2 = 0.9914, Adj R
2 = 0.9871 and Pred R
2 = 0.9442), indicating outstanding agreement between the experimental and predicted values (
Table 3 and
Table 4). The small difference between adjusted and predicted R
2 values further confirmed the high predictive capability and stability of the model. Both carrot waste (A) and celery waste (B) exerted highly significant negative linear effects on the a* parameter (
p < 0.0001), indicating that increasing waste incorporation reduced redness of the samples. In contrast, the quadratic term B
2 (
p = 0.0223) and the interaction term AB (
p = 0.0007) significantly influenced the response in a positive manner, demonstrating the presence of curvature and interaction effects within the investigated experimental region. The obtained results suggest that the effect of celery waste on redness was not purely linear, but depended on the proportion of waste incorporated into the formulation. Furthermore, the significant interaction between carrot and celery peel waste indicated that the effect of one substitution factor on a* depended on the level of the other factor, confirming a combined influence of the two plant materials on the redness of the formulations. The excellent predictive performance of the model demonstrated that the response surface methodology approach was highly suitable for describing variations in the a* parameter caused by vegetable waste incorporation. The decrease in a* values with increasing peel waste substitution indicates a shift toward lower redness of the formulations. This response may reflect differences in the pigment composition of the peel-derived and corresponding vegetable tissues, as well as changes in the relative contribution of individual plant components to the overall color of the mixed matrix. In addition, processing-related pigment degradation and browning reactions may contribute to changes in the red–green color coordinate, as previously reported for plant materials subjected to thermal drying [
50]. However, since individual pigments were not quantified in the present study, the contribution of specific pigment groups to the observed changes in a* cannot be determined.
3.6.3. b*
Both carrot waste (A) and celery waste (B) significantly affected the b* parameter, with negative regression coefficients indicating that increasing waste incorporation reduced yellowness of the samples. The interaction term AB was also included in the model and showed a positive coefficient, although its statistical significance was slightly above the conventional significance threshold (p = 0.0708), suggesting a possible interaction trend between the investigated factors. The observed decrease in b* values with increasing peel waste substitution may reflect differences in the composition and relative contribution of naturally occurring pigments and other color-related constituents between the peel-derived and corresponding vegetable tissues. However, since individual pigments were not quantified, the specific compositional changes responsible for the decrease in yellowness cannot be established from the present results. Compared to the a* parameter, the b* response demonstrated lower predictive capability, suggesting a more complex or variable behavior of yellowness changes within the investigated design space. Nevertheless, the selected 2FI model provided the best predictive performance among the evaluated model forms, although its moderate predictive capability should be considered when interpreting the response surface. Interestingly, the increase in antioxidant activity observed with higher waste incorporation was accompanied by reductions in a* and b* values, indicating lower redness and yellowness of the samples. However, since carotenoids, chlorophylls, and other pigment compounds were not directly quantified in the present study, the relationship between the observed changes in antioxidant activity and color cannot be attributed to specific pigments or pigment degradation pathways.
Benucci et al. [
20] reported that vegetable peel waste represents a complex plant matrix containing carotenoids as well as other components that may influence its color characteristics. In addition, oxidative reactions occurring during processing may contribute to the formation of colored oxidation products and changes in the visual properties of plant materials [
51]. Such mechanisms may potentially contribute to the color changes observed in the present formulations; however, without direct pigment analysis, they remain possible explanations rather than experimentally confirmed mechanisms. Direct quantification of carotenoids, chlorophylls, and related pigment compounds would therefore be valuable in future studies to clarify the relationship between pigment composition, antioxidant activity, and the observed color changes.
3.6.4. C
The chroma value (C) was successfully described by a significant quadratic model (
p = 0.0002), with high adequacy statistics (R
2 = 0.9480, Adj R
2 = 0.9108 and Pred R
2 = 0.6707), indicating good agreement between the experimental and predicted values (
Table 3 and
Table 4). Although the difference between adjusted and predicted R
2 values was somewhat higher compared to other responses, the model still demonstrated acceptable predictive capability for describing chroma changes within the investigated experimental region. Both carrot waste (A) and celery waste (B) had highly significant negative linear effects on chroma (
p = 0.0002 and
p = 0.0003, respectively), indicating that increasing the proportion of vegetable waste reduced color saturation or intensity of the samples. In contrast, the quadratic term B
2 (
p = 0.0083) and the interaction term AB (
p = 0.0075) positively affected the response, suggesting the presence of curvature and interaction effects between the investigated factors. The quadratic term A
2 was not statistically significant (
p = 0.1069), indicating a less pronounced nonlinear effect of carrot waste on chroma. The reduction in chroma values with increasing peel waste substitution indicates a decrease in overall color saturation, consistent with the observed changes in the individual a* and b* coordinates. Furthermore, the significant interaction term indicated that the effect of one substitution factor on chroma depended on the level of the other factor, demonstrating a combined influence of carrot and celery peel waste on color saturation.
3.6.5. h
The hue angle (h) was adequately described by a highly significant linear model (
p < 0.0001), with excellent coefficients of determination (R
2 = 0.9730, Adj R
2 = 0.9676 and Pred R
2 = 0.9397), indicating outstanding predictive capability and strong agreement between the experimental and predicted values (
Table 3 and
Table 4). Both carrot waste (A) and celery waste (B) exerted highly significant positive effects on the hue angle (
p < 0.0001), demonstrating that increasing waste incorporation shifted the color characteristics of the samples toward higher hue angle values. The regression coefficient for celery waste was notably higher than that for carrot waste, suggesting a stronger influence of celery waste on hue modification. The excellent predictive performance of the model indicated that hue angle changes followed a predominantly linear behavior within the investigated experimental range. Compared to the other color parameters, the h response exhibited the highest model stability and predictive accuracy, confirming that the response surface methodology approach was highly suitable for describing hue variations induced by vegetable waste incorporation. The increase in hue angle reflects a systematic shift in the overall color characteristics of the formulations with increasing peel waste substitution and is consistent with the simultaneous changes observed in the a* and b* coordinates. Since hue angle is derived from these chromatic coordinates, the observed response provides an integrated representation of the change in color tone rather than direct evidence of changes in specific pigment compounds.
3.6.6. ΔE
The total color difference (Δ
E) was successfully described by a significant quadratic model (
p < 0.0001), with excellent adequacy statistics (R
2 = 0.9755, Adj R
2 = 0.9581 and Pred R
2 = 0.8392), indicating strong agreement between the experimental and predicted values and confirming the high predictive capability of the model (
Table 3 and
Table 4). Both carrot waste (A) and celery waste (B) exerted highly significant positive linear effects on Δ
E (
p < 0.0001), demonstrating that increasing the proportion of vegetable waste intensified the overall color difference in the samples relative to the control formulation. In addition, the quadratic term B
2 (
p = 0.0204) and the interaction term AB (
p = 0.0066) significantly affected the response, while the quadratic term A
2 showed borderline significance (
p = 0.0516), suggesting a tendency toward nonlinear behavior. The positive regression coefficients obtained for the linear terms indicated that waste incorporation promoted increasingly pronounced color deviations from the control sample. Furthermore, the significant interaction effect indicated that the influence of one substitution factor on the overall color difference depended on the level of the other factor, demonstrating a combined effect of carrot and celery peel waste on Δ
E. The high predictive capability of the model demonstrated that response surface methodology was highly suitable for describing total color changes caused by vegetable waste incorporation. Since Δ
E represents an integrated color parameter derived from L*, a*, and b* values, the obtained results confirmed that increasing levels of peel waste substantially modified the overall instrumental color characteristics of the investigated formulations.
3.7. Response Surface Plots for Color Parameters
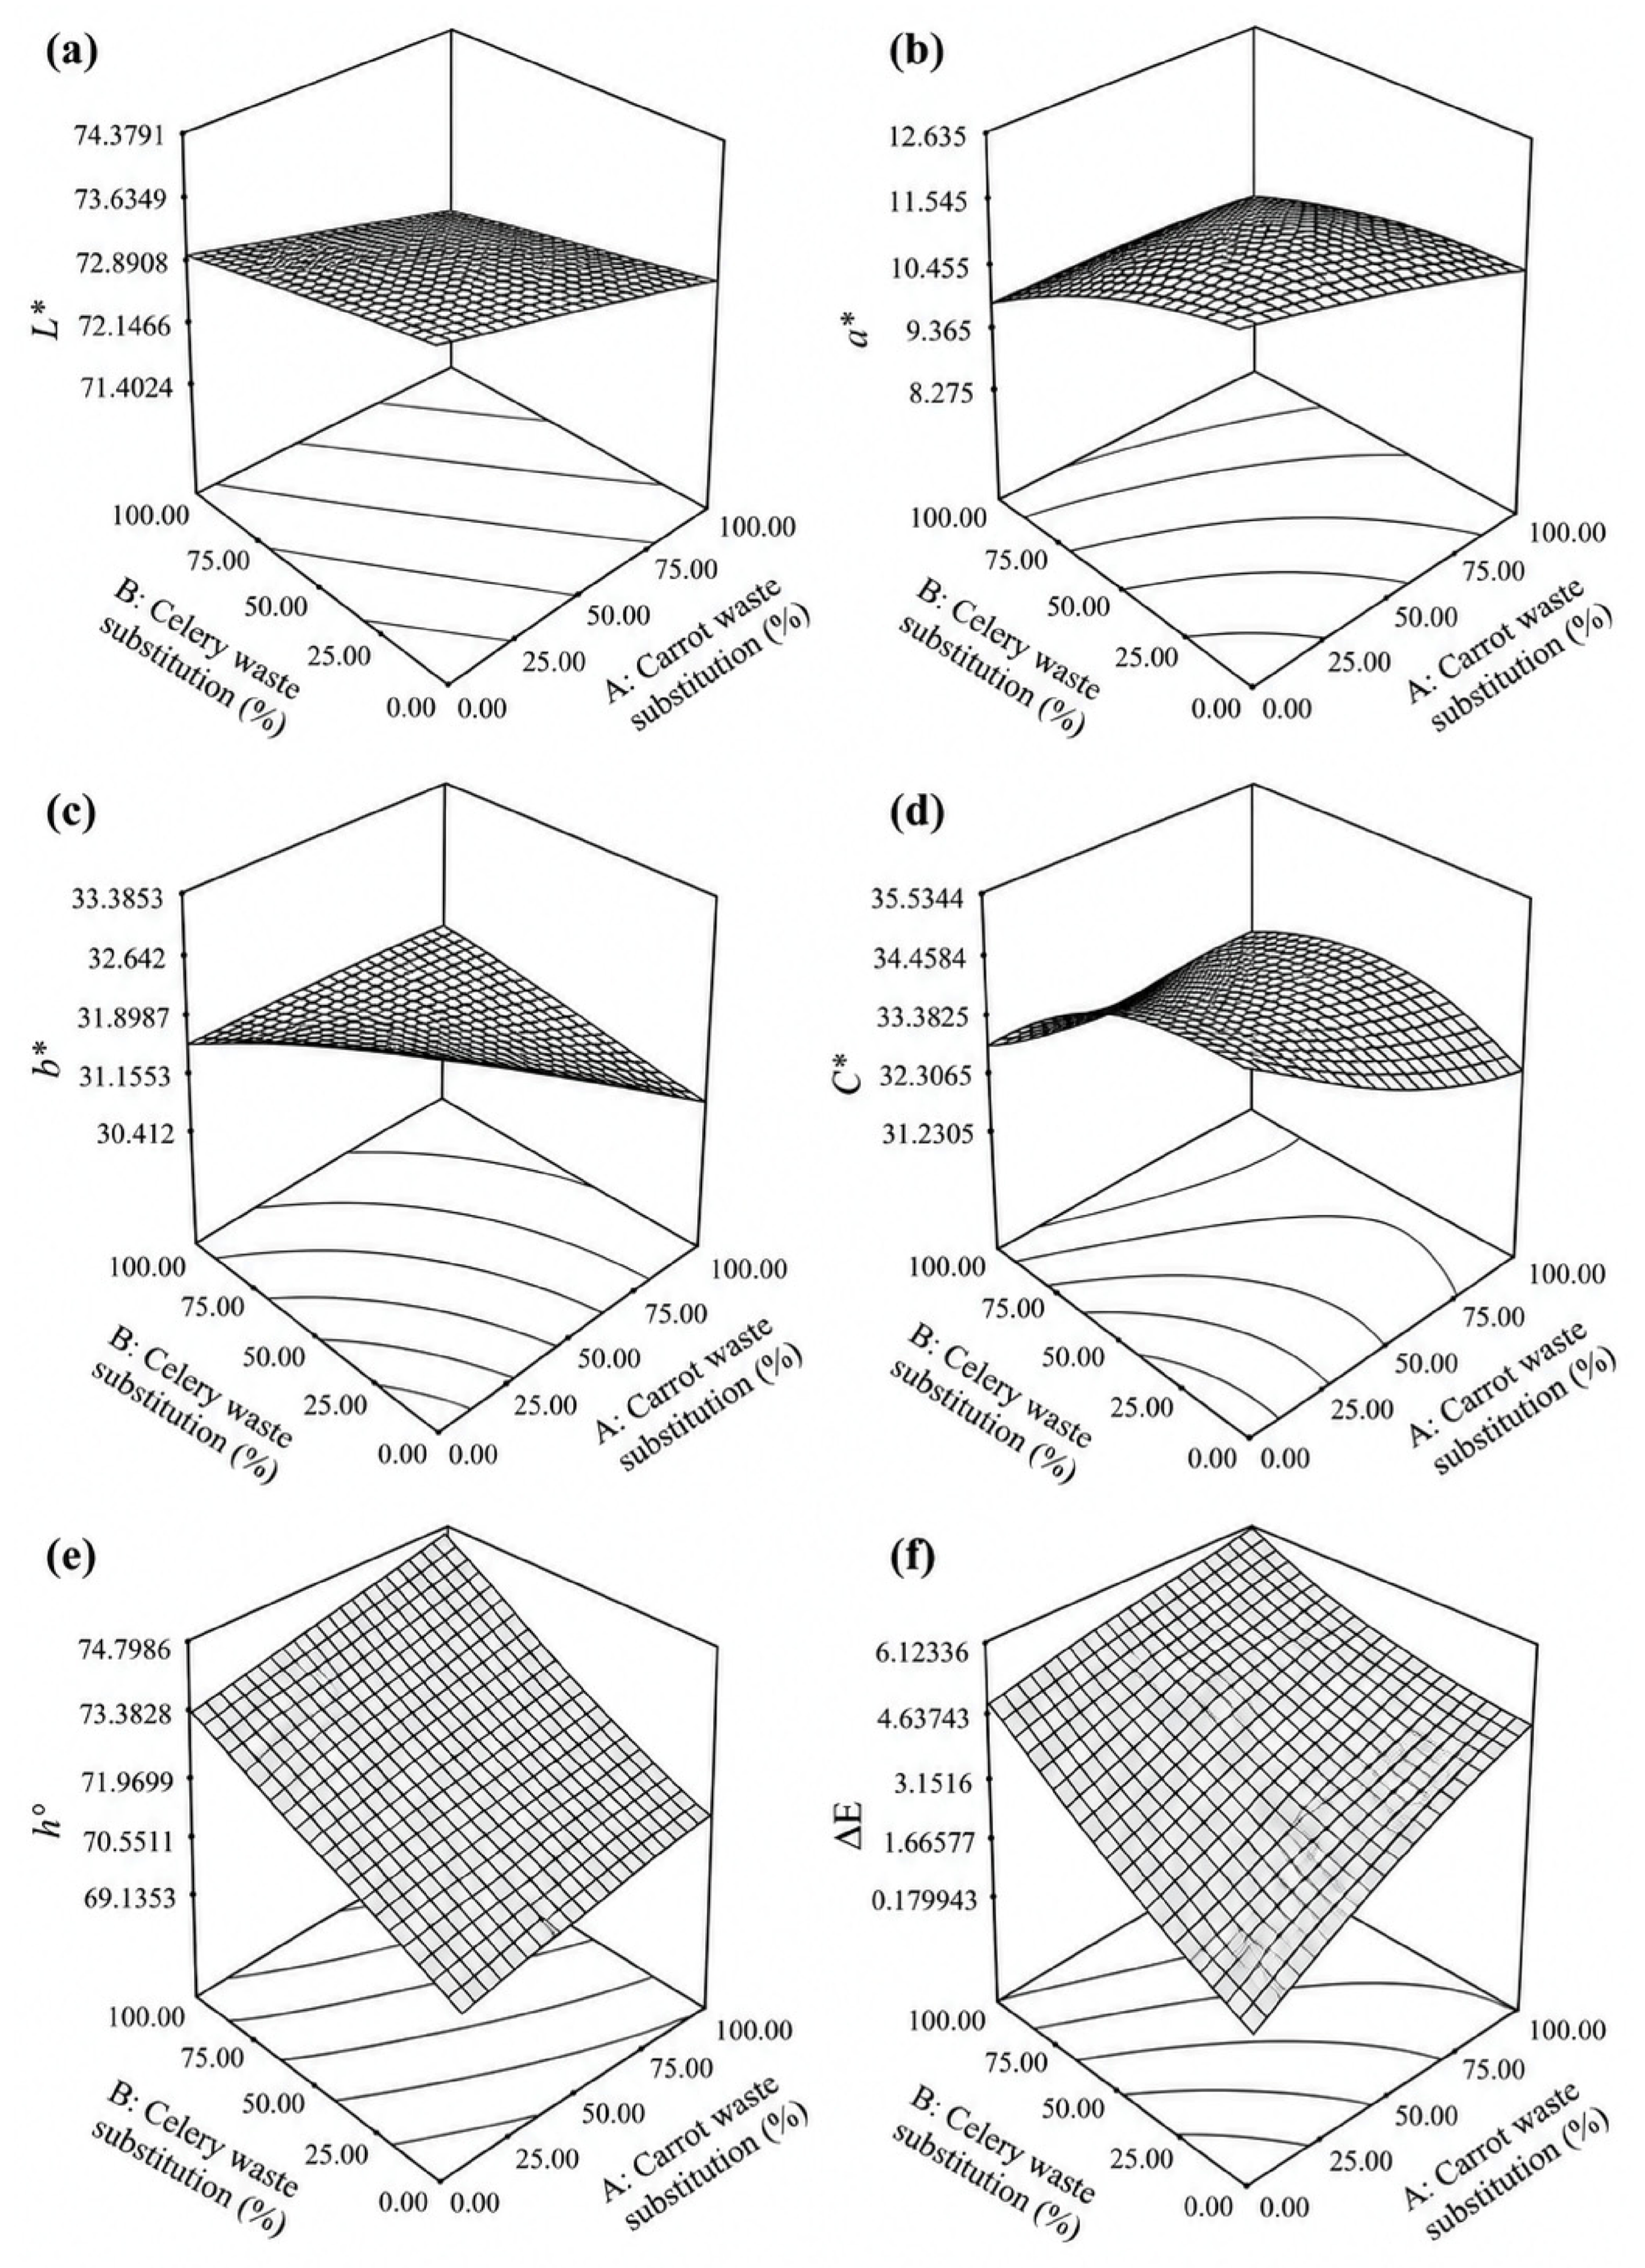
The response surface plots presented in
Figure 2 demonstrated clear changes in color characteristics with increasing levels of vegetable waste incorporation. Increasing carrot and celery waste proportions generally resulted in lower L*, b*, and C values, indicating darker and less saturated samples, while the hue angle and total color difference increased. These results confirmed that incorporation of vegetable peel waste substantially altered the instrumental color characteristics of the formulations. Yang et al. [
50] reported changes in CIELab color parameters during hot-air drying of plant material associated with pigment degradation and the development of browning reactions. Such processing-related mechanisms may also contribute to the color characteristics of dried vegetable materials. However, since individual pigments and browning products were not quantified in the present study, the specific mechanisms responsible for the observed color changes cannot be established. The simultaneous changes in L*, a*, and b* coordinates were reflected in the increasing Δ
E values, demonstrating that the combined changes in individual color coordinates progressively increased the overall color difference from the control formulation.
The experimentally measured Δ
E values ranged from 2.12 at 0% carrot waste and 50% celery waste substitution to a maximum measured value of 6.11 at 50% carrot waste and 100% celery waste substitution (
Supplementary Table S1). The progressive increase in Δ
E with increasing peel waste substitution demonstrates a greater instrumental color deviation from the control formulation (carrot waste 0%, celery waste 0%). However, since perceptual thresholds may depend on the characteristics of the evaluated material and viewing conditions, the measured Δ
E values were not used to infer specific levels of visual perceptibility or consumer acceptance.
It should be noted that significant lack of fit was observed for several color responses (L*, a*, b*, C, and ΔE), whereas the lack of fit for h was not significant. Alternative model forms were examined for responses exhibiting significant lack of fit; however, increasing model complexity did not consistently improve predictive performance. Therefore, the selected models were retained based on model significance, parsimony, and comparative predictive performance. Nevertheless, the significant lack of fit indicates that the fitted models do not fully describe all variability present in the experimental data and should therefore be acknowledged as a limitation. In addition, the pure-error estimate was derived from analytical replicates at the central design point rather than from independently prepared formulation replicates. Predictions from the affected models should therefore be interpreted cautiously and primarily within the investigated experimental domain.
3.8. Optimization
Three optimization scenarios were evaluated using the desirability function approach in order to identify the most suitable formulation depending on the intended application (
Table 5). The optimization strategy was designed progressively, from a simpler to a more complex approach. Thus, the first scenario focused exclusively on maximizing the functional potential of the formulations, whereas the second and third scenarios gradually incorporated additional nutritional and color-related criteria. Such a stepwise optimization approach enabled a comprehensive assessment of the trade-offs among bioactive properties, nutritional quality, and color characteristics of the developed formulations.
In the first optimization scenario (Set 1), total polyphenol content, antioxidant activity, and crude fiber content were simultaneously maximized, since these responses were positively affected by vegetable peel incorporation. The obtained optimum corresponded to the highest investigated levels of both carrot and celery waste (100% each), resulting in predicted values of 3704.15 mg/100 g total polyphenols, 26.94% DPPH inhibition, and 8.35% crude fiber. The high desirability value (D = 0.869) indicated that the predicted formulation closely satisfied the specified optimization goals, with extensive incorporation of vegetable peel waste favoring the maximization of the selected functional responses. The Set 1 optimum corresponds to complete substitution of the carrot and celery fractions with their respective peel waste. However, these peel fractions should not be interpreted as inedible material. Carrot and celery peels are edible plant tissues that are commonly generated as processing residues during peeling and preparation, and the term “waste” in the present study refers to their status as underutilized processing by-products rather than to their edibility. Nevertheless, although complete substitution maximized the investigated functional responses, its suitability for a specific food application would depend on the food matrix, processing conditions, incorporation level, and sensory characteristics. Therefore, Set 1 should primarily be interpreted as the formulation maximizing functional potential within the investigated experimental domain, whereas Set 3 represents a more balanced multi-response solution.
In the second optimization scenario (Set 2), ash content was additionally included as a nutritional response and set to be maximized together with total polyphenols, antioxidant activity, and crude fiber. Under these conditions, the optimal formulation shifted to 89.08% carrot waste and 76.76% celery waste, while the desirability decreased to 0.675. The reduction in overall desirability suggests the existence of a trade-off between maximizing bioactive compounds and maintaining a higher total ash content. This behavior may be explained by the previously observed negative effect of celery waste incorporation on ash content, indicating that optimization based exclusively on bioactive properties does not necessarily coincide with maximization of all nutritional attributes. Nevertheless, the inclusion of ash provided a more comprehensive evaluation of formulation quality from a nutritional perspective.
The third optimization scenario (Set 3) additionally incorporated total color difference (ΔE) with the objective of minimizing color changes relative to the control sample. Inclusion of this color-related parameter substantially altered the optimum, reducing carrot and celery waste levels to 75.08% and 44.23%, respectively. Consequently, predicted total polyphenol content, antioxidant activity, and crude fiber decreased to 3561.47 mg/100 g, 21.28%, and 7.95%, respectively, whereas the predicted ash content slightly increased to 8.49%. The overall desirability further decreased to 0.555, indicating that simultaneous optimization of functionality, nutritional quality, and color characteristics required additional compromises among the investigated responses. Despite the lower desirability, Set 3 was selected as the most practically relevant optimization scenario because it represented a balanced compromise among functional properties, nutritional quality, and color characteristics.
Based on the multi-response optimization, Set 3 was selected for experimental validation because it represented the most comprehensive compromise among functional, nutritional, and color-related criteria. The numerical optimum (75.08% carrot waste and 44.23% celery waste) was rounded to 75% and 45%, respectively, for practical preparation. Experimental validation showed reasonable agreement between the measured and model-predicted responses, with relative deviations ranging from 2.75% to 6.50% (
Table 6). These results support the practical adequacy of the selected multi-response optimum within the investigated formulation domain, while avoiding interpretation of the validation as evidence of unrestricted predictive capability of the individual response models.
4. Conclusions
The present study demonstrated that carrot and celery peel waste can be successfully valorized as functional ingredients, contributing to the development of sustainable food systems based on circular economy principles. The incorporation of vegetable peel waste substantially improved the functional profile of the investigated formulations, particularly regarding polyphenol content, antioxidant activity, and crude fiber content. The multi-response optimization approach proved to be a useful tool for balancing functional, nutritional, and color-related attributes, highlighting that the formulation providing the highest bioactive potential does not necessarily represent the optimal compromise when multiple quality parameters are considered simultaneously. Set 3 provided a balanced compromise among the investigated responses, although its practical applicability and consumer acceptance cannot be inferred from instrumental color measurements alone.
A limitation of this study is the absence of independently prepared formulation replicates. Furthermore, the nutritional characterization was restricted to crude fiber and total ash content, without determination of total dietary fiber or individual macro- and microelements. Sensory properties and consumer acceptance were outside the scope of the present study. Future studies should therefore address detailed nutritional characterization, bioaccessibility and bioavailability of bioactive compounds, sensory and consumer acceptance, and shelf-life. In addition, technological properties such as water-holding, oil-holding, and emulsifying capacities should be evaluated in specific food matrices, since the behavior of the dried formulations and the retention of their bioactive, nutritional, and color properties may change following incorporation and subsequent food processing. Such studies would enable further validation of the optimized formulations in actual food products and are necessary before broader conclusions regarding their practical applicability can be drawn.




 ,
,