1. Introduction
The COVID-19 pandemic disrupted health and social care systems worldwide and disproportionately affected older adults, particularly people living with cognitive impairment and dementia. Public health restrictions and service interruptions reduced access to in-person clinical follow-up, community-based services, and opportunities for social and cognitive engagement. Evidence from dementia-focused studies has documented difficulties in maintaining care continuity, accessing support services, and preserving cognitive and psychological well-being during periods of restricted contact [
1,
2,
3,
4].
These disruptions occurred in a population already vulnerable to the adverse consequences of social isolation and reduced social participation. During the pandemic, people living with dementia and their caregivers experienced changes in daily routines, loss of or reduction in formal and informal support, and increased psychological burden [
5,
6]. Such changes provide a plausible context for population-level variation in cognitive-health indicators during the COVID-19 period. However, observed changes in surveillance indicators may reflect multiple mechanisms, including changes in underlying health, healthcare access, reporting behavior, and population composition. Consequently, surveillance data are useful for identifying population patterns but do not, by themselves, establish individual-level trajectories or causal effects.
Public health surveillance systems provide an opportunity to examine these patterns across time, geographic areas, and population subgroups. In the United States, the Centers for Disease Control and Prevention (CDC) Alzheimer’s Disease and Healthy Aging Data Portal provides aggregated indicators related to cognitive decline and healthy aging across geographic and demographic strata [
7]. These data enable repeated cross-sectional comparisons across periods and can support the evaluation of whether predictive relationships identified in historical surveillance data remain stable when applied to subsequent time periods.
Machine-learning methods provide complementary tools for predictive modeling when relationships between surveillance indicators and stratification characteristics may be nonlinear or heterogeneous. However, predictive performance estimated using conventional random train–test splits may not fully represent performance when models are applied to observations collected in later periods. This issue is particularly relevant when major population-level disruptions, such as the COVID-19 pandemic, may alter the distribution of observed data. Evaluating temporal generalization is therefore important for distinguishing within-sample predictive performance from the ability of a model to retain predictive accuracy under changing conditions.
Despite extensive research on COVID-19, older adults, and dementia, comparatively little work has combined nationwide, publicly available surveillance indicators with explicit time-aware predictive benchmarking. In particular, it remains important to determine whether (i) subjective cognitive decline (SCD) and memory-loss-related surveillance indicators differed between pre-pandemic and COVID-19 periods and (ii) predictive models trained on pre-pandemic surveillance data retain their performance when evaluated during COVID-19 and subsequent periods.
Accordingly, this study uses aggregated data from the CDC Alzheimer’s Disease and Healthy Aging Data Portal [
7] from 2015 to 2022 to examine four SCD and memory-loss-related indicators. The objectives are to: (1) quantify differences between the pre-pandemic (2015–2019) and COVID-19 (2020–2021) periods, with 2022 evaluated as a post-period; (2) benchmark linear regression and four machine-learning approaches—support vector regression, random forest regression, a feed-forward neural network, and CatBoost; and (3) evaluate temporal generalization by training models on 2015–2018 data and assessing their performance in 2019, 2020–2021, and 2022. The study is designed for descriptive surveillance analysis and predictive benchmarking rather than causal attribution.
Prior Research
A growing body of evidence indicates that the COVID-19 pandemic affected the cognitive, psychological, and social well-being of older adults, particularly those living with dementia or cognitive impairment. Restrictions on social contact and disruptions to health and community-based services altered daily routines, reduced opportunities for social and cognitive engagement, and complicated access to formal and informal support. Dementia-focused studies documented difficulties in maintaining care continuity and sustaining well-being during periods of restricted contact [
1,
3,
4]. A rapid systematic review further found evidence of worsening cognition, neuropsychiatric symptoms, and functional outcomes among people living with dementia during COVID-19 isolation measures, although the magnitude and consistency of these effects varied across studies [
2].
Evidence from broader older-adult populations similarly suggests that the pandemic was associated with substantial psychosocial challenges. Studies and systematic reviews have reported increased depressive symptoms, loneliness, fear of COVID-19, and social isolation among older adults [
8,
9,
10]. Pre-pandemic research had already established associations between social isolation, depression, and psychological distress in later life [
11], providing an important conceptual basis for understanding why pandemic-related reductions in social interaction could be relevant to cognitive and mental health. Additional studies identified associations involving disrupted community connections, lifestyle, loneliness, media-related psychological burden, and sleep and mental health during the pandemic [
12,
13,
14,
15].
Importantly, the experience of the pandemic was not uniform across older populations. Differences have been reported according to demographic characteristics, social relationships, living environments, and access to support. Brown et al. [
16], for example, identified heterogeneity in depressive symptoms across racialized groups living with dementia or cognitive impairment, while Gyori [
17] reported associations between social-relationship patterns and worsening mental health among older adults. Experiences also differed across residential and care environments [
18], and longitudinal evidence suggests that some older adults exhibited resilience and behavioral adaptation during lockdown [
19]. These findings emphasize the importance of examining population-level surveillance indicators across demographic and geographic strata rather than assuming a uniform pandemic-related pattern.
The pandemic also affected the broader caregiving environment surrounding cognitive impairment and dementia. Family and informal caregivers experienced disruptions to formal services, reduced access to respite and support, and increased psychological burden. A systematic review and meta-analysis reported adverse effects on depression, anxiety, psychological distress, and caregiver burden among caregivers of people with dementia or mild cognitive impairment [
6]. Other studies identified heterogeneous pandemic experiences among informal caregivers and persistent mental health challenges following lockdown periods [
20,
21]. Professional caregivers were also affected, with evidence of substantial COVID-19-related fear and emotional burden [
22]. Together, these findings indicate that changes observed in cognitive-health surveillance indicators should be interpreted within a broader system of individual, social, and care-related disruptions.
Beyond describing pandemic-related changes, computational approaches have increasingly been used to characterize heterogeneous health patterns and develop predictive models. Machine-learning methods are particularly useful for benchmarking predictive relationships when data contain multiple demographic, geographic, temporal, and categorical characteristics. In older populations, Nguyen and Byeon [
23], for example, demonstrated the application of deep learning to depression-related prediction using large-scale population data. However, predictive accuracy obtained from a conventional random train–test split does not necessarily indicate that a model will generalize to observations collected in later periods, particularly when population conditions or data-generating processes change.
This distinction is especially important for COVID-19 surveillance. Models trained primarily on pre-pandemic observations may encounter changes in outcome distributions, healthcare access, population composition, reporting behavior, or relationships among predictors when applied to pandemic and post-pandemic data. Consequently, temporal validation provides a more demanding assessment of whether predictive relationships remain stable across changing conditions than conventional random-split benchmarking alone. Despite the growing literature on COVID-19 and older-adult cognitive and mental health, comparatively limited research has combined nationwide SCD-related surveillance indicators with explicit evaluation of predictive performance across pre-pandemic, pandemic, and post-period windows. This gap motivates the present study’s emphasis on both period-specific surveillance patterns and time-aware machine-learning benchmarking.
2. Materials and Methods
This section describes the data source, construction of the analytic dataset, and the study design used to compare period-specific patterns in U.S. public health surveillance indicators related to cognitive and mental health among older adults.
2.1. Study Design, Data Source, and Study Periods
We conducted an ecological, repeated cross-sectional study using publicly available data from the Centers for Disease Control and Prevention (CDC) Alzheimer’s Disease and Healthy Aging Data Portal [
7]. The portal provides aggregated surveillance estimates across U.S. geographic and demographic strata. Participation in the optional BRFSS Cognitive Decline Module, response patterns, and the availability of state-level and stratified estimates vary by year; consequently, temporal movement may partly reflect changes in surveillance composition rather than changes in underlying prevalence. The data contain no individual identifiers, clinical diagnoses, or longitudinal follow-up, and the unit of observation is an aggregated surveillance estimate rather than an individual participant.
The study was designed to characterize population-level patterns in selected subjective cognitive decline (SCD) and memory-loss indicators and to evaluate predictive performance across time. Accordingly, all statistical comparisons are interpreted as differences between aggregated surveillance records rather than individual-level changes or causal effects of the COVID-19 pandemic. Because the study used publicly available, de-identified, aggregated data, institutional review board approval was not required.
2.2. Study Periods and Analytical Sample
The original CDC data extract, obtained from the Alzheimer’s Disease and Healthy Aging Data Portal [
7], contained 284,142 annual surveillance records spanning multiple health topics, geographic units, and population strata. Records with missing values for the primary outcome (
) were excluded (
; 32.14%), leaving 192,808 records with an available surveillance estimate. The dataset was subsequently restricted to records classified by the CDC under the
Mental Health and
Cognitive Decline categories, yielding 28,644 observations.
An initial screening was then performed to identify records corresponding to subjective cognitive decline and memory-loss-related questions. Because exact string matching did not consistently recover all relevant question-text variants in the raw data extract, a case-insensitive keyword-based identification procedure was used. This screening identified 14,136 potentially relevant records. Following harmonization of the question definitions and restriction to the four prespecified outcome series used in the final analytical workflow (Q30, Q31, Q41, and Q42), the final descriptive analytical dataset comprised 11,444 aggregated surveillance records.
Calendar years were classified a priori into three epidemiologically meaningful periods: pre-pandemic (2015–2019), COVID-19 (2020–2021), and post-period (2022). The final analytical dataset contained 7448 records in the pre-pandemic period, 2639 records in the COVID-19 period, and 1357 records in 2022. The primary statistical comparison contrasted the pre-pandemic and COVID-19 periods, whereas 2022 was retained as a separate post-period for descriptive assessment, temporal model evaluation, and prospective forecasting analyses.
2.3. Outcome Indicators and Unit of Analysis
The final descriptive analytical dataset comprised four prespecified CDC outcome series related to subjective cognitive decline (SCD) and memory loss. No exact duplicate records or duplicated analytical keys were identified during data-quality assessment.
The four selected indicators were:
the percentage of older adults reporting subjective cognitive decline or memory loss that occurred more frequently or worsened during the preceding 12 months;
the percentage of older adults reporting that subjective cognitive decline or memory loss interfered with their ability to engage in social activities or household chores;
the percentage of older adults reporting that, as a result of subjective cognitive decline or memory loss, they required assistance with day-to-day activities; and
the percentage of older adults with subjective cognitive decline or memory loss who reported discussing these concerns with a health care professional.
For each indicator, the response variable was the CDC-reported Data_Value, expressed as a percentage on a 0–100 scale. The full CDC wording and corresponding question codes are presented in
Table 1. The numbers of records contributed by Q30, Q31, Q41, and Q42 were 3162, 2754, 2731, and 2797, respectively, yielding the final total of 11,444 records.
The unit of analysis was an aggregated annual surveillance estimate rather than an individual respondent. The 11,444 annual records represented repeated observations from 879 unique profiles for Q30, 773 for Q31, 769 for Q41, and 777 for Q42. Each profile was defined by geographic unit and available demographic stratification variables. Therefore, record counts were not interpreted as numbers of independent individuals. Analyses that explicitly modeled temporal contrasts used profile matching, cluster-robust inference, or balanced panels, while predictive analyses reported both record and profile counts and used profile-clustered resampling for uncertainty estimation.
The CDC Question and QuestionID fields were used exclusively to identify and distinguish the four outcome series and were not included as predictors in the indicator-specific machine-learning models. Statistical comparisons were conducted separately for each indicator. Machine-learning development, temporal validation, forecasting, and prospective projections were likewise performed separately by indicator, allowing temporal generalization and predictive performance to be evaluated independently for each outcome series.
2.4. Predictor Variables and Data Preprocessing
Predictor variables were selected to represent the temporal, geographic, and demographic stratification structure available in the CDC surveillance data rather than individual-level clinical characteristics. The primary categorical predictors were geographic location (LocationDesc), data source (Datasource), primary demographic stratification (Stratification1), and secondary demographic stratification (Stratification2). Calendar year (YearStart) was included as a numeric temporal predictor. When available in the analytical dataset, YearEnd was also retained as a numeric temporal predictor.
The CDC Question, Topic, and Class fields were not included as predictors in the primary modeling specification. Question was used to define the four indicator-specific outcome series, whereas Class was used during data construction to restrict the analytical domain to the Mental Health and Cognitive Decline categories.
For linear regression, support vector regression, random forest regression, and the neural network, categorical predictors were transformed using one-hot encoding. In the pipeline-based analyses, OneHotEncoder (handle_unknown = “ignore”) was used so that categorical levels occurring in temporal holdout data but not observed during model fitting could be processed without modifying the fitted feature structure. Numerical temporal predictors were standardized for scale-sensitive models, including linear regression, support vector regression, and the neural network, whereas they were passed without standardization to the random forest.
All preprocessing operations used in the chronological evaluation were estimated from the corresponding training data only and subsequently applied to the temporal holdout sets. For the neural network, the preprocessing transformation was fitted on the training predictors, and the outcome standardization was likewise estimated exclusively from the training response values before predictions were transformed back to the original Data_Value scale.
CatBoost followed a separate preprocessing pathway. Rather than applying one-hot encoding, the original categorical predictors were supplied directly to the CatBoost model and identified through their categorical feature indices. Missing values in categorical predictors were represented using a common “Missing” category before model fitting.
No individual-level clinical characteristics, such as cognitive diagnosis, dementia severity, comorbidities, medication use, or caregiver characteristics, were available as predictors. Consequently, predictive performance should be interpreted as reflecting relationships among aggregated surveillance stratification characteristics and the corresponding CDC indicator values rather than individual-level risk prediction.
2.5. Statistical Analysis of Period Differences
Descriptive analyses were conducted separately for each of the four SCD/memory-loss indicators and study periods. Because the outcome (Data_Value) represents an aggregated percentage, distributions were summarized using means and standard deviations (SDs), together with medians and interquartile ranges (IQRs). Distributional characteristics were additionally examined graphically. Means were retained because differences in Data_Value have a direct interpretation in percentage points, whereas medians and IQRs provided complementary summaries less sensitive to distributional asymmetry.
The primary period-level comparison contrasted the pre-pandemic period (2015–2019) with the COVID-19 period (2020–2021) separately for each indicator. As an initial unpaired analysis, Welch’s two-sample -test was used to compare mean percentages without assuming equal variances between periods. The Mann–Whitney test was used as a complementary rank-based procedure. Because these tests evaluate different features of the distributions, their results were interpreted jointly rather than as interchangeable tests of an identical null hypothesis.
For the unpaired comparisons, standardized mean differences were quantified using Hedges’ , which applies a small-sample bias correction to the standardized mean difference:
The small-sample correction factor was defined as
Here, and denote the period-specific mean percentages, and is the pooled standard deviation. Effect sizes were reported with 95% confidence intervals and interpreted together with absolute percentage-point differences rather than statistical significance alone.
Because the surveillance dataset contains repeated combinations of geographic and demographic strata across years, an additional profile-matched analysis was conducted to reduce potential distortion arising from changes in the composition of available surveillance records between periods. A surveillance profile was defined by the combination of geographic unit and available demographic stratification variables within each SCD indicator. For profiles represented in both the pre-pandemic and COVID-19 periods, observations were first aggregated within profile and period, producing one pre-pandemic and one COVID-period mean for each eligible profile.
For each matched profile
, the period difference was defined as
The mean paired difference was then calculated as
where
denotes the number of matched profiles. The mean paired difference was evaluated using a paired
-test and accompanied by a 95% confidence interval. The Wilcoxon signed-rank test was additionally applied as a complementary rank-based paired analysis. Standardized paired differences were summarized using Hedges’ g with 95% confidence intervals.
To account for multiple testing across the four SCD indicators, -values from each family of primary comparisons were adjusted using the Holm procedure. Both unadjusted and Holm-adjusted -values were retained for transparency, with multiplicity-adjusted results used when assessing statistical evidence across indicators.
Potentially extreme observations were examined using graphical diagnostics and the conventional criterion. Such observations were not removed solely on the basis of statistical extremeness because they represent reported surveillance estimates and may reflect genuine geographic or demographic heterogeneity.
All analyses were performed at the level of aggregated surveillance records or matched surveillance profiles, rather than individual respondents. Accordingly, results describe differences in the CDC surveillance indicators and should not be interpreted as individual-level effects or as causal effects of the COVID-19 pandemic.
2.6. Machine-Learning Models
Five regression approaches with complementary modeling characteristics were evaluated separately for each of the four SCD/memory-loss indicators: linear regression (LR), support vector regression (SVR), random forest regression (RF), a feed-forward neural network (NN), and CatBoost regression. The models were selected to provide an interpretable linear baseline and nonlinear alternatives capable of representing more complex relationships among the temporal, geographic, and demographic characteristics of the CDC surveillance records. All models predicted the continuous CDC-reported outcome Data_Value.
2.6.1. Linear Regression
Linear regression was included as the reference model because it provides an interpretable additive specification against which the predictive performance of the nonlinear approaches can be compared. For observation i, the model was expressed as
where
denotes the observed Data_Value,
is the value of predictor
for observation
,
is the intercept,
represents the corresponding regression coefficient, and
is the residual error. Linear regression was treated primarily as a predictive baseline rather than as a model for causal interpretation of the individual coefficients.
2.6.2. Support Vector Regression
Support vector regression was used to model nonlinear relationships through a radial basis function (RBF) kernel. SVR estimates a function
where
maps the predictor vector into a higher-dimensional feature space,
denotes the model weights, and
is the bias term. Model estimation follows the ε-insensitive loss formulation,
Subject to:
where
controls the trade-off between model complexity and deviations exceeding the ε-insensitive region, and
and
are slack variables [
24]. The RBF kernel allows nonlinear relationships to be represented without explicitly constructing the transformed feature space.
2.6.3. Random Forest Regression
Random forest regression was included as a tree-based ensemble approach capable of representing nonlinear relationships and interactions without requiring a prespecified functional form. Random forests construct multiple regression trees using bootstrap samples of the training data and randomized subsets of predictors considered at candidate splits [
25]. For an ensemble containing
trees, the prediction for observation
can be written as
where
denotes the prediction produced by tree
. Averaging predictions across trees reduces the variance associated with individual regression trees while retaining the ability to represent nonlinear relationships and higher-order interactions.
In this study, the number of trees was fixed at 300, while the maximum tree depth, minimum number of observations per terminal leaf, and number of predictors considered at candidate splits were selected using the forward-chaining temporal cross-validation procedure described in
Section 2.7. A fixed random seed was used to support reproducibility.
Random forest regression was used strictly as a predictive benchmark. Model-derived feature importance, when examined, was treated as an exploratory measure of predictive contribution within the fitted model and was not interpreted as evidence of causal importance.
2.6.4. Feed-Forward Neural Network
A feed-forward multilayer perceptron was evaluated as a flexible nonlinear function approximator for the encoded surveillance predictors. For hidden layer
, the transformation can be represented as
where
denotes the output from the preceding layer,
and
are the layer-specific weight matrix and bias vector, respectively, and
is the activation function. The output layer generated a continuous prediction of Data_Value.
The network was trained by minimizing mean squared error (MSE) using the Adam optimization algorithm [
26]. Input predictors were encoded and standardized as described in
Section 2.4, and the outcome was standardized during model fitting and subsequently transformed back to its original scale for performance evaluation. Network training and model-selection procedures, including the indicator-specific selection of the final training epoch, are described in
Section 2.7.
2.6.5. CatBoost Regression
CatBoost was included as a gradient-boosting approach designed to model complex nonlinear relationships and interactions in tabular data, with specific mechanisms for handling categorical predictors and reducing prediction shift associated with conventional target-statistic encoding [
27]. The model constructs an additive ensemble of sequentially fitted regression trees,
where
denotes the regression tree added at boosting iteration
,
is the total number of boosting iterations, and
is the learning rate.
For the CatBoost implementation, categorical predictors were supplied directly using their categorical feature indices from the original, non-one-hot-encoded design matrix. Hyperparameters were selected using the forward-chaining temporal cross-validation procedure described in
Section 2.7. The candidate search considered alternative numbers of boosting iterations, tree depths, learning rates, and
leaf-regularization values. The selected specification used 1000 boosting iterations, a maximum tree depth of 6, a learning rate of 0.03, and an
leaf-regularization parameter of 3. A fixed random seed was used to support reproducibility.
CatBoost was used strictly as a predictive benchmark. Its predictions and any model-derived importance measures were interpreted as predictive contributions within the fitted surveillance model and not as evidence of causal relationships.
2.7. Predictors, Hyperparameter Tuning, and Temporal Validation
Predictive models were developed separately for each of the four SCD/memory-loss indicators. This indicator-specific modeling strategy avoided treating the indicator identifier itself as a predictor and allowed model performance to be evaluated independently for outcomes with substantially different distributions and scales.
The predictor set reflected the geographic, demographic, and temporal structure of the CDC surveillance records. Categorical predictors included geographic location (LocationDesc), primary stratification (Stratification1), secondary stratification category, and secondary stratification value. Structurally absent secondary stratification values corresponding to overall estimates were represented as an explicit overall category rather than treated as conventional missing data. Calendar year (YearStart) was included as the only numeric temporal predictor.
Variables used only for dataset construction or filtering were excluded from predictive modeling. In particular, Question and QuestionID were excluded because separate models were fitted for each indicator; YearEnd was excluded because the final modeling dataset was restricted to annual estimates for which YearStart = YearEnd; Datasource was excluded because all selected records originated from BRFSS; and CDC confidence-limit variables, alternative outcome representations, record identifiers, and the outcome itself were not used as predictors.
For linear regression, support vector regression, random forest, and the neural network, categorical variables were transformed using one-hot encoding with unknown categories ignored during transformation. This ensured that preprocessing estimated from historical training data could be applied to later temporal holdouts without using information from the future. Numeric standardization was applied to YearStart for scale-sensitive models. For the neural network, the response variable was additionally standardized within the training data and subsequently transformed back to the original percentage scale for evaluation. CatBoost received the categorical predictors directly through its native categorical-feature interface rather than through one-hot encoding.
All preprocessing operations were fitted exclusively within the corresponding training data and then applied without refitting to validation or test periods. This pipeline-based procedure was used to prevent information leakage from future observations into feature encoding or scaling.
2.7.1. Temporal Hyperparameter Tuning
Hyperparameter selection was performed using forward-chaining temporal cross-validation restricted to the 2015–2018 development period. Three chronological folds were used:
and
Thus, every validation year occurred strictly after the observations used for model fitting. This expanding-window design was chosen to approximate prospective temporal generalization and to avoid the optimistic performance estimates that can arise when future and past surveillance records are randomly mixed during model development.
For each candidate hyperparameter configuration, root mean squared error (RMSE), mean absolute error (MAE), and the coefficient of determination () were calculated in each temporal fold. Hyperparameter selection was based on the lowest mean RMSE across the three temporal validation folds. MAE and were retained as complementary performance measures.
Linear regression contained no tuned hyperparameters and served as the fixed reference model. For support vector regression with an RBF kernel, the regularization parameter
, kernel parameter
, and ε-insensitive margin were tuned. Random forest models were fitted with 300 trees, while maximum tree depth, minimum observations per terminal leaf, and the proportion of predictors considered at candidate splits were selected by temporal cross-validation. Neural-network candidate configurations varied in hidden-layer architecture, dropout, learning rate, and batch size. CatBoost candidate configurations varied in the number of boosting iterations, tree depth, learning rate, and
leaf regularization. Complete hyperparameter search spaces and selected indicator-specific configurations are reported in
Supplementary Table S2.
For neural networks, early stopping monitored validation loss and restored the weights from the epoch with the lowest validation loss. The final training epoch for each indicator was determined using 2018 as an internal temporal validation year within the 2015–2018 development sample; the model was then refitted to all 2015–2018 data using the selected duration. The selected epoch counts were 72 for Q30, 1 for Q31, 17 for Q41, and 49 for Q42 in the archived analysis. The single epoch for Q31 indicates that additional optimization did not improve 2018 validation loss under the selected architecture; it should be interpreted as strong early regularization rather than as evidence that Q31 was intrinsically easier to model. Because training duration was selected separately for each outcome, epoch counts are not direct measures of comparability across indicators.
The use of validation-loss monitoring and restoration of the best-performing weights is consistent with the standard Keras EarlyStopping procedure.
2.7.2. Temporal Holdout Evaluation
After hyperparameter selection, each model was refitted using all available records from 2015–2018 for the corresponding indicator. Model performance was then evaluated sequentially on three out-of-period datasets that were not used for hyperparameter selection:
and
The 2019 holdout provided an assessment of pre-pandemic temporal generalization immediately beyond the development window. The 2020–2021 test set evaluated model behavior during the COVID-19 period, whereas 2022 was retained as a subsequent temporal test. Neither the COVID-period nor 2022 observations were used for hyperparameter tuning or preprocessing estimation.
Predictive performance was quantified using RMSE, MAE, and
:
and
Here, denotes the observed surveillance percentage, the model prediction, and the mean outcome within the corresponding evaluation set. Lower RMSE and MAE indicate lower prediction error, whereas larger indicates greater explained variation in the temporal holdout. Negative values were retained and interpreted as evidence that the fitted model performed worse on the corresponding holdout than a constant predictor based on that holdout’s mean. This interpretation is consistent with the standard definition of , which permits negative values for sufficiently poor out-of-sample predictions.
Uncertainty in temporal holdout performance was quantified using 3000 profile-clustered bootstrap replicates. Complete surveillance profiles were resampled with replacement within each indicator and holdout, preserving repeated records belonging to the same profile. Percentile 95% confidence intervals were calculated for RMSE, MAE, and R2. The two models with the lowest observed RMSE in each indicator–holdout combination were also compared using the paired bootstrap distribution of their RMSE difference. These comparisons were used to distinguish a lower observed error from evidence of a reproducible performance advantage. To characterize the predictive variables used by the tree-based models, CatBoost mean absolute SHAP values and random-forest permutation importance were calculated separately for each indicator and temporal holdout. Importance was summarized at the original predictor level and normalized within each model–indicator–holdout combination. These diagnostics describe contribution to prediction within the fitted models and were not interpreted causally.
As a sensitivity analysis, temporal performance was additionally recalculated after restricting each holdout to surveillance profiles already represented in the 2015–2018 training data. This analysis was used to assess whether deterioration in out-of-period performance could be attributed primarily to the appearance of previously unseen geographic–demographic profiles rather than to temporal changes in predictor–outcome relationships.
2.8. Temporal Forecasting and Model-Based Projections
Because predictive accuracy under temporal holdout evaluation does not necessarily imply reliable extrapolation beyond the observed time range, forecasting was evaluated separately from the machine-learning benchmark described in
Section 2.7. The forecasting analysis was designed to determine whether simple temporal specifications could provide stable one-step-ahead predictions and to establish a defensible model for prospective projections beyond 2022.
Three forecasting strategies were initially compared separately for each SCD/memory-loss indicator: a naive last-observation benchmark, a global linear temporal trend, and a profile fixed-effects linear trend model.
For the naïve benchmark, the predicted value for surveillance profile
at year
was defined as the most recent observed value for that profile:
The global linear-trend model was specified as
where
denotes calendar year and
represents the estimated average temporal slope.
To account for persistent differences among geographic–demographic surveillance profiles, a profile fixed-effects trend model was additionally fitted:
where
denotes a profile-specific fixed effect and
represents the common linear temporal trend. This specification controls for time-invariant differences among repeatedly observed surveillance profiles while estimating the temporal trajectory from within-profile information.
2.8.1. Rolling-Origin Backtesting
Forecasting performance was assessed using an expanding-window, one-step-ahead rolling-origin design. Models were sequentially fitted using all observations available before each evaluation year and then used to predict the immediately subsequent year. The evaluation sequence was:
To ensure direct comparability among forecasting strategies, performance within each backtest year was calculated on a common set of eligible surveillance profiles. Eligible profiles were required to be present in the forecast year, to have an observation in the most recent preceding year for the naïve benchmark, and to contain sufficient historical observations for estimation of the profile fixed-effects model.
Forecasting accuracy was quantified using RMSE, MAE, and
, as defined in
Section 2.7. Model selection was based primarily on mean RMSE across rolling-origin backtests, with MAE,
, and the frequency with which each approach achieved the lowest yearly RMSE used as complementary indicators of forecasting stability.
2.8.2. Sensitivity to COVID-Period Structural Change
Because the descriptive and longitudinal analyses identified marked but indicator-specific changes during 2020–2021, additional COVID-aware forecasting specifications were evaluated as sensitivity analyses. These models examined whether explicitly representing pandemic-period temporal changes improved out-of-sample forecasting relative to the simpler linear profile fixed-effects trend.
A COVID-period level-shift model was specified as
where
An interrupted-trend specification additionally allowed the temporal slope to change from 2020 onward:
where
These specifications were compared prospectively using 2021 and 2022 as one-step-ahead evaluation years. COVID-period terms were treated strictly as predictive temporal indicators and were not interpreted as causal effects of the pandemic.
The simpler profile fixed-effects linear trend model was retained for prospective projection because it provided the most stable forecasting performance across the four indicators and outperformed the COVID-level and interrupted-trend alternatives in the COVID-aware backtesting analysis.
2.8.3. Prospective Projection Procedure for 2023–2026
After forecasting model selection, the profile fixed-effects linear trend model was refitted using all annual observations available from 2015 through 2022. Prospective model-based projections were then generated for 2023–2026.
To prevent future changes in the composition of geographic–demographic records from being conflated with temporal change, projections were standardized to a fixed reference population. For each indicator, the reference population consisted of surveillance profiles observed in 2022 that had at least two historical observations and were therefore estimable within the fixed-effects model.
For reference profile
, the projected outcome in future year
was obtained from
The annual projected mean was calculated by averaging predictions across the fixed set of
reference profiles:
To provide a compositionally consistent transition between the observed and projected periods, the same reference profiles were also used to obtain a model-based estimate for 2022. Thus, the prospective trajectory was represented as a continuous model-based reference-profile series from 2022 through 2026, whereas the observed 2015–2022 means continued to represent all eligible surveillance records available in each year.
Ninety-five percent confidence intervals for each annual projected mean were derived from the covariance matrix of the fitted model coefficients. If
denotes the mean design vector for the reference profiles at year
, the estimated variance of the projected mean was calculated as
with the corresponding 95% confidence interval given by
Two uncertainty quantities were reported. Confidence intervals describe uncertainty in the projected mean trajectory for the fixed reference-profile population. Prediction intervals describe the expected range of a future aggregated surveillance estimate drawn from those reference profiles and incorporate coefficient uncertainty, between-profile heterogeneity, and residual variation. Prediction intervals were generated by 50,000 simulations from the fitted coefficient covariance matrix, sampling reference profiles and residual errors at each future year. Neither interval represents uncertainty for an individual patient or an individual-level cognitive outcome.
All projected values were examined for consistency with the permissible percentage range of 0–100. No post-estimation truncation or clipping was applied.
Finally, because the prospective estimates are extrapolations of the fitted historical temporal structure rather than observations of future surveillance outcomes, results for 2023–2026 are referred to throughout as model-based projections rather than observed estimates or causal forecasts.
2.9. Software and Reproducibility
All statistical and machine-learning analyses were conducted in Python within a Google Colaboratory environment. Data manipulation and numerical operations were performed using pandas and NumPy; statistical procedures were implemented using SciPy and statsmodels; machine-learning models, preprocessing pipelines, and performance metrics were implemented using scikit-learn; neural networks were developed using TensorFlow/Keras; and gradient-boosting models with native categorical-feature handling were implemented using CatBoost.
To enhance computational reproducibility, fixed random seeds were specified for stochastic algorithms wherever applicable. Data preprocessing, predictor encoding, hyperparameter tuning, temporal cross-validation, holdout evaluation, forecasting backtests, sensitivity analyses, and model-based projections were implemented programmatically within a single analytical workflow. Preprocessing transformations and model-selection procedures were fitted exclusively to the corresponding training data to prevent information leakage from temporally subsequent observations.
The final computational environment used Python 3.12.13, pandas 2.2.2, NumPy 2.0.2, SciPy 1.16.3, statsmodels 0.14.6, scikit-learn 1.6.1, TensorFlow 2.20.0, and CatBoost 1.2.10.
3. Results
The results are presented in six stages corresponding to the analytical framework described in the Methods. First, the final analytic sample and the distribution of the four subjective cognitive decline (SCD) and memory-loss indicators are summarized across the pre-pandemic (2015–2019), COVID-19 (2020–2021), and 2022 periods. Second, differences between the pre-pandemic and COVID-19 periods are examined using crude and profile-matched comparisons. Third, adjusted year-specific estimates relative to 2019 are evaluated together with balanced-panel sensitivity analyses to assess the robustness of the observed temporal patterns. Fourth, the temporal generalization of the machine-learning models is assessed across the 2019, COVID-19, and 2022 holdout periods. Fifth, forecasting performance is evaluated through temporal backtesting to support selection of the prospective projection model. Finally, model-based projections are reported for 2023–2026.
All results refer to aggregated CDC surveillance records rather than individual participants. Accordingly, estimated differences, predictive performance, and projected trajectories are interpreted at the level of the surveillance data structure and do not represent individual-level effects or causal effects attributable to the COVID-19 pandemic.
3.1. Analytical Sample and Descriptive Characteristics
The final descriptive sample comprised 11,444 aggregated CDC surveillance records corresponding to the four selected subjective cognitive decline (SCD) and memory-loss indicators between 2015 and 2022. Of these, 7448 records corresponded to the pre-pandemic period (2015–2019), 2639 to the COVID-19 period (2020–2021), and 1357 to 2022. The number of available records varied across indicators and years, reflecting the repeated cross-sectional structure and availability of the CDC surveillance estimates.
Descriptive characteristics by indicator and study period are presented in
Table 2. For SCD/memory loss worsening (Q30), the mean Data_Value decreased from 11.77 (SD = 4.03) during the pre-pandemic period to 11.26 (SD = 4.30) during 2020–2021, before returning to 11.78 (SD = 3.86) in 2022. The corresponding medians were 11.3, 10.7, and 11.1, respectively. SCD interfering with activities (Q31) showed a higher mean during 2020–2021 (40.01, SD = 14.33) than during 2015–2019 (39.13, SD = 13.62), followed by a lower mean of 38.06 (SD = 14.46) in 2022.
A similar descriptive pattern was observed for the need for assistance due to SCD (Q41), for which the mean increased from 33.56 (SD = 12.29) before the pandemic to 34.73 (SD = 13.78) during 2020–2021 and subsequently decreased to 32.20 (SD = 13.22) in 2022. In contrast, discussing SCD with a health care professional (Q42) remained comparatively stable across periods, with mean values of 44.68 (SD = 11.00), 43.88 (SD = 11.11), and 44.38 (SD = 12.52) for the pre-pandemic, COVID-19, and 2022 periods, respectively.
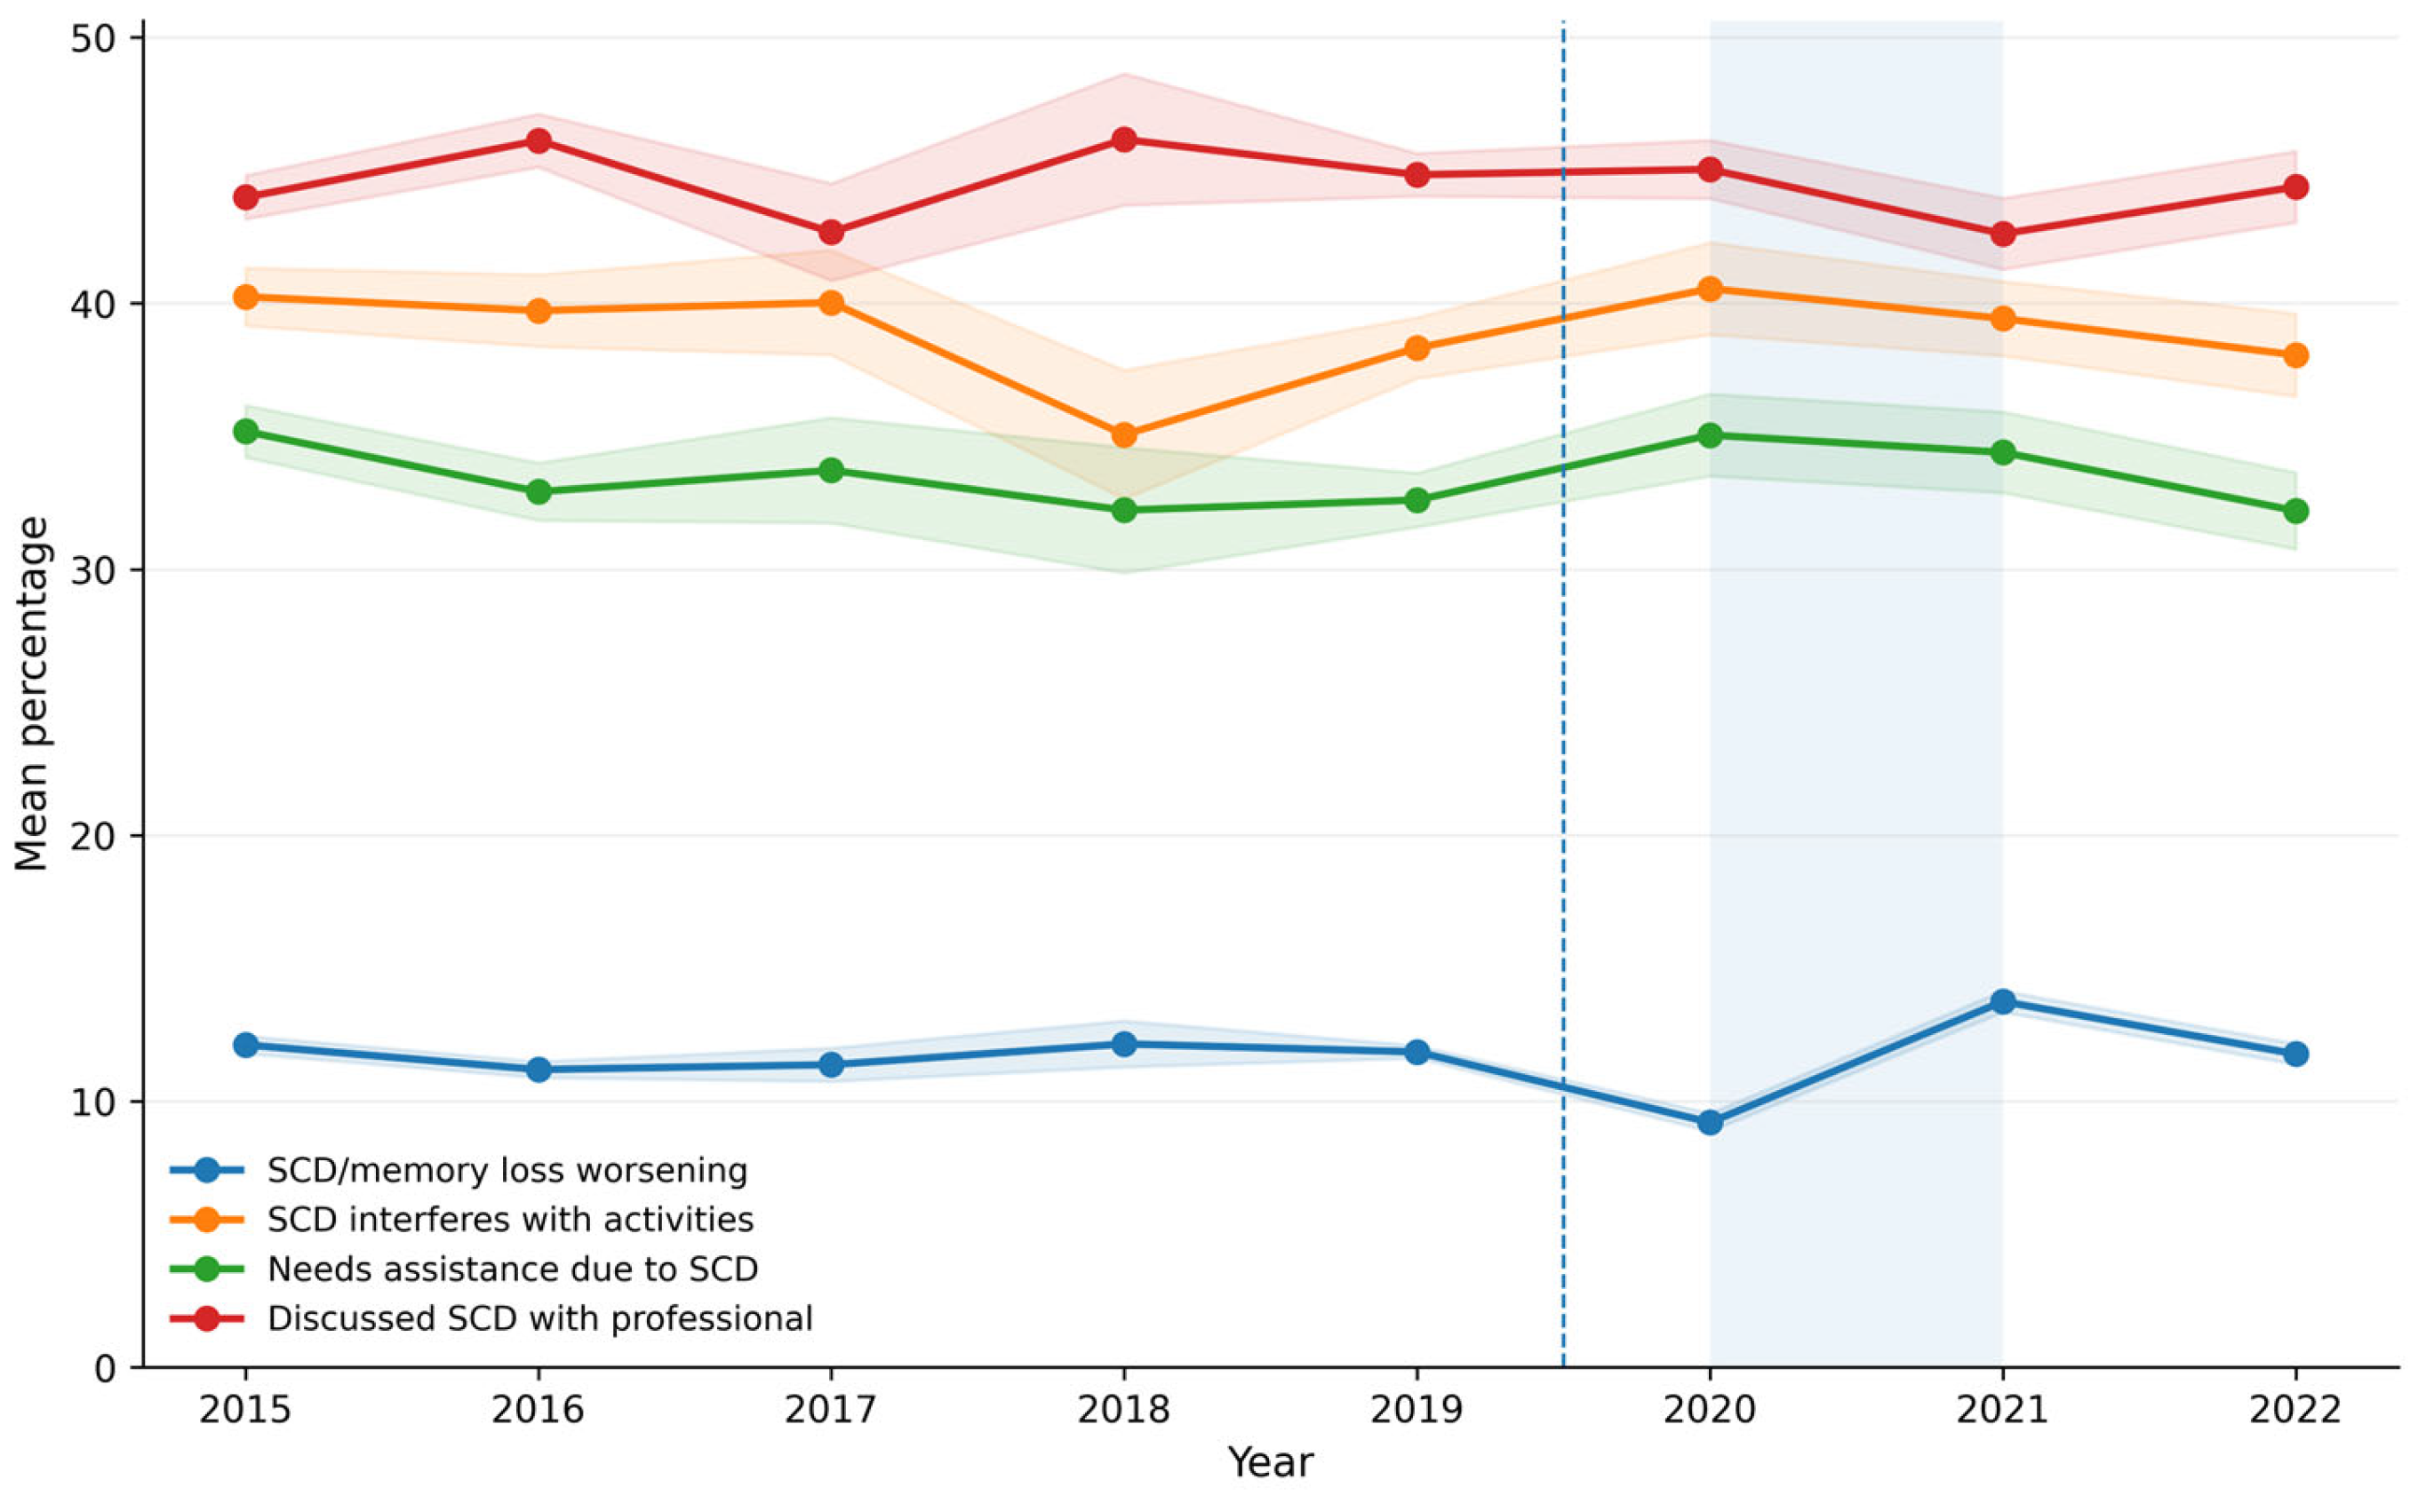
The median and IQR estimates generally supported these descriptive patterns while also indicating substantial heterogeneity among the aggregated surveillance records, particularly for Q31 and Q41. These descriptive differences are displayed in
Figure 1 and were subsequently evaluated using unpaired, profile-matched, and adjusted longitudinal analyses.
3.2. Pre-Pandemic Versus COVID-19 Comparisons
Descriptive and inferential comparisons between the pre-pandemic (2015–2019) and COVID-19 (2020–2021) periods are presented in
Table 3. Across the four indicators, unpaired mean differences were small, ranging from −0.80 to 1.17 percentage points. The largest standardized differences were nevertheless negligible in magnitude according to Hedges’
(absolute
).
For Q30 (SCD/memory loss worsening), the mean indicator value decreased from 11.77% in the pre-pandemic period to 11.26% during 2020–2021, corresponding to an unadjusted difference of −0.51 percentage points. Both Welch’s test and the Mann–Whitney U test remained statistically supported after Holm adjustment, although the standardized difference was small. The matched-profile analysis provided stronger evidence: among 547 profiles represented in both periods, the COVID-19 period was associated with a mean within-profile decrease of 0.80 percentage points (95% CI: −1.06 to −0.54), with both paired tests remaining supported after multiplicity adjustment.
Q31 showed only a small increase and no evidence of a systematic period difference in either the unpaired or matched-profile analyses. Q41 showed a mean within-profile increase of 1.07 percentage points (95% CI: 0.25 to 1.88); however, statistical support depended on the inferential procedure, and the standardized effect remained small. For Q42, the Mann–Whitney comparison was statistically supported after Holm adjustment, whereas Welch’s test and the matched-profile analyses were not. Its standardized difference was negligible and its confidence interval included zero. Complete test statistics, adjusted
p-values, effect sizes, and confidence intervals are reported in
Table 3 and
Table 4.
Overall, the paired and unpaired analyses showed consistent directional patterns. Q30 represented the most robust period-related difference, whereas the evidence for Q31 and Q42 was weak. The small Q41 increase should be interpreted cautiously because its statistical support was sensitive to the inferential procedure.
3.3. Adjusted Temporal Changes and Sensitivity to Panel Composition
To examine year-specific temporal changes while accounting for the repeated geographic and demographic structure of the surveillance data, adjusted models were estimated separately for each SCD indicator. Calendar year was modeled categorically, with 2019 serving as the pre-pandemic reference year, and cluster-robust standard errors were calculated at the surveillance-profile level. The primary analysis included all available profiles for each indicator, comprising 3093 observations from 810 profiles for Q30, 2676 observations from 695 profiles for Q31, 2651 observations from 689 profiles for Q41, and 2728 observations from 708 profiles for Q42.
Table 4 presents the adjusted differences for 2020, 2021, and 2022 relative to 2019, together with the corresponding balanced-panel sensitivity estimates.
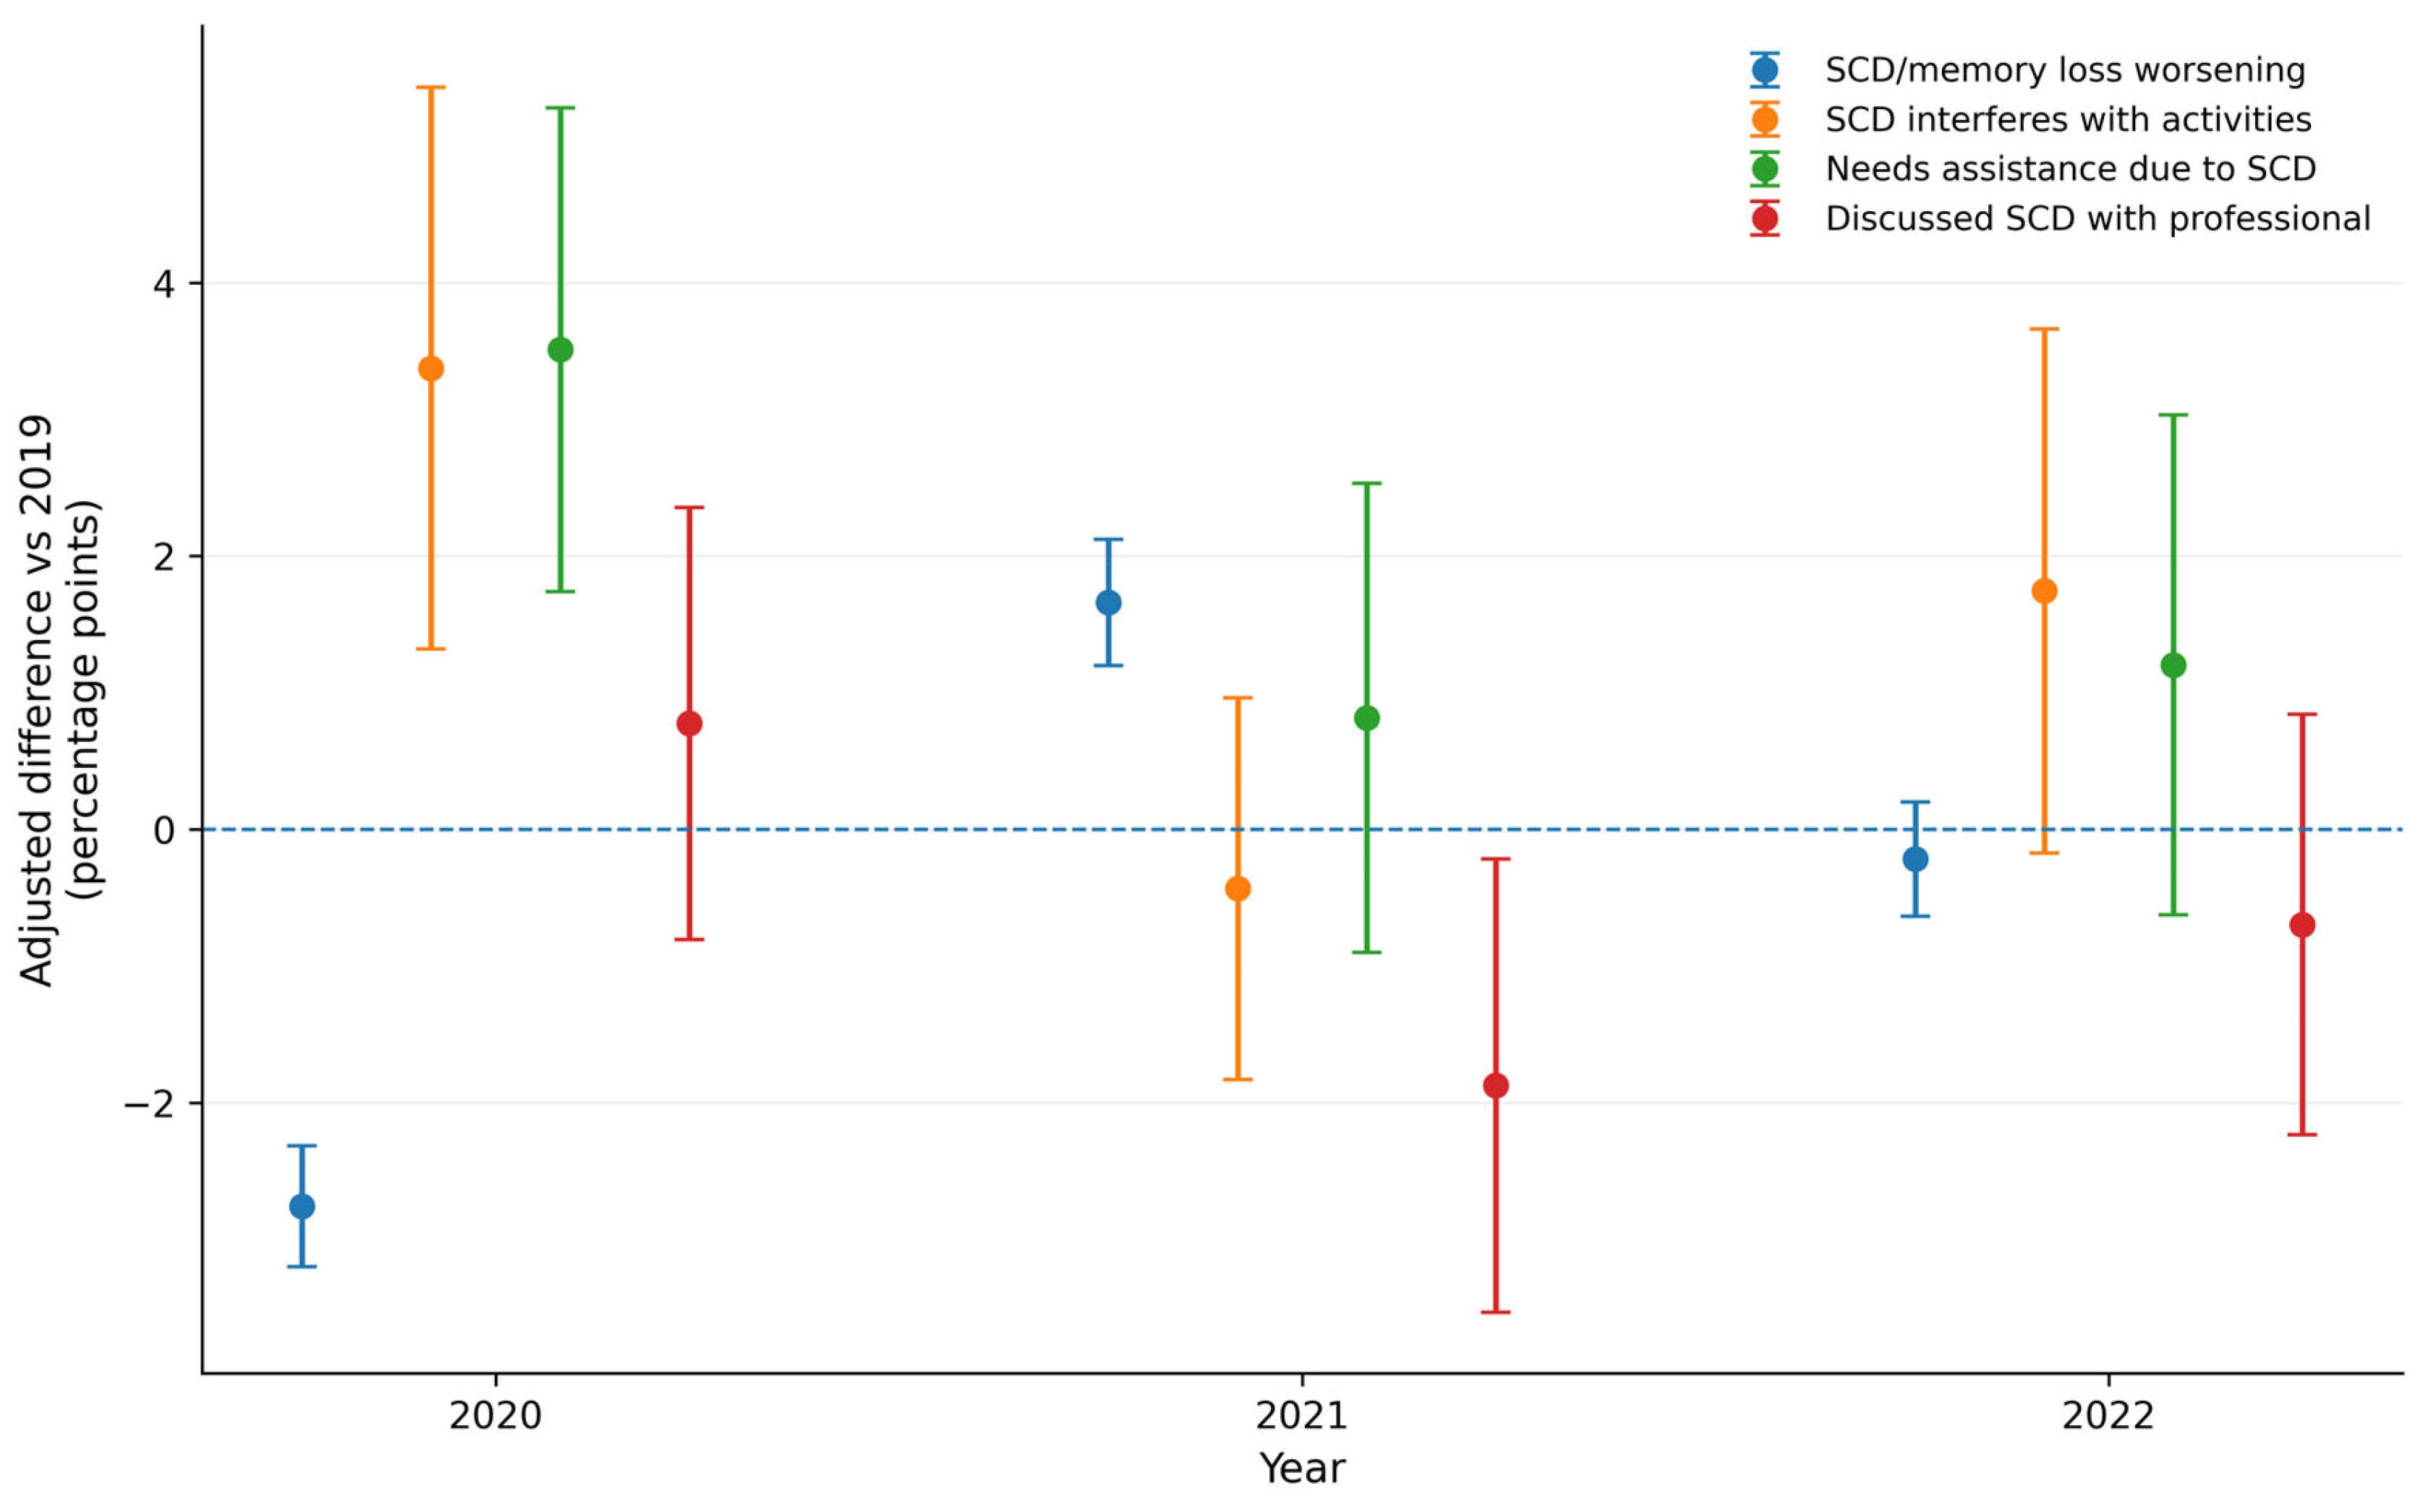
Year-specific models showed a non-monotonic Q30 trajectory: relative to 2019, the estimate decreased by 2.76 percentage points in 2020, increased by 1.66 points in 2021, and returned close to the reference level in 2022. Q31 and Q41 showed their clearest positive deviations in 2020, whereas Q42 showed no contrast that remained supported after global Holm adjustment. Full numerical results and confidence intervals are reported in
Table 4 and visualized in
Figure 2.
Figure 1.
Observed annual means of the four subjective cognitive decline indicators, 2015–2022. Points represent annual mean percentages, and shaded ribbons represent 95% confidence intervals. The vertical dashed line marks the transition from the pre-pandemic period to the COVID-19 period; the light-blue background highlights the COVID-19 period (2020–2021).
Figure 1.
Observed annual means of the four subjective cognitive decline indicators, 2015–2022. Points represent annual mean percentages, and shaded ribbons represent 95% confidence intervals. The vertical dashed line marks the transition from the pre-pandemic period to the COVID-19 period; the light-blue background highlights the COVID-19 period (2020–2021).
Balanced-panel sensitivity analyses retained 157 complete profiles for Q30, 145 for Q31, 145 for Q41, and 148 for Q42. All 12 coefficient directions were preserved, although intervals widened. The 2020 decrease and 2021 increase for Q30 remained supported after global Holm adjustment; the Q31 and Q41 increases in 2020 retained their direction but not adjusted statistical significance. Thus, changing composition did not fully explain the observed patterns, but residual compositional bias cannot be excluded.
3.4. Machine-Learning Predictive Performance
Models trained on 2015–2018 records were evaluated in 2019, 2020–2021, and 2022.
Table 5 reports RMSE, MAE, and R
2 with profile-clustered bootstrap 95% confidence intervals. Performance generally deteriorated with temporal distance, but rankings varied across indicators and periods. The 2019 data were not used for preprocessing, hyperparameter selection, early stopping, or model fitting and therefore constitute a fully held-out temporal evaluation under the definitive pipeline.
For Q30, SVR had the lowest observed RMSE in 2019, whereas CatBoost had the lowest observed RMSE in 2020–2021 and 2022. The CatBoost–RF differences in the latter periods were small and their paired bootstrap intervals included zero (
Supplementary Table S3). For Q31 and Q41, Random Forest had the lowest observed RMSE in the later holdouts, but its advantage over the runner-up was likewise not statistically distinguishable in those periods. Consequently, these findings support outcome- and period-specific rankings rather than general algorithm recommendations.
Figure 2 visualizes the adjusted year-specific differences reported in
Table 4. The coefficients and their 95% confidence intervals show the indicator-specific temporal contrasts relative to 2019; the horizontal dashed line at β = 0 denotes no adjusted difference from the reference year. Predictive RMSE results across the three chronological holdouts are reported numerically in
Table 5.
Figure 2.
Adjusted year-specific differences in subjective cognitive decline indicators relative to 2019. Points represent adjusted coefficients (β) for 2020, 2021, and 2022 relative to the 2019 reference year, and vertical bars represent 95% confidence intervals. Estimates are derived from full-panel models using cluster-robust standard errors at the surveillance-profile level. The horizontal dashed line at β = 0 indicates no difference from 2019. Statistical significance after global Holm correction is reported in
Table 4.
Figure 2.
Adjusted year-specific differences in subjective cognitive decline indicators relative to 2019. Points represent adjusted coefficients (β) for 2020, 2021, and 2022 relative to the 2019 reference year, and vertical bars represent 95% confidence intervals. Estimates are derived from full-panel models using cluster-robust standard errors at the surveillance-profile level. The horizontal dashed line at β = 0 indicates no difference from 2019. Statistical significance after global Holm correction is reported in
Table 4.
When 2020–2021 and 2022 were considered jointly, CatBoost had the lowest observed mean future RMSE for Q30 and Random Forest for Q31, Q41, and Q42. However, formal paired bootstrap comparisons showed that most differences between the two lowest-RMSE models were compatible with zero. Model labels are therefore descriptive rankings conditional on the observed holdouts, not evidence that one algorithm is universally superior.
Several model–indicator combinations produced in later holdouts. In those cases, the model did not outperform the holdout mean benchmark and was not considered predictively useful, even if it ranked above another poorly performing algorithm. Performance loss is interpreted as evidence of temporal instability that may arise from covariate, outcome, concept, or compositional shift; it does not corroborate or identify a causal pandemic effect.
Taken together, the temporal validation results demonstrate unstable transportability across periods. This predictive result is analytically distinct from the period-comparison analyses: the latter describe temporal differences in aggregated indicators, whereas the former tests whether historical predictor–outcome relationships remain accurate in later data.
Tree-model diagnostics also varied by indicator and holdout. CatBoost SHAP values most often emphasized location and secondary stratification for Q30 and Q41, while primary and secondary stratification were more prominent for Q31 and Q42. Random-forest permutation importance showed a broadly similar concentration on secondary stratification, with contributions changing across outcomes and periods. These shifts are consistent with heterogeneous predictive structure (
Supplementary Table S4), but they do not establish which variable caused performance deterioration.
3.5. Temporal Forecasting Backtesting and Model Selection
Because predictive performance on temporal holdouts does not necessarily imply reliable extrapolation beyond the observed time range, forecasting performance was evaluated separately from the machine-learning benchmark. Three explicitly temporal strategies were first compared using one-step-ahead rolling-origin backtesting: a naïve last-observation benchmark, a global linear temporal trend, and a profile fixed-effects linear trend. Within each evaluation year, the three approaches were assessed on the same set of eligible surveillance profiles to ensure direct comparability.
Table 6 summarizes their average forecasting performance across the rolling-origin evaluations.
Across all four indicators, the profile fixed-effects trend model achieved the lowest mean RMSE. For Q30, mean RMSE decreased from 6.138 for the naïve benchmark and 5.117 for the global linear trend to 4.744 for the profile fixed-effects model. The corresponding profile-based model achieved the lowest yearly RMSE in four of the six evaluable forecasting origins. However, its mean remained slightly negative (−0.085), indicating that the improvement in absolute prediction error did not translate into strong explained variation across all forecast years.
The advantage of accounting for persistent profile-level heterogeneity was clearer for Q31 and Q41. For Q31, the profile fixed-effects model reduced mean RMSE to 15.121, compared with 16.553 for the global linear trend and 18.864 for the naïve approach, and achieved the lowest RMSE in five of six yearly backtests. For Q41, the corresponding mean RMSE values were 14.272, 15.434, and 18.235, respectively, with the profile fixed-effects specification again ranking first in five of six evaluations. Mean values for the profile model were 0.112 for Q31 and 0.114 for Q41, indicating modest but positive out-of-sample explanatory performance.
For Q42, the profile fixed-effects model also provided the lowest average prediction error, with a mean RMSE of 13.603 compared with 14.261 for the global linear trend and 17.239 for the naïve benchmark. It achieved the lowest yearly RMSE in four of six evaluable forecast years. Nevertheless, its mean was only 0.034, indicating limited absolute forecasting ability despite its relative advantage over the simpler alternatives.
COVID-Aware Sensitivity Analysis
Because the adjusted analyses in
Section 3.3 showed substantial year-specific changes during 2020–2021, additional forecasting models were evaluated to determine whether explicitly incorporating a pandemic-period level shift or an interrupted temporal trend improved prospective prediction. These models were compared with the simpler profile fixed-effects linear trend using 2021 and 2022 as one-step-ahead evaluation years.
The simpler linear profile specification produced the lowest mean RMSE for all four indicators (
Table 6, Panel B). For Q30, mean RMSE was 3.845 for the linear model, compared with 4.272 for the COVID-level-shift model and 7.434 for the interrupted-trend specification. The particularly poor performance of the interrupted model (
on average) indicated substantial instability when the pandemic-associated slope change was extrapolated.
A similar pattern was observed for Q31. Mean RMSE increased from 12.178 under the profile fixed-effects linear model to 12.640 after introducing a COVID-period level shift and to 13.947 under the interrupted-trend specification. Mean correspondingly declined from 0.179 to 0.117 and −0.069.
For Q41, the linear specification again performed best (mean RMSE = 11.826, mean ), followed by the COVID-level model (, ) and interrupted trend (RMSE = 12.947, ). For Q42, differences between the linear and COVID-level specifications were comparatively small (RMSE = 11.052 vs. 11.098), but the interrupted-trend model again performed less favorably (RMSE = 11.541).
The COVID-aware sensitivity analysis therefore did not support carrying an explicit pandemic-level or pandemic-slope effect forward into the prospective projection period. Although
Section 3.3 identified substantial temporal disturbances during 2020–2021, those disturbances did not form a sufficiently stable predictive structure to improve forecasting of subsequent observations. The profile fixed-effects linear trend was consequently retained as the prospective projection model because it combined the lowest rolling-origin forecasting error with greater stability and parsimony across all four indicators.
Importantly, selection of the profile fixed-effects model was based on relative forecasting performance rather than evidence of high absolute predictive accuracy. The modest or negative mean R2 values, particularly for Q30 and Q42, indicate that substantial out-of-sample variability remained unexplained. Accordingly, the subsequent 2023–2026 estimates are interpreted as model-based projections of the fitted temporal structure, rather than precise forecasts of future CDC surveillance values.
3.6. Model-Based Projections for 2023–2026
Following the forecasting comparison described in
Section 3.5, the profile fixed-effects linear trend model was refitted using all available annual observations from 2015 through 2022 and used to generate model-based projections for 2023–2026. To maintain a constant surveillance composition across the projection horizon, estimates were standardized to the fixed set of eligible profiles observed in 2022. The same reference profiles were also used to obtain a model-based 2022 baseline, allowing the projected trajectory to be interpreted independently from year-to-year changes in the composition of the observed surveillance records.
Projected mean trajectories were broadly stable, but the prediction intervals were substantially wider than the confidence intervals for the mean. For example, Q30 was projected at 11.458% in 2023 (mean 95% CI: 11.270–11.649; 95% PI: 3.928–20.938) and 11.366% in 2026 (mean 95% CI: 11.044–11.691; 95% PI: 3.766–21.059). Q31, Q41, and Q42 showed similarly modest mean slopes but wide intervals for individual future aggregated estimates, as reported in
Table 7.
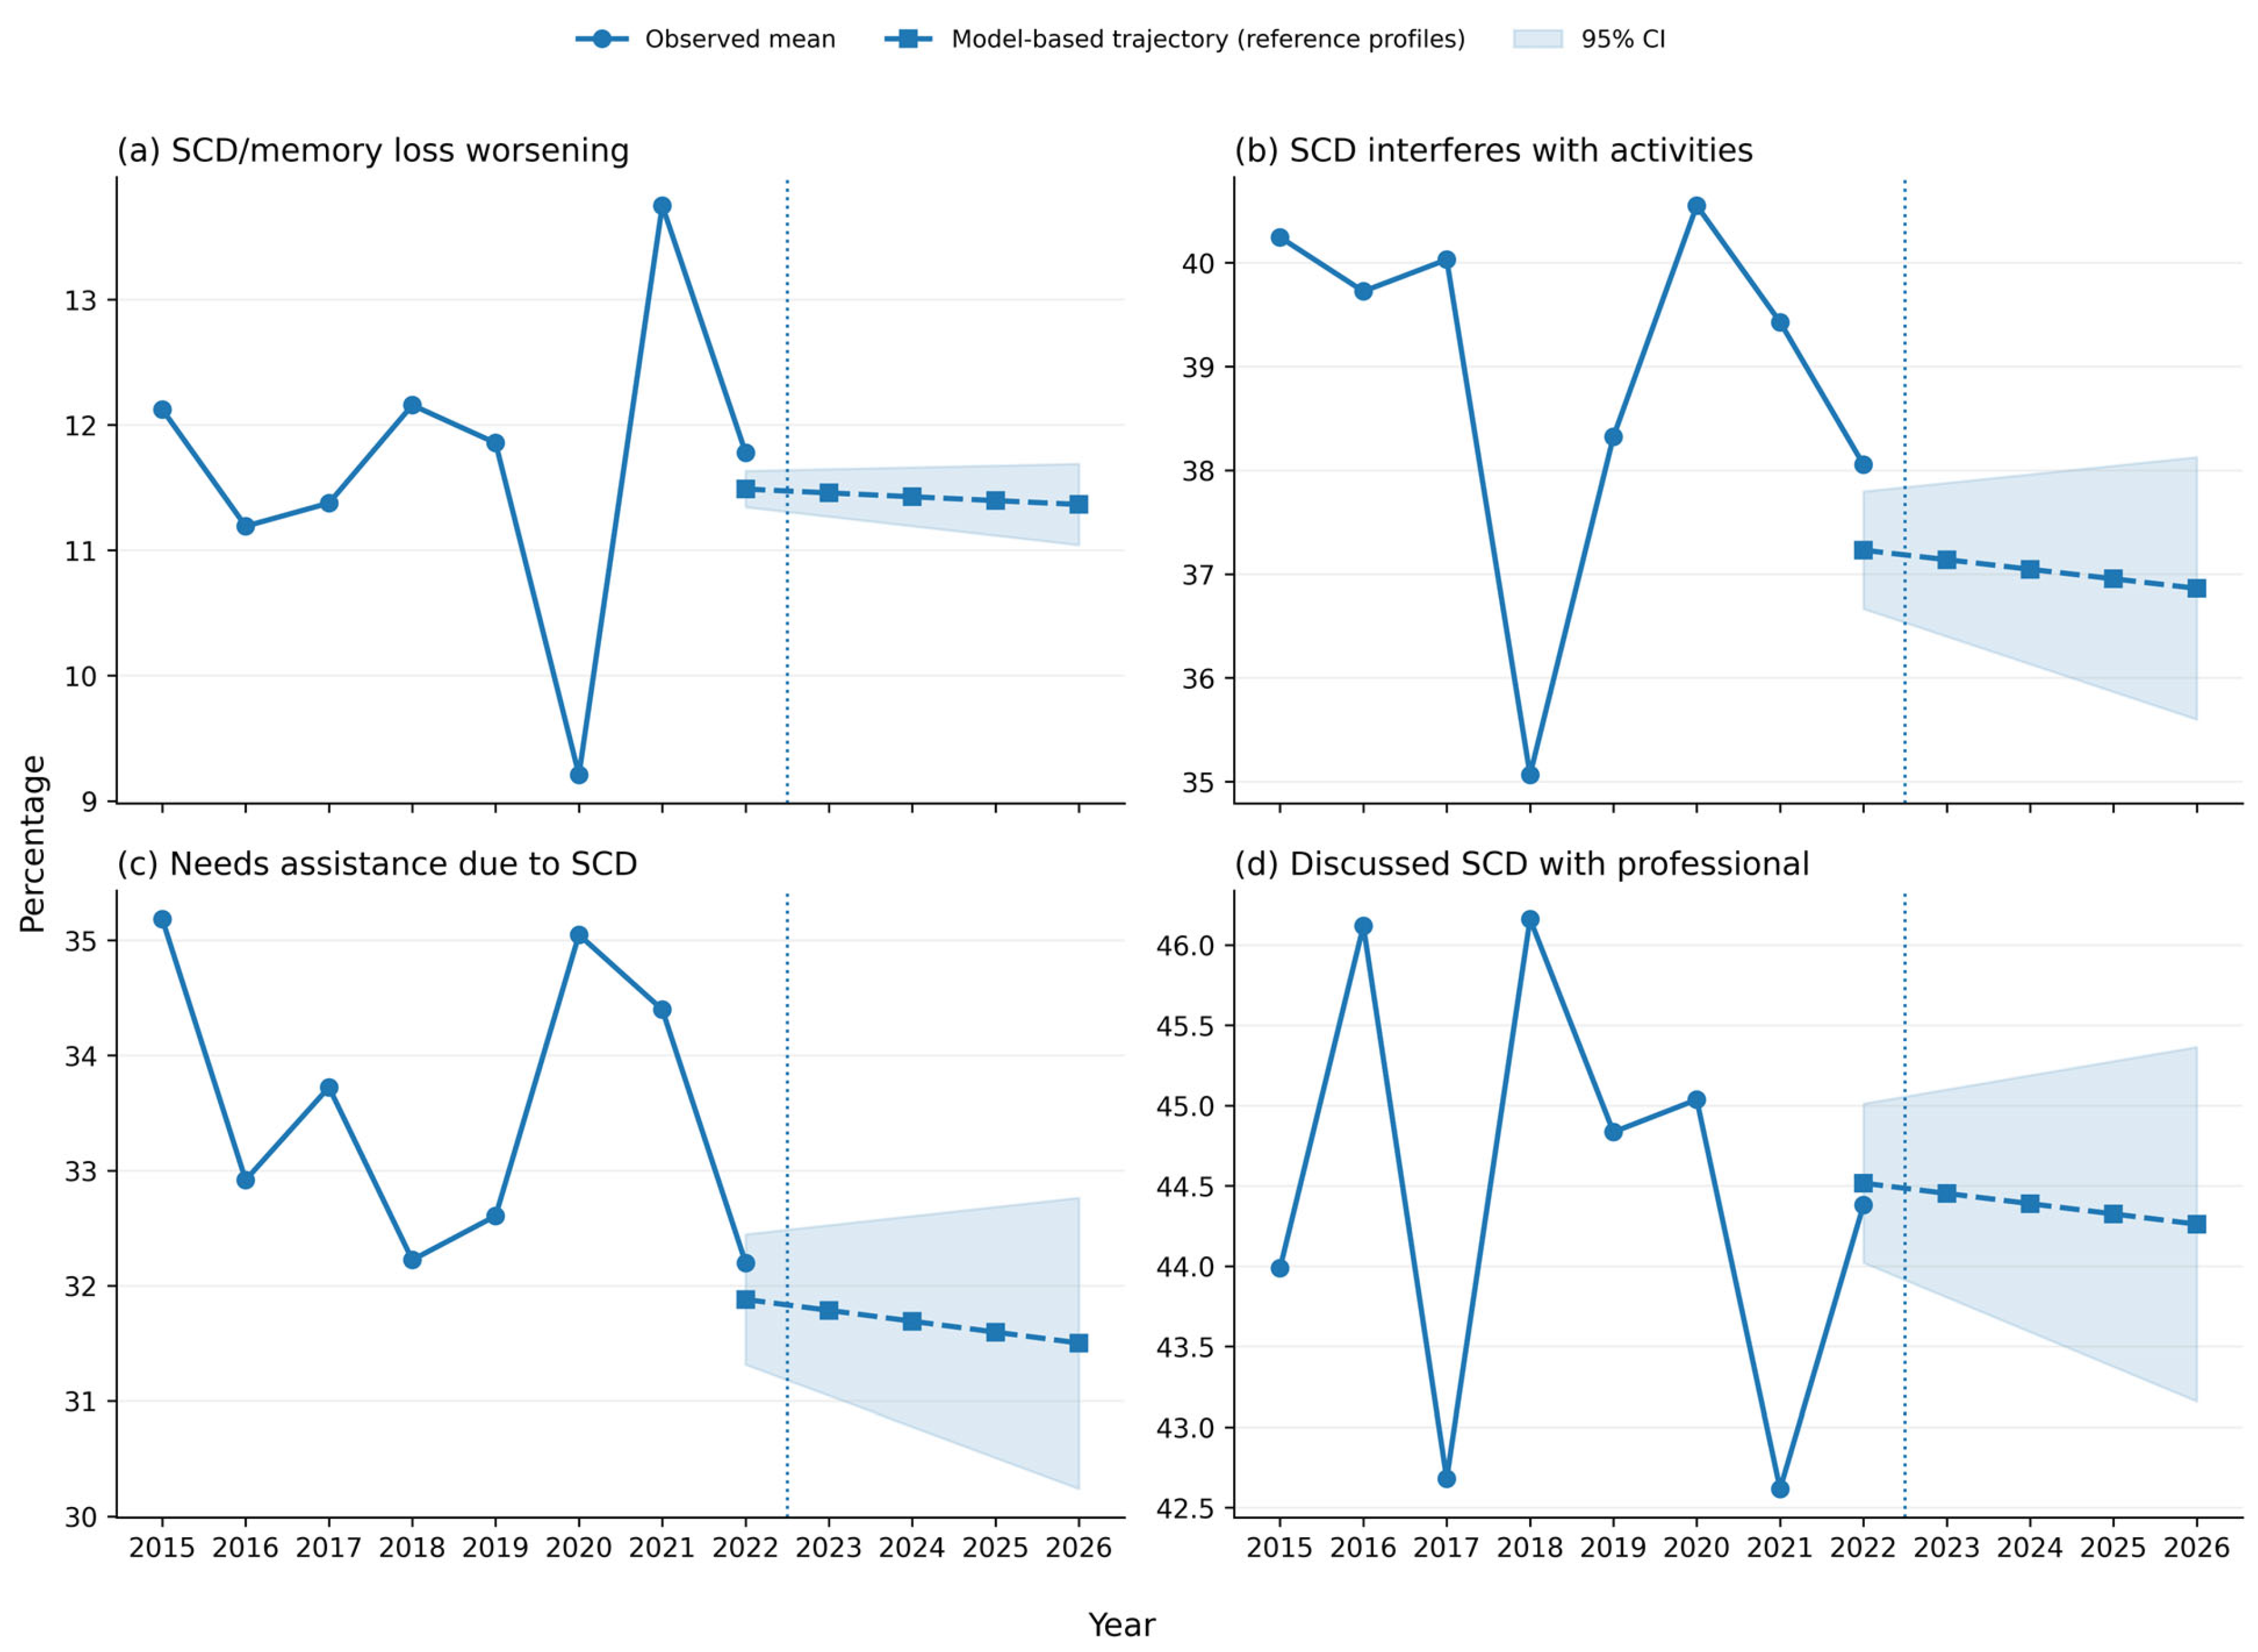
The relationship between the observed annual means and the model-based reference-profile trajectory is shown in
Figure 3. The observed series covers 2015–2022, whereas the dashed reference-profile trajectory begins with the model-based 2022 estimate and extends through 2026. This distinction is important because the overall observed 2022 mean and the model-based 2022 reference estimate are not identical quantities: the former uses all eligible records available in 2022, whereas the latter uses a fixed set of profiles selected for prospective projection.
The difference between the observed and model-based 2022 estimates was small for Q30, Q41, and Q42 and somewhat larger for Q31, reflecting the compositional restriction applied to the reference-profile population. Importantly, once the reference population was fixed, the modelled 2022–2023 changes corresponded exactly to the estimated annual slopes: −0.031 percentage points for Q30, −0.092 for Q31, −0.095 for Q41, and −0.064 for Q42. This confirms that the apparent discontinuity between the overall observed 2022 value and the 2023 projection does not represent a forecasted abrupt change, but rather a difference between the full observed surveillance composition and the fixed reference-profile population.
No projected mean fell outside the 0–100% range. The considerably wider prediction intervals, modest backtesting performance, and uncertainty about future module participation emphasize that the projections are extrapolations of the fitted surveillance structure rather than precise future prevalence forecasts.
Overall, the prospective analysis suggests that the four SCD-related surveillance indicators are more consistent with near-term stability than with substantial continued increases or decreases through 2026. This projected stability should be interpreted in the context of substantial heterogeneity across geographic–demographic profiles and the limited out-of-sample explanatory performance of the forecasting models.
4. Discussion
This study provides a temporally explicit assessment of four population-level surveillance indicators related to subjective cognitive decline (SCD) and memory loss in the United States before, during, and immediately after the COVID-19 pandemic. SCD is an important population-health construct because self-perceived worsening of memory or cognition may precede objectively measurable impairment and is associated with increased long-term risk of mild cognitive impairment and dementia, although progression is heterogeneous [
28]. The CDC Cognitive Decline Module monitors worsening memory, its functional consequences, assistance needs, and discussion of cognitive concerns with healthcare professionals, rather than clinically diagnosed dementia or Alzheimer’s disease [
29].
Three principal findings emerged. First, descriptive and inferential comparisons showed indicator- and year-specific temporal differences rather than a uniform pandemic-period change. Second, the predictive benchmark showed that relationships learned from 2015–2018 transported unevenly to later surveillance periods. These are separate inferential levels: predictive degradation indicates temporal instability and does not confirm that the pandemic caused the observed indicator changes. Third, rolling-origin forecasting favored a parsimonious profile fixed-effects trend over pandemic-aware specifications, while wide prediction intervals showed substantial uncertainty for future aggregated estimates.
The year-specific findings demonstrate why treating 2020–2021 as a homogeneous pandemic period can obscure important temporal variation. Q30, representing worsening SCD or memory loss during the preceding 12 months, decreased markedly in 2020 relative to 2019, increased above the 2019 level in 2021, and returned close to the reference level in 2022. Q31 and Q41, reflecting interference with activities and need for assistance, respectively, showed their clearest increases in 2020, whereas Q42, representing discussion of cognitive concerns with a healthcare professional, showed no robust temporal change after global multiplicity correction. Importantly, coefficient directions were preserved in the balanced-panel sensitivity analysis, suggesting that these patterns were not solely attributable to year-to-year changes in the composition of available surveillance profiles. Similar temporal complexity has been reported among people living with dementia and their caregivers, with severe initial disruption followed by varying degrees of adaptation and restoration of services [
3,
5].
The decrease in Q30 during 2020 should not be interpreted as evidence that cognitive health improved during the first pandemic year. The BRFSS Cognitive Decline Module measures self-reported worsening memory and its consequences for population surveillance rather than clinical cognitive impairment. Moreover, BRFSS surveys community-dwelling adults, excludes institutionalized populations, and may under-represent individuals unable to participate because of cognitive or physical limitations [
29]. Estimates may also be influenced by recall, reporting behavior, state-level module participation, healthcare access, daily routines, social exposure, and opportunities to recognize functional difficulties [
29]. These considerations are particularly relevant during COVID-19, when healthcare and social environments changed abruptly.
This distinction helps reconcile the transient Q30 decrease with clinical evidence of adverse cognitive consequences during the pandemic. Suárez-González et al. [
2], in a rapid systematic review, documented worsening behavioral, psychological, cognitive, and functional symptoms among people with dementia exposed to pandemic restrictions. Bakker et al. [
30] subsequently reported steeper memory decline following lockdown among memory-clinic patients, particularly those with SCD or mild cognitive impairment. Studies of dementia-affected households likewise documented interruptions to community services, reduced social and respite support, greater reliance on informal caregivers, and increased caregiver burden [
3,
20]. Because these studies examined clinically selected populations and outcomes distinct from aggregated BRFSS surveillance estimates, their findings do not necessarily conflict with the transient population-level decrease observed in Q30.
Post-pandemic evidence further supports distinguishing acute or subgroup-specific cognitive deterioration from persistent population-wide elevation in SCD. In a population-based study of dementia-free adults aged 65 years and older in Switzerland, Schrempft et al. [
31] reported an SCD prevalence of 18.9% in 2022 compared with 19.5% in a pre-pandemic cohort. Conversely, clinically selected populations exposed to SARS-CoV-2 continue to show long-term cognitive morbidity: reduced cognitive performance has been documented among older hospitalized COVID-19 survivors, and meta-analytic evidence suggests an increased risk of new-onset dementia following COVID-19 infection, although estimates vary across study designs and comparator groups [
32,
33]. Thus, the absence of a sustained increase in aggregated surveillance indicators does not imply an absence of clinically important post-COVID cognitive sequelae among vulnerable individuals.
The non-monotonic pattern also parallels our previous population-level research in Chile. Barría-Sandoval et al. [
34] identified substantial temporal and regional variation in dementia- and Alzheimer’s disease-related mortality during 2017–2022 and emphasized that pandemic-era patterns could reflect both underlying health changes and altered recording or attribution of dementia as a cause of death. Although mortality and SCD are distinct outcomes and the Chilean and U.S. settings are not directly comparable, both studies caution against conceptualizing the pandemic as a homogeneous exposure producing a single directional population response.
The temporary increases in Q31 and Q41 during 2020 are also epidemiologically plausible in light of disruptions to routines, social interaction, community services, and formal and informal dementia care. Functional deterioration, loss of respite, increased care intensity, and barriers to healthcare were repeatedly documented among dementia-affected populations during the pandemic [
2,
3,
35,
36]. These findings provide a plausible context for the observed increases in functional interference and assistance needs, although the observational design of the present study precludes attributing these changes directly to pandemic restrictions.
Finally, Q42 showed comparatively little temporal change, and none of its year-specific contrasts survived global multiplicity correction. This finding is relevant because discussing cognitive concerns with a healthcare professional represents an important entry point into assessment, counseling, and care planning. BRFSS evidence indicates that adults with SCD who have a usual source of healthcare are more likely to discuss memory loss with a provider [
37]. Moreover, Healthy People 2030 objective DIA-03 aims to increase the proportion of adults aged 45 years and older with SCD who discuss their symptoms with a health professional from a baseline of 45.4% to 50.4%; as of 2026, the objective remains classified as “baseline only” [
38]. The approximately 44% trajectory observed and projected for Q42 therefore provides no indication of clear progress toward that target, although direct numerical comparison should be cautious because our analyses use aggregated CDC surveillance records rather than the nationally weighted Healthy People indicator.
4.1. Temporal Generalization of Machine-Learning Models
A second major finding concerns predictive transportability. No algorithm was uniformly superior, and most paired bootstrap comparisons between the two lowest-RMSE models were compatible with no difference. More importantly, several later-period values were near zero or negative. We therefore interpret model rankings conditionally and emphasize limited temporal stability rather than recommending CatBoost, Random Forest, or any other algorithm as generally preferable.
This finding is consistent with the growing literature on temporal dataset shift in health-related machine learning. Changes in population composition, healthcare utilization, measurement practices, predictors, and outcome distributions can progressively reduce model performance when historical models are applied to later data [
39,
40,
41]. Systematic reviews indicate that temporal shift and concept drift are among the most frequently encountered forms of dataset shift in health prediction and that approaches such as recalibration, refitting, model updating, and retraining may mitigate deterioration, although no single strategy performs consistently across applications [
39,
42]. This application-specific behavior parallels our finding that the best-performing algorithm differed across SCD indicators and evaluation periods.
The COVID-19 pandemic provides a particularly relevant setting for such instability because healthcare utilization, population behavior, care pathways, and the composition of observed populations changed abruptly. Previous studies have documented deterioration when models developed using pre-pandemic clinical data were transferred to pandemic-period observations, accompanied by shifts in predictor distributions and relationships [
43,
44]. More recent analyses have similarly shown that increasing temporal separation between training and evaluation data can reduce predictive accuracy and that the magnitude of deterioration depends on both the target outcome and the algorithm employed [
45]. Our findings extend this concern to population-level cognitive-health surveillance, where temporal instability was likewise indicator-specific.
The absence of uniform superiority of the nonlinear models is also informative. Linear regression remained competitive for several indicators in the 2019 holdout, whereas random forest or CatBoost became preferable in later periods. Greater algorithmic flexibility therefore did not guarantee greater temporal robustness. Temporal non-stationarity may affect different outcomes and subpopulations differently, and even complex models can deteriorate when the underlying data-generating process changes [
40,
41,
46]. Accordingly, the present results should not be interpreted as evidence that CatBoost or random forest is intrinsically more resistant to temporal shift; robustness appears to depend on the interaction between the outcome, predictor structure, temporal environment, and learning algorithm.
This distinction complements our previous machine-learning research in older adults. Navarrete et al. [
47] found strong random-forest performance for mortality-risk prediction in the Cardiovascular Health Study under the validation framework used in that study. The present analysis demonstrates an additional consideration: strong predictive accuracy within a historical dataset does not necessarily imply stable transportability across subsequent calendar periods. For longitudinal surveillance applications, conventional random train–test partitions should therefore be complemented by temporally separated validation.
Recent methodological work supports this approach. Rolling-window and prospective temporal evaluation frameworks have been proposed to estimate generalization under non-stationarity and to characterize model longevity as predictors and outcomes evolve [
41,
48]. Evidence from clinical prediction further suggests that dynamic updating, drift-aware retraining, and continual learning can mitigate performance deterioration when data distributions change [
49,
50,
51]. These principles are consistent with the chronological holdout and rolling-origin procedures used in the present study.
Taken together, changing rankings, overlapping paired-bootstrap comparisons, and near-zero or negative values demonstrate that predictive accuracy cannot be assumed to persist as surveillance conditions evolve. This temporal instability may reflect several forms of dataset shift and remains distinct from evidence about changes in the outcome level itself.
4.2. Interpretation of the 2023–2026 Projections
The forecasting analysis provides a third contribution of this study. Although the pandemic produced distinct year-specific perturbations, explicitly incorporating a COVID-period level shift or an interrupted post-2020 trend did not improve subsequent one-step-ahead prediction. Instead, the simpler profile fixed-effects linear specification achieved the lowest mean RMSE across all four indicators in the COVID-aware sensitivity analysis. From a forecasting perspective, this favors a parsimonious interpretation in which pandemic-associated deviations behaved more like temporary disturbances than persistent structural changes suitable for extrapolation.
The resulting 2023–2026 projections indicate approximate stability rather than strong directional change. Q30 remained close to 11.4%, Q31 to 37%, Q41 to 32%, and Q42 to 44%, with all estimated annual slopes small and statistically compatible with zero. These trajectories should not be interpreted as forecasts of clinical dementia incidence, Alzheimer’s disease prevalence, or individual cognitive decline. Rather, they represent extrapolations of aggregated population-surveillance indicators under a fixed reference-profile composition. This distinction is important because the CDC Cognitive Decline Module measures self-reported worsening memory and its functional consequences rather than clinically diagnosed cognitive impairment or dementia [
29].
Available post-2022 evidence is broadly compatible with, but does not validate, this near-term stability interpretation. The CDC characterizes SCD as affecting approximately one in ten U.S. adults aged 45 years and older, which is qualitatively consistent with the approximately 11.4% Q30 trajectory projected here [
29]. Similarly, Schrempft et al. [
31] reported an SCD prevalence of 18.9% among dementia-free adults aged 65 years and older in Switzerland in 2022, compared with 19.5% in a pre-pandemic cohort, providing little evidence of a substantial persistent population-wide increase. These estimates are not directly comparable with our results because of differences in populations, instruments, sampling, and analytical definitions, but their direction is consistent with the absence of a pronounced sustained post-pandemic increase.
Importantly, external validation of the complete projection horizon is not yet possible. The CDC public SCD interface includes BRFSS data-collection years through 2024, while indicating that 2023 data are unavailable in that product [
52]. Consequently, the 2025–2026 projections remain prospective model-based expectations rather than observed or confirmed outcomes. Even for available later data, formal validation would require harmonization of indicator definitions, geographic–demographic profiles, eligibility criteria, and analytical procedures. Future BRFSS releases therefore provide an opportunity to prospectively evaluate and, where necessary, recalibrate the projected trajectories.
The apparent stability of percentage-based SCD indicators should also be distinguished from the growing absolute burden of cognitive impairment and dementia. The 2025 Alzheimer’s Disease Facts and Figures report estimates that approximately 7.2 million Americans aged 65 years and older are living with Alzheimer’s dementia, with this burden expected to increase as the population ages [
53]. Stable percentages therefore do not imply a stable number of affected individuals or reduced demand for cognitive assessment, functional support, and caregiving services. Moreover, population averages may conceal persistent geographic, demographic, and socioeconomic disparities in cognitive health and access to care [
7,
29,
37].
Overall, the 2023–2026 projections are most appropriately interpreted as evidence against a strong sustained directional shift in these four aggregated surveillance indicators under the fitted model and fixed reference composition. They are compatible with a scenario in which the largest pandemic-associated perturbations were temporary and followed by partial reversion toward longer-term levels. Nevertheless, the modest forecasting performance observed during backtesting, uncertainty inherent in extrapolation, and absence of harmonized observed data through 2026 warrant cautious interpretation. Future BRFSS Cognitive Decline Module releases should therefore be used to prospectively validate, recalibrate, or revise these trajectories.
4.3. Policy Implications
The findings have several implications for dementia preparedness, population surveillance, and predictive analytics in public health. First, emergency preparedness for older adults should balance protection from acute infectious threats with continuity of cognitive, functional, social, and caregiver support. During COVID-19, people living with dementia and their caregivers experienced interruptions to community and healthcare services, reduced respite and social support, and increased informal caregiving demands, with consequences for cognitive and functional health and caregiver well-being [
54,
55,
56]. Dementia-related services should therefore be considered essential components of emergency preparedness. Continuity plans should preserve access to cognitive assessment, clinical follow-up, caregiver support, social engagement, and community-based assistance through adaptable combinations of in-person and remote care. Although telehealth can complement service delivery during disruptions, differences in technology access, digital literacy, and caregiver support require attention to avoid exacerbating inequalities [
57,
58].
Second, cognitive-health surveillance should remain geographically and demographically sensitive. The CDC Cognitive Decline Module is intended to identify where and among whom cognitive concerns and their functional consequences occur, while participation in the optional module varies across states and survey years [
29]. Consistent with the profile-level heterogeneity observed in this study, previous BRFSS analyses have documented substantial racial/ethnic, educational, insurance-related, age-related, and geographic differences in SCD prevalence and in discussion of cognitive concerns with healthcare professionals [
59]. National pooled estimates may therefore obscure important subgroup disparities, supporting stratified surveillance capable of identifying populations with disproportionate cognitive concerns, functional limitations, assistance needs, or barriers to care.
Third, predictive surveillance systems should be treated as dynamic rather than static tools. The deterioration observed under chronological validation indicates that predictive relationships estimated from historical data may change as surveillance populations and healthcare environments evolve. Temporal validation, performance monitoring, drift detection, and periodic recalibration or retraining should therefore form part of model governance [
41]. Importantly, the variation in algorithm rankings across indicators also cautions against equating model complexity with temporal robustness: CatBoost was most stable for Q30, whereas random forest performed more favorably for Q31, Q41, and Q42. Model selection and continued use should consequently be based on observed out-of-period performance rather than algorithmic sophistication alone.
Finally, the relative stability of Q42 is particularly relevant because discussing cognitive concerns with a healthcare professional represents a potentially modifiable step toward evaluation, identification of reversible conditions, diagnosis, counseling, and care planning. Previous BRFSS analyses indicate that fewer than half of adults reporting SCD discussed their concerns with a healthcare professional and that access to a usual source of care facilitates such discussion [
37,
59]. Healthy People 2030 objective DIA-03 seeks to increase this proportion from a baseline of 45.4% to 50.4% [
38]. Against this benchmark, the approximately 44% Q42 trajectory projected here provides no indication of a substantial spontaneous increase, although our aggregated estimates are not directly equivalent to the nationally weighted Healthy People measure. Improving recognition and clinical discussion of cognitive concerns should therefore remain a public-health priority, particularly among populations facing barriers to regular healthcare.
Taken together, these findings support a broader model of cognitive-health resilience that integrates continuity of dementia-related services and caregiver support, geographically and demographically sensitive surveillance, and temporally monitored predictive systems into routine public-health infrastructure. Such an approach extends beyond pandemic preparedness and emphasizes the capacity to identify cognitive-health needs, preserve access to support, and adapt surveillance and predictive systems as population conditions change.
5. Limitations and Future Directions
Several limitations should be considered. The portal contains aggregated repeated cross-sectional estimates, not independent individuals or individual longitudinal trajectories. The 11,444 annual records were distributed across 769–879 unique profiles per indicator, with repeated observations within profiles and a geographic–demographic hierarchy. Profile matching, cluster-robust inference, balanced panels, and profile-clustered bootstrap resampling address parts of this dependence, but they do not fully reproduce a multilevel survey model or eliminate residual correlation.
Second, subjective cognitive decline is a self-reported surveillance construct and is not equivalent to objectively measured cognitive impairment, mild cognitive impairment, Alzheimer’s disease, or dementia. The CDC emphasizes that the Cognitive Decline Module is intended for public-health surveillance rather than clinical diagnosis [
29], while contemporary evidence indicates that subjective cognitive concerns and objective cognitive performance are related but distinct constructs [
60,
61]. Moreover, BRFSS surveys community-dwelling adults and excludes institutionalized populations and respondents unable to participate because of substantial cognitive or physical limitations. Consequently, individuals with more severe cognitive impairment or functional dependency may be under-represented, and the observed indicators should be interpreted as population-level reports of cognitive concerns and their consequences rather than estimates of clinical neurodegenerative disease.
Participation in the optional Cognitive Decline Module, response rates, telephone sampling composition, state coverage, and availability of demographic strata varied over 2015–2022 [
29]. Matched-profile and balanced-panel analyses reduced sensitivity to changing record composition but cannot eliminate selective nonresponse or participation bias, particularly during the pandemic. Accordingly, some movement may reflect surveillance composition rather than a true prevalence shift.
Fourth, the available predictors primarily represented geographic, demographic, and temporal surveillance characteristics. Individual-level clinical and contextual factors—including SARS-CoV-2 infection and severity, vascular risk, mental health, socioeconomic circumstances, healthcare utilization, social isolation, vaccination, caregiver support, and comorbidity—were unavailable. This limits both predictive accuracy and mechanistic interpretation. Progression from SCD to objective impairment is heterogeneous and associated with multiple clinical and psychosocial characteristics [
49], while post-COVID cognitive outcomes also vary according to individual health characteristics and comorbidity burden [
32]. Unmeasured clinical and contextual factors may therefore account for part of the residual variation in the predictive models.
Fifth, predictive performance was not temporally stable. Several model–indicator combinations produced near-zero or negative out-of-sample
values in later holdouts, consistent with the recognized vulnerability of healthcare machine-learning models to temporal dataset shift [
39,
42]. The reported predictive performance should therefore be regarded as conditional on the observed surveillance periods rather than as evidence of durable accuracy under future data-generating conditions.
Sixth, the 2023–2026 estimates are model-based extrapolations. Confidence intervals quantify uncertainty in the mean trajectory, whereas the newly reported prediction intervals incorporate residual and between-profile variation for a future aggregated estimate. Neither accounts for all possible structural changes in survey methodology, module participation, population composition, or external shocks, and neither should be interpreted at the individual-patient level.
Finally, respondent-level BRFSS survey weights, strata, primary sampling units, and standard errors were not available for direct incorporation in the predictive models. The portal confidence limits were not used as precision weights because they do not recover the complete complex-survey covariance structure and may induce inconsistent weighting across aggregated strata. The models therefore characterize variation among reported estimates and should not be interpreted as design-based national or state prevalence estimators.
Future research should extend this work using respondent-level BRFSS data with appropriate complex-survey methods, hierarchical or multilevel models that account for geographic and demographic clustering, and richer clinical, socioeconomic, healthcare-access, and social-support information where available. Predictive surveillance systems should also incorporate formal drift detection, temporal recalibration, and model-updating procedures, because no single strategy has proved universally effective under temporal dataset shift [
39,
42]. Most importantly, subsequent releases of the Cognitive Decline Module will provide an opportunity for prospective validation of the 2023–2026 projections, allowing direct assessment of forecast bias and whether the apparent post-pandemic stability persists or gives way to a new temporal pattern.
6. Conclusions
This study examined temporal changes, predictive generalization, and prospective trajectories of four population-level surveillance indicators related to subjective cognitive decline (SCD) and memory loss in the United States before, during, and immediately after the COVID-19 pandemic. By combining descriptive and inferential analyses, matched-profile longitudinal comparisons, machine-learning benchmarking, temporal validation, forecasting backtests, and prospective projections, the study provides a complementary assessment of both observed temporal variation and the ability of predictive models to generalize across changing surveillance periods.
The findings show that the COVID-19 period was not associated with a uniform change across SCD-related indicators. Year-specific analyses revealed substantial heterogeneity that would have been obscured by treating 2020–2021 as a single homogeneous period. Worsening SCD or memory loss decreased markedly in 2020 relative to 2019, increased above the 2019 level in 2021, and returned close to the reference level in 2022. In contrast, interference with activities and need for assistance showed their clearest increases in 2020, while discussion of cognitive concerns with a healthcare professional showed no robust year-specific change after correction for multiple comparisons. The consistency of coefficient direction in the balanced-panel sensitivity analysis further indicated that these temporal patterns were not explained solely by changes in the composition of available surveillance profiles.
The predictive analyses also demonstrated that performance measured in one temporal setting cannot be assumed to remain stable in subsequent periods. Although nonlinear machine-learning models provided advantages for some indicators, no algorithm was uniformly superior across outcomes and evaluation periods. Models trained exclusively on pre-pandemic observations frequently showed reduced performance when transported to COVID-19 and post-period data, including near-zero or negative out-of-sample values for several model–indicator combinations. These findings emphasize that temporal validation, rather than random-split performance alone, is essential when predictive models are developed for longitudinal public-health surveillance.
Forecasting analyses provided an additional perspective on the persistence of the observed pandemic-era changes. In rolling-origin and COVID-aware backtesting, the parsimonious profile fixed-effects linear trend was generally more reliable than specifications incorporating permanent COVID-level or interrupted-trend effects. Under this specification, projected mean trajectories for 2023–2026 remained broadly stable, at approximately 11% for worsening SCD or memory loss, 37% for interference with activities, 32% for need for assistance, and 44% for discussion with a healthcare professional. The estimated temporal slopes were small and statistically compatible with zero, providing no evidence within the fitted surveillance model of a sustained post-2022 upward or downward trajectory.
These projections should nevertheless be interpreted as extrapolations of aggregated surveillance indicators under a fixed reference-profile composition, not as forecasts of individual cognitive decline, clinical dementia incidence, or Alzheimer’s disease prevalence. They also should not be considered confirmed outcomes through 2026. Their principal value is to establish explicit, testable near-term surveillance expectations that can be prospectively evaluated as additional harmonized BRFSS Cognitive Decline Module data become available.
Taken together, the observed surveillance indicators showed indicator-specific, predominantly nonpersistent temporal perturbations, while the predictive analyses demonstrated instability of historical predictor–outcome relationships. These findings are complementary but not confirmatory of one another. Continued surveillance and periodic model reassessment are warranted.