Article

Study on the Stability of Cemented Backfill Under Blasting Disturbance: A Case Study of Makeng Iron Mine


1
College of Mining, Liaoning Technical University, Fuxin 123000, China
2
State Key Laboratory of Intelligent Deep Metal Mining and Equipment, Shenyang 110819, China
3
School of Resources and Civil Engineering, Northeastern University, Shenyang 110819, China
*
Author to whom correspondence should be addressed.
Appl. Sci. 2026, 16(18), 9233; https://doi.org/10.3390/app16189233
Submission received: 21 July 2026 / Revised: 9 September 2026 / Accepted: 14 September 2026 / Published: 17 September 2026

Abstract

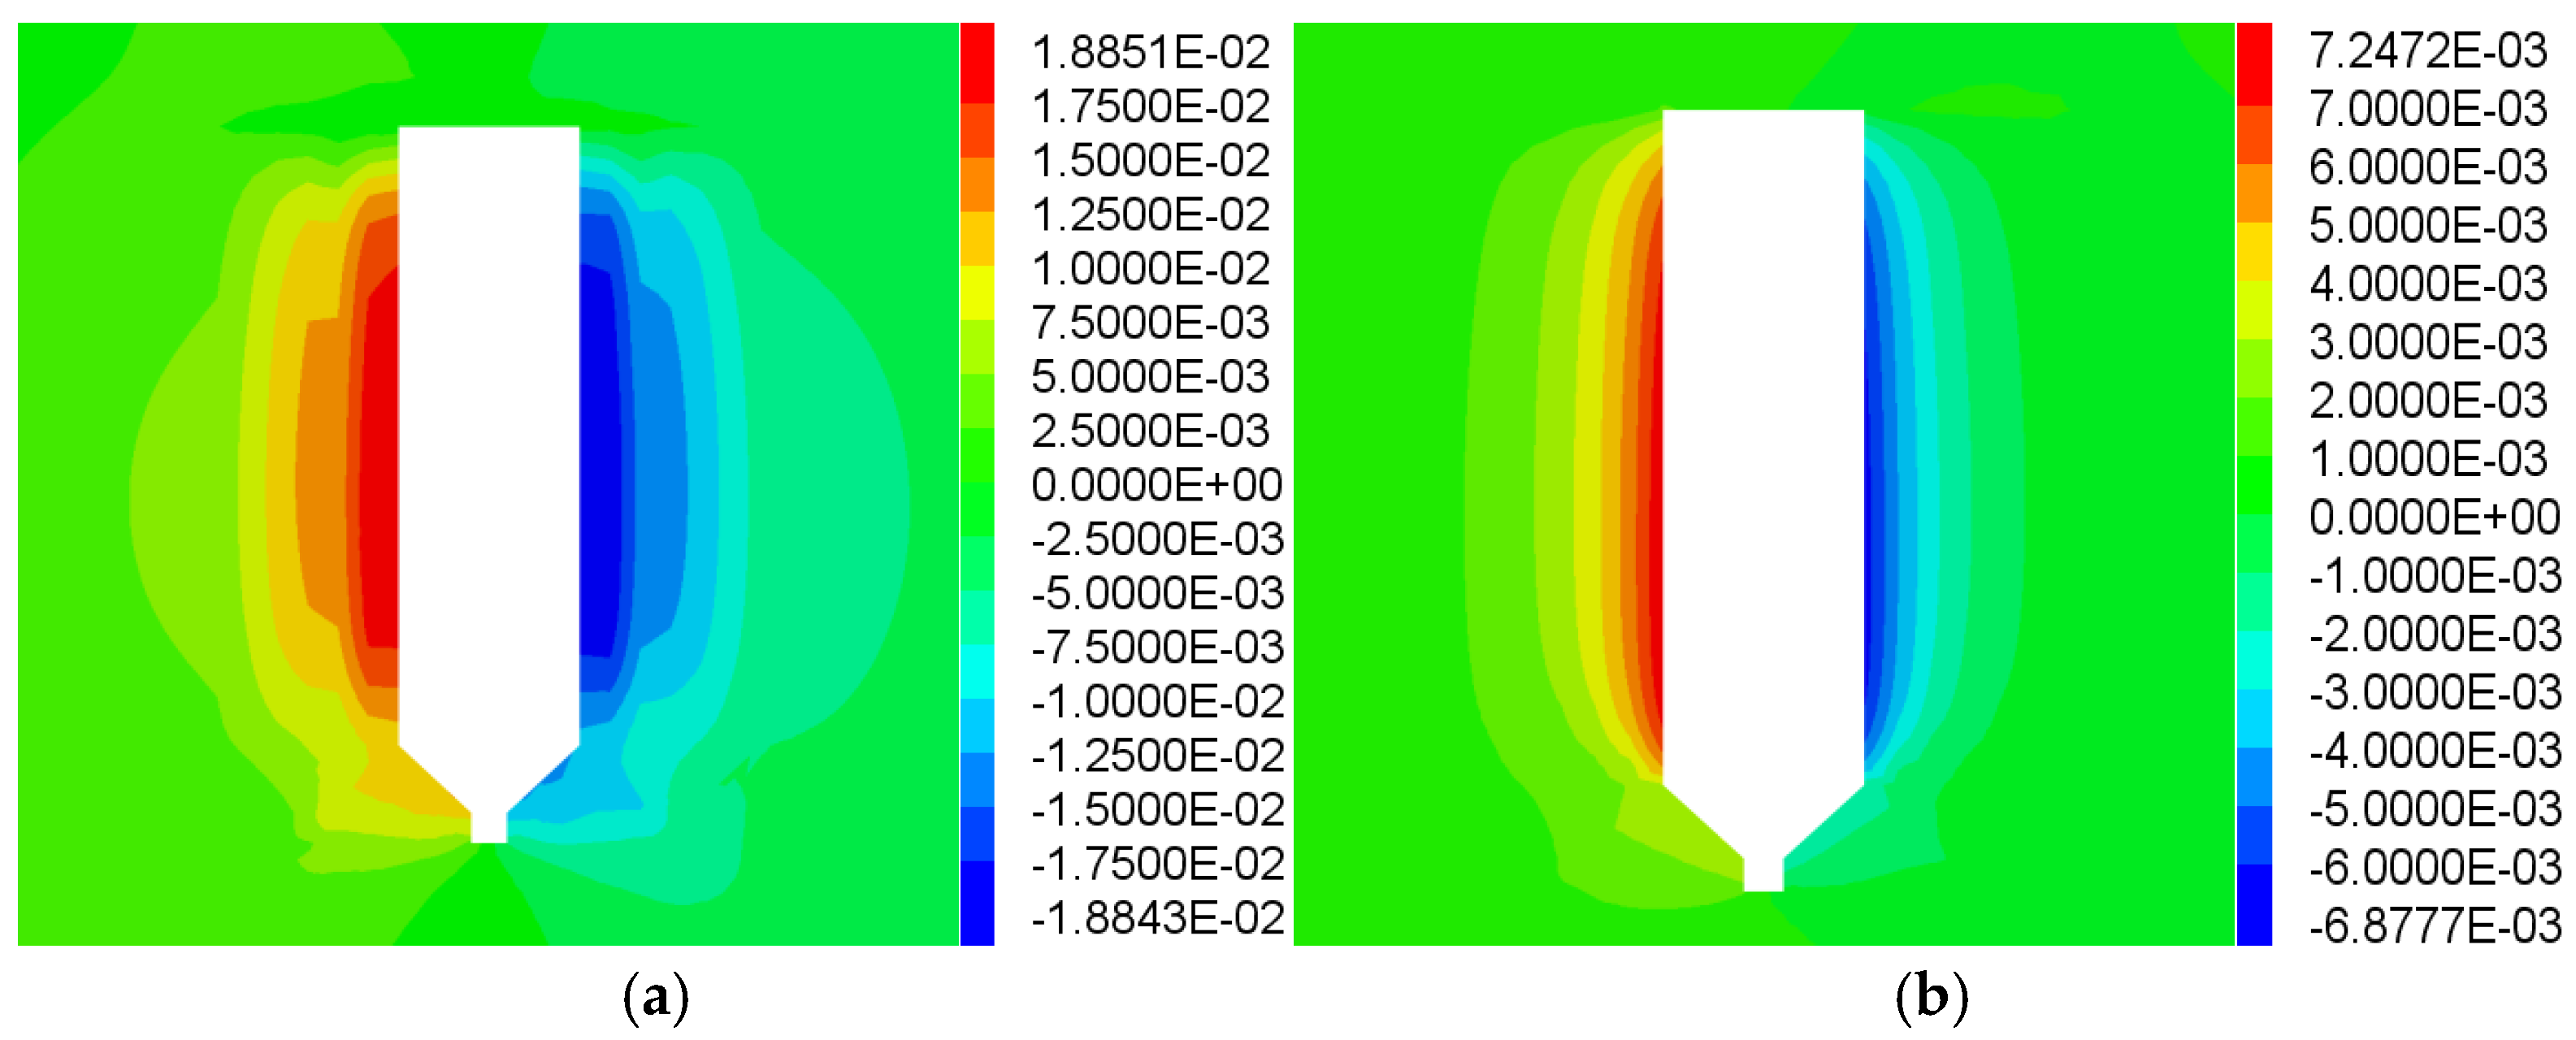
The stability of cemented backfill during secondary extraction depends on its response to coupled static and blast-induced loading, yet the required strength and dominant failure mechanisms remain uncertain. Using the Makeng Iron Mine as a case study, we combined mix-design tests, analytical strength assessment, split Hopkinson pressure bar (SHPB) tests, static and dynamic FLAC3D simulations, and field monitoring. A slurry mass concentration of 78% and a binder-to-tailings ratio of 1:8 produced a 28-day uniaxial compressive strength of 2.69 MPa. Six self-supporting models yielded a conservative design strength of 2.45 MPa, slightly higher than the theoretically estimated blast-transmitted stress of 2.40 MPa. In the SHPB tests, the dynamic peak stress increased from 4.09 to 19.15 MPa as the average strain rate rose from 50 to 152 s−1, while the dynamic increase factor increased from 1.52 to 7.12, demonstrating a pronounced rate-strengthening effect. Numerical simulations identified the orebody–backfill interfaces as the principal zones of stress-wave reflection, deformation incompatibility, and shear-dominated plastic deformation. Flexible mesh reinforcement reduced the maximum lateral displacement of the exposed backfill from 18.85 to 7.24 mm (61.60%) and reduced the extent of the shear-failure zone by approximately 39.72%. Field monitoring recorded a maximum lateral displacement of 8.97 mm, with no large-scale backfill instability observed. These findings provide a case-specific framework for selecting backfill strength and controlling interface instability under blasting disturbance.

1. Introduction

Against the backdrop of green mine development and the transition towards sustainable energy, the comprehensive utilization of solid waste has become an important approach to achieving safe, efficient, and environmentally responsible mining [1,2,3,4,5]. Mine tailings occupy substantial land and may give rise to dust emissions, acid mine drainage, metal leaching, and water contamination. Tailings recycling and ecological remediation are therefore essential for mitigating their long-term environmental impacts [6,7]. Cemented tailings backfill enables mine waste to be reused as an underground supporting material. It reduces the demand for surface tailings storage, improves ground control and ore recovery, and mitigates surface subsidence, making it an important technology for sustainable underground mining [8,9,10].
The Makeng Iron Mine employs a sublevel subsequent cemented backfilling mining method with an alternating extraction sequence. After the primary stopes are mined and backfilled, secondary pillars are extracted once the backfill has attained the required design strength. Although this method improves ore recovery and mining efficiency, the exposed backfill must remain stable under mining-induced stress redistribution and the loads associated with the filling sequence [11,12]. Its stability is also influenced by construction layering, material composition, curing conditions, blasting in adjacent stopes, and interactions between the pillars and backfill [13,14,15,16]. Under repeated large-diameter deep-hole blasting, the backfill is subjected to coupled static and dynamic loading. Owing to the significant contrast in mechanical properties between the surrounding rock and the cemented backfill, blasting-induced stress waves are reflected and transmitted at the interface, resulting in localized stress concentration, crack initiation, and progressive damage [17,18,19,20,21]. The accumulation of blasting damage may ultimately lead to local instability or collapse of the exposed backfill, thereby increasing ore dilution and waste rock mixing [22,23].
Although considerable research has been conducted on the mechanical properties, strength development, and mix proportion optimization of cemented backfill, relatively limited attention has been paid to its dynamic behavior during secondary extraction. Recent quantitative studies have shown that stress-wave reflection and transmission at the backfill–rock interface can cause localized strain concentration and progressive damage, with near-field peak volumetric strain decreasing by approximately 26% across the interface and sonic-velocity losses reaching 8–13% [24,25]. However, these interface effects have rarely been considered in backfill design together with mining-induced static stresses. To address this gap, this study integrates laboratory experiments, theoretical analysis, numerical simulation, and field monitoring to investigate the deformation and failure of cemented backfill under coupled static–dynamic loading. Based on the results, a practical backfill strength design method and stability control strategy are proposed and verified through field application.

2. Materials and Methods

2.1. Test Materials and Preparation

2.1.1. Test Materials

(1)
Tailings
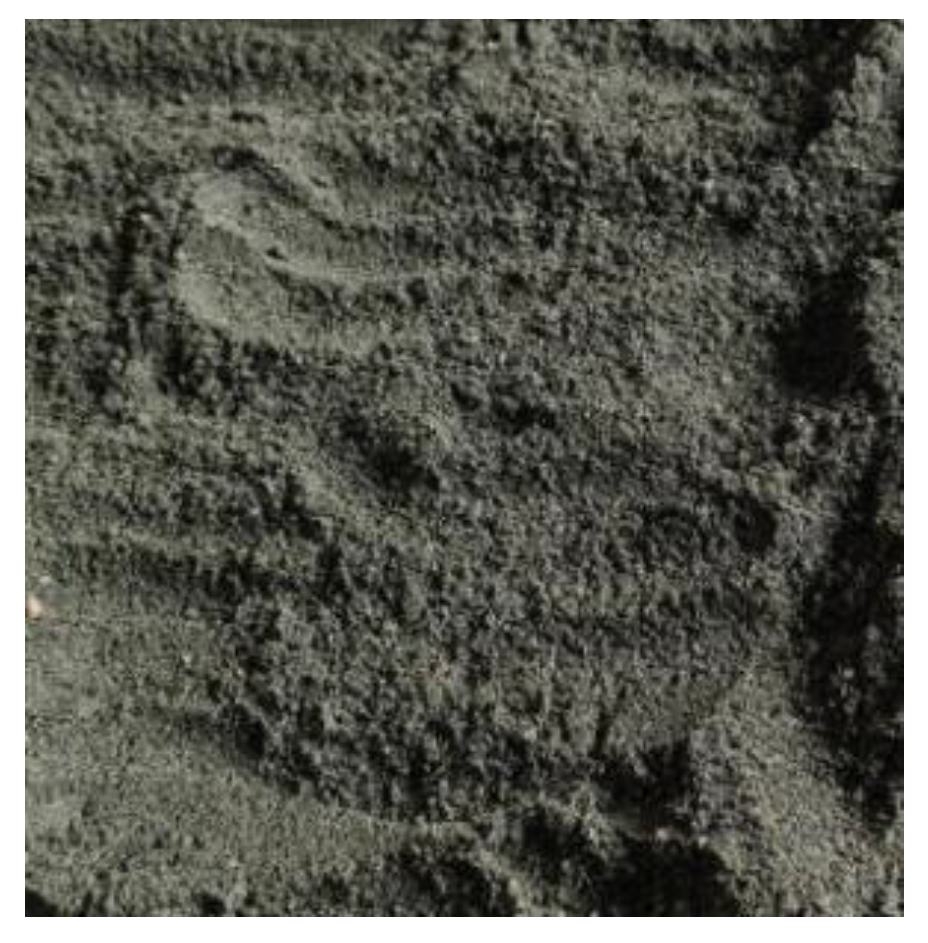
Tailings are the waste materials discharged from mineral processing plants after ore grinding and the extraction of valuable components under specific economic conditions. In this study, tailings from the Makeng Iron Mine were selected as the aggregate material. As shown in Figure 1, the tailings used in this experiment are predominantly fine-grained. The coefficient of uniformity (Cu) and the coefficient of curvature (Cc) are 31.88 and 1.88, respectively, satisfying the criteria Cu ≥ 5 and 1 < Cc < 3. These results indicate that the tailings exhibit well-graded particle size distribution, which is favorable for their application in cemented backfill materials [26,27].
C u = d 60 d 10
C c = ( d 30 ) 2 d 10 × d 60
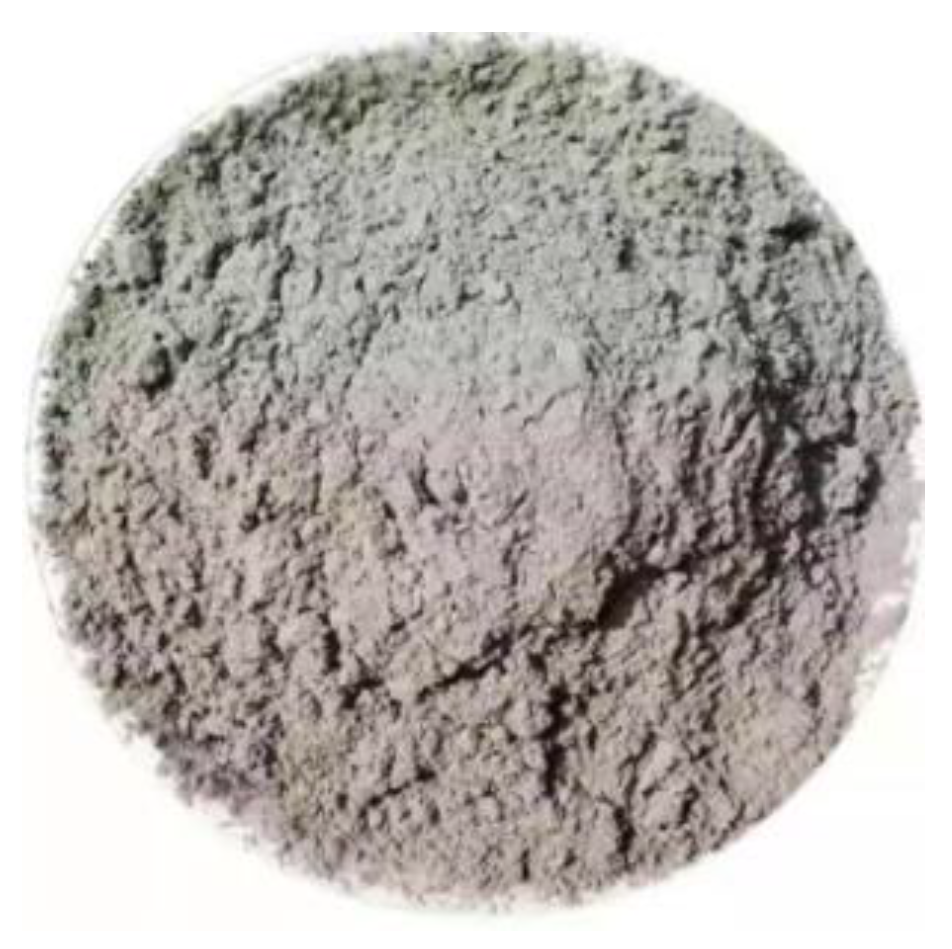
The chemical composition of the iron ore tailings is presented in Table 1. X-ray fluorescence spectroscopy (XRF) was employed to determine the concentrations of major chemical components in the tailings, providing a scientific basis for their subsequent utilization and treatment. The detailed results are summarized in Table 1, and a photograph of the tailings sample is shown in Figure 2. The moisture content of the tailings ranges from 12% to 18%. Prior to testing, the samples were initially air-dried and subsequently oven-dried until a constant mass was achieved to ensure experimental accuracy and repeatability.
(2)
Cement
The cement used in this study was P.O 42.5 composite Portland cement, consistent with that applied in the engineering practice at the Makeng Iron Mine. The P.O 42.5 composite Portland cement used in this study is shown in Figure 3. This cement is a hydraulic binder composed of Portland cement clinker, blended materials, and an appropriate amount of gypsum, and is characterized by relatively high early strength development. Table 2 presents the X-ray fluorescence (XRF) analysis results, indicating that CaO, SiO2, Fe2O3, and Al2O3 are the primary chemical constituents of the cement. These oxides exhibit latent hydraulic and pozzolanic reactivity and can be partially activated under alkaline conditions. In such environments, silicate and aluminosilicate phases undergo bond breakage and depolymerization, followed by hydration and polycondensation reactions, ultimately forming calcium silicate hydrate and calcium aluminate hydrate products with cementitious properties. This process significantly enhances the mechanical strength and durability of the backfill material.

2.1.2. Preparation of Test Materials

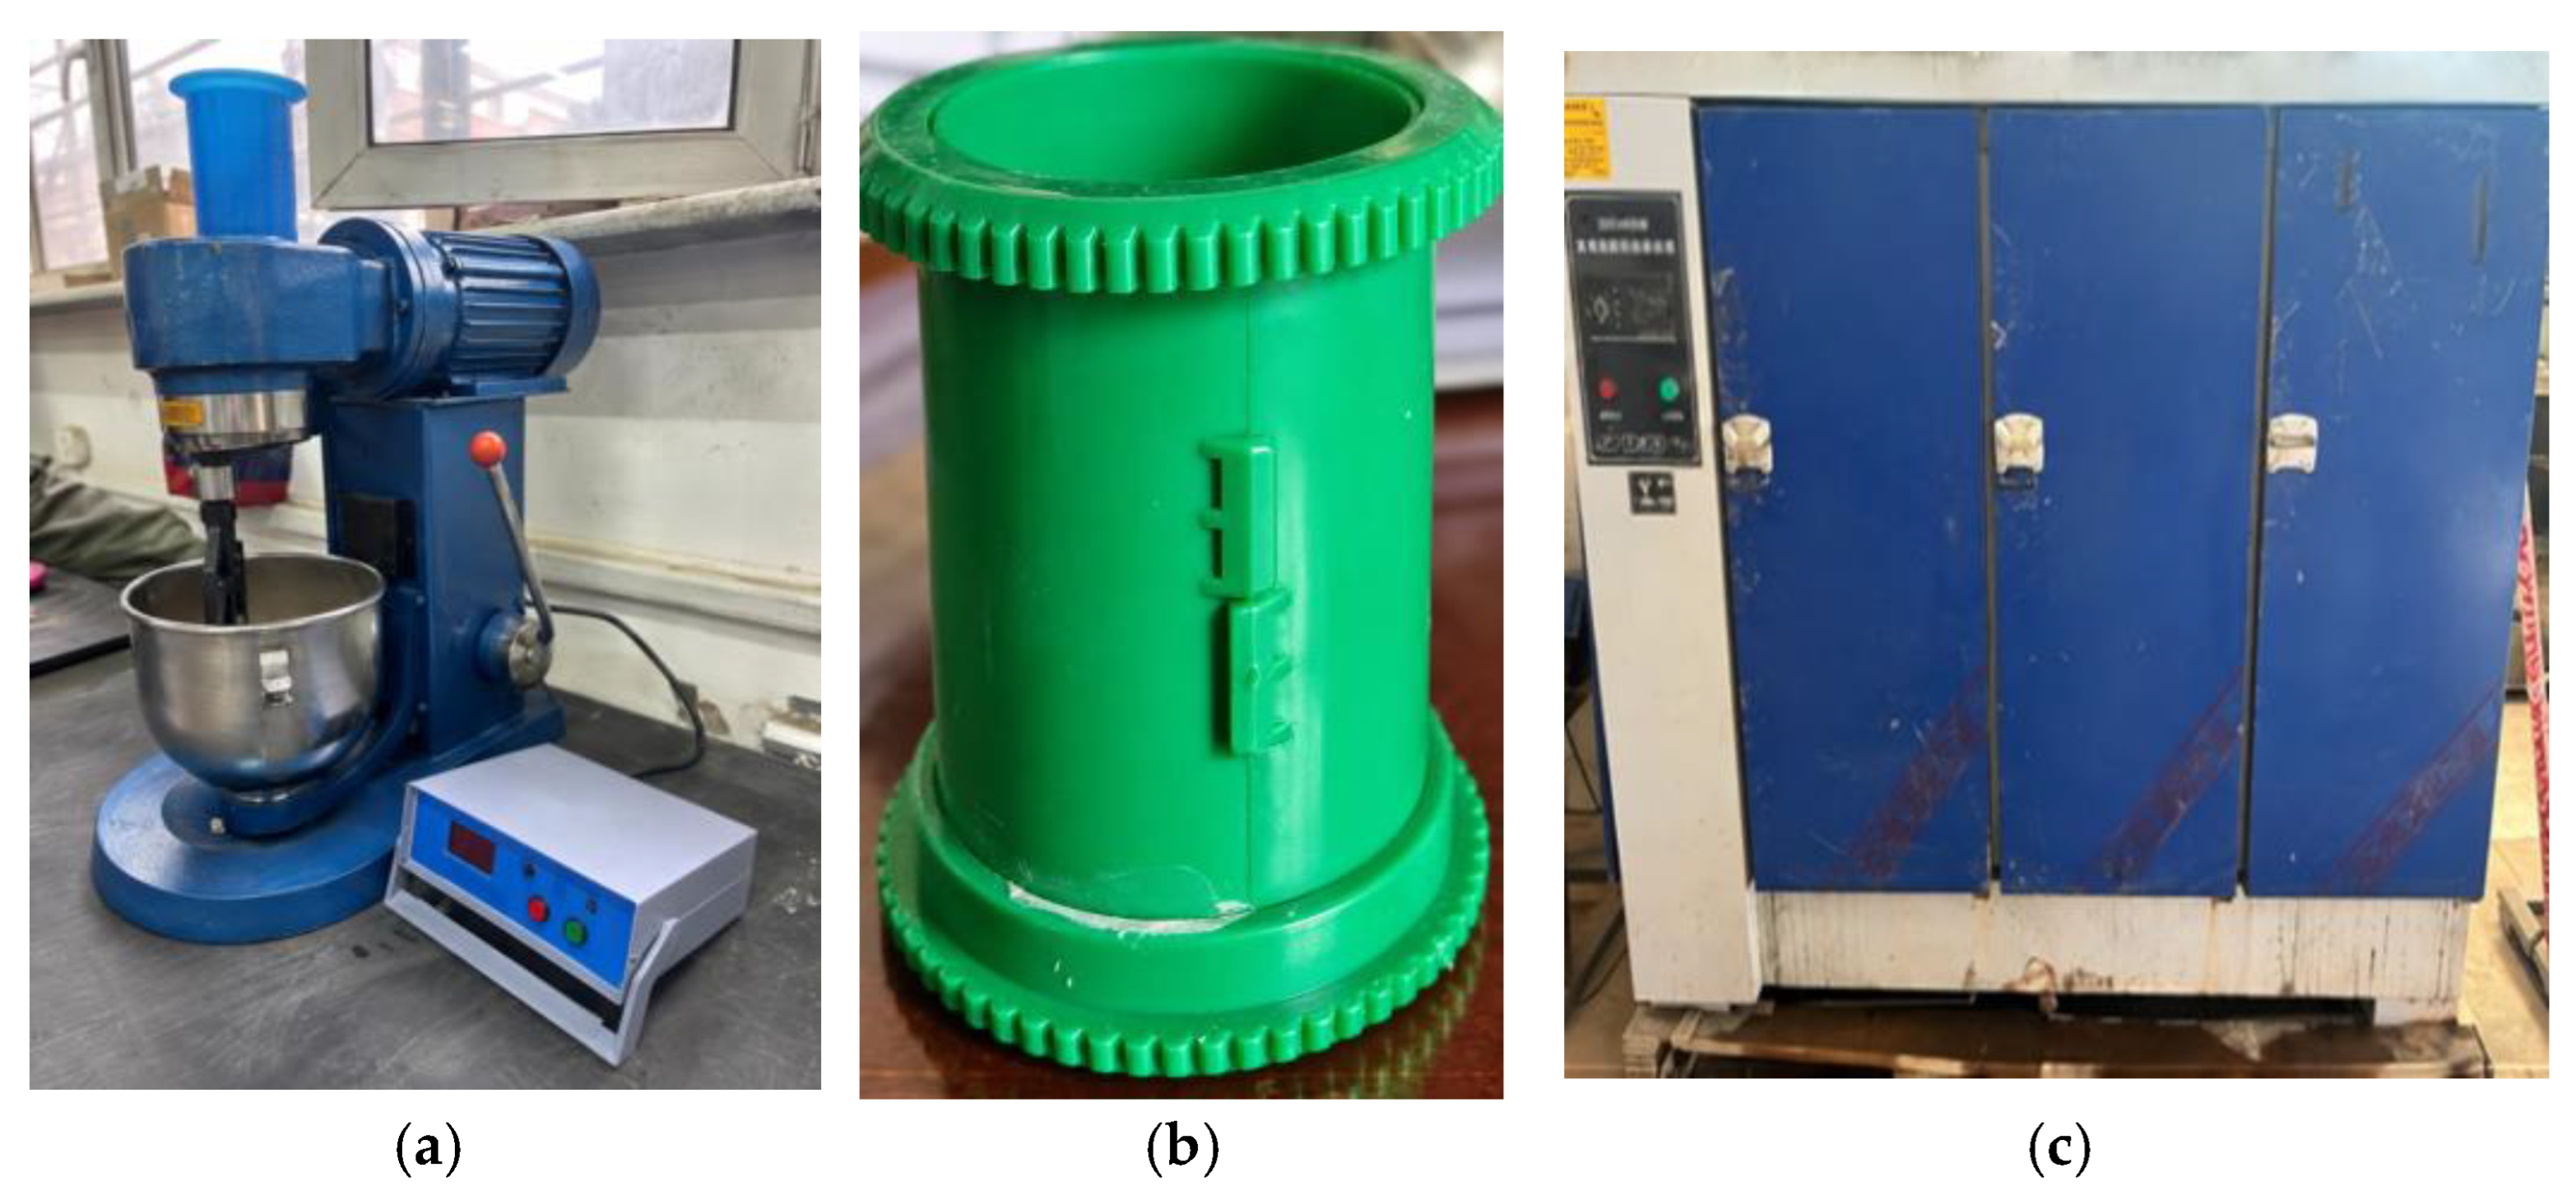
The binder-to-tailings ratios of the backfill slurry were set at 1:4, 1:6, 1:8, and 1:10. Standard detachable molds were used for specimen preparation. The specimen preparation process is shown in Figure 4. All materials were accurately weighed and thoroughly mixed using a mortar mixer, after which the fresh mixture was cast into the molds. The specimens were demolded 24 h after casting and then transferred to a standard curing chamber (20 ± 1 °C, relative humidity > 90%) for 28 days of curing. After reaching the designated curing age, the specimens were subjected to mechanical testing. Three replicate specimens were prepared for each test group, and the compressive strength results are reported as mean ± standard deviation in Table 3. To systematically investigate the factors governing the mechanical behavior of cemented tailings backfill, a single-factor control variable method was employed. The binder-to-tailings ratio and mass concentration were selected as the primary influencing parameters, while the slump and 28-day uniaxial compressive strength were used as evaluation indices. Under the premise of satisfying pipeline transport performance requirements, the optimal mix design parameters of the backfill were determined, providing a reliable basis for engineering design and field application.

2.2. Static Mechanical Testing

2.2.1. Natural Sedimentation Characteristics of Full Tailings Aggregate

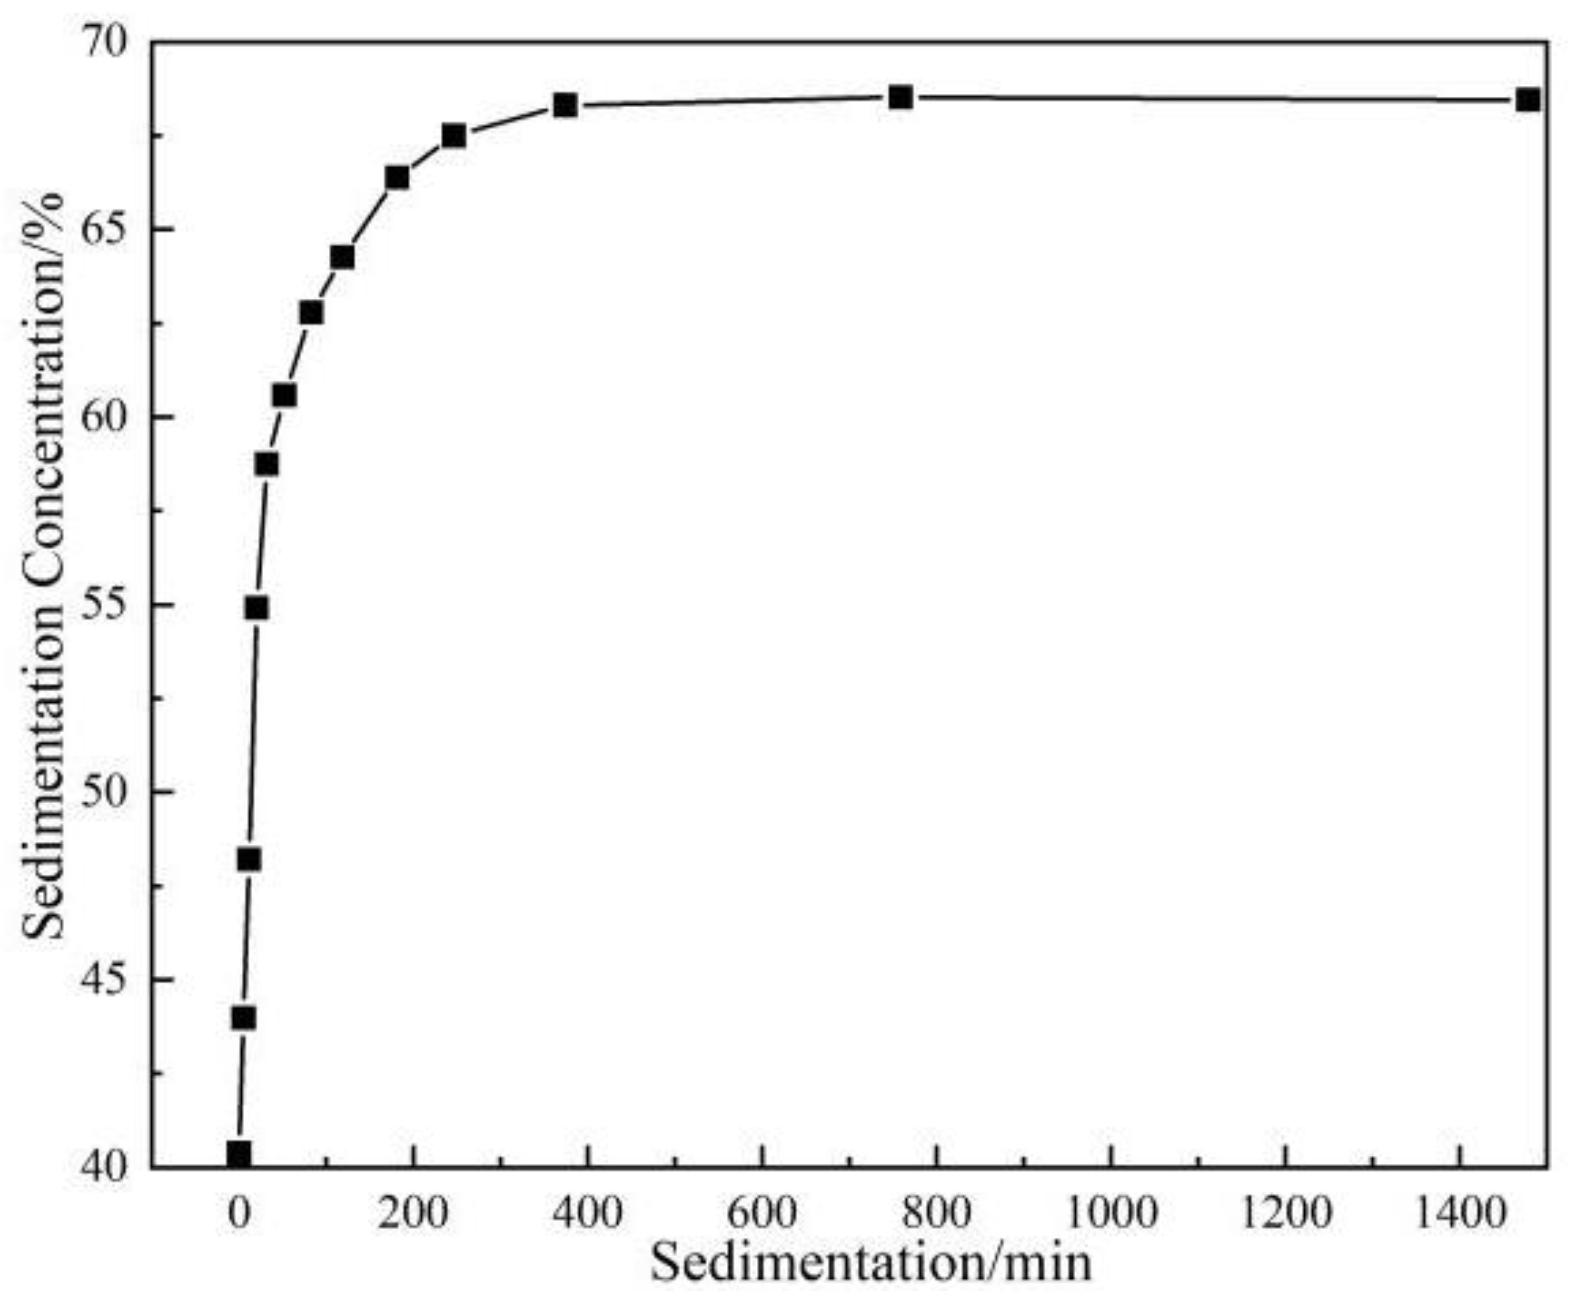
Tailings are the main solid component of the backfill slurry, and their physical properties influence slurry workability. Conducting sedimentation analysis prior to the strength testing of cemented backfill not only facilitates optimization of the experimental design, but also provides a theoretical basis for slurry performance regulation and mix proportion optimization. Figure 5 shows that the tailings slurry concentration increases with sedimentation time and gradually approaches a stable value. After reaching sedimentation equilibrium, the slurry concentration stabilizes at approximately 68.9%. This sedimentation behavior affects the static stability of the slurry and ultimately governs the mechanical properties of the cemented backfill [28].

2.2.2. Slump Test

The flowability of the backfill slurry is critical to efficient pipeline transport, and slump is a key indicator of its flow performance. In general, a higher slump indicates better flowability; however, the cohesion and water retention properties of the slurry must also be considered to ensure stable transport behavior. The slump test was conducted in accordance with the Standard Test Methods for Properties of Ordinary Concrete Mixes (GB/T 50080-2016 [29]). The slump value was determined by measuring the vertical distance between the highest point of the specimen and the top edge of the mold immediately after the lifting of the cylinder.
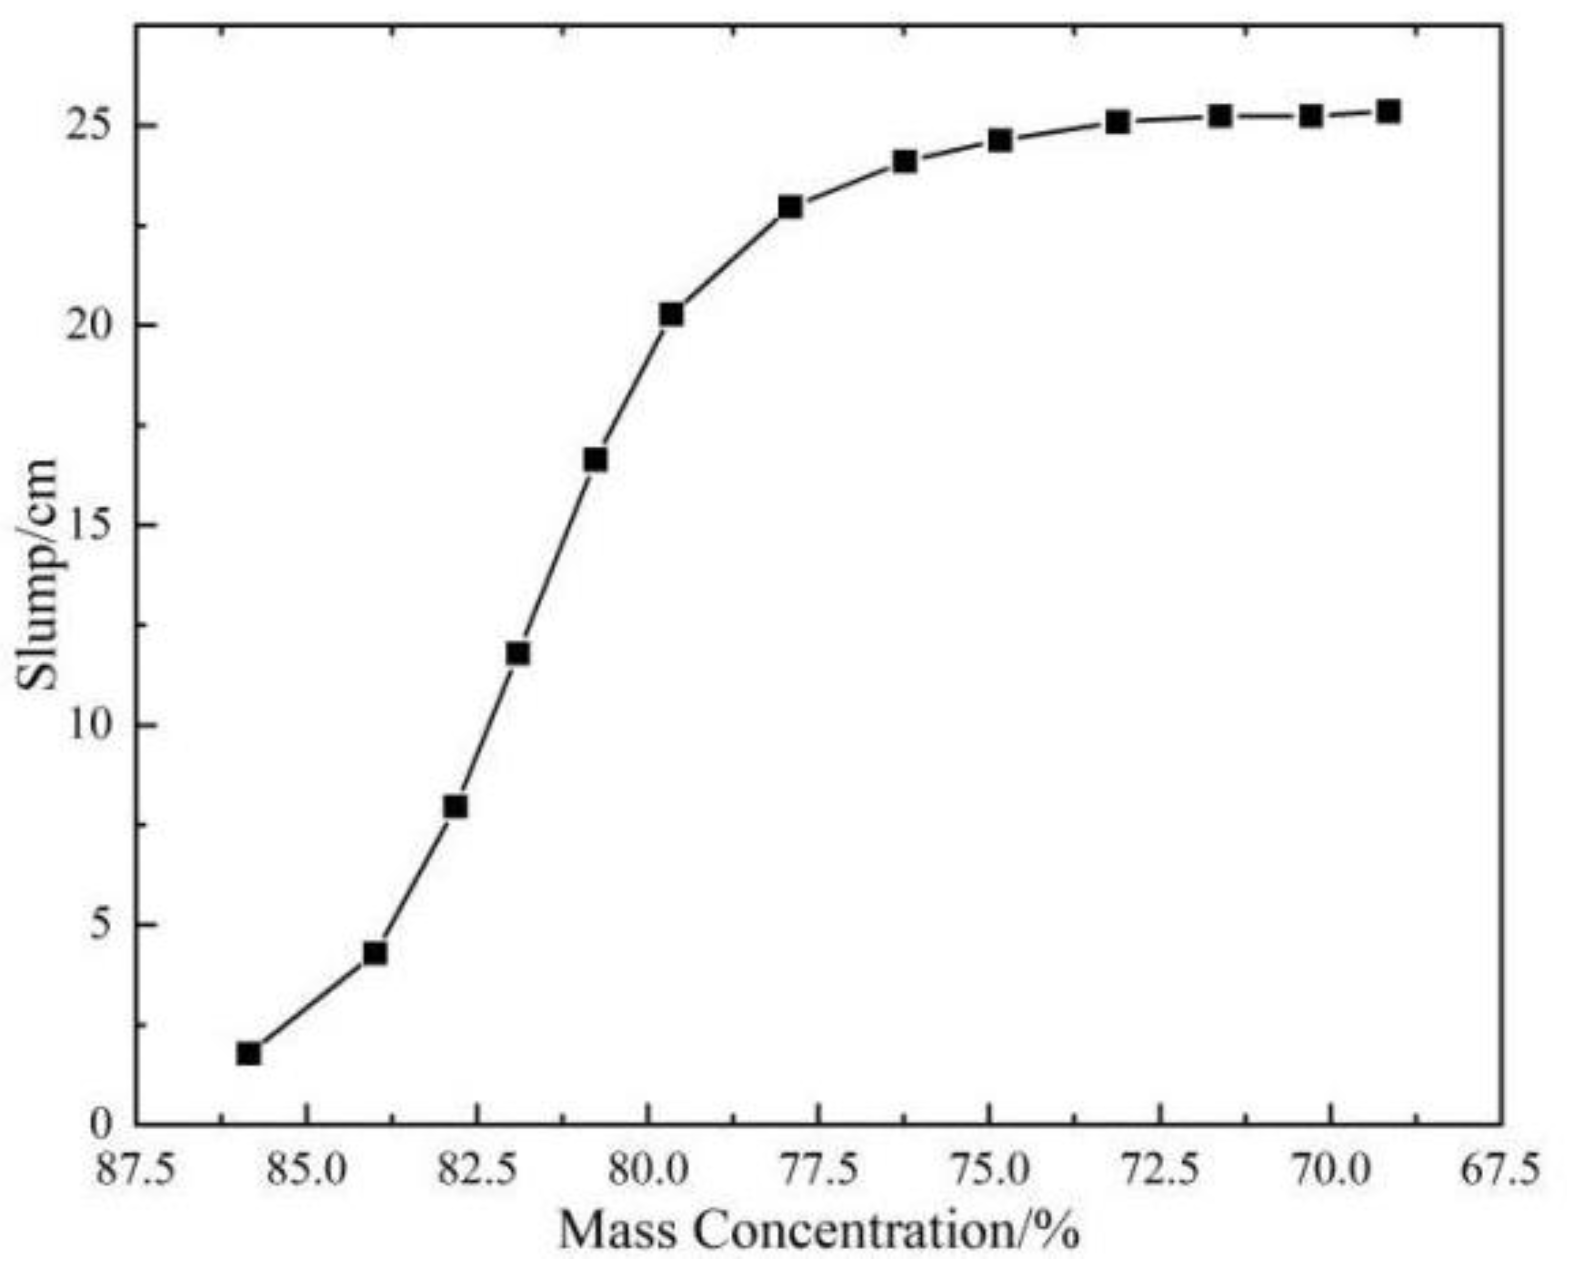
The slump test results are shown in Figure 6. The slump test results of the full tailings from the Makeng Iron Mine indicate that the slump decreases gradually with increasing slurry mass concentration. This trend can be attributed to the reduction in water content at higher concentrations, which leads to increased slurry viscosity and enhanced interparticle friction, thereby reducing flowability. Previous studies have shown that the optimal slump range for backfill slurry is 15–30 cm. When the slump exceeds 19 cm, the slurry can satisfy both pumpable and gravity-assisted transportation requirements, effectively minimizing the risk of pipeline blockage. Based on the experimental results, a slurry mass concentration range of 72–78% was determined to be appropriate for subsequent strength testing of the cemented backfill material.

2.2.3. Static Uniaxial Compressive Strength Test

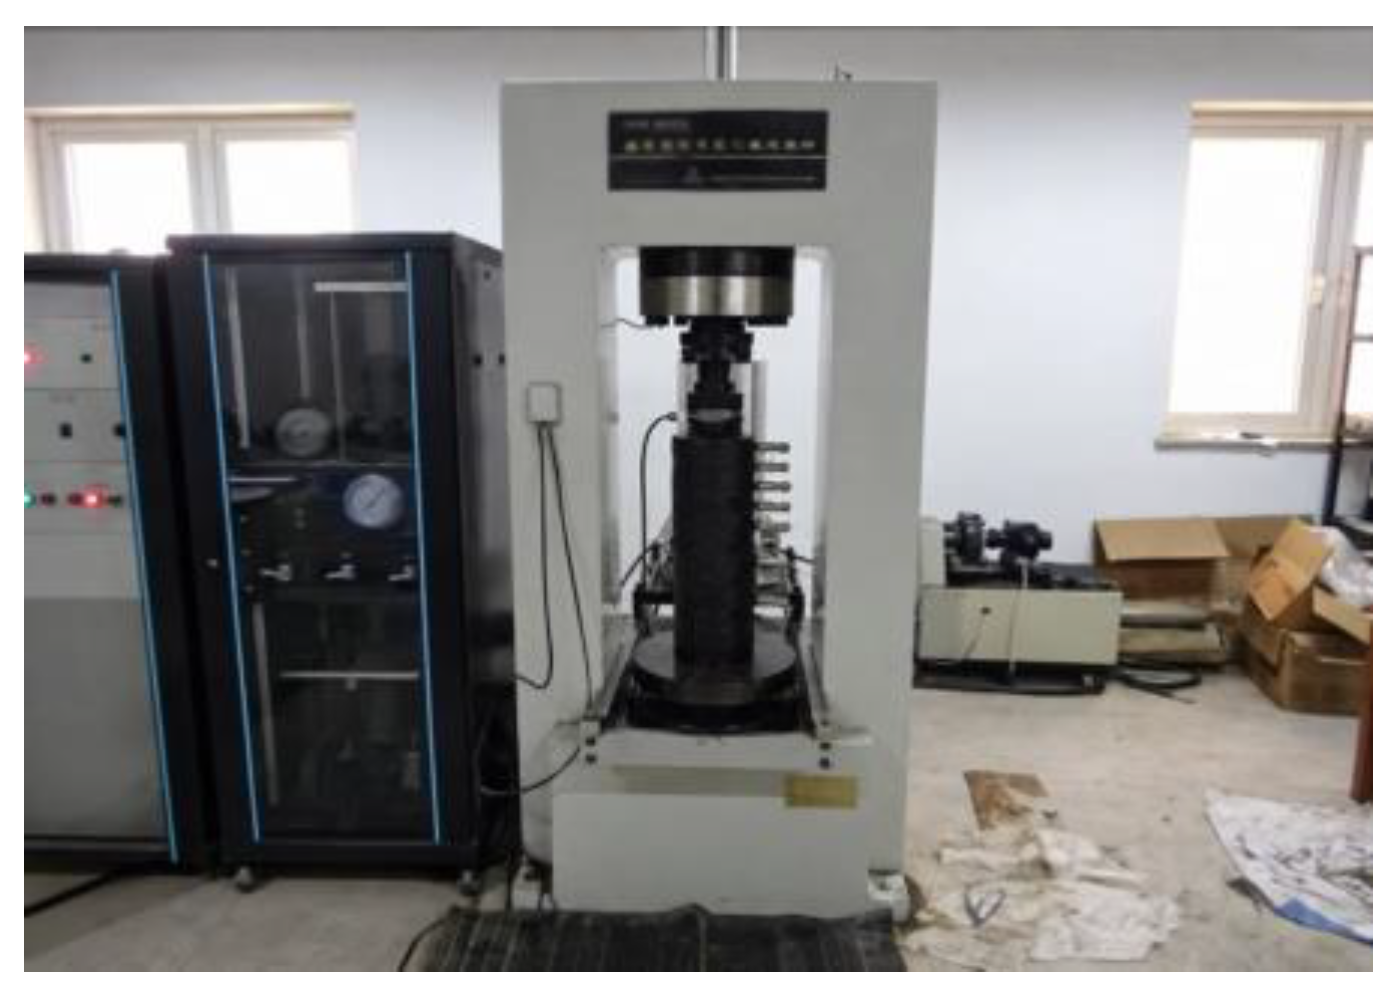
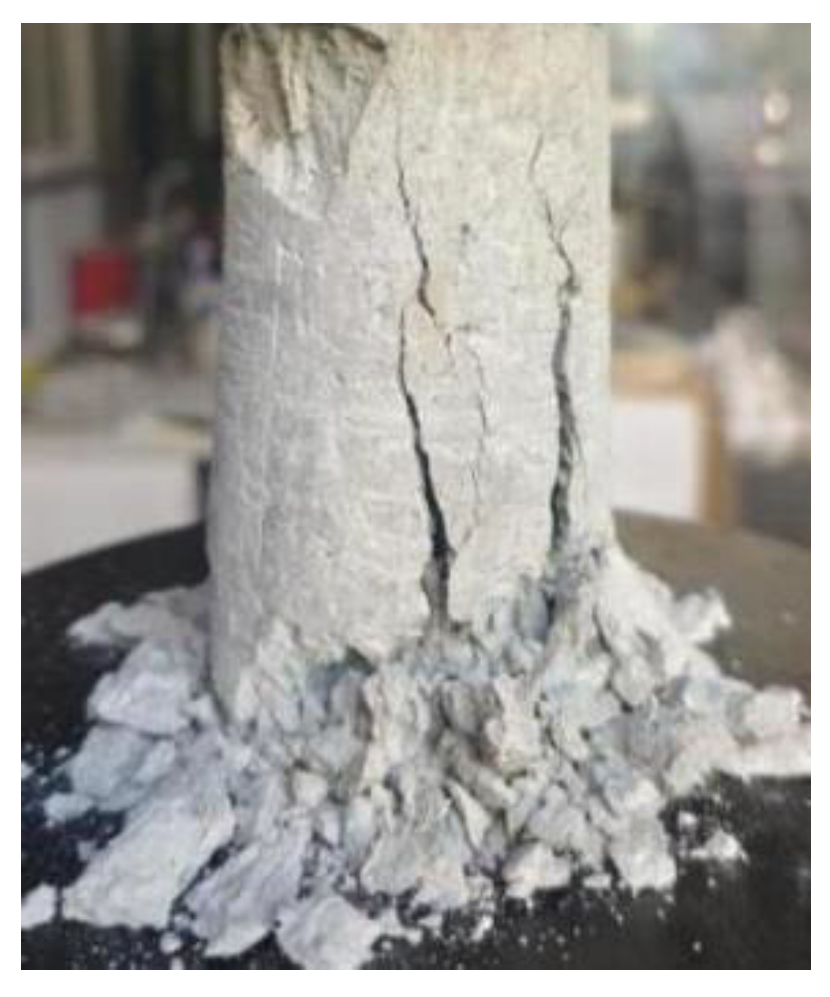
This test was conducted in accordance with the Technical Standards for Backfilling Engineering in Metal and Non-Metal Mines (GB/T 51450-2022 [30]). The primary testing parameter was the compressive strength of the backfill specimens. All tests were carried out in the laboratory of the School of Mechanics and Engineering, Liaoning Provincial College of Communications. A WDW-200 microcomputer-controlled electronic universal testing machine (KASON Testing Equipment Co., Ltd., Jinan, China) was employed for the experiments, as shown in Figure 7. Figure 8 presents the setup of the uniaxial compression test. The cohesion and internal friction angle were obtained through Mohr-Coulomb fitting based on direct shear test results under different normal stresses.
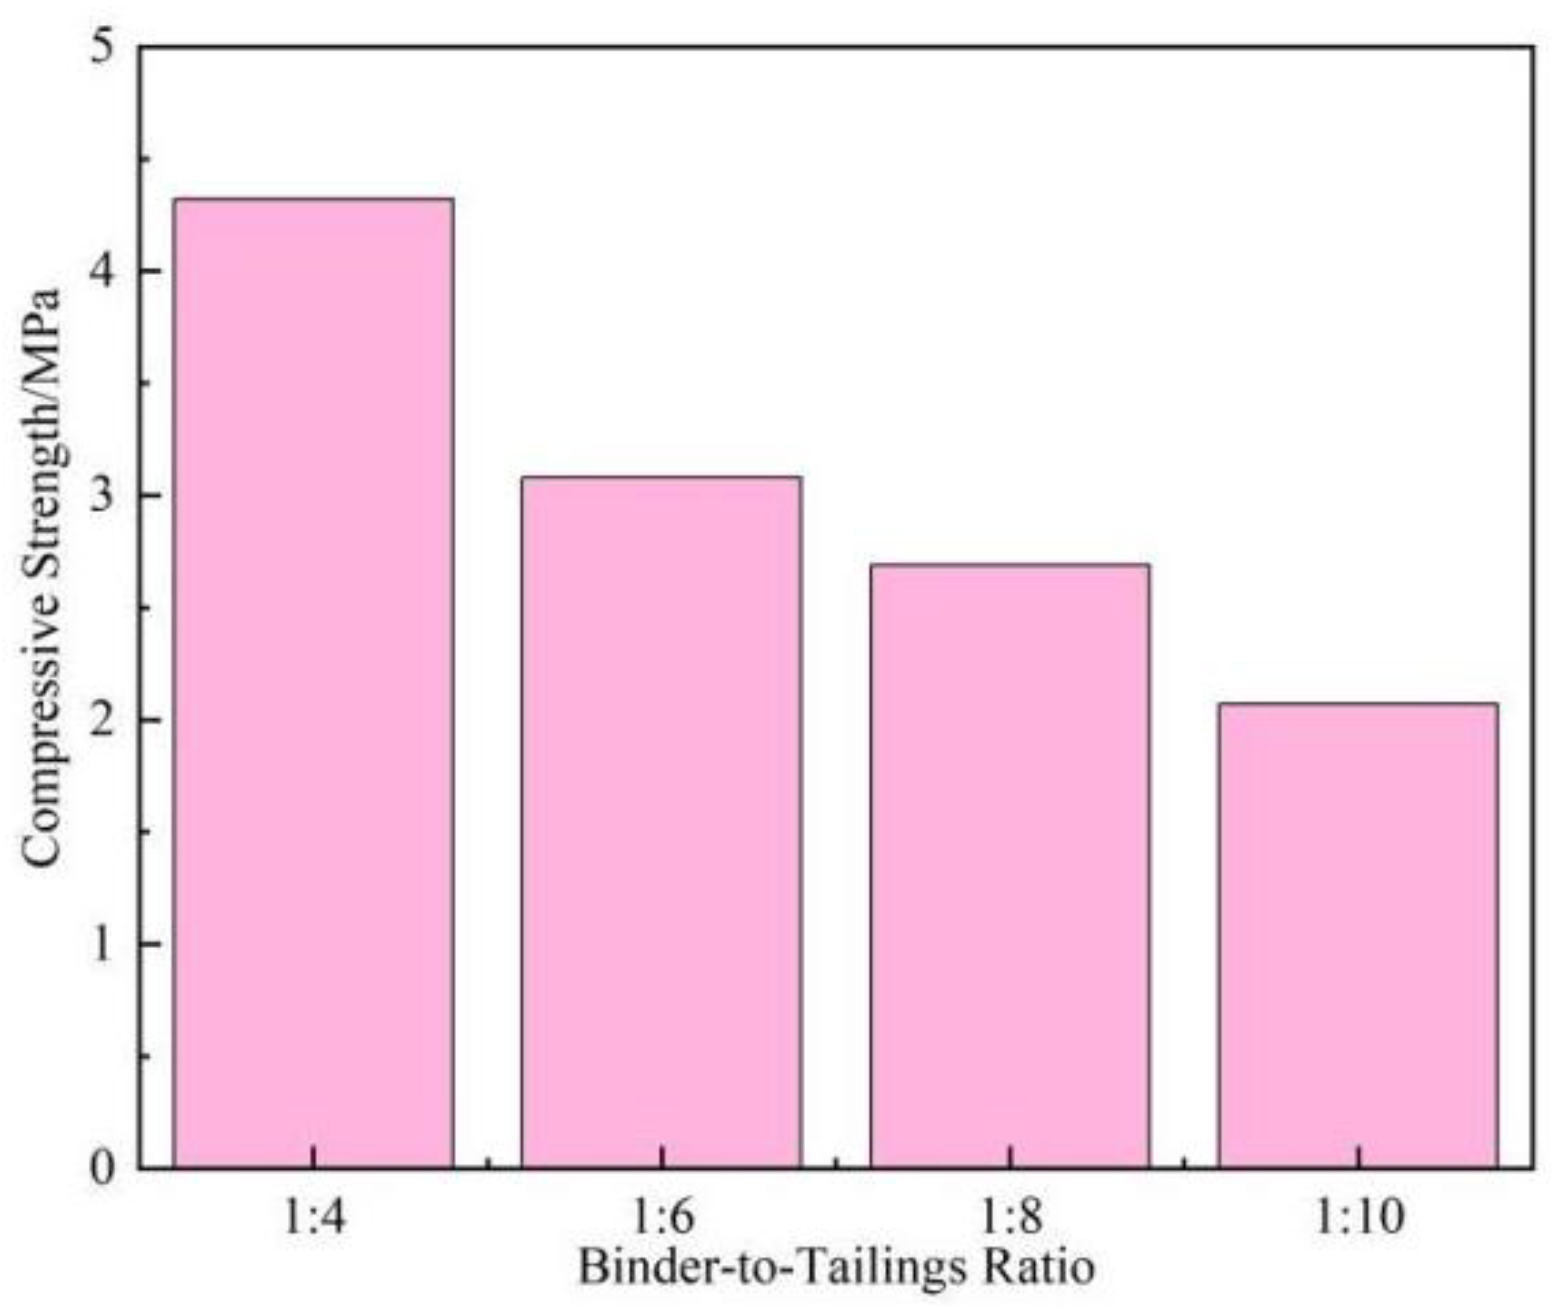
The influence of the binder-to-tailings ratio on the mechanical properties of the backfill arises from variations in the proportion of aggregate to cementitious material. Based on the experimental data presented in Table 3, the variation in the uniaxial compressive strength of the backfill under different binder-to-tailings ratios was plotted, as shown in Figure 9.
Taking the mix with a mass concentration of 78% and a binder-to-tailings ratio of 1:4 as the reference case, the 28-day uniaxial compressive strength of the specimens decreased by 28.70%, 37.73%, and 52.08%, respectively, as the binder-to-tailings ratio was reduced. At the same curing age, the uniaxial compressive strength exhibits a continuous declining trend with decreasing cement content. This behavior can be attributed to the reduced proportion of cementitious material at lower binder-to-tailings ratios, which increases the relative content of tailings aggregate and consequently enlarges the overall specific surface area of the composite matrix. As a result, the cement paste coating surrounding the aggregate becomes thinner, leading to a weakened interfacial bonding capacity. Ultimately, these microstructural changes result in a significant reduction in the uniaxial compressive strength of the backfill.
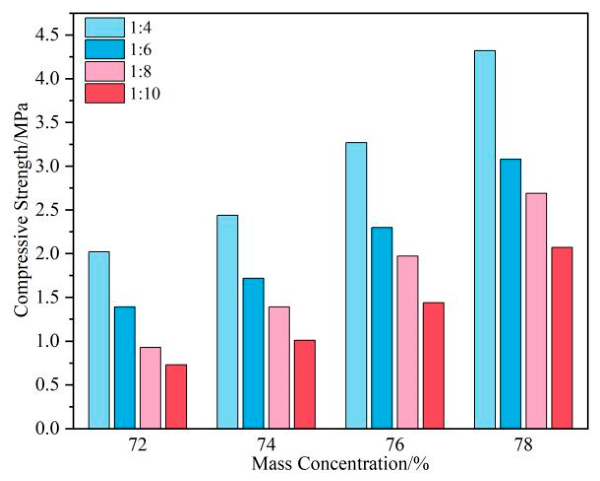
The influence of mass concentration on the mechanical properties of the backfill is primarily reflected in variations in the water-to-binder ratio. As the mass concentration increases, the water content of the slurry decreases while its viscosity increases, leading to a denser backfill structure. As shown in Figure 10, the uniaxial compressive strength of the backfill increases progressively with increasing mass concentration. Taking specimens with a curing age of 28 days and a binder-to-tailings ratio of 1:4 as an example, the uniaxial compressive strength increased by 21.78%, 61.88%, and 113.86%, respectively, as the mass concentration increased. Considering both workability and mechanical performance, a mass concentration of 78% was selected for subsequent experiments to ensure sufficient strength development of the backfill.
Specimens with different binder-to-tailings ratios and a mass concentration of 78% were prepared for testing of relevant physical and mechanical properties. All tests were conducted using a WDW-200 microcomputer-controlled electronic universal testing machine. Uniaxial compression tests were performed at a loading rate of 0.5 mm/min using standard cylindrical specimens with dimensions of 50 mm in diameter and 100 mm in height. Brazilian splitting tensile tests were carried out using disc specimens with dimensions of 50 mm in diameter and 25 mm in height. The measured physical and mechanical parameters are presented in Table 4.

2.3. Backfill Strength Requirement and Dynamic Performance Evaluation

2.3.1. Calculation of the Self-Supporting Static Strength of Mine Filling Materials

To further verify and determine the required strength of the primary-stage backfill under actual mining conditions, the backfill strength at different depths below its top surface was calculated using the Thomas model [31], Terzaghi model [32], Janssen equation [33], Mitchell method [34], overburden load-bearing method [35], and Cai Sijing empirical formula [36].
Thomas’s computational model accounts for the frictional interaction between the backfill material and the surrounding rock walls. Provided that the length L of the backfill is no less than half of its height h, the vertical stress σ v within the backfill is calculated as follows:
σ v   =   γ h 1   +   h / L
where: σ v is the vertical stress in the backfill, MPa;
L is the length of the backfill, m;
γ is the unit weight of the backfill, taken as 0.021 MN/m3.
Compared with the three-dimensional model, the Terzaghi two-dimensional model provides a more conservative and safer estimation, and is therefore more widely adopted in engineering practice. The calculation formula is expressed as follows:
σ v   =   D A 1     e Ah
A = 2 k L tan φ
D = γ     2 c L
k = 1   sin φ
where: c is the cohesion of the backfill body, MPa;
φ is the internal friction angle of the backfill material, °;
k is the lateral pressure coefficient of the backfill body;
A is the attenuation coefficient;
D is the equivalent unit weight correction coefficient of the backfill body.
The Mitchell method considers the frictional resistance developed at the interface between the backfill and the surrounding rock mass, assuming that the interfacial friction can partially sustain the self-weight of the backfill. The corresponding calculation formula is expressed as follows:
σ v   =   γ H k 1 tan β + H L 1
where: β is the slip angle, taken as 35°;
k1 is the safety factor, taken as 2.0.
The Yang Xin empirical formula is used to calculate the vertical stress σ v within the backfill body, expressed as follows:
σ v = γ F λ ( S F ) t a n δ [ 1 e λ S t a n δ F H ]
where: S is the perimeter of the backfilled stope, taken as 210 m;
F is the horizontal cross-sectional area of the filled stope, taken as 1350 m2;
δ is the friction angle between the backfill and the surrounding rock mass, taken as 18°;
λ is the lateral pressure coefficient, taken as 0.36.
The overburden load-bearing method based on rock mechanics is used to calculate the vertical stress σ v within the backfill body, and the corresponding formula is expressed as follows:
σ v   =   k w γ
where: kw is the gravity coefficient of the overlying backfill, taken as 0.90.
The formula for calculating the vertical stress in the backfill using the Cai Sijing empirical method is as follows:
σ v   =   a H 2 3
where: a is an empirical coefficient, taken as 1000.
The maximum strength predicted by the six theoretical and empirical models was adopted as the analytical design strength. The calculated strength values obtained from the six models are summarized in Table 5. Laboratory strength development, slurry transport performance, and field construction conditions were also considered when selecting the backfill mixture. The analytical strength requirement was therefore assessed together with these experimental and practical considerations rather than used as the sole basis for mixture selection.

2.3.2. Dynamic Strength Calculation of Stope Backfill Under Blasting Disturbance

In the large-diameter deep-hole stopes of Makeng Iron Mine, the mining height is approximately 55 m in the western area and 68 m in the eastern area. The lower sections are extracted using medium-length blast holes, whereas the upper sections adopt large-diameter deep-hole blasting. The blasting parameters of the lower sections are consistent with those used in the sublevel open stoping with subsequent backfilling method. For the upper large-diameter deep-hole blasting, No. 2 rock emulsion explosive (ϕ130 mm × 420 mm, 6 kg per cartridge) was employed. The perimeter holes adopted a coupled deck charging structure with a blasthole diameter of 150 mm and a linear charge concentration of 17.66 kg/m. A combined initiation system of electronic detonators and detonating cord was used. To reduce blasting-induced disturbance to the backfill, a hole-by-hole and row-by-row delay blasting scheme was implemented, with delay intervals of 25 ms between adjacent holes and 70 ms between rows. The hole spacing was 2.5 m, and the charging coefficient was 38.65%. The calculated total explosive charge of the upper perimeter holes was approximately 239 kg in the western area and 294 kg in the eastern area.
During secondary stope blasting, larger explosive charges in the perimeter holes and shorter distances between the blasting holes and the backfill can significantly intensify blasting-induced damage to the backfill. When the transmitted stress generated by the blasting shock wave exceeds the strength of the backfill, instability and collapse of the backfill may occur. The relationship among transmitted stress, explosive charge amount, and blasting-center distance is expressed in Equations (12)–(14) [37,38].
σ t   = 2 γ 2 c 2 γ 2 c 2 + γ 1 c 1   ×   σ r
σ r = γ 1 c 1 v g   ×   1 0 5
V = K Q 3 r 1 α
where: σ t is the transmitted stress of the shock wave within the backfill body, MPa;
γ1 is the density of the ore body, g/cm3;
c1 is the longitudinal wave velocity of the ore body, m/s;
γ2 is the density of the backfill body, g/cm3;
c2 is the longitudinal wave velocity of the backfill body, m/s;
σr is the incident dynamic pressure of the shock wave at the interface between the backfill body and the orebody wall, MPa;
g is the gravitational acceleration, taken as 9.8 m/s2;
v is the peak particle vibration velocity (PPV) induced by blasting seismic waves, cm/s;
K and α are empirical blasting attenuation parameters adopted from the literature, with values of 150 and 1.3, respectively. These values were used for the present engineering calculation and were not calibrated against site-specific vibration measurements at the Makeng Iron Mine.
Q is the total explosive charge of the perimeter holes, kg;
r is the perpendicular distance between the charge center of the perimeter holes and the boundary of the backfill body, m.
According to the previous analysis, the average density and longitudinal wave velocity of the ore body in Makeng Iron Mine are 3.8 g/cm3 and 7340 m/s, respectively, whereas those of the backfill body are 2.12 g/cm3 and 1570 m/s, respectively. Under upward fan-shaped medium-length hole blasting conditions, the maximum perimeter-hole charge is 100 kg. For large-diameter deep-hole blasting, the maximum perimeter-hole charge reaches 294 kg in the eastern area and 239 kg in the western area. When the transmitted stress induced by blasting shock waves exceeds the strength of the backfill, cracks initiate within the backfill body. Under the cumulative damage caused by repeated cyclic blasting, these cracks progressively propagate and may ultimately result in instability and collapse of the backfill. Therefore, the required strength of the backfill should be greater than the transmitted stress generated by the blasting shock wave within the backfill body.
Considering the influence of blasting disturbance, Equations (12)–(14) indicate that the blasting-induced damage to the backfill is primarily governed by the explosive charge amount and the thickness of the backfill retaining wall. To ensure the safety of secondary stope extraction, the blasting shock waves should not induce microcrack damage within the backfill, while the retaining wall should still be capable of controlled self-collapse under blasting impact. The condition for self-collapse is that the retaining-wall thickness must be smaller than the minimum burden of the perimeter-hole blasting. Accordingly, by substituting the retaining-wall thickness adopted in the mine (1.87 m) into the calculation, the transmitted stress corresponding to a charge amount of 294 kg was determined to be 2.40 MPa. Therefore, under blasting conditions, the required backfill strength should exceed 2.40 MPa.
The attenuation parameters K = 150 and α = 1.3 were adopted from the literature and were not calibrated against site-specific vibration measurements. A simple sensitivity analysis was therefore conducted by varying each parameter individually by ±10%, while keeping all other inputs unchanged. These variations represent illustrative scenarios rather than measured uncertainty bounds. Taking the reported transmitted stress of 2.40 MPa as the baseline, a ±10% change in K produces a corresponding ±10% change in stress, yielding 2.16–2.64 MPa. Under Equation (14), decreasing α by 10% increases the stress to approximately 2.67 MPa, whereas increasing α by 10% reduces it to approximately 2.20 MPa. Thus, the estimated stress depends on the adopted attenuation parameters, and 2.40 MPa should be regarded as a conditional estimate rather than a site-calibrated upper bound. Consequently, the small difference between the analytical design strength of 2.45 MPa and the estimated stress of 2.40 MPa does not, by itself, demonstrate a reliable safety margin.
In summary, the conservative design strength of the backfill was determined to be 2.45 MPa based on the maximum value predicted by the six analytical models, whereas the calculated blasting-induced transmitted stress was 2.40 MPa. The selected mixture, with a mass concentration of 78% and a binder-to-tailings ratio of 1:8, exhibited a 28-day uniaxial compressive strength of 2.69 MPa, thereby satisfying the design requirement.

2.3.3. SHPB Test and Experimental Verification

To experimentally characterize the dynamic response of the selected backfill, impact compression tests were conducted using a split Hopkinson pressure bar (SHPB) system. The specimens were prepared with a mass concentration of 78% and a binder-to-tailings ratio of 1:8 following the same preparation and curing procedure described in Section 2.1.2. Cylindrical specimens measuring 50 mm in diameter and 50 mm in height were used, and three replicate specimens were prepared for each test group. The SHPB apparatus consisted of a striker bar, an incident bar, a transmission bar, and an absorption bar. The striker bar was 50 mm in diameter and 0.5 m in length, whereas the incident and transmission bars were both 50 mm in diameter and 3 m in length. All bars were made of high-strength alloy steel with an elastic modulus of 210 GPa and a density of 7800 kg/m3. The striker was driven by high-pressure nitrogen, and a rubber pulse shaper with a diameter of 18 mm and a thickness of 0.5 mm was used to reduce high-frequency oscillations.
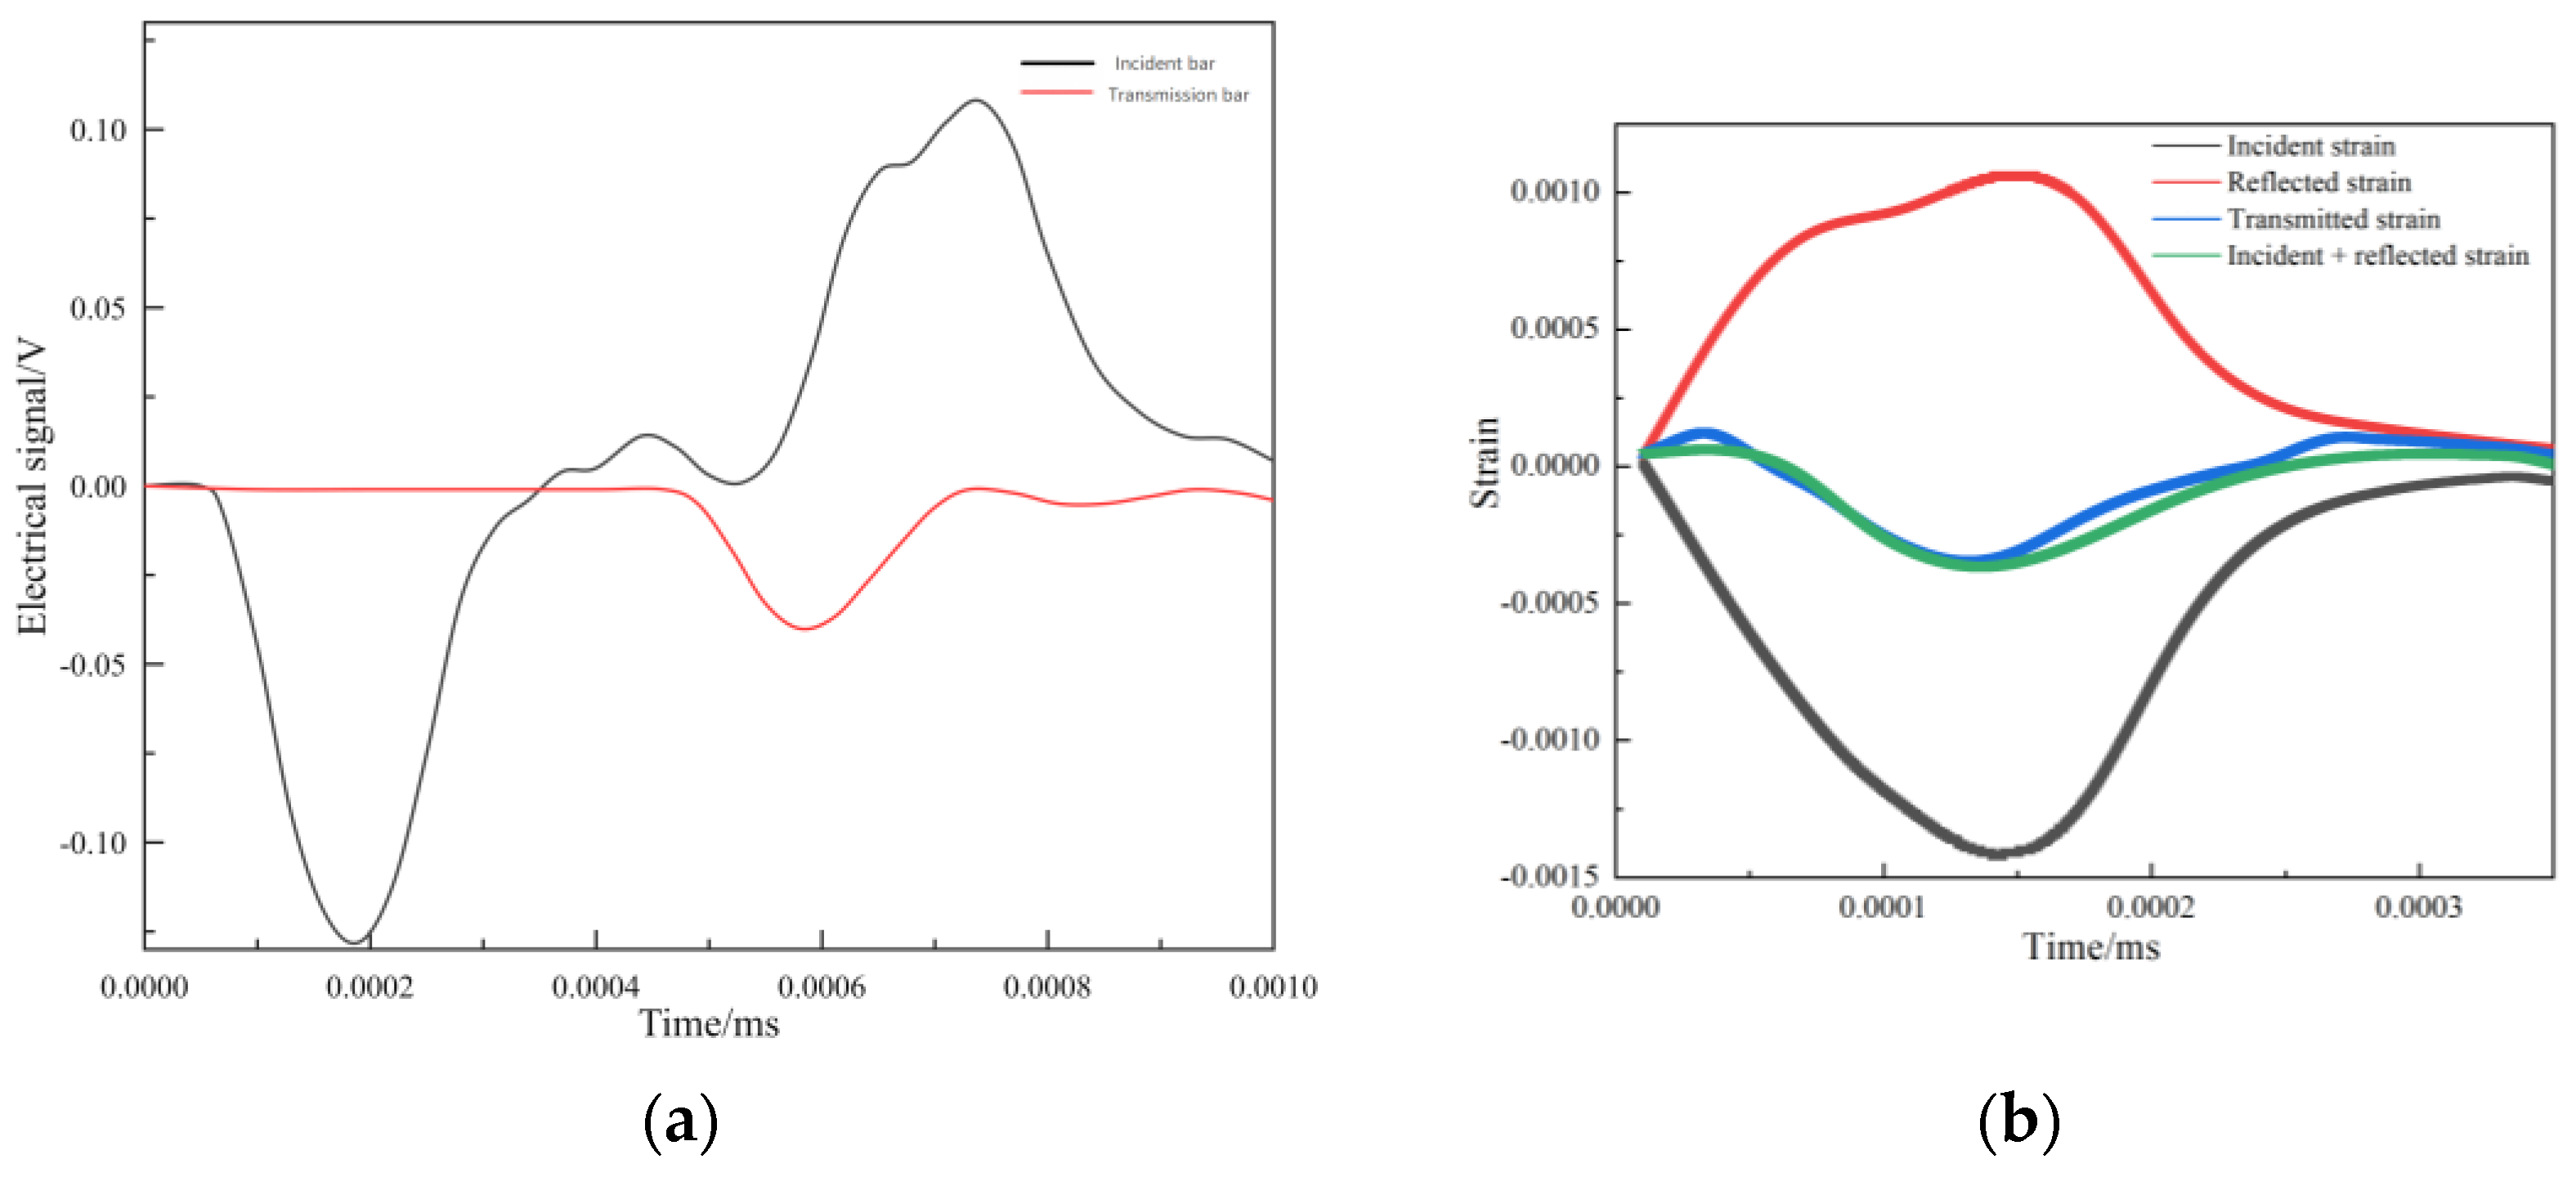
The incident, reflected, and transmitted strain signals were recorded using strain gauges and processed according to one-dimensional stress-wave theory. The effective pulse duration was approximately 97 μs. The typical impact waveforms and stress-equilibrium verification results are shown in Figure 11. Before calculating the dynamic response, stress equilibrium was verified by comparing the sum of the incident and reflected stresses with the transmitted stress. Their close agreement before specimen failure indicated that the stress-uniformity requirement was adequately satisfied.
The SHPB test results for the selected backfill mixture are summarized in Table 6. Given the limited number of replicates, further testing is needed to determine whether the slight decrease at the highest strain rate reflects a reproducible trend.
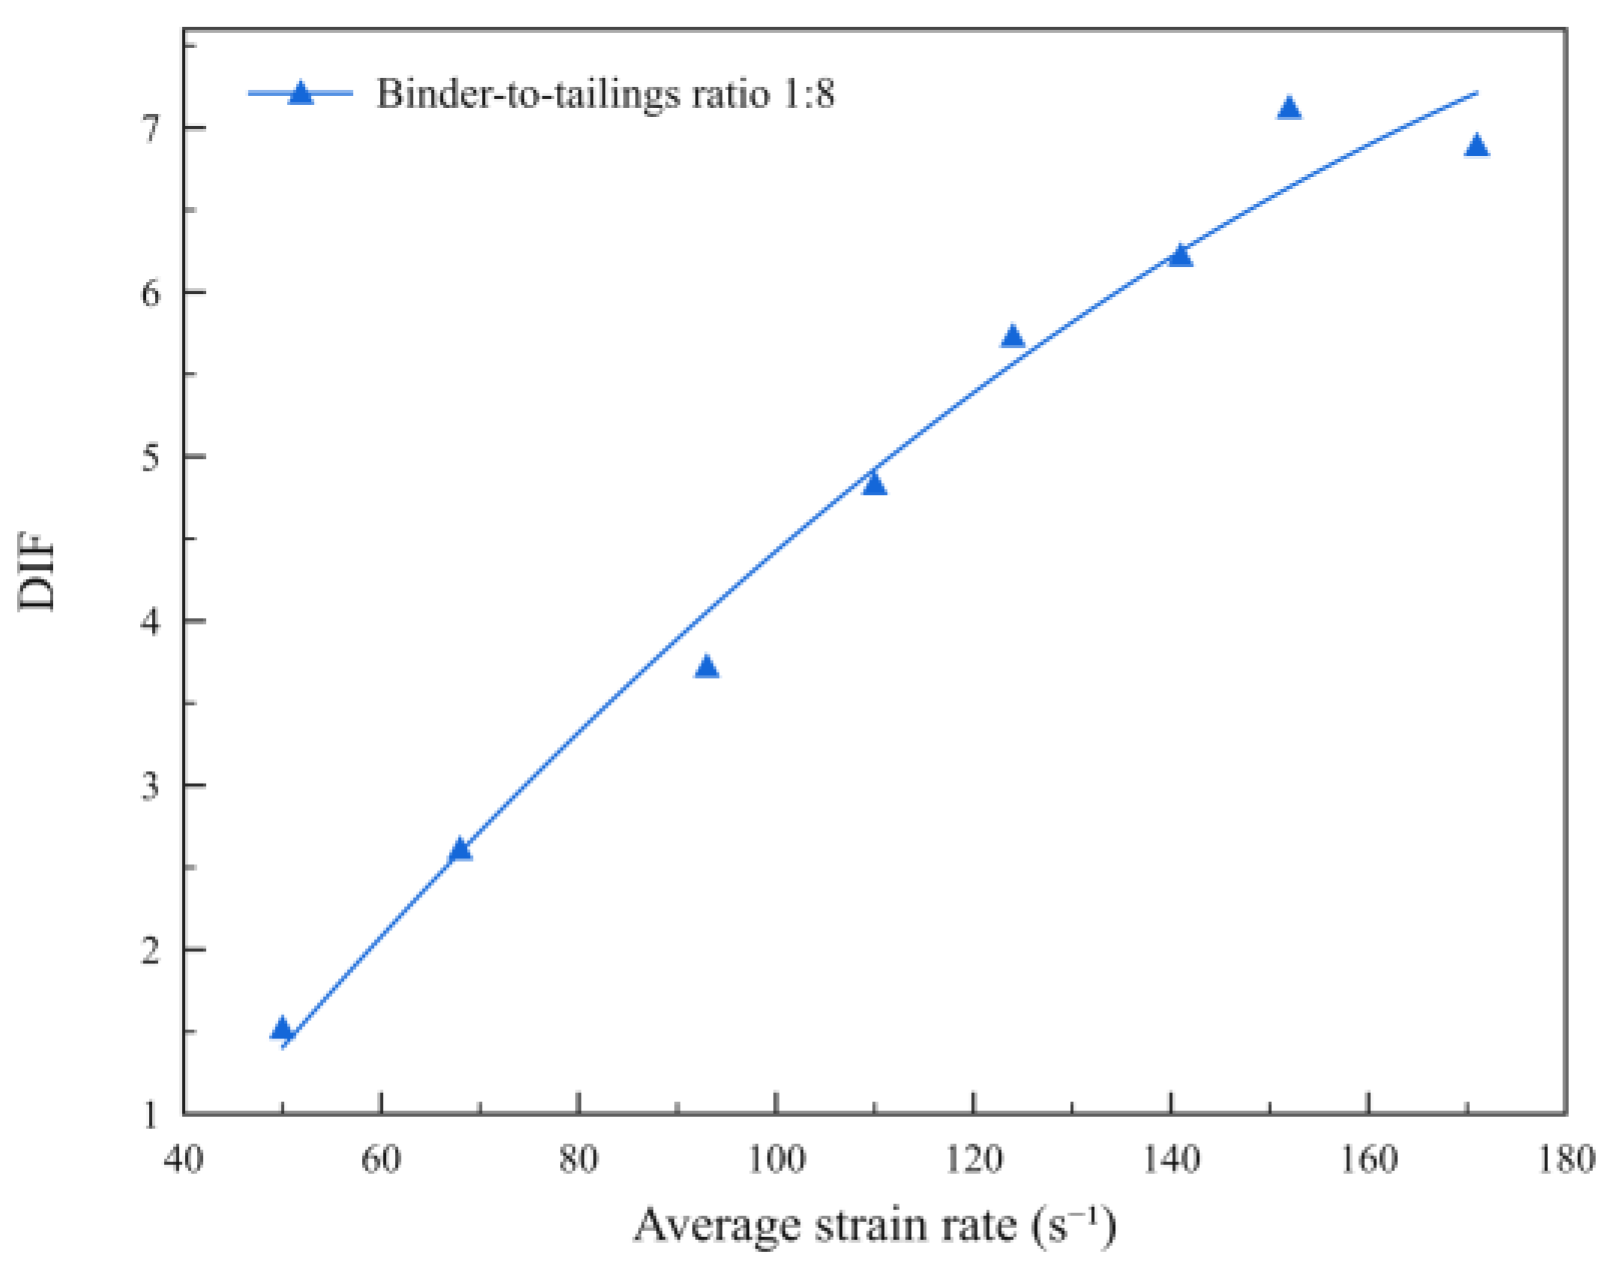
For the backfill with a mass concentration of 78% and a binder-to-tailings ratio of 1:8, the dynamic peak stress increased overall from 4.09 MPa at an average strain rate of 50 s−1 to a maximum of 19.15 MPa at 152 s−1. Meanwhile, the dynamic increase factor (DIF) increased from 1.52 to 7.12. Figure 12 illustrates the relationship between the average strain rate and DIF. When the average strain rate increased further to 171 s−1, the dynamic peak stress and DIF decreased slightly to 18.59 MPa and 6.89, respectively. Overall, the results suggest a rate-strengthening trend over the tested strain-rate range.
Therefore, the SHPB results provide supplementary evidence of the dynamic response of the selected mixture but do not directly establish 2.45 MPa as an in-situ dynamic failure threshold.

3. Numerical Simulation

Two three-dimensional numerical models were established using FLAC3D to investigate the mechanical behavior of the backfilled stope under mining and blasting disturbances. The static model was used to analyze the displacement, stress redistribution, and plastic failure caused by excavation and backfilling and to evaluate the reinforcing effect of the flexible protective mesh. The dynamic model was used to investigate the propagation of blast-induced disturbances and the corresponding velocity, stress, displacement, and plastic responses of the orebody–backfill system.

3.1. Static Numerical Model

(1)
A three-dimensional numerical model was developed using FLAC3D 7.0 to reproduce the spatial configuration and mining sequence of the Makeng Iron Mine stope. FLAC3D employs an explicit finite-volume solution scheme. As shown in Figure 13, the model measured 160 m × 35 m × 156.5 m and included the orebody, surrounding rock, primary backfilled stopes, secondary stopes, bottom trenches, and ore-drawing drifts. The ore-drawing drifts were represented by three-centered arch sections measuring 3.9 m × 3.6 m. The trenches were inclined at 45°, and the vertical distance between the trench roof and the drift floor was 8.15 m. The orebody, surrounding rock, and backfill were discretized using finite-volume zones, whereas the flexible protective mesh was represented separately using Geogrid structural elements.
(2)
The elastoplastic behavior of the orebody, surrounding rock, and cemented backfill was described using the Mohr–Coulomb constitutive model. The corresponding mechanical parameters were obtained from laboratory tests on representative rock and backfill specimens, as summarized in Table 7 [39].
Local mesh refinement was applied around the stope boundaries, ore-drawing drifts, trenches, flexible-mesh installation regions, and backfill–rock interfaces, where relatively high stress and displacement gradients were expected. The minimum zone size in the refined regions was approximately 0.8 m and gradually increased to 3–5 m away from the stope. The model comprised approximately 185,000 zones and 205,000 gridpoints. When the minimum zone size was further reduced to 0.5 m, the maximum lateral displacement of the backfill changed by approximately 3.2%, which was less than 5%. Therefore, the adopted mesh was considered sufficiently accurate for the subsequent calculations.
The bottom boundary was constrained in the vertical direction. Normal displacement was restrained on the four lateral boundaries, while tangential movement along these boundaries remained unrestricted. The upper model boundary and the surfaces formed after excavation were treated as traction-free. The initial stress field was established using the in-situ stresses adopted in the calculation, with a vertical stress of 15.27 MPa and a horizontal stress of 25.57 MPa. Each excavation and backfilling stage was solved to mechanical equilibrium before the subsequent stage was initiated. The backfill and surrounding rock were connected through coincident gridpoints without introducing an independent interface element. Thus, displacement continuity and stress transfer were maintained across the material boundary, while interfacial opening, sliding, and debonding were not explicitly considered.
(3)
Orebody extraction adopts an “alternate mining” sequence and advances from left to right following a cyclic procedure of “cutting-mining-backfilling.” Specifically, the leftmost orebody section and bottom structure are first excavated. After completion of mining, a flexible mesh model is established at both ends of the goaf using the Geogrid module in the FLAC3D 7.0 numerical simulation software, followed by backfilling operations. The parameters of the flexible protective mesh listed in Table 8 were obtained through laboratory experiments.
(4)
Following the same procedure, the first orebody on the right side is extracted and the flexible mesh model is subsequently established. After completion of backfilling, the third orebody on the left side is mined. Finally, the effectiveness of the backfill stability control scheme is comprehensively evaluated by comparing the displacement characteristics, stress evolution, and plastic zone distribution of the backfill before and after the application of the flexible mesh.

3.2. Static Analysis

3.2.1. Displacement Analysis

Analysis of the displacement contours in Figure 14 shows that the displacement field is markedly nonuniform, with deformation concentrated primarily at the interface between the side backfill and the surrounding rock. This pattern confirms that the interface is a mechanically vulnerable region within the stope system. Owing to the pronounced contrast in mechanical properties between the backfill and the surrounding rock, stress concentrations develop along the interface and promote plastic deformation. The resulting coupled shear–tensile plastic zone initiates and propagates along this material boundary, progressively reducing the load-bearing capacity of the backfill. If these plastic zones coalesce, overall backfill instability may occur, threatening both stope stability and the continuity of mining operations.
By comparing the X-direction displacement of the backfill in the two wings, the support effect of the flexible protective mesh can be quantitatively evaluated. As shown in the displacement contours in Figure 15, under the unsupported condition, the horizontal displacement of the backfill on both sides of the stope after first-stage mining is relatively large, with a maximum value of approximately 18.85 mm. After the application of the flexible protective mesh, the maximum X-direction displacement decreases to 7.24 mm, which is only 38.40% of that under the unsupported condition, corresponding to a displacement reduction rate of 61.60%. Comparative analysis of the maximum displacement contours of the stope cross-section further indicates that the high-displacement concentration zone is significantly reduced after mesh installation, and the displacement peak value decreases markedly. These results demonstrate that the flexible protective mesh can effectively restrain the horizontal displacement of the backfill, thereby fundamentally reducing the risk of collapse and caving and providing reliable technical support for stable stope extraction.

3.2.2. Stress Analysis

During the secondary extraction process, the original stress equilibrium of the rock mass is disturbed, resulting in pronounced stress concentration zones at the interface between the surrounding rock and the backfill. Consequently, the contact regions between the backfill and the surrounding rock become areas of concentrated plastic deformation. Under the influence of joints and fractures, these regions are more susceptible to block sliding and other shear-dominated deformation failures, which may further lead to instability and collapse of the backfill. In severe cases, such instability may even trigger large-scale ground pressure disasters.
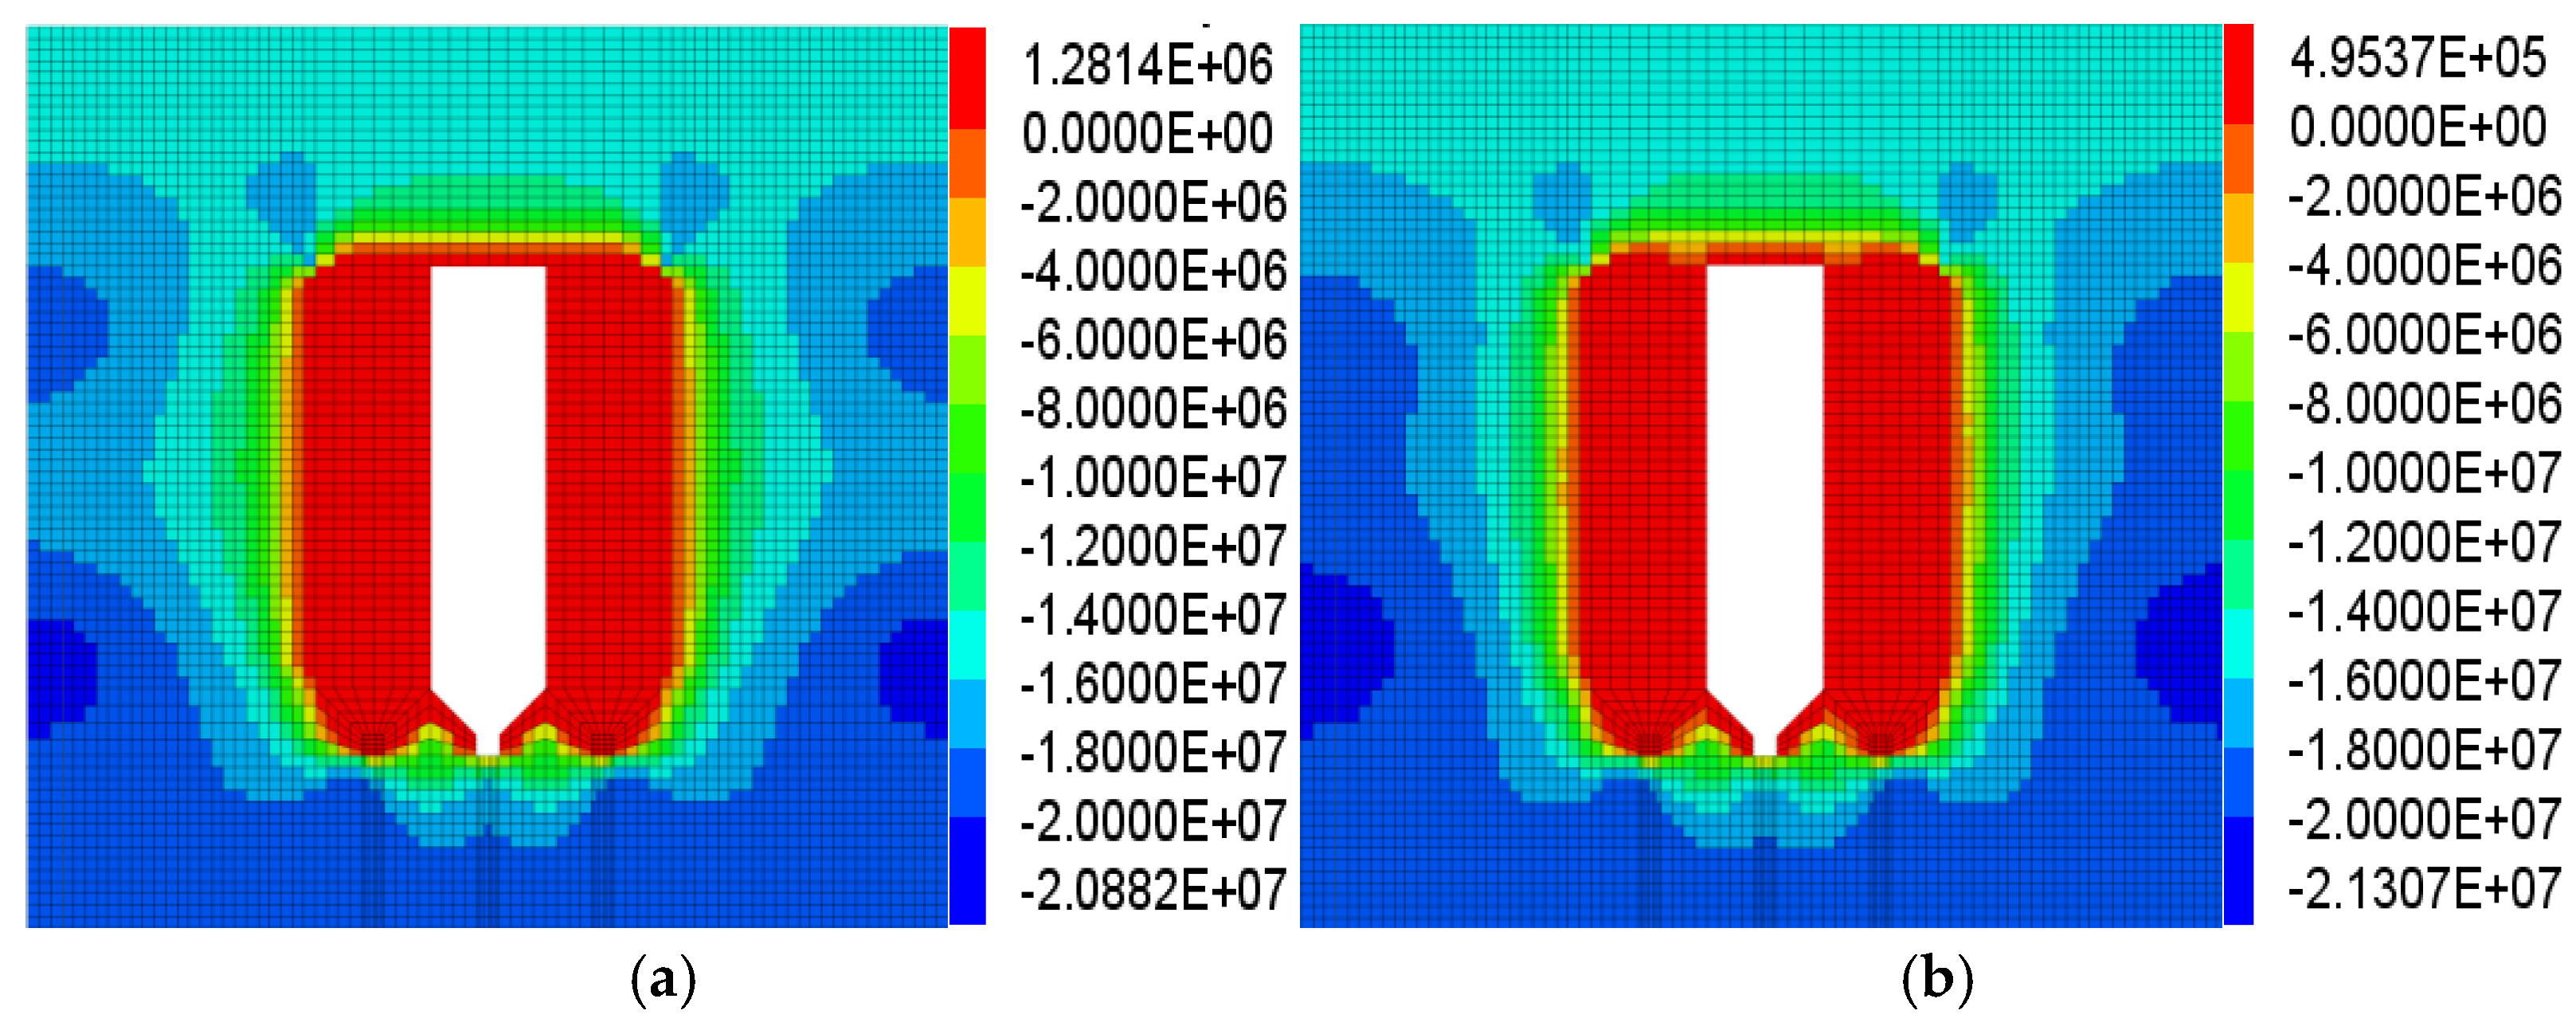
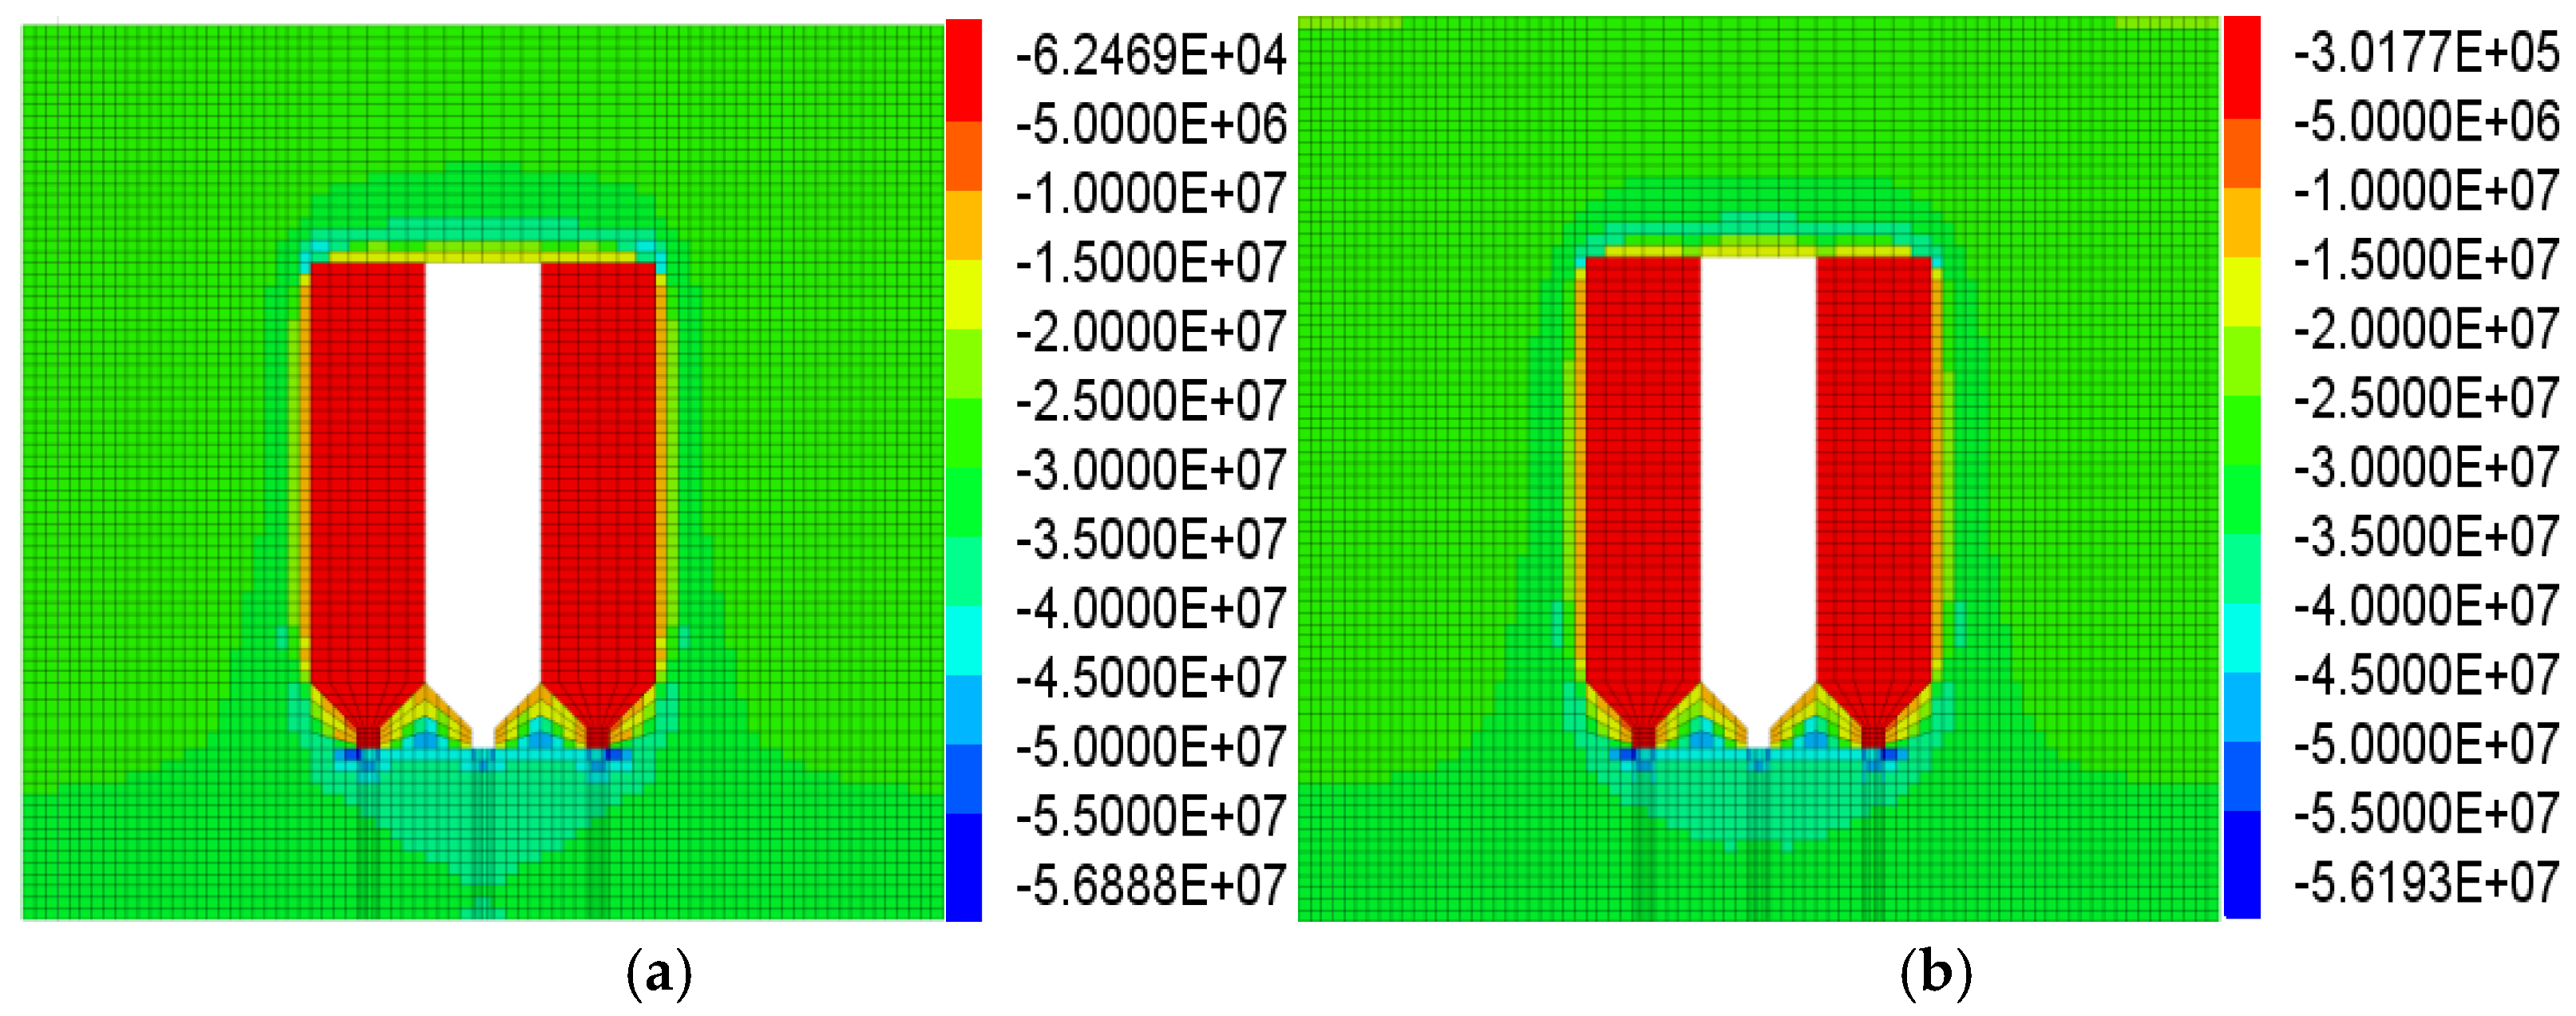
To verify the effectiveness of the support scheme, a comparative analysis of the maximum principal stress contours on the stope cross-section after secondary extraction was carried out. The corresponding maximum and minimum principal stress contour plots are shown in Figure 16 and Figure 17, respectively. The results indicate that both tensile and compressive stresses remain mainly concentrated in the sidewall and roof regions before and after support installation; however, the overall stress level is significantly reduced after support, demonstrating the effective stress regulation capability of the support system. Specifically, the maximum principal stress in the sidewall region decreases from 1.28 MPa to 0.50 MPa, corresponding to a reduction of 60.94%. Meanwhile, the minimum principal stress increases from 0.006 MPa to 0.03 MPa, indicating that the support structure enhances the load-bearing capacity of the backfill. Overall, the numerical results suggest that the support system may reduce the risk of backfill instability during stope extraction.

3.2.3. Plastic Zone Analysis

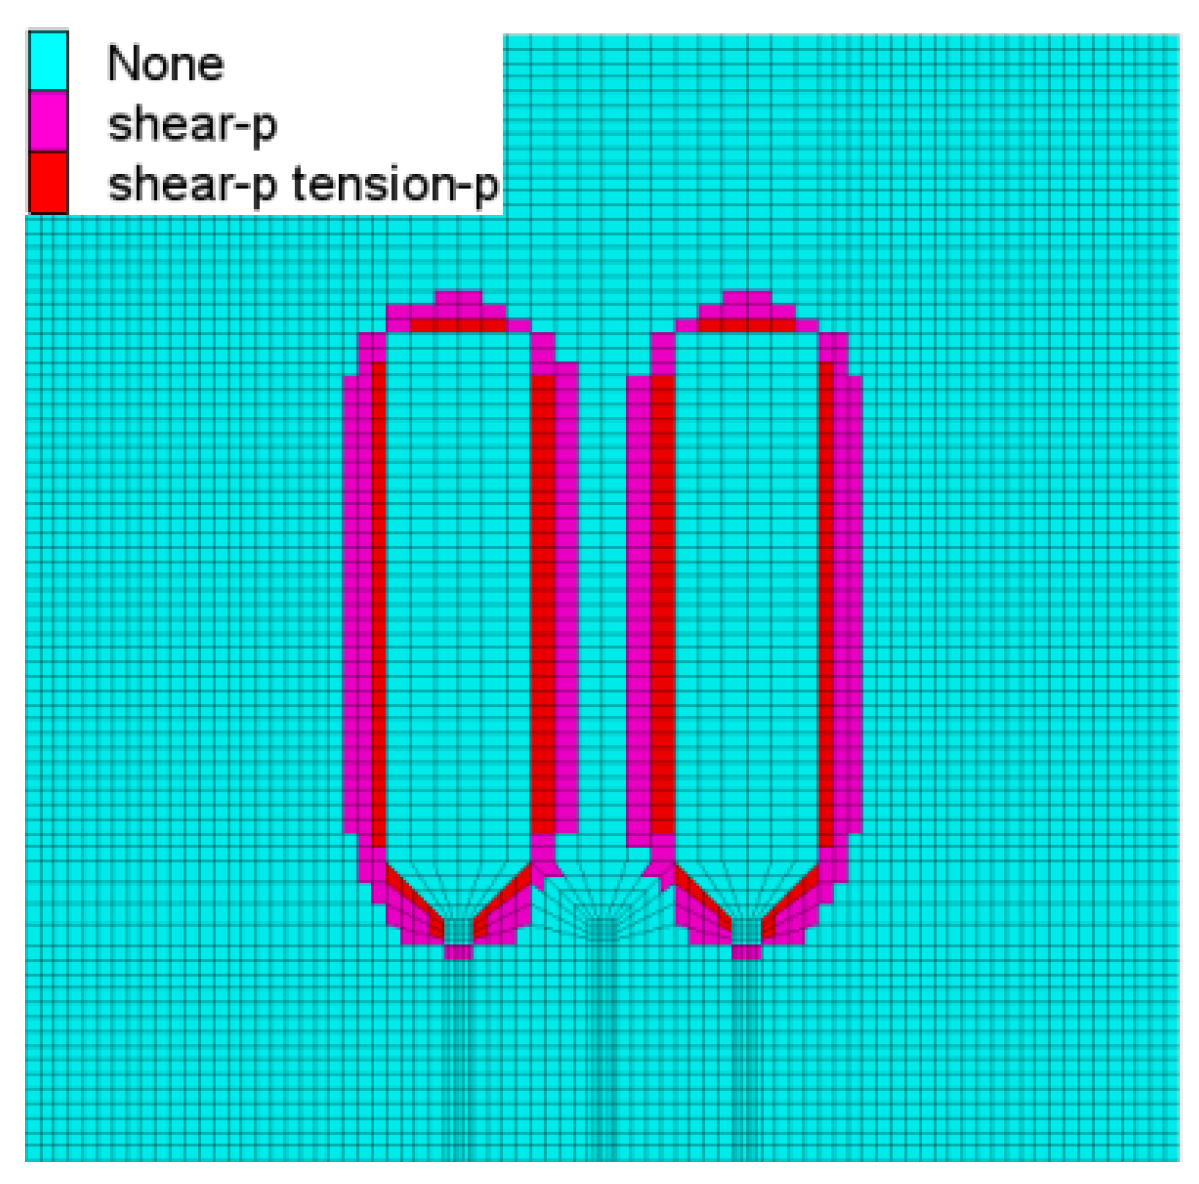
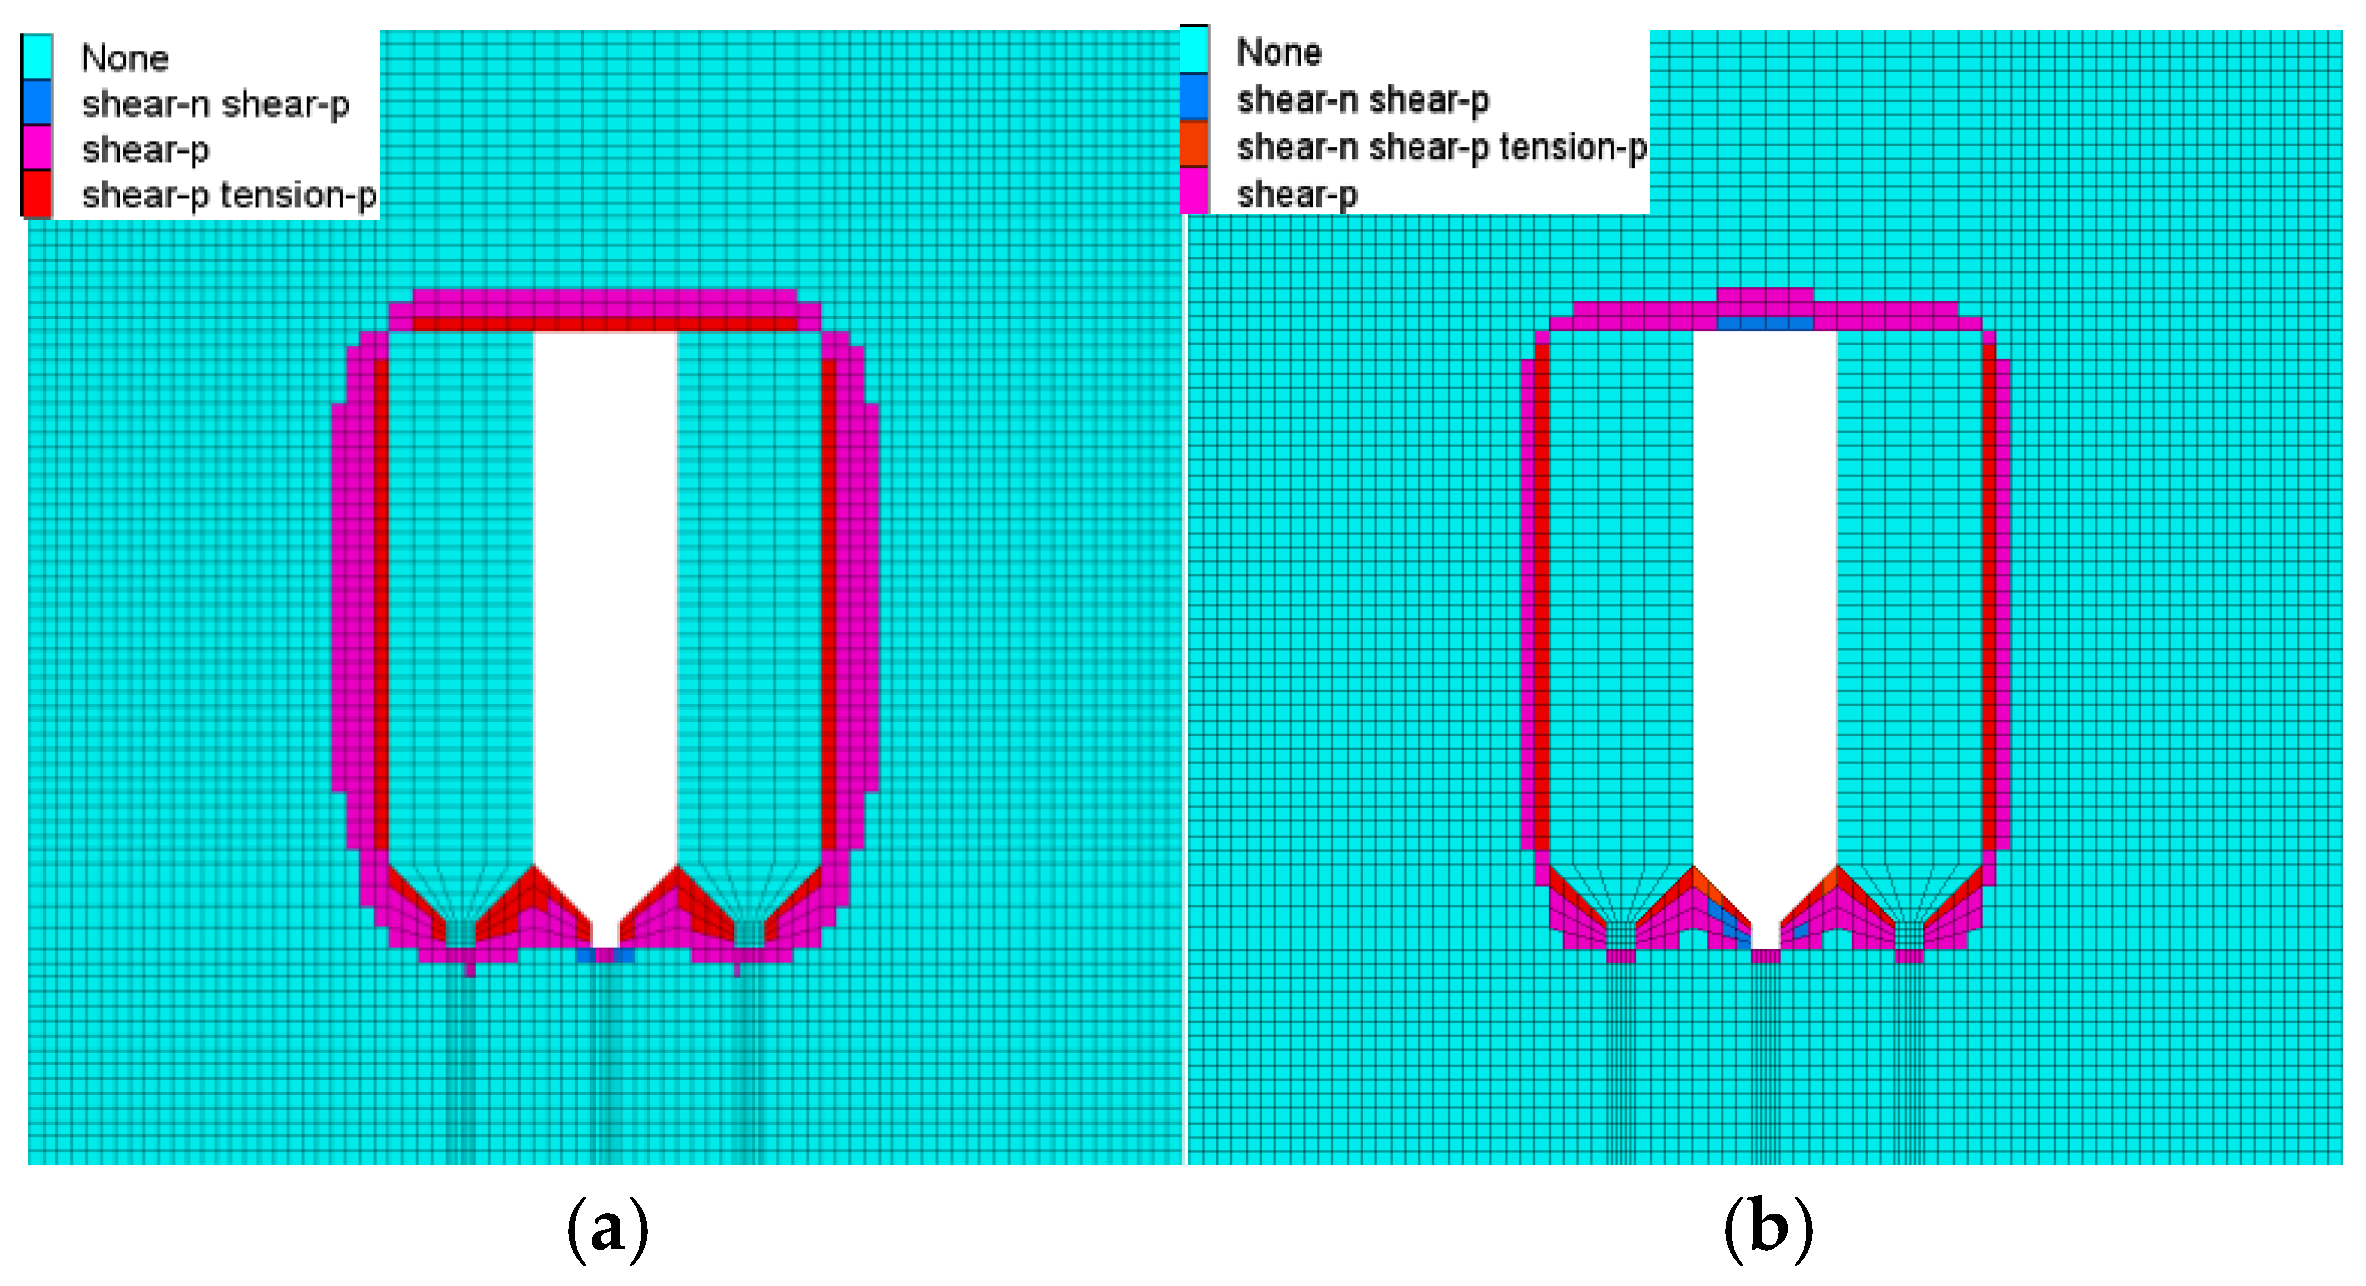
As shown in Figure 18, pronounced stress concentration occurs during the first-stage mining process, and shear failure develops in the surrounding rock, further intensifying the stress concentration effect at the interface and making it a mechanically weak zone prone to plastic deformation. During direct pillar recovery in the secondary stope, the plastic zone is mainly concentrated at the contact interface between the backfill and the surrounding rock. Further analysis of the plastic zone distribution after stepwise extraction indicates that the failure concentration area gradually shifts to the top drilling chamber and trench regions, where the dominant failure mode is large-scale shear failure accompanied by localized tensile failure.
As shown in Figure 19, during the pillar recovery stage, the backfill under the flexible mesh support condition exhibits significantly improved stability. The shear failure zone is notably reduced, decreasing by approximately 39.72% compared with the unsupported condition, while the overall integrity of the backfill is substantially enhanced. Compared with the unsupported case, the flexible protective mesh, owing to its high ductility and interfacial confinement effect, not only restrains the expansion of the failure zone and effectively reduces shear-dominated damage, but also inhibits progressive shear failure while maintaining the structural integrity of the backfill. Consequently, it provides reliable support for maintaining stope stability.
The reinforcement effect can be placed in context through comparison with previous studies. In the present excavation-stage simulations, flexible mesh reduced the maximum lateral displacement from 18.85 to 7.24 mm (61.60%) and the extent of the shear-yielding zone by approximately 39.72%. Liu [40]. reported a 21.43% reduction in roof displacement for a reserved roadway within backfill reinforced with three-dimensional flexible mesh under static loading. Both studies indicate improved deformation control, although the different geometries, reinforcement arrangements, and displacement measures prevent a direct ranking of reinforcement efficiency. For blast-induced responses, Li demonstrated the importance of blasting sequence and backfill ductility in controlling damage, whereas Zhao reported that delayed detonation reduced the instantaneous peak energy to 0.76 times that under simultaneous detonation. These studies address damage control through material behavior and blast timing, whereas the present comparison quantifies the contribution of mesh reinforcement during excavation. Their damage and energy measures are not directly equivalent to the shear-yielding-zone reduction reported here. Accordingly, the reductions of 61.60% and 39.72% should be regarded as case-specific results rather than general reduction factors for reinforced backfill under blasting.

3.3. Dynamic Numerical Model

A three-dimensional dynamic model was established using FLAC3D 7.0 to investigate the response of the orebody–backfill system under blast loading. The model dimensions were 150 m × 100 m × 80 m in the longitudinal, transverse, and vertical directions, respectively. The widths of the orebody and backfill units were both 15 m, consistent with the actual stope width at the Makeng Iron Mine.
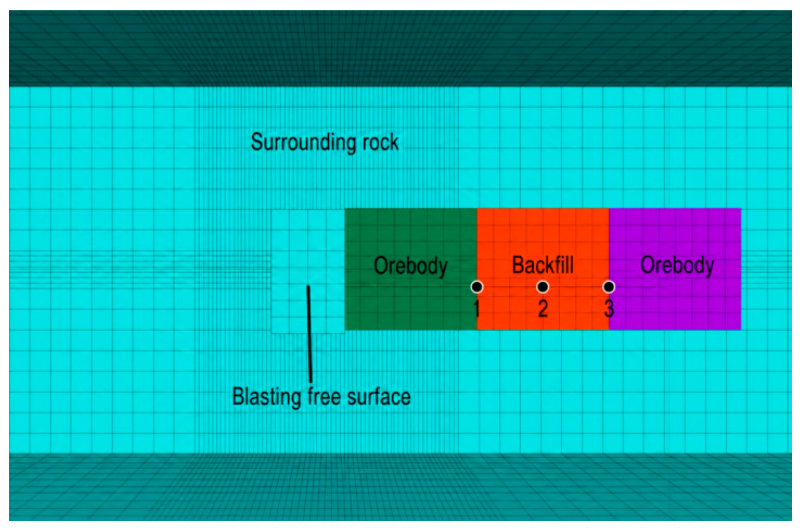
The analyzed propagation path was defined as the blasting free surface–orebody–cemented backfill–adjacent orebody, as shown in Figure 20. This configuration represents blasting during secondary-pillar extraction, in which the blast-induced disturbance initially propagates through the orebody and subsequently reaches the orebody–backfill interfaces.
FLAC3D adopts an explicit finite-volume calculation method rather than the conventional finite-element method. The orebody, surrounding rock, and backfill were discretized using three-dimensional finite-volume zones. A structured mesh was adopted in regular regions, and mesh refinement was applied near the blasting free surface and the orebody–backfill interfaces, where relatively large stress and displacement gradients were expected. The calculation time step was automatically controlled according to the critical stable time step determined by the minimum zone size and material wave velocity.
The mechanical behavior of the orebody, surrounding rock, and cemented backfill was described using the Mohr–Coulomb constitutive model. The mechanical parameters of the surrounding rock and orebody were obtained from laboratory rock-mechanics tests, whereas those of the backfill corresponded to the selected mixture with a mass concentration of 78% and a binder-to-tailings ratio of 1:8. The adopted parameters are summarized in Table 9. The uniaxial compressive and tensile strengths of the selected backfill were 2.69 MPa and 0.21 MPa, respectively.
The orebody and backfill shared coincident gridpoints at their contact boundary. Accordingly, stress and displacement continuity were maintained across the material interface, and the reflection and transmission of stress waves caused by the difference in material impedance could be reproduced. However, an independent interface element was not introduced; therefore, explicit interface opening, sliding, and debonding were not considered in the present model. Because interface opening, sliding, and debonding were not explicitly modeled, the results indicate plastic deformation near the interface rather than direct evidence of interface failure.
The dynamic calculation consisted of two consecutive stages. First, a static-equilibrium calculation was performed to establish the initial stress state. The bottom boundary was constrained in the vertical direction, normal displacement was restrained on the four lateral boundaries, and the upper surface was treated as a free boundary. Gravity and the measured in situ stress field were then applied. The representative vertical and horizontal stresses were 15.27 MPa and 25.57 MPa, respectively. The model was calculated until the prescribed equilibrium criterion was satisfied. This static-equilibrium calculation was conducted only to generate the initial stress field required for the subsequent dynamic analysis and was independent of the static mining simulation described in Section 3.1.
After static equilibrium was achieved, the blasting free surface was generated through excavation, and the equilibrium state was retained as the initial condition for the dynamic calculation. This procedure allowed the combined effects of the pre-existing in situ stress and blast-induced disturbance to be considered.
During the dynamic stage, viscous boundaries were applied to the bottom and four lateral surfaces to absorb outgoing stress waves and reduce artificial reflections from the external boundaries. The upper surface remained a free boundary. Rayleigh damping was adopted to suppress high-frequency numerical oscillations while retaining the dominant blast-induced response. Dynamic calculations were conducted using the explicit time-integration scheme implemented in FLAC3D.
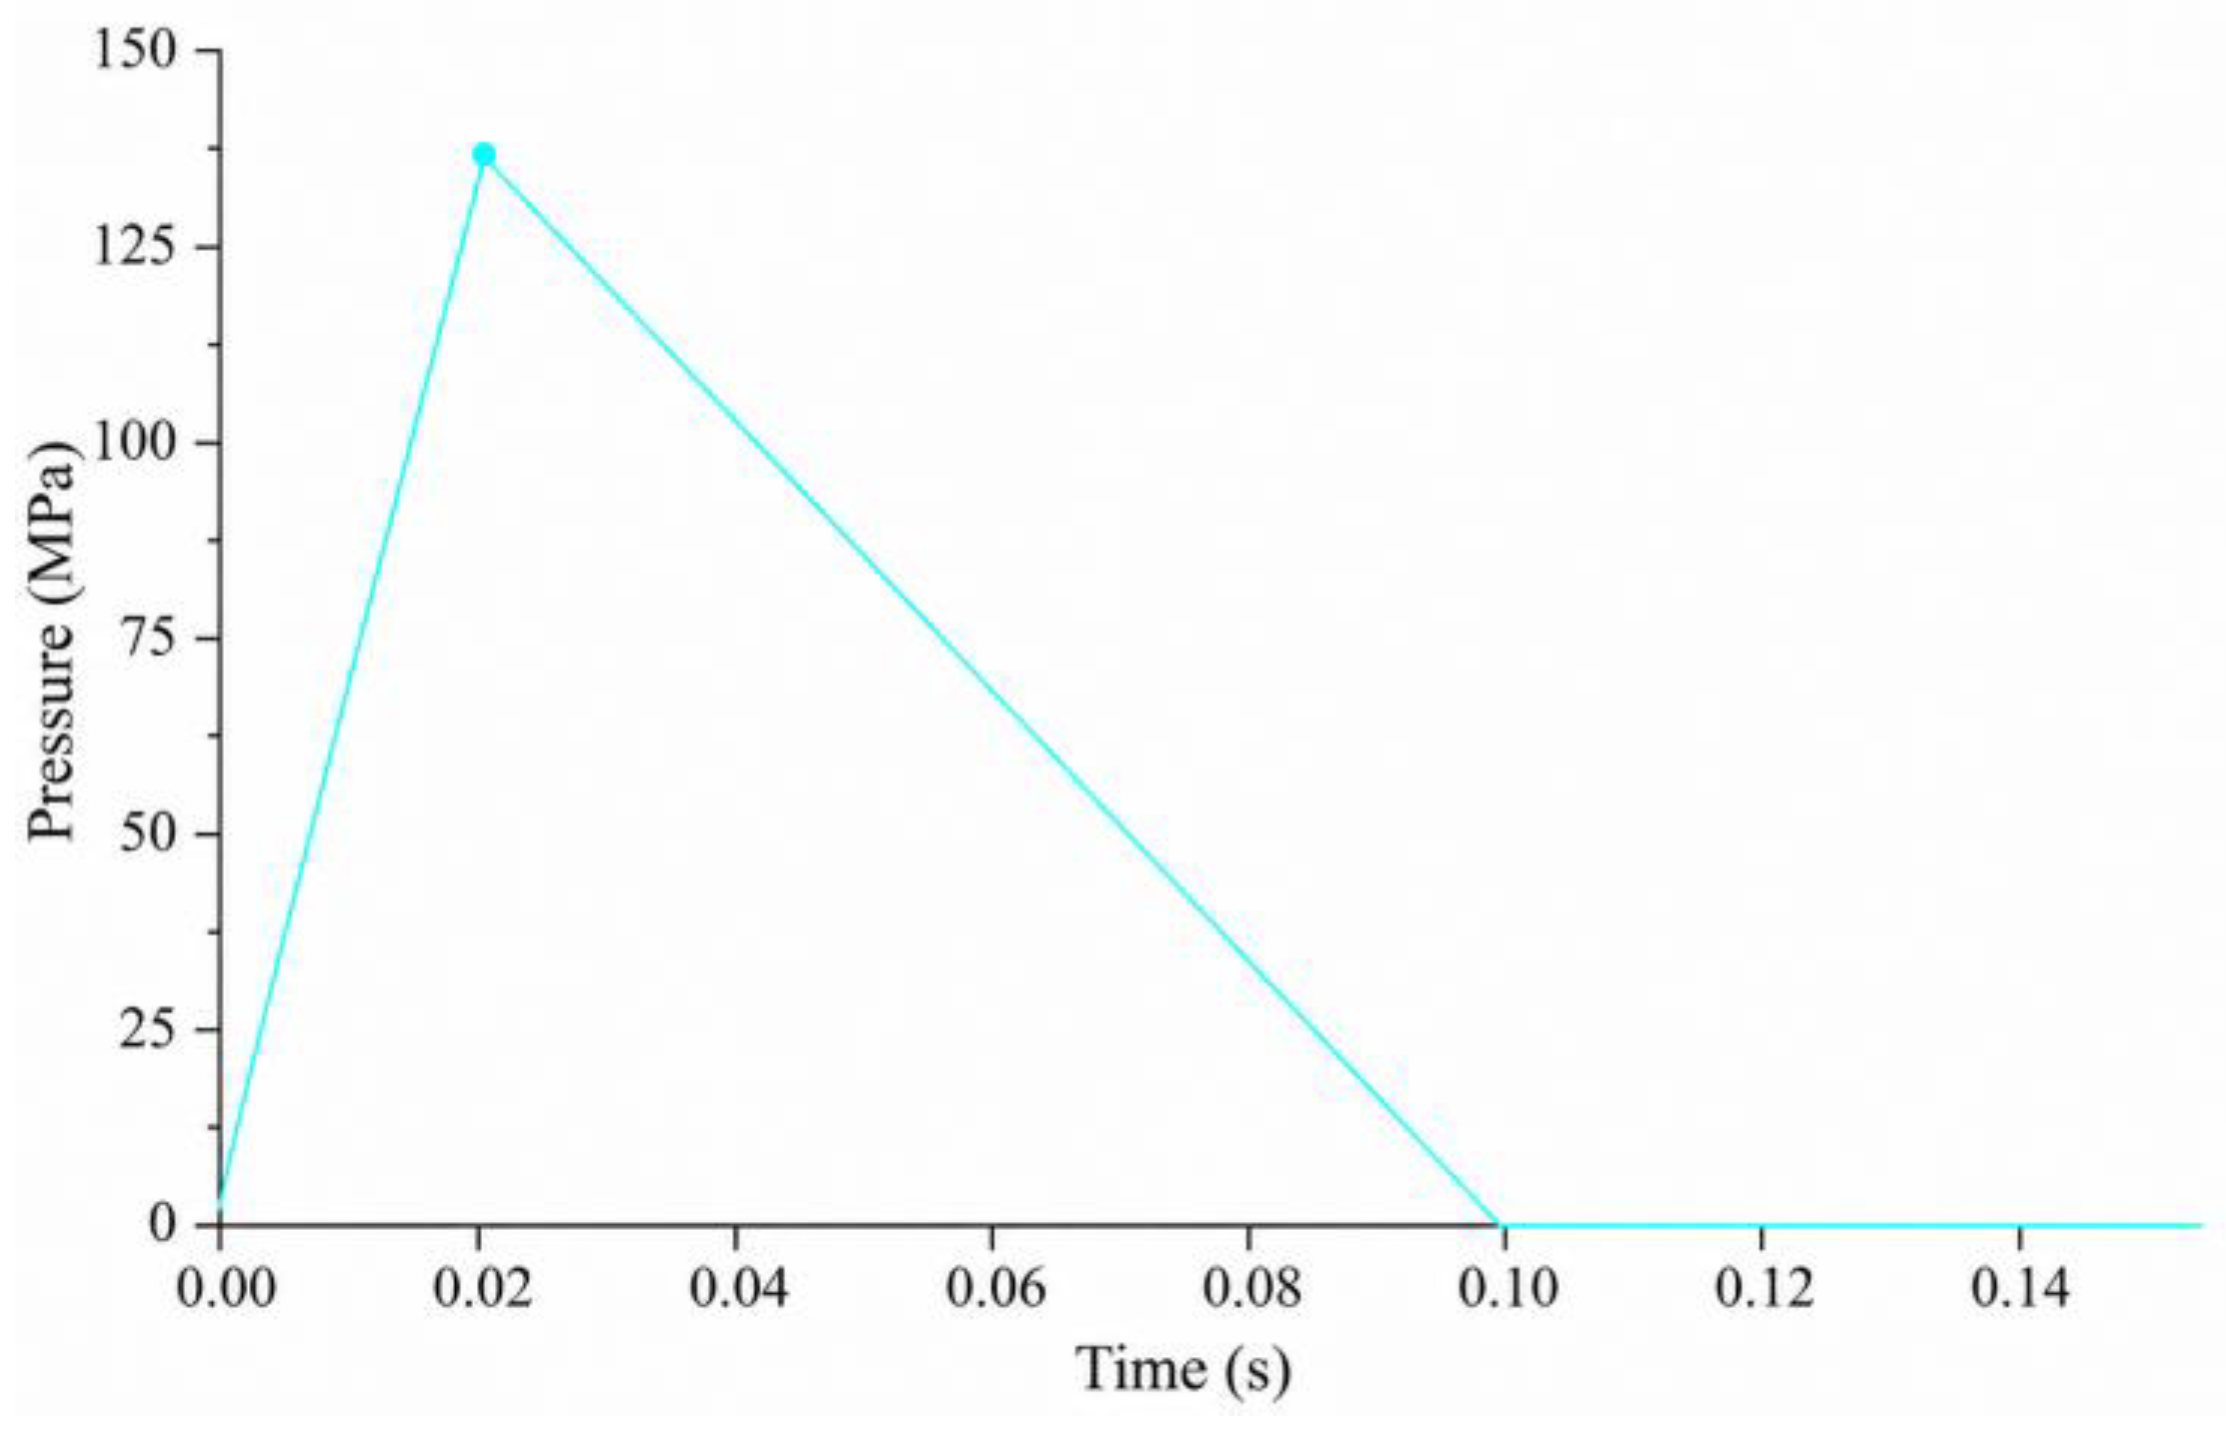
Because the actual pressure–time history generated by production blasting is highly transient and difficult to measure directly, the blast load was simplified as an equivalent triangular pressure pulse. The peak pressure was determined from field blasting data as 137.4 MPa. As shown in Figure 21, the pressure increased linearly from zero to its peak value and subsequently decreased linearly to zero. This simplification assumes that the blast load can be represented by a single equivalent pressure pulse with linear loading and unloading branches. It does not resolve individual delay events or the detailed high-frequency fluctuations of the actual blast-pressure history. The simulated response should therefore be interpreted as the response to the prescribed equivalent pulse, rather than a reconstruction of the complete field blasting sequence.
According to the pressure history used in the numerical calculation, the peak pressure was reached at approximately 0.02 s, and the active pressure pulse decreased to zero at approximately 0.10 s. The calculation was continued to 0.15 s to capture the subsequent vibration attenuation and residual response. The pressure history was applied normally to the orebody surface adjacent to the blasting free surface.
Three monitoring points were arranged along the stress-wave propagation path. Point 1 was located at the first orebody–backfill interface to record the interface displacement. Point 2 was positioned at the center of the backfill to record its internal stress response. Point 3 was located at the opposite edge of the backfill, close to the backfill–orebody interface, to record the particle velocity after the disturbance propagated through the backfill. The horizontal velocity, horizontal stress, and horizontal displacement histories were recorded during the calculation.

3.4. Dynamic Analysis

3.4.1. Velocity Response

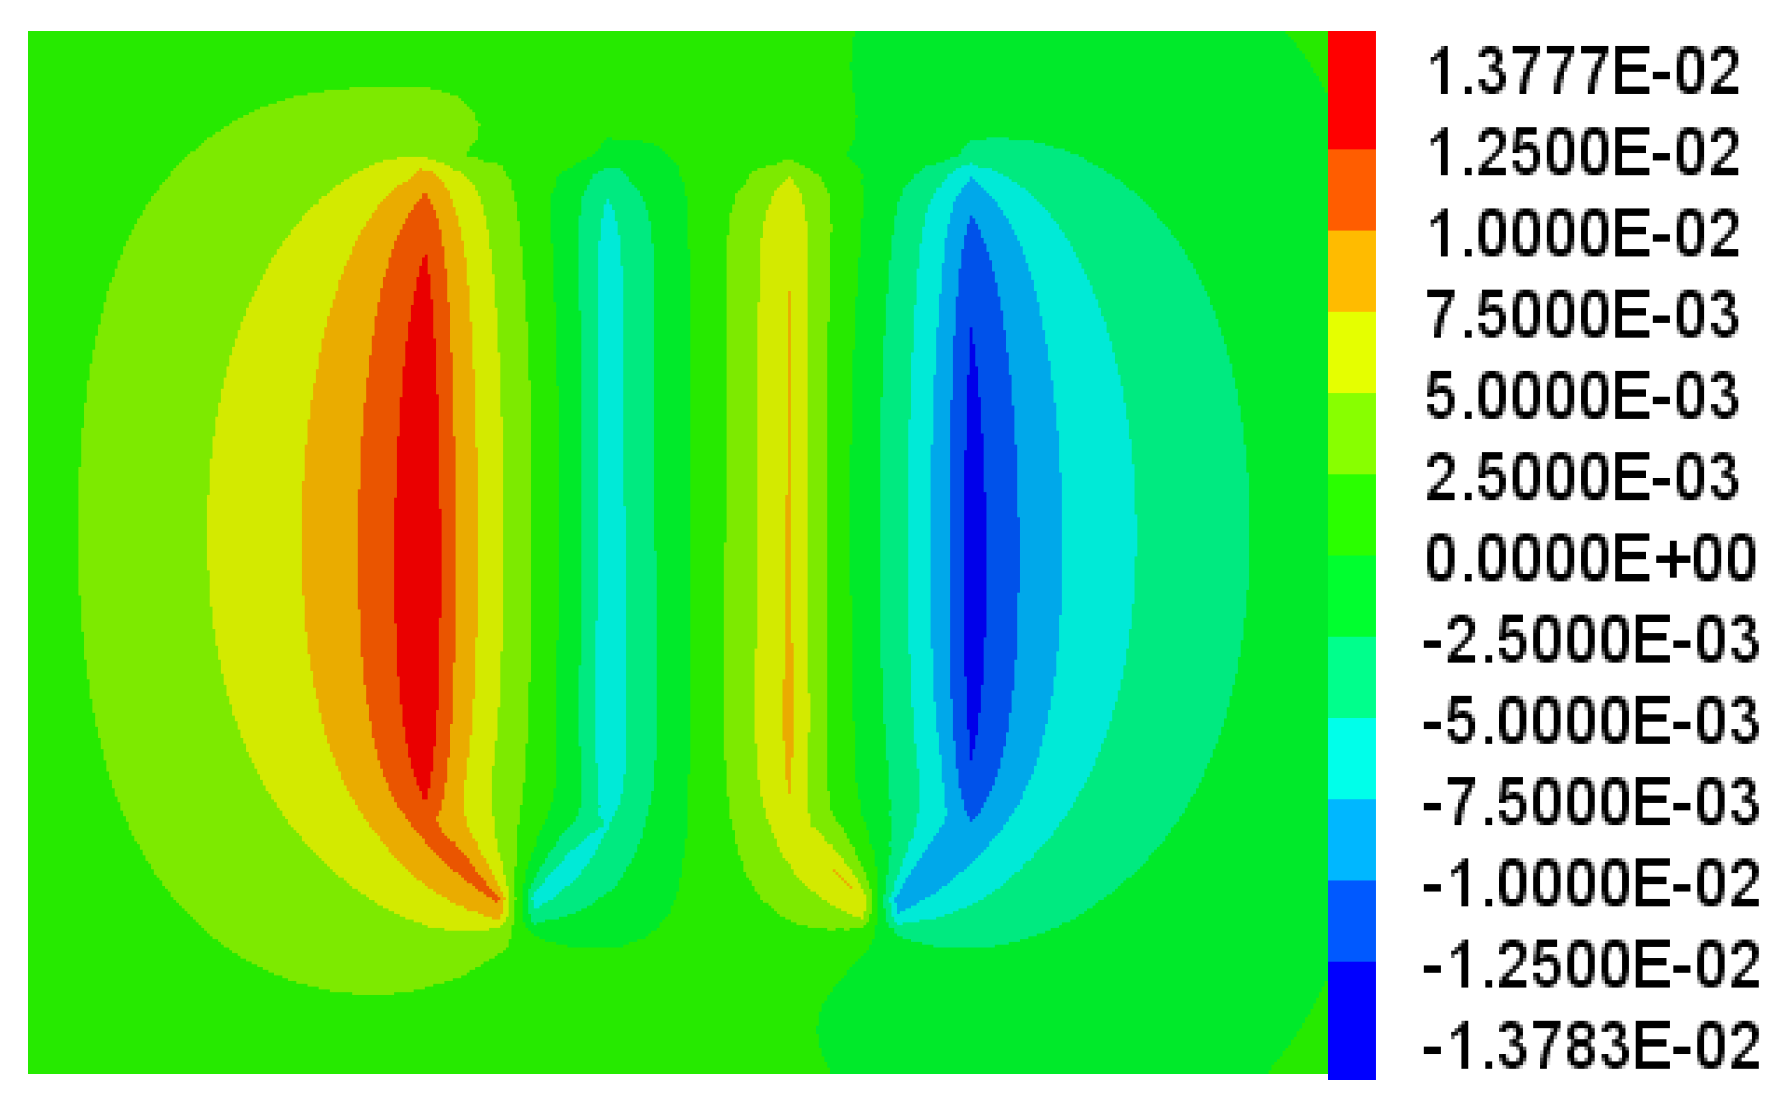
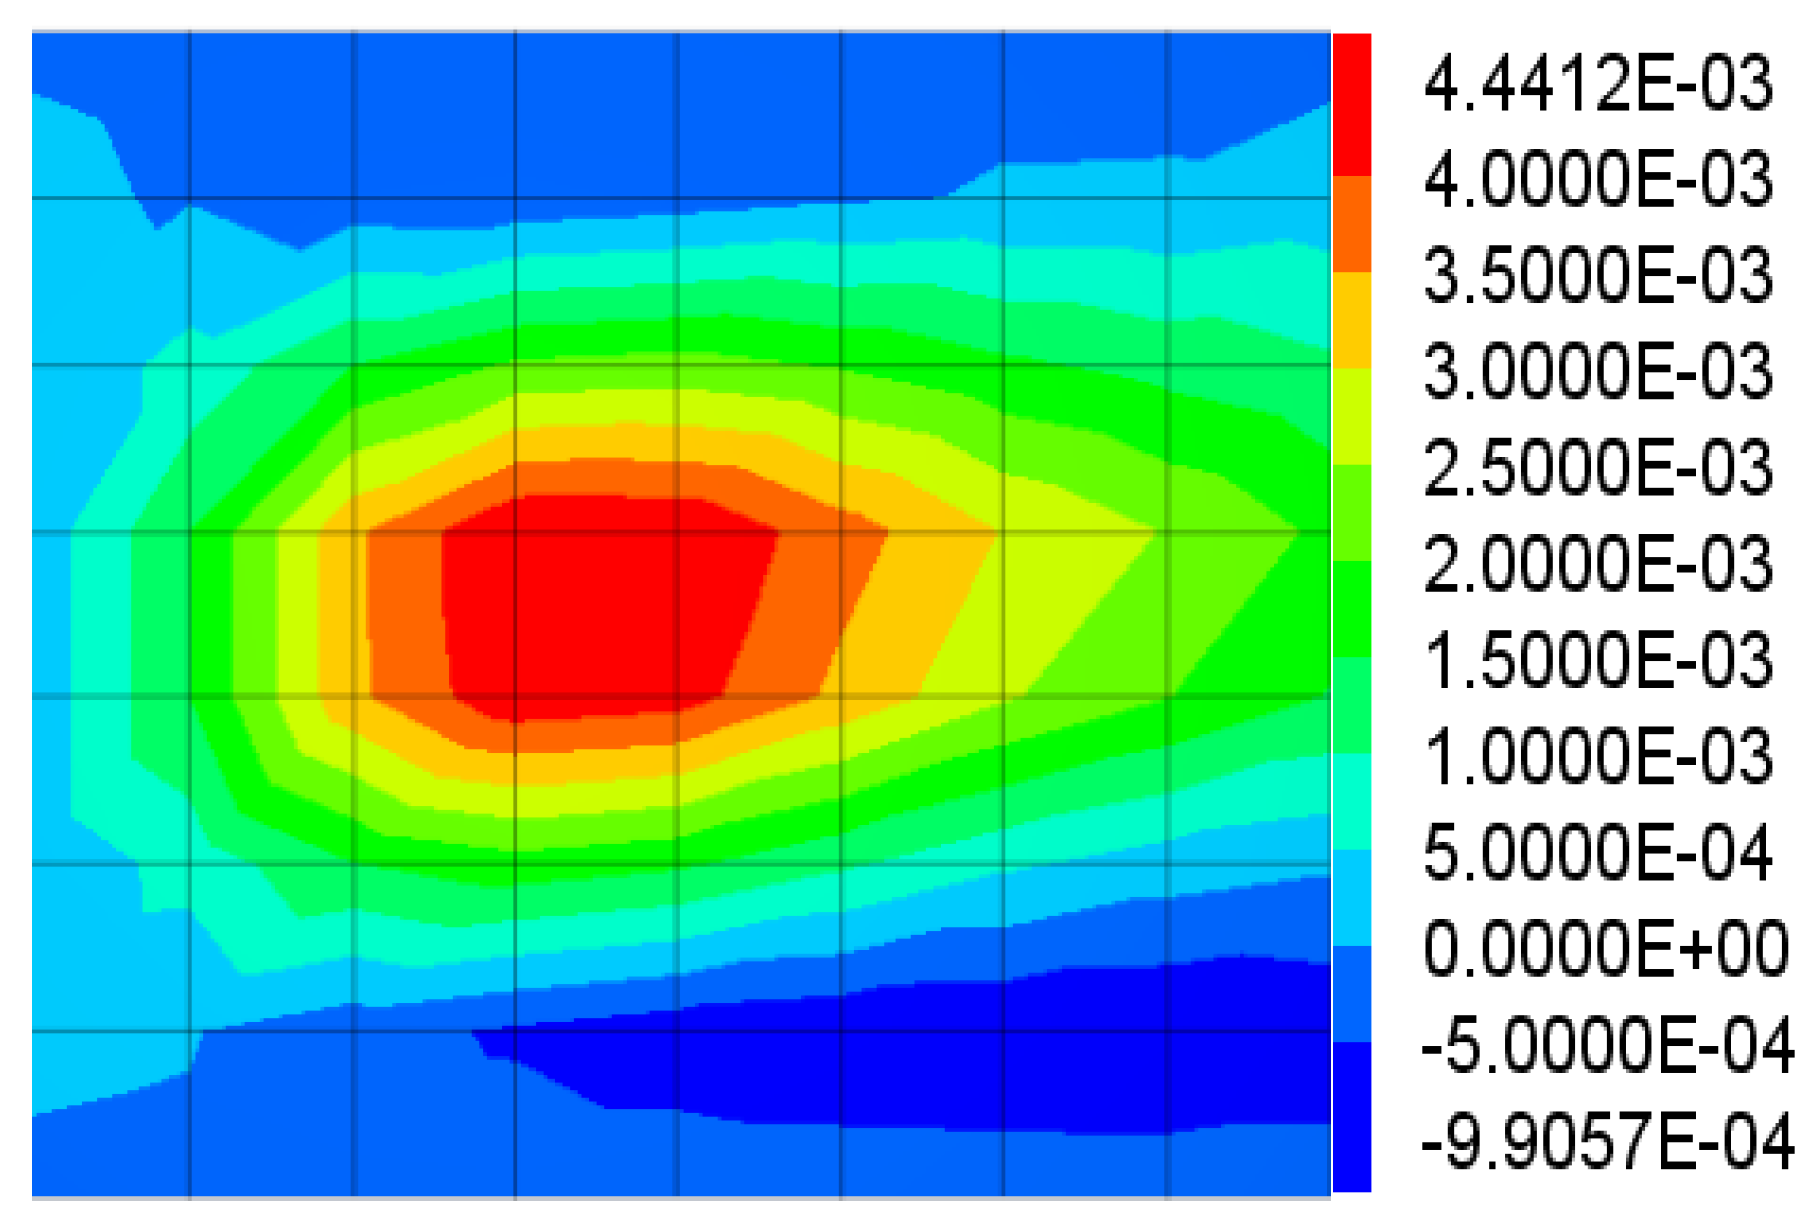
Figure 22 presents the horizontal particle-velocity field of the backfill with a binder-to-tailings ratio of 1:8. After the triangular pressure pulse was applied, the blast-induced disturbance initially propagated through the orebody, and a relatively concentrated high-velocity region developed near the wave front. When the disturbance reached the orebody–backfill interface, its propagation pattern changed because of the pronounced differences in stiffness and wave impedance between the two materials.
Part of the incident wave was reflected into the orebody, whereas the remaining wave was transmitted into the backfill. The transmitted response gradually spread, and the high-velocity region decreased as the propagation distance increased. This phenomenon indicates that wave reflection at the interfaces, material damping, and deformation of the backfill affected the propagation of the blast-induced disturbance.
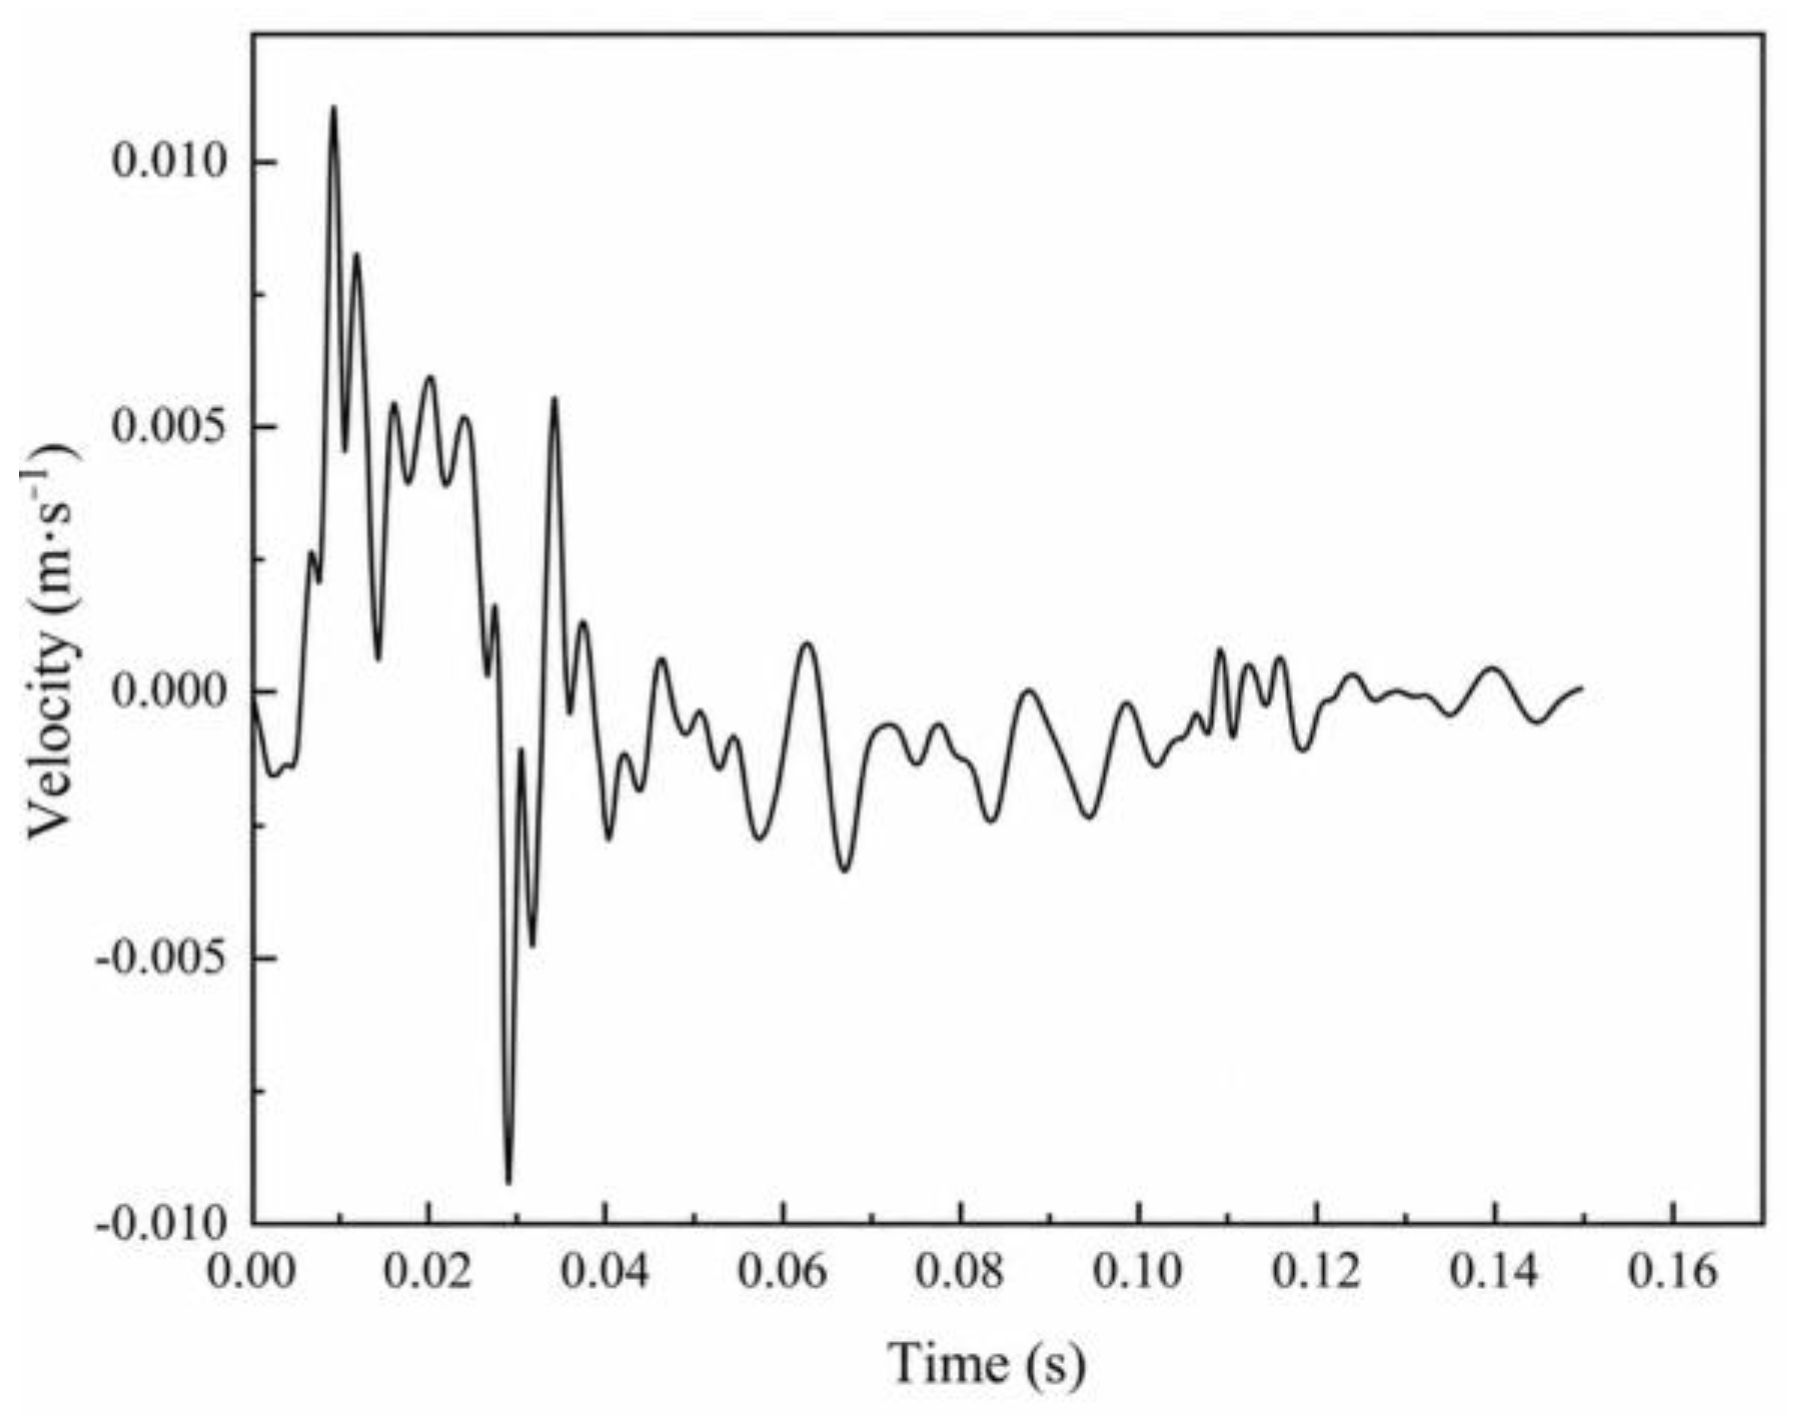
The horizontal velocity history at Point 3 is shown in Figure 23. The particle velocity increased rapidly and reached a positive peak of approximately 0.011 m/s at approximately 0.01 s. Subsequently, the velocity changed direction and reached a negative peak of approximately −0.009 m/s at approximately 0.03 s. The oscillation amplitude then gradually decreased, and the velocity approached zero after approximately 0.12 s.
The alternating positive and negative velocities reflect the arrival, reflection, and superposition of stress waves at the material interfaces. The gradual reduction in velocity amplitude indicates that the dynamic response attenuated with time after reaching the opposite side of the backfill.

3.4.2. Dynamic Stress Response

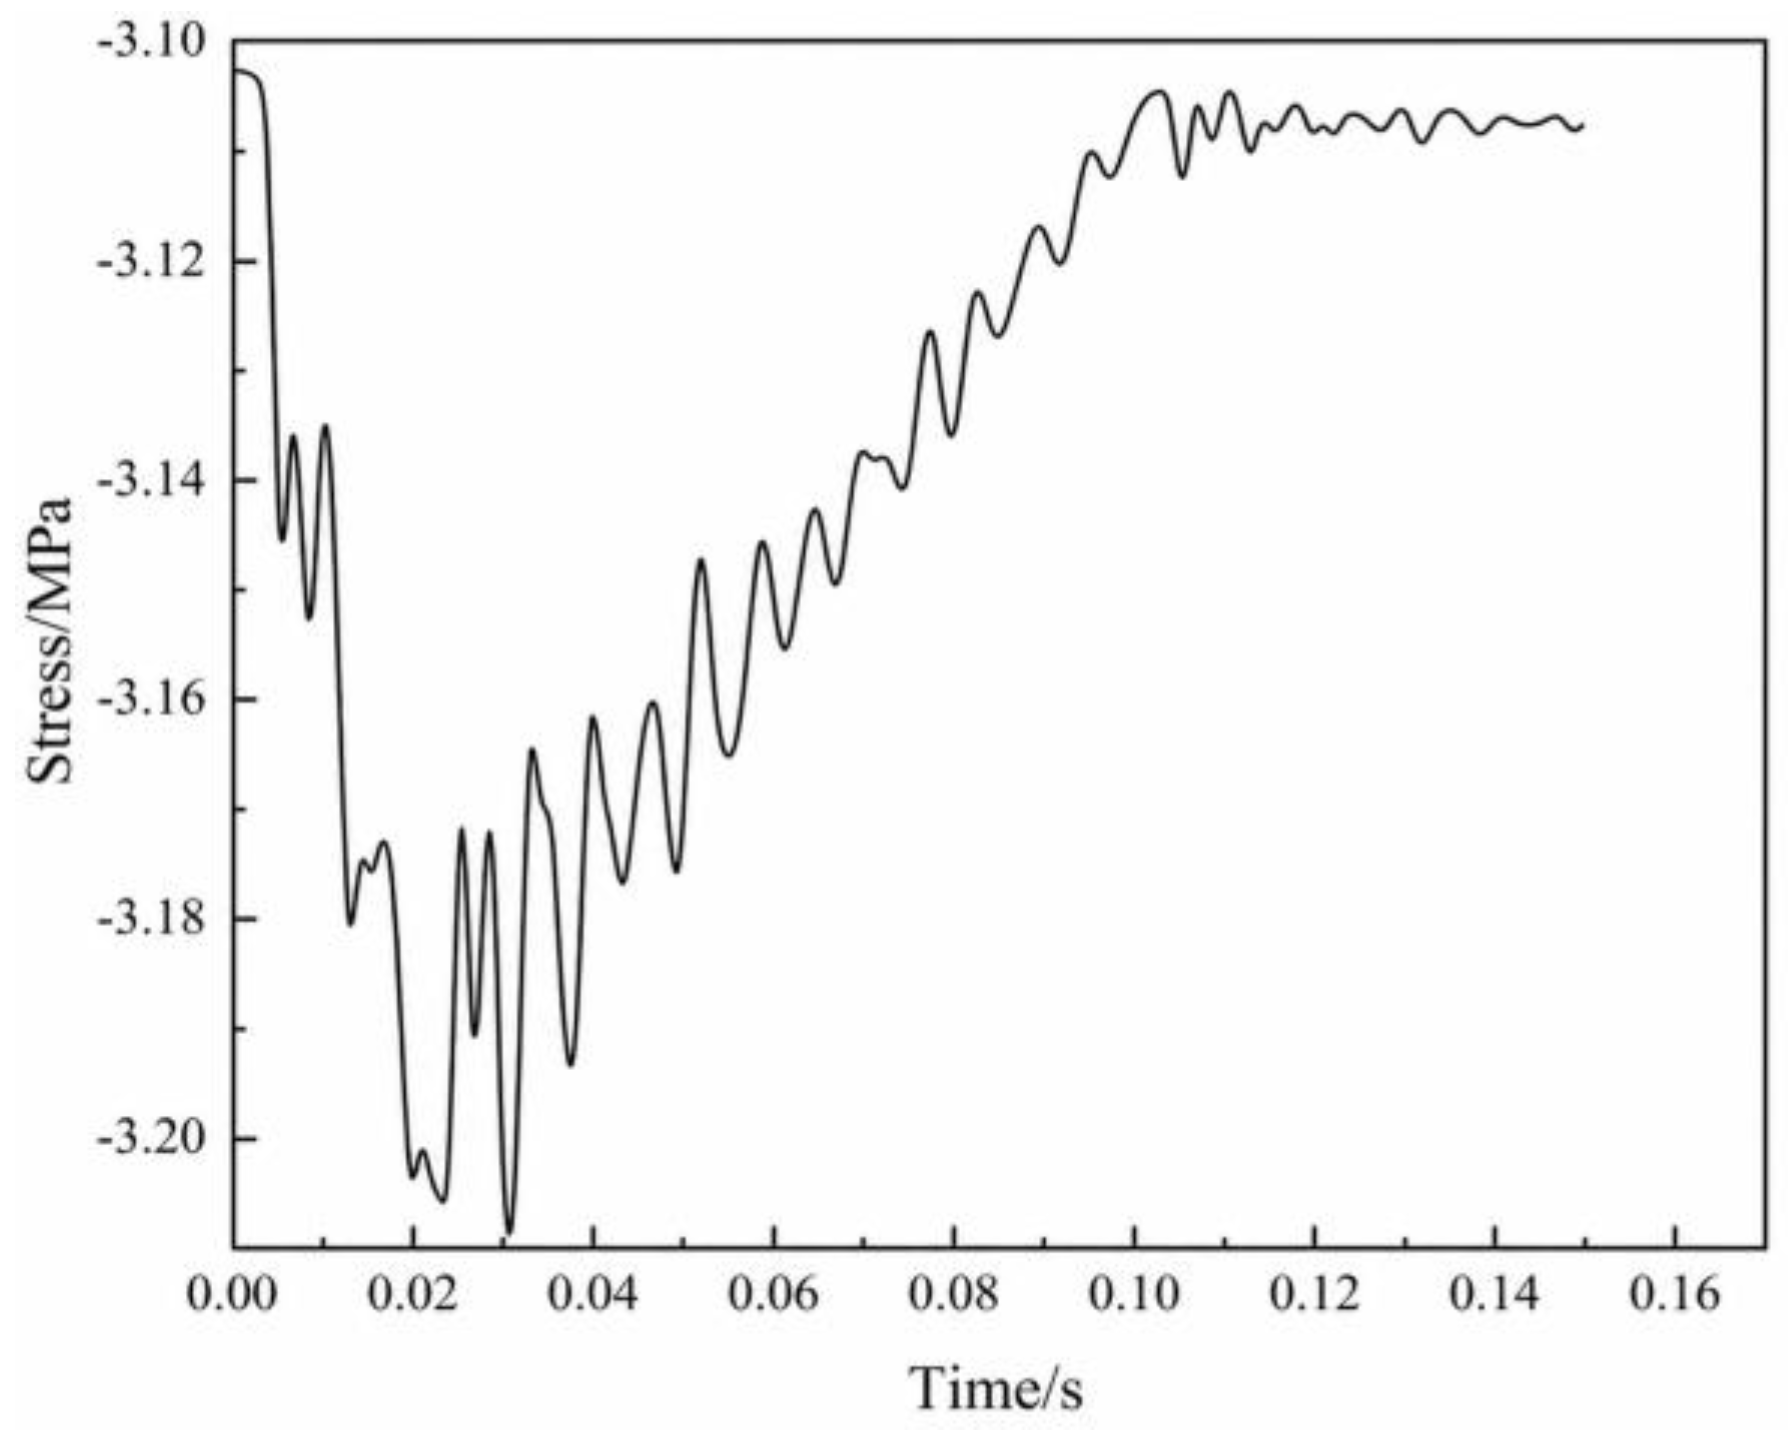
Figure 24 shows the horizontal stress history at Point 2, located at the center of the backfill. The stress remained negative throughout the calculation, indicating that the monitored region was continuously under compression. Before the arrival of the blast-induced disturbance, the compressive stress was approximately 3.10 MPa. It increased after dynamic loading and reached a maximum compressive magnitude of approximately 3.21 MPa at approximately 0.03 s.
The stress subsequently exhibited nonlinear oscillations and gradually returned to approximately 3.11 MPa after 0.11 s. Thus, the additional dynamic compressive stress at Point 2 was approximately 0.11 MPa. Compared with the pressure applied to the blasting free surface, the stress increment inside the backfill was substantially smaller, demonstrating the combined attenuation effects of spatial propagation, wave reflection at the orebody–backfill interface, and energy dissipation within the backfill. The stress value at Point 2 represents a confined multiaxial stress state and should not be compared directly with the uniaxial compressive strength as an independent failure criterion.

3.4.3. Interface Displacement Response

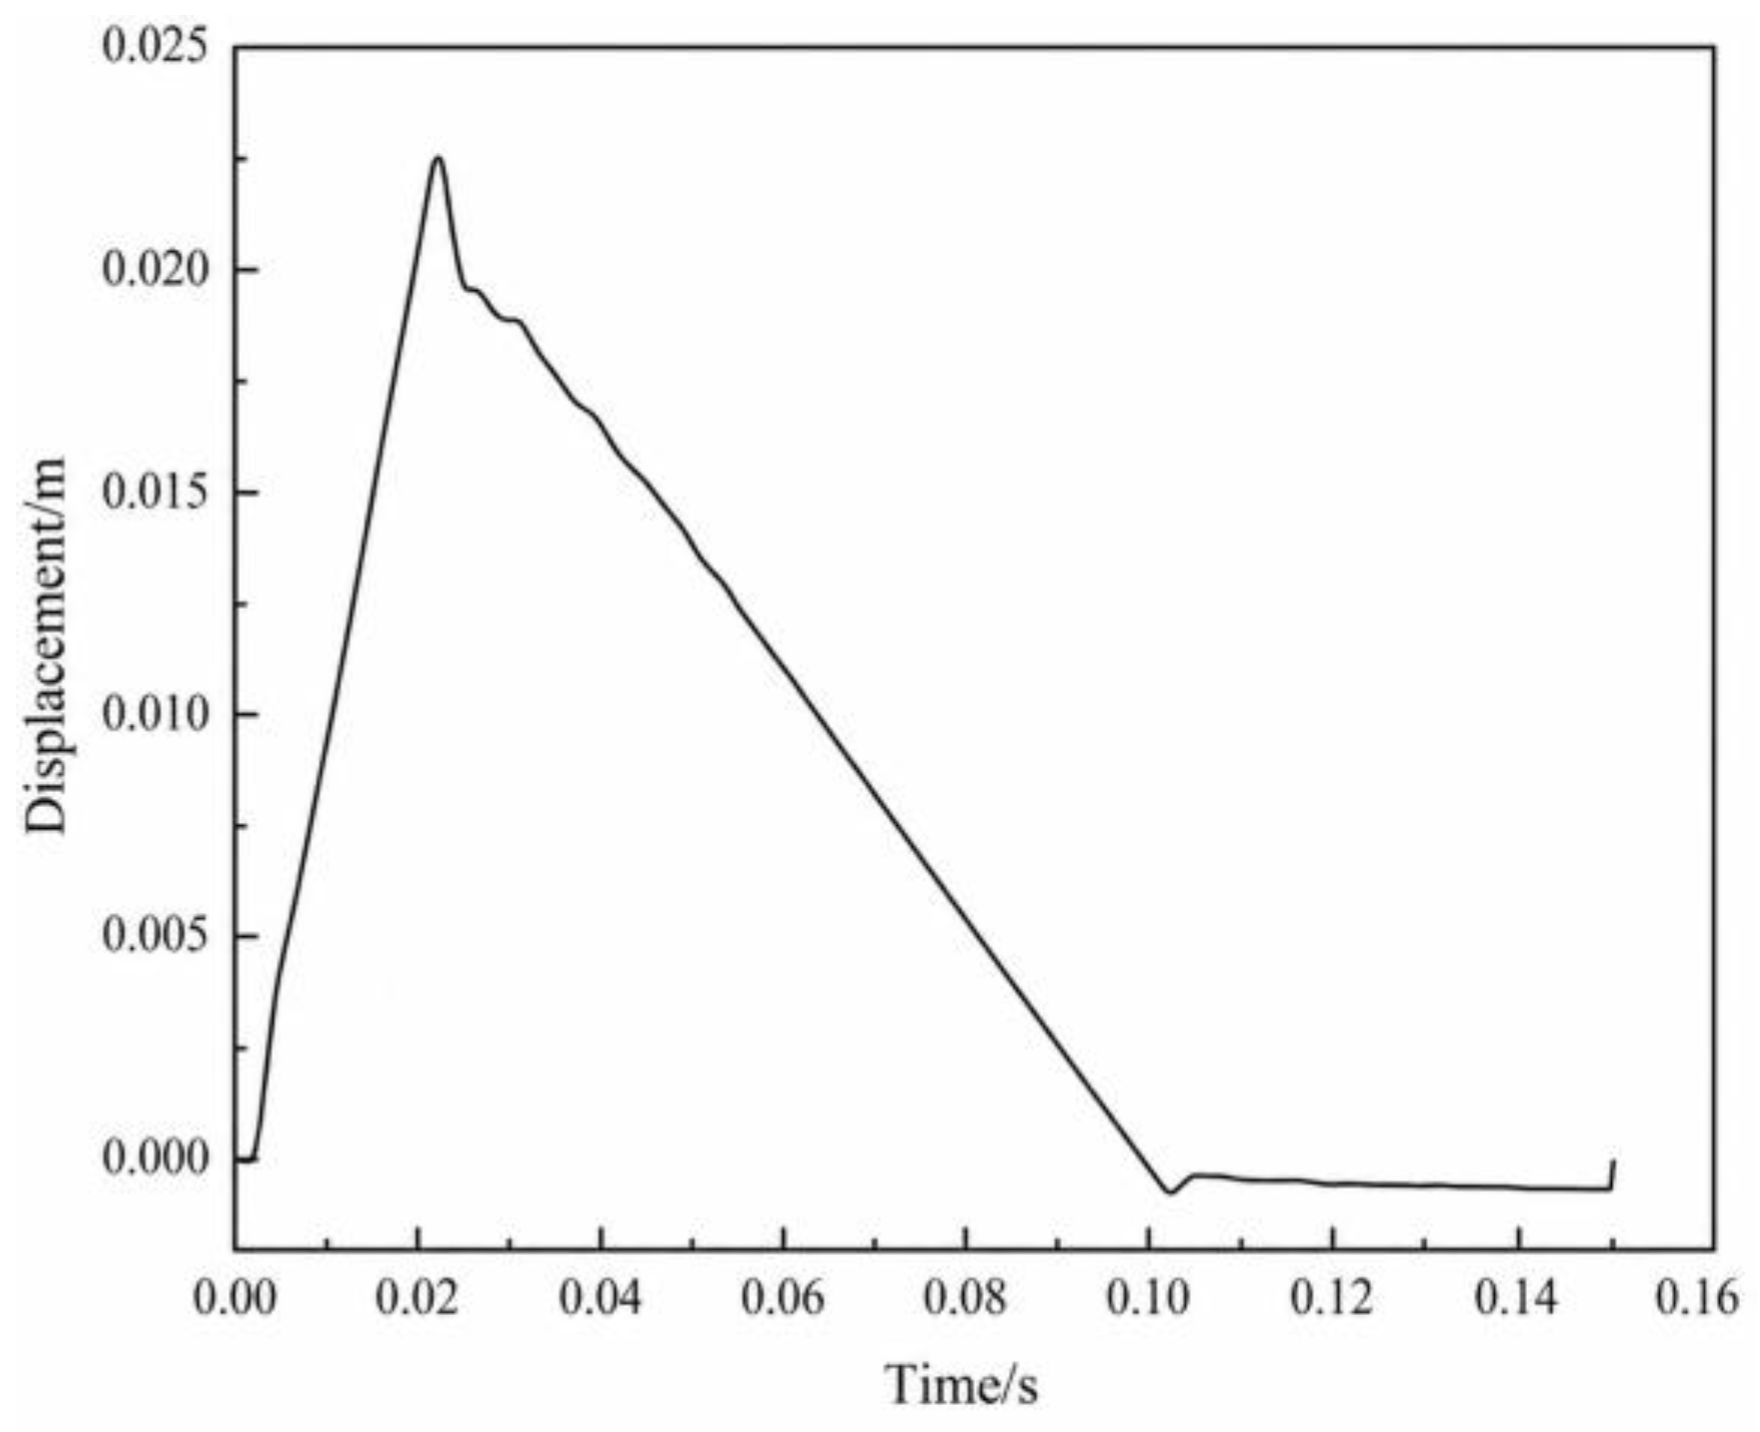
Point 1 was located at the orebody–backfill interface and was used to evaluate the deformation compatibility of the two materials. As shown in Figure 25, the horizontal displacement increased rapidly during the loading stage and reached a maximum value of approximately 0.0225 m at approximately 0.022 s.
During unloading, the displacement gradually decreased and approached zero at approximately 0.10 s. A small residual displacement remained during the subsequent vibration stage. The rapid increase in interface displacement indicates that the pronounced stiffness contrast between the orebody and backfill resulted in deformation incompatibility when the stress wave crossed the interface. This deformation difference may contribute to localized deformation near the interface.

3.4.4. Dynamic Plastic-Zone Analysis

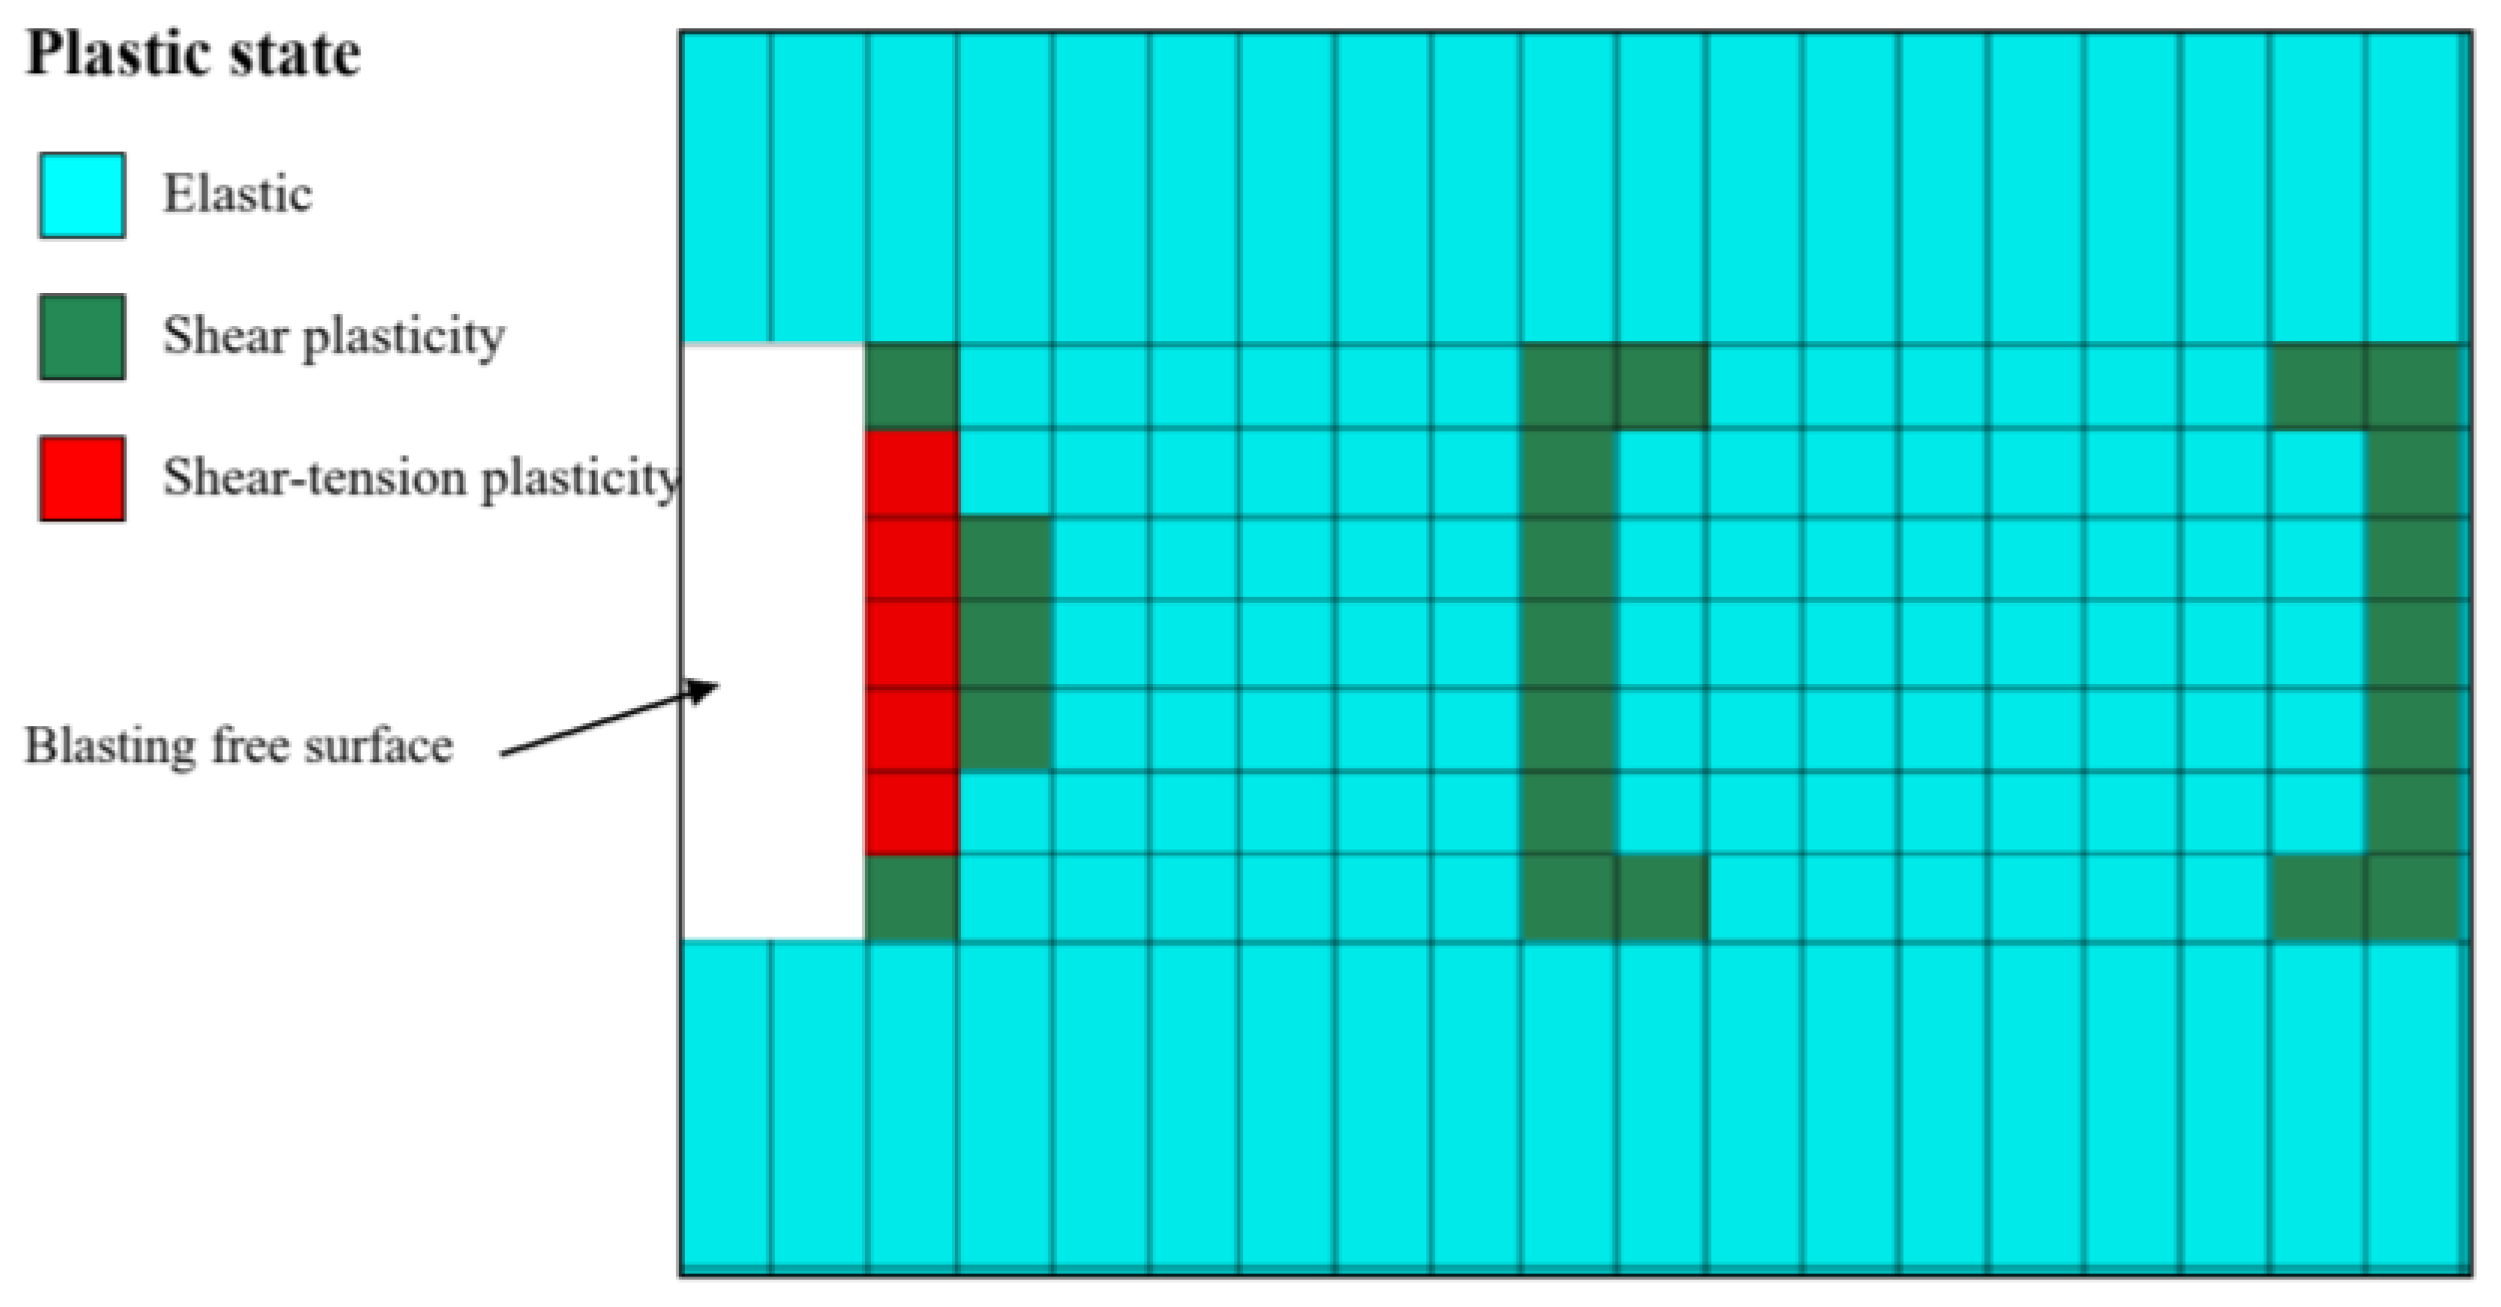
The plastic-zone distribution after blasting is shown in Figure 26. Shear plastic zones were mainly concentrated near the orebody–backfill interfaces, whereas combined shear and tensile failure occurred near the blasting free surface. Plastic deformation was not uniformly distributed throughout the backfill but was concentrated along the boundaries between materials with substantially different mechanical properties.
When the stress wave propagated from the high-stiffness orebody into the lower-stiffness backfill, reflection and transmission occurred simultaneously at the interface. The resulting stress superposition and deformation incompatibility promoted shear yielding along the material boundary. The cumulative evolution of these plastic zones under repeated blasting requires further investigation.

4. Stope Safety Monitoring

During and after the secondary extraction process, the formed goaf may induce continuous deformation in the high backfill bodies on both sides. The stress redistribution caused by mining further increases the internal stress of the first-stage backfill and may even trigger localized large deformation. Meanwhile, during secondary extraction, the first-stage backfill is exposed on one side, resulting in lateral displacement. Excessive lateral displacement can seriously threaten the overall stability of the stope. Therefore, dynamic monitoring of the first-stage backfill is not only an important means of understanding ground pressure behavior in the stope, but also a fundamental prerequisite for ensuring safe and stable stope extraction.

4.1. Stope Safety Monitoring Scheme

A displacement monitoring scheme was developed to track backfill deformation during secondary extraction, taking into account the existing roadway layout and available monitoring equipment. Boreholes were drilled directly from the drilling chamber of the first-stage backfill, and multipoint extensometers together with stress meters were installed within the monitored stope. The stope width is 15 m, and the distance from the drilling drift wall to the backfill boundary is approximately 8 m. Accordingly, installing the multipoint extensometer at a borehole depth of 20 m enables effective monitoring of horizontal displacement variations in the central region of the stope.

4.2. Analysis of Monitoring Results

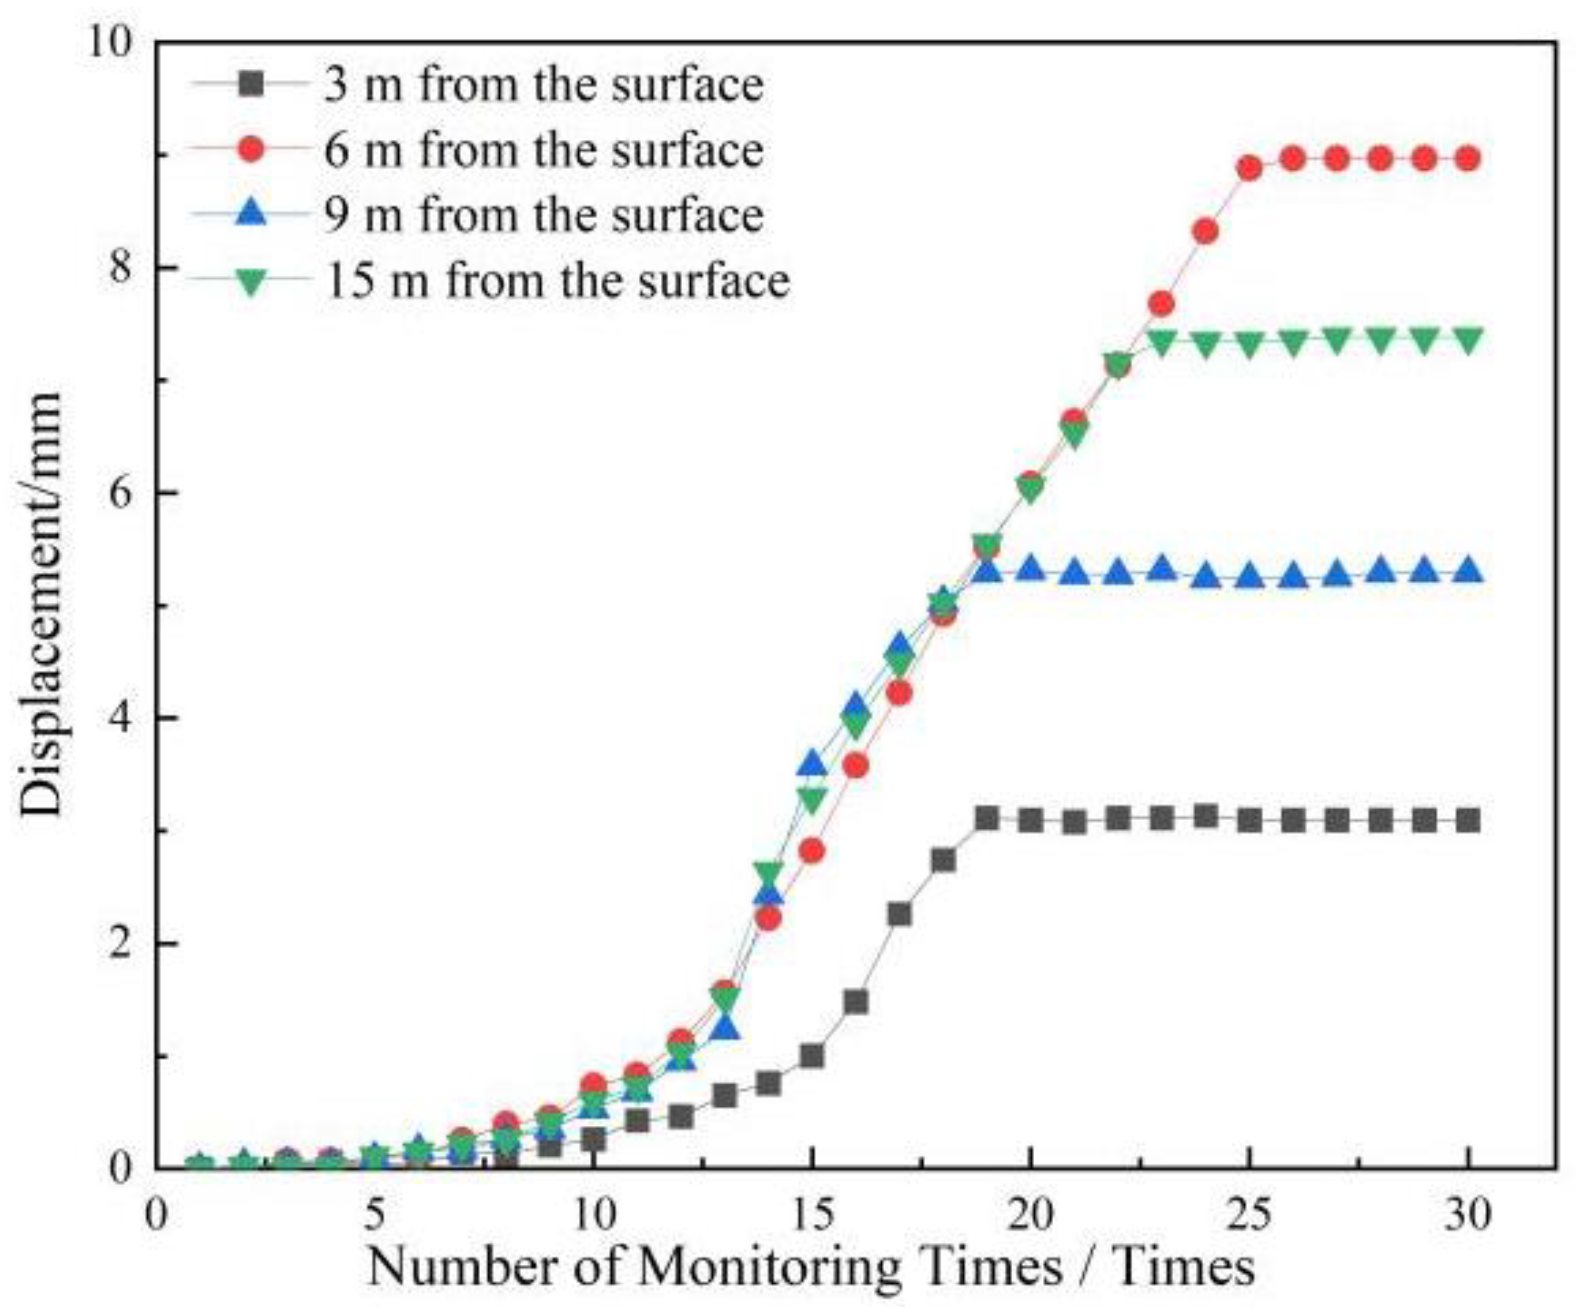
As shown in Figure 27, during the initial mining stage, the lateral displacement of the backfill is relatively small and gradually increases with the enlargement of the exposed area. The deformation is mainly concentrated during continuous secondary stope extraction, during which the displacement growth rate increases significantly and the risk of instability at the exposed backfill surface rises accordingly. After the application of the flexible protective mesh, the maximum lateral displacement of the backfill on both sides is 8.97 mm. Upon completion of secondary extraction, the displacement at the exposed surfaces of both sides of the goaf remains generally stable. The overall displacement exhibits a clear spatial attenuation trend, with displacement decreasing as the distance from the exposed surface increases. These displacement evolution characteristics indicate that the selected binder-to-tailings ratio is highly applicable. The extraction process does not induce large-scale sliding failure of the backfill, and its influence on overall mining operations remains limited. The field monitoring results demonstrate satisfactory performance under the monitored operating conditions, but do not constitute direct validation of the dynamic numerical model because no comparison of measured and simulated transient dynamic responses was performed.

4.3. Field Performance Evaluation

After the backfill with a mass concentration of 78% and a binder-to-tailings ratio of 1:8 was adopted together with the flexible protective mesh, no large-scale backfill instability occurred in the monitored mining area. After completion of blasting and ore extraction in the secondary stope, a three-dimensional laser scanning system was used to scan the entire exposed surface of the mined-out area. The acquired point-cloud data were processed through registration, noise removal, and format standardization and were subsequently imported into the Dimine 2022 mining software for three-dimensional reconstruction and engineering evaluation. The principal technical and economic indicators obtained from the field application are listed in Table 10.

5. Conclusions

(1)
Laboratory tests showed that compressive strength increased with slurry concentration and binder content over the tested ranges. The optimal mixture was determined as 78% slurry concentration with a binder-to-tailings ratio of 1:8.
(2)
Considering both self-supporting capacity and blasting disturbance, the governing analytical design strength of cemented backfill was determined to be 2.45 MPa.
(3)
SHPB tests on the selected backfill mixture showed that its dynamic peak stress increased from 4.09 to 19.15 MPa as the average strain rate increased from 50 to 152 s−1, while the DIF increased from 1.52 to 7.12, demonstrating a pronounced nonlinear rate-strengthening effect. These results provide experimental evidence of the dynamic load-bearing capacity of the mixture, although they should not be interpreted as direct full-scale validation of the 2.45 MPa design criterion.
(4)
Numerical simulations indicated deformation concentration near the orebody–backfill interfaces and improved deformation control with flexible mesh reinforcement. Field monitoring recorded a maximum lateral displacement of 8.97 mm, with no large-scale backfill instability observed in the monitored area.
(5)
The proposed evaluation and reinforcement method provides a practical approach for improving the stability of cemented backfill during secondary extraction in underground metal mines with similar or comparable engineering conditions.

Author Contributions

Conceptualization, L.Z. and Z.D.; Methodology, X.L.; Software, L.Z. and Z.D.; Validation, G.L.; Formal analysis, Z.D.; Investigation, Z.D.; Resources, L.Z.; Data curation, L.Z. and G.L.; Writing – original draft, X.L.; Writing – review & editing, L.Z.; Supervision, G.L.; Project administration, G.L.; Funding acquisition, G.L. All authors have read and agreed to the published version of the manuscript.

Funding

This research was funded by the National Natural Science Foundation of China, grant number 52174077.

Institutional Review Board Statement

Not applicable.

Informed Consent Statement

Not applicable.

Data Availability Statement

The original contributions presented in the study are included in the article, further inquiries can be directed to the corresponding author.

Conflicts of Interest

The authors declare no conflict of interest.

References

  1. Cacciuttolo, C.; Atencio, E. In-pit disposal of mine tailings for a sustainable mine closure: A responsible alternative to develop long-term green mining solutions. Sustainability 2023, 15, 6481. [Google Scholar] [CrossRef] [Scilit]
  2. Srivani Maddala, V.K.; Sharma, S.; Chohan, J.; Kumar, R. Green mining techniques to curb environmental problems—A Review. IOP Conf. Ser. Earth Environ. Sci. 2021, 889, 012026. [Google Scholar] [CrossRef] [Scilit]
  3. Li, S.; Yu, L.; Jiang, W.; Yu, H.; Wang, X. The recent progress China has made in green mine construction, Part I: Mining groundwater pollution and sustainable mining. Int. J. Environ. Res. Public Health 2022, 19, 5673. [Google Scholar] [CrossRef] [Scilit] [PubMed]
  4. Pouresmaieli, M.; Ataei, M.; Qarahasanlou, A.N.; Barabadi, A. Integration of renewable energy and sustainable development with strategic planning in the mining industry. Results Eng. 2023, 20, 101412. [Google Scholar] [CrossRef] [Scilit]
  5. Du, K.; Xie, J.; Xi, W.; Wang, L.; Zhou, J. Construction practices of green mines in China. Sustainability 2024, 16, 461. [Google Scholar] [CrossRef] [Scilit]
  6. Bernd, G.L. Mine Wastes, Characterization, Treatment and Environmental Impacts; Springer Science & Business Media: Berlin/Heidelberg, Germany, 2007. [Google Scholar]
  7. Xu, D.M.; Zhan, C.L.; Liu, H.X.; Lin, H.Z. A critical review on environmental implications, recycling strategies, and ecological remediation for mine tailings. Environ. Sci. Pollut. Res. 2019, 26, 35657–35669. [Google Scholar] [CrossRef] [Scilit] [PubMed]
  8. Sheshpari, M. A review of underground mine backfilling methods with emphasis on cemented paste backfill. Electron. J. Geotech. Eng. 2015, 20, 5183–5208. [Google Scholar]
  9. Cacciuttolo, C.; Marinovic, A. Experiences of underground mine backfilling using mine tailings developed in the Andean region of Peru: A green mining solution to reduce socio-environmental impacts. Sustainability 2023, 15, 12912. [Google Scholar] [CrossRef] [Scilit]
  10. Li, S.; Zou, P.; Yu, H.; Hu, B.; Wang, X. Advantages of backfill mining method for small and medium-sized mines in china: Safe, eco-friendly, and efficient mining. Appl. Sci. 2023, 13, 7280. [Google Scholar] [CrossRef] [Scilit]
  11. Xu, H.; Apel, D.B.; Wang, J.; Wei, C.; Pourrahimian, Y. Investigation of backfilling step effects on stope stability. Mining 2021, 1, 155–166. [Google Scholar] [CrossRef] [Scilit]
  12. Grabinsky, M.; Bawden, W.; Thompson, B. Required plug strength for continuously poured cemented paste backfill in longhole stopes. Mining 2021, 1, 80–99. [Google Scholar] [CrossRef] [Scilit]
  13. Chiloane, N.M.; Sengani, F.; Mulenga, F. An experimental and numerical study of the strength development of layered cemented tailings backfill. Sci. Rep. 2024, 14, 734. [Google Scholar] [CrossRef] [Scilit] [PubMed]
  14. Li, G.; Deng, G.; Ma, J. Numerical modelling of the response of cemented paste backfill under the blasting of an adjacent ore stope. Constr. Build. Mater. 2022, 343, 128051. [Google Scholar] [CrossRef] [Scilit]
  15. Chiloane, N.M.; Mulenga, F.K. Revisiting factors contributing to the strength of cemented backfill support system: A review. J. Rock Mech. Geotech. Eng. 2023, 15, 1615–1624. [Google Scholar] [CrossRef] [Scilit]
  16. Xia, K.; Chen, C.; Liu, X.; Yuan, J. Estimating shear strength of high-level pillars supported with cemented backfilling using the Hoek–Brown strength criterion. J. Rock Mech. Geotech. Eng. 2024, 16, 454–469. [Google Scholar] [CrossRef] [Scilit]
  17. Li, Z.; Yu, B.; Guo, L.; Xu, W.; Zhao, Y.; Peng, X. Numerical study of the layered blasting effect on a cemented backfill stope. Metals 2022, 13, 33. [Google Scholar] [CrossRef] [Scilit]
  18. Zhao, Y.; Yang, R.; Zuo, J.; Liu, Z.; Wang, W. Dynamic response characteristics of backfill under blasting disturbance simulated through a three-dimensional model. Constr. Build. Mater. 2024, 443, 137685. [Google Scholar] [CrossRef] [Scilit]
  19. Wang, H.; Liu, C.; Zhang, X.; Qiu, H. Influence of wave impedance of backfill medium on explosive stress wave propagation and rock mass damage evolution. Sci. Rep. 2025, 15, 35362. [Google Scholar] [CrossRef] [Scilit] [PubMed]
  20. Zhang, Y.; Xu, M.; Liu, S.; Wang, Q. Rate-dependent constitutive modelling blasting crack initiation and propagation in rock masses. Int. J. Coal Sci. Technol. 2023, 10, 83. [Google Scholar] [CrossRef] [Scilit]
  21. Li, Q.; Sun, J.; Xie, X.; Dong, Q.; Wang, J.; Zhang, H.; Wen, T. Numerical study on impact damage and damage evolution of cemented backfill. Crystals 2025, 15, 514. [Google Scholar] [CrossRef] [Scilit]
  22. Zheng, D.; Liu, G.; Guo, L.; Yang, X.; Wu, S.; Zhao, Y. Initial pore distribution characteristics and crack failure development of cemented tailings backfill under low impact amplitude. Front. Earth Sci. 2023, 11, 1330766. [Google Scholar] [CrossRef] [Scilit]
  23. Guo, J.; Yu, L.; Feng, G.; Guo, Y.; Dias, D.; Bai, J.; Qi, T.; Wen, X.; Zhang, J. Damage evolution and failure characteristics of a cemented gangue backfill considering direct shear and dynamic tests. Constr. Build. Mater. 2024, 415, 135099. [Google Scholar] [CrossRef] [Scilit]
  24. Yin, S.; Zeng, J.; Yan, Z.; Wang, L.; Chen, W.; Chen, D.; Yang, J. Damage constitutive models and damage evolution of cemented tailings and waste-rock backfill under impact loading. Constr. Build. Mater. 2025, 460, 139838. [Google Scholar] [CrossRef] [Scilit]
  25. Qiu, H.; Qiu, X.; Cao, R.; Chen, X.; Shi, X.; Tian, Z.; Li, X. Experimental study on layered cemented tailings backfill damage and failure mechanisms under blast loading. Sci. Rep. 2026, 16, 11339. [Google Scholar] [CrossRef] [Scilit] [PubMed]
  26. Li, Z.; Guo, L.; Zhao, Y.; Peng, X.; Kyegyenbai, K. A particle size distribution model for tailings in mine backfill. Metals 2022, 12, 594. [Google Scholar] [CrossRef] [Scilit]
  27. Peng, X.; Guo, L.; Liu, G.; Yang, X.; Chen, X. Experimental study on factors influencing the strength distribution of in situ cemented tailings backfill. Metals 2021, 11, 2059. [Google Scholar] [CrossRef] [Scilit]
  28. Wen, Z.; Xiao, B.; Wei, H.; Ba, L.; Yang, X.; Gao, Q.; Chen, B. Determination of the curing time and appropriate strength of cement grout based on energy matching relationships. Chin. J. Rock Mech. Eng. 2021, 40, 2701–2707. [Google Scholar]
  29. GB/T 50080-2016; Standard for Test Method of Performance on Ordinary Fresh Concrete. China Architecture & Building Press: Beijing, China, 2016.
  30. GB/T 51450-2022; Technology Standard for Backfill Engineering in Metallic and Non-Metallic Mines. China Planning Press: Beijing, China, 2022.
  31. Thomas, E.G. Fill Technology in Underground Metalliferous Mines; International Academic Services Ltd.: Kingston, ON, Canada, 1979; pp. 35–41. [Google Scholar]
  32. Terzaghi, K. Theoretical Soil Mechanics; John Wiley & Sons: New York, NY, USA, 1943. [Google Scholar]
  33. Sperl, M. Experiments on corn pressure in silo cells—Translation and comment of Janssen’s paper from 1895. Granul. Matter 2006, 8, 59–65. [Google Scholar] [CrossRef] [Scilit]
  34. Mitchell, R.J.; Olsen, R.S.; Smith, J.D. Model studies on cemented tailings used in mine backfill. Can. Geotech. J. 1982, 19, 14–28. [Google Scholar] [CrossRef] [Scilit]
  35. Liu, G.S.; Li, L.; Yang, X.C.; Guo, L.J. Required strength evaluation model and its application for vertically exposed backfill: Inspired by Mitchell’s physical model tests. In Paste 2019; Australian Centre for Geomechanics: Perth, Australia, 2019; pp. 451–466. [Google Scholar]
  36. Cai, S.J.; Wang, H.J. Modern Backfill Theory and Technology; Metallurgical Industry Press: Beijing, China, 2012. [Google Scholar]
  37. Kolsky, H. Stress Waves in Solids; Dover Publications: New York, NY, USA, 1963. [Google Scholar]
  38. Jia, B.; Zhou, L.; Cui, J.; Chen, H. Attenuation model of tunnel blast vibration velocity based on the influence of free surface. Sci. Rep. 2021, 11, 21077. [Google Scholar] [CrossRef] [Scilit] [PubMed]
  39. Zhang, L.; Deng, Z.; Li, G. Application of Pipe Slit Anchor Mesh Spraying Supporting Technology Based on Loose Circle Supporting Theory in Makeng Iron Ore Mine. Appl. Sci. 2025, 15, 5537. [Google Scholar] [CrossRef] [Scilit]
  40. Liu, X.; Wang, W.; Li, H. A Study on Three-Dimensional Flexible Mesh Influence on the Stability of Reserved Tunnels in Cemented Backfill. Materials 2025, 18, 3291. [Google Scholar] [CrossRef] [Scilit] [PubMed]
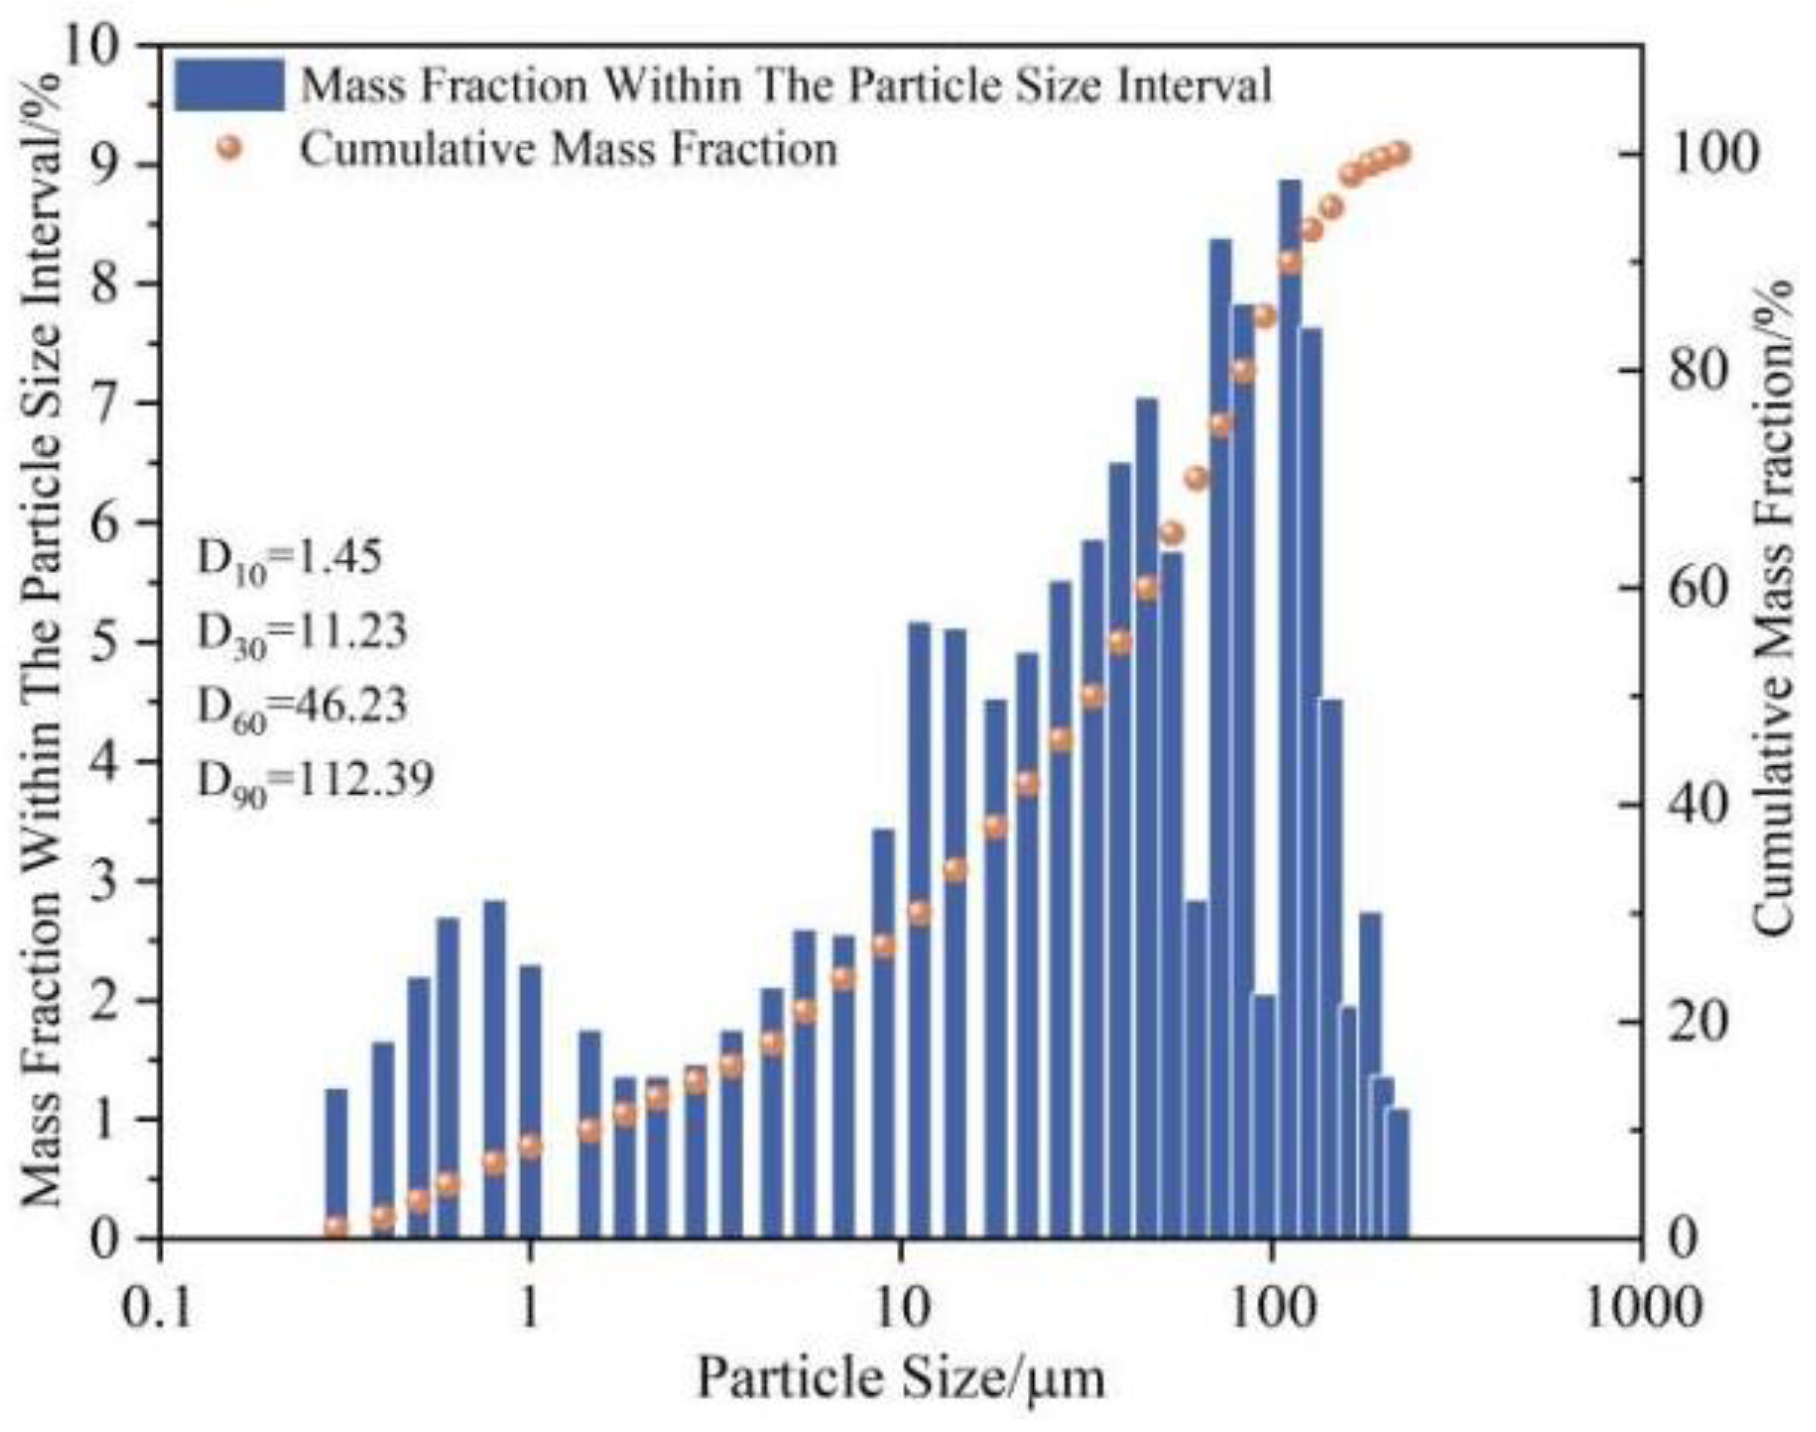
Figure 1. Particle size gradation distribution of full tailings.
Applsci 16 09233 g001
Figure 2. Full tailings from the Makeng Iron Mine.
Applsci 16 09233 g002
Figure 3. P.O 42.5 composite Portland cement.
Applsci 16 09233 g003
Figure 4. Preparation of experimental specimens. (a) Mortar Mixer; (b) Mold; (c) SHBY-90B Constant Temperature and Humidity Curing Chamber (Shanghai Leiyun Test Instrument Manufacturing Co., Ltd., Shanghai, China).
Applsci 16 09233 g004
Figure 5. Variation in tailings slurry concentration with sedimentation time.
Applsci 16 09233 g005
Figure 6. Slump measurement result.
Applsci 16 09233 g006
Figure 7. Rock physical and mechanical parameter test.
Applsci 16 09233 g007
Figure 8. Photo of compressive strength test.
Applsci 16 09233 g008
Figure 9. Compressive strength of backfill with different binder-to-tailings ratios.
Applsci 16 09233 g009
Figure 10. Compressive strength of backfill at different mass concentrations.
Applsci 16 09233 g010
Figure 11. Typical impact waveforms and stress-equilibrium condition obtained from the SHPB test. (a) Raw SHPB waveforms; (b) Stress-equilibrium condition.
Applsci 16 09233 g011
Figure 12. Relationship between average strain rate and dynamic increase factor of the 1:8 backfill.
Applsci 16 09233 g012
Figure 13. Numerical calculation horizontal model.
Applsci 16 09233 g013
Figure 14. Displacement contour plots of the two-step stope in the unmined state (m).
Applsci 16 09233 g014
Figure 15. Displacement of the backfill body before and after support (m). (a) Unsupported condition; (b) Flexible mesh support condition.
Applsci 16 09233 g015
Figure 16. Maximum principal stress contour plots of stope cross section (Pa). (a) Unsupported condition; (b) Flexible mesh support condition.
Applsci 16 09233 g016
Figure 17. Minimum principal stress contour plots of stope cross section (Pa). (a) Unsupported condition; (b) Flexible mesh support condition.
Applsci 16 09233 g017
Figure 18. Distribution of plastic zones in the two-step stope in the unmined state.
Applsci 16 09233 g018
Figure 19. Changes in the plastic zone before and after support. (a) Unsupported condition; (b) Flexible mesh support condition.
Applsci 16 09233 g019
Figure 20. Three-dimensional dynamic model, boundary conditions, blast loading, and monitoring-point arrangement.
Applsci 16 09233 g020
Figure 21. Equivalent triangular pressure–time history used in the dynamic calculation. The cyan circle marks the peak pressure.
Applsci 16 09233 g021
Figure 22. Horizontal particle-velocity field of the 1:8 backfill under blast loading (m/s).
Applsci 16 09233 g022
Figure 23. Horizontal velocity–time history at Point 3 for the 1:8 backfill.
Applsci 16 09233 g023
Figure 24. Horizontal stress–time history at Point 2 for the 1:8 backfill.
Applsci 16 09233 g024
Figure 25. Horizontal displacement–time history at Point 1 for the 1:8 backfill.
Applsci 16 09233 g025
Figure 26. Plastic-zone distribution under blast loading.
Applsci 16 09233 g026
Figure 27. Monitoring results of the lateral displacement of the backfill.
Applsci 16 09233 g027
Table 1. Main components of tailings.
IngredientsSiO2Al2O3MgOFe2O3CaOTiO2Na2OCaF2K2O
Content (%)45.413.844.0814.7422.180.210.593.170.55
Table 2. Determination of main chemical components of Portland cement.
IngredientsSiO2CaOMgOAl2O3Fe2O3K2OOther
Content (%)21.4362.342.614.255.061.073.24
Table 3. Test strength of cemented backfill with total tailings.
Binder-to-Tailings RatioMass Concentration (%)Compressive Strength (MPa)
Mean ± SD
1:4722.02 ± 0.17
742.44 ± 0.10
763.27 ± 0.17
784.32 ± 0.10
1:6721.39 ± 0.15
741.72 ± 0.10
762.30 ± 0.07
783.08 ± 0.16
1:8720.93 ± 0.15
741.39 ± 0.20
761.97 ± 0.14
782.69 ± 0.10
1:10720.73 ± 0.06
741.01 ± 0.15
761.44 ± 0.12
782.07 ± 0.16
Table 4. Physical and mechanical parameters.
Binder-to-Tailings RatioBulk Density (g/cm3)Poisson’s RatioUniaxial Compressive Strength (MPa)Tensile Strength
(MPa)
Internal Friction Angle (°)
1:42.100.254.320.2540.12
1:62.110.293.080.2738.32
1:82.120.322.690.2136.37
1:102.160.332.070.1935.87
Table 5. Summary table of backfill calculation strength.
Stope Height (m)Calculated Strength of the Backfill (MPa)
Thomas FormulaTerzaghi
Formula
Mitchell
Formula
Janssen EquationOverburden Load-Bearing MethodCai Sijing Empirical Formula
541.421.511.751.941.541.71
601.521.651.852.121.711.84
721.6881.912.032.452.052.08
Table 6. SHPB test results for the selected backfill mixture with a binder-to-tailings ratio of 1:8.
Average Strain Rate (s−1)Dynamic Peak Stress (MPa)Dynamic Increase Factor
504.091.52
687.022.61
9310.013.72
11012.994.83
12415.415.73
14116.736.22
15219.157.12
17118.596.89
Table 7. Simulation parameters.
Rock MassCompressive Strength
(MPa)
Elastic Modulus
(GPa)
Cohesion
(MPa)
Internal Friction Angle
(°)
Orebody143.4347.727.6547.88
Backfill2.690.71.7636.37
Surrounding Rock88.836.8318.2841.05
Table 8. Main parameters of the numerical model of flexible protective mesh.
StripNode
Density
(kg/m3)
Elastic Modulus
(MPa)
Poisson’s RatioFracture StrainStress TriaxialityNormal Stiffness
(MPa)
Shear Stiffness
(MPa)
Normal Strength
(MPa)
Shear Strength
(MPa)
300028000.350.150.332001502017
Table 9. Mechanical parameters used in the dynamic numerical model.
MaterialDensity (g/cm3)Elastic Modulus (GPa)Poisson’s RatioCohesion (MPa)Internal Friction Angle (°)
Surrounding rock2.6941.510.2718.2841.89
Orebody3.8247.700.2727.6547.88
Quartz sandstone2.5436.830.2827.1441.05
Backfill2.120.700.321.7636.37
Table 10. Principal technical and economic indicators of the field application.
No.IndicatorUnitValue
1Stope production capacityt/d1500–3000
2Ore loss rate%11.78
3Designed ore dilution rate%11.37
4Waste-rock mixing rate%4.14
5Actual ore dilution rate%2.96
Disclaimer/Publisher’s Note: The statements, opinions and data contained in all publications are solely those of the individual author(s) and contributor(s) and not of MDPI and/or the editor(s). MDPI and/or the editor(s) disclaim responsibility for any injury to people or property resulting from any ideas, methods, instructions or products referred to in the content.