Article

Automated Handwriting Analysis for Early Risk Screening of Learning Disabilities in Arabic-Speaking Children Using Convolutional Neural Networks (CNNs)

by
Sarah Mohammed AlMuraytib
1,*,
Majid Almaraashi
1,
Noura Alotaibi
1 and
Samer Alhassani
2
1
Department of Computer Science and Artificial Intelligence, University of Jeddah, Jeddah 21589, Saudi Arabia
2
Department of Special Education, University of Jeddah, Jeddah 21589, Saudi Arabia
*
Author to whom correspondence should be addressed.
Appl. Sci. 2026, 16(18), 9163; https://doi.org/10.3390/app16189163
Submission received: 21 August 2026 / Revised: 11 September 2026 / Accepted: 13 September 2026 / Published: 15 September 2026
(This article belongs to the Section Computing and Artificial Intelligence)

Abstract

Handwriting analysis has recently emerged as a modality for the early identification of learning disabilities, as it can reveal characteristic patterns associated with motor control, spatial planning, and cognitive processing. Nevertheless, most existing automated handwriting analysis systems focus primarily on Latin scripts, while Arabic handwriting remains largely unexplored despite its distinct structural and morphological characteristics. This research presents a Convolutional Neural Network (CNN) model for the early risk screening of dysgraphia in the handwriting of Arabic-speaking children. A specialist-annotated dataset comprising 259 handwriting samples from fourth-grade students in Saudi Arabia was collected and preprocessed using a pipeline that included grayscale conversion, Otsu binarization, spatial normalization, and data augmentation. A custom CNN architecture with batch normalization and global average pooling (GAP) was trained with focal loss to address class imbalance. Furthermore, ten handwriting features grounded in prior literature were extracted and evaluated using four classical machine learning classifiers under identical experimental conditions. The proposed CNN model achieved satisfactory performance, reaching 88.8% accuracy, 92.3% balanced accuracy, and 98.1% sensitivity, substantially outperforming feature-based machine learning approaches, whose best balanced accuracy reached 62.6%. These results demonstrate that discriminative patterns in Arabic-speaking children’s handwriting can potentially be learned by deep neural networks. The proposed approach could support the early identification of children showing indicators of potential dysgraphia, assisting educators and specialists in making timely referrals for further assessment.

1. Introduction

Learning disabilities are neurodevelopmental conditions that affect how children acquire, process, store, and respond to information. They reflect differences in how the brain processes information and handles specific cognitive tasks, such as reading, writing, and language processing. Learning disabilities encompass a spectrum of disorders that affect a child’s ability to learn, often manifesting in various aspects of academic performance, including handwriting [1]. Nowadays, learning disabilities represent one of the most persistent challenges in early childhood education. When these conditions remain unidentified during the critical early years of schooling, they may lead to serious long-term consequences, including sustained academic underachievement, reduced self-efficacy, and significant social and psychological difficulties for affected children [2].
Early identification and targeted intervention are the most effective strategies for improving developmental outcomes; therefore, every undetected year narrows the window available for effective intervention [3]. However, traditional screening and diagnostic approaches typically rely on standardized cognitive assessments and structured behavioral observations conducted by trained specialists. Nevertheless, these methods are often time-consuming, costly, dependent on professional expertise, and susceptible to subjectivity, making the evaluation process slow and resource-intensive [1,4,5]. Moreover, children are often assessed only after continuous academic struggles have been observed [5,6]. These limitations highlight the need for screening approaches that are accurate, efficient, objective, automated, and scalable, enabling earlier identification of at-risk children and supporting timely referral for further assessment.
Handwriting has emerged as a particularly informative domain for identifying early indicators of learning disabilities [3,6]. As one of the earliest observable outcomes of a child’s developing cognitive and motor systems, handwriting encodes a rich set of diagnostic signals accessible through simple observation. Variations in handwriting can reveal characteristic patterns related to motor coordination, spatial planning, and cognitive processing, which may help distinguish children with learning disabilities from their typically developing peers [2]. Beyond its role in written expression, handwriting can therefore serve as a valuable early screening modality, offering educators and clinicians accessible yet meaningful insights into a child’s learning profile [1].
Handwriting difficulties often arise from deficits in orthographic knowledge (the understanding of how letters are formed and structured) and impairments in motor skills. Among the most observable manifestations of such disabilities is dysgraphia, a specific learning disorder characterized by persistent problems with handwriting fluency, letter formation, and fine motor coordination during writing [2]. Handwriting contains rich diagnostic information that reflects a child’s cognitive and motor development. Characteristics such as the consistency of stroke formation, regularity of letter sizing, spatial distribution of characters and words, and adherence to the horizontal baseline can reveal meaningful differences in writing behavior. These attributes often differ systematically between typically developing children and those experiencing learning disabilities. Consequently, handwriting patterns may serve as markers of learning challenges, enabling researchers to utilize handwriting samples to identify children who may be at risk [2,7,8].
Recent advances in machine learning and deep learning have attracted increasing attention for the early detection of learning disabilities. Motivated by this perspective, the present study aims to develop an automated approach for recognizing and classifying Arabic children’s handwriting to support the early detection of dysgraphia. In particular, convolutional neural networks (CNNs) are employed due to their proven effectiveness in extracting hierarchical visual features and recognizing complex patterns in image data, making them well-suited for handwriting analysis [6]. CNN-based models are capable of learning both local and global visual representations without requiring manual feature engineering. For handwriting analysis, this includes capturing fine-grained local cues such as stroke texture, edge irregularities, and subtle variations in writing pressure proxies, as well as global structural cues such as layout organization, spacing distribution, line stability, and overall writing rhythm [9,10]. This capability enables CNN models to automatically identify discriminative patterns that may be indicative of learning disabilities.
Within this broader context, the present study specifically focuses on dysgraphia as the target condition; accordingly, the term “learning disabilities” is used when referring to the broader educational and clinical context, whereas “dysgraphia” is used when referring to the specific condition investigated by the proposed model.

Research Gap and Contributions

Despite growing interest in automated handwriting-based screening for learning disabilities, the literature reveals several persistent limitations. Most existing CNN-based studies on learning-disability and dysgraphia detection have been developed and validated on English-language handwriting. and Arabic handwriting, characterized by cursive connectivity, context-dependent letter forms, and diacritic dependency, remains largely unexplored in this context. While Alqahtani et al. [11] recently demonstrated that CNNs can detect dyslexia from isolated Arabic letter images in a Saudi sample, no prior study, to our knowledge, has addressed this task for whole-sample, connected-text Arabic handwriting under a formally validated, multi-stage diagnostic labeling framework. This gap motivates the present research: to develop a CNN model capable of learning discriminative patterns directly from full Arabic handwriting samples, evaluated with metrics appropriate to real-world class imbalance, and benchmarked against classical feature-based classifiers. By addressing this gap, the present research aims to complement and extend recent Arabic-language efforts such as [11], moving from isolated-character classification toward full-sample, page-level analysis. To address this gap, the primary contributions of this study are as follows:
  • Design of a custom CNN architecture capable of learning discriminative Arabic handwriting patterns directly from raw image data, without manual feature engineering.
  • Evaluation of the feasibility of CNN-based early risk screening using full, connected-text Arabic children’s handwriting, while recognizing that independent external validation is required before practical deployment can be considered.
  • Comparison of the performance of the proposed CNN against four classical machine learning classifiers: logistic regression, linear support vector machine (SVM), RBF SVM, and random forest, trained on handcrafted handwriting features, under identical experimental conditions.
The remainder of this paper is organized as follows. Section 2 reviews the related work on the detection of learning disabilities through handwriting analysis. Section 3 describes the methodology adopted in this study. Section 4 presents the experimental setup and the corresponding results. Section 5 discusses the findings, and the paper concludes in Section 6.

2. Related Works

Learning disabilities have gained increasing awareness and growing research interest, and various approaches have been used to detect and diagnose them at an early stage. Recent advances in machine learning and deep learning have led to the development of automated methods for detecting learning disabilities.
The study by Kedar et al. [12] proposed a method for analyzing a child’s writing dynamics using a standardized digital writing pad and machine learning algorithms. The study employed online handwriting analysis, which takes into account factors such as pen pressure, timestamp, and other variables to enhance the effectiveness of the analysis. The dataset used in the research consisted of 60 handwriting samples collected through a WACOM digital tablet, comprising Latin-based (English) handwriting. Handwriting parameters, such as timestamp, time, coordinates, and pressure, were recorded using the digital tablet for each task. Motion, time, and pressure-related features were extracted from the dataset for further analysis. The study compared the performance of different machine learning algorithms, including Random Forest, Decision Tree, and Voting Classifier, for classifying and predicting subjects with learning disabilities. The Random Forest classifier showed the highest accuracy, at 92.59% during testing. The results suggested that features such as the in-air time of the pen, the on-paper time of the pen, and the standard deviation in pressure are essential for accurate classification.
Several studies have applied deep learning techniques, especially CNN, to detect learning disabilities among children using handwriting. CNN is an artificial neural network consisting of multiple layers of neurons that can learn hierarchical features from the input data. The following studies have utilized various CNN architectures and achieved promising results.
Isa et al. [13] presented an automated detection system for identifying dyslexia symptoms in children based on their handwriting images. The study was conducted on English handwriting samples from primary school students. The system used pattern recognition techniques, specifically Optical Character Recognition (OCR), to detect and extract features of written characters. An artificial neural network (ANN) was then used to classify dyslexia risk levels as low risk (LR) and risk (R). The classification accuracy was obtained through automated correct detection and manual calculation. Their proposed system achieved an accuracy rate of 73.33% based on the ANN. Similarly, Isa et al. [14] explored and compared the performance of different CNN models for detecting dyslexia based on handwriting images obtained from a Kaggle database, comprising English Latin-script handwriting. Four CNN models were tested in the study, and each model had a different architecture and was trained on the preprocessed dataset. The study found that the LeNet-5 model had the best accuracy and lowest loss among the tested CNN models.
The study by Vilasini et al. [15] focused on using CNN and Vision Transformers (ViT). The specific learning disability addressed in their study was Motor dysgraphia, which affects a person’s writing ability. The CNN model processed pixel data and classified the writings, while the ViT model prepared patches from each image and analyzed them to make predictions. The proposed model achieved a test accuracy of 86.22% on English handwriting samples.
Moreover, Rosli et al. [5] proposed a CNN model that utilized transfer learning based on the LeNet-5 architecture for dyslexia handwriting recognition. The model was trained and tested on a dataset of 138,500 handwriting images representing three dyslexic handwriting classes: normal, reversal, and corrected, each consisting of English letters. Data augmentation and preprocessing techniques were applied to balance the dataset and improve the model’s performance. The developed CNN model achieved an accuracy of 95.34% in classifying dyslexic handwriting into three classes.
Furthermore, Spoon et al. [16] created two novel datasets: a “messy” set of naturally produced samples (2 dyslexic, 15 non-dyslexic) and a controlled set containing word lists, paragraphs, and story-completion tasks (9 dyslexic, 62 non-dyslexic) collected via classroom sessions, in the English language. Their CNN architecture (5 convolutional layers, 3 max-pooling layers, 2 fully connected layers, dropout) was trained with a 4:1:1 train--validation--test split, and achieved an average accuracy of 55.7 ± 1.4%.
In addition, Yogarajah and Bhushan [17] focused on Hindi-speaking children in India, where dyslexia and dysgraphia are prevalent. The researchers collected handwriting samples from 54 children with a risk of dyslexia and compared them to samples from age-matched children without dyslexia. They analyzed the samples using a CNN to identify specific features indicative of dyslexia–dysgraphia. The CNN achieved an average accuracy of 86.14% in identifying dyslexia–dysgraphia based on the handwriting samples.
Moreover, Al Abadleh et al. [6] present a structured literature review on using handwriting images with deep learning to detect and classify dyslexia, dysgraphia, and other learning disabilities, and demonstrate the ability of CNN models. They selected 502 records and included 24 studies, all of which were in the English language. The review shows that CNNs are the dominant approach, as they can automatically learn fine-grained spatial handwriting patterns (letter shape, spacing, alignment irregularities) and achieve high accuracy in distinguishing children with learning disabilities from typically developing peers. The review highlights several persistent challenges: small and imbalanced datasets, limited diversity in languages and populations, poor generalizability of models across settings, computational cost, and a lack of interpretability and real-world deployment in schools or clinics.
However, Arabic has not received attention in this research field. Arabic script presents a set of structural and visual properties that make it fundamentally distinct from Latin alphabets, introducing unique and significant challenges for automated recognition that cannot be addressed simply by adapting existing models developed for English data [10].
Limited studies have applied deep learning techniques, especially CNN, to recognize Arabic characters in children’s writing. Most existing research has instead focused on adult handwriting. Nevertheless, children’s handwriting has recently become a significant research focus. However, the application of CNNs to Arabic children’s handwriting recognition is still in its early stages. A few studies have explored the use of CNNs for this task, with promising results. For instance, Alheraki et al. [18] proposed a handwritten Arabic character recognition system for children’s writing using CNN and stroke identification. The proposed CNN architecture is designed for recognizing children’s Arabic handwritten characters. This architecture achieved significantly improved prediction accuracy: 91% on the Hijja dataset and 97% on the Arabic Handwritten Character Dataset. Furthermore, they proposed a CNN model to recognize characters based on their strokes, identified by the number and direction of endpoints and junction points in the thinned images. This approach used multiple models instead of a single model, based on the number of strokes in a character, and merged Hijja with AHCD, achieving an average prediction accuracy of 96%.
Furthermore, Altwaijry and Al-Turaiki [10] designed a CNN tailored for recognizing handwritten Arabic letters, focusing on improving accuracy for both children’s and adults’ handwriting. The CNN architecture they proposed involves multiple convolutional layers followed by fully connected layers, optimized for high-dimensional image data. They trained this CNN on their newly collected Hijja dataset (children’s handwriting) as well as the existing Arabic Handwritten Character Dataset (AHCD). Data augmentation, normalization, and preprocessing steps were applied to handle variability. The CNN achieved 88% accuracy on Hijja, demonstrating its effectiveness in recognizing children’s handwriting, which is more variable and complex compared to adult handwriting datasets.
Similarly, Alwagdani and Jaha [19] developed a deep learning-based child handwritten Arabic character recognition and handwriting discrimination system. The study proposes a CNN model trained on children’s and adults’ handwriting datasets and evaluates its performance in recognizing children’s handwriting. The study used two datasets, namely Hijja and AHCD. The proposed methodology was divided into four phases: data preprocessing, feature extraction using CNN, extraction of supplementary features, and classification using popular machine learning-based classifiers (Softmax, SVM, KNN, RF). It also proposed supplementary features based on empirical observations to enhance the classification of child and adult writers. The system achieved an accuracy of 93% for character recognition and 94% for child handwriting discrimination. Most closely related to the present work, Alqahtani et al. [11] proposed a CNN-based model for predicting dyslexia in Arabic-speaking children using handwriting. Their dataset comprised 3611 images of isolated Arabic letters, written by children aged 7–10, divided into a dyslexic group and a non-dyslexic group. A CNN trained on these character-level images achieved an accuracy of 95.30%, improving to 95.97% following data augmentation. This study confirms the feasibility of CNN-based dyslexia detection from Arabic handwriting.
To sum up, Table 1 and Table 2 summarize the related works on the automated prediction of learning disabilities using children’s handwriting. As shown, while Alqahtani et al. [11] recently demonstrated that CNNs can detect dyslexia from isolated Arabic letter images in a Saudi sample, the broader literature on detecting learning disabilities from full, connected-text handwriting using deep learning remains dominated by English-language studies. The specific research gap this motivates, and our contributions in addressing it, are outlined in the Research Gap and Contributions section.

3. Materials and Methods

This section presents the research design and methodology used in developing a CNN model for the early detection of dysgraphia in Arabic children’s handwriting.

3.1. Dataset

The dataset used in this research consists of handwriting samples from fourth-grade primary school students in Jeddah, Saudi Arabia, collected across six government schools. Participants were selected through two groups: children who had been formally classified as having dysgraphia through the multi-stage diagnostic procedure adopted by the Saudi educational system, and typically developing peers from the same schools and grade level who showed no indicators of learning disabilities.
In this procedure, students who exhibit early signs of learning disabilities are first flagged as at-risk and referred for pre-referral interventions. If a student does not demonstrate sufficient progress following these interventions, they are referred to a specialist center where a comprehensive assessment is conducted. This assessment typically includes standardized intelligence measures, alongside the National Test of Reading, Writing, and Mathematics. A school-based committee then reviews the results against established diagnostic criteria, and students who meet the criteria are formally classified as having dysgraphia. All students in the with_dysgraphia group participated in this study having been diagnosed through this process.
Data samples were divided into two distinct groups based on these formal educational evaluations: (1) children diagnosed with dysgraphia and (2) children with no such diagnosis. To ensure consistency across all samples, each student was asked to copy a standardized passage of text.
The dataset initially comprised 226 samples labelled as (without_disabilities) and 53 labelled as (with_dysgraphia). Preliminary preprocessing identified a number of samples unsuitable for analysis due to quality-related issues: 12 were excluded due to poor scanning quality, five due to significant ink leakage or illegibility, and three due to insufficient handwriting content. After this data-cleaning phase, the final dataset consisted of 206 samples in the without_disabilities class, while all 53 samples in the with_dysgraphia class were retained. The resulting dataset remained relatively small and class-imbalanced, a typical challenge in this domain.
Despite its limited size, the dataset is particularly valuable due to its formally validated annotations grounded in the Saudi diagnostic framework, and its relevance to the Saudi educational context. It captures a diverse range of handwriting styles and quality levels reflecting realistic classroom conditions, providing a practical and challenging benchmark for developing and evaluating machine learning models aimed at identifying dysgraphia.
Table 3 summarizes the dataset composition, including the number of participants in each class, along with their age range and grade level.
Table 1. A summary of related work on detecting learning disabilities based on child handwriting.
PaperTechniqueDatasetHandwriting TypeLanguageAccuracy
Vilasini et al. [15]CNN and ViTNIST Special Database 19: 810,000 character images from 3600 writers. Abnormal set: mirrored handwriting images (∼100,000 per class). Age group: Not mentioned.CharactersEnglish (Latin)CNN: 79.47%
ViT: 86.22%
Rosli et al. [5]CNN (LeNet-5)NIST Special Database 19, Kaggle dataset, and samples from dyslexic students at Seberang Jaya primary school. Total: 138,500 images (normal, reversal, corrected). Age group: Primary school children.CharactersEnglish (Latin)95.34%
Kedar et al. [12]Random Forest, Voting Classifier, Decision TreeWACOM digital tablet; 80 adolescents (40 dysgraphic, 40 typical). Age group: Adolescents.Words and Geometric ShapesEnglish (Latin)RF: 92.59%
DT: 88.88%
VC: 80%
Isa et al. [14]CNN and LeNet-5Kaggle dyslexic handwriting dataset. Three classes: 78,275 normal, 52,196 reversal, 8029 corrected. Age group: Not mentioned.CharactersEnglish (Latin)87%
Yogarajah and Bhushan [17]CNN54 children (36 boys, 18 girls), grades 1–5. 14 Hindi words (two-letter, vowel signs, conjoined consonants). Total: 267 images. Age group: 7–12 years.WordsHindi(Devanagari)86.14%
Isa et al. [13]OCR and ANNAssociation of Dyslexia Malaysia (ADM); 30 dyslexic children. Eight characters: b, c, f, p, 2, 5, 6, 7. Age group: 7–12 years.CharactersEnglish (Latin)73.33%
Spoon et al. [16]CNNTwo datasets: (1) “messy” set (2 dyslexic + 15 non-dyslexic) and (2) controlled set (9 dyslexic + 62 non-dyslexic), grades K–6. Age group: 9–10 years.ParagraphsEnglish (Latin)55.7 ± 1.4%
RF: Random Forest; DT: Decision Tree; VC: Voting Classifier; OCR: Optical Character Recognition; ANN: Artificial Neural Network; CNN: Convolutional Neural Network; ViT: Vision Transformer; NIST: National Institute of Standards and Technology.
Table 2. Summary of related work on child handwritten Arabic character recognition.
AuthorTechniqueDatasetHandwriting TypeAccuracy
Altwaijry and Al-Turaiki [10]CNN for isolated character recognition trained separately on adult vs. child dataHijja, AHCDCharacters97% (AHCD, adult); 88% (Hijja, child)
Alheraki et al. [18]CNN + stroke-based multi-model approachHijja, AHCDCharacters91% (Hijja); 97% (AHCD); ∼96% on merged data
Alwagdani and Jaha [19]CNN + training-strategy analysis + feature fusion with Softmax/SVM/KNN/RFHijja, AHCDCharactersUp to ∼93% child recognition; ∼94% child/adult discrimination
Alqahtani et al. [11]CNNCustom (Jeddah, KSA); 3611 letter imagesCharacters95.30% (95.97% with augmentation)
CNN: Convolutional Neural Network; SVM: Support Vector Machine; KNN: K-Nearest Neighbour; RF: Random Forest; AHCD: Arabic Handwritten Characters Dataset.
Table 3. Dataset composition of Arabic children’s handwriting.
GroupInitial SamplesFinal SamplesAge RangeGrade Level
Without_disabilities2262069–104th Grade
With_dysgraphia53539–104th Grade
Total2792599–104th Grade

3.2. Image Preprocessing

To ensure data consistency and improve input quality, a systematic preprocessing pipeline was implemented to transform the raw scanned handwriting images into a standardized representation suitable for CNN-based analysis. This stage constitutes a critical prerequisite for effective model training, as it ensures uniformity across the dataset and aligns the input data with the computational requirements of deep learning architectures [20]. The preprocessing workflow was specifically designed to reduce variability in image quality, normalize input dimensions, and mitigate the influence of noise and scanning artifacts.
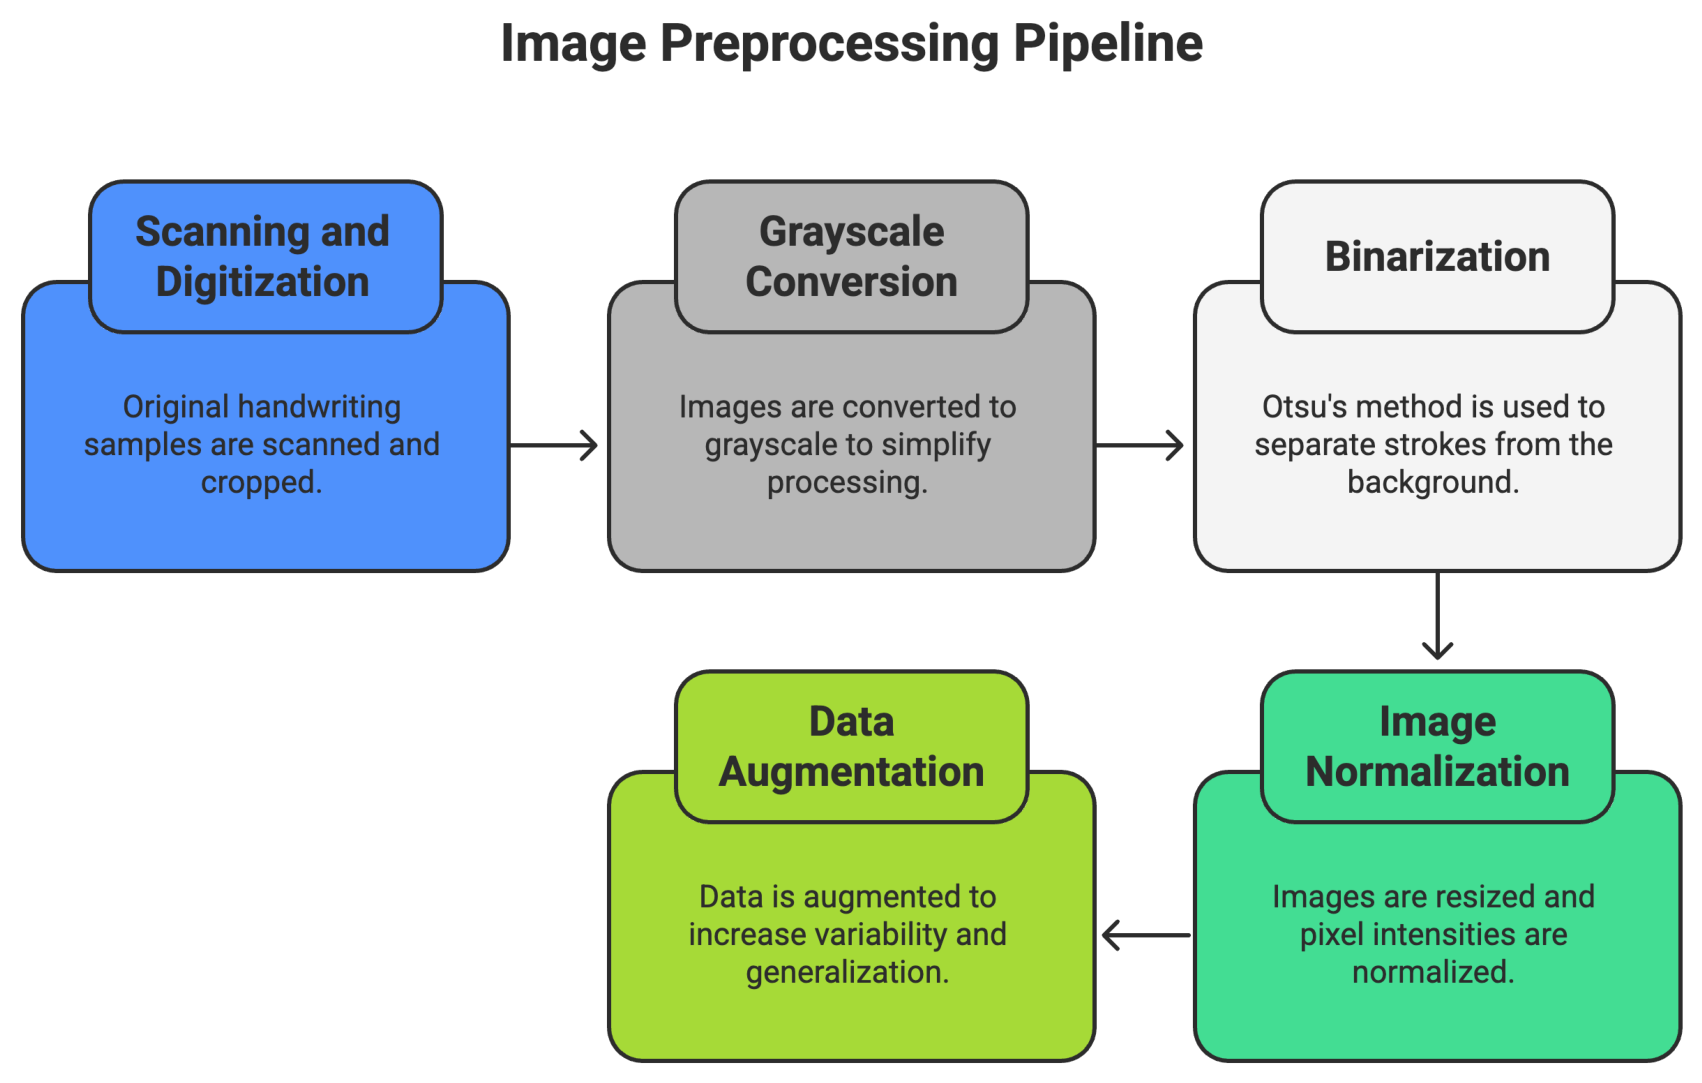
Figure 1 illustrates the sequential steps: scanning and digitization, grayscale conversion, binarization, image normalization, and data augmentation.
Scanning and Digitization: The original handwriting samples, collected in physical form from participating schools, were digitized using a flatbed scanner.
Grayscale Conversion and Binarization: Grayscale representation was retained since color information is irrelevant for handwriting, while intensity variations capture the essential structural features of handwriting such as strokes, curves, and spacing. Following this step, binarization was applied to separate handwriting strokes from the background. Otsu’s thresholding method was used to binarize the handwriting images. Unlike fixed thresholding, Otsu’s algorithm automatically computes an optimal global threshold value by minimizing the intra-class variance between foreground (handwriting strokes) and background pixels [21]. For a given threshold t, the within-class variance is defined as:
σ w 2 ( t ) = ω 1 ( t ) σ 1 2 ( t ) + ω 2 ( t ) σ 2 2 ( t ) ,
where ω 1 ( t ) and ω 2 ( t ) are the probabilities (class weights) of the two classes separated by the threshold, and σ 1 2 ( t ) and σ 2 2 ( t ) are the corresponding variances. Otsu’s method selects the threshold t * that minimizes σ w 2 ( t ) , equivalently maximizing the between-class variance. This ensures that the chosen threshold provides the most effective separation between handwriting and background regions [22].
Image Normalization: Spatial normalization resized all images to a uniform 256 × 256 pixels, satisfying the fixed-input requirement of the CNN architecture [23]. Pixel values were subsequently scaled from the integer range [0, 255] to floating-point [0.0, 1.0] by dividing by 255.0, which prevents activation saturation and accelerates optimizer convergence [24].
Data augmentation: Data augmentation was applied to increase sample variability and improve generalization, as well as to overcome the overfitting associated with limited datasets [20]. Transformations included random brightness adjustments, contrast variations, and small spatial translations. These augmentations preserve the essential handwriting characteristics while simulating realistic variability in scanned samples.

3.3. The Proposed CNN Model

CNNs were selected as the core model in this research because of their demonstrated ability to learn discriminative spatial representations directly from raw image data, without requiring manually defined feature extraction [25]. Children’s handwriting exhibits pronounced variability in stroke thickness, curvature, orientation, and character spacing, a pattern further noticeable in children with dysgraphia, where irregular strokes, inconsistent sizing, and distorted letter forms are characteristic diagnostic signals [26,27]. Traditional features extracted frequently fail to capture the full complexity of these nuanced spatial patterns, particularly when they appear at multiple scales and in varying positions across the page. CNNs address this by learning hierarchical feature representations, early layers capture low-level patterns such as edges and stroke textures, while deeper layers progressively combine these into more abstract representations such as letter fragments, spacing distributions, and structural irregularities. This hierarchical learning capacity makes CNNs uniquely suited to the detection of the subtle and distributed visual markers associated with dysgraphia in children’s handwriting [28].
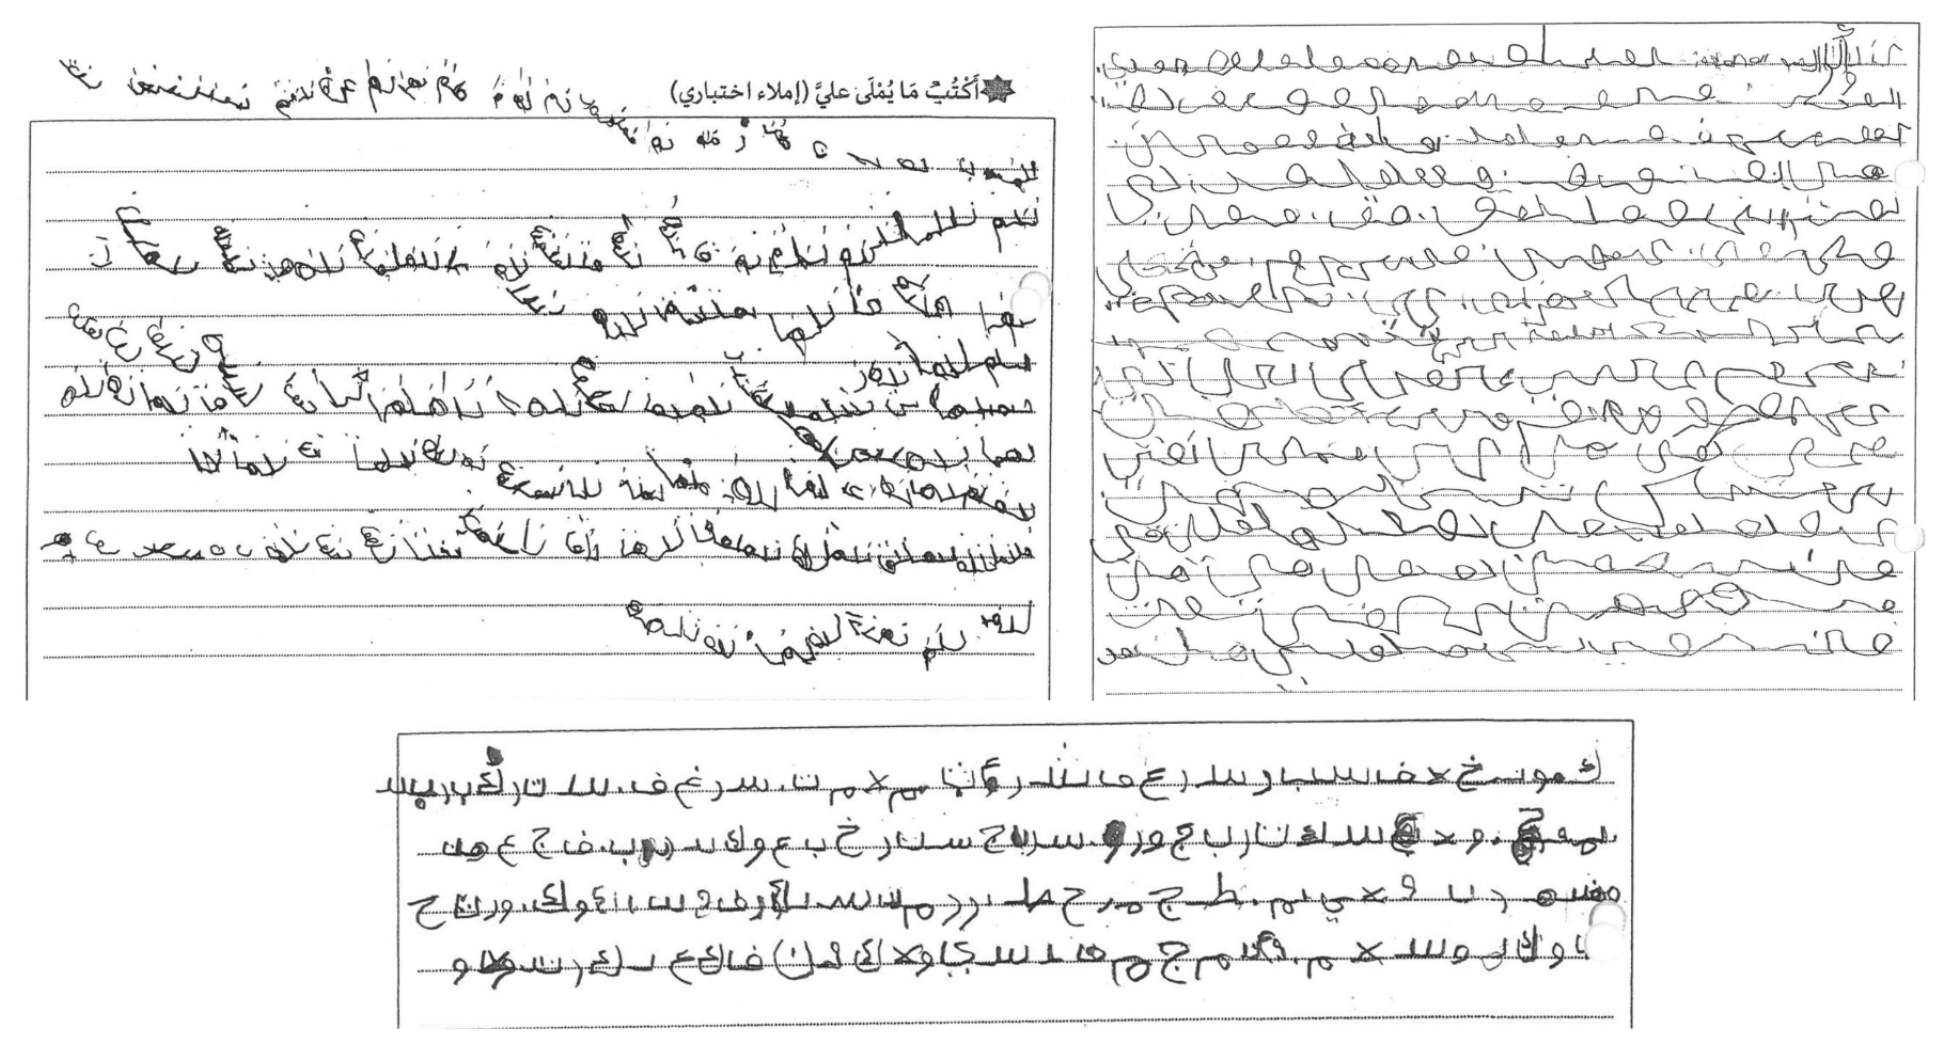
CNNs automatically extract complex spatial features directly from raw pixel data, eliminating the need for manual feature engineering. This capability is particularly important for the analysis of children’s handwriting, which often exhibits irregular strokes, inconsistent spacing, and distorted letter shapes, as illustrated in the dataset sample shown in Figure 2. Such variability makes feature extraction challenging for conventional handcrafted approaches. In contrast, CNNs can robustly learn hierarchical visual representations from the data, enabling the model to capture subtle structural variations that may be indicative of dysgraphia.
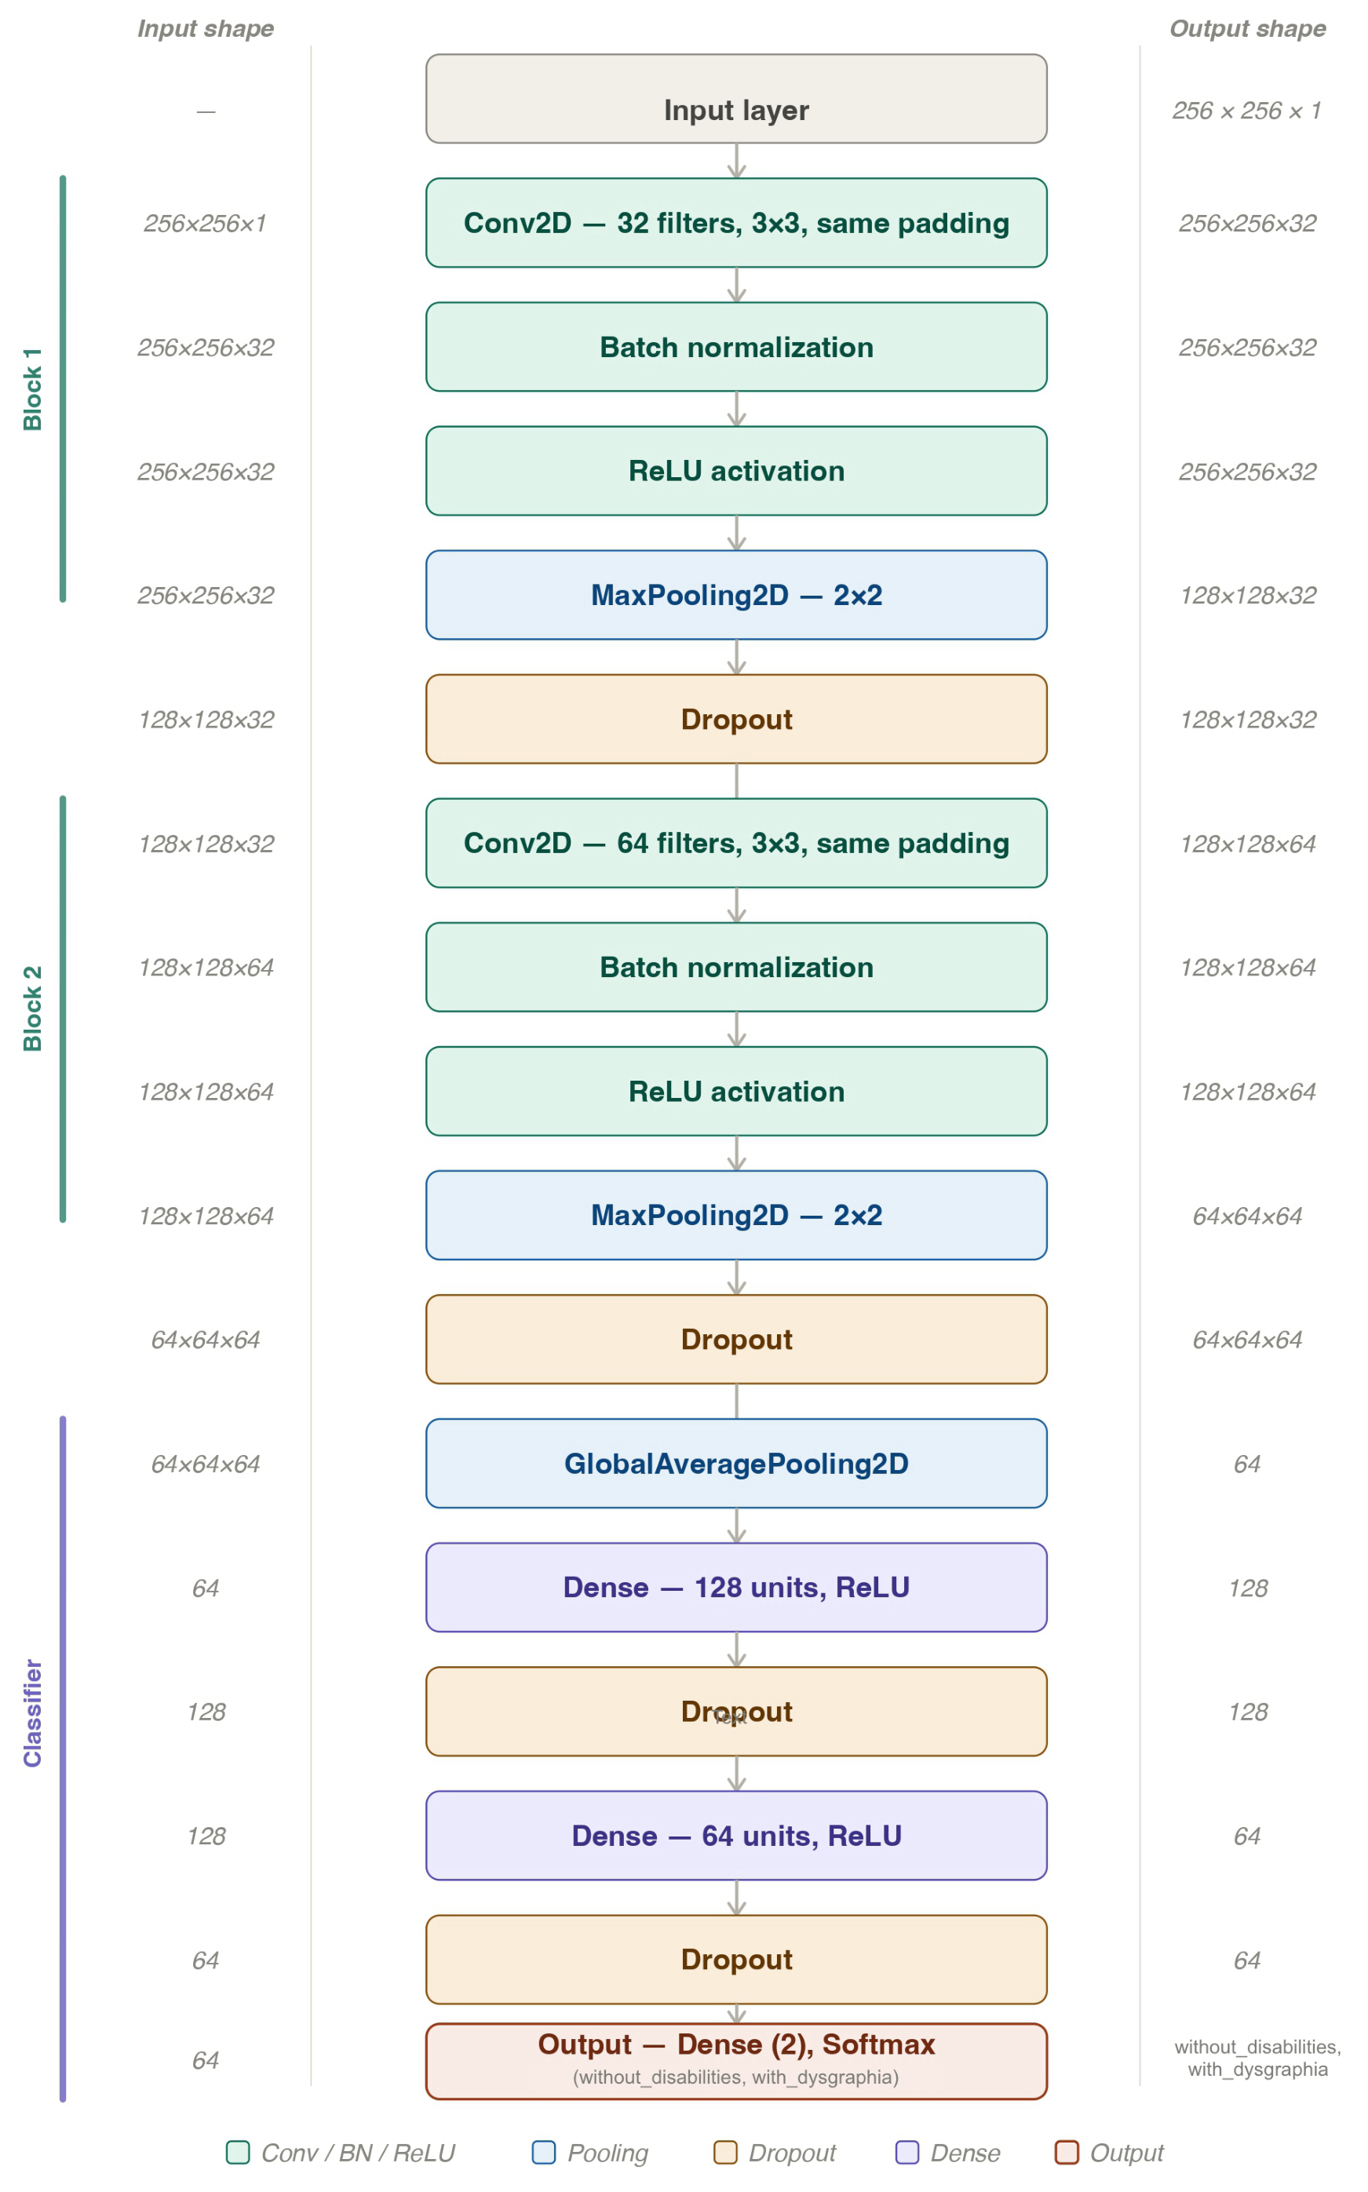
The architecture of the proposed CNN was carefully designed to achieve an effective balance between feature extraction capability, computational efficiency, and robust generalization. The final design was selected following a series of exploratory experiments aimed at identifying an architecture capable of learning discriminative handwriting patterns while remaining suitable for the limited dataset size. The model is structured as a sequence of interconnected layers, each performing a specific role ranging from low-level feature extraction to high-level classification. Through this hierarchical structure, the network learns progressively more abstract representations directly from the handwriting images, beginning with simple visual patterns such as edges and stroke fragments and gradually capturing more complex structural features before producing the final classification output. The overall architecture of the proposed CNN is illustrated in Figure 3. It consists of three main components: (i) an input layer, (ii) two convolutional feature-extraction blocks, and (iii) a classification head. Each convolutional block includes a sequence of convolution, batch normalization, activation, pooling, and dropout operations to enhance feature learning while reducing overfitting. The classification head employs GAP followed by fully connected dense layers to perform the final decision-making process. The input layer receives grayscale handwriting images of size 256 × 256 × 1, consistent with the preprocessing pipeline applied to the dataset.
The core of the network consists of two convolutional blocks designed to progressively build a rich understanding of the input image, moving from simple features to more complex representations. The first block is designed to identify fundamental patterns in the handwriting samples. It follows a standard and effective pattern: Convolution → Batch Normalization → Activation → Pooling → Dropout.
  • Convolutional Layer: In CNNs, convolutional layers act as the fundamental building blocks for feature extraction. They scan the input image with small filters to capture spatial dependencies [25]. In this model, the block begins with a convolutional layer that applies 32 learnable filters of size 3 × 3. This layer serves as the primary feature detector, learning to identify elementary patterns such as edges, curves, and strokes.
  • Batch Normalization Layer: Batch normalization layers are designed to stabilize the learning process by standardizing the output of previous layers. This ensures that each mini-batch maintains consistent distributions of activations [29]. Following the convolution, a batch normalization layer is applied. Its purpose is to normalize the activations, which stabilizes and accelerates the training process by reducing internal covariate shift. This also provides a minor regularizing effect.
  • Activation (ReLU): Activation functions introduce non-linearity into the network, allowing it to approximate complex mappings rather than being limited to linear transformations [30]. A Rectified Linear Unit (ReLU) activation function introduces non-linearity, allowing the model to learn complex relationships that a purely linear model could not capture.
  • Max Pooling Layer: Pooling layers reduce the dimensionality of feature maps, thus lowering computational requirements and controlling overfitting [31]. A max pooling layer with a 2 × 2 window is used to downsample the feature maps. This reduces the computational load and provides a degree of local translation invariance, making the model more robust to slight variations in the position of strokes.
  • Dropout Layer: Regularization layers were incorporated to mitigate overfitting by reducing the model’s dependency on specific neurons. In particular, dropout was employed as an effective regularization technique to improve generalization and enhance training stability [32]. A dropout rate of 0.3 was applied during training, whereby approximately 30% of neurons are randomly deactivated in each iteration. This stochastic deactivation discourages the network from relying excessively on specific features and encourages the learning of more robust and distributed representations, thereby improving the model’s ability to generalize to unseen data.
The second convolutional block follows the same architectural pattern as the first, building upon the feature representations learned in the preceding stage. This block mirrors the structure of the first, again applying convolution, normalization, activation, pooling, and dropout. The critical distinction lies in the convolutional layer, which employs 64 filters instead of 32, thereby expanding the channel depth. This increase enables the model to capture more complex and abstract features by integrating the elementary patterns detected in the first block. For example, the network can learn to identify more intricate handwriting structures, such as letter fragments, characteristic ligatures, or distinctive spacing patterns. After the feature extraction stages, the resulting feature maps are processed by a classification head to produce the final output. This component is designed to perform effective classification while maintaining a relatively low number of trainable parameters, thereby reducing the risk of overfitting.
The GAP layer serves as the transition between the convolutional feature extraction blocks and the fully connected classification head. Instead of flattening the final feature maps into a very large vector, GAP computes the mean activation value of each feature map, which lead to condensing spatially distributed information into a compact representation. In this study, the GAP layer transforms the output of the final convolutional block (64 feature maps of size 64 × 64) into a one-dimensional vector of length 64 [30]. The benefits of adding the GAP layer are twofold: first, GAP reduces the risk of overfitting by drastically lowering the number of trainable parameters in the fully connected layers [33]. This property is particularly valuable for this study, where the dataset used is relatively small and imbalanced, a more parameter-heavy alternative, such as flattening, would likely cause the model to memorize noise rather than generalize meaningful handwriting features. Second, GAP enhances translation invariance: it discards the absolute spatial location of handwriting patterns and instead emphasizes their overall presence across the image. This is highly relevant to children’s handwriting, where irregularities such as inconsistent spacing, distorted curves, or uneven strokes that may appear anywhere on the pages. Across several experimental runs, the leveraging of GAP consistently should produce more stable training, higher validation accuracy, and better recall for the minority class.
Dense (fully connected) layers serve as the decision-making stage of a CNN. Unlike convolutional layers that capture spatial features, dense layers integrate all extracted features and learn complex combinations that directly guide classification. Because they involve a high number of trainable parameters, they are powerful but tending to overfitting [28]. In this model, the feature vector is passed through two sequential Dense layers with 128 and 64 neurons, respectively. These layers act as the reasoning part of the model, learning to weigh and combine the high-level features to make a classification decision. Each dense layer is followed by an aggressive Dropout layer with a 50% rate. This heavy regularization is crucial because dense layers contain a large number of parameters and are particularly subject to overfitting the training data.
The output layer is responsible for translating the learned features into the final prediction. It typically contains one neuron per class and applies an activation function to generate interpretable probabilities [25]. In this architecture, the final component is a Dense layer with 2 neurons, corresponding to the two classes (“with_dysgraphia” and “without_disabilities”). It employs a softmax activation function, which converts the model’s raw output scores into a probability distribution. The result is a prediction, indicating the model’s confidence for each class.

3.4. Handwriting Feature Extraction

As a comparative baseline, 10 handwriting features described in the learning disabilities literature were extracted from the same preprocessed images and evaluated using machine-learning classifiers. Features were selected from different learning disabilities assessment studies [6,8,34,35,36,37,38,39] and grouped into four categories: motor control (Stroke Thickness Variation, Size Uniformity, Aspect Ratio Variation), spatial planning (Organization Score, Line Straightness, Vertical Alignment, Baseline Adherence), fluency (Writing Density, Component Count), and rhythmic consistency (Spacing Consistency).
Motor control features capture the consistency and quality of fine motor execution during writing, and children with learning disabilities frequently exhibit greater variability in pen pressure, letter sizing, and letter proportions due to disabilities with motor planning and proprioceptive feedback regulation. Spatial planning assess the organization of writing elements on the page, including baseline control, component overlap, and vertical positioning consistency. Fluency features capture writing output and spatial utilization as written text. Finally, Spacing Consistency, the sole rhythm feature, measures the regularity of inter-component spacing. Table 4 provides a complete description of each feature and its extraction procedure.

3.5. Training Configuration

The model was implemented in Python 3.12 using TensorFlow/Keras and trained on Google Colab with a T4 GPU. The Adam optimizer was used with a learning rate of 0.001. Training was conducted for up to 100 epochs with early stopping (patience = 10), monitoring balanced validation accuracy to prevent overfitting.
Class imbalance was addressed using Focal Loss [40] with a concentration parameter of γ = 4, selected through systematic comparison against cross-entropy and weighted cross-entropy baselines. Focal Loss down-weights well-classified majority-class samples and focuses training on the harder minority-class examples (with_dysgraphia), making it particularly appropriate for the 3.9:1 imbalance ratio of this dataset.

3.6. Evaluation Protocol

Given the small dataset (N = 259), Leave-One-Out Cross-Validation (LOOCV) was used as the evaluation strategy. LOOCV maximizes the use of available labeled data, each iteration trains on N − 1 samples and evaluates on the single held-out sample, and has been shown to provide robust performance estimates for small datasets [41]. The same LOOCV protocol was applied to both the CNN and the machine learning classifiers to ensure a fair comparison. Because the aim of this research is the reliable early detection of dysgraphia, LOOCV is particularly appropriate. It ensures that no sample is overlooked during training and testing, therefore, for this reason, LOOCV was adopted as the validation strategy in the proposed model.
For each LOOCV iteration, the dataset was first divided into N 1 training samples and one held-out sample. Data augmentation was subsequently applied only to the training samples. The held-out sample was not augmented, and no augmented transformation derived from it was included in the corresponding training dataset. Thus, augmentation was performed after the LOOCV split to prevent augmentation-related information leakage between the training and held-out samples.
Performance was assessed using six metrics. Since overall accuracy can be misleading in the presence of class imbalance, the primary evaluation metrics included Balanced Accuracy, Sensitivity, and the Matthews Correlation Coefficient (MCC). Balanced Accuracy, defined as the arithmetic mean of sensitivity and specificity, provides a more reliable estimate of performance across imbalanced classes.
Sensitivity represents the recall of the minority class, corresponding to the proportion of children with dysgraphia correctly identified by the model. The MCC was also employed, as it summarizes all four cells of the confusion matrix into a single scalar measure and remains robust under class imbalance [42]. In addition, Specificity, ROC-AUC (Receiver Operating Characteristic (ROC) Curve and Area Under the Curve), and PR-AUC (Precision–Recall Area Under the Curve) were reported as secondary metrics to provide a comprehensive assessment of model behavior. In particular, PR-AUC is considered more informative than ROC in imbalanced classification settings [43].
It should be noted that the architectural configuration (Section 4.1) and loss function (Section 4.2) were selected based on exploratory comparisons conducted on this same dataset prior to the final LOOCV evaluation reported in Section 4.4. Consequently, the final LOOCV metrics reflect the performance of a fixed, previously selected model configuration rather than a fully independent estimate of generalization performance, since the same data informed both model selection and final evaluation. This limitation, and its implications for interpreting the reported results, are discussed further in Section 5.

4. Experiments and Results

This section presents the experiments conducted to determine the optimal configuration and best performance of the proposed CNN model, covering key design decisions, including architecture choices, loss function selection, and cross-validation strategy. In addition, handwriting features are analyzed by comparing multiple machine learning classifiers. Finally, a comprehensive evaluation of the proposed CNN model’s performance metrics is presented to demonstrate the approach’s effectiveness.

4.1. CNN Architecture Choices Experiments

To validate the effect of each architectural decision, two configurations were evaluated under the same training conditions and compared to assess whether they affect the final proposed model, without batch normalization and without GAP Layer, as illustrated in Table 5.
The proposed CNN Model, before adding the batch normalization layer, achieved strong accuracy (90.35%). However, balanced accuracy was 78.52%. The model predicted the majority class effectively, but struggled with the minority class. The confusion matrix indicates that 22 false negatives accounted for the majority of errors. Precision was high 91.118%, but recall for the positive class was 58.49%, reflecting a bias toward specificity over sensitivity, as shown in Table 5. Therefore, the research aims for both high accuracy and reliable detection of children with dysgraphia. So, a lower recall for the positive class (with_dysgraphia) is not preferred in this case.
The most notable observation without Batch Normalization was that the CNN still learns to classify handwriting, but training is slower, less stable, and most likely to bias toward the majority class. This instability reduces the model’s ability to correctly detect the minority class (with_dysgraphia), which is the main objective of this study. Also, instability produces worse generalization on unseen handwriting. With an imbalanced set, this instability can raise bias toward the majority class and reduce the model’s ability to recognize the minority (with_dysgraphia) patterns [44].
Furthermore, the impact of GAP, the proposed CNN model, before the addition of the GAP layer, achieved an overall accuracy of 79.54%. At first glance, the accuracy suggested a reasonable level of performance. However, closer review revealed that the balanced accuracy was only 50%, with a sensitivity of 0% and a specificity of 100%.
In practice, this mean the model classified all handwriting samples as belonging to the (without_disabilities) class. The confusion matrix confirmed this limitation: out of 53 positive cases, none were detected (TP = 0, FN = 53), while all negative cases were correctly classified (TN = 206, FP = 0). This outcome rendered the model ineffective for this study, since it completely failed to recognize children with dysgraphia without GAP, the model likely relied on fully connected layers that memorized training set spatial patterns, which led to poor generalization. The model without GAP confirms this, which learned to minimize loss by always predicting the majority class, indicating complete failure to learn meaningful feature representations for the minority class.
As shown in Table 5, without the GAP layer caused a failure in sensitivity (0%), confirming its critical role in detecting handwriting difficulties.

4.2. Loss Function Selection

Four loss functions were evaluated under LOOCV: standard cross-entropy, class-weighted cross-entropy, and Focal Loss at γ = 3 and γ = 4. Table 6 reports the mean loss and standard deviation across LOOCV folds.
Cross-entropy and weighted cross-entropy produced similar mean loss values (0.558 and 0.564) with high variance, indicating unstable training. Focal Loss at γ = 3 reduced the mean loss to 0.0223 and the variance substantially. Focal Loss at γ = 4 achieved the lowest mean loss (0.0120 ± 0.0047), indicating the most stable and focused training. The γ parameter controls the rate at which the loss down-weights easy examples: at γ = 4, the model concentrates almost entirely on the harder minority-class samples. Focal Loss with γ = 4 was selected for the proposed model.

4.3. Handwriting Feature Analysis: Machine Learning Classifiers Results

Four machine learning classifiers were trained on the ten handwriting features under LOOCV to establish a performance baseline for comparison with the proposed CNN. Table 7 presents classification results.
Logistic Regression achieved the highest balanced accuracy (62.6%) and sensitivity (50.9%). Random Forest produced the highest overall accuracy (80.3%) but only 13.2% sensitivity, a direct impact of the model depending to the majority class to maximize accuracy, which represents a failure mode under class imbalance. Even the best-performing classifier missed approximately half of children with dysgraphia, a result that falls well short of the performance required for a reliable automated early screening.

4.4. Comprehensive Proposed CNN Model Performance Metrics

Under the LOOCV protocol, the proposed CNN with its architecture and loss configuration fixed following the exploratory comparisons in Section 4.1 and Section 4.2 achieved an accuracy of 88.8% and a balanced accuracy of 92.3%. As these design choices were informed by performance signals on the same dataset used for this evaluation, the reported metrics should be interpreted as a potentially optimistic estimate of generalization performance rather than a fully unbiased one; see Section 5 for discussion. Table 8 presents a comprehensive summary of the model’s performance.
The balanced accuracy of 92.3% is notably higher than the standard accuracy, suggesting that the model performs well across all classes rather than being biased toward the majority class. This is particularly important in classification tasks where the class distribution may be unbalanced. The macro-averaged recall of 92.3% aligns with the balanced accuracy, indicating consistent performance across per-classes.
Precision, Recall, and F1-Score are reported under two averaging strategies: Macro Average, which treats all classes equally regardless of their size, and Micro Average, which weights each class proportionally to its number of samples, equivalent to overall accuracy in binary classification.
Precision metrics reveal some variation between macro and micro averaging, with macro-averaged precision at 82.2% compared to micro-averaged precision at 88.8%. This difference suggests that while the model performs well overall, there may be some classes where precision could be improved. The F1-scores follow a similar pattern, with macro-averaged F1 at 85.3% and micro-averaged F1 at 88.8%, indicating a reasonable balance between precision and recall.
The macro-averaged precision reached 82.2%, while the macro-averaged recall was 92.3%, leading to a macro F1-score of 85.3%. The corresponding micro-averaged values for precision, recall, and F1-score were all consistent at 88.8%.
A key indicator of the model’s quality is the MCC of 0.738, as this metric is considered more informative than accuracy alone, especially for imbalanced datasets. The MCC is a highly robust metric that produces a high score only if the classifier obtains good results in all four categories of the confusion matrix (true positives, false negatives, true negatives, and false positives).
Furthermore, as shown in Table 9, the confusion matrix indicated that out of 259 samples, the model produced 52 true positives (TP) and 178 true negatives (TN), with only one false negative (FN) and 28 false positives (FP). The single false negative is particularly notable: it indicates that only one child with dysgraphia was missed across all LOOCV folds. In contrast, the majority of misclassifications appeared from false positives, where some children without disabilities were incorrectly flagged as having dysgraphia.
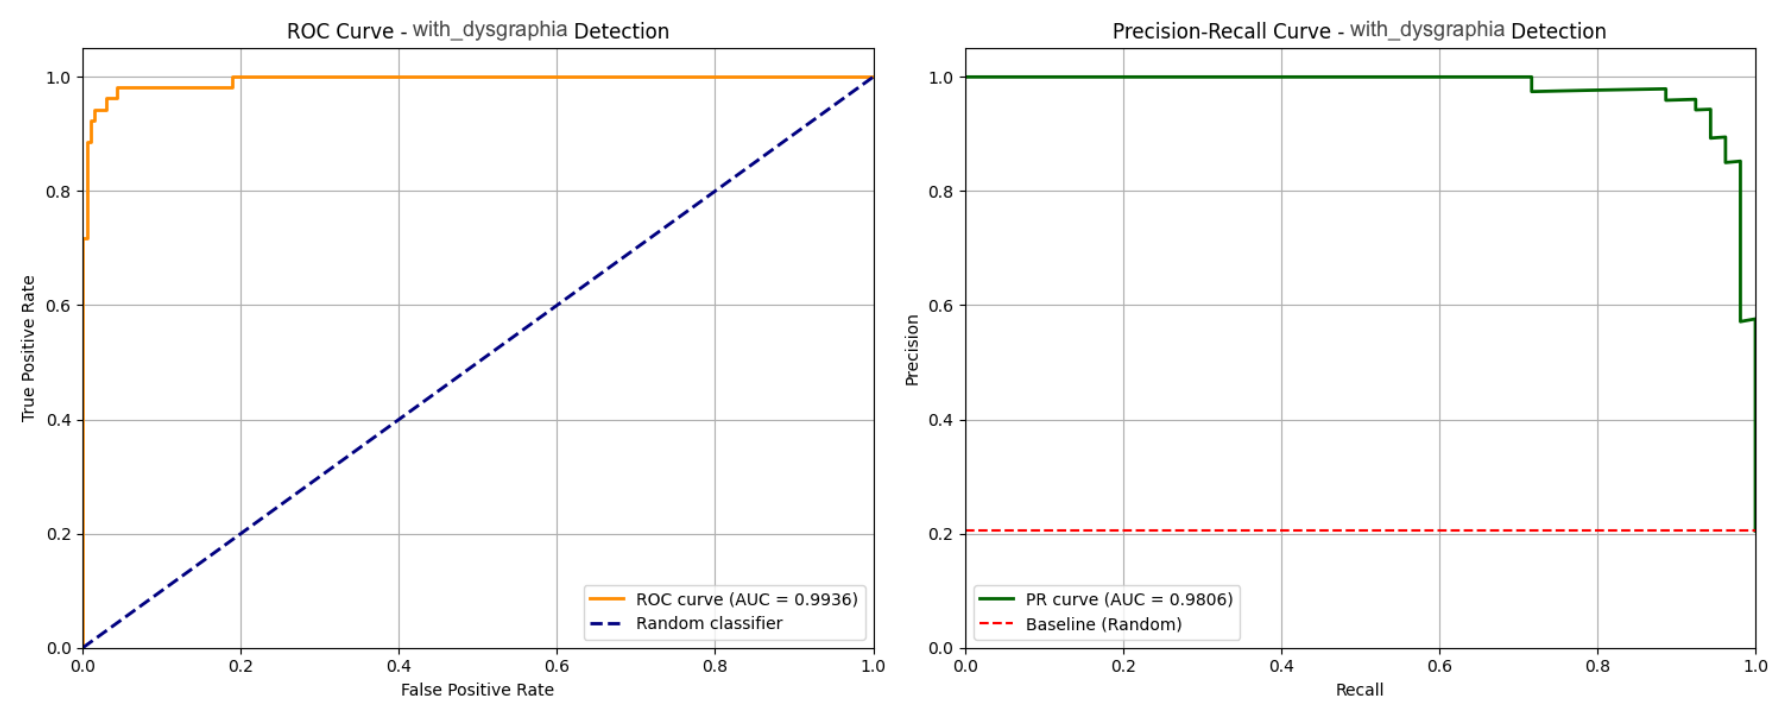
As illustrated in Figure 4, both the ROC and Precision–Recall (PR) curves confirm the model’s excellent discriminative performance.
The ROC curve confirms that the model achieves near-perfect discriminative performance. With an AUC of 0.9936, the classifier consistently ranks positive cases above negatives, maintaining both high sensitivity and specificity across thresholds. This indicates that the model separates the two handwriting categories with exceptional reliability.
Moreover, the PR AUC of 0.9806 is especially significant in light of the 4:1 class imbalance. Unlike ROC, the PR curve is sensitive to skewed data distributions, so such a high score demonstrates that the model not only excels at ranking but also maintains strong precision and recall trade-offs. Together, these metrics show that the model has successfully learned discriminative handwriting features and is robust against class imbalance.

5. Discussion

The primary objective of this study is to develop a CNN-based screening model to support the early identification of children who may be showing indicators of dysgraphia in their handwriting, assisting educators and specialists in making timely referrals for further assessment. The proposed CNN architecture is designed to balance sufficient feature extraction capacity while taking into consideration the constraints of having a small dataset. It is notable that two specific architectural components made a difference in the proposed CNN, which were not just performance enhancers but were absolutely critical to the model’s ability to learn a meaningful and useful classification function, especially given the complexity of the Arabic handwriting.
First one, Batch Normalization had a clear and measurable impact on performance. Although overall accuracy decreased slightly from 90.35% without BatchNorm to 88.8% with it, the balanced accuracy increased from 78.52% to 92.3%. This shows that the trade-off was not in correctness but in achieving a more acceptable detection across both classes. Sensitivity, which had been only 58.49% without BatchNorm, improved to 98.1%. Similarly, the MCC increased from 0.6814 to 0.738, and ROC AUC improved from 0.9618 to 0.9936, indicating stronger class discrimination.
Without the stabilizing effect of Batch Normalization, training became unstable, and the model struggled to learn the features of the minority class, resulting in a biased classifier unsuitable for early screening. In contrast, adding BatchNorm not only stabilized optimization but also refined the internal feature representations, enabling the model to capture subtle handwriting distortions. These gains were directly aligned with the study’s objective of early and reliable detection of dysgraphia.
Second one, the GAP layer, before adding the GAP layer, the CNN struggled to generalize and showed severe class imbalance problems. The model without GAP reached only 79.54% accuracy and its balanced accuracy was 50%, meaning it effectively failed to detect the minority class. Sensitivity dropped to 0%, with the model predicting all samples as belonging to the majority class, even though specificity remained perfect at 100%. ROC AUC was limited to 88.78% and the MCC fell to 0, confirming that the classifier provided no meaningful discrimination. And, by looking at the performance after introducing the GAP layer, led to huge performance improvement.
By having the GAP, the proposed CNN helped in two areas: the GAP improved generalization by emphasizing the presence of discriminative features rather than their exact spatial location, which is essential in children’s handwriting, where relevant features may appear at different spatial locations within writing samples. Children with dysgraphia may exhibit inconsistent letter placement and irregular line adherence, requiring a classification model that can recognize diagnostic patterns regardless of their specific spatial position within the image. Therefore, Spatial feature integration provided by GAP layers enables the model to consider global handwriting characteristics such as overall spacing consistency, general letter size regularity, and line adherence patterns.
Second, it significantly reduced the number of trainable parameters by replacing fully connected layers with a pooling operation that converts each feature map into a single scalar value. This was particularly valuable given the small and imbalanced dataset, as it lowered the risk of overfitting.
The results indicate that GAP was most crucial architectural choice for enabling the model to capture meaningful patterns. Removing GAP caused the model to collapse toward majority-class prediction, with sensitivity and MCC both falling to zero. However, GAP is a well-established CNN component. Its relevance here is empirical: within the investigated full-sample Arabic handwriting setting, GAP provided a compact mechanism for aggregating spatial feature information while substantially reducing the number of trainable parameters, which was particularly beneficial given the limited and imbalanced dataset.
Furthermore, the implementation of focal loss in the proposed CNN model addresses the critical challenge in the dataset’s class imbalance (206 without_disabilities vs. 53 with_dysgraphia). Among the tested configurations, γ = 4 was identified as the optimal setting, hitting the best balance between stability and sensitivity. This choice directly supports the study’s objective of reliably recognizing children with dysgraphia without having a low overall accuracy. Because the dataset is imbalanced between with_dysgraphia and without_disabilities cases, the selection of the loss function is critical for effective learning. Standard cross-entropy (0.5579 ± 0.1773) treated all examples equally and biased the model toward the majority class, while weighted cross-entropy (0.5643 ± 0.2787) showed even greater instability.
In contrast, focal loss reduced the validation loss by more than 95%, reaching 0.0120 ± 0.0047 with γ = 4 . At γ = 4 , the model was forced to learn from the harder minority cases without entirely ignoring correctly classified majority examples. Therefore, γ = 4 was chosen as the optimal configuration, as it ensured discriminative feature learning across both classes and aligned directly with the goal of early and reliable detection of dysgraphia.
The proposed CNN outperforms feature-based classification. The 47.4% relative improvement in balanced accuracy (62.6% → 92.3%) and the 92.7% relative improvement in sensitivity (50.9% → 98.1%) demonstrate that learned visual representations capture information that manually defined features cannot encode.
The overall performance metrics indicate that the proposed CNN has a strong, foundational capability to distinguish between handwriting samples from children with dysgraphia and those without learning disabilities. The overall accuracy reached 88.8%, while the balanced accuracy was even higher at 92.3%, showing that the model maintained strong predictive ability despite the dataset’s class imbalance. The high balanced accuracy suggests that the model was not biased toward the majority class and was able to effectively capture patterns from both classes. A major obstacle faced in this study was the imbalance between the two classes: a majority of handwriting samples from children without learning disabilities, and a minority from those diagnosed with dysgraphia.
The model’s performance is further supported by the MCC was 0.738. The MCC is widely regarded as one of the most balanced performance measures for binary classification, as it produces a high score only if the classifier obtains good results in all four categories of the confusion matrix (true positives, true negatives, false positives, and false negatives).
Precision and recall metrics provide deeper insights into the class-specific performance. The macro-average precision stood at 82.2%, while macro-average recall reached 92.3%, indicating that although the model occasionally misclassified some positive cases, it achieved very high sensitivity overall. This pattern is reflected in the class-wise results: for the with_dysgraphia class, the model reached 98.1% recall but only 65.2% precision resulting in an F1-score of 78.2% In contrast, the without_disabilities class achieved 99.4% precision and 86.4% recall with a higher F1-score of 92.4%.
This imbalance between precision and recall in the with_dysgraphia class suggests that the model strongly favors sensitivity, prioritizing the identification of children with potential dysgraphia even at the cost of generating more false positives. From a practical perspective, this trade-off aligns with the objective of early screening: it is preferable to flag more children for further evaluation rather than risk missing cases of genuine difficulty. False positives, while not ideal, can be resolved through secondary diagnostic assessments, whereas false negatives carry a greater long-term risk of leaving disabilities unaddressed.
The model’s discriminative power is further confirmed by the ROC AUC of 0.9936 and the PR AUC of 0.9806, both of which are near-perfect values. These results suggests that the CNN may be highly effective in distinguishing between children with dysgraphia and without learning disabilities, even under imbalanced conditions. However, these results should not be interpreted as evidence that overfitting is absent. Given the relatively small dataset and the lack of external validation, the possibility of overfitting cannot be completely excluded, and further validation on independent datasets is required to assess the robustness and generalizability of the model.
Notably, these findings suggest that this carefully designed CNN not only achieved excellent overall performance but also fulfilled the primary goal of prioritizing early detection of children at risk. By maximizing recall for the with_dysgraphia class, the model may help reduce the likelihood of undetected cases, suggesting it could serve as a useful preliminary screening tool in early detection. At the same time, the relatively lower precision for this class highlights the need for follow-up evaluation to confirm flagged cases, ensuring that resources are allocated efficiently and that children without dysgraphia are not unnecessarily referred for further evaluation.
However, the high sensitivity of 98.1% was accompanied by a substantially lower precision of 65.2% for the with_dysgraphia class. The confusion matrix further illustrates this trade-off, with 52 true positives and 28 false positives. Thus, although the model missed only one child in the with_dysgraphia class, a considerable proportion of the children flagged as potentially at risk were false positives. This trade-off has important practical implications. In a preliminary screening context, prioritizing sensitivity may be appropriate because the objective is to minimize the number of potentially at-risk children who remain unidentified. However, the relatively high number of false positives could lead to unnecessary referrals and increase the workload and resources required for the subsequent specialist evaluation. Therefore, the proposed approach should not be used as a diagnostic system or as a standalone basis for educational decisions. Rather, its potential role is as an initial screening tool, in which positive predictions indicate the need for further evaluation by specialists.
Although the proposed CNN achieved strong results, several limitations need to be highlighted. A methodological limitation concerns the relationship between model selection and performance evaluation. The architectural components retained in the final model (Batch Normalization, GAP) and the Focal Loss focusing parameter ( γ = 4) were selected based on comparative results obtained on the same 259-sample dataset that was subsequently used for the LOOCV evaluation reported in Section 4.4. When model or hyperparameter selection and final performance estimation draw on the same data, the resulting estimate can be optimistically biased, a phenomenon well documented in the model-selection literature [45]. A fully unbiased estimate would require either nested cross-validation, in which model selection is repeated independently within each outer training fold, or evaluation on a separate, untouched cohort. Given the dataset size (N = 259) and the computational cost of retraining a CNN under a full nested-LOOCV scheme, this was not performed in the present study, and the reported LOOCV metrics should therefore be read as a potentially optimistic estimate of generalization performance rather than a fully independent estimate.
However, we note that this risk is not uniform across the model-selection decisions made. The Batch Normalization and GAP components were retained based on comparisons against alternatives that failed by a wide margin (e.g., complete failure to detect the minority class, with sensitivity and MCC both reduced to 0 in the absence of GAP, as shown in Table 5); this is a coarse, binary architectural decision rather than fine-grained tuning across many closely competing configurations, and both components are standard, broadly validated choices in the general CNN literature [28] independent of this particular dataset. The Focal Loss γ parameter, by contrast, was selected via a finer comparison among four candidate configurations (Table 6) and is therefore more susceptible to the selection bias described above.
Bedsides that, most critical risk is misclassifications due to natural handwriting variation. Some children may simply exhibit poor or inconsistent handwriting without having dysgraphia. In such cases, the model may mistakenly flag them as with_dysgraphia. A further limitation concerns the image preprocessing pipeline itself. The scanned handwriting samples were collected on ruled school paper, and the current pipeline applies grayscale conversion and Otsu binarization directly to the scans without an explicit step to remove the printed ruling lines. Consequently, the binarized images retain both the child’s handwriting strokes and the background ruling grid, and it cannot be fully excluded that the CNN and potentially certain handcrafted features, such as Line Straightness, which relies on Hough-based line detection partially reflect page-level artifacts (e.g., ruling-line geometry or scan characteristics) rather than relying exclusively on handwriting-specific motor and spatial cues. Future work should incorporate an automated line-removal step, such as Hough-based line filtering or morphological line subtraction, prior to binarization to isolate handwriting strokes more cleanly. Relatedly, the current pipeline resizes whole-page images to a fixed 256 × 256 resolution for both the CNN and the handcrafted-feature extraction described in Section 3.4, which may compress fine-grained stroke-level detail, such as subtle pressure variation or edge irregularity, in both approaches. Transitioning from whole-page processing to line-level or word-level cropping prior to resizing would better preserve native stroke resolution for both pipelines and may further improve sensitivity to the fine-grained motor and spatial irregularities associated with dysgraphia.
A major limitation of this study concerns the dataset size, class imbalance, and particularly the limited size of the minority class. The final dataset included 206 samples in the without_disabilities class and 53 samples in the with_dysgraphia class, all collected from fourth-grade students across six government schools in Jeddah, Saudi Arabia. Focal Loss and Leave-One-Out Cross-Validation (LOOCV) address different aspects of this limitation, but neither fully resolves it. Focal Loss shifts the training emphasis toward harder-to-classify examples, including minority-class samples, and reduces the tendency of the optimizer to favor the majority class, as demonstrated in Section 4.2. LOOCV, on the other hand, maximizes the amount of data available for training in each fold and avoids the variability associated with a single arbitrary train–test split. However, neither approach increases the diversity or number of handwriting samples represented in the dataset.
Expanding the minority class is therefore a key requirement for strengthening the generalization and robustness of these findings. In practice, however, collecting additional positive cases is challenging because inclusion in the with_dysgraphia class requires formal classification by qualified learning specialists.
A further limitation concerns external validity, the model was developed and evaluated entirely within a single data of 259 participants. Although Leave-One-Out Cross-Validation ensures that no individual sample contributes to the model that classifies it, every fold draws its training data from the same schools, the same grade level, the same curriculum, and the same data collection protocol. Cross-validation of this form estimates performance on unseen samples drawn from the same distribution; it provides no evidence regarding performance on samples drawn from a different one. Several sources of variation are therefore untested. All participants attended six government schools in Jeddah and received handwriting instruction under a single curriculum, so the model has not been exposed to differences in pedagogical practice across regions or education systems. All samples were produced by copying the same standardized passage and were digitized using a single scanner, so the model has not been evaluated under different variation. No claim regarding scalability or readiness for deployment is therefore warranted on the present evidence. The results establish that discriminative signal is present in this cohort and can be learned by a convolutional model; they do not establish that the model would perform comparably elsewhere. External validation on an independent cohort is a prerequisite for any operational use.
When comparing the proposed CNN with previous studies, it is important to note that most prior studies on the detection of learning disabilities based on handwriting have focused on English-language samples. Within the Arabic-language literature specifically, Alqahtani et al. [11] reported a CNN accuracy of 95.30–95.97% for dyslexia detection from isolated Arabic letter images collected in the same city (Jeddah, Saudi Arabia). At face value, this exceeds the 88.8% accuracy achieved by the proposed model. However, the two results are not directly comparable: [11] classifies single, isolated letters—a lower-dimensional and visually more constrained problem—whereas the present study classifies full connected-text samples reflecting natural page-level handwriting behavior, and evaluates performance using balanced accuracy, sensitivity, and MCC rather than raw accuracy alone, which is a more conservative standard given the dataset’s class imbalance. Relative to the English-language studies summarized above, it should further be noted that the unique characteristics of Arabic script—its cursive nature, context-dependent letterforms, and reliance on diacritics—introduce additional challenges that are not present in Latin alphabets.
Despite these added complexities, the proposed model achieves a balanced accuracy of 92.3%, a result that is competitive with, and in some cases exceeds, the performance reported in English-language contexts. More importantly, the proposed methodological contribution lies in the use of a GAP layer, a technique not explored in the related works, including [11]. This study argues that GAP is particularly suited to the challenges of Arabic script, as it emphasizes global feature presence over precise location, which is important for analyzing a fluid, cursive writing style. Therefore, rather than being the first study to apply deep learning to Arabic children’s handwriting, this work extends recent efforts such as [11] from isolated-character classification to full-sample, imbalance-aware screening, and offers methodological design choices—particularly GAP—that could inform future studies on other complex scripts.


6. Conclusions

This study proposes a CNN-based model for the early risk screening of dysgraphia from the handwriting of Arabic children. A custom CNN architecture was designed, comprising two key design decisions that proved critical to performance: Batch Normalization, which stabilized training and substantially improved minority-class detection (sensitivity increased from 58.49% to 98.1%), and GAP, whose absence led to complete failure on the minority class (sensitivity 0%). Together, these components enabled the model to learn discriminative handwriting patterns from a small and imbalanced dataset. Focal Loss with γ = 4 further addressed class imbalance by directing the model’s learning toward harder and minority-class examples.
The proposed CNN achieved 88.8% accuracy, 92.3% balanced accuracy, 98.1% sensitivity, an MCC of 0.738, and near-perfect ROC AUC (0.9936) and PR AUC (0.9806), substantially outperforming all feature-based machine learning classifiers and suggesting that visual markers associated with dysgraphia in Arabic children’s handwriting may be learnable by deep neural networks. This work establishes a strong foundation for preliminary automated screening for early indicators of dysgraphia in Arabic-speaking children, and the methodological contributions, particularly the use of GAP in this domain, may inform future research on other complex scripts.
Future work should focus on expanding the dataset beyond its current geographic scope in Jeddah, Saudi Arabia, to improve the generalizability of the findings. The additional experiment showed that the extracted handwriting features contain meaningful between-class information, although they are insufficient for classification on their own. A hybrid architecture combining CNN-learned representations with the ten extracted handwriting features could therefore be investigated to potentially improve performance while also providing more interpretable outputs.
Future work will also incorporate explainable artificial intelligence (XAI) techniques, such as Gradient-weighted Class Activation Mapping (Grad-CAM), to visualize the handwriting regions that contribute most strongly to the CNN’s predictions. Such analysis could provide greater transparency into the model’s decision-making process and support further investigation of whether the learned representations correspond to meaningful handwriting characteristics, including stroke formation, spacing, alignment, and spatial organization.
The primary priority for future work, however, is external validation. Data collection is planned across additional regions of Saudi Arabia and across different grade levels to establish an independent cohort on which the current model can be evaluated without retraining. Such validation would provide a more rigorous test of whether the reported performance reflects generalizable handwriting characteristics rather than patterns specific to the present dataset. Subsequent validation across other Arabic-speaking educational systems would further help define the model’s broader applicability and limitations.

Author Contributions

Conceptualization, S.M.A.; methodology, S.M.A.; formal analysis, S.M.A.; investigation, S.M.A.; data curation, S.A.; writing—original draft preparation, S.M.A.; writing—review and editing, M.A. and N.A.; supervision, M.A., N.A. and S.A.; resources, S.A. All authors have read and agreed to the published version of the manuscript.

Funding

This research received no external funding.

Institutional Review Board Statement

The study was conducted in accordance with the Implementing Regulations of the Law of Ethics of Research on Living Creatures, National Committee of BioEthics [46]. The study was non-interventional, conducted in an educational setting, involved ordinary classroom handwriting activities, collected no personal, medical, sensitive, or identifying information, and posed no more than minimal risk to participants. Under Article 10.19, minimal-risk research that does not reveal participants’ identities may be handled through an expedited review procedure. Article 10.33 identifies research involving educational tests and research conducted for educational purposes as categories that may be exempted from periodic follow-up. Article 13.5 further permits waiver of documented written consent and acceptance of verbal consent when the research does not exceed minimal risk and obtaining a participant’s signature would reveal their identity [46]. Accordingly, the study did not require standard full-committee review under the institutional policy applicable at the time of data collection. Data collection was carried out with the permission of the participating schools and the relevant educational authorities in Jeddah, Saudi Arabia.

Informed Consent Statement

Verbal informed consent was obtained from the parents or legal guardians of all child participants prior to data collection.

Data Availability Statement

The dataset is not publicly available due to privacy restrictions relating to the participation of minors, but is available from the corresponding author on reasonable request.

Acknowledgments

The authors would like to thank the participating schools and the educational authorities in Jeddah, Saudi Arabia, for facilitating data collection, and the parents and guardians who consented to their children’s participation in this study.

Conflicts of Interest

The authors declare no conflicts of interest.

References

  1. Fletcher, J.M.; Lyon, G.R.; Fuchs, L.S.; Barnes, M.A. Learning Disabilities: From Identification to Intervention; Guilford Publications: New York, NY, USA, 2018. [Google Scholar]
  2. Chung, P.J.; Patel, D.R.; Nizami, I. Disorder of written expression and dysgraphia: Definition, diagnosis, and management. Transl. Pediatr. 2020, 9, S46–S54. [Google Scholar] [CrossRef] [Scilit]
  3. Asdaq, S.M.B.; Alhowail, A.H.; Rabbani, S.I.; Nayeem, N.; Asdaq, S.M.E.; Nausheen, F. Learning Disabilities in the 21st Century: Integrating Neuroscience, Education, and Technology for Better Outcomes. SAGE Open 2025, 15, 21582440251365483. [Google Scholar] [CrossRef] [Scilit]
  4. Kunhoth, J.; Al Maadeed, S.; Saleh, M.; Akbari, Y. CNN feature and classifier fusion on novel transformed image dataset for dysgraphia diagnosis in children. Expert Syst. Appl. 2023, 231, 120740. [Google Scholar] [CrossRef] [Scilit]
  5. Rosli, M.S.A.B.; Isa, I.S.; Ramlan, S.A.; Sulaiman, S.N.; Maruzuki, M.I.F. Development of CNN transfer learning for dyslexia handwriting recognition. In Proceedings of the 2021 11th IEEE International Conference on Control System, Computing and Engineering (ICCSCE), Virtual (Online), 27–28 August 2021; pp. 194–199. [Google Scholar]
  6. Al Abadleh, A.H.; Al-Shqeerat, K.H.A.; Shaikh, M.A.; Sait, A.R.W. Unravelling handwriting images: Deep neural models for dyslexia, dysgraphia, and other learning disabilities detections and classifications: A literature review. PeerJ Comput. Sci. 2025, 11, e3296. [Google Scholar] [CrossRef] [Scilit]
  7. Danna, J.; Puyjarinet, F.; Jolly, C. Tools and methods for diagnosing developmental dysgraphia in the digital age: A state of the art. Children 2023, 10, 1925. [Google Scholar] [CrossRef] [Scilit]
  8. Gargot, T.; Asselborn, T.; Pellerin, H.; Zammouri, I.; Anzalone, S.M.; Casteran, L.; Johal, W.; Dillenbourg, P.; Cohen, D.; Jolly, C. Acquisition of handwriting in children with and without dysgraphia: A computational approach. PLoS ONE 2020, 15, e0237575. [Google Scholar] [CrossRef] [Scilit]
  9. Aldehim, G.; Rashid, M.; Alluhaidan, A.; Sakri, S.; Basheer, S. Deep Learning for Dyslexia Detection: A Comprehensive CNN Approach with Handwriting Analysis and Benchmark Comparisons. J. Disabil. Res. 2024, 3, 20240010. [Google Scholar] [CrossRef] [Scilit]
  10. Altwaijry, N.; Al-Turaiki, I.M. Arabic handwriting recognition system using convolutional neural network. Neural Comput. Appl. 2020, 33, 2249–2261. [Google Scholar] [CrossRef] [Scilit]
  11. Alqahtani, N.D.; Alzahrani, B.; Ramzan, M.S.; Altuwijri, M. Predicting Dyslexia in Arabic-Speaking Children Through Handwritten Images Using Deep Learning Methods. Commun. Math. Appl. 2024, 15, 1561–1578. [Google Scholar] [CrossRef] [Scilit]
  12. Kedar, S.V.; Parab, P.P.; Sharma, A.R.; Patil, J.M.; Wagh, R.T. Identifying learning disability through digital handwriting analysis. Turk. J. Comput. Math. Educ. 2021, 12, 46–56. [Google Scholar] [CrossRef] [Scilit]
  13. Isa, I.S.; Rahimi, W.N.S.; Ramlan, S.A.; Sulaiman, S.N. Automated detection of dyslexia symptom based on handwriting image for primary school children. Procedia Comput. Sci. 2019, 163, 440–449. [Google Scholar] [CrossRef] [Scilit]
  14. Isa, I.S.; Zahir, M.A.; Ramlan, S.A.; Wang, L.-C.; Sulaiman, S.N. CNN comparisons models on dyslexia handwriting classification. ESTEEM Acad. J. 2021, 17, 12–25. [Google Scholar]
  15. Vilasini, V.; Rekha, B.B.; Sandeep, V.; Venkatesh, V.C. Deep learning techniques to detect learning disabilities among children using handwriting. In Proceedings of the 2022 Third International Conference on Intelligent Computing Instrumentation and Control Technologies (ICICICT), Kannur, India, 11–12 July 2022; pp. 1710–1717. [Google Scholar]
  16. Spoon, K.; Crandall, D.; Siek, K. Towards detecting dyslexia in children’s handwriting using neural networks. In Proceedings of the International Conference on Machine Learning AI for Social Good Workshop, Long Beach, CA, USA, 15 June 2019; pp. 1–5. [Google Scholar]
  17. Yogarajah, P.; Bhushan, B. Deep learning approach to automated detection of dyslexia-dysgraphia. In Proceedings of the 25th IEEE International Conference on Pattern Recognition, Milan, Italy, 10–15 January 2021. [Google Scholar]
  18. Alheraki, M.; Al-Matham, R.; Al-Khalifa, H. Handwritten Arabic character recognition for children writing using convolutional neural network and stroke identification. Hum. Cent. Intell. Syst. 2023, 3, 147–159. [Google Scholar] [CrossRef] [Scilit]
  19. Alwagdani, M.S.; Jaha, E.S. Deep learning-based child handwritten Arabic character recognition and handwriting discrimination. Sensors 2023, 23, 6774. [Google Scholar] [CrossRef] [Scilit]
  20. Talebi, H.; Milanfar, P. Learning to Resize Images for Computer Vision Tasks. In Proceedings of the 2021 IEEE/CVF International Conference on Computer Vision (ICCV), Virtual, 11–17 October 2021; pp. 497–506. [Google Scholar]
  21. Jing, Z.; Tang, B. Improved image segmentation method based on Otsu thresholding and level set techniques. J. Phys. Conf. Ser. 2024, 2813, 012017. [Google Scholar] [CrossRef] [Scilit]
  22. Otsu, N. A Threshold Selection Method from Gray-Level Histograms. IEEE Trans. Syst. Man Cybern. 1979, 9, 62–66. [Google Scholar] [CrossRef] [Scilit]
  23. Baxter, L. Chapter 3—Functional network construction using functional MRI. In Connectome Analysis; Schirmer, M.D., Arichi, T., Chung, A.W., Eds.; Academic Press: London, UK, 2023; pp. 45–69. [Google Scholar]
  24. Depeursinge, A.; Fageot, J.; Al-Kadi, O.S. Chapter 1—Fundamentals of Texture Processing for Biomedical Image Analysis: A General Definition and Problem Formulation. In Biomedical Texture Analysis; Depeursinge, A., Al-Kadi, O.S., Mitchell, J.R., Eds.; Academic Press: London, UK, 2017; pp. 1–27. [Google Scholar]
  25. O’Shea, K.; Nash, R. An Introduction to Convolutional Neural Networks. arXiv 2015, arXiv:1511.08458. [Google Scholar]
  26. Feder, K.P.; Majnemer, A. Handwriting development, competency, and intervention. Dev. Med. Child Neurol. 2007, 49, 312–317. [Google Scholar] [CrossRef] [Scilit]
  27. Rangasrinivasan, S.; Suresh, M.; Olszewski, A.; Setlur, S.; Jayaraman, B.; Govindaraju, V. AI-Enhanced Child Handwriting Analysis: A Framework for the Early Screening of Dyslexia and dysgraphia. SN Comput. Sci. 2025, 6, 399. [Google Scholar] [CrossRef] [Scilit]
  28. Alzubaidi, L.; Zhang, J.; Humaidi, A.J.; Al-Dujaili, A.; Duan, Y.; Al-Shamma, O.; Santamaría, J.; Fadhel, M.A.; Al-Amidie, M.; Farhan, L. Review of deep learning: Concepts, CNN architectures, challenges, applications, future directions. J. Big Data 2021, 8, 53. [Google Scholar] [CrossRef] [Scilit]
  29. Ioffe, S.; Szegedy, C. Batch Normalization: Accelerating Deep Network Training by Reducing Internal Covariate Shift. arXiv 2015, arXiv:1502.03167. [Google Scholar]
  30. Lin, M.; Chen, Q.; Yan, S. Network In Network. arXiv 2013, arXiv:1312.4400. [Google Scholar]
  31. Guo, Y.; Liu, Y.; Oerlemans, A.; Lao, S.; Wu, S.; Lew, M.S. Deep learning for visual understanding: A review. Neurocomputing 2016, 187, 27–48. [Google Scholar] [CrossRef] [Scilit]
  32. Shrestha, A.; Mahmood, A. Review of Deep Learning Algorithms and Architectures. IEEE Access 2019, 7, 53040–53065. [Google Scholar] [CrossRef] [Scilit]
  33. Dogan, Y. A new global pooling method for deep neural networks: Global average of top-k max-pooling. Trait. Signal 2023, 40, 577–587. [Google Scholar] [CrossRef] [Scilit]
  34. Murnani, S.; Hashitsume, K.; Igasaki, T. Handwriting Difficulties: A Review of Recent Advances in the Identification and Intervention. IEEE Access 2025, 13, 133397–133417. [Google Scholar] [CrossRef] [Scilit]
  35. Kunhoth, J.; Al-Maadeed, S.; Kunhoth, S.; Akbari, Y. Automated systems for diagnosis of dysgraphia in children: A survey and novel framework. Int. J. Doc. Anal. Recognit. 2022, 27, 707–735. [Google Scholar]
  36. Rashid, H.; Malik, T.; Siddiqui, I.; Bhatti, N.; Samad, A. DYSIGN: Towards Computational Screening of Dyslexia and dysgraphia Based on Handwriting Quality. In Proceedings of the 22nd Annual ACM Interaction Design and Children Conference, Chicago, IL, USA, 19–23 June 2023. [Google Scholar]
  37. Takahata, S.; Hagihara, H.; Ishihara, H.; Enomoto, D.; Ienaga, N.; Noda, H.; Ishida, S.; Terayama, K. Comprehensive search for assessment indicators that influence the level of handwriting difficulties among children in educational settings. Sci. Rep. 2025, 15, 22795. [Google Scholar] [CrossRef] [Scilit]
  38. Borges, M.; Aprígio, L.C.S.; Azoni, C.A.S.; Crenitte, P.A.P. Types of handwriting and signs of dysgraphia in children and adolescents with learning difficulties. Rev. CEFAC 2020, 22, e17719. [Google Scholar] [CrossRef] [Scilit]
  39. Ghaleb, A.-M.O.E. Script Struggles: A Psycholinguistic Study of Handwriting Difficulties among EFL Learners. World J. Engl. Lang. 2024, 15, 464. [Google Scholar] [CrossRef] [Scilit]
  40. Lin, T.-Y.; Goyal, P.; Girshick, R.; He, K.; Dollár, P. Focal loss for dense object detection. In Proceedings of the IEEE International Conference on Computer Vision, Venice, Italy, 22–29 October 2017; pp. 2980–2988. [Google Scholar]
  41. Geroldinger, A.; Lusa, L.; Nold, M.; Heinze, G. Leave-one-out cross-validation, penalization, and differential bias of some prediction model performance measures—A simulation study. Diagn. Progn. Res. 2023, 7, 9. [Google Scholar] [CrossRef] [Scilit]
  42. Chicco, D.; Jurman, G. The advantages of the Matthews correlation coefficient (MCC) over F1 score and accuracy in binary classification evaluation. BMC Genom. 2020, 21, 6. [Google Scholar] [CrossRef] [Scilit]
  43. Saito, T.; Rehmsmeier, M. The Precision-Recall Plot Is More Informative than the ROC Plot When Evaluating Binary Classifiers on Imbalanced Datasets. PLoS ONE 2015, 10, e0118432. [Google Scholar] [CrossRef] [Scilit]
  44. Potgieter, H.L.; Mouton, C.; Davel, M.H. Impact of Batch Normalization on Convolutional Network Representations. In Artificial Intelligence Research; Springer Nature Switzerland: Cham, Switzerland, 2024; pp. 235–252. [Google Scholar]
  45. Cawley, G.C.; Talbot, N.L.C. On over-fitting in model selection and subsequent selection bias in performance evaluation. J. Mach. Learn. Res. 2010, 11, 2079–2107. [Google Scholar]
  46. National Committee of BioEthics (NCBE). Implementing Regulations of the Law of Ethics of Research on Living Creatures; Version 3; King Abdulaziz City for Science and Technology: Riyadh, Saudi Arabia, 2025.
Figure 1. Overview of the image preprocessing pipeline applied to the handwriting dataset, including grayscale conversion, binarization, noise removal, and normalization.
Applsci 16 09163 g001
Figure 2. Examples of handwriting samples produced by children diagnosed with dysgraphia.
Applsci 16 09163 g002
Figure 3. Architecture of the proposed CNN used for classifying Arabic children’s handwriting samples.
Applsci 16 09163 g003
Figure 4. Receiver operating characteristic (ROC) curve and precision–recall (PR) curve of the final CNN model for detecting handwriting samples associated with dysgraphia.
Applsci 16 09163 g004
Table 4. Summary of the ten handwriting features extracted and utilized as inputs for the machine learning classifiers.
FeatureDescription and Extraction Method
Stroke Thickness VariationMeasures pen pressure consistency. The image is skeletonized via morphological thinning, and the Euclidean distance transform then computes the local stroke radius at each skeleton point. The coefficient of variation (CV = σ / μ ) of all stroke widths captures pressure variability. Higher values indicate irregular motor force control.
Size UniformityMeasures the consistency of letter sizing across the sample. Connected components are extracted and filtered for noise (area < 10 pixels). The CV of the component bounding box heights is computed. High variability reflects instability in motor planning amplitude or sustained attention during writing.
Aspect Ratio VariationMeasures consistency of letter proportions independently of absolute size. For each component, the height-to-width ratio is computed; the standard deviation across all ratios captures shape variability. High values indicate that letters are produced with inconsistent proportions, reflecting poor motor program stability.
Organization ScoreMeasures spatial disorganization through component overlap. All pairwise combinations of component bounding boxes are checked for intersection; the ratio of overlapping pairs to total pairs is returned. Values above zero indicate that letters or letter clusters occupy the same spatial region, a direct sign of spatial planning failure.
Line StraightnessMeasures baseline control. Canny edge detection followed by a Probabilistic Hough Transform detects dominant line segments (minimum length 30 px). The standard deviation of detected line angles quantifies how much the text baseline deviates from horizontal; high values indicate poor directional control across the writing line.
Vertical AlignmentMeasures the vertical positioning consistency of letter clusters. Image moments are used to compute the y-coordinate of the centroid of each component. The standard deviation of these y-values, normalized by image height, captures how much letters jump vertically across the sample.
Baseline AdherenceMeasures how precisely individual letter bottoms align to their local baseline. The bottom edge of each component bounding box is extracted; a linear regression is fitted to these points. The mean absolute deviation of the residuals, normalized by the image height, reflects local positional accuracy around the fitted baseline.
Writing DensityMeasures the spatial utilization of the writing sample. Computed as the ratio of ink pixels to total image pixels. Lower density may reflect reduced writing output, larger spacing, or avoidance strategies adopted by children who struggle with writing.
Component CountMeasures writing complexity and output quantity. The number of noise-filtered connected components is counted and normalized by image area. Fewer components suggest simplified letter forms, reduced text production, or letter merging, all associated with struggling with writing.
Spacing ConsistencyMeasures the regularity of inter-element spacing as a proxy for writing automatization. Component centroids are sorted in right-to-left reading order; Euclidean distances between consecutive centroids are collected. The CV of these distances captures spacing regularity; high variability indicates struggling with writing.
Table 5. Performance comparison of CNN architectural variations.
ArchitectureAccuracyBalanced AccuracySensitivitySpecificityROC AUCMCC
Without Batch Norm90.35%78.52%58.49%98.54%0.96180.6814
Without GAP Layer79.54%50%0%100%0.88780
Table 6. Comparison of cross-entropy, weighted cross-entropy, and focal loss with different focusing parameters.
Loss FunctionAvg. Validation LossStd. Deviation
Cross-Entropy0.55790.1773
Weighted Cross-Entropy (w = [0.63, 2.44])0.56430.2787
Focal Loss ( γ = 3 )0.02230.0094
Focal Loss ( γ = 4 )0.01200.0047
Table 7. Feature-based classifier performance.
ClassifierAccuracyBalanced AccuracySensitivitySpecificityF1-ScoreROC AUC
Logistic Regression69.5%62.6%50.9%74.3%40.6%0.688
SVM (Linear)70.3%58.9%39.6%78.2%35.3%0.672
SVM (RBF)65.6%58.8%47.2%70.4%36.0%0.624
Random Forest80.3 %55.4%13.2%97.6%21.5%0.645
Table 8. Summary of performance of the proposed CNN.
MetricValue
Accuracy88.8%
Balanced Accuracy92.3%
Precision (Macro Avg.)82.2%
Precision (Micro Avg.)88.8%
Recall (Macro Avg.)92.3%
Recall (Micro Avg.)88.8%
F1-Score (Macro Avg.)85.3%
F1-Score (Micro Avg.)88.8%
ROC AUC0.9936
PR AUC0.9806
MCC0.738
Table 9. Confusion matrix of the proposed CNN classifier.
Predicted: Without DisabilitiesPredicted: With Dysgraphia
Actual: Without DisabilitiesTN = 178FP = 28
Actual: With dysgraphiaFN = 1TP = 52
Disclaimer/Publisher’s Note: The statements, opinions and data contained in all publications are solely those of the individual author(s) and contributor(s) and not of MDPI and/or the editor(s). MDPI and/or the editor(s) disclaim responsibility for any injury to people or property resulting from any ideas, methods, instructions or products referred to in the content.