Article

Production of β-Phycoerythrin and Exopolysaccharide in Porphyridium purpureum Modulated via Static Magnetic Fields and Polymeric Nanofibers


by
Matheus Pereira de Carvalho
1,2,
Michele Greque de Morais
3,
Christine Gardarin
1,
Lucielen Oliveira dos Santos
4,
Jorge Alberto Vieira Costa
2 and
Céline Laroche
1,*
1
Institut Pascal, Université Clermont Auvergne, UMR CNRS 6602, F-63000 Clermont-Ferrand, France
2
Laboratory of Biochemical Engineering, College of Chemistry and Food Engineering, Federal University of Rio Grande, Rio Grande 96203-900, RS, Brazil
3
Laboratory of Microbiology and Biochemistry, College of Chemistry and Food Engineering, Federal University of Rio Grande, Rio Grande 96203-900, RS, Brazil
4
Laboratory of Biotechnology, School of Chemistry and Food, Federal University of Rio Grande, Rio Grande 96203-900, RS, Brazil
*
Author to whom correspondence should be addressed.
Appl. Sci. 2026, 16(14), 7311; https://doi.org/10.3390/app16147311
Submission received: 10 June 2026 / Revised: 6 July 2026 / Accepted: 15 July 2026 / Published: 21 July 2026

Abstract

Trade-offs between biomass productivity and metabolite accumulation constrain microalgae cultivation for high-value biomolecules due to nutrient competition and concurrent metabolic pathways. This study evaluated the independent and combined effects of static magnetic fields (SMF) and polymeric nanofibers on growth performance, biomass composition, and exopolysaccharide (EPS) profiles of Porphyridium purpureum. A process intensification strategy was applied by integrating external physical forcing and structured functional materials to enhance mass transfer and carbon utilization efficiency. Cultivations were conducted under controlled photobioreactor conditions using SMF exposure for 1 h d−1 or 24 h d−1, combined with polyacrylonitrile (PAN) nanofibers or monoethanolamine-functionalized nanofibers (MEA). Intermittent SMF increased maximal biomass concentration by 36% compared to the control, whereas continuous SMF, MEA nanofibers, and combined conditions reduced biomass accumulation by up to 45%. SMF promoted metabolic reallocation toward carbon-rich fractions, increasing released polysaccharides by 83% and lipid content by 38%. Nanofibers strongly enhanced pigment biosynthesis, with β-phycoerythrin reaching 41.3 mg g−1, threefold higher than the control. EPS characterization showed increased purity, uronic acid content, and sulfation depending on treatment. Overall, SMF and nanofibers acted as selective intensification tools, enabling tunable modulation of growth, metabolism, and product formation.

1. Introduction

Microalgae function as the primary agent for global carbon sequestration, mediating approximately 50% of the planet’s oxygenic photosynthesis [1]. Their carbon assimilation rates often exceed those of vascular plants by 10 to 50 times, attributed to the Carbon Concentrating Mechanism (CCM). CCM increases inorganic carbon assimilation through carbon dioxide (CO2) supersaturation around the RuBisCO enzyme, facilitating photosynthesis [2,3]. Beyond their ecological significance, these microorganisms present a compelling alternative to terrestrial crops. They bypass the “food vs. fuel” trilemma by thriving on marginal lands, exhibiting high nutrient-use efficiency, and high valor biomass production [1].
Industrial microalgae biomass is mostly derived from Chlorella sp. and the cyanobacteria Arthrospira (commercially “Spirulina”) summing up to 90% of the total production, due to their lipid and protein content, respectively [4]. However, the pursuit for other high value molecules has increased the interest toward genera such as Crypthecodinium and Nannochloropsis for long-chain polyunsaturated fatty acids (PUFAs), and Haematococcus for astaxanthin [5,6,7]. Among these microalgae, the rhodophyte Porphyridium purpureum is characterized by the synthesis of exopolysaccharides (EPS), phycoerythrin, carotenoids, and PUFAs [8]. The structural complexity of these EPS gives them characteristics ranging from their viscoelastic behavior, bioactivity, and antioxidant potential. P. purpureum is a promising candidate for food, pharmaceutics, and cosmetic industries due to EPS antiviral, immune regulatory, and thickening behavior, as well as phycoerythrin pink-red pigments [8,9,10].
The transition to industrial-scale production of microalgae is typically hindered by productivity, since traditional strategies to enhance high-value molecules, such as nitrogen or phosphorus starvation, decrease biomass production [11]. Consequently, the development of strategies to mitigate the low biomass productivity while increasing the synthesis of high-value molecules is necessary. Hence, Static Magnetic Fields (SMF) have emerged as a promising alternative as an easy-to-apply, non-toxic, and low-cost method to improve microalgal cultivation [12]. SMF stimulus acts upon biological systems via magnetic induction, magneto-mechanical effect, and the radical pair mechanism, potentially modulating DNA transcription, enzymatic flux, metabolic pathways, photosynthesis, and oxidation levels [13,14,15].
Most of the data available on the effect of SMF on microalgae and cyanobacteria are derived from observational, whole-culture experiments interpreted through general biochemical and biophysical principles, rather than from direct mechanistic investigation, highlighting the need for research targeting the specific metabolic pathways through which this stimulus acts. In these organisms, the reported effects of magnetic fields can be broadly grouped into three categories: metabolic and/or genetic changes, structural changes at the cellular level, and changes in electron transport linked to the photosynthetic reaction centers [14]. Metabolic and genetic changes are typically inferred from experiments in which SMF exposure increases the growth rate or alters protein content, indicating a shift in cellular metabolism. Structural changes are mostly associated with increased membrane permeability, which enhances nutrient uptake from the medium into the cytoplasm and, consequently, metabolic efficiency. Effects on the reaction centers, in turn, have been linked to an increase in the quantum yield of photosystem II, stimulating energy flow and electron transfer during photosynthesis [14]. The microalgae response to SMF stimuli is highly dependent on the source, intensity, and duration of exposure, as well as the microorganism being exposed, suggesting the need for specific studies of how SMF acts in different microalgae [14,15].
In parallel, the optimization of interfacial mass transfer of CO2 remains a critical challenge in high-density cultivation. Chemical absorbents, specifically alkanolamines such as monoethanolamine (MEA) and diethanolamine (DEA), are well-documented for their ability to increase CO2 retention in liquid media through the formation of carbamates [16,17,18]. Also, to amplify the bioavailability of inorganic carbon, the use of polymeric nanofibers can be employed. Due to the high surface area of these structures, they act as physical adsorbents of CO2 in the microalgal cultivation [19,20]. At the same time, nanofiber production allows for personalizing its components; thus, the production of polymeric nanofibers with chemical absorbents is a potential tool. These nanofibers theoretically have a double CO2 retention mechanism: the nanofiber matrix provides a dense network of physical adsorption sites, while the functionalized MEA enables localized chemisorption, increasing CO2 availability for microalgal cultivation [21]. Enhanced CO2 availability during cultivation can stimulate carbon fixation by increasing Calvin-cycle activity and photosynthetic oxygen evolution. It may also enhance bicarbonate transport, carbonic anhydrase function, and pyrenoid-based CO2-concentrating mechanisms, improving CO2 supply to Rubisco and thereby favoring metabolic activity and growth [22].
The combined SMF and polymeric nanofibers represents a novel and largely unexplored strategy in microalgal biotechnology. SMF have been reported to influence cellular activity and metabolic regulation, whereas polymeric nanofibers improve CO2 availability at the cell–medium interface [14,21]. In this context, this study aims to evaluate the independent and combined effects of SMF and MEA-nanofibers on the cultivation of Porphyridium purpureum. Specifically, investigating how these stimuli modulate growth kinetics and the biosynthesis of high-value β-phycoerythrin and EPS, while seeking alternatives to conventional stress-based induction strategies.

2. Materials and Methods

2.1. Inoculum

The strain used was Porphyridium purpureum CCAP 1380/1A acquired from the Culture Collection of Algae and Protozoa (www.ccap.ac.uk) grown in modified artificial sea water (ASW) medium [23] composed of g L−1; 28 NaCl, 1.85 NaNO3, 0.95 K2HPO4, 7.20 MgSO47H2O, 1.55 CaCl2 2H2O, 100 µL mineral solution (g L−1); 1.5 MnSO4H2O, 0.15 (NH4)6Mo7O244H2O, 0.15 CoSO4, 7H2O 0.5 CuSO45H2O, 2.5 ZnSO47H2O, and 100 Fer-EDTA and vitamins (g L−1); 0.1 B12, 0.25 thiamine, and 0.4 biotin. Medium was sterilized by filtration on 0.22 µm membranes and kept at room temperature. All chemical reagents were purchased from Sigma-Aldrich®, Saint-Quentin-Fallavier, France).

2.2. Experiment Design

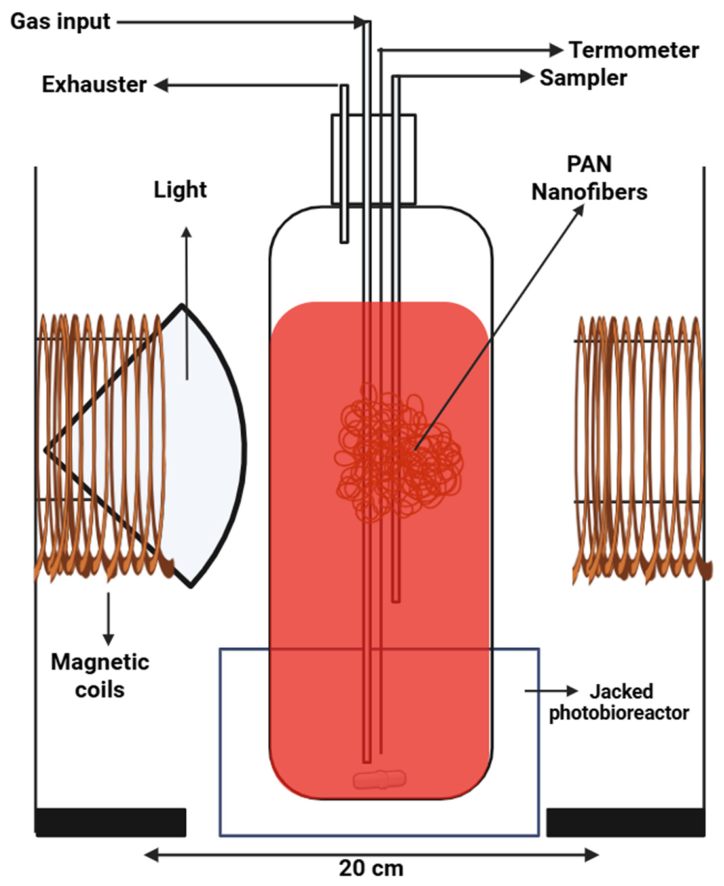
All experiments were performed in triplicate in 600 mL rectangular jacked photobioreactors connected to condensers to minimize evaporation (Figure 1). Cultivations were homogenized using a magnetic stirrer and sterile airflow; the temperature was controlled by an immersed electrode. The experiments lasted 15 days with modified ASW medium [23]. Cultures were maintained at 21 ± 1 °C under continuous (24 h) irradiation of 200 μmol photons⋅m−2·s−1 [24]. Homogenization was ensured by sterile compressed air at a flow rate of 0.3 vvm (mLair·mLmedium−1·min−1). A gas mixture of 7.5% CO2 was injected for 2 min hourly, with aeration paused for 1 min before and after injection to enhance mass transfer [18].
A static magnetic field (SMF) of 11 ± 2 mT was generated by coils connected to an electric current (3A) at the center of the bioreactors and applied intermittently (1 h d−1) or continuously (24 h d−1) [25]. Nanofiber solutions were prepared according to Cardias et al. [21]. Polyacrylonitrile (PAN; 150,000 g mol−1, Sigma-Aldrich®, Saint-Quentin-Fallavier, France) was dissolved in dimethylformamide (DMF; Sigma-Aldrich®, Saint-Quentin-Fallavier, France) at 11.5% (w v−1), followed by the addition of monoethanolamine (MEA; Sigma-Aldrich®, Saint-Quentin-Fallavier, France) at 1% (w v−1). Electrospinning was performed at a flow rate of 800 μL h−1 using a 0.55 mm capillary, with an applied voltage of 425 kV and a tip-to-collector distance of 180 mm. The process was conducted at 20–23 °C and 50–58% relative humidity. Polymeric nanofibers were added in the proportion of 0.1 mg mLmedium−1 [19].
The experiments had 7 conditions: Control (CT), static magnetic field 1 h d−1 (M1), static magnetic field 24 h (M24), with only PAN nanofibers (N), PAN nanofibers and static magnetic field 1 h d−1 (MN), PAN monoethanolamine nanofiber (NE), and PAN monoethanolamine nanofiber with static magnetic field 1 h d−1 (MNE).

2.3. Growth Kinetics

Culture growth was tracked daily by cell counting in Malassez chamber, which was linearly correlated to gravimetric dry mass. The culture pH was monitored with pH meter (SevenEasy S20, Mettler Toledo, Viroflay, France). The biomass concentration (X), productivity (P), and doubling time (Dt) were calculated from the daily reads. The final mass of cells was added to the biomass production calculations. Daily productivity was obtained by the equation P = ( X t X 0 ) / t where X t is the biomass concentration of the day, X 0 is the biomass concentration at the beginning of the culture, and t is the time in days. The maximum growth rate (μmax) was estimated by linear regression of the exponential growth phase in the lnX vs. t graph, and the doubling time Dt was determined by l n ( 2 ) / μ m a x [25].
For treatments containing nanofibers, a correction was applied to account for adhered biomass. At the end of the cultivation, nanofibers were collected, dried at 50 °C until a constant weight ( N i n i t a l ) was achieved. A daily linear biomass accumulation rate on the nanofibers ( P N a n o ) was assumed and calculated using the equation P N a n o = ( N f i n a l N i n i t a l ) / t f i n a l where N i n i t a l is the initial mass of the nanofibers, and t f i n a l is the total cultivation duration in days. The corrected daily biomass concentration ( X c o r r e c t e d ) was then calculated by adding this linear accumulation to the measured suspended biomass: X c o r r e c t e d = X t + ( P N a n o . t ) [24].

2.4. Biomass and EPS Harvest

After 15 days, the culture was centrifuged (10,000× g for 15 min at 5 °C), the biomass was washed 2 times with NaCl solution (18 g L−1) to reduce salt content and wash RPS while avoiding cell lysis, the supernatant was separated for released polysaccharides (RPS) extraction while the pellet (biomass) was frozen at −80 °C for 48 h, then lyophilized and kept at −20 °C until further analysis.
EPS was separated into released polysaccharides (RPS) and bound polysaccharides (BPS). RPS was harvested by ultrafiltration of the centrifuged supernatant at the end of the experiments with Vivaflow 200 system (Merck Millipore, Saint-Quentin-Fallavier, France) with 10 kDa NMWCO (molecular weight cut-off) membrane for desalination and purification of RPS up to a conductivity measured < 5 μS cm−1, after which the sample was frozen at −80 °C for 48 h, then lyophilized and kept at −20 °C until further analysis.
BPS extraction was performed as described by Filali et al. [26] modified by Phélippe et al. [27]. A 0.5 g sample of lyophilized biomass was suspended in 200 mL of TAPS buffer (50 mM, pH 8.15) containing 25 mM EDTA and heated to 100 °C for 20 min. After centrifugation (10,000× g for 15 min), the supernatant was reserved, and the pellet was subjected to a second extraction under identical conditions. The two supernatants were pooled, and the BPS was precipitated by adding three volumes of 3% (w/v) cetyltrimethylammonium bromide (CTAB) and incubating overnight. The precipitated BPS-CTAB complex was recovered by centrifugation (10,000× g for 15 min at 0 °C) and purified through three sequential resolubilization-precipitation cycles. The pellet was first dissolved in 1.5 M KCl, then reprecipitated with three volumes of 96% (v v−1) ethanol (24 h at −20 °C). This process was repeated using 0.75 M KCl and 0.3 M KCl. Finally, BPS pellet was dissolved in MilliQ water, submitted to ultrafiltration as previously described, and then lyophilized.

2.5. Biomass Characterization

For macronutrient quantification, a cellular lysate was prepared by resuspending 10 mg of lyophilized biomass in 10 mL of distilled water. The suspension was then subjected to ultrasonication for 10 min (UP100H, Hielscher, Teltow, Germany) at 100% amplitude using a 30-s on, 29-s off pulse cycle to ensure complete cell lysing. In order to prevent molecular degradation, the tube was maintained in ice during the process. Total carbohydrates were quantified from the lysate using the phenol-sulfuric acid method described by Dubois et.al [28] and modified as previously described by Borjas et al. [29] with glucose as the standard. For total protein analysis, the lysate was first treated with 1 M NaOH (1:1) and incubated for 5 min at 100 °C for solubilization of protein [30], followed by the Lowry et al. [31] method against an albumin standard curve. The lipid content was extracted from 10 mg of lyophilized biomass and measured by the colorimetric method described by Marsh and Weinstein [32] with chloroform and methanol as solvents.
To evaluate the pigments, 0.1 g of dried biomass was diluted in 7 mL of sodium phosphate 20 mM buffer (pH 7.2). The cells were lysed by subjecting the suspension to three freeze-thaw cycles, followed by ultrasonication for 3 min at 100% amplitude (UP100H, Hielscher) in an ice bath. This extraction was centrifuged 10,000× g for 30 min and the supernatant absorbance was measured at 545, 620, and 650. The B-phycoerythrin (B-PE) concentration (mg L−1) was calculated with the correlation equations between R-phycocyanin (RPC) and allophycocyanin (APC) [33]:
R P C = ( A b s 620 n m 0.7 A b s 650 n m ) / 7.38
A P C = ( A b s 650 n m 0.19 A b s 620 n m ) / 5.65
B P E = ( A b s 545 n m 2.8 R P C 1.34 A P C ) / 12.7
Subsequently, liposoluble compounds were extracted from the pellets subjected to repeated extractions with 80% (v v−1) acetone, with centrifugation after each step, until the pellet was colorless. The absorbance of the pooled acetone supernatants was measured at 470, 646.8, and 663.2 nm. Concentration (mg L−1) of carotenoids (TC), chlorophyll a and b (Chl a and Chl b) were determined by the correlations [34]:
C h l   a = 12.25   A b s 663.2 n m 2.79   A b s 646.8 n m
C h l   b = 21.50   A b s 646.8 n m 5.1   A b s 663 n m
T C = ( 1000 A b s 470 n m 1.82 C h l   a 85.02 C h l   b ) / 198
B-PE concentration, initially obtained on a culture volume basis (mg L−1), was normalized to biomass concentration to express B-PE content (mg BPE g dw−1). B-PE volumetric productivity (mg BPE L−1 d−1) was then calculated by multiplying this content by the maximum biomass productivity (Pmax, g L−1 d−1) obtained for each treatment.

2.6. EPS Characterization

For detailed monosaccharide composition, EPS samples were first hydrolyzed in 2 M trifluoroacetic acid (TFA) for 90 min at 120 °C, followed by neutralization with 2 M NH4OH (pH~7). The hydrolysates were filtered (0.2 μm) prior to analysis by High-Performance Anion-Exchange Chromatography with Pulsed Amperometric Detection (HPAEC-PAD) on a Dionex ICS 3000 system (Thermo Fischer Scientific, Montigny-le-Bretonneux, France) equipped with an AS 50 autosampler as described by [29].
A 25 μL aliquot of each sample was injected onto a CarboPac PA1 guard column (4 × 50 mm) connected to a CarboPac PA1 analytical column (4 × 250 mm) maintained at 25°C. The column was equilibrated with 18 mM NaOH for 15 min before each injection. Monosaccharides were eluted at a constant flow rate of 1 mL min−1 using an isocratic step of 18 mM NaOH for 25 min to separate neutral sugars, followed by a 20-min linear gradient from 0 to 0.5 M sodium acetate in 200 mM NaOH to elute acidic sugars. A final 15-min wash with 200 mM NaOH was performed to regenerate the column. Data were collected and analyzed using Chromeleon 6.80 software. Monosaccharide peaks were identified by comparing their elution times to a standard mixture (L-Rha, D-Rib, L-Fuc, L-Ara, D-Xyl, D-Man, D-Gal, D-Glc, D-GalN, D-GalNAc, D-GlcNAc, D-GlcA, D-GalA). Peak identities were subsequently confirmed by co-elution (spiking) of samples with the corresponding authentic standards. HPAEC-PAD chromatograms of one sample (RPS CT) and standards are proposed as Supplementary Figure S1.
The global composition and sulfate content of the exopolysaccharide (EPS) fractions were determined using established colorimetric and turbidimetric assays. Protein was determined by the Lowry et al. [31] method, and total sugars by Dubois et al. [28]. Total neutral sugars were quantified using the resorcinol-sulfuric acid method [35,36] and total uronic (acidic) sugars were quantified using the metahydroxydiphenyl method [37]. Sulfate content was determined via the turbidimetric method described by Dogson and Price [38] against a K2SO4 standard curve, with results expressed as mg SO4 equivalent per g of EPS.

2.7. Statistical Analysis

All experiments were conducted using at least three independent biological replicates (n ≥ 3), and the results are presented as the mean ± standard deviation (SD). Statistical significance between experimental groups was assessed by a one-way analysis of variance (ANOVA) followed by Tukey’s post hoc test; a p-value < 0.05 was considered statistically significant.

3. Results

3.1. Porphyridium purpureum Growth Kinetics and EPS Production

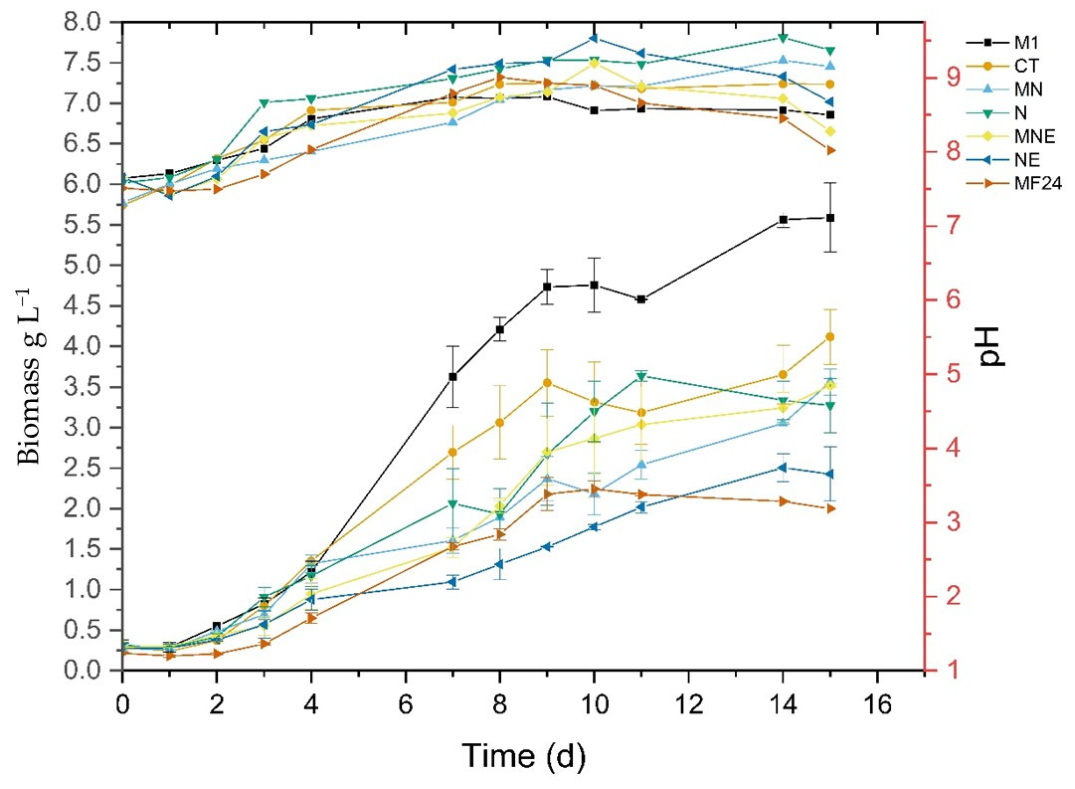
Throughout the cultivation, the pH varied from 7.3 to 9.5 (Figure 2), and the experiments with added nanofibers showed a higher pHmax (>9.2) than the assays without nanofibers (pHmax < 8.9). The experiments under SMF tend to show a lower pH than their non-MF counterparts (e.g., MN × N).
All experiments followed a similar growth behavior (Figure 1), with the start of the exponential phase on day 1 (Table 1). They differed in the duration of this phase, varying from 1 to 8 days, with the longest being experiment M1. M1 was the assay with the highest (p ≤ 0.05) maximal biomass (Xmax) of 5.59 g L−1, an increase of 36% when compared to CT, while for the experiment MNE, NE, and M24 showed a decrease of 15, 39, and 45%, respectively.
The maximum specific growth (μmax) was the highest from CT, MN, and N (0.59, 0.51, and 0.50 g d−1) due to the shorter exponential phase (1–4 days). Similarly, for the doubling time (Dt), the lowest value corresponds to the one with the highest μmax. At the end, the released polysaccharide (RPS) concentration varied from 0.66–0.28 g L−1 for M1 and N assays, respectively.

3.2. Biomass Characterization

Analysis of the P. purpureum biomass indicates that carbohydrates constituted the primary macromolecular fraction across all experimental groups (Table 2). The M24 treatment yielded the maximal carbohydrate concentration at 52.4%, representing a 21% increase relative to the control (CT). This was followed by the MN treatment (49.3%), whereas the M1 group exhibited the lowest carbohydrate content at 40.1%. Protein concentrations were highest in the MNE and CT treatments, both stabilizing at approximately 37%. The M24 treatment showed the lowest protein levels at 28.5%. Regarding the lipid fraction, values fluctuated between ~19% (CT and M24), and ~26% (MN and M1).
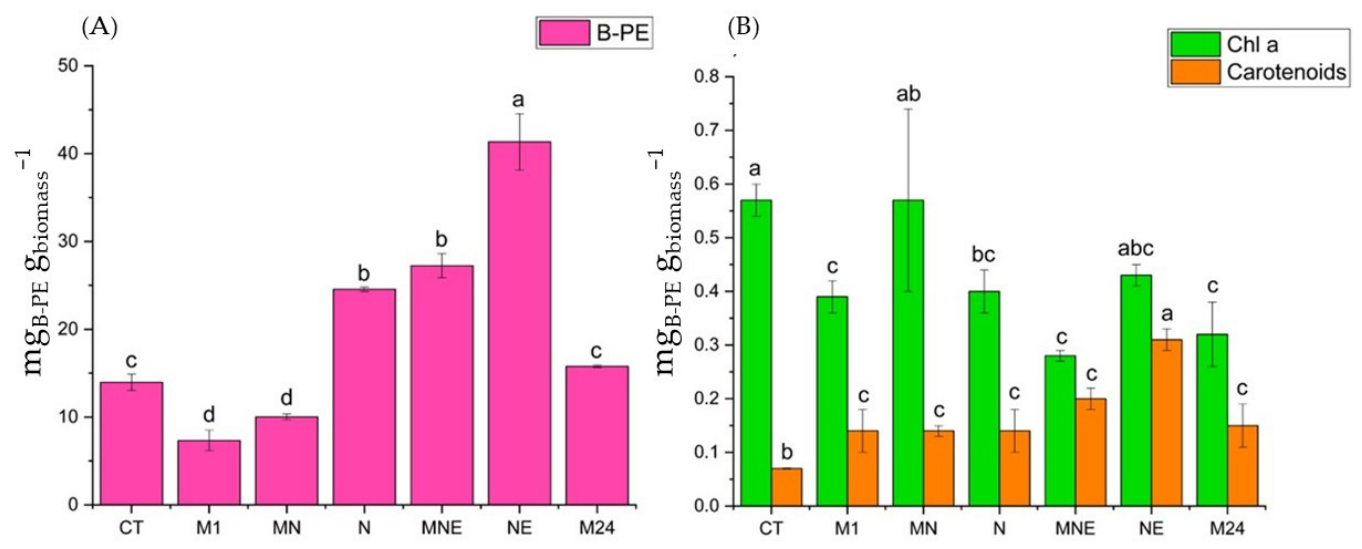
The main pigments present in P. purpureum are phycobilin, chlorophylls, and carotenoids. Phycoerythrin is divided into B-phycoerythrin (B-PE) and α-phycoerythrin, where B-PE is considered the core pigment [39,40]. The higher (p ≤ 0.05) B-PE content was in treatments with only nanofibers, in particular, the NE assay (41.3 ± 3.22 mgB-PE gdw−1) (Figure 3A), which presented a 196% increase when compared to CT (13.9 ± 0.95 mgB-PE gdw−1). While treatments with only SMF had no difference (M24) or a decrease (p ≤ 0.05) of 47% when compared to CT. Carotenoid content (Figure 3B) in the biomass was affected in all experiments, showing an increase (~100%) when compared to CT, but NE treatment had the highest increase (342%) when compared to CT.
Considering biomass production across the treatments and assuming that B-PE content at harvest is representative of content during the period of maximal biomass productivity, volumetric B-PE productivity was still higher in the NE treatment, reaching 6.61 mg B-PE L−1 d−1, compared with 5.02 mg B-PE L−1 d−1 in CT. The N and MNE treatments showed the highest B-PE productivity among all conditions, both reaching 7.35 mg B-PE L−1 d−1. These results indicate that, despite lower biomass productivity, treatments enhancing B-PE content still translate into a net gain in volumetric pigment production relative to the control.

3.3. EPS Characterization

EPS purity can be indicated by the results of the total sugars assay (Table 3), which shows a higher purity of the RPS (60–92%) than BPS (40–52%), due to the hot extraction of the BPS from the biomass, which increases the protein content of the purified EPS. Assays with nanofibers, in general, have shown a higher (p ≤ 0.05) RPS purity (~20%) when compared to M1 and CT of the produced EPS (both RPS and BPS), varying between 62–77%.
MNE treatment RPS showed the highest (p ≤ 0.05) acid sugar ratio (28%). Treatment M24 had the highest (p ≤ 0.05) sulphated content (16.9%) and the second-highest uronic acid concentration (21.1%). BPS biochemistry profile differed from RPS mostly by the higher (p ≤ 0.05) sulphate ratio (15–21%) and lower acid sugars (10–18%). BPS of all assays showed a higher acid sugar content than CT, but not for sulphates. Sulphate ratio was equal for CT, M1, MN, MNE, where M1 assay showed high sulphate (19%) and uronic acid (18%) ratios simultaneously.
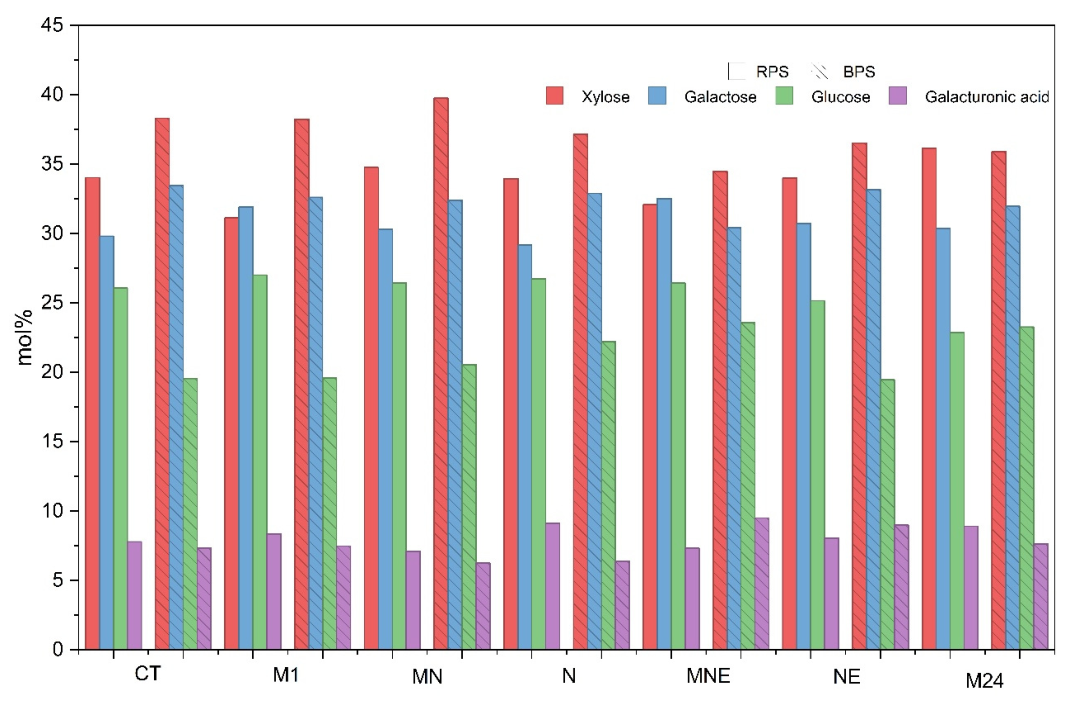
The monosaccharide profile of the extracted exopolysaccharides (EPS) confirms a heteropolymeric structure dominated by xylose, galactose, glucose, and galacturonic acid (Figure 4). These findings align with established benchmarks for P. purpureum [29,41]. Neutral sugars accounted for over 90% of the total mass, following abundance order: xylose > galactose > glucose. However, the apparent backbone stability across treatments covers some divergences between the released (RPS) and bound (BPS) fractions. Notably, RPS exhibited an 18% higher glucose proportion compared to BPS, whereas the latter showed a higher xylose (10%) and galactose (6%). These differences suggest that glucose is preferentially associated with released polymers, whereas xylose characterizes cell wall-bound polymers.

4. Discussion

4.1. Porphyridium purpureum Growth Kinetics and EPS Production

The effect of the treatments on growth kinetics can be associated with the SMF, nanofibers, or a combination of both treatments. MF can act by enhancing CO2 solubility by physically stabilizing the dielectric gas-liquid layer through the Hall effect [42] acidifying the media. This behavior is desirable from a biotechnological point of view since it would be necessary to use less CO2 for pH control, increasing the efficiency of CO2 assimilation. Meanwhile, nanofiber experiments show an increase in pH during cultivation, but the MNE assays show a sharp drop in pH during the last two days, probably due to metabolic decline and CO2 saturation in the media. Nanofibers in microalgae cultivations are shown to increase the pH due to the adsorption of CO2, decreasing the formation of carbonic acid [43].
The increase in pH during microalgae cultivation is expected, since the consumption of CO2 during photosynthesis tends to influence the carbonate balance by assimilating the carbonic acid via carbonic anhydrase, as well as the production of hydroxide during the NH3+ metabolism, which increases the pH [44]. Followed by a drop in pH due to CO2 accumulation and the end of nitrates in the media after the exponential phase, reducing the consumption of carbonic acid and the production of hydroxide. The rise and fall of pH during cultivation behavior were seen in all experiments. Once they achieved the higher biomass content, the pH followed the tendency to be the highest.
Growth in microalgae cultivation is a multifactorial process depending on cultivation parameters such as temperature, bioreactor design, light, salinity, and other stresses. SMF does not follow a linear dose-response relationship and can act as a stimulatory, inhibitory, or non-existent effect depending on the intensity, time, source, and microorganism to which it is applied [15,45]. It influences physical and biochemical mechanisms, such as enzymatic activation and photosynthesis [13]. This broad range of responses makes it difficult to isolate a single factor governing the response of biological systems to SMF.
SMF can increase reactive oxygen species beyond the cell’s antioxidant capacity, disrupt paramagnetic enzymatic centers, and increase cell wall permeability, rendering its application inhibitory [45]. At the same time, if applied under favorable conditions (time and intensity), it can have the opposite effect (M1), increasing biomass production, antioxidant response, and photosynthesis via enzymatic activation, membrane permeability for nutrient intake, and/or ion transfer [13,14,45]. It is worth noting that M1 combined the lowest specific growth rate (μmax) with the highest volumetric productivity (Pmax) among all treatments (Table 1). This apparent contradiction is explained by the distinct nature of these two parameters: μmax reflects the relative rate of biomass increase during the exponential phase, whereas Pmax reflects the absolute biomass gain over time, which depends on both growth rate and the duration of active growth. M1 sustained an exponential phase markedly longer than the other treatments (8 days, versus 1–4 days), allowing it to reach the highest Xmax (5.59 g L−1) despite a comparatively lower specific rate. This indicates that, under M1 conditions, SMF prolonged the period of active growth rather than accelerating it, resulting in the greatest overall biomass gain.
At the molecular level, the effects of SMF on microalgal and cyanobacterial cells can be broadly attributed to three non-mutually exclusive mechanisms. First, the radical pair mechanism proposes that magnetic fields modulate the singlet-triplet interconversion of light-generated radical pairs, such as those formed in flavin- and cryptochrome-based photoreceptors, thereby altering local reactive oxygen species levels and downstream redox-sensitive signaling pathways [46,47]. Second, SMF may influence redox enzymes and electron-transfer reactions, including antioxidant defenses such as superoxide dismutase, thereby affecting cellular oxidative balance [48]. Third, magnetic-field-induced effects on ion transport and membrane-associated signaling may contribute to changes in Ca2+ homeostasis, nutrient uptake, and gene expression, although this mechanism remains less directly validated in microalgae [15,49]. In a more mechanistic bacterial model, proteomic analysis of Listeria monocytogenes exposed to pulsed magnetic field showed coordinated disruption of nutrient transport and key metabolic pathways, including carbohydrate, amino acid, and nicotinate/nicotinamide metabolism, supporting the idea that magnetic fields can perturb membrane-linked transport and intracellular metabolism [50]. Together, these mechanisms provide a plausible molecular basis for the responses observed in the present study, but species- and dose-specific validation is still needed.
Xmax for the nanofiber-only treatments (MN and N) did not differ significantly from either CT or the MEA-functionalized treatments (MNE and NE), occupying an intermediate position between them. CT, in turn, was significantly higher than MNE and NE, which showed reductions of 15% and 23%, respectively, relative to CT (Table 1). This gradient, from CT, through the intermediate MN/N, to the reduced MNE/NE, suggests that the biomass-limiting effect intensifies with MEA functionalization rather than being caused by the presence of nanofibers alone, possibly because MEA promotes a more pronounced cell–surface interaction. This is consistent with the tendency of P. purpureum to aggregate on surfaces, which could reduce cell/media interaction and limit nutrient uptake.
Studies on Porphyridium under SMF or nanofibers are not available in the literature; the main strategies reported to increase biomass and biocompound production rely on manipulation of parameters such as nutrients, light, pH, and hormones [51]. Yi et al. [52] increased biomass production to ~5.97 g L−1, a 132% increase over their control, using experimental optimization of calcium gluconate, magnesium gluconate, and peptide ratios—a substantially larger gain than the 36% observed here for M1, though achieved through nutrient supplementation rather than a physical stimulus. The authors attributed this increase to the high-quality plant peptides and the additional organic carbon supplied.
Adding nanofibers to microalgae cultivation also has a methodological downside: biomass adsorption onto the fibers during growth can make concentration measurements inaccurate and hinder comparison with nanofiber-free cultures [20]. Carvalho et al. [24] reported a 9–15% of Limnospira biomass attached to nanofibers. In our study, the biomass attached to the nanofibers varied from 15–19% of the Xmax, this increase was expected for P. purpureum since this microalga tends to produce EPS and attach to surfaces. This adsorbed fraction was weighed at the end of the experiment and included in the final biomass and kinetics calculations.
The EPS production is linked to physical and chemical stress, such as osmotic pressure and nitrogen deprivation [29]. For the M1 and MN assays, SMF seems to act as a physical stressor, inducing the formation of RPS. It is relevant to notice that the M24 treatment showed an RPS concentration statistically similar to CT, despite having 45% less biomass, which may indicate an increase in the RPS/biomass ratio. SMF seems to increase carbohydrate production towards RPS; this effect could be associated with the influence of the SMF in microalgae cultivation associated with carbon assimilation metabolic pathways, enzymatic activity, an increase in cell wall permeability, and improved nutrient intake [14]. During the SMF experiments, a more homogeneous cultivation was visually observed, which could help explain the higher RPS concentration in the medium: with less cell clustering, a smaller fraction of EPS remains attached to the cell wall, favoring its release into the medium as RPS. Further studies are needed to evaluate the homogenizing effect of SMF on Porphyridium cultivation.

4.2. Biomass Characterization

Carbohydrate accumulation in the biomass did not respond uniformly across SMF treatments: it increased under continuous SMF (M24) and the combined MN treatment, but decreased under intermittent SMF alone (M1). Nanofiber-only treatments also increased carbohydrate content despite the absence of SMF. This pattern suggests that carbohydrate accumulation in the biomass is not an exclusive SMF effect, but rather a broader stress-associated metabolic response, potentially involving carbon assimilation pathways, enzymatic activity, and cell wall permeability, triggered to different extents by both SMF and nanofiber exposure. Carbohydrates in Porphyridium are found mainly as sulfated cell-wall polysaccharides, floridean starch, and low-molecular-weight carbohydrates, primarily floridoside [53,54]. Synthesized through photosynthesis and the Calvin-Benson-Bassham cycle, their production is influenced by countless reasons, such as nutrients, temperature, and stress [46]. Complex biological systems are susceptible to magnetic forces that act in paramagnetic molecules, electric changes, and radical pairs [14]. The increase in biomass carbohydrates has been reported for other microalgae by Deamici et al. [53] for Chlorella fusca with an increase of 31% when compared to the control in cultivation under 30 mT SMF for 1 h d−1. Similar behavior was found by Menestrino et al. [54] for Chlorella minutissima cultivation under 30 mT 24 h d−1 continuous SMF, with a twofold increase in carbohydrate content when compared to CT.
Comparing intracellular and extracellular carbohydrate pools across treatments suggests that SMF duration influences how carbon is partitioned between the two. M1 (intermittent SMF) combined the lowest biomass carbohydrate content (40.1%) with the highest RPS concentration (0.66 g L−1), whereas M24 (continuous SMF) showed the inverse profile, the highest biomass carbohydrate content (52.4%) alongside an RPS concentration close to CT. This is consistent with intermittent SMF favoring carbon release into the medium, while continuous exposure favors intracellular carbohydrate accumulation instead. This inverse relationship, however, was specific to the SMF-only treatments and did not extend to MN, which combined a high biomass carbohydrate content with a high RPS concentration, suggesting that the addition of nanofibers alters this partitioning independently of the SMF duration effect described above.
As with carbohydrates, lipid metabolism draws on the same carbon fixation pathway and is typically favored under nitrogen limitation or stress, serving as energy storage and structural material. Lipids are formed through the enzymatic transformation of triose phosphate from the CBB cycle, which is synthesized into fatty acids and then assembled into triacylglycerols by the Kennedy pathway. The lipid content in Porphyridium sp. is 9–14% dw−1 and characterized by a high ratio of PUFAs up to 33% when under stress, which is seen as a high-value product [48]. In the present study, the biomass lipid ratio got an increase of 38% for MN and 34% for M1 biomass when compared to the CT.
The lowest protein ratio was observed in the MN treatment (23.8%), suggesting a faster diversion of metabolic flux toward lipid and carbohydrate production, a behavior commonly associated with nitrogen depletion, compared with CT and MNE (both approximately 37%). Protein content is directly related to nitrogen intake (nitrate or ammonia) and carbon availability, since nitrogen forms part of the amino acid backbone. In Porphyridium, proteins are found mostly as enzymes and phycobiliproteins, the latter being structural components of the photosynthetic light-harvesting system, represented by phycoerythrin, phycocyanin, and allophycocyanin [46].
The production of B-PE is related to many factors, such as temperature, light color, and intensity [55,56], phosphorus, nitrogen, and mineral content [49,57]. Although B-PE is a phycobiliprotein and therefore part of the protein pool, total protein content in the nanofiber treatments (N, NE) was actually lower than in CT (Table 2), indicating that the increase in B-PE reflects a shift in protein allocation toward phycobiliprotein synthesis specifically, rather than a general increase in nitrogen assimilation or total protein content. This is consistent with the fact that phycobiliproteins represent only a small fraction of total cellular protein. Since this pigment is a phycobiliprotein, it is directly linked to the synthesis of proteins; the nitrogen metabolic pathway seems to be prioritized when nanofibers are added to P. purpureum cultivation. The use of nanofiber to increase protein content in Chlorella fusca biomass is reported by Comitre et al. [43], and for Spirulina sp. LEB 18 by Cardias et al. [21]. These authors link protein increase to the influence of nanofibers on the C/N ratio, which can act directly in their synthesis; similar behavior was seen in our study for P. purpureum.
The mechanistic basis for the nanofiber effects differs from that of SMF, acting primarily through enhanced carbon availability rather than direct molecular interaction with cellular components. PAN nanofibers increase local CO2 retention at the cell-medium interface through physical adsorption, while MEA functionalization adds a chemisorption route via carbamate formation, together increasing the pool of dissolved inorganic carbon accessible to the cells [21]. The extra carbon appears to favor glycolytic flux and amino acid precursor supply (Ala, Leu, and Val) for phycoerythrin biosynthesis in P. purpureum cultivation. Even though the total protein of the biomass does not reflect the results of B-PE, phycobiliproteins are just a small part of the total protein content [55].
At the same time, the physical presence of the nanofiber matrix promotes cell attachment and aggregation at the fiber surface, which may reduce the effective cell-medium contact area available for nutrient exchange, offering a plausible explanation for the concurrent reduction in biomass accumulation observed in the MEA nanofibers treatments. This trade-off between enhanced carbon capture for pigment biosynthesis and reduced nutrient exchange for biomass growth illustrates how the same physical structure can exert opposing effects on distinct metabolic outputs.
The B-PE increase in biomass is a positive effect since this compound has high value due to its color, fluorescence, antioxidant, and anti-inflammatory properties, with potential use in food, biomedical research, nutraceuticals, and pharmaceuticals [51]. Although this increase in B-PE content coincided with lower biomass accumulation, a profile generally associated with low-growth physiological states, volumetric B-PE productivity remained higher than the control in all pigment-enhancing treatments (Section 3.1), indicating that the reduction in biomass did not translate into a net loss of pigment output. Strategies to increase phycoerythrin in Porphyridium biomass are high nitrate concentration [56], light control (wavelength/intensity), minerals, phosphate deficiency [52,55], and peptides [52]. Yi et al. [49] reported ~44 mg gdw−1 of B-PE in P. purpureum biomass on the 16th day of cultivation with calcium gluconate (3 g L−1), but with a decrease in biomass production (~2.7 g L−1) when compared to the control. Similarly, Gargouch et al. [55] reported low biomass productivity but a higher concentration of B-PE (~41 mg gdw−1) in P. purpureum cultivated with higher nitrates, minerals, lower light intensities, and phosphorus deficiency. The same pattern was observed in the NE treatment, where higher B-PE concentration coincided with reduced biomass production relative to CT.
The increase in carotenoid content across all treatments suggests a conserved metabolic response to oxidative stress induction, most pronounced in the NE treatment. Carotenoids in P. purpureum are primarily zeaxanthin and β-carotene [57]. These pigments play a crucial role in protection against solar radiation and oxidative stress. They are natural antioxidants and colorants, which make them a valuable compound for the cosmetic, food, and pharmaceutical industries [51].
In the present study, cultures were subjected to high light intensity (200 μmol photons·m−2·s−1) and moderate temperatures (21 °C). Under these conditions, Guihéneuf and Stenge [58] reported the decrease in pigments, in agreement with our control. The authors linked this behavior to the thylakoid membrane area shrinkage, minimizing pigment content in the biomass. They also reported the opposite: low-temperature (10 °C) and low-intensity-light (30 μmol photons·m−2·s−1) systems shift the metabolic pathway to increase the production of pigments over primary biomass accumulation. These results suggest that the stress caused by nanofibers with/without MEA may have a similar effect to low light and low-temperature strategies, increasing photosynthetic unit size, thus boosting pigment concentration in the biomass of P. purpureum.
Taken together, the results indicate that SMF and nanofiber treatments do not act as uniform “enhancers” of P. purpureum metabolism, but instead redirect carbon and nitrogen flux toward specific outputs, often at the expense of others. Three trade-offs illustrate this pattern. First, M1 achieved the highest biomass production (Xmax) but did not improve B-PE content relative to CT, indicating that the conditions favoring rapid biomass accumulation did not simultaneously favor phycobiliprotein synthesis. Second, NE showed the opposite profile: the highest B-PE content of all treatments, but with reduced biomass accumulation, consistent with the general association between phycoerythrin enrichment and lower growth performance already reported for P. purpureum under nutrient-limiting conditions [58]. It is worth noting, however, that this reduction in biomass did not offset the pigment gain in volumetric terms, as B-PE productivity in NE still exceeded that of CT once corrected for biomass output (Section 3.1). Third, M24 combined the highest carbohydrate content with the lowest protein content, pointing to a metabolic shift away from nitrogen-dependent biosynthesis and toward carbon storage under prolonged SMF exposure. A similar partitioning logic was observed for the extracellular versus intracellular carbohydrate pools, where the highest RPS release (M1) coincided with the lowest intracellular carbohydrate content, and the reverse was true for M24, suggesting that the same carbon pool can be preferentially allocated to either storage or release depending on SMF duration.
These trade-offs suggest that SMF and nanofiber exposure act as selective metabolic switches rather than general growth promoters, with the specific outcome (biomass, pigment, carbohydrate, or EPS accumulation) depending on the type, intensity, and duration of the stimulus applied. From an applied perspective, this indicates that no single treatment condition tested here maximizes all valuable outputs simultaneously; rather, treatment selection should be guided by the target product, intermittent SMF (M1) for biomass-driven applications, MEA-functionalized nanofibers (NE) for B-PE-enriched biomass, and continuous SMF (M24) for carbohydrate-rich biomass or RPS-lean conditions. This treatment-specific tunability, rather than a single optimal condition, represents the central practical outcome of the present study.

4.3. EPS Characterization

The predominance of neutral sugars in the EPS, already noted in Section 3.3, is consistent with the established monosaccharide profile of P. purpureum EPS [29]. Acidic sugars (uronic acids) are present as D-glucuronic and galacturonic acids. The primary metabolic pathway for uronic acid and its derivatives formation is the enzymatic oxidation of the C-6 hydroxyl group, resulting in a carboxylic acid group (-COOH) linked to the former C-6 position. This is usually triggered by stress, such as osmotic, nutritional uptake, carbon availability, and heavy metals, as a response to fix redox equilibrium, the balance between neutral and acidic sugars, to increase water retention (viscosity), and gene regulation in response to stress [8,41]. This response was most evident in M24 and the MEA-functionalized nanofiber treatments, peaking in the combined MNE treatment, suggesting a synergistic effect between SMF and MEA-nanofiber stress on uronic acid production.
Uronic acid and sulphated groups are indicative of EPS reactivity: at the mechanical, chemical, and biological levels [8]. The distribution of uronic acids and sulphate groups in the EPS structure increases the overall anionic character, which controls its rheological behavior, chemical reactivity, and diverse bioactivities such as metal binding, antioxidant, and antiviral properties [8,59,60]. Uronic acid in Porphyridium EPS is usually found as D-glucuronic or galacturonic acid and its acetylated/methylated form [61], while sulphation arises from SO42− groups covalently attached to sugar residues [62].
SMF exposure for 24 h seems to have promoted sulphation of RPS as a stress response, via the secondary sulphate assimilation pathway, in which increased ATP sulfurylase and APS kinase activity generate the intermediary required for carbohydrate sulfotransferase to attach sulphate groups to the hydroxyl residues of the EPS backbone, typically glucose O-6 and galactose O-6/O-3 in Porphyridium [62,63,64]. Whereas for BPS, the SMF treatments instead showed a stronger effect on the acid sugar fraction, with most SMF assays increasing uronic acid synthesis relative to CT, indicating that SMF stress stimulates this metabolic pathway as well. The ratio and concentration of sulphated EPS are highly susceptible to environmental changes, such as nutrient limitation [8] oxidative stress [65], and osmotic stress [66]. Since SMF can act through magnetic induction via the Hall effect, interfering with ions and charge distribution within molecules, it may directly influence the electronegativity of these sulphate groups [14].
Porphyridium EPS has documented bioactivity, including antiviral activity against enveloped viruses (HSV-1, HSV-2, and VZV) through receptor mimicry and blocking viral entry [59], antioxidant activity via radical scavenging [67] and immunomodulatory effects through cytokine release stimulation [67,68]. The bioactivity correlates especially with sulphate content and molecular weight, with properties already evident above 10% sulphate content and enhanced in lower molecular weight polymers due to improved bioavailability [68,69]. Beyond its bioactivity, sulphates and acid groups grant singular rheological characteristics to the EPS. Arad and Levy-Ontman [70] reports the rheological behavior of Porphyridium EPS, particularly its potential as a thickening agent, biolubricant, and weak gel formation. They associate these potentials in Porphyridium EPS with its high intrinsic viscosity, low friction coefficients, wear protection, and structural stability across a broad range of shear velocities. These unique physical-chemical attributes demonstrate the potential of the Porphyridium EPS produced in our study to be used as a candidate for specialized applications in the pharmaceutical, food, mechanical, and biochemical industries.
The higher xylose and galactose ratios observed in BPS relative to RPS (Section 3.3) could shift its functional properties, since xylose tends to introduce branching and additional substituents (sulphates, methyl, acetyl groups) to the polymer backbone, affecting rheological behavior such as gel formation through increased electronegative character [62]. Despite these compositional differences between fractions, the treatments did not significantly alter the monosaccharide backbone composition, indicating that RPS and BPS differences are intrinsic to the polymer’s biosynthetic origin rather than treatment-dependent. Discrepancies between colorimetric and chromatographic quantification of uronic acids may result from monosaccharide modifications (methoxylation, acetylation, sulfation) not detected by chromatographic standards, as previously reported for P. purpureum EPS [9,41].

5. Conclusions

This study demonstrates that static magnetic fields (SMF) and polymeric nanofibers modulate Porphyridium purpureum physiology in distinct and complementary ways. Intermittent SMF application (M1) significantly enhanced growth performance, yielding the highest maximal biomass (5.59 g L−1), a 36% increase relative to the control, whereas prolonged exposure or combination with MEA nanofibers reduced biomass accumulation. SMF exposure also influenced carbon allocation in a treatment-dependent manner: intermittent SMF (M1 and MN) favored the release of extracellular polysaccharides (RPS) and increased the lipid fraction, whereas continuous exposure (M24) instead favored intracellular carbohydrate storage, indicating that carbon partitioning under SMF depends on the duration of exposure rather than on SMF application alone. In contrast, nanofiber-based systems markedly enhanced pigment biosynthesis, particularly β-phycoerythrin, with the MEA-functionalized nanofiber treatment alone (NE) reaching a 196% increase in B-PE content compared to the control. Although this was accompanied by lower biomass accumulation, volumetric B-PE productivity, when corrected for biomass output, still exceeded the control in all pigment-enhancing treatments, indicating a genuine net gain in pigment production rather than a simple biomass-productivity trade-off. Regarding extracellular polysaccharides, nanofiber-containing treatments improved RPS purity and promoted higher uronic acid content, especially in the combined static magnetic field and MEA-nanofiber condition (MNE), while extended SMF exposure (M24) favored RPS sulfation, suggesting stress-mediated regulation of polysaccharide functionalization. Bound polysaccharides (BPS) generally showed a higher sulphation ratio than released polysaccharides (RPS). The monosaccharide profile indicates that the treatments did not alter the major EPS composition, suggesting that RPS and BPS differences are intrinsic to the polymer’s biosynthetic origin rather than treatment-dependent. Collectively, these results indicate that SMF and nanofiber treatments act as selective, tunable stimuli rather than uniform growth enhancers, with SMF duration governing the balance between biomass accumulation and carbon release or storage, and nanofiber functionalization governing the balance between biomass growth and pigment accumulation, highlighting their combined potential to tailor biomass composition and high-value metabolite production in P. purpureum cultivation.

Supplementary Materials

The following supporting information can be downloaded at: https://www.mdpi.com/article/10.3390/app16147311/s1, Figure S1: HPAEC-PAD chromatograms of standards (A) and one sample (RPS CT, B).

Author Contributions

M.P.d.C.: investigation, writing—original draft, formal analysis, conceptualization. M.G.d.M.: conceptualization, methodology. C.G.: investigation, data curation. L.O.d.S.: conceptualization, methodology. J.A.V.C.: funding acquisition, project administration, supervision, resources, writing—review & editing. C.L.: conceptualization, funding acquisition, project administration, supervision, resources, writing—review & editing. All authors have read and agreed to the published version of the manuscript.

Funding

This study was financed in part by the Coordenação de Aperfeiçoamento de Pessoal de Nível Superior—Brasil (CAPES)—Finance Code 001. This research was funded by the Program CAPES-COFECUB (Sv 945/19).

Institutional Review Board Statement

Not applicable.

Informed Consent Statement

Not applicable.

Data Availability Statement

Data will be made available on request.

Conflicts of Interest

The authors declare no conflict of interest.

References

  1. Hoque, M.M.; Iannelli, V.; Padula, F.; Radice, R.P.; Saha, B.K.; Martelli, G.; Scopa, A.; Drosos, M. Microalgae: Green Engines for Achieving Carbon Sequestration, Circular Economy, and Environmental Sustainability—A Review Based on Last Ten Years of Research. Bioengineering 2025, 12, 909. [Google Scholar] [CrossRef] [PubMed]
  2. Dao, O.; Bertrand, M.; Alseekh, S.; Veillet, F.; Auroy, P.; Nguyen, P.-C.; Légeret, B.; Epting, V.; Morin, A.; Cuiné, S.; et al. The green algae CO2 concentrating mechanism and photorespiration jointly operate during acclimation to low CO2. Nat. Commun. 2025, 16, 5296. [Google Scholar] [CrossRef] [PubMed]
  3. Xu, P.; Li, J.; Qian, J.; Wang, B.; Liu, J.; Xu, R.; Chen, P.; Zhou, W. Recent advances in CO2 fixation by microalgae and its potential contribution to carbon neutrality. Chemosphere 2023, 319, 137987. [Google Scholar] [CrossRef] [PubMed]
  4. Ang, W.S.; Kee, P.E.; Lan, J.C.-W.; Chen, W.-H.; Chang, J.-S.; Khoo, K.S. Unveiling the rise of microalgae-based foods in the global market: Perspective views and way forward. Food Biosci. 2025, 66, 105390. [Google Scholar] [CrossRef]
  5. Liu, L.; Diao, J.; Bi, Y.; Zeng, L.; Wang, F.; Chen, L.; Zhang, W. Rewiring the Metabolic Network to Increase Docosahexaenoic Acid Productivity in Crypthecodinium cohnii by Fermentation Supernatant-Based Adaptive Laboratory Evolution. Front Microbiol. 2022, 13, 824189. [Google Scholar] [CrossRef] [PubMed]
  6. Navalho, S.; Ferrer-Ledo, N.; Barbosa, M.J.; Varela, J. Nannochloropsis Lipids and Polyunsaturated Fatty Acids: Potential Applications and Strain Improvement. Mar. Drugs 2025, 23, 128. [Google Scholar] [CrossRef] [PubMed]
  7. Nur, S.; Oslan, H.; Shoparwe, N.F.; Yusoff, A.H.; Rahim, A.A.; Chang, C.S.; Tan, J.S.; Oslan, S.N.; Arumugam, K.; Ariff, A.B.; et al. A Review on Haematococcus pluvialis Bioprocess Optimization of Green and Red Stage Culture Conditions for the Production of Natural Astaxanthin. Biomolecules 2021, 11, 256. [Google Scholar] [CrossRef] [PubMed]
  8. Laroche, C. Exopolysaccharides from Microalgae and Cyanobacteria: Diversity of Strains, Production Strategies, and Applications. Mar. Drugs 2022, 20, 336. [Google Scholar] [CrossRef] [PubMed]
  9. Medina-Cabrera, E.V.; Rühmann, B.; Schmid, J.; Sieber, V. Characterization and comparison of Porphyridium sordidum and Porphyridium purpureum concerning growth characteristics and polysaccharide production. Algal Res. 2020, 49, 101931. [Google Scholar] [CrossRef]
  10. Wang, W.N.; Li, Y.; Zhang, Y.; Xiang, W.Z.; Li, A.F.; Li, T. Comparison on characterization and antioxidant activity of exopolysaccharides from two Porphyridium strains. J. Appl. Phycol. 2021, 33, 2983–2994. [Google Scholar] [CrossRef]
  11. Maizatul, A.Y.; Radin, M.S.R.; Mohamed, A.A.; Ambati, R.A.; Ranga, R. Influence of nitrogen and phosphorus on microalgal growth, biomass, lipid, and fatty acid production: An overview. Cells 2021, 10, 393. [Google Scholar] [CrossRef]
  12. Deamici, K.M.; Dziergowska, K.; Silva, P.G.P.; Michalak, I.; Santos, L.O.; Detyna, J.; Kataria, S.; Brestic, M.; Sarraf, M.; Islam, M. Microalgae Cultivated under Magnetic Field Action: Insights of an Environmentally Sustainable Approach. Sustainability 2022, 14, 13291. [Google Scholar] [CrossRef]
  13. Deamici, K.M.; Cuellar-Bermudez, S.P.; Muylaert, K.; Santos, L.O.; Costa, J.A.V. Quantum yield alterations due to the static magnetic fields action on Arthrospira platensis SAG 21.99: Evaluation of photosystem activity. Bioresour. Technol. 2019, 292, 121945. [Google Scholar] [CrossRef] [PubMed]
  14. Font, Y.S.; Díaz, Y.O.; Cuypers, A.; Alemán, E.I.; Vandamme, D. The effect of magnetic field treatment on the cultivation of microalgae: An overview of involved mechanisms. J. Appl. Phycol. 2023, 35, 1525–1536. [Google Scholar] [CrossRef]
  15. Santos, L.O.; Silva, P.G.P.; Machado, B.R.; Sala, L.; Deamici, K.M. Update on the application of magnetic fields to microalgal cultures. World J. Microbiol. Biotechnol. 2022, 38, 211. [Google Scholar] [CrossRef] [PubMed]
  16. Daneshvar, E.; Wicker, R.J.; Show, P.-L.; Bhatnagar, A. Biologically-mediated carbon capture and utilization by microalgae towards sustainable CO2 biofixation and biomass valorization—A review. Chem. Eng. J. 2022, 427, 130884. [Google Scholar] [CrossRef]
  17. Rosa, G.M.; Moraes, L.; de Souza, M.R.A.Z.; Costa, J.A.V. Spirulina cultivation with a CO2 absorbent: Influence on growth parameters and macromolecule production. Bioresour. Technol. 2016, 200, 528–534. [Google Scholar] [CrossRef] [PubMed]
  18. da Rosa, G.M.; de Morais, M.G.; Costa, J.A.V. Green alga cultivation with monoethanolamine: Evaluation of CO2 fixation and macromolecule production. Bioresour. Technol. 2018, 261, 206–212. [Google Scholar] [CrossRef] [PubMed]
  19. Vaz, B.d.S.; Costa, J.A.V.; de Morais, M.G. Innovative nanofiber technology to improve carbon dioxide biofixation in microalgae cultivation. Bioresour. Technol. 2019, 273, 592–598. [Google Scholar] [CrossRef] [PubMed]
  20. Vaz, B.d.S.; Costa, A.V.; de Morais, M.G. Physical and biological fixation of CO2 with polymeric nanofibers in outdoor culti-vations of Chlorella fusca LEB 111. Int. J. Biol. Macromol. 2020, 151, 1332–1339. [Google Scholar] [CrossRef] [PubMed]
  21. Cardias, B.B.; de Morais, M.G.; Costa, J.A.V. Increased biomass and biomolecule productivity of Spirulina sp. LEB 18 cultivated with CO2 adsorbent nanofibers. Clean. Technol. Environ. Policy 2025, 27, 5843–5853. [Google Scholar] [CrossRef]
  22. Yao, D.; Wu, L.; Tan, D.; Yu, Y.; Jiang, Q.; Wu, Y.; Wang, H.; Liu, Y. Enhancing CO2 fixation by microalgae in a Photobioreactor: Molecular mechanisms with exogenous carbonic anhydrase. Bioresour. Technol. 2024, 408, 131176. [Google Scholar] [CrossRef] [PubMed]
  23. Soanen, N.; Da Silva, E.; Gardarin, C.; Michaud, P.; Laroche, C. Improvement of exopolysaccharide production by Porphyridium marinum. Bioresour. Technol. 2016, 213, 231–238. [Google Scholar] [CrossRef] [PubMed]
  24. de Carvalho, M.P.; de Morais, M.G.; dos Santos, L.O.; Laroche, C.; Costa, J.A.V. Production of biomass and biomolecules in Limnospira indica PCC 8005 cultivation under magnetic fields and polymeric nanofibers. J. Biotechnol. 2025, 405, 48–56. [Google Scholar] [CrossRef] [PubMed]
  25. Deamici, K.M.; Morais, M.G.d.; dos Santos, L.O.; Gros, F.; Costa, J.A.V.; Laroche, C. Magnetic Field Action on Limnospira indica PCC8005 Cultures: Enhancement of Biomass Yield and Protein Content. Appl. Sci. 2022, 12, 1533. [Google Scholar] [CrossRef]
  26. Filali Mouhim, R.; Cornet, J.F.; Fontane, T.; Fournet, B.; Dubertret, G. Production, isolation and preliminary characterization of the exopolysaccharide of the cyanobacterium Spirulina platensis. Biotechnol. Lett. 1993, 15, 567–572. [Google Scholar] [CrossRef]
  27. Phélippé, M.; Gonçalves, O.; Thouand, G.; Cogne, G.; Laroche, C. Characterization of the polysaccharides chemical diversity of the cyanobacteria Arthrospira platensis. Algal Res. 2019, 38, 101426. [Google Scholar] [CrossRef]
  28. DuBois, M.; Gilles, K.A.; Hamilton, J.K.; Rebers, P.A.; Smith, F. Colorimetric Method for Determination of Sugars and Related Substances. Anal. Chem. 1956, 28, 350–356. [Google Scholar] [CrossRef]
  29. Borjas Esqueda, A.; Gardarin, C.; Laroche, C. Exploring the Diversity of Red Microalgae for Exopolysaccharide Production. Mar. Drugs 2022, 20, 246. [Google Scholar] [CrossRef] [PubMed]
  30. Safi, C.; Zebib, B.; Merah, O.; Pontalier, P.Y.; Vaca-Garcia, C. Morphology, composition, production, processing and applications of Chlorella vulgaris: A review. Renew. Sustain. Energy Rev. 2014, 35, 265–278. [Google Scholar] [CrossRef]
  31. Lowry, O.H.; Rosebrough, N.J.; Farr, A.L.; Randall, R.J. PProtein measurement with the Folin phenol reagent. J. Biol. Chem. 1951, 193, 265–275. [Google Scholar] [CrossRef]
  32. Marsh, J.B.; Weinstein, D.B. Simple charring method for determination of lipids. J. Lipid Res. 1966, 7, 574–576. [Google Scholar] [CrossRef]
  33. Bermejo Román, R.; Alvárez-Pez, J.M.; Acién Fernández, F.G.; Molina Grima, E. Recovery of pure B-phycoerythrin from the microalga Porphyridium cruentum. J. Biotechnol. 2002, 93, 73–85. [Google Scholar] [CrossRef] [PubMed]
  34. Lichtenthaler, H.K. Chlorophylls and carotenoids: Pigments of photosynthetic biomembranes. Methods Enzymol. 1987, 148, 350–382. [Google Scholar] [CrossRef]
  35. Monsigny, M.; Petit, C.; Roche, A.-C. Colorimetric determination of neutral sugars by a resorcinol sulfuric acid micromethod. Anal. Biochem. 1988, 175, 525–530. [Google Scholar] [CrossRef] [PubMed]
  36. Montreuil, J.; Spik, G.; Chosson, A.; Segard, E.; Scheppler, N. Methods of study of the structure of glycoproteins. J. Pharm. Belg. 1963, 18, 529–546. [Google Scholar] [PubMed]
  37. Blumenkrantz, N.; Asboe-Hansen, G. New method for quantitative determination of uronic acids. Anal. Biochem. 1973, 54, 484–489. [Google Scholar] [CrossRef] [PubMed]
  38. Dogson, K.; Price, R. A note on the determination of the ester sulphate content of sulphated polysaccharides. Biochem. J. 1962, 84, 106–110. [Google Scholar] [CrossRef] [PubMed]
  39. Ma, J.; You, X.; Sun, S.; Wang, X.; Qin, S.; Sui, S.-F. Structural basis of energy transfer in Porphyridium purpureum phycobilisome. Nature 2020, 579, 146–151. [Google Scholar] [CrossRef] [PubMed]
  40. Marcati, A.; Ursu, A.V.; Laroche, C.; Soanen, N.; Marchal, L.; Jubeau, S.; Djelveh, G.; Michaud, P. Extraction and fractionation of polysaccharides and B-phycoerythrin from the microalga Porphyridium cruentum by membrane technology. Algal Res. 2014, 5, 258–263. [Google Scholar] [CrossRef]
  41. Guerreiro, M.; Emmanuel, C.; Dupuits, C.; Gardarin, C.; Mouzeyar, S.; Varela, J.; Roche, J.; Laroche, C. Transcriptomic Insights into Metabolic Reprogramming and Exopolysaccharide Synthesis in Porphyridium purpureum Under Gradual Nitrogen Deprivation. Mar. Drugs 2026, 24, 40. [Google Scholar] [CrossRef] [PubMed]
  42. Pazur, A.; Winklhofer, M. Magnetic effect on CO2 solubility in seawater: A possible link between geomagnetic field variations and climate. Geophys. Res. Lett. 2008, 35, L16710. [Google Scholar] [CrossRef]
  43. Comitre, A.A.; Vaz, B.d.S.; Costa, J.A.V.; Morais, M.G. Renewal of nanofibers in Chlorella fusca microalgae cultivation to increase CO2 fixation. Bioresour. Technol. 2021, 321, 124452. [Google Scholar] [CrossRef] [PubMed]
  44. Blankenship, R.E. Molecular Mechanisms of Photosynthesis, 3rd ed.; Wiley & Sons: Hoboken, NJ, USA, 2021. [Google Scholar]
  45. Serrano, G.; Miranda-Ostojic, C.; Ferrada, P.; Wulff-Zotelle, C.; Maureira, A.; Fuentealba, E.; Gallardo, K.; Zapata, M.; Rivas, M. Response to static magnetic field-induced stress in Scenedesmus obliquus and Nannochloropsis gaditana. Mar. Drugs 2021, 19, 527. [Google Scholar] [CrossRef] [PubMed]
  46. Müller, P.; Ahmad, M. Light-activated cryptochrome reacts with molecular oxygen to form a flavin-superoxide radical pair consistent with magnetoreception. J. Biol. Chem. 2011, 286, 21033–21040. [Google Scholar] [CrossRef] [PubMed]
  47. Evans, E.W.; Dodson, C.A.; Maeda, K.; Biskup, T.; Wedge, C.J.; Timme, C.R. Magnetic field effects in flavoproteins and related systems. Interface Focus 2013, 3, 20130037. [Google Scholar] [CrossRef] [PubMed]
  48. Yoon, S.; Chang, S.C.; Payne, G.F.; Lee, S.; Kyhm, K.; Park, S.G.; Kang, M. Effect of a magnetic field on the activity of superoxide dismutase studied at the enzyme level. RSC Adv. 2026, 16, 25395–25401. [Google Scholar] [CrossRef] [PubMed]
  49. Gartzke, J.; Lange, K. Cellular target of weak magnetic fields: Ionic conduction along actin filaments of microvilli. Am. J. Physiol. Physiol. 2002, 283, C1333–C1346. [Google Scholar] [CrossRef] [PubMed]
  50. Chen, D.; Qian, J.; Huo, S.; Wang, F.; Ma, H.; Liu, S. Proteomic Analysis of Listeria monocytogenes Subjected to Pulsed Magnetic Field. Foods 2025, 14, 1871. [Google Scholar] [CrossRef] [PubMed]
  51. Nguyen, A.Q.; Mohammadi, M.; Alian, M.; Muralitharan, G.; Chauhan, V.S.; Balan, V. Exploring the versatility of Porphyridium sp.: A comprehensive review of cultivation, bio-product extraction, purification, and characterization techniques. Biotechnol. Adv. 2024, 77, 108471. [Google Scholar] [CrossRef] [PubMed]
  52. Yi, S.; Zhang, A.H.; Huang, J.; Yao, T.; Feng, B.; Zhou, X.; Hu, Y.; Pan, M. Maximizing Polysaccharides and Phycoerythrin in Porphyridium purpureum via the Addition of Exogenous Compounds: A Response-Surface-Methodology Approach. Mar. Drugs 2024, 22, 138. [Google Scholar] [CrossRef] [PubMed]
  53. Deamici, K.M.; Santos, L.O.; Costa, J.A.V. Use of static magnetic fields to increase CO2 biofixation by the microalga Chlorella fusca. Bioresour. Technol. 2019, 276, 103–109. [Google Scholar] [CrossRef] [PubMed]
  54. Menestrino, B.d.C.; Pintos, T.H.C.; Sala, L.; Costa, J.A.V.; Santos, L.O. Application of Static Magnetic Fields on the Mixotrophic Culture of Chlorella minutissima for Carbohydrate Production. Appl. Biochem. Biotechnol. 2020, 192, 822–830. [Google Scholar] [CrossRef] [PubMed]
  55. Gargouch, N.; Karkouch, I.; Elleuch, J.; Elkahoui, S.; Michaud, P.; Abdelkafi, S.; Laroche, C.; Fendri, I. Enhanced B-phycoerythrin production by the red microalga Porphyridium marinum: A powerful agent in industrial applications. Int. J. Biol. Macromol. 2018, 120, 2106–2114. [Google Scholar] [CrossRef] [PubMed]
  56. Zhang, A.H.; Feng, B.; Zhang, H.; Jiang, J.; Zhang, D.; Du, Y.; Cheng, Z.; Huang, J. Efficient cultivation of Porphyridium purpureum integrated with swine wastewater treatment to produce phycoerythrin and polysaccharide. J. Appl. Phycol. 2022, 34, 2315–2326. [Google Scholar] [CrossRef]
  57. Schubert, N.; García-Mendoza, E.; Pacheco-Ruiz, I. Carotenoid composition of marine red algae. J. Phycol. 2006, 42, 1208–1216. [Google Scholar] [CrossRef]
  58. Guihéneuf, F.; Stengel, D.B. Towards the biorefinery concept: Interaction of light, temperature and nitrogen for optimizing the co-production of high-value compounds in Porphyridium purpureum. Algal Res. 2015, 10, 152–163. [Google Scholar] [CrossRef]
  59. Bello-Morales, R.; Andreu, S.; Ruiz-Carpio, V.; Ripa, I.; López-Guerrero, J.A. Extracellular Polymeric Substances: Still Promising Antivirals. Viruses 2022, 14, 1337. [Google Scholar] [CrossRef] [PubMed]
  60. Xie, L.; Shen, M.; Wang, Z.; Xie, J. Structure, function and food applications of carboxymethylated polysaccharides: A comprehensive review. Trends Food Sci. Technol. 2021, 118, 539–557. [Google Scholar] [CrossRef]
  61. Gargouch, N.; Elleuch, F.; Karkouch, I.; Tabbene, O.; Pichon, C.; Gardarin, C.; Rihouey, C.; Picton, L.; Abdelkafi, S.; Fendri, I.; et al. Potential of exopolysaccharide from Porphyridium marinum to contend with bacterial proliferation, biofilm formation, and breast cancer. Mar. Drugs 2021, 19, 66. [Google Scholar] [CrossRef] [PubMed]
  62. Usov, A.I.; Zelinsky, N.D. Chemical structures of algal polysaccharides. In Funct Ingredients from Algae Foods Nutraceuticals; Elsevier: Amsterdam, The Netherlands, 2013; pp. 23–86. [Google Scholar] [CrossRef]
  63. Prioretti, L.; Gontero, B.; Hell, R.; Giordano, M. Diversity and regulation of ATP sulfurylase in photosynthetic organisms. Front. Plant Sci. 2014, 5, 597. [Google Scholar] [CrossRef] [PubMed]
  64. Wójcik-Augustyn, A.; Johansson, A.J.; Borowski, T. Mechanism of Sulfate Activation Catalyzed by ATP Sulfurylase—Magnesium Inhibits the Activity. Comput. Struct. Biotechnol. J. 2019, 17, 770–784. [Google Scholar] [CrossRef] [PubMed]
  65. de Bont, L.; Donnay, N.; Couturier, J.; Rouhier, N. Redox regulation of enzymes involved in sulfate assimilation and in the synthesis of sulfur-containing amino acids and glutathione in plants. Front. Plant Sci. 2022, 13, 958490. [Google Scholar] [CrossRef] [PubMed]
  66. Decamp, A.; Martineau, E.; Grizeau, D.; Pruvost, J.; Gonçalves, O. Effects of the salinity on the biosynthesis of the polysaccharides of the marine microalgae Porphyridium cruentum. Algal Res. 2023, 71, 103089. [Google Scholar] [CrossRef]
  67. Casas-Arrojo, V.; Decara, J.; Arrojo-Agudo, M.d.l.Á.; Pérez-Manríquez, C.; Abdala-Díaz, R.T. Immunomodulatory, antioxidant activity and cytotoxic effect of sulfated polysaccharides from Porphyridium cruentum. (s.f.gray) nägeli. Biomolecules 2021, 11, 488. [Google Scholar] [CrossRef] [PubMed]
  68. Han, S.I.; Heo, Y.M.; Jeon, M.S.; Kyung, S.; Kang, S.; Kwon, S.J.; Ryu, J.H.; Kim, J.H.; Ahn, J.W. The effect of exopolysaccharides from EMS-induced Porphyridium cruentum mutant on human epidermal and dermal layers. Front. Mar. Sci. 2024, 11, 1365311. [Google Scholar] [CrossRef]
  69. Sun, L.; Wang, L.; Zhou, Y. Immunomodulation and antitumor activities of different-molecular-weight polysaccharides from Porphyridium cruentum. Carbohydr. Polym. 2012, 87, 1206–1210. [Google Scholar] [CrossRef]
  70. Arad, S.; Levy-Ontman, O. Sulfated Polysaccharides in the Cell Wall of Red Microalgae. In Handbook of Biopolymer-Based Materials: From Blends and Composites to Gels and Complex Networks; Thomas, S., Durand, D., Chassenieux, C., Jyotishkumar, P., Eds.; Wiley: Hoboken, NJ, USA, 2013; pp. 351–370. [Google Scholar] [CrossRef]
Figure 1. Schematic of photobioreactor used for experiments experiments.
Applsci 16 07311 g001
Figure 2. Growth curves of Porphyridium purpureum under magnetic field, nanofibers, and control culture.
Applsci 16 07311 g002
Figure 3. Concentration of phycoerythrin (A), chlorophyll, and carotenoids (B) in produced P. purpureum biomass. CT—Control; M1—Magnetic field 1 h d−1; MN—added nanofiber magnetic field; N—Added nanofibers; MNE—Magnetic field and nanofiber produced with MEA; NE—Nanofiber addition produced with MEA; M24—Magnetic field 24 h d−1. The results are expressed as mean (n = 3) ± standard deviation. Different letters on different graphs represent a significant difference between treatments, p-values < 0.05 (Tukey’s test).
Applsci 16 07311 g003
Figure 4. Monosaccharide profile composition of RPS and BPS in % molar ratios.
Applsci 16 07311 g004
Table 1. Growth parameters and produced RPS of Porphyridium purpureum under the influence of SMF and nanofibers.
CTM1MNNMNENEM24
Xmax (g L−1)4.12 ± 0.34 b5.59 ± 0.42 a3.56 ± 0.16 bc3.64 ± 0.06 bc3.52 ± 0.02 c2.5 ±0.17 d2.27 ± 0.1 d
μmax (d−1)0.59 ± 0.040.34 ± 0.03 c0.51 ± 0.01 ab0.5 ± 0.03 b0.39 ± 0.05 c0.38 ± 0.08 c0.4 ± 0.01 c
Pmax (g L−1 d−1)0.36 ± 0.04 b0.48 ± 0.04 a0.26 ± 0.02 cd0.3 ± 0.01 bc0.27 ± 0.05 cd0.16 ± 0.01 de0.2 ± 0.01 e
Dt (d)1.19 ± 0.092.04 ± 0.19 bc1.36 ± 0.02 a1.43 ± 0.1 a2.14 ± 0.21 b1.9 ± 0.37 b2.33 ± 0.03 c
R20.970.980.980.960.980.990.98
Δt (d)1—41—81—41—41—41—41—7
RPS (g L−1)0.36 ± 0.05 c0.66 ± 0.11 a0.60 ± 0.16 ab0.28 ± 0.02 c0.40 ± 0.04 bc0.36 ± 0.02 c0.41 ± 0.02 bc
CT—Control; M1—Magnetic field 1 h d−1; MN—added nanofiber magnetic field; N—Added nanofibers; MNE—Magnetic field and nanofiber produced with MEA; NE—Nanofiber addition produced with MEA; M24—Magnetic field 24 h d−1. The results are expressed as mean (n = 3) ± standard deviation. Different letters on the same line show a significant difference between treatments p-values < 0.05 (Tukey’s test).
Table 2. Main compounds of Porphyridium purpureum biomass.
CTM1MNNMNENEM24
Protein (%)37.16 ± 0.48 a33.83 ± 0.76 b23.81 ± 0.86 e33.87 ± 0.46 b37.69 ± 0.27 a31.39 ± 0.65 c28.53 ± 0.27 d
Carbohydrates (%)43.39 ± 0.48 e40.06 ± 1.25 f49.3 ± 0.85 b47.46 ± 0.75 c41.09 ± 0.32 f45.59 ± 0.73 d52.39 ± 0.48 a
Lipids (%)19.44 ± 0.81 de26.11 ± 1.66 a26.9 ± 0.83 a18.67 ± 0.39 e21.22 ± 0.41 cd23.01 ± 0.74 bc19.08 ± 0.57 e
CT—Control; M1—Magnetic field 1 h d−1; MN—added nanofiber magnetic field; N—Added nanofibers; MNE—Magnetic field and nanofiber produced with MEA; NE—Nanofiber addition produced with MEA; M24—Magnetic field 24 h d−1. The results are expressed as mean (n = 3) ± standard deviation. Different letters on the same line show a significant difference between treatments, p-values < 0.05 (Tukey’s test).
Table 3. Biochemical composition of released/bound polysaccharides.
% Total Sugars% Protein% Sulphated Groups (Eq. SO4)% Neutral Sugars% Uronic Acid
Samples (%Mass)EPS (%Mass (g 100gEPS−1))
Released polysaccharides (RPS)
CT67.5 ± 2.71 c7.0 ± 0.83 ab13.0 ± 0.96 b75.6 ± 0.69 ab11.4 ± 0.9 c
M160.6 ± 2.16 c6.6 ± 0.85 c13.4 ± 0.01 b70.8 ± 0.97 ab15.8 ± 0.86 c
MN78.8 ± 2.29 b6.3 ± 1.76 ab11.9 ± 0.38 bc77.2 ± 2.81 a10.9 ± 0.58 d
N92.2 ± 2.91 a6.8 ± 1.22 e13.2 ± 0.65 b77.3 ± 4.35 a9.5 ± 0.99 d
MNE75.5 ± 3.47 b5.8 ± 0.98 a10.9 ± 0.78 c61.0 ± 3.01 c28.0 ± 2.39 a
NE89.6 ± 1.66 a7.4 ± 0.49 d9.3 ± 0.6 d69.7 ± 3.82 b21.1 ± 3.72 b
M2487.6 ± 4.19 a7.9 ± 0.21 bc16.9 ± 0.38 a62.1 ± 1.53 c21.1 ± 1.37 b
Bound polysaccharides (BPS)
CT47.7 ± 1.94 ab21.8 ± 0.83 ab20.5 ± 1.33 a69.4 ± 1.09 a10.0 ± 0.86 c
M140.1 ± 2.51 c19.1 ± 0.85 c19.2 ± 0.43 ab62.3 ± 0.25 a18.5 ± 1.09 a
MN51.5 ± 4.85 a21.8 ± 1.76 ab17.0 ± 3.39 abc69.6 ± 5.18 a13.4 ± 0.27 b
N52.2 ± 3.07 a11.3 ± 1.22 e15.0 ± 0.26 c70.9 ± 2.43 a14.1 ± 0.4 b
MNE48.9 ± 1.32 a23.9 ± 0.98 a19.7 ± 0.06 ab68.0 ± 1.88 a12.3 ± 0.98 b
NE41.9 ± 0.74 bc15.2 ± 0.49 d16.2 ± 1.25 bc70.4 ± 6.57 a13.5 ± 0.81 b
M2440.4 ± 1.48 c21.1 ± 0.21 bc16.8 ± 0.01 bc71.0 ± 4.94 a12.3 ± 0.56 b
CT—Control; M1—Magnetic field 1 h d−1; MN—added nanofiber magnetic field; N—Added nanofibers; MNE—Magnetic field and nanofiber produced with MEA; NE—Nanofiber produced with MEA; M24 Magnetic field 24 h d−1. The results are expressed as mean (n = 3) ± standard deviation. Different letters on the same column and EPS section show a significant difference between p-values < 0.05 (Tukey’s test).
Disclaimer/Publisher’s Note: The statements, opinions and data contained in all publications are solely those of the individual author(s) and contributor(s) and not of MDPI and/or the editor(s). MDPI and/or the editor(s) disclaim responsibility for any injury to people or property resulting from any ideas, methods, instructions or products referred to in the content.