Review

Multimodal Sensing for Live-Stand Analytics: A Design-Oriented Literature Synthesis and Reference Architecture


NOVA LINCS, Institute of Engineering (ISE), Universidade do Algarve, 8005-139 Faro, Portugal
*
Author to whom correspondence should be addressed.
These authors contributed equally to this work.
Appl. Sci. 2026, 16(14), 7286; https://doi.org/10.3390/app16147286
Submission received: 9 June 2026 / Revised: 15 July 2026 / Accepted: 17 July 2026 / Published: 21 July 2026
(This article belongs to the Special Issue Human–Machine Interaction Applications)

Abstract

Tourism, cultural events, and trade exhibitions increasingly need real-time, privacy-risk-reducing methods for quantifying visitor behavior and satisfaction at physical stands. This article addresses a fragmented evidence base by (i) presenting a focused, design-oriented literature synthesis of multimodal sensing for stand-like environments and (ii) proposing a unified, deployment-oriented reference architecture. It analyses a 60-paper design corpus (2022–2026), together with selected benchmark/context references across RGB-D, thermal cameras, LiDAR, mmWave radar, microphone arrays, and multimodal fusion, and maps the analytic corpus to event-relevant key performance indicators (KPIs). The synthesis identifies gaps in the corpus: scarce stand-specific, multimodal KPI-labeled event datasets, conceptual inconsistencies in satisfaction inference, and limited direct evidence for commercially important KPIs such as feedback, conversion, and retention. In response, the article introduces the Stand Multimodal Behavior and Satisfaction Analysis (SMBSA) architecture, a five-layer edge-AI conceptual reference architecture with hierarchical fusion and candidate analytics heads for future validation of behavior and satisfaction KPIs under GDPR-aware, privacy-by-design requirements.

1. Introduction

The digitization of tourism, cultural events, and trade exhibitions has increased the need for tools that can characterize visitor behavior and satisfaction in physical spaces. Exhibition stands, brand activations, and event booths require substantial investment, but operational ROI assessment can still depend on manual counting, post-event surveys, or staff judgment. The cited trade-show and tourism literature mainly provides booth-design, cohort-behavior, and exhibition-effect models rather than validated live-stand sensing systems [1,2,3]. Within the reviewed corpus, it was found that no validated stand deployment that combines live-stand behavior and satisfaction assessment with multimodal real-time sensing and privacy-by-design constraints.
The AI.INSIGHTS (Project scientific microsite: https://sites.google.com/view/aiinsights-scientificmicrosite, accessed on 10 July 2026) project aims to address this gap by developing an edge-AI-powered, multi-sensor platform. The platform is intended to translate privacy-risk-reducing aggregate outputs into candidate KPI estimates for future validation. When short-horizon trajectories or interaction features are needed, they should remain pseudonymized, limited to the deployment purpose, and classified under the applicable GDPR context.
For event managers, the planned analytics include temporal profiles of visitor engagement, sentiment and emotion, stand-level dwell-time distributions, conversion- and retention-relevant proxies or consented operational outcomes, spatial-temporal group-density mapping, and automated anomaly detection. These outputs are intended to inform GDPR- and EU AI Act-aware deployment choices [4,5]. INSIGHTS therefore proposes to fuse data from RGB-D, thermal, LiDAR, mmWave radar, and microphone arrays, with local processing through lightweight deep-learning models. The system is intended to capture stand activity and to help select a sensor layout for a given space and KPI set. In this paper, “insights” denotes proposed measurable constructs and operational KPI candidates, not validated stand-performance metrics.
Although AI.INSIGHTS has an applied objective, the scientific foundations required to realize such a platform are distributed across multiple, often disconnected, research communities. The target constructs for event organizers, behavior and satisfaction, are studied extensively in affective computing [6], human activity recognition [7], crowd analysis [8], and human–computer interaction [9]. In the reviewed corpus, no study jointly covers all proposed live-stand KPIs, modalities, real-time constraints, and privacy requirements in a validated stand deployment. Some business-relevant KPIs, including visitor feedback, conversion, commitment, and retention, are more often represented by proxy evidence than by direct machine-perception targets with datasets and standardized metrics.
(a) Behavior is used here as an author-adapted operational construct: the collective observable actions, shared practices, and evolving patterns of conduct exhibited by both individuals and groups within a specific environment. It includes more than isolated physical movements. This review, it represents the extent to which human activities, ranging from individual engagement to collaborative group dynamics, remain consistent with the intended use and objectives of the setting.
(b) Satisfaction is a measure used to assess the extent to which a user’s physical, cognitive, and emotional responses elicited by a system, product, or service fulfill the user’s needs and expectations. Physical responses refer to sensations of comfort or discomfort; cognitive responses include attitudes, preferences, and perceptions; and emotional responses correspond to the user’s affective states (i.e., emotions, sentiments) [10].
This paper makes two main contributions: (i) a focused, design-oriented literature synthesis of current research on multimodal sensing for behavior and satisfaction, with an explicit focus on the requirements of live-stand monitoring; and (ii) a integration of heterogeneous sensing modalities into a deployment-oriented, privacy-aware reference architecture—Stand Multimodal Behavior and Satisfaction Analysis (SMBSA). This architecture integrates design lessons from the literature for systems such as AI.INSIGHTS.
Section 2 summarizes selected behavior and satisfaction sensing literature across visual, thermal, audio, radar, and multimodal approaches, and describes representative datasets relevant to the paper’s design purpose. Section 3 consolidates the findings into a five-layer edge-AI architecture with hierarchical fusion and candidate analytics heads for behavior and satisfaction KPIs. Section 4 concludes with directions for future work.

2. Multimodal Behaviors and Satisfaction: A Review by Sensor Type

This section reviews privacy-aware multimodal sensing for live-stand and live-event analytics, with emphasis on deployment constraints such as occlusion, variable illumination, acoustic interference, high group density, and real-time operation. It first outlines the review methodology and the taxonomy used to classify the literature by sensing modality (RGB-D, thermal, LiDAR, mmWave radar, microphone arrays, and multimodal systems) and by stand-relevant KPIs. Behavioral and satisfaction-inference approaches are then reviewed by modality, with attention to the constructs each sensor can support. For cross-study comparison, the section also summarizes fusion strategies, model families, satisfaction-inference paradigms, and representative datasets before identifying the gaps that motivate the unified architecture introduced in Section 3.

2.1. Methodology

The literature corpus was compiled for a targeted, design-oriented literature synthesis using major (four) digital libraries, namely IEEE Xplore, the ACM Digital Library, Scopus, and Web of Science. The search was consolidated in April 2026 using (seven) combinations of the core expressions “multimodal human behavior”, “multimodal human satisfaction”, and terms “human behavior”, “satisfaction recognition”, “group monitoring”, “emotion recognition”, and “engagement detection” were each combined using the Boolean operator AND with (seven) sensor-related keywords, including “depth camera”, “thermal camera”, “LiDAR”, “mmWave radar”, “microphone array”, “multimodal”, and “privacy-preserving sensing”. This procedure yielded 49 query combinations (7 core & terms expressions × 7 sensor-related keywords), each of which was executed in all 4 digital libraries. These query families were used to identify recent English-language, peer-reviewed work from January 2022 to March 2026; selected earlier works were included only when they introduced benchmark datasets that remain central to the focus of the paper.
Because the broad query families returned very large result sets, this review should not be interpreted as a fully reproducible systematic review or meta-analysis. To keep screening tractable and purpose-driven, for each of the 49 queries in each of the 4 libraries, the first 20 records returned under the library’s proprietary “relevance” ranking were retained, producing an internal screening pool of 3920 candidate-record retrievals ( 49 × 20 × 4 ; 980 per library) before deduplication. The threshold of 20 was determined empirically as a tractability–coverage compromise: (i) the resulting pool was already large relative to the design purpose of the corpus; (ii) inspection of the ranked lists showed that, under relevance ordering, records beyond the first positions rapidly lost topical relevance to live-stand sensing, so a larger cutoff would primarily have added marginally relevant records rather than new design evidence; and (iii) because the same rule was applied uniformly to all queries and all libraries, no query family, sensing modality, or database was privileged over another. This first-20 rule was used as a purposive relevance-sampling cutoff rather than as a prevalence estimate, and the resulting corpus may reflect database ranking choices.
Since relevance rankings depend on proprietary algorithms and tend to favor highly cited or well-indexed work, this bias is partially aligned with the stated goal of anchoring the proposed architecture in established and validated designs; nevertheless, it remains a genuine limitation of the adopted search strategy. Accordingly, the resulting corpus is intended to support the architectural design decisions developed in Section 3, rather than to provide an exhaustive representation of the available evidence, further reinforcing the distinction between the present design-oriented synthesis and a systematic review.
After deduplication across the four libraries and across the 49 partially overlapping query families, and relevance screening, the final design-oriented corpus comprised 60 papers. The inclusion stage prioritized studies compatible with live-stand deployment constraints: non-stationary illumination, high acoustic noise, pervasive occlusion, dense group interactions, real-time latency requirements, and privacy-sensitive operation. Papers judged unlikely to directly inform the design of a real-time stand analytics system were excluded. The resulting corpus is therefore best understood as a targeted, design-oriented sample rather than an exhaustive evidence synthesis. Duplicate counts, exclusion counts by reason, and a record-level exclusion log are not reported; relevance screening was used to construct a design corpus rather than to support a reproducible systematic-review flow diagram or meta-analytic evidence synthesis.
For the above-mentioned reason, a PRISMA-style flow diagram is deliberately not provided. PRISMA is designed for prospectively logged evidence syntheses whose conclusions depend on exhaustiveness and record-level counting (e.g., prevalence of findings, effect sizes, or evidence counts), whereas the present corpus serves a different epistemic function: it provides design evidence for a reference architecture, and none of the paper’s conclusions depends on corpus completeness or on treating citation frequencies as evidence strength. Moreover, the record-level deduplication and exclusion decisions were internal working notes that were not deposited as an auditable log; reconstructing a full flow diagram retroactively would present approximate counts as if they had been prospectively recorded, giving a misleading impression of systematic rigor. Instead, the search specification reported above (query combinations, libraries, search date, filters, and the first-20 rule), together with the explicit deployment-oriented inclusion criteria, allows the essential steps of the selection procedure to be understood and repeated.
Relevance screening against qualitative design criteria is inherently judgment-based and cannot be made fully objective. Three consequences of the adopted strategy are therefore acknowledged explicitly. First, the corpus may over-represent highly cited or well-ranked work, and recent or niche contributions may have been missed. Second, absences within the corpus, such as the lack of LiDAR or mmWave radar studies targeting satisfaction measurement (Section 2.3), should be read as not having been surfaced by this sampling strategy rather than as evidence of absence in the wider literature. Third, the research gaps identified in this paper are consequently gaps within a targeted, design-oriented sample and are framed as such throughout. This residual subjectivity is considered an acceptable trade-off given the paper’s design objective, and both the procedure and its limitations are made transparent so that readers can weigh the evidence accordingly.
Selection summary. Queries: 49 combinations (7 topic × 7 sensor expressions), executed identically in 4 digital libraries, consolidated April 2026, covering January 2022–March 2026. Retention: first 20 records per query/library list, yielding 3920 candidate-record retrievals (980 per library) before deduplication. Selection: cross-query and cross-library deduplication followed by deployment-oriented relevance screening produced a final corpus of 60 papers. Inclusion logic: credible relevance to live-stand deployment under variable illumination, acoustic noise, occlusion, dense group interactions, real-time latency constraints, and privacy-sensitive operation. Intermediate duplicate and exclusion counts were not prospectively logged and are therefore not reported; see also for more details Supplementary Section S1 and Supplementary Table S1.
The 60-paper analytic corpus refers to the behavior and satisfaction sensing studies summarized in Table 1 and Supplementary Section S2, Supplementary Table S2; related surveys and dataset-context references cited narratively are not included in this count unless listed in those corpus tables. Benchmark dataset papers summarized in Supplementary Table S3 are contextual resources used to assess data availability and are not included in the 60-paper analytic corpus unless otherwise indicated.
The corpus denominator is a paper-level count. Survey, review, or architecture papers included in the corpus tables are counted as design evidence rather than as independent empirical validations. Every study was categorized according to the primary sensor type for Table 1: RGB-D (including RGB cameras, RGB-D cameras, and depth sensors), thermal cameras, LiDAR, mmWave radar, microphone arrays, or as multimodal when two or more sensors or sensor-derived analysis streams were fused. Tables that organize evidence by sensor or KPI may repeat a paper across columns when multiple modalities or constructs are relevant; those reference lists should therefore be read as citation occurrences, not as independent validation counts. Each paper was also mapped to the behavioral or satisfaction KPIs it directly addresses, or to proxy KPI evidence where the study contributes a transferable sensing primitive rather than an explicit stand-alone KPI.
Mapping was author-coded from the KPI definitions in Section 2.6. Evidence was treated as direct when a study measured the target construct or a validated operational label, and as proxy evidence when it measured a transferable cue such as dwell time, trajectory, applause, speech activity, or engagement. The mappings were produced through a structured, consensus-based multi-author coding protocol, described at the end of Section 2.6; the coding was performed for design synthesis rather than as independently duplicated screening, and no formal inter-rater reliability statistic is claimed for these mappings, for the reasons stated there.
Finally, it is important to stress that the review deliberately spans not only high-density public events (concerts, transportation hubs, public squares) but also semi-structured environments (classrooms, museums, human-robot interaction) and exhibition stands, because the methodological advances across these domains may be transferable and are treated here as design hypotheses requiring stand-specific validation.
The following subsections present the results first for behavior (Section 2.2) and then for satisfaction (Section 2.3), each organized by sensor modality, before a joint discussion of datasets and remaining challenges.

2.2. Behavioral Sensing Approaches

The literature is organized by primary sensing modality (RGB-D, thermal, LiDAR, mmWave radar, microphones, and their multimodal combinations) and by the behavioral KPIs most relevant to operational stand analytics.
RGB-D. Systems that rely exclusively on depth data reduce, but do not eliminate, facial-texture capture; depth, movement, or body-shape features can still be personal or biometric depending on processing purpose, mounting geometry, retention, and linkage. Within the 2022–2026 review window, Abdelrahman et al. [11] proposed a real-time three-stage engagement estimation pipeline for multi-person human-robot interaction that uses a Kinect v2 sensor together with an FOA (Focus of Attention) network incorporating gaze and head pose. The system achieved ≈96% precision and ≈93% F-score on their custom multi-person interaction dataset, although computational cost and network latency currently limit direct event-scale deployment. Also in 2022, Navarro et al. [12] demonstrated an LSTM framework that processes depth images from a Microsoft Kinect v2 to count people with ≈90% accuracy on a collected indoor office dataset, supporting cross-space tracking without body-worn sensors. Khaire and Kumar [13] developed a semi-supervised CNN-BILSTM autoencoder for anomaly detection in a collected automated teller machine (ATM) surveillance dataset using the same sensor type. Training only on normal videos avoids the need for labeled anomalies, but annotation remains a bottleneck.
In 2024, several depth-based counting and recognition systems were introduced. Kajendran and Mayan [14] presented a DC-CGAN coupled with a DCSNN that detects unusual activities at ATMs using RGB-D data, attaining ≈98% accuracy on a custom ATM surveillance dataset. Abed et al. [15] turned to crowded retail environments and proposed REDNet for head segmentation from top-view depth images, performing well under illuminance variation and partial occlusion. Mishima et al. [16] captured multi-view 3D point clouds with several Azure Kinect sensors and applied P4Transformer to recognize micro-activities such as cutting, holding, and placing, suggesting candidate depth-based primitives that could be tested for transfer to interactive exhibition analytics.
Most recently, Cao et al. [17] advanced anomaly detection in 3D point-cloud video with HyPCV-Former, which embeds depth point clouds into hyperbolic space. The hyperbolic transformer improved anomaly detection by 7.0% on the TIMo (Time-of-flight Indoor Monitoring) dataset and 5.6% on the DAD (Driver Anomaly Detection) dataset over Euclidean baselines, offering a geometric deep-learning approach for event safety monitoring.
Thermal Cameras. Thermal cameras capture emitted radiation rather than visible texture, making them less sensitive to lighting variation and typically less exposed to facial-texture capture than RGB cameras. They may therefore be useful in nighttime and outdoor event deployments. For instance, Kim et al. [18] employed a thermal camera with a YOLOv8n detector to perform real-time stampede risk assessment and transmit density and risk scores to a web interface. The approach works in low light and reduces facial-texture capture, but limited sensor resolution and the absence of complementary spatial sensors remain acknowledged drawbacks.
LiDAR. In comparison, dense 3D point clouds can reduce face-texture capture and have been evaluated in large-scale, high-occupancy outdoor environments. Hishida et al. [19] deployed a network of 20 3D LiDAR sensors across a 900 m2 railway station concourse, combining IA-SSD detection and Iterative Closest Point (ICP)-based multi-sensor alignment with offline tracking compensation to achieve Higher Order Tracking Accuracy (HOTA) scores above ≈90% on their custom railway station concourse dataset. The resulting heatmaps and trajectory indicators provide crowd-level measures, though tracking still relies on handcrafted trajectory prediction, and no public ground-truth dataset exists at this scale.
mmWave Radar. Millimeter-wave radar detects human presence and motion non-optically via Doppler, range, and angle, without capturing face texture or other image-based biometric identifiers. Early work [20] used a four-channel CNN with attention on Multiple-Input Multiple-Output (MIMO) radar point clouds for multi-person activity recognition. For tracking, Canil et al. [21]’s ORACLE network self-calibrates radar nodes from pedestrian trajectories, improving tracking accuracy by 27% over single sensors (median error 0.12 m) on an experimental indoor testbed dataset on a Jetson Nano. For counting, an SNN on Frequency Modulated Continuous Wave (FMCW) radar achieved F 1 = 0.8284 on a custom indoor person counting dataset with ultra-low energy, though performance degraded beyond five persons [22]. Edge-suitable lightweight models include LPBS-Net, a POINTNET-BILSTM with Squeeze-and-Excitation (SE) attention attaining ≈97% accuracy on millimeter-wave activity (MMActivity) dataset with 0.176 M parameters [23], and a 60 GHz radar enhanced RESNET-50 fusing Doppler–range spectrograms that reaches 98% counting accuracy and 95% motion classification on their collected radar dataset despite noise and limited data [24]. Signal superposition in larger groups remains an open challenge for all radar-only systems.
Microphone (Arrays). (Consistent with the sampling limitations acknowledged in Section 2.1, these absences are bounded by the reviewed design-oriented corpus and should not be read as evidence that no such systems exist in the wider literature). No work in this review relies solely on audio for behavioral monitoring.
Multimodal. In the reviewed event-oriented behavior papers, many systems fuse complementary sensors. In 2022, multimodal activity and social analysis expanded across several directions: Roche et al. [25] fused RGB and LiDAR (90% accuracy on a custom captured multimodal dataset); Zhang et al. [26] synthesized mmWave signals from vision data for zero-shot recognition; Nguyen and Kong [27] dynamically weighted visible-thermal streams for illumination-invariant anomaly detection; Cheng et al. [28] fused RGB, thermal, and mmWave radar data for multi-target tracking under difficult conditions; and Tu et al. [29] improved engagement estimation by ≈7% on the MULTIMEDIATE 2023 test set with a DCTM. Later work shifted toward robustness and deployment stressors: Shafizadegan et al. [30] surveyed multimodal HAR and stressed missing modalities and temporal misalignment; Kamra et al. [31] showed RGB-only systems fail under occlusion; Mu et al. [32] and She and Xu [33] advanced RGB-thermal crowd counting and multimodal anomaly detection; Tsiktsiris et al. [34] fused audiovisual cues for public-transport anomaly detection; and Vrochidis et al. [35] monitored audience engagement. In 2025, the corpus added large-scale surveys by Wang et al. [8] and Shin et al. [36], foundation models such as X-Fi [37], engagement-driven museum layout optimization [38], real-time transformer-based engagement prediction [39], and hierarchical urban-space fusion with sub-100 ms responses [40]. The most recent contribution, Jeon and Woo [41], fused 60 GHz radar with a 4 × 5 -pixel privacy-preserving camera, achieving ≈98% accuracy on their constructed multimodal dataset across 15 activities with only 11 MFLOPs. Two related surveys are also relevant: a 2026 comparative study of machine learning and deep learning for human behavior detection using multisensory data [42], and the authors’ 2025 survey on emotional body gesture recognition [43].
Across these multimodal works, some evaluations begin to address real-time operation and selected stressors such as lighting variation, occlusion, crowd density, or privacy constraints, but the evidence remains component-level and often outside live-event stands.

2.3. Satisfaction Sensing Approaches

Because satisfaction is often inferred through emotional responses, this subsection organizes the reviewed satisfaction literature by principal sensor type and chronology.
RGB-D. Within the reviewed satisfaction corpus, the largest group of studies uses RGB cameras for facial expressions, head pose, and sometimes upper-body gestures. Early work in 2022 reached 93.99% accuracy for positive and negative emotions detection on the RaFD dataset; however, it lacked temporal analysis [44], while a service-quality indicator based on pre- vs. post-service emotional change achieved 80% on the Cohn-Kanade+ dataset [45]. In 2024, real-time multi-CNN fusion (VimoNet) reached 84.10% accuracy in the FAGE-KO dataset [46]. EfficientNetB3 achieved ≈97% binary satisfaction in the KDEF dataset but grouped neutral and surprise as satisfied, inflating scores [47].
CNN/LSTM comparisons reported 97.26% CNN accuracy and 92.38% LSTM accuracy for facial-emotion recognition, according to the available abstract [48]. A MediaPipe Holistic ensemble reached 97% accuracy on the EMOTIC dataset, but revealed a 30% gap in negative emotions compared with the self-reports [49]. FaceReader 9 AU analysis predicted valence ( r = 0.42 ) and arousal ( r = 0.29 ) on a private dataset [50]. In 2025, a CNN-SVM hybrid achieved 97.60% on a Kaggle-sourced dataset [51]. On an emotion and teaching-satisfaction database created from 5000 classroom facial images of 5 teachers and 25 students, another framework achieved facial-emotion recognition accuracies of 98.1% for teachers and 99.50% for students [52]. A student satisfaction system tested on a private dataset of 30 students dropped from 94% accuracy to 78% in real time [53]. More recent affective-computing work includes MPFNet for micro-expression recognition [54], TGFNet for facial action-unit detection [55], and KR-HRI for group-level emotional dynamics under global scene guidance [56].
RGB-based satisfaction assessment is feasible, but dataset representativeness, real-world robustness, temporal modeling, and emotion-to-satisfaction interpretability remain open challenges. Much of the satisfaction/emotion literature relies on RGB information, which increases the risk of capturing identifiable biometric data. The authors’ 2026 survey on computer-vision-based audience analysis, focusing on sentiment, emotions, and engagement analysis in live events, is available at [57].
For that reason, RGB-based facial analysis is included here despite the GDPR concerns it raises.
Thermal Cameras. By capturing emitted infrared radiation rather than visible facial texture, thermal imaging can reduce some RGB-specific privacy risks while supporting affect inference from heat distributions and operation under poor illumination. Assiri and Hossain [58] used a nose-tip-anchored, three-region (eyes and lips) framework with a parallel CNN and decision-level fusion, achieving 96.87% accuracy for the CK+ dataset at reduced processing time. Rashmi et al. [59] found that a custom 9 × 9 -kernel CNN reached 95.8% accuracy for thermal images and 93.5% for RGB on a private dataset, outperforming transfer-learned DenseNet-121, ResNet-50, and VGG-19, while noting thermal imaging’s lower lighting sensitivity and ability to capture regional heat variations, though automated RoI placement remains future work. These studies support thermal-only affect or emotion inference, with thermal normalization and landmark detection remaining critical; satisfaction inference from thermal features still requires concurrent satisfaction labels.
LiDAR. (Consistent with the sampling limitations acknowledged in Section 2.1, these absences are bounded by the reviewed design-oriented corpus and should not be read as evidence that no such systems exist in the wider literature). No studies in the reviewed corpus apply LiDAR to satisfaction measurement.
mmWave Radar. (Consistent with the sampling limitations acknowledged in Section 2.1, these absences are bounded by the reviewed design-oriented corpus and should not be read as evidence that no such systems exist in the wider literature). No satisfaction measurement systems employing mmWave radar were identified in this review.
Microphone (Arrays). Audio- and speech-derived satisfaction inference uses paralinguistic, acoustic, and transcript-derived linguistic cues, although not every cited study evaluates microphone-array localization or raw waveform features. Early work achieved 75.7% accuracy for customer satisfaction evaluation on the KONECTADB dataset [60], and 73.97% accuracy for Mandarin speech using auto-encoded MFCCs on a private dataset [61], though the latter lacked generalization. Transformer-based emotion analysis in negotiation dialogues explained significant variance in satisfaction ( R 2 = 0.137 ) [62]. In short-voice-recording emotion prediction, an MLP reached 75.9% accuracy compared with 53% for a CNN [63]. Group-gated multimodal fusion of self-supervised speech and language representations outperformed unimodal and other multimodal baselines on the KONECTADB and IEMOCAP tasks considered [64]. On IEMOCAP, CNNs with soft-label correction achieved 70% weighted accuracy and 71% unweighted accuracy [65]. These results make audio relevant to stand analytics, but the optimal strategy depends on dataset size, language, recording conditions, and the relative discriminative power of lexical over acoustic cues.
Multimodal. Several works fuse visual, acoustic, textual, and physiological signals for emotion and satisfaction inference. Perez-Toro et al. [66] achieved an F-score of 0.89 for call-center satisfaction (private call-center dataset) by combining CNN-BiGRU acoustic and BERT-BiLSTM linguistic features on the arousal–valence plane. Maris et al. [67] used principal component analysis to fuse eye tracking, motion, facial, and physiological data, with minimal performance loss when removing expensive sensors. Maheen et al. [68] proposed emoAIsec, integrating Inception-ResNet-v2, CNN-LSTM, and GPT-4 with federated learning, while Luo et al. [69] developed TriagedMSA, achieving 83–87% accuracy via sentiment agreement/disagreement triaging across text, audio, and vision for the datasets considered (CMU-MOSI, CMU-MOSEI, CH-SIMS.v2). These approaches indicate that fusion, modality-disagreement handling, and privacy-preserving design require explicit evaluation in real-world satisfaction inference.
Satisfaction assessment, like behavior sensing, is shifting from controlled, unimodal emotion classification toward real-time, multimodal, and privacy-aware systems that model temporal affect dynamics and adopt continuous arousal-valence frameworks rather than simplistic “happy equals satisfied” mappings.

2.4. Sensing Advantages, Deployment Limitations and Suitability for Live-Stand Analytics

Table 1 quantifies the distribution of reviewed papers across sensor modalities for behavior and satisfaction. Supplementary Table S2 summarizes the methods by behavior and satisfaction KPI (see Section 2.6), sensor modality (with RGB cameras separated from depth sensors), fusion strategy, main algorithms/architectures, and key limitations or gaps.
Taken together, the reviewed modalities span a trade-off gradient between semantic richness, deployment limitations, and privacy exposure. RGB-D is the semantically richest option for behavioral sensing, supporting counting, dwell, interaction, and anomaly analytics from a single installation, but is limited by line-of-sight occlusion in dense crowds, high compute and bandwidth demands, calibration sensitivity, and residual privacy risk, since depth and body-shape features may still be personal or biometric; it is best suited to moderate-density interaction zones where this semantic detail justifies the cost. LiDAR offers larger-area geometry, lighting invariance, and reduced visible-texture capture, but its higher hardware and alignment costs and sparse geometry position it as a backbone for counting, density, motion, and dwell-time analytics. mmWave radar provides strong low-light operation, low raw-data identifiability, and efficient edge inference, but its coarse semantics and sensitivity to multipath, interference, and crowd superposition restrict it to presence, counting, and motion fallback in low-to-moderate densities.
This gradient also anticipates the satisfaction-oriented evidence reviewed in Section 2.3. The sparse, texture-free representations that make LiDAR and radar attractive from a deployment and privacy standpoint are precisely what limit their evidential value for affective constructs, and no satisfaction systems based on either modality were surfaced in the reviewed corpus. Satisfaction-related inference in the corpus instead concentrates on modalities that capture expressive detail, RGB and thermal imaging of the face, and audio or speech cues, which carry correspondingly higher privacy exposure and stronger dependence on labeled satisfaction data. Behavioral and satisfaction sensing, therefore, impose partially conflicting modality requirements, a tension that any live-stand architecture must resolve explicitly rather than by sensor choice alone.
Multimodal systems extend this spectrum rather than resolving it: they offer the broadest KPI coverage across both behavioral and satisfaction constructs and the best opportunity for graceful degradation, but concentrate the limitations of their constituent sensors while adding cross-sensor calibration, synchronization, latency, infrastructure, and governance burdens. Fusion is therefore conditionally appropriate for live stands, justified only when ablation and dropout tests show that each modality adds reliable, privacy-acceptable information and when explicit fallback paths preserve operation under sensor failure; the prevalence of fusion in the reviewed corpus should not be read as evidence of deployment superiority. In practice, modality selection should follow the target KPIs and crowd density: LiDAR or radar suffices for occupancy and flow indicators, RGB-D is justified where interaction-level semantics are needed, and full fusion only where its validated added value outweighs its integration costs.

2.5. Datasets

The most relevant datasets for this paper’s purpose are briefly described.
Behavior Datasets. Brscic et al. [70] provided the ATC Shopping Center dataset, utilizing 49 overhead 3D range sensors to track continuous pedestrian trajectories and spatial statistics within a 900 m2 indoor public space. Alameda-Pineda et al. [71] introduced SALSA, the canonical multimodal dataset for social event analysis, synchronizing static cameras and sociometric badges to capture group behavior with F-formation, position, and personality annotations. Zhang et al. [72] presented SFU-Store-Nav, a multimodal dataset of synchronized RGB video and motion-capture trajectories from 108 participants, designed for studying navigational intent in retail environments. Ehsanpour et al. [73] contributed JRDB-Act, extending the JRDB platform with over 2.8 M atomic action labels and social group annotations for spatiotemporal action detection from an egocentric robot perspective.
An et al. [74] proposed mRI, a multimodal 3D pose estimation dataset providing 160 k synchronized frames of mmWave radar, RGB-D, and IMU data for rehabilitation exercises. Su et al. [75] introduced SCU-VSD-Social, extending their previous SCU-VSD dataset with multi-group labels and corrected pedestrian trajectories across 8 high-resolution video sequences, designed specifically for social group detection based on spatiotemporal interpersonal distance. Martin-Martin et al. [76] released the original JRDB, a 64-min egocentric dataset from a social mobile manipulator with 2.4 M 2D bounding boxes and 1.8 M 3D cuboids across 3500 person trajectories. Vendrow et al. [77] extended this with JRDB-Pose, providing 636 k multi-person pose instances and per-keypoint occlusion labels for tracking evaluation. Piadyk et al. [78] presented StreetAware, a synchronized multimodal urban dataset combining LiDAR, high-resolution cameras, and microphones to capture pedestrian and vehicle behavior at intersections over nearly eight hours. Le et al. [79] introduced JRDB-PanoTrack, adding open-world panoptic segmentation and tracking with 428 K masks and 27 K tracking labels in crowded environments. Jahangard et al. [80] contributed JRDB-Social, enriching the family with multi-label social interaction annotations and textual descriptions for group dynamics understanding.
Zhou et al. [81] created RAV4D, an indoor multi-person tracking dataset fusing 4D FMCW radar, microphone arrays, and stereo cameras with annotated 3D head trajectories and Doppler velocities. Gucsi et al. [82] provided HRI-SENSE (2025), a multimodal human-robot interaction dataset comprising six hours of RGB-D, audio, and subjective impression ratings for engagement and satisfaction research.
Satisfaction Datasets and Related Multimodal Resources. Abdrakhmanova et al. [83] introduced SpeakingFaces, a large-scale multimodal resource combining audio, visual, and thermal streams from 142 subjects for human–computer interaction and biometric authentication, providing over 13,000 synchronized multimodal instances and approximately 3.8 TB of data; it is relevant as a multimodal sensing resource, but not as a direct satisfaction dataset. Fard et al. [84] presented AffectNet+, which extends the original AffectNet with soft-label probability vectors for eight emotions, difficulty-based subsets, and enriched metadata to model compound expressions and annotation ambiguity. Gao et al. [85] presented AMuSeD, an audiovisual sarcasm resource that is relevant to multimodal sentiment-resource coverage but is not a direct stand-satisfaction dataset. Ji et al. [86] proposed Hugging Rain Man (HRM) (2025), a novel dataset of approximately 130,000 frames with FACS-coded action units and atypicality ratings from children with autism spectrum disorder, bridging subjective perception and objective facial muscle analysis. Guo et al. [87] released DEPRESS (2026), a longitudinal multimodal dataset capturing mental health, indoor environmental quality, physiological signals, and facial action units from 184 students during the COVID-19 pandemic to study the influence of home environment on learning and well-being.
Supplementary Table S3 details these contextual dataset resources by sensor modalities, KPIs (see next Section), environment and scale, annotation format, and key limitations. A more extensive/detailed survey of affective-computing databases (done by the authors in 2025) can be found in [88].
Synthetic Data Generation for Multimodal Stand Analytics: None of the datasets reviewed above is stand-specific, and collecting new annotated recordings at live events is constrained by GDPR requirements on lawful basis, purpose limitation, and biometric data processing [4], as well as by the cost and unreliability of manual annotation in dense crowds. Synthetic data generation offers a complementary pathway. Simulation platforms such as NVIDIA Omniverse, with Isaac Sim and the Omniverse Replicator synthetic-data pipeline, can render photorealistic, physically simulated indoor environments populated by animated human agents and observed by configurable virtual sensor rigs. The publicly released PhysicalAI-SmartSpaces dataset demonstrates the maturity of this approach, providing large-scale synthetic multi-camera recordings of human activity in indoor smart spaces with automatically generated ground truth for detection, multi-camera tracking, and occupancy. The same methodology can be specialized to the live-stand scope: parameterized exhibition-hall and stand geometries, visitor agents with configurable behavior profiles, and virtual counterparts of the architecture sensing layer (RGB-D, thermal approximation, LiDAR, and radar point-cloud emulation).
For the behavioral KPI family of Section 2.6, simulation provides ground truth by construction: exact per-frame person counts and continuous density fields; identity-consistent trajectories for motion-pattern analysis; per-agent, per-zone timestamps yielding exact dwell-time distributions; and scripted agent state machines (pass-by → approach → interact → transact) that produce labeled conversion, commitment, and retention proxies. In contrast, satisfaction- and affect-related KPIs cannot be meaningfully synthesized, since simulated agents possess no affective ground truth; synthetic corpora are therefore positioned here as pretraining and benchmarking resources for behavioral analytics, not as substitutes for consented real-world satisfaction labels. The principal limitation is the sim-to-real domain gap in appearance, sensor noise, and behavioral realism, which can be mitigated through domain randomization, physically based sensor noise modeling, and mixed synthetic-plus-real fine-tuning, followed by validation against small, consented pilot recordings. Generating such a stand-specific synthetic corpus is identified as a priority for the future validation of the architecture (Section 3).

2.6. Constructs (KPIs)

The literature does not determine a single exact set of constructs required to represent or compute each metric. Behavior and Satisfaction are often derived from constructs that contribute to more than one metric. As noted in the introduction, constructs for specific metrics are also considered KPIs in this work. For simplicity, all constructs are therefore referred to as KPIs, except where stated otherwise.
Table 2 presents author-coded direct or proxy KPI evidence found in the reviewed corpus, organized by sensor type and reference. As a conservative author-coded filter for design synthesis, we retained constructs (KPIs) mentioned by at least two publications in the 60-paper corpus, including survey or architecture papers where listed. This threshold should not be interpreted as validation of construct importance or sensing feasibility. Feedback is retained as a single-source proxy design exception because observable approval events are operationally relevant to the proposed architecture, but it is not threshold-supported within the analytic corpus. The selection remains partly subjective: if a larger body of literature were considered, additional constructs could emerge.
A brief definition is provided for each construct (KPI). The first ten are more closely associated with behavior: (i) Conversion: the proportion of visitors who complete a desired action, e.g., a purchase or a sign-up; (ii) Commitment: a visitor’s sustained loyalty to the stand, demonstrated by repeat visits, conversions, and extended dwell time; (iii) Density maps: spatial heatmaps showing how visitor concentration varies across different parts of the stand; (iv) Engagement: the degree of visitor attentiveness, interest, and active participation with stand content or staff; (v) Feedback: explicit visitor signals such as applause, thumbs-up, nodding, or positive exclamations indicating approval; (vi) Motion Patterns: the classification of how visitors move (e.g., directed, exploratory, hesitant) throughout the stand; (vii) Odd Behavior: actions that deviate markedly from the norm, such as running, distress, or unusual crowd/group movements. (viii) Person Counting: the total number of individuals present in the stand or a specific zone at any time; (ix) Retention: the rate at which visitors return to the same stand or exhibit after an initial visit; (x) Social Interactions: interactions between visitors, and between visitors and staff, within the stand.
The satisfaction-related constructs are (xi) Attention: where visitors focus their gaze, revealing which displays or areas capture and hold visual interest; (xii) Conversation: verbal exchanges between staff and visitors, ranging from brief queries to in-depth discussions; (xiii) Dwell Time: the duration a visitor spends in a specific area, signaling interest or possible confusion; (xiv) Emotion: affective states mapped on a valence–arousal plane (pleasantness vs. activation), e.g., joy, anger; (xv) Sentiment: overall emotional tone categorized as negative, neutral, or positive based on visitor reactions.
To separate direct measurements, behavioral proxies, and validated business or psychological outcomes, the 15 constructs are organized into a three-tier evidence taxonomy, which is carried through Table 3 and Table 4 and the remainder of the paper. Tier D, direct sensor-derived measurements (Person Counting, Density Maps, Motion Patterns, and Dwell Time), are geometric or temporal quantities estimable directly from sensor data with established evaluation metrics (e.g., MAE for counting, HOTA for tracking), and constitute the strongest evidence class in the corpus. Tier P, behavioral proxies (Engagement, Social Interactions, Odd Behavior, Attention, Conversation, Emotion, and Sentiment), are inferable from sensor data but stand in for latent constructs; their validity depends on context-specific proxy-to-construct assumptions that the corpus rarely tests. Tier V, validated business or psychological outcomes (Conversion, Commitment, Retention, and Feedback, together with the overarching satisfaction construct), require external ground truth, such as self-reports, transactions, return visits, or consented operational records, for validation; within the reviewed corpus they are supported almost exclusively by Tier-P proxy evidence, and no study validates a sensor-derived estimate against a concurrent outcome label in a live-stand setting. Accordingly, Tier-D KPIs are treated as measurable outputs, Tier-P KPIs as candidate estimators requiring construct-validity assumptions, and Tier-V KPIs as validation targets rather than sensing outputs.
For the Tier-V behavioral-outcome KPIs, conceptual definitions alone are insufficient for future validation, so a concrete operational specification is proposed for each, comprising the external data requirement (the non-sensor record needed as ground truth), the observable variable and time window, a candidate estimator, and the linkage mechanism required to connect a sensor-derived track to an external outcome record, namely a consented, pseudonymous, session-scoped token that is never linked to biometric identity. Conversion is operationally defined over a session window W and stand zone z as the ratio of tracked visitor sessions in z that are matched, via the consented linkage token, to a completed transaction or sign-up record in the same window, to the total number of tracked sessions in z during W; validation requires point-of-sale or CRM transaction logs timestamped and zone-tagged consistently with the sensing system, with linkage established only under explicit consent (e.g., opting into a loyalty scan or checkout prompt).
Commitment is operationally defined as a composite of (a) normalized dwell time in z relative to a stand-specific baseline, (b) the count of distinct sub-zones or content touch-points visited within a session, and (c) the occurrence of a Conversion event in the same session; each sub-component requires calibration against staff-validated logs or repeat-interaction records before combination. Retention is operationally defined as the proportion of pseudonymous visitor identifiers, valid only within a single event or a short-lived, consented registration window, that re-appear in a subsequent, clearly delimited time window (e.g., a later day of a multi-day exhibition, or a subsequent edition of a recurring event where a consented, longer-lived loyalty identifier exists); Retention as defined here is bounded by the privacy-by-design retention and linkage constraints adopted by the architecture (Section 3) and cannot rely on persistent biometric re-identification. These operational definitions are proposed specifications for future validation, not evidence that such validation has occurred in the reviewed corpus, which provides only proxy support for these constructs drawn from adjacent domains.
Operationally, each KPI requires explicit variables, scope, estimator type, ground truth, aggregation, missing-data handling, and normalization. For this architecture, observable variables are sensor-derived features such as track counts, dwell intervals, gaze/head orientation, proxemic formations, acoustic events, speech activity, thermal blobs, radar motion signatures, and LiDAR trajectories. Spatial scope is defined at stand, zone, and tracked-instance levels; temporal scope is frame, short window, session, and event. Estimators may be regressors, classifiers, counters, spatial density estimators, or sequence models.
Ground truth should come from manual annotation, event transaction records, consented survey/self-report labels, or staff-validated operational logs, depending on the KPI. Aggregation should use pre-specified means, sums, rates, quantiles, or time-weighted scores. Missing modalities should be handled by confidence-weighted masking rather than zero imputation, and all KPI outputs should be empirically calibrated to [0, 1] using validation data, or mapped to provisional [0, 1] utility scores using explicitly declared expert-defined mappings. Validation should distinguish sensor/modality missingness from missing or biased ground truth, including survey non-response, consent-selection effects, transaction-linkage failures, and incomplete staff logs. In Table 2 and Table 3, Commitment, Conversion, and Retention are supported as business-outcome proxies rather than by direct validated stand-level labels, and Feedback is retained as a single-source proxy design exception based on observable response cues.
A final note to refer that the author-coded mappings reported in Table 2, Table 3 and Table 4 were produced through a structured, multi-author coding protocol. (i) Codebook definition: before coding, the KPI definitions above were consolidated into an internal codebook specifying, for each KPI, the operational definition, what counts as a primary sensing contribution (the study directly measures the KPI construct or a validated operational label for it), and what counts as a secondary/proxy contribution (the study measures a transferable cue, e.g., dwell time, trajectory, applause, speech activity, or engagement, from which the KPI could plausibly be derived but which is not validated against the construct); modality assignment followed the fixed primary-sensor rule stated in Section 2.1. (ii) Independent initial coding: one author performed the initial coding of the full 60-paper corpus against this codebook. (iii) Verification pass: a second author independently re-coded the corpus subset associated with the most interpretation-sensitive constructs, namely the satisfaction-related KPIs and the Conversion, Commitment, and Retention proxy mappings, where primary/secondary boundaries are least self-evident; modality assignments, being largely factual, were verified by cross-checking against the hardware descriptions in each paper. (iv) Consensus resolution: all divergent assignments were discussed in dedicated coding sessions among the co-authors until a unanimous consensus was reached; the codebook was refined where disagreements revealed ambiguous decision rules, the affected mappings were re-checked against the refined rules, and the senior authors adjudicated residual borderline cases. No formal inter-rater reliability statistic (e.g., Cohen’s κ ) is reported deliberately: the coding was performed as a consensus-based expert classification for a design-oriented synthesis, not as independently duplicated screening under a pre-registered protocol, and a coefficient computed post hoc over consensus-influenced labels would overstate the procedure’s formality. Readers should weigh the mappings accordingly, noting that the reference lists in these tables are citation occurrences rather than independent validation counts.
Table 3 reflects the authors’ assessment of direct or proxy construct (KPI) evidence by sensor type following their review of the papers. Table 4 illustrates the same author-coded evidence without references: the symbol “•” designates the hypothesized primary sensing contribution to a construct under nominal conditions, and the symbol “∘” designates modalities providing supplementary evidence or degraded-condition fallback coverage.

2.7. Discussion

Individual components of live-stand analytics provide enough evidence to inform system design, but the integrated deployment problem remains unresolved. The reviewed corpus contains relatively direct evidence for selected primitives, including people counting, density estimation, motion-pattern analysis, anomaly detection, engagement cues, and emotion or sentiment inference under constrained conditions. It does not contain a validated stand deployment that jointly covers the proposed KPIs, heterogeneous sensor fusion, real-time operation, and privacy-by-design constraints. Results should therefore be interpreted as component-level evidence and, in many cases, as optimistic upper bounds for live-event performance [30,36,90].
Evidence-base characterization. To make the heterogeneity of the corpus explicit, the 60 papers were characterized, using the consensus-based coding protocol described in Section 2.6, along eight dimensions: study type, sample or dataset size, data availability, validation method, laboratory versus real-world setting, reproducibility, real-time capability, and deployment maturity; dimensions not reported by a paper were recorded as such rather than inferred. The large majority of the corpus consists of empirical studies evaluated in laboratory conditions or on public benchmarks, with a minority of surveys, architecture papers, and dataset contributions, which are counted as design evidence rather than independent empirical validations (Section 2.1). Reported sample and dataset sizes vary by orders of magnitude, from small single-site collections to large public benchmarks. A minority of studies release code and data sufficient for reproduction; the large majority validate on custom or private datasets in laboratory or controlled field settings. Real-time capability is claimed more often than demonstrated, with only a minority reporting measured latency or throughput on deployment-class hardware, and none of the reviewed studies reach operational deployment maturity in a live-stand setting, i.e., a validated, real-time, privacy-constrained deployment at an actual exhibition stand. This structured characterization is a transparent classification of what each paper explicitly reports, not a formal risk-of-bias or GRADE assessment, which the corpus-construction procedure of Section 2.1 could not legitimately support; it confirms that the evidentiary gap motivating the SMBSA architecture is a property of the assessed corpus rather than an impression.
Fusion robustness and deployment reliability. Multimodal fusion is often presented as a route to higher accuracy. For live stands, however, it should first be treated as a reliability problem. The reviewed fusion strategies can be grouped into five categories. Feature-level fusion combines intermediate modality representations before a shared classifier or regressor. Decision-level fusion merges independent modality outputs through voting, averaging, or rule-based aggregation. Data-level fusion integrates raw or minimally processed streams at the pixel, point-cloud, or waveform level, usually when sensors are spatially aligned. Hybrid strategies combine these levels, for example, using early feature extraction with late decision aggregation or adaptive stream weighting. Supplementary Table S4 summarizes the frequency of these strategies.
Feature-level fusion dominates the reviewed corpus, but its frequency should not be read as evidence of deployed superiority. Fusion benefits depend on calibration, temporal alignment, sensor quality, missing-modality handling, and domain-specific ablation against strong unimodal baselines. Several reviewed studies show that multimodal systems can be brittle under modality dropout, occlusion, lighting variation, acoustic interference, and mmWave signal superposition [23,30,34]. In satisfaction contexts, group-gated fusion can outperform unimodal baselines when speech and language streams are well aligned [64]. That result still leaves the deployment question open: under which conditions does each modality add reliable, privacy-acceptable information?
Construct validity and KPI evidence strength. The reviewed evidence is uneven across the proposed KPIs. Person counting, density maps, motion patterns, odd behavior or anomaly detection, and constrained emotion or sentiment recognition have relatively direct machine-perception support. Engagement, social interaction, conversation, and dwell time are supported by adjacent or transferable evidence from classrooms, museums, human-robot interaction, transport, or crowd-monitoring settings. Feedback, Conversion, Retention, and Commitment are the weakest as formal stand-level sensing targets: within the reviewed corpus, they are mostly represented by proxies such as dwell time, trajectories, interaction cues, or engagement estimates rather than by validated event-outcome labels.
Satisfaction inference has an additional construct-validity problem. Several reviewed systems use discrete emotion recognition as satisfaction-related evidence, for example, in telecommunication-service or museum-visitor applications [46,47], but this does not by itself establish a general mapping from emotion labels to stand satisfaction. Dimensional arousal–valence representations offer a more explicit alternative because they avoid fixed categorical boundaries [66], but they still require concurrent satisfaction ground truth. Across modalities, reported accuracy can exceed ≈90% under controlled conditions, while live or noisy settings are less stable: a vision-based student satisfaction system dropped from 94% in controlled testing to 78% in real-time deployment [53], and audio systems remain sensitive to acoustic conditions despite efficient real-world call-center results [60]. Supplementary Table S5 summarizes the main satisfaction-inference approaches found in the reviewed corpus.
Ecological validity, temporal modeling, and demographic limits. Many of the reviewed satisfaction and behavior pipelines remain benchmark-driven. Several rely on posed, well-lit, frontal, short-window data, which do not represent occlusion, non-frontal viewpoints, dynamic illumination, dense groups, low-intensity expressions, or acoustically noisy event venues. Existing datasets are also often demographically narrow. Although AffectNet+ enables subgroup auditing through enriched metadata [84], none of the reviewed systems reports systematic subgroup performance evaluation. As argued by the authors in Vaz et al. [43], new task-specific datasets are needed if claims are to generalize to stand-like deployments.
Annotation scarcity reinforces this limitation. Among the selected contextual dataset resources, it was found that no public corpus provides synchronized multi-sensor annotations across all stand-relevant KPIs in an actual event venue. Self-supervised pretraining on unlabeled streams, weak supervision from aggregated outcomes, and synthetic-to-real transfer are plausible routes, but each still requires event-specific validation [26,39]. Temporal modeling is especially important because behavior and satisfaction are trajectories rather than isolated frames. A YOLO-LSTM pipeline using sequences of up to 160 frames [52] and dialogue-based evidence for affective dynamics [62] indicate why short-window or snapshot estimates are insufficient for reliable stand analytics. Supplementary Table S6 summarizes the common algorithm families across the behavior and satisfaction papers.
Ethical and privacy constraints. Biometric emotion recognition, behavioral profiling, and long-horizon trajectory association raise privacy and governance concerns that cannot be deferred until after model selection. Some reviewed work incorporates federated learning and differential privacy [68], releases OpenFace-extracted Facial Action Unit features rather than raw video [87], or exploits the lower lighting sensitivity and reduced visible facial texture of thermal sensing [58]. For stand analytics, these patterns imply concrete design requirements: sensor minimization, local processing, short retention of raw RGB and audio streams, explicit deletion rules, transparent signage, documented edge/cloud boundaries, and quantified privacy-utility trade-offs when face-based inference is replaced by depth, skeletal, thermal, LiDAR, radar, acoustic, or feature-only pathways. A privacy-aware architecture can support GDPR- and EU AI Act-aware engineering choices [4,5], but it cannot by itself establish compliance for a concrete deployment.

2.8. Design Implications for SMBSA

The review motivates a reference architecture rather than a single optimal model. No modality covers behavior, satisfaction, privacy, and deployment robustness by itself, so a stand analytics system should combine complementary sensors while allowing privacy-risk-reducing configurations. RGB-D provides semantic and affective cues but carries a higher biometric risk. Thermal, LiDAR, and mmWave radar can reduce visible facial-texture capture for occupancy and spatial structure, but may still yield personal or identifying data depending on processing, retention, and linkage. Microphone arrays contribute feedback, conversation, and engagement evidence, but require strict audio governance.
The evidence also motivates confidence-aware fusion and KPI-specific analytics heads. Modality dropout, poor illumination, acoustic interference, temporal misalignment, and radar superposition are expected operating conditions rather than rare exceptions. The architecture should therefore expose sensor-quality indicators to the fusion layer, benchmark fused outputs against strong unimodal baselines, and separate KPI heads so that mature constructs are not conflated with proxy-supported ones (Tier D vs. Tiers P and V in Section 2.6). Feedback, Conversion, Retention, and Commitment should be treated as validation targets until concurrent stand-level ground truth is available; Feedback is especially preliminary because the reviewed analytic corpus provides only single-source proxy support. The SMBSA score should be introduced as a bounded aggregation scheme, not as an established metric. Its weights, KPI mappings, missing-data handling, and calibration procedure require empirical validation with real-event data.
The architecture should also carry privacy and regulatory substantiation from the physical layer to the reporting layer: local processing, raw-data minimization, edge/cloud boundaries, auditability, and deployment-specific legal assessment are design requirements, not optional post-processing steps. Based on these findings, the next section proposes the Stand Multimodal Behavior and Satisfaction Analysis (SMBSA) architecture for deployment-oriented live-stand sensing.

3. Stand Multimodal Behavior and Satisfaction Analysis Architecture

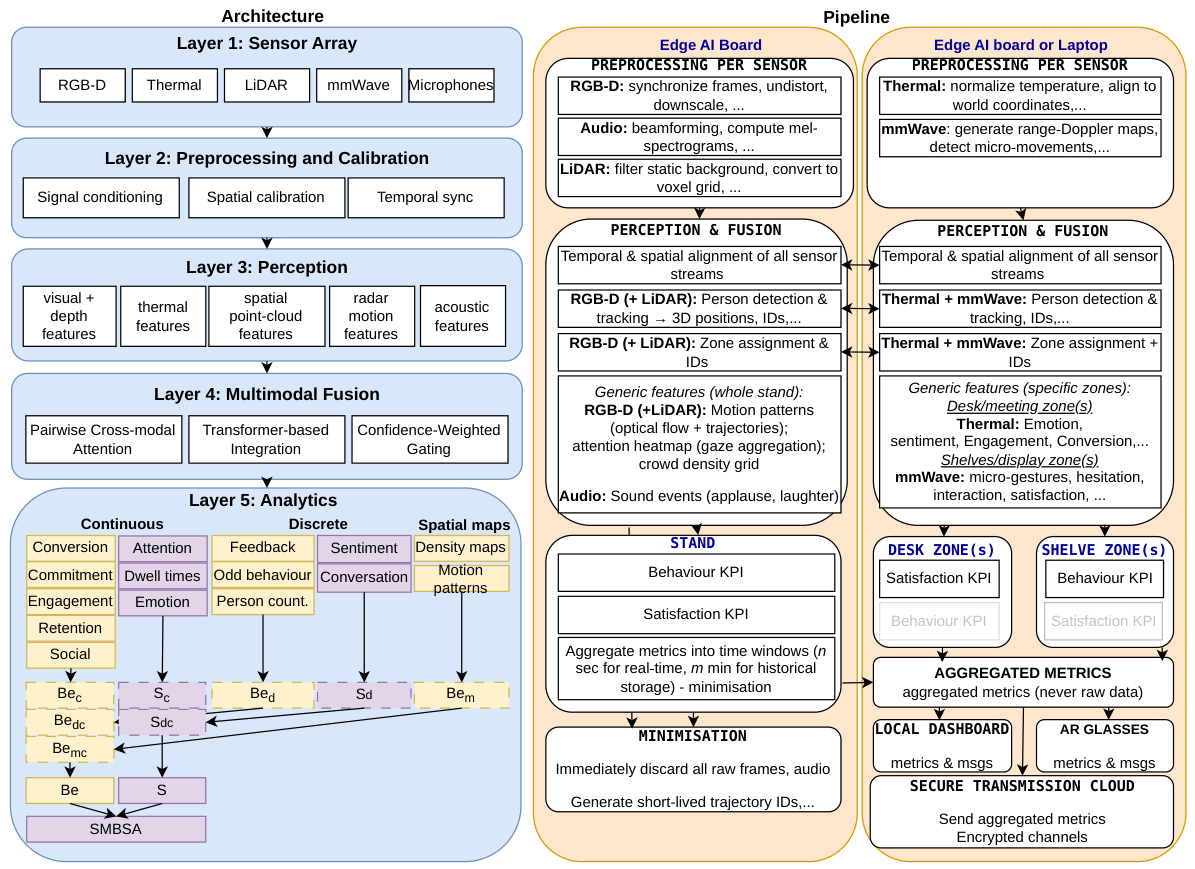
The SMBSA architecture is a modular, deployment-oriented reference model for real-time stand analytics under privacy-sensitive constraints. As shown in Figure 1 (left, “Architecture”), it structures the pipeline into five layers, from multi-sensor acquisition and spatiotemporal alignment to modality-specific encoders, hierarchical attention-based fusion, and 15 KPI-specific heads spanning behavioral and satisfaction metrics.

3.1. Layers

Layer 1: Sensor Array. The front end uses five complementary modalities: RGB-D, thermal, LiDAR, mmWave, and microphone arrays. RGB and/or RGB-D provide dense semantic cues such as facial, gaze, and posture information, but degrade in low light and carry identifiable biometric information. Thermal cameras are less sensitive to illumination and support density estimation and anomaly detection in darkness [18,27]. LiDAR provides 3D point clouds for large-scale group mapping and trajectory estimation [19]. mmWave radar can support data-minimization-oriented counting and motion classification, including micro-movements, in low-density small-group settings, with source-specific limits still requiring validation [22,23,24]. Microphone arrays can capture applause, vocalizations, and speech activity that support candidate Feedback proxies and contribute to engagement and social interaction estimates [29,35]. The five sensor modalities support different levels of privacy constraint: in permissive environments with appropriate lawful basis, the full RGB-D camera can be integrated with the other sensors, whereas in higher-risk contexts, the RGB stream can be disabled and only the depth channel retained (see also Table 4).
Layer 2: Preprocessing and Calibration. Heterogeneous raw data are converted to synchronized, co-registered tensors through intra-modality conditioning (depth hole-filling, thermal non-uniformity correction, LiDAR ground removal and down-sampling, mmWave range-Doppler-angle FFTs and DBSCAN clustering, microphone beamforming and source separation), spatial calibration (checkerboard for camera pairs, target-based or mutual-information for LiDAR-to-camera, and radar network calibration [21]), and hardware-based temporal alignment to reduce, estimate, and monitor residual offset errors [30,81].
Layer 3: Perception. Lightweight encoders extract compact feature vectors from each stream for scene-level and instance-level analyses, depending on downstream needs. The RGB-D encoder employs, e.g., CNN backbones (MobileNet, ResNet-18) with depth pathways [11,91], producing spatial feature maps that can be globally pooled for whole-stand descriptors (e.g., density, overall engagement) or cropped around detected persons for per-individual appearance and depth features. The thermal encoder follows a similar design with fine-tuned RGB backbones [32], enabling global thermal summaries or instance-level blob/bounding-box extraction for counting and individual analysis. LiDAR point clouds are processed, e.g., by Point Transformer or PointNet-based architectures [19,23], yielding per-point features that can be globally pooled for spatial occupancy and layout, or clustered to form person-specific 3D embeddings.
The mmWave encoder applies, e.g., 2D CNNs to spectrograms or PointNet-family networks to point clouds, always augmented with BiLSTM or Transformer temporal modeling to capture Doppler velocity signatures [26,41]; scene-level global statistics are available alongside per-tracked-cluster motion signatures. Finally, a candidate dual-pathway audio encoder would use a Mel-spectrogram CNN for crowd-level acoustic embeddings (applause, noise) and, if microphone-array geometry and validation data permit, a localization branch for speaker-level prosodic features; both branches remain conditioned on SNR-aware confidence estimates and require noisy-stand validation before deployment.
Layer 4: Multimodal Fusion. The embeddings produced by the perception modules are combined by a hierarchical fusion architecture intended to preserve inter-modal complementarity under sensor dropout or degradation. Pairwise Cross-modal Attention operates on preselected sensor pairs (RGB-D–TIR, LiDAR–mmWave, Microphone–RGB-D, Microphone–mmWave) to learn bidirectional correspondences and is intended to reduce single-modality dominance in the joint representation [37]. A Transformer-based Multimodal Integration Network (MMIN) then aggregates the enhanced tokens via multi-head self-attention. An optional BiLSTM or Transformer temporal module can be inserted before integration to model short-term dynamics (1–5 s windows) for KPIs that depend on temporal evolution, such as motion patterns or dwell-time tracking [12,13]. Confidence-Weighted Adaptive Gating (CWAG) uses real-time sensor-quality indicators, depth completeness, radar SNR, and acoustic interference level, to dynamically re-weight each modality’s contribution under modality dropout [30].
This specific combination is chosen over common alternatives based on the review findings. Feature-level (early) fusion of concatenated features dominates the reviewed corpus (Section 2.7), yet several reviewed studies show such systems to be brittle under exactly the conditions that define live stands, since early fusion assumes all modalities are present, synchronized, and comparably reliable, an assumption routinely violated by occlusion, lighting variation, acoustic interference, and sensor dropout. Late (decision-level) fusion is robust to missing modalities but discards the cross-modal correspondences on which several target KPIs depend, for example, associating detected speech activity with the visually tracked group that produces it (Conversation, Engagement) or corroborating RGB-D tracks with thermal or radar returns under occlusion. The proposed design is an intermediate point adapted to the stand setting: restricting cross-modal attention to physically complementary sensor pairs, rather than applying a single monolithic joint transformer over all tokens, preserves the required cross-modal interactions while avoiding the quadratic token-interaction cost of full joint attention, which matters for the real-time, edge-deployable budget of this layer; and confidence-weighted gating provides graceful degradation, attenuating an absent or degraded modality instead of letting it corrupt the joint embedding, which is the failure mode reported for early fusion in the corpus. Tensor-based fusion was set aside because its parameter growth is incompatible with edge budgets, and purely score-level ensembles because they provide no cross-modal grounding for group-level KPIs.
The proposed fusion design is an initial architecture rather than a validated optimum. It requires ablation against strong unimodal baselines, missing-modality tests, and stress tests under occlusion, lighting variation, acoustic interference, and radar crowding. The output of the fusion module is a compact joint embedding that is fed to all behavioral and satisfaction analytics heads in Layer 5.
Layer 5: Behavioral and Satisfaction Analytics. Fifteen proposed heads would translate the joint multimodal embedding into KPI estimates, covering the behavioral and satisfaction metrics defined in Section 2.6. The heads inherit the three-tier evidence taxonomy of Section 2.6: the Tier-V heads (Conversion, Commitment, Retention, and Feedback) are explicitly candidate heads whose outputs are hypotheses requiring future validation against consented outcome labels, not validated stand-performance metrics. Until such linkage and calibration exist, Tier-V head outputs must not be reported to end users as measured values, and operator dashboards should visually and structurally separate Tier-D and Tier-P outputs from Tier-V outputs (e.g., through distinct panel labeling), to avoid implying equivalent evidentiary status. The heads produce three types of outputs: continuous scores, mapped categories or counts, and spatial maps. Before any composite index is computed, each output must be transformed into a calibrated score in [0, 1]:
-
Continuous KPIs. Engagement (En) and Social Interactions (So) are proposed as scalar estimates in [0, 1] by dedicated regressors that exploit the instance-level features provided by the perception modules. Conversion (Con), Commitment (Com), and Retention (Re) are included as candidate operational-outcome heads; before they can be estimated as calibrated, utility-oriented scalar values, they require validated labels from transaction records, repeat-visit identifiers, consented surveys, or staff-validated logs. Engagement, for example, fuses head-pose, facial dynamics, acoustic cues, and body movement into a continuous attentiveness score [11,29], while the Social Interactions head would estimate proxemic/F-formation social groups from spatiotemporal position, orientation, and interpersonal-distance cues [71,75]. On the satisfaction side, Attention (At), calibrated Dwell Time proxy (Dw), and Emotion (Em) may be normalized and oriented to [0, 1]. Dwell Time is retained only as a contextual proxy because it can indicate interest, congestion, or confusion depending on zone and task.
-
Mapped KPIs. Feedback (Fe), Odd behavior (Od), Person counting (Pe), Sentiment (Se), and Conversation (Co) are initially returned as labels, counts, or event outputs (e.g., “applause”, “running”, “positive”, “discussion”). These outputs require validated utility mappings or explicitly documented provisional expert-defined utility tables before contributing to the mapped behavior and satisfaction components, B d and S d , defined below. The Feedback head is treated as a proxy-feedback head for observable response events from sound-event cues such as speech, pauses, and applause, optionally fused with spatial context in future microphone-array deployments [35]. Validated feedback labels or staff/survey confirmation are still required before interpreting it as a stand-level feedback KPI. The Odd Behavior head combines an autoencoder-based reconstruction score with a discriminative classifier [17,27].
-
Spatial map KPIs. Density Maps (Dm) and spatialized Motion Patterns (Mo) are represented as 2D spatial arrays. The Density Map head employs CSRNet-style convolutions with count regression to generate continuous density surfaces [8]. The Motion-Pattern head performs multi-label activity classification on temporally extended features [23,34]; it enters the spatial component only after its outputs are converted into a declared spatial activity-intensity map M Mo . In deployments without a declared M Mo , Mo is excluded from the displayed composite unless a deployment-specific mapped Motion Patterns variant u Mo and corresponding candidate set are explicitly declared. These maps are not used directly as scalar KPIs; they are reduced by predefined map summaries and combined into the spatial behavior component B m defined below.
-
Metrics general computation. The following equations define a bounded linear aggregation scheme for the proposed architecture, not an empirically validated scoring model. Let W denote a time window and z a spatial scope, such as the full stand or a specific zone. For each calibrated scalar KPI, let x j ( W , z ) [ 0 , 1 ] denote the corresponding primitive estimate. For categorical, count, or event-label outputs, let u j ( y j ; W , z ) [ 0 , 1 ] denote a validated or explicitly provisional utility mapping from the raw head output y j to a scalar score. For spatial maps, let a j ( M j ; W , z ) [ 0 , 1 ] denote a predefined map summary, such as a zone-weighted mean, percentile, or normalized integral. Every x j , u j , and a j must be oriented so that larger values carry more favorable evidence for the target construct; adverse or non-monotonic raw outputs require an explicit transformation before aggregation.
All quantities x j ( W , z ) , u j ( y j ; W , z ) , and a j ( M j ; W , z ) denote calibrated outputs generated by the Layer-5 analytics heads described above; they are therefore inputs to the aggregation framework defined by the following equations, not raw sensor observations. For any aggregation layer with candidate index set I , active subset A ( W , z ) I , calibrated child scores q i ( W , z ) [ 0 , 1 ] , and non-negative nominal weights ρ i satisfying i I ρ i = 1 , define
Agg ρ , A ( q ; W , z ) = i A ( W , z ) ρ i q i ( W , z ) i A ( W , z ) ρ i , A ( W , z ) , i A ( W , z ) ρ i > 0 .
If the active subset is empty, or if its retained nominal weight is zero, the aggregate is reported as unavailable rather than imputed. This same rule is applied recursively to KPI groups, behavior, and satisfaction components, and the final integrated score.
The KPI groups used by the aggregation are B c = { Con , Com , En , Re , So } ,   S c = { At , Dw , Em } ,   B d = { Fe , Od , Pe } ,   S d = { Se , Co } , and B m = { Dm , Mo } . Here, B c and S c contain continuous behavior and satisfaction KPIs, B d and S d contain mapped label, count, or event outputs, and B m contains spatial-map outputs. Let A B c , A S c , A B d , A S d , and A B m denote the available calibrated terms in those groups for ( W , z ) .
The continuous behavior and satisfaction components are B c ( W , z ) = Agg α , A B c ( x ; W , z ) , and S c ( W , z ) = Agg β , A S c ( x ; W , z ) , where α j and β j are non-negative nominal weights that each sum to one over their full candidate groups. The mapped behavior and satisfaction components are B d ( W , z ) = Agg t a , A B d ( u ; W , z ) , and S d ( W , z ) = Agg η , A S d ( u ; W , z ) , with non-negative nominal weights t a j and η j summing to one over their respective candidate groups. The spatial behavior component is obtained by summarizing the density map and motion-pattern maps: B m ( W , z ) = Agg λ , A B m ( a ; W , z ) , where λ j are non-negative nominal weights summing to one over B m .
For the next layer, let q c B = B c , q d B = B d , q m B = B m , and let A B ( W , z ) { c , d , m } contain the available child components. Similarly, let q c S = S c , q d S = S d , A S ( W , z ) { c , d } , and q B I = B , q S I = S , A I ( W , z ) { B , S } . The overall behavior, satisfaction, and integrated stand scores are then
B ( W , z ) = Agg θ , A B ( q B ; W , z ) ,
S ( W , z ) = Agg ϕ , A S ( q S ; W , z ) ,
and
SMBSA ( W , z ) = Agg ω , A I ( q I ; W , z ) ,
where θ , ϕ , and ω are non-negative nominal weights that each sum to one over their full candidate layers.
Under these constraints, every computed component score and SMBSA ( W , z ) is a convex combination of calibrated [0, 1] quantities and is therefore bounded in [0, 1]. Missing modalities should not be treated as zero-valued evidence. Scores computed from different active subsets should report coverage and should not be compared with fully observed scores unless missingness, degraded-mode behavior, and measurement invariance have been validated for the deployment. Values near 0, 0.5, or 1 are meaningful only after primitive KPI calibration, weight validation, missing-data policy validation, and construct-specific ground truth; before that validation, they denote intended utility/index semantics rather than measured performance, interval-scale meaning, or ratio-scale meaning. If non-linear learned functions replace the linear, their outputs must be fitted and validated as calibrated [0, 1] scores; a bounded activation, such as a sigmoid, is not by itself calibration.
Because KPI values are time-varying, some primitive perception heads can be estimated per frame, whereas operational outcomes such as Conversion, Commitment, Retention, and Dwell Time require explicit window, session, event, denominator, and attribution rules. Window-level estimates should be obtained by applying predefined aggregators, such as normalized sums, means, rates, percentiles, or time-weighted scores, and then transforming them into calibrated [0, 1] utility scores before applying the same scoring equations. Some KPI components, such as engagement and attention, with arousal used inside the engagement model, have already been explored by this manuscript’s authors using RGB-D sensors and are available at [92]; however, the full SMBSA composite still requires calibration, ablation, missing-data validation, and deployment validation.
It is also important to stress that the scope of this formulation is deliberately bounded. Estimation of the individual KPIs from sensor observations is performed by the 15 analytics heads specified above, each instantiated by the cited state-of-the-art estimators; the equations treat the primitive estimates x j ( W , z ) as the calibrated outputs of these replaceable modules, so that heads can be substituted as the state of the art evolves, without altering the aggregation framework. The utility transformations u j and the nominal weights ( ρ , α , β , t a , η , λ , θ , ϕ , ω ) are not derived here, because no stand-level ground truth exists in the reviewed corpus against which they could be legitimately fitted. Instead, the intended derivation procedure is specified: utility mappings are to be obtained by monotone calibration against consented ground-truth labels where available, and otherwise by documented, versioned, expert-defined provisional tables; nominal weights are initialized by equal weighting within each candidate group or by documented expert elicitation, and are to be re-estimated by constrained optimization against outcome labels once event-venue validation data exist. The equations, therefore, specify the part of the framework that can be fixed by design, the bounded, coverage-aware aggregation with explicit unavailability semantics, while estimation and calibration are empirical matters assigned to the staged validation agenda.

3.2. Pipeline

Figure 2 shows an illustrative, non-validated stand layout and one possible sensor-placement hypothesis. In this configuration, two RGB-D cameras would be mounted at the upper left and upper right corners of the stand (red markers), providing broad coverage of visitor motion and interactions subject to field-of-view and occlusion analysis. A ceiling-mounted microphone would be placed near the center of the stand (black marker) to capture acoustic cues such as speech activity and feedback events. A thermal camera would be oriented towards the service desk (green marker) to support occupancy and constrained affect cues in the interaction zone. Two or three mmWave radar units would be installed above the display areas (blue markers), covering the projector and shelf regions to capture presence, counting, zone motion, and interaction or micro-motion cues under low-to-moderate group density. Finally, a LiDAR sensor would be mounted on a side wall (yellow marker) to obtain a stand-wide 3D view for counting and spatial mapping.
Figure 1 (right, “Pipeline”) summarizes a possible practical example of a two-branch, on-device processing workflow using the scenario presented in Figure 2. In the first branch, on the left (Edge-AI board), the system would process the RGB-D, microphone-array (audio), and LiDAR streams. After local preprocessing, including frame synchronization (RGB-D), beamforming and feature extraction (audio), and background filtering/voxelization (LiDAR), the pipeline would extract stand-level descriptors such as person detections and tracks, movement patterns, and attention/density heatmaps. Behavior and satisfaction KPIs would then be computed and aggregated over short time windows to support real-time monitoring, subject to validation of edge latency, concurrent stream throughput, model precision, and degraded-mode operation. The intended privacy-by-design pattern is to discard raw frames and raw audio after feature extraction and retain only short-lived pseudonymous trajectory identifiers when needed for short-horizon tracking.
In the second branch, on the right (Edge-AI or laptop), the pipeline would process thermal and mmWave sensors with a zone-centric focus. Thermal sensing is oriented towards the desk/meeting area to support occupancy and constrained affect-related cues; interpreting these cues as sentiment or satisfaction would require stand-specific labels. mmWave radar covers the shelves/display area to capture presence, counting, zone motion, and candidate interaction cues; hesitation and micro-gesture semantics would likewise require stand-specific annotation. Both branches would communicate to fuse sensor information for the KPIs and metrics.
The architecture is intended to support KPI computation at multiple spatial scopes: both for the entire stand and separately for specific zones (desk and shelves), enabling more targeted analytics. In the proposed deployment pattern, only aggregated KPI values would be delivered to local interfaces (dashboard/AR) and, when required, transmitted securely to the cloud via encrypted channels. Raw sensor data that could be personal or biometric is intended to remain on the Edge-AI device and be deleted after KPI processing.
Regulatory substantiation and limits. A deployable SMBSA system would require a documented data-flow inventory covering each sensor stream, local preprocessing stage, retained feature, KPI output, and any cloud transfer. Raw RGB frames, audio waveforms, and other biometric or potentially identifying signals should have explicit retention and deletion rules, with default local deletion after feature extraction unless a lawful basis and ethics approval justify retention. Any deployment should document the assumed lawful basis, signage and transparency notices, data-minimization choices, access controls, encryption, audit logging, and edge/cloud boundaries. Because emotion recognition, biometric inference, and behavioral profiling can trigger heightened GDPR and EU AI Act scrutiny [4,5], the architecture should be treated as a privacy-aware design pattern rather than a compliance guarantee.
Under GDPR (at the time of submission of this article) Article 35(7), a Data Protection Impact Assessment (DPIA) for an SMBSA deployment would need to document at minimum: (i) a systematic description of the processing operations, consistent with the per-sensor, per-KPI data-flow inventory required above; (ii) an assessment of the necessity and proportionality of each sensor modality relative to its target KPIs, for which Table 4 provides a traceable evidentiary basis (e.g., justifying whether full RGB capture, versus a depth-only or feature-only pathway, is necessary for a given construct); (iii) an assessment of risks to data subjects’ rights and freedoms, including re-identification risk from short-horizon trajectory linkage and the sensitivity of inferred affective states; and (iv) the mitigation measures envisaged, such as pseudonymization, local deletion after feature extraction, access controls, and the confidence-weighted missing-modality handling specified in Layer 4 (Section 3.1). Independently of the DPIA, where a deployment infers emotions or satisfaction from biometric data, it falls within the EU AI Act’s definition of an emotion-recognition system (Article 3(39)), which triggers an exposed-person transparency obligation under Article 50, separate from GDPR transparency duties. Emotion recognition in workplace or education settings is subject to the prohibition in Article 5(1)(f), subject to narrow medical or safety exemptions, requiring dedicated screening whenever a stand deployment is co-located with such settings; deployments outside this prohibition may still fall under the Annex III high-risk category, triggering conformity assessment, logging, and human-oversight obligations beyond the DPIA.
This paper does not resolve these questions for any specific deployment. Article 5 applicability and Annex III classification or any other specific legislation and jurisdiction-specific determinations requires dedicated legal counsel, and a concrete deployment would still require a security assessment and legal classification of the intended use case in addition to the DPIA outlined above.

4. Conclusions and Future Work

This work reviewed a 60-paper design corpus from 2022 to 2026 and used selected benchmark/context references to examine whether current multimodal sensing research can support live-stand behavior and satisfaction analytics. The reviewed corpus shows that RGB-D, thermal cameras, LiDAR, mmWave radar, microphone arrays, and multimodal fusion can support selected primitives, including counting, density estimation, motion analysis, engagement cues, and constrained affect or sentiment inference. It does not yet demonstrate an integrated stand deployment that jointly validates all proposed KPIs, real-time operation, robustness under event conditions, and privacy-by-design requirements.
The Stand Multimodal Behavior and Satisfaction Analysis (SMBSA) architecture was proposed as a synthesis-derived reference architecture for this unresolved deployment problem. It organizes the system into five layers: sensor acquisition, preprocessing and calibration, modality-specific perception, hierarchical fusion, and KPI-specific analytics heads. Its five-modality design, confidence-aware fusion, privacy-risk-reducing fallback paths, and bounded composite score are intended to make the assumptions of stand analytics explicit. They are not, at this stage, empirical proof of end-to-end performance.
It is important to stress how SMBSA differs from previously published multimodal reference architectures. The sensing and fusion components used within SMBSA are drawn from established literature (Section 2) and are not claimed as novel in isolation. The contribution lies in four design decisions not jointly present, to our knowledge, in prior multimodal reference architectures: (i) jointly targeting five heterogeneous modalities, real-time operation, and privacy-by-design constraints for live-stand analytics, unlike vision-only audience-analysis architectures [57], surveys without a concrete architecture [90], or urban-space design architectures [40]; (ii) a typed taxonomy of the 15 KPIs (continuous, mapped, spatial-map); (iii) a coverage-aware bounded aggregation formalism that reports missing evidence as unavailable rather than imputed; and (iv) an evidence-traceable link between the KPI-by-sensor mapping (Table 4) and the sensor-fallback and regulatory-substantiation decisions. SMBSA remains a synthesis-derived reference architecture whose configuration requires empirical validation before any performance claim.
In summary, the principal scientific contribution of this work lies in the integration of heterogeneous sensing modalities into a deployment-oriented, privacy-aware reference architecture, together with its typed KPI taxonomy, coverage-aware aggregation formalism, and evidence-traceable design decisions, rather than in the proposal of new sensing algorithms.
Future work should proceed as a staged validation agenda. The first priority is a public, naturalistic multi-sensor event dataset with tiered annotations, beginning with core behavioral labels and extending to satisfaction self-reports and operational outcomes. In parallel, the generation and public release of a stand-specific synthetic multimodal corpus, built with the simulation methodology outlined in Section 2.5, is a concrete next step of the AI.INSIGHTS project, supplying behavioral pretraining data and exact benchmarking ground truth ahead of consented real-world campaigns. KPI mappings should then be validated against ground truth, especially for Feedback, Conversion, Retention, and Commitment, where the current evidence is mostly proxy-based. Fusion should be benchmarked against strong unimodal baselines under modality dropout, occlusion, lighting variation, acoustic noise, latency limits, and mmWave crowding. Privacy-utility trade-offs should be quantified when RGB or raw audio is removed, minimized, pseudonymized, or replaced by depth, LiDAR, radar, thermal, or feature-only representations.

Supplementary Materials

The following supporting information can be downloaded at: https://www.mdpi.com/article/10.3390/app16147286/s1, Section S1. Search Design and Corpus Construction. Section S2. Corpus Boundary and Interpretation. Section S3. Fusion Strategy, Satisfaction Inference, and Algorithm Families. Table S1. Search-term matrix and execution settings. Table S2. Reviewed-corpus methods for behavior and satisfaction sensing. Table S3. Selected contextual dataset resources for behavior and satisfaction sensing. Table S4. Fusion strategy frequency across the reviewed literature. Table S5. Satisfaction inference approaches. Table S6. Most frequently used algorithm families (counts cover both behavior and satisfaction papers).

Author Contributions

Conceptualization, A.W. and D.S.; methodology, A.W. and D.S.; formal analysis, A.W., D.S. and J.M.F.R.; investigation, A.W. and D.S.; resources, A.W. and D.S.; data curation, A.W. and D.S.; validation, J.A.M., P.J.S.C. and J.M.F.R.; writing—original draft preparation, A.W. and D.S.; writing—review and editing, J.A.M., P.J.S.C. and J.M.F.R.; visualization, A.W. and D.S.; supervision, J.M.F.R.; project administration, J.M.F.R.; funding acquisition, J.M.F.R., A.W. and D.S. contributed equally to this work. All authors have read and agreed to the published version of the manuscript.

Funding

This work is supported by UID/04516/2025 Laboratory for Computer Science and Informatics (NOVA LINCS) with the financial support of FCT.IP, and by the project AI.INSIGHTS: AI-Powered Real-Time Anonymous User Echo Monitoring (ALGARVE-FEDER-02964500, Ref. 24298) co-financed by ALGARVE 2030, Portugal 2030, and by the European Union.

Institutional Review Board Statement

Not applicable to this review because no new human-participant or sensor data were collected, generated, or processed for this manuscript.

Informed Consent Statement

Not applicable to this review because no new human-participant data were collected or processed for this manuscript.

Data Availability Statement

No new human-participant, sensor, or experimental datasets were generated or analyzed. This review analyses a literature corpus and selected contextual dataset resources; the reviewed studies are cited in the manuscript, and the search terms and corpus-selection limitations are described in Section 2.1. The database-specific query-result lists, deduplication decisions, screening notes, and citation-level coding records were internal working records and are not deposited.

Acknowledgments

The authors acknowledge institutional support from Universidade do Algarve and NOVA LINCS. During the preparation of this manuscript, the authors used M365 Copilot for English-language editing and sentence-level polishing. Qwen3.6 was used to generate the illustrative stand mock-up images shown in Figure 2. OpenAI Codex (GPT-5.5-xhigh) was used during manuscript revision to assist with LaTeX editing and wording audits. AI-assisted tools were not used to select, screen, or code the literature corpus. The authors reviewed and edited the AI-assisted outputs and take full responsibility for the content of this publication.

Conflicts of Interest

The authors declare no conflicts of interest. The funders had no role in the design of the study; in the collection, analyses, or interpretation of data; in the writing of the manuscript; or in the decision to publish the results.

Abbreviations

The following abbreviations are used in this manuscript:
1D/2D/3DOne/two/three-dimensional
AIArtificial Intelligence
CNNConvolutional Neural Network
FOAFocus of Attention
HOTAHigher Order Tracking Accuracy
GDPRGeneral Data Protection Regulation
IECInternational Electrotechnical Commission
ISOInternational Standardization Organization
KPIkey performance indicators
PCAPrincipal Component Analysis
RGB-DRed, Green, Blue - Depth sensor/camera
ROIReturn on Investment
RoIRegion of Interest
SMBSAStand Multimodal Behavior and Satisfaction Analysis

References

  1. Bloch, P.H.; Gopalakrishna, S.; Crecelius, A.T.; Murarolli, M.S. Exploring booth design as a determinant of trade show success. J. Bus. Bus. Mark. 2017, 24, 237–256. [Google Scholar] [CrossRef]
  2. Ramos, C.M.Q.; Rodrigues, J.M.F. SNUX2.0: A Social Network Model for Cohort Behaviour Analysis as Support for Purchasing Tourism Products and Services. J. Relatsh. Mark. 2023, 22, 132–151. [Google Scholar] [CrossRef]
  3. Sun, D.; Xue, M.; Zhao, Y. Identifying and controlling key factors in exhibition effect: A hybrid method combining Best-Worst Method and regression models. Front. Commun. 2025, 10, 1670964. [Google Scholar] [CrossRef]
  4. European Parliament and Council of the European Union. Regulation (EU) 2016/679 of the European Parliament and of the Council of 27 April 2016 on the protection of natural persons with regard to the processing of personal data and on the free movement of such data (General Data Protection Regulation). Off. J. Eur. Union 2016, L 119, 1–88. Available online: http://data.europa.eu/eli/reg/2016/679/oj (accessed on 10 July 2026). [CrossRef]
  5. European Parliament and Council of the European Union. Regulation (EU) 2024/1689 of the European Parliament and of the Council of 13 June 2024 laying down harmonised rules on artificial intelligence (Artificial Intelligence Act). Off. J. Eur. Union 2024, L Series, 2024/1689. Available online: http://data.europa.eu/eli/reg/2024/1689/oj (accessed on 10 July 2026).
  6. Pei, G.; Li, H.; Lu, Y.; Wang, Y.; Hua, S.; Li, T. Affective computing: Recent advances, challenges, and future trends. Intell. Comput. 2024, 3, 0076. [Google Scholar] [CrossRef]
  7. Morshed, M.G.; Sultana, T.; Alam, A.; Lee, Y.K. Human action recognition: A taxonomy-based survey, updates, and opportunities. Sensors 2023, 23, 2182. [Google Scholar] [CrossRef] [PubMed]
  8. Wang, M.; Zhou, X.; Chen, Y. A comprehensive survey of crowd density estimation and counting. IET Image Process. 2025, 19, e13328. [Google Scholar] [CrossRef]
  9. Rodrigues, J.M.F.; Pereira, J.A.R.; Sardo, J.D.P.; Freitas, M.A.G.; Cardoso, P.J.S.; Gomes, M.; Bica, P. Adaptive Card Design UI Implementation for an Augmented Reality Museum Application. In Proceedings of the Universal Access in Human–Computer Interaction. Design and Development Approaches and Methods. UAHCI 2017; Lecture Notes in Computer Science; Springer International Publishing: Cham, Switzerland, 2017; Volume 10277, pp. 433–443. [Google Scholar] [CrossRef]
  10. Standard ISO 9241-11:2018; Ergonomics of Human-System Interaction—Part 11: Usability: Definitions and Concepts. International Organization for Standardization: Geneva, Switzerland, 2018. Available online: https://www.iso.org/standard/63500.html (accessed on 10 July 2026).
  11. Abdelrahman, A.A.; Strazdas, D.; Khalifa, A.; Hintz, J.; Hempel, T.; Al-Hamadi, A. Multimodal Engagement Prediction in Multiperson Human-Robot Interaction. IEEE Access 2022, 10, 61980–61991. [Google Scholar] [CrossRef]
  12. Navarro, R.C.; Ruiz, A.R.; Molina, F.J.; Romero, M.J.; Chaparro, J.D.; Alises, D.V.; Lopez, J.C. Indoor occupancy estimation for smart utilities: A novel approach based on depth sensors. Build. Environ. 2022, 222, 109406. [Google Scholar] [CrossRef]
  13. Khaire, P.; Kumar, P. A semi-supervised deep learning based video anomaly detection framework using RGB-D for surveillance of real-world critical environments. Forensic Sci. Int. Digit. Investig. 2022, 40, 301346. [Google Scholar] [CrossRef]
  14. Kajendran, K.; Mayan, J.A. Recognition and detection of unusual activities in ATM using dual-channel capsule generative adversarial network. Expert Syst. Appl. 2024, 247, 122987. [Google Scholar] [CrossRef]
  15. Abed, A.; Akrout, B.; Amous, I. Convolutional Neural Network for Head Segmentation and Counting in Crowded Retail Environment Using Top-view Depth Images. Arab. J. Sci. Eng. 2024, 49, 3735–3749. [Google Scholar] [CrossRef]
  16. Mishima, Y.; Matsui, T.; Matsuda, Y.; Suwa, H.; Yasumoto, K. Micro Activity Recognition Using Multi-View 3D Point Clouds. In Proceedings of the 2024 IEEE International Conference on Pervasive Computing and Communications Workshops and Other Affiliated Events, PerCom Workshops 2024; Institute of Electrical and Electronics Engineers Inc.: Piscataway, NJ, USA, 2024; pp. 453–456. [Google Scholar] [CrossRef]
  17. Cao, J.; Zhou, K.; Du, J. HyPCV-Former: Hyperbolic spatio-temporal transformer for 3D point cloud video anomaly detection. Adv. Eng. Inform. 2026, 73, 104537. [Google Scholar] [CrossRef]
  18. Kim, G.Y.; Ko, E.S.; Kim, D.R.; Kim, J.E.; Hindsley, D.; Matson, E.T. Real-Time Crowd Density Estimation and Stampede Risk Assessment System Using Thermal Camera. In Proceedings of the Proceedings—2024 8th IEEE International Conference on Robotic Computing, IRC 2024; IEEE: Piscataway, NJ, USA, 2024. [Google Scholar] [CrossRef]
  19. Hishida, R.; Iryo, M.; Alhamdani, R.; Mano, K.; Yamaguchi, Y. Development of Methods for High-Density Crowd Measurement and Tracking in Railway Station Concourses. Int. J. Intell. Transp. Syst. Res. 2026; early access. [CrossRef]
  20. Wu, Z.; Cao, Z.; Yu, X.; Zhu, J.; Song, C.; Xu, Z. A Novel Multiperson Activity Recognition Algorithm Based on Point Clouds Measured by Millimeter-Wave MIMO Radar. IEEE Sens. J. 2023, 23, 19509–19523. [Google Scholar] [CrossRef]
  21. Canil, M.; Pegoraro, J.; Shastri, A.; Casari, P.; Rossi, M. ORACLE: Occlusion-Resilient and Self-Calibrating mmWave Radar Network for People Tracking. IEEE Sens. J. 2024, 24, 3157–3171. [Google Scholar] [CrossRef]
  22. Martin-Martin, A.; Verona-Almeida, M.; Padial-Allue, R.; Saez, B.; Mendez, J.; Castillo, E.; Parrilla, L. Spiking Neural Networks for People Counting Based on FMCW Radar. IEEE Access 2025, 13, 60846–60858. [Google Scholar] [CrossRef]
  23. Zhang, F.; Sun, H.; Peng, J.; Wang, H. LPBS-Net: A Lightweight Network for Human Activity Recognition from Sparse Millimeter-Wave Radar Point Clouds. IEEE Sens. Lett. 2025, 9, 6012704. [Google Scholar] [CrossRef]
  24. Zhang, N.; Li, H.; Zahid, A.; Tian, Y.; Li, W. A Robust mmWave Radar Framework for Accurate People Counting and Motion Classification. Sensors 2026, 26, 1289. [Google Scholar] [CrossRef] [PubMed]
  25. Roche, J.; De-Silva, V.; Hook, J.; Moencks, M.; Kondoz, A. A Multimodal Data Processing System for LiDAR-Based Human Activity Recognition. IEEE Trans. Cybern. 2022, 52, 10027–10040. [Google Scholar] [CrossRef] [PubMed]
  26. Zhang, X.; Li, Z.; Zhang, J. Synthesized Millimeter-Waves for Human Motion Sensing. In Proceedings of the SenSys 2022—Proceedings of the 20th ACM Conference on Embedded Networked Sensor Systems; Association for Computing Machinery: New York, NY, USA, 2022. [Google Scholar] [CrossRef]
  27. Nguyen, V.A.; Kong, S.G. Multimodal feature fusion for illumination-invariant recognition of abnormal human behaviors. Inf. Fusion 2023, 100, 101949. [Google Scholar] [CrossRef]
  28. Cheng, P.; Xiong, Z.; Bao, Y.; Zhuang, P.; Zhang, Y.; Blasch, E.; Chen, G. A Deep Learning-Enhanced Multi-Modal Sensing Platform for Robust Human Object Detection and Tracking in Challenging Environments. Electronics 2023, 12, 3423. [Google Scholar] [CrossRef]
  29. Tu, V.N.; Huynh, V.T.; Yang, H.J.; Kim, S.H.; Nawaz, S.; Nandakumar, K.; Zaheer, M.Z. DCTM: Dilated Convolutional Transformer Model for Multimodal Engagement Estimation in Conversation. In Proceedings of the MM 2023—Proceedings of the 31st ACM International Conference on Multimedia; Association for Computing Machinery: New York, NY, USA, 2023. [Google Scholar] [CrossRef]
  30. Shafizadegan, F.; Naghsh-Nilchi, A.R.; Shabaninia, E. Multimodal vision-based human action recognition using deep learning: A review. Artif. Intell. Rev. 2024, 57, 178. [Google Scholar] [CrossRef]
  31. Kamra, V.; Vaishnav, A.; Verma, A.; Khan, R.; Singh, S. A Novel Approach for Crowd Analysis and Density Estimation by Using Machine Learning Techniques. In Proceedings of the 2024 International Conference on Intelligent Systems for Cybersecurity, ISCS 2024; Institute of Electrical and Electronics Engineers Inc.: Piscataway, NJ, USA, 2024. [Google Scholar] [CrossRef]
  32. Mu, B.; Shao, F.; Xie, Z.; Chen, H.; Jiang, Q.; Ho, Y.S. Visual Prompt Multibranch Fusion Network for RGB-Thermal Crowd Counting. IEEE Internet Things J. 2024, 11, 31758–31775. [Google Scholar] [CrossRef]
  33. She, X.; Xu, Z. Human Abnormal Behavior Detection Based on Multimodal Data Fusion. In Proceedings of the 2nd IEEE International Conference on Data Science and Network Security, ICDSNS 2024; IEEE: Piscataway, NJ, USA, 2024. [Google Scholar] [CrossRef]
  34. Tsiktsiris, D.; Lalas, A.; Dasygenis, M.; Votis, K. Multimodal Abnormal Event Detection in Public Transportation. IEEE Access 2024, 12, 133469–133480. [Google Scholar] [CrossRef]
  35. Vrochidis, A.; Dimitriou, N.; Krinidis, S.; Panagiotidis, S.; Parcharidis, S.; Tzovaras, D. A Deep Learning Framework for Monitoring Audience Engagement in Online Video Events. Int. J. Comput. Intell. Syst. 2024, 17, 124. [Google Scholar] [CrossRef]
  36. Shin, J.; Hassan, N.; Miah, A.S.M.; Nishimura, S. A Comprehensive Methodological Survey of Human Activity Recognition Across Diverse Data Modalities. Sensors 2025, 25, 4028. [Google Scholar] [CrossRef] [PubMed]
  37. Chen, X.; Yang, J. X-FI: A Modality-Invariant Foundation Model for Multimodal Human Sensing. In Proceedings of the 13th International Conference on Learning Representations, ICLR 2025; OpenReview: Alameda, CA, USA, 2025; Available online: https://openreview.net/forum?id=b42wmsdwmB (accessed on 10 July 2026).
  38. Lei, L. The artificial intelligence technology for immersion experience and space design in museum exhibition. Sci. Rep. 2025, 15, 27317. [Google Scholar] [CrossRef] [PubMed]
  39. Xu, B. IoT-based multimodal learning framework for predicting student engagement in English education. In Proceedings of the Second International Conference on Intelligent Transportation and Smart Cities (ICITSC 2025); Li, Y., Mezhuyev, V., Li, Z., Eds.; SPIE: Bellingham, WA, USA, 2025; p. 109. [Google Scholar] [CrossRef]
  40. Liu, X. AI-driven real-time responsive design of urban open spaces based on multi-modal sensing data fusion. Sci. Rep. 2025, 15, 41255. [Google Scholar] [CrossRef] [PubMed]
  41. Jeon, M.; Woo, S. A Lightweight Radar–Camera Fusion Deep Learning Model for Human Activity Recognition. Sensors 2026, 26, 894. [Google Scholar] [CrossRef] [PubMed]
  42. Devi, H.; Kumar, P.; Govindarajan, V.; Kumar, S.; Lohano, R.; Hitesh, H.; Shiwlani, A. A Comparative Study of Classical Machine Learning and Deep Learning Approaches for Human Behavior Detection Using Multisensor Data. IEEE Access 2026, 14, 25311–25325. [Google Scholar] [CrossRef]
  43. Vaz, P.J.; Rodrigues, J.M.F.; Cardoso, P.J.S. Affective Computing Emotional Body Gesture Recognition: Evolution and the Cream of the Crop. IEEE Access 2025, 13, 192871–192890. [Google Scholar] [CrossRef]
  44. S, N.P.; Koti, M.S.; G, T.K.; Anwar, S.; J, G.B.; Thinakaran, R. Real Time Customer Satisfaction Analysis using Facial Expressions and Headpose Estimation. Int. J. Adv. Comput. Sci. Appl. 2022, 13, 231–238. [Google Scholar] [CrossRef]
  45. Yusupova, N.I.; Bogdanova, D.R.; Nuriakhmetov, A.I. Assessing the Quality of Customer Service Based on the Emotional Satisfaction of Clients Using Artificial Immune System Technologies. Pattern Recognit. Image Anal. 2023, 33, 544–554. [Google Scholar] [CrossRef]
  46. Kwon, D.H.; Yu, J.M. Real-time Multi-CNN-based Emotion Recognition System for Evaluating Museum Visitors’ Satisfaction. J. Comput. Cult. Herit. 2024, 17, 1–18. [Google Scholar] [CrossRef]
  47. Gangan, H.A.; Rohani, M.; Hosseini, S.A.; Mansouri, A. Detection of Customer Satisfaction in In-Person Telecommunication Services Using Automated Facial Image Analysis with Artificial Intelligence. In Proceedings of the 11th International Symposium on Telecommunication: Communication in the Age of Artificial Intelligence, IST 2024; Institute of Electrical and Electronics Engineers Inc.: Piscataway, NJ, USA, 2024; pp. 485–490. [Google Scholar] [CrossRef]
  48. Harianto, D.; Filbert, S.; Cahyakusuma, A.B.; Zakiyyah, A.Y. Analyzing Customer Satisfaction Through Face Emotion Recognition: A Comparative Study of Convolutional Neural Networks (CNN) and Long Short Term Memory (LSTM). In Proceedings of the 2024 10th International Conference on Smart Computing and Communication, ICSCC 2024; Institute of Electrical and Electronics Engineers Inc.: Piscataway, NJ, USA, 2024; pp. 50–54. [Google Scholar] [CrossRef]
  49. Alhasson, H.F.; Alsaheel, G.M.; Alsalamah, A.A.; Alharbi, N.S.; Alhujilan, J.M.; Alharbi, S.S. Integration of machine learning bi-modal engagement emotion detection model to self-reporting for educational satisfaction measurement. Int. J. Inf. Technol. 2024, 16, 3633–3647. [Google Scholar] [CrossRef]
  50. Zhang, J.; Sato, W.; Kawamura, N.; Shimokawa, K.; Tang, B.; Nakamura, Y. Sensing emotional valence and arousal dynamics through automated facial action unit analysis. Sci. Rep. 2024, 14, 19563. [Google Scholar] [CrossRef] [PubMed]
  51. Karthikayani; Nithya, A.R.; Bhattacharya, C.; Saraswathi, C.; Prasanna, S.S.; Nandhini, M. Predicting Faculty Emotions and Job Satisfaction from Facial Expressions in Higher Education Using CNN-SVM Models. In Proceedings of the 2025 Global Conference in Emerging Technology, GINOTECH 2025; Institute of Electrical and Electronics Engineers Inc.: Piscataway, NJ, USA, 2025. [Google Scholar] [CrossRef]
  52. Lin, K.C.; Lin, Y.H.; Chen, M.Y. A Realtime Classroom Assessment System for Analysis of Students’ Evaluation of Teaching Through a Deep Learning and Emotional Contagion Mechanism. Int. J. Interact. Multimed. Artif. Intell. 2025, 9, 51–59. [Google Scholar] [CrossRef]
  53. Sang, T.V.D.; Hoan, N.N.; Tung, L.C.; Thu, N.T.A.; Tuan, P.V. Proposed Machine Learning Approach To Measure Nonverbal Clues-Based Student Satisfaction In STEAM Maker Innovation Space. In Proceedings of the 2025 IEEE International Conference on Artificial Intelligence and Mechatronics Systems, AIMS 2025; Institute of Electrical and Electronics Engineers Inc.: Piscataway, NJ, USA, 2025. [Google Scholar] [CrossRef]
  54. Ma, C.; Zhao, S.; Zhou, D.; Pei, Y.; Luo, Z.; Xie, L.; Yan, Y.; Yin, E. MPFNet: A Multi-Prior Fusion Network with a Progressive Training Strategy for Micro-Expression Recognition. IEEE Trans. Affect. Comput. 2026, 17, 348–365. [Google Scholar] [CrossRef]
  55. Shi, M.; Zheng, W. Towards Identity-Independent Facial Action Unit Detection: Integrating Decoupled 3D Geometry with Textural Features. IEEE Trans. Affect. Comput. 2026, 17, 482–496. [Google Scholar] [CrossRef]
  56. Zhu, Q.; Mao, Q.; Dong, W.; Shao, X.; Huang, X.; Zheng, W. Adaptive Key Role Guided Hierarchical Relation Inference for Enhanced Group-level Emotion Recognition. IEEE Trans. Affect. Comput. 2026, 17, 366–378. [Google Scholar] [CrossRef]
  57. Lemos, M.; Cardoso, P.J.S.; Rodrigues, J.M.F. From Cues to Engagement: A Comprehensive Survey and Holistic Architecture for Computer Vision-Based Audience Analysis in Live Events. Multimodal Technol. Interact. 2026, 10, 8. [Google Scholar] [CrossRef]
  58. Assiri, B.; Hossain, M.A. Face emotion recognition based on infrared thermal imagery by applying machine learning and parallelism. Math. Biosci. Eng. 2023, 20, 913–929. [Google Scholar] [CrossRef] [PubMed]
  59. Rashmi, R.; Snekhalatha, U.; Salvador, A.L.; Raj, A.N.J. Facial emotion detection using thermal and visual images based on deep learning techniques. Imaging Sci. J. 2024, 72, 153–166. [Google Scholar] [CrossRef]
  60. Parra-Gallego, L.F.; Orozco-Arroyave, J.R. Classification of emotions and evaluation of customer satisfaction from speech in real world acoustic environments. Digit. Signal Process. Rev. J. 2022, 120, 103286. [Google Scholar] [CrossRef]
  61. Ko, Y.H.; Hsu, P.Y.; Liu, Y.C.; Yang, P.C. Confirming Customer Satisfaction with Tones of Speech. IEEE Access 2022, 10, 83236–83248. [Google Scholar] [CrossRef]
  62. Chawla, K.; Clever, R.; Ramirez, J.; Lucas, G.M.; Gratch, J. Towards Emotion-Aware Agents for Improved User Satisfaction and Partner Perception in Negotiation Dialogues. IEEE Trans. Affect. Comput. 2024, 15, 433–444. [Google Scholar] [CrossRef]
  63. Ganesan, S. Deep learning model for identification of customers satisfaction in business. J. Auton. Intell. 2024, 7, 1–11. [Google Scholar] [CrossRef]
  64. Parra-Gallego, L.F.; Arias-Vergara, T.; Orozco-Arroyave, J.R. Multimodal evaluation of customer satisfaction from voicemails using speech and language representations. Digit. Signal Process. Rev. J. 2025, 156, 104820. [Google Scholar] [CrossRef]
  65. Gan, C.; Zhou, D.; Zhu, Q.; Wang, X.; Jain, D.K.; Struc, V. Improving Emotion Recognition from Ambiguous Speech via Spatio-Temporal Spectrum Analysis and Real-Time Soft-Label Correction. IEEE Trans. Affect. Comput. 2026, 17, 1058–1073. [Google Scholar] [CrossRef]
  66. Perez-Toro, P.A.; Vasquez-Correa, J.C.; Bocklet, T.; Noth, E.; Orozco-Arroyave, J.R. User State Modeling Based on the Arousal-Valence Plane: Applications in Customer Satisfaction and Health-Care. IEEE Trans. Affect. Comput. 2023, 14, 1533–1546. [Google Scholar] [CrossRef]
  67. Maris, L.; Matsuda, Y.; Sadre, R.; Yasumoto, K. Towards Cheaper Tourists’ Emotion and Satisfaction Estimation with PCA and Subgroup Analysis. In Proceedings of the 2023 IEEE International Conference on Pervasive Computing and Communications Workshops and other Affiliated Events, PerCom Workshops 2023; Institute of Electrical and Electronics Engineers Inc.: Piscataway, NJ, USA, 2023; pp. 502–508. [Google Scholar] [CrossRef]
  68. Maheen, S.M.; Sultana, I.; Kshetri, N.; Zim, M.N.F. emoAIsec: Fortifying Real-Time Customer Experience Optimization with Emotion AI and Data Security. In Proceedings of the 2nd International Conference on Machine Learning and Autonomous Systems, ICMLAS 2025—Proceedings; Institute of Electrical and Electronics Engineers Inc.: Piscataway, NJ, USA, 2025; pp. 793–798. [Google Scholar] [CrossRef]
  69. Luo, Y.; Liu, W.; Sun, Q.; Li, S.; Li, J.; Wu, R.; Tang, X. TriagedMSA: Triaging Sentimental Disagreement in Multimodal Sentiment Analysis. IEEE Trans. Affect. Comput. 2025, 16, 1557–1569. [Google Scholar] [CrossRef]
  70. Brscic, D.; Kanda, T.; Ikeda, T.; Miyashita, T. Person Tracking in Large Public Spaces Using 3-D Range Sensors. IEEE Trans. Hum.-Mach. Syst. 2013, 43, 522–534. [Google Scholar] [CrossRef]
  71. Alameda-Pineda, X.; Staiano, J.; Subramanian, R.; Batrinca, L.; Ricci, E.; Lepri, B.; Lanz, O.; Sebe, N. SALSA: A novel dataset for multimodal group behavior analysis. IEEE Trans. Pattern Anal. Mach. Intell. 2016, 38, 1707–1720. [Google Scholar] [CrossRef] [PubMed]
  72. Zhang, Z.; Rhim, J.; TaherAhmadi, M.; Yang, K.; Lim, A.; Chen, M. SFU-store-nav: A multimodal dataset for indoor human navigation. Data Brief 2020, 33, 106539. [Google Scholar] [CrossRef] [PubMed]
  73. Ehsanpour, M.; Saleh, F.; Savarese, S.; Reid, I.; Rezatofighi, H. JRDB-Act: A Large-scale Dataset for Spatio-temporal Action, Social Group and Activity Detection. In Proceedings of the IEEE Computer Society Conference on Computer Vision and Pattern Recognition; IEEE Computer Society: Piscataway, NJ, USA, 2022; pp. 20951–20960. [Google Scholar] [CrossRef]
  74. An, S.; Li, Y.; Ogras, U. mRI: Multi-modal 3D Human Pose Estimation Dataset using mmWave, RGB-D, and Inertial Sensors. In Proceedings of the Advances in Neural Information Processing Systems, New Orleans, LA, USA, 28 November–9 December 2022; Volume 35. Available online: https://proceedings.neurips.cc/paper_files/paper/2022/hash/af9c9c6d2da701da5a0acf91ec217815-Abstract-Datasets_and_Benchmarks.html (accessed on 10 July 2026).
  75. Su, J.; Huang, J.; Qing, L.; He, X.; Chen, H. A new approach for social group detection based on spatio-temporal interpersonal distance measurement. Heliyon 2022, 8, e11038. [Google Scholar] [CrossRef] [PubMed]
  76. Martin-Martin, R.; Patel, M.; Rezatofighi, H.; Shenoi, A.; Gwak, J.Y.; Frankel, E.; Sadeghian, A.; Savarese, S. JRDB: A Dataset and Benchmark of Egocentric Robot Visual Perception of Humans in Built Environments. IEEE Trans. Pattern Anal. Mach. Intell. 2023, 45, 6748–6765. [Google Scholar] [CrossRef] [PubMed]
  77. Vendrow, E.; Le, D.T.; Cai, J.; Rezatofighi, H. JRDB-Pose: A Large-Scale Dataset for Multi-Person Pose Estimation and Tracking. In Proceedings of the 2023 IEEE/CVF Conference on Computer Vision and Pattern Recognition (CVPR); IEEE: Piscataway, NJ, USA, 2023; pp. 4811–4820. [Google Scholar] [CrossRef]
  78. Piadyk, Y.; Rulff, J.; Brewer, E.; Hosseini, M.; Ozbay, K.; Sankaradas, M.; Chakradhar, S.; Silva, C. StreetAware: A High-Resolution Synchronized Multimodal Urban Scene Dataset. Sensors 2023, 23, 3710. [Google Scholar] [CrossRef] [PubMed]
  79. Le, D.T.; Gou, C.; Datta, S.; Shi, H.; Reid, I.; Cai, J.; Rezatofighi, H. JRDB-PanoTrack: An Open-World Panoptic Segmentation and Tracking Robotic Dataset in Crowded Human Environments. In Proceedings of the 2024 IEEE/CVF Conference on Computer Vision and Pattern Recognition (CVPR); IEEE: Piscataway, NJ, USA, 2024; pp. 22325–22334. [Google Scholar] [CrossRef]
  80. Jahangard, S.; Cai, Z.; Wen, S.; Rezatofighi, H. JRDB-Social: A Multifaceted Robotic Dataset for Understanding of Context and Dynamics of Human Interactions Within Social Groups. In Proceedings of the 2024 IEEE/CVF Conference on Computer Vision and Pattern Recognition (CVPR); IEEE: Piscataway, NJ, USA, 2024; pp. 22087–22097. [Google Scholar] [CrossRef]
  81. Zhou, Y.; Song, N.; Ma, J.; Man, K.L.; López-Benítez, M.; Yu, L.; Yue, Y. RAV4D: A Radar-Audio-Visual Dataset for Indoor Multi-Person Tracking. In Proceedings of the IEEE Radar Conference; Institute of Electrical and Electronics Engineers Inc.: Piscataway, NJ, USA, 2024. [Google Scholar] [CrossRef]
  82. Gucsi, B.; Tuyen, N.T.V.; Chu, B.; Tarapore, D.; Tran-Thanh, L. HRI-SENSE: A Multimodal Dataset on Social and Emotional Responses to Robot Behaviour. In Proceedings of the ACM/IEEE International Conference on Human-Robot Interaction; IEEE: Piscataway, NJ, USA, 2025. [Google Scholar] [CrossRef]
  83. Abdrakhmanova, M.; Kuzdeuov, A.; Jarju, S.; Khassanov, Y.; Lewis, M.; Varol, H.A. Speakingfaces: A large-scale multimodal dataset of voice commands with visual and thermal video streams. Sensors 2021, 21, 3465. [Google Scholar] [CrossRef] [PubMed]
  84. Fard, A.P.; Hosseini, M.M.; Sweeny, T.D.; Mahoor, M.H. AffectNet+: A Database for Enhancing Facial Expression Recognition with Soft-Labels. IEEE Trans. Affect. Comput. 2026, 17, 784–800. [Google Scholar] [CrossRef]
  85. Gao, X.; Bansal, S.; Gowda, K.; Li, Z.; Nayak, S.; Kumar, N.; Coler, M. AMuSeD: An Attentive Deep Neural Network for Multimodal Sarcasm Detection Incorporating Bi-modal Data Augmentation. IEEE Trans. Affect. Comput. 2026, 17, 900–912. [Google Scholar] [CrossRef]
  86. Ji, Y.; Wang, S.; Xu, R.; Chen, J.; Quan, Y.; Jiang, X.; Deng, Z.; Liu, J. Hugging Rain Man: A Novel Facial Action Units Dataset for Analyzing Atypical Facial Expressions in Children with Autism Spectrum Disorder. IEEE Trans. Affect. Comput. 2025, 16, 2287–2302. [Google Scholar] [CrossRef]
  87. Guo, X.; Rodriguez, A.C.I.; Wang, C.; Rundensteiner, E.A.; Liu, S. DEPRESS: Dataset on Emotions, Performance, Responses, Environment, and Satisfaction during COVID-19. Sci. Data 2026, 13, 331. [Google Scholar] [CrossRef] [PubMed]
  88. Vaz, P.J.; Rodrigues, J.M.F.; Cardoso, P.J.S. Affective Computing Databases: In-Depth Analysis of Systematic Reviews and Surveys. IEEE Trans. Affect. Comput. 2025, 16, 537–554. [Google Scholar] [CrossRef]
  89. Wang, S.; Wu, W.; Li, Y.; Xu, Y.; Lyu, Y. MIANet: Bridging the Gap in Crowd Density Estimation with Thermal and RGB Interaction. IEEE Trans. Intell. Transp. Syst. 2025, 26, 254–267. [Google Scholar] [CrossRef]
  90. Sadiq, T.; Omlin, C.W. Sensing in Smart Cities: A Multimodal Machine Learning Perspective. Smart Cities 2026, 9, 3. [Google Scholar] [CrossRef]
  91. Altuwairqi, K.; Jarraya, S.K.; Allinjawi, A.; Hammami, M. Student behavior analysis to measure engagement levels in online learning environments. Signal Image Video Process. 2021, 15, 1387–1395. [Google Scholar] [CrossRef] [PubMed]
  92. Lemos, M.; Cardoso, P.J.; Rodrigues, J.M. MiE: A microscopic model for real-time group engagement estimation using gaze and posture. J. Comput. Sci. 2026, 96, 102856. [Google Scholar] [CrossRef]
Figure 1. SMBSA conceptual architecture (left) and processing pipeline (right), from multimodal sensing to KPI estimation and privacy-aware edge/cloud aggregation.
Applsci 16 07286 g001
Figure 2. Illustrative AI-generated stand mock-ups were used to show one possible sensor-placement scenario. The images were generated with Qwen3.6 and are not empirical evidence or a validated deployment layout.
Applsci 16 07286 g002
Table 1. Number of papers cited by sensor type in the Behavior and Satisfaction sections.
Sensor TypeBehaviorSatisfaction
RGB-D714
Thermal Cameras12
LiDAR10
mmWave Radar50
Microphone (Arrays)06 *
Multimodal204
Total3426
* Includes one work based solely on textual transcripts derived from spoken dialogues.
Table 2. Mapping of reviewed papers that directly address, or provide transferable proxy evidence for, the constructs (KPIs), with evidence tier shown for each construct (D = direct sensor-derived measurement; P = behavioral proxy; V = validation-dependent outcome; see text for tier explanation details).
Constructs (KPIs)References
Commitment (proxy) (V)[38,40]
Conversion (proxy) (V)[38,40]
Density Maps (D)[8,18,19,31,32,40,89]
Engagement (P)[11,29,35,38,39,40,57]
Feedback (single-source proxy) (V)[35]
Motion Patterns (D)[16,19,20,21,23,24,25,26,28,30,31,34,35,36,37,38,40,41,90]
Odd Behavior (P)[13,14,17,27,31,33,34,36,90]
Person Counting (D)[8,12,15,18,19,20,21,22,24,28,31,32,40,89,90]
Retention (proxy) (V)[38,40]
Social Interactions (P)[11,28,30,35,90]
Attention (P)[44,49,53,57]
Conversation (P)[29,35,39,62,64,68]
Dwell Time (D)[12,15,19,38,40]
Emotion (P)[44,45,46,47,48,49,50,51,52,53,54,55,56,57,58,59,60,61,62,63,64,65,66,67,68]
Sentiment (P)[45,46,47,48,49,52,53,57,60,61,62,63,64,66,67,68,69]
This table aggregates direct and proxy evidence; citation-level direct/proxy status is not separately encoded. Tier labels classify the KPI construct, not every cited paper. Feedback is a single-source proxy design exception.
Table 3. Author-coded direct/proxy KPI evidence in the reviewed corpus: references per-sensor type.
KPIRGB-DThermalLiDARmmWaveAudioMultimodal
Commitment[38,40]
Conversion[38,40]
Density Maps[8,31,32,40,89][8,18,31,32,89][19,31][8,31,32,40,89]
Engagement[11,29,35,38,39,40,57][29,35,39][29,35,38,39,40]
Feedback[35][35][35]
Motion Patterns[16,25,28,30,31,34,35,36,37,38,40,41,90][28,30,31,90][19,25,31,36,37,90][20,21,23,24,28,36,37,41,90][30,34,35,38,40,90][25,26,28,30,31,34,35,36,37,38,40,41,90]
Odd Behavior[13,14,17,27,31,33,34,36,90][27,31,36,90][31,36,90][36,90][34,90][27,31,34,36,90]
Person Counting[8,12,15,28,31,32,40,89,90][8,18,28,31,32,89,90][19,31,90][20,21,22,24,28,90][40,90][8,28,31,32,40,89,90]
Retention[38,40]
Social Interactions[11,28,30,35,90][28,30,90][90][28,90][35,90][28,30,35,90]
Attention[44,49,53,57]
Conversation[29,35,39,68][29,35,39,62,64,68][29,35,39,68]
Dwell Time[12,15,40][19][38,40]
Emotion[44,45,46,47,48,49,50,51,52,53,54,55,56,57,59,67,68][58,59][60,61,62,63,64,65,66,67,68][58,59,66,67,68]
Sentiment[45,46,47,48,49,52,53,57,67,68,69][60,61,62,63,64,66,67,68,69][67,68,69]
This table aggregates direct and proxy evidence; citation-level direct/proxy status is not separately encoded.
Table 4. Author-coded direct/proxy KPI evidence by sensor type, with primary (•) and secondary (∘) design hypotheses, and the evidence tier of each KPI (D = direct sensor-derived measurement; P = behavioral proxy; V = validation-dependent outcome), produced with the coding protocol described above.
ConstructRGB-DThermalLiDARmmWaveAudioMultimodal
Commitment (V)
Conversion (V)
Density Maps (D)
Engagement (P)
Feedback (V)
Motion Patterns (D)
Odd Behavior (P)
Person Counting (D)
Retention (V)
Social Interactions (P)
Attention (P)
Conversation (P)
Dwell Time (D)
Emotion (P)
Sentiment (P)
Disclaimer/Publisher’s Note: The statements, opinions and data contained in all publications are solely those of the individual author(s) and contributor(s) and not of MDPI and/or the editor(s). MDPI and/or the editor(s) disclaim responsibility for any injury to people or property resulting from any ideas, methods, instructions or products referred to in the content.