Article

Expert Recommendation for Interdisciplinary Project Evaluation Based on Multi-Agent Collaboration and Dynamic Knowledge Graphs

1
School of Management, Guangdong University of Technology, Guangzhou 510520, China
2
Guangdong Science and Technology Innovation Monitoring and Research Center, Guangzhou 510033, China
3
School of Computer Science and Engineering, Guangdong University of Technology, Guangzhou 510006, China
4
School of Electromechanical Engineering, Guangdong University of Technology, Guangzhou 510006, China
5
Guangdong Jinke Information Network Center Co., Ltd., Guangzhou 510040, China
*
Author to whom correspondence should be addressed.
These authors contributed equally to this work.
Appl. Sci. 2026, 16(14), 7262; https://doi.org/10.3390/app16147262
Submission received: 19 June 2026 / Revised: 9 July 2026 / Accepted: 17 July 2026 / Published: 20 July 2026
(This article belongs to the Section Computing and Artificial Intelligence)

Abstract

Interdisciplinary scientific project evaluation requires reviewer selection that is both accurate and explainable; however, rapidly changing topics and heterogeneous terminology make it difficult to match experts. This study develops and evaluates an interpretable expert recommendation framework for interdisciplinary project evaluation. The proposed Knowledge Graph-driven Multi-Agent Recommendation System (KG-MARS) combines terminology alignment for cross-domain semantic normalization, graph retrieval over a dynamically weighted knowledge graph, and expert ranking with explicit justifications. Here, the term “agents” refers to specialized coordinated software modules with fixed roles, not to autonomous large language model or reinforcement learning agents. We evaluate the proposed framework on a de-identified institutional dataset containing 2846 experts, 462 research projects, and 31,306 weighted relations across 12 interdisciplinary domains. Rather than claiming a uniformly large accuracy gain—the overall margin over the strongest baseline is small and obtained at comparable computational cost—we show that the benefit of KG-MARS is concentrated where interdisciplinary matching is hardest, while remaining robust to label leakage and corpus drift. Under a common offline protocol with five randomized splits, KG-MARS achieved a precision of 0.8027 ± 0.011 , a recall of 0.7384 ± 0.013 , and an F1-score of 0.7852 ± 0.010 , outperforming ten baselines; the recall gain over the strongest baseline remained statistically significant after Holm–Bonferroni correction for multiple comparisons (paired t-test, p < 0.05 ), with a large effect size in the paired five-split test (Cohen’s d > 0.8 ); the F1-score gain was significant at the split level but only borderline at the more conservative project level, whereas the precision difference over that baseline was not statistically significant at either level. KG-MARS also achieved the best normalized discounted cumulative gain (NDCG@10), mean average precision (MAP), and mean reciprocal rank (MRR). A temporal hold-out experiment separating feature and label time windows confirmed that the advantage is not an artifact of label leakage, and a drift experiment showed that periodic dynamic updates preserve accuracy as the corpus evolves. Removing individual modules lowered the F1-score by 14.0–19.2% and cross-domain analyses showed significantly larger gains on domain pairs with greater semantic distance, reaching up to 10.3 F1 points on the most distant pair. These findings indicate that dynamic knowledge graphs and coordinated agents can support more accurate and auditable expert selection in institutional project evaluation, particularly for interdisciplinary proposals.

1. Introduction

Recent studies have demonstrated the value of knowledge graphs for recommendation tasks, scholarly information retrieval, and structured analysis of research project data [1,2]. These studies provide relevant context for the present focus on graph-grounded expert recommendation in scientific project evaluation.
Scientific project evaluation affects how research resources are allocated and how large research programs are organized. Reviews of research funding peer review show that improving proposal assessment remains important for both effectiveness and efficiency [3]. In this context, the accuracy and timeliness of expert evaluation have direct consequences for research governance and allocation efficiency.
As research becomes more interdisciplinary, problem-driven, and data-intensive, traditional evaluation models come under increasing strain. Single-discipline expert databases often cannot cover the full range of expertise needed for interdisciplinary review, and differences in terminology across fields further complicate expert matching [4]. Available reports also suggest that shorter review cycles and persistent matching inefficiencies have become more visible in time-sensitive evaluation settings [5]. These conditions make a stronger case for recommendation methods that can cope with semantic heterogeneity and changing knowledge structures.
Existing expert recommendation methods still share two recurring weaknesses. Many remain only loosely adaptive: static knowledge representations struggle to keep up with rapidly changing research topics, which can create mismatches between expert profiles and project requirements. Strong ranking models also often offer limited interpretability, making it hard to reconstruct why a given expert–project match was produced [6]. While recent studies have improved recommendation quality, these issues remain only partially addressed. Collaborative filtering and graph neural network (GNN) models can capture patterns in historical data, but their effectiveness degrades in exactly the settings that matter for interdisciplinary review: when an expert has few historical records, the collaborative signal becomes too sparse to estimate reliable similarities, and when a researcher moves into a new field the historical co-occurrence structure no longer reflects current expertise; thus, cross-domain relevance is systematically underestimated. Methods based on topic coverage or post hoc explanation improve transparency, but the explanation is generated after and separately from the ranking decision; because it can indicate which features correlated with a score without recovering the actual matching steps, it still falls short of a clear and auditable decision trail [7]. Post hoc feature attribution methods such as SHAP have proven valuable for interpreting predictive models in other engineering domains [8], but they explain a trained model’s outputs after the fact rather than exposing the actual matching steps, which is the level of traceability required by interdisciplinary expert assignment. These gaps motivate recommendation frameworks that are adaptive by construction and expose structured reasoning paths.
To address these limitations, we propose the Knowledge Graph-driven Multi-Agent Recommendation System (KG-MARS), which combines a dynamically weighted knowledge graph with specialized agent coordination. The proposed framework links an evolving graph representation of domains and expert expertise with three modules for terminology alignment, graph retrieval, and expert ranking. Each recommendation is accompanied by an explicit reasoning path rather than a score alone.
Study aims. The aim of this study is to develop and rigorously evaluate a method for recommending experts for interdisciplinary scientific project evaluation that is adaptive to changing research knowledge and interpretable by construction. Concretely, we pursue three objectives: (i) to represent evolving expert–project–domain relations in a dynamically weighted knowledge graph that can be updated as new evaluation records arrive; (ii) to align heterogeneous cross-domain terminology and retrieve suitable experts through coordinated specialized modules so that semantically distant project–expert pairs are matched more reliably than by static or single-model baselines; and (iii) to produce an explicit reasoning path for every recommendation that makes the decision auditable. We assess whether these objectives are met through an offline protocol on institutional evaluation data with significance testing, a temporal hold-out approach, and per-domain analysis.
The main contributions of this paper are summarized as follows:
  • We design KG-MARS, a recommendation framework that couples a dynamically weighted knowledge graph with three coordinated agents called the Terminology Alignment Agent (TAA), Graph Retrieval Agent (GRA), and Expert Recommendation Agent (ERA), producing an explicit reasoning path for every recommendation. To avoid ambiguity in the current broad usage of “multi-agent”, we emphasize that these agents are specialized coordinated software modules with fixed responsibilities, rather than autonomous large language model or reinforcement learning agents; here, the term ‘agent ’denotes a modular division of labor, not learned autonomous behavior.
  • We introduce a confidence-weighted terminology alignment mechanism and a multi-stage graph retrieval procedure to jointly address semantic heterogeneity in cross-domain expert matching.
  • We evaluate the proposed framework through a rigorous offline protocol including repeated randomized splits, paired significance testing with multiple-comparison correction and effect-size reporting, ranking-oriented metrics (NDCG, MAP, MRR), per-domain significance analysis, a temporal hold-out that controls for label leakage, an assessment of extraction accuracy, a drift experiment that quantifies the benefit of dynamic graph updates, and a complexity analysis of the pipeline. Rather than claiming a uniformly large gain, we provide statistical evidence that the advantage of KG-MARS is concentrated on semantically distant interdisciplinary domain pairs.
Application scenarios and practical impact. KG-MARS is designed around recurring institutional needs. When review windows are short, periodic graph updates and parallel module execution help to shorten expert retrieval time. In cross-domain evaluation areas, such as artificial intelligence applications in biomedical engineering or quantum computing in materials science, terminology alignment helps to reduce mismatches caused by different disciplinary vocabularies. For large project portfolios, the recorded reasoning paths make later auditing easier. In practical terms, the system is intended to sit inside an existing review workflow: a review coordinator submits a project description, receives a ranked shortlist of candidate experts together with the reasons for each match, and can act on it directly within a single review cycle, making the contribution a deployable decision-support tool rather than just a scoring model.
The remainder of the paper reviews related work, describes the KG-MARS framework and evaluation protocol, presents the experimental results, and then discusses the scope and limitations of the evidence.

2. Related Work

Expert recommendation research has moved from traditional collaborative filtering towards graph-based and multi-agent approaches. The literature reviewed below is organized into three groups: traditional recommendation methods, knowledge graph-based methods, and multi-agent systems, with emphasis on how each line of work handles scientific project evaluation.

2.1. Traditional Recommendation Methods

Traditional expert recommendation methods usually fall into three categories: collaborative filtering, content-based approaches, and hybrid models. These three lines of work remain the main conventional baselines in the expert recommendation literature [9].
Collaborative filtering recommends experts by using similarities among experts, historical collaboration records, and rating information, in formulations ranging from early behavior- and rating-based methods to later model-based variants. The main advantage of collaborative filtering is that it can exploit implicit relationships without requiring deep manual feature engineering. Its weakness is that performance often drops when data are sparse or when expert domains change quickly [4,5,6]. This is especially visible when experts span multiple fields, since historical co-occurrence alone is often not enough to recover cross-domain relevance.
Content-based recommendation relies on information such as academic background, research interests, publications, and other profile features [7]. As natural language processing tools have improved, more systems have drawn directly on publication text to derive finer-grained domain labels and topic representations. These methods are usually more responsive than collaborative filtering to changes in expert profiles; even so, they remain vulnerable in interdisciplinary settings, where differences in terminology and domain conventions can create semantic mismatches that simple text similarity does not resolve well.
Hybrid methods combine collaborative filtering with content-based recommendation to use both historical interaction patterns and expert profile information [9]. In practice, this can improve robustness, especially when both behavior data and textual descriptions are available. The trade-off is that hybrid systems usually require more complete data and more careful fusion design.

2.2. Knowledge Graph-Based Recommendation Methods

Knowledge graphs have become a common way to strengthen recommendation systems, including expert recommendation. By organizing entities and relations into an explicit semantic structure, they allow recommendation models to more directly represent associations among experts, projects, institutions, and research topics. An academic paper recommendation model, for instance, has shown how graph structure, temporal patterns, citation relations, and author collaboration can be fused in scholarly information retrieval [1]. Similarly, graph-convolution collaborative filtering models [10] have strengthened relational modeling for recommendation. More recently, KGCL [11] has been used to denoise knowledge-aware recommendation via contrastive learning, applying knowledge graph contrastive augmentation to suppress noisy relations over the user–item–entity graph. While these models make good use of relational information and set strong modern baselines, most still focus on static graph representations or ranking quality. Explicit reasoning traces and cross-domain terminology alignment have received much less attention, even though both matter in interdisciplinary evaluation settings.

2.3. Multi-Agent Systems for Recommendation

Multi-agent methods have attracted growing interest in recommendation thanks to their ability to split complex decisions into subtasks handled by specialized components where coordinated agents can make use of heterogeneous signals in a dynamic setting. More recently, large language models have been used both as recommenders and as the backbone of autonomous agents: surveys of LLM-based recommendation [12] and LLM-based autonomous agents [13] document rapid progress in using generative models for ranking and tool use. This trend has reached scholarly reviewer and expert assignment directly; recent studies have applied large language models to the peer review process and examined the accompanying reliability and integrity risks [14]. Such works confirm that LLM-assisted reviewer assignment is an active 2024–2025 direction, but also makes the outstanding gap explicit: generative rationales are not necessarily grounded in verifiable relational evidence, and the models used are not designed to expose an auditable graph-level reasoning trail. These approaches offer fluent natural-language rationales, but the explanations are not necessarily grounded in verifiable relational evidence and inference is often costly. Existing multi-agent recommendation studies often describe task decomposition at a high level while giving less attention to operational coordination details such as inter-agent message exchange, conflict resolution, and feedback-driven updating in expert-evaluation workflows. The combination of such coordination with explicit domain knowledge and interpretable graph-grounded reasoning paths remains comparatively underdeveloped.

2.4. Research Gap and Our Contribution

Against this background, KG-MARS combines a dynamic knowledge graph with specialized agent coordination in a single recommendation framework. The graph records evolving relations among experts, projects, institutions, and domain terms, while three linked agents handle terminology alignment, graph retrieval, and final ranking. In practice, project expressions are first mapped to standardized domain labels with confidence scores. The retrieval stage then searches the weighted graph for relevant experts through multi-dimensional similarity matching. A final ranking stage combines matching quality, response timeliness, and historical evaluation quality, then returns both a ranked list and a structured justification. Table 1 compares the main capabilities of several common recommendation paradigms with the design scope targeted by KG-MARS. To make the distinction from specific recent systems explicit, Table 2 further contrasts KG-MARS with the named knowledge graph, GNN, LLM, and explainable recommenders used as baselines, along the dimensions of graph updating, terminology alignment, reasoning traceability, and validation type.

3. Materials and Methods

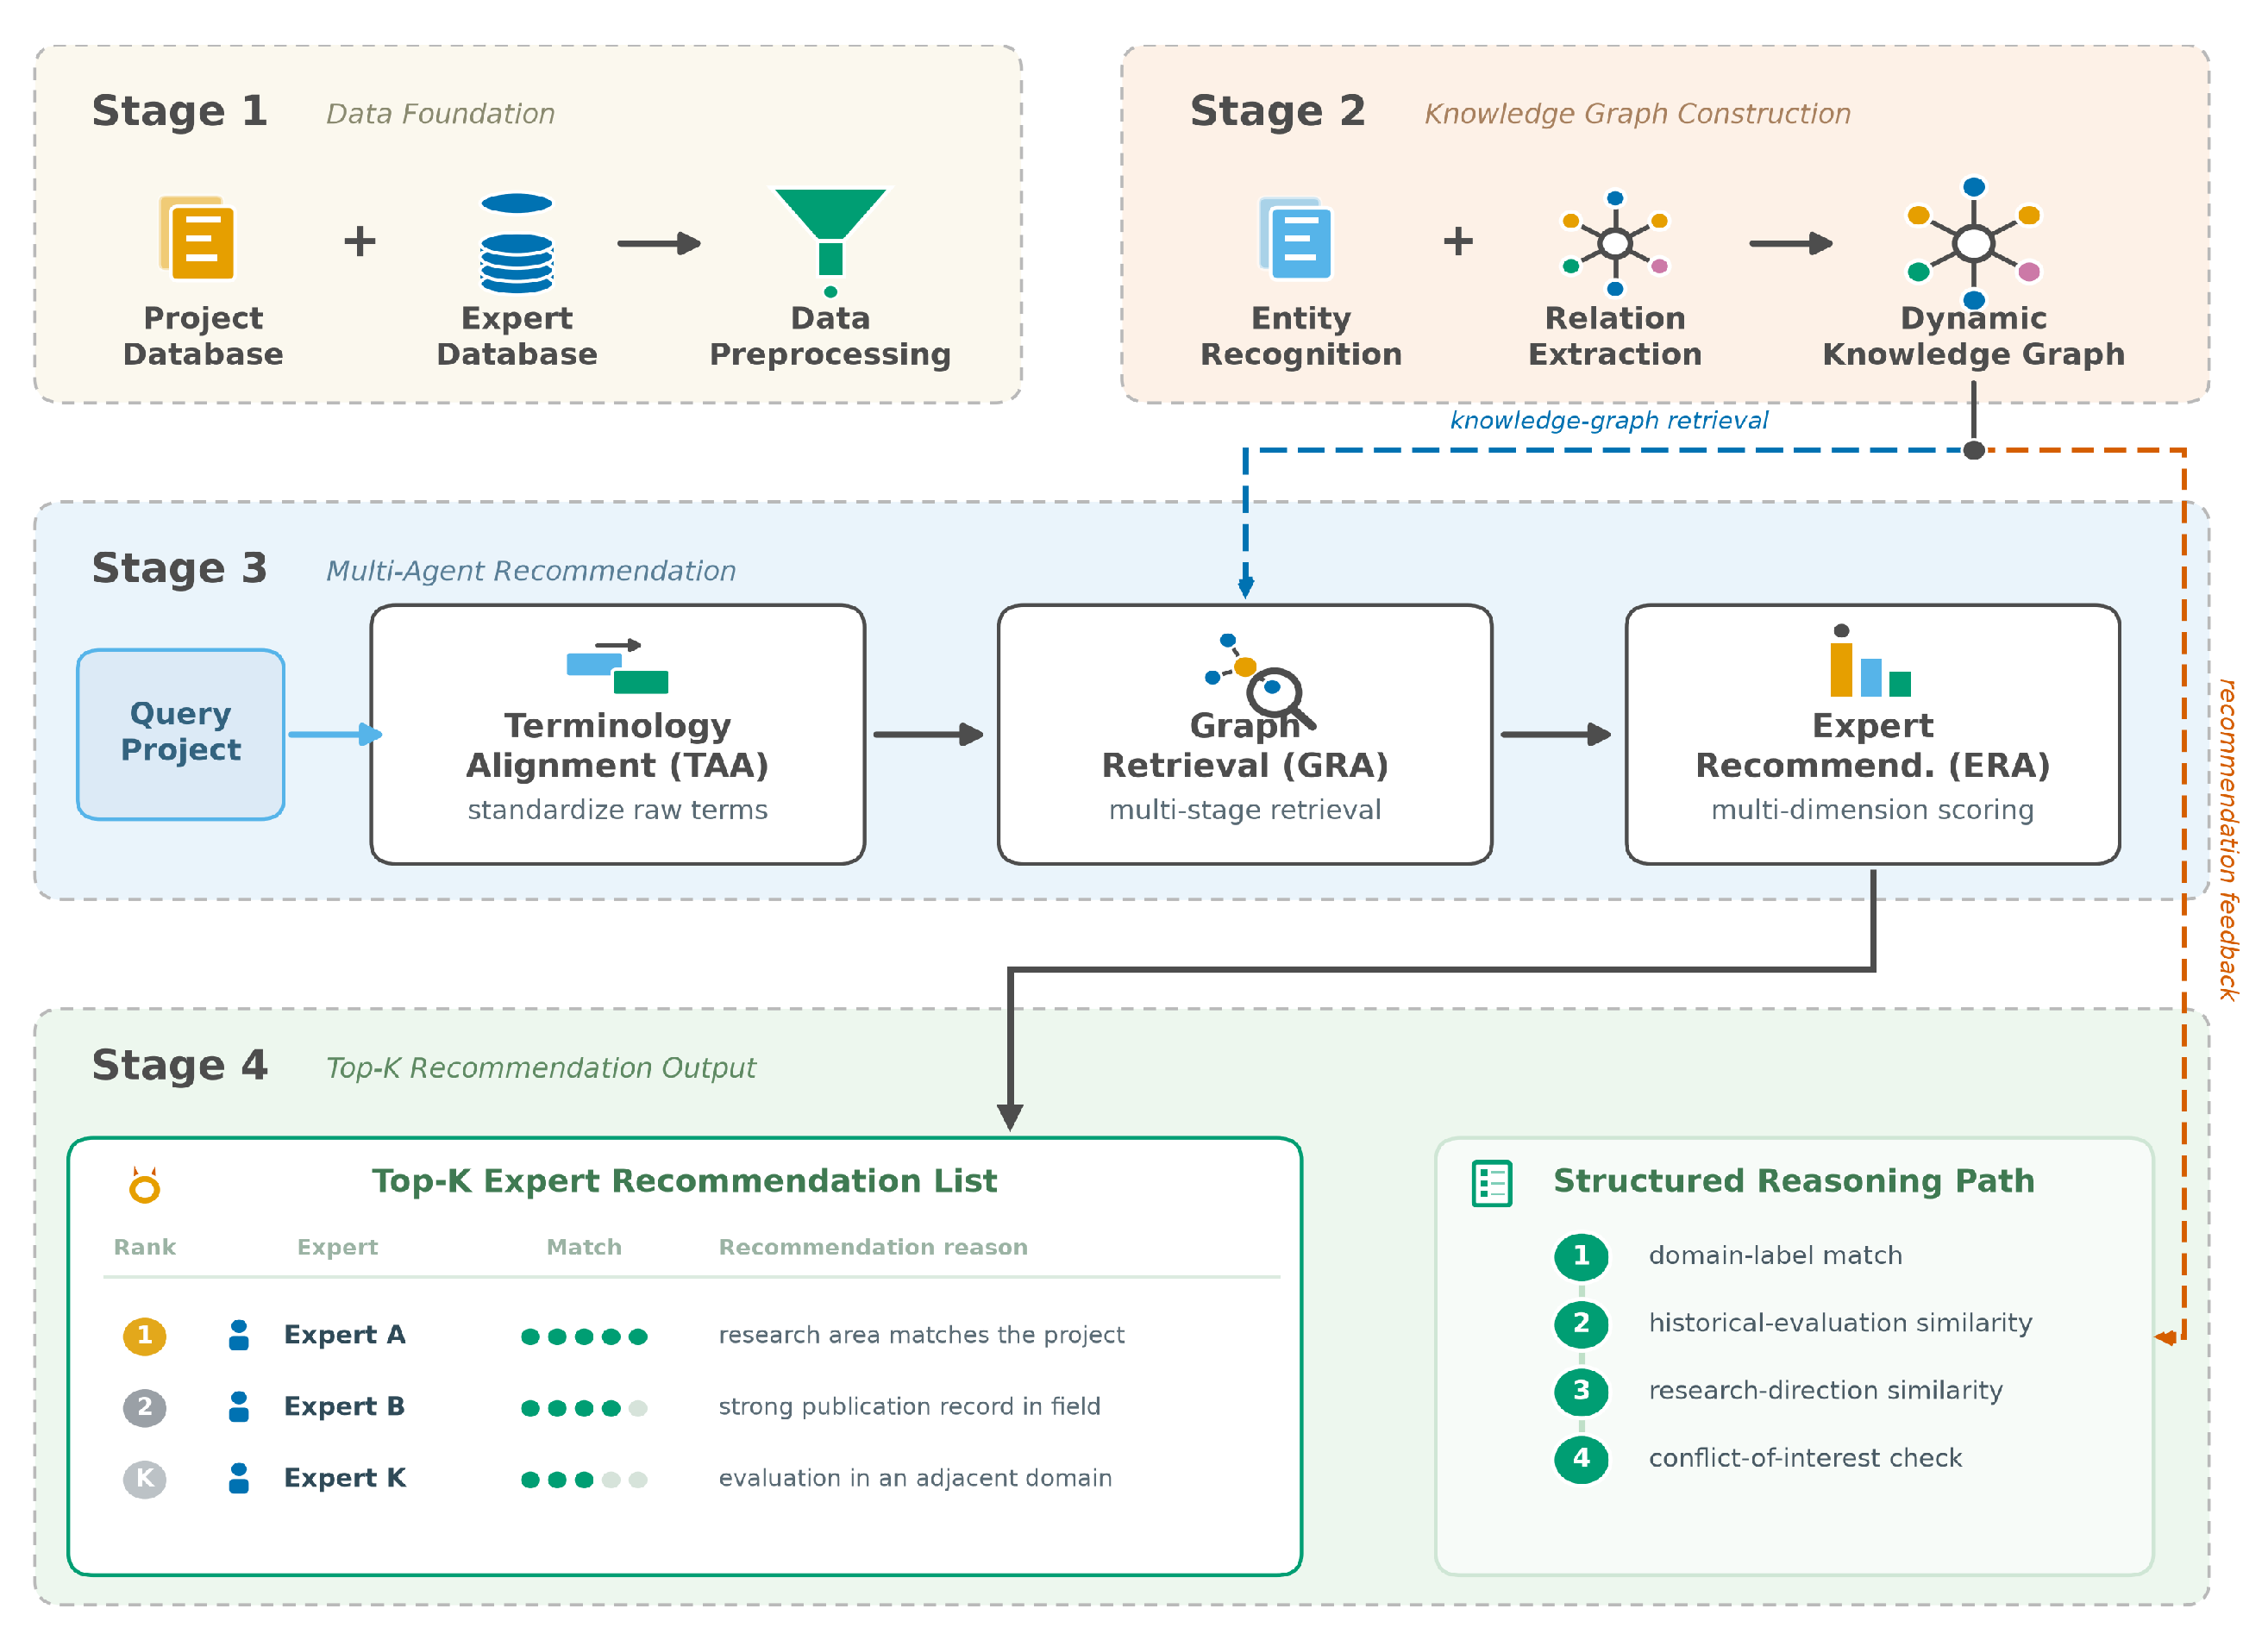
KG-MARS uses a three-stage pipeline: terminology alignment for cross-domain semantic standardization, graph-based expert retrieval over a dynamically weighted knowledge graph, and multi-dimensional expert ranking with structured justifications. The following subsections describe the overall design, graph construction procedure, agent coordination, and key implementation choices.

3.1. Problem Formulation

Let E = { e 1 , , e n } be the set of experts and P = { p 1 , , p m } the set of projects. Each expert e i is described by a set of research domain terms T e i , a sequence of historical evaluation records, and a set of research directions D i ; each project p j carries a set of raw domain expressions T p j . The institutional knowledge is encoded as a time-varying knowledge graph G t = ( V , E t , W t ) , where the edge-weight function W t evolves through the update rule in (1) as new records arrive. Given a query project p j , the task is to return a ranked list R final ( p j ) E of at most k experts that maximizes relevance to p j while satisfying conflict-of-interest constraints, together with a structured reasoning path Reason ( e i , p j ) for every recommended expert. Formally, KG-MARS learns a scoring function C ( e i , p j ) and outputs R final ( p j ) = TopK ( { C ( e i , p j ) e i R ( p j ) } , k ) , where R ( p j ) is the conflict-filtered eligible set. Table 3 summarizes the main notation.

3.2. KG-MARS Framework Design

KG-MARS combines a knowledge graph with three coordinated agents. We use the term agent in the software engineering sense: each agent is a specialized independently-invoked module with its own inputs, outputs, asynchronous message interface, and local decision logic (conflict resolution and feedback) rather than a reinforcement learning or large language model autonomous agent. The graph represents semantic relationships among experts, projects, institutions, and evaluation records, while the agents handle terminology alignment, graph retrieval, and final recommendation. Expert nodes are linked to research direction labels, project nodes carry domain classifications, and evaluation records appear as weighted edges between experts and projects. The graph is structured so that new institutional records and topic changes can be incorporated over time.
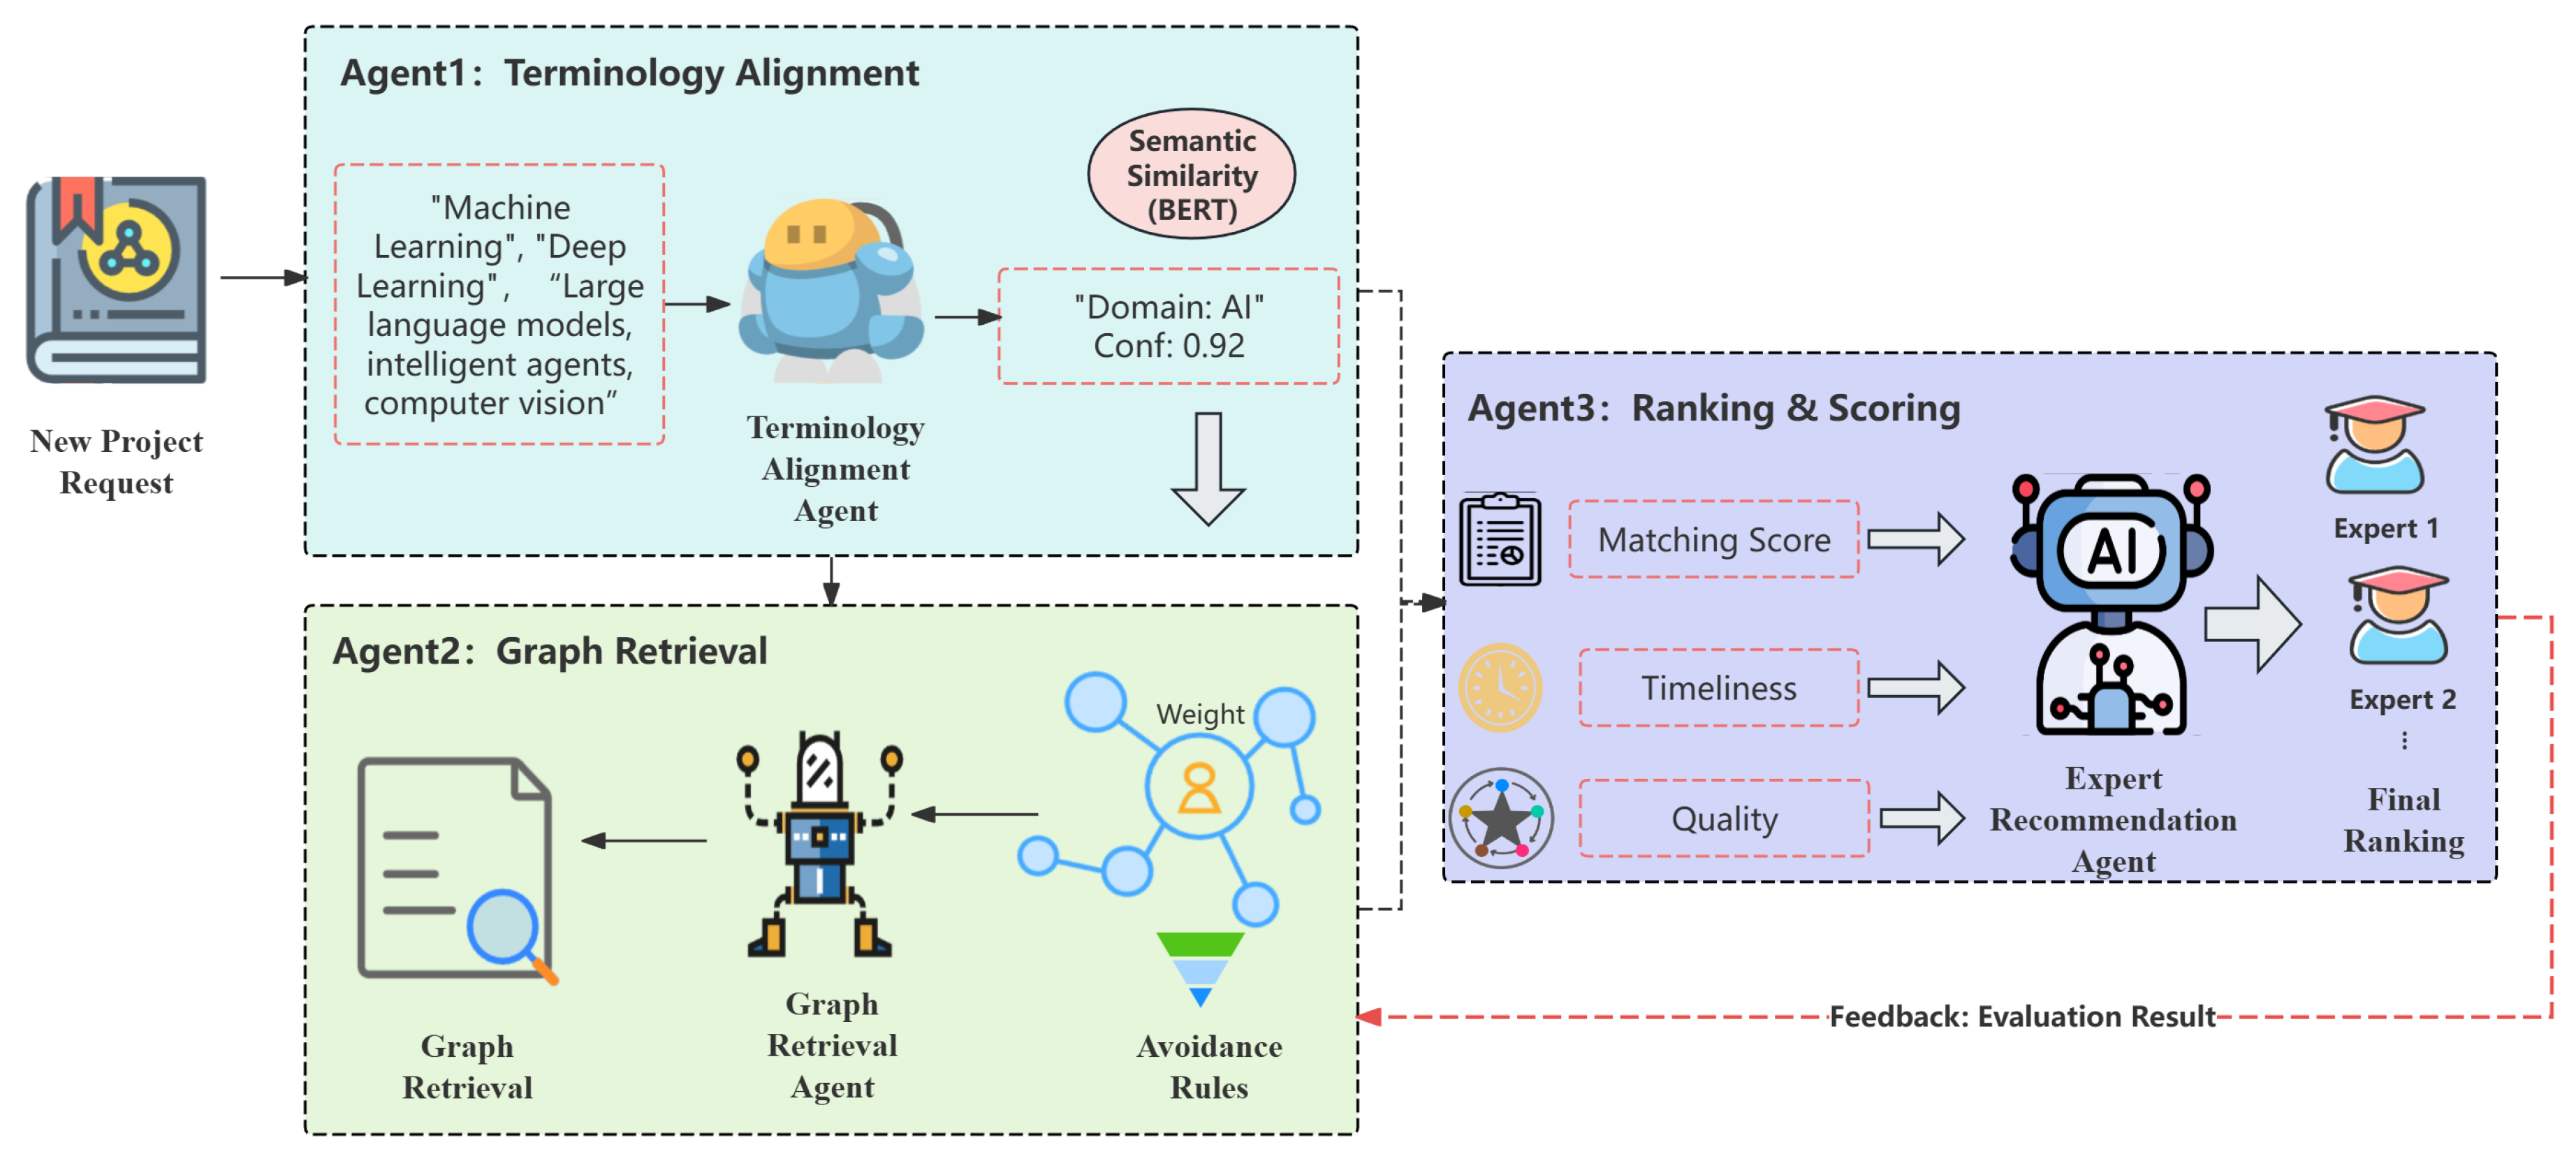
The workflow begins when the TAA processes the domain-related fields of a new project and maps key expressions to standardized disciplinary labels. For example, project phrases such as “AI-driven drug discovery” and “precision medicine” are converted into normalized labels with confidence scores before retrieval. The GRA then queries the knowledge graph with those labels and returns a candidate expert set together with intermediate matching scores. Finally, the ERA combines matching quality, historical evaluation quality, and response speed; these are used to rank candidates, output the top-k experts, and generate structured reasons for each recommendation. Figure 1 provides an overview of this process.

3.3. Dynamic Knowledge Graph Construction

3.3.1. Entity and Relation Extraction

Knowledge graph construction begins with entity and relation extraction from unstructured text in expert profiles, project descriptions, and evaluation records. For entity recognition, we use a graph-based named entity recognition (NER) model that combines a graph neural network (GNN) with pre-trained Bidirectional Encoder Representations from Transformers (BERT) embeddings [17,18]. Each token is first embedded with BERT (bert-base-chinese for Chinese text, bert-base-uncased for English text) into a 768-dimensional vector. This embedding is then contextualized through L graph-convolution layers over the token dependency graph and classified into one of five entity types (experts, projects, institutions, domains, and evaluation events) with a Softmax layer. Among these, the first four types become graph nodes, whereas evaluation events are encoded as temporal attributes on expert–project edges rather than as separate nodes, which keeps the node set consistent with the dataset description. Relations between identified entities are then extracted with a GNN-based relation extraction (RE) model [19] that concatenates the contextual embeddings of each entity pair, propagates information over the surrounding dependency context, and predicts the relation type with a Softmax classifier. Because these standard NER and RE components serve only as preprocessing for graph construction, their extraction accuracy is reported in Section 4.5 rather than derived here; both follow established GNN and BERT formulations [17,18,19].

3.3.2. Knowledge Graph Construction

After NER and RE, we assemble the knowledge graph with entities as nodes V = { v 1 , v 2 , , v n } and relations as edges E = { ε 1 , ε 2 , , ε m } . Each edge ε i j represents the relation r i j between entities v i and v j , and receives a weight w i j [ 0 , 1 ] . The weight is computed from three normalized components: interaction frequency between the linked entities, temporal recency of the underlying record, and semantic similarity between the associated textual descriptions. More recent, more frequent, and semantically closer relations receive higher weights. The final graph contains 4563 entity nodes (2846 experts, 462 projects, 12 domains, and 1243 institutions) together with 31,306 weighted edges. The graph is stored in Neo4j (version 5.11) for traversal and query operations. This use of a graph layer for structured research management data is consistent with prior work on Horizon 2020 data, where project and organizational information was modeled as a knowledge graph to support relational exploration and analysis [2].

3.3.3. Dynamic Update

KG-MARS includes a dynamic update component so that newly available expert evaluation data, project records, and domain information can be folded into the institutional knowledge base. The update rule is
w i j new = α s · w i j + ( 1 α s ) · Δ w i j ,
where w i j is the old weight, Δ w i j is the change in relationship weight caused by new data, and α s is a smoothing factor controlling the influence of new data on old data. This formulation smooths new evidence into existing relationship weights and avoids abrupt changes caused by isolated records. The graph is refreshed periodically to remove redundant links and incorporate new domain trends, expert participation records, and evaluation information; Section 4.6 quantifies the benefit of this mechanism under corpus drift.

3.4. Multi-Agent Collaboration Mechanism

KG-MARS uses three specialized agents: the TAA for cross-domain semantic standardization, the GRA for expert discovery over the knowledge graph, and the ERA for final scoring and ranking. As emphasized above, these are coordinated software modules with fixed hand-designed roles and deterministic interfaces, not autonomous reinforcement learning or large language model agents; here, “multi-agent” denotes modular coordination rather than autonomous generative behavior. Semantic processing within these agents relies on pretrained language representations and embedding-based similarity. The agents exchange standardized JavaScript Object Notation (JSON) messages, resolve ambiguous inputs through the mechanisms defined in (9) and (10), and are linked to iterative graph updates through (11) and (12). Figure 2 summarizes the workflow.

3.4.1. Terminology Alignment

The TAA addresses semantic heterogeneity across disciplines. Different fields often use different terms for closely related concepts, for instance “machine learning”, “computational intelligence”, and “artificial intelligence”. This variation creates semantic gaps that can weaken expert–project matching.
Given a project p j with domain terms T p = { t p 1 , t p 2 , , t p m } and an expert e i with research domain terms T e = { t e 1 , t e 2 , , t e n } , the TAA maps both to a standardized domain ontology T * containing 12 canonical disciplinary categories, listed with their abbreviations in Table 4. The ontology and synonym resources were compiled from institutional terminology resources, domain taxonomies used in project management, and normalized research field descriptors extracted during preprocessing. The mapping step combines pretrained sentence embeddings from the Universal Sentence Encoder Multilingual v3 with these curated synonym dictionaries. For each input term t, the TAA computes similarity scores to all ontology terms, Sim ( t , T k * ) = cosine ( Emb ( t ) , Emb ( T k * ) ) , and keeps the top-k matches (typically k = 3 ) with confidence scores. The resulting standardized domain labels are then passed to the GRA together with confidence weights. Supplementary Section S8 gives examples of how heterogeneous project expressions are normalized before graph retrieval.

3.4.2. Graph Retrieval

The GRA retrieves relevant experts from the dynamic knowledge graph using the standardized domain labels provided by the TAA. Let the expert set be E = { e 1 , e 2 , , e n } and the project set be P = { p 1 , p 2 , , p m } . For each project p j , the agent filters the expert pool through a multi-stage retrieval process.
Stage 1: Domain Label Similarity. Given the standardized domain label set T p * for project p j and expert e i ’s domain labels T e , the domain label similarity is computed using a confidence-weighted Jaccard formulation. For each standardized project label t * T p * , sim max ( t * ) = max t T e cosine ( Emb ( t ) , Emb ( t * ) ) :
Sim ( T e , T p * ) = I w C p + W e I w
where I w = t * T p * c ( t * ) sim max ( t * ) is the confidence-weighted intersection, C p = t * T p * c ( t * ) , and W e = t T e w ( t ) . Here, c ( t * ) is the confidence score from the TAA (normalized so that C p 1 ) and w ( t ) is the weight of expert label t based on its frequency in the knowledge graph (normalized so that W e 1 ). The numerator is a weighted intersection and the denominator a weighted union, so the similarity remains in [ 0 , 1 ] .
Stage 2: Historical Evaluation Record Similarity. Let r i = { r i 1 , , r i K } denote the K most recent evaluation records for expert e i ( K = 10 , chosen to match the operative length of the recommendation lists produced in deployment rather than swept as a free parameter), each containing project domain, evaluation score, and temporal information:
Sim ( r i , p j ) = 1 K k = 1 K γ h Δ k / τ h s i k
where s i k = sim dom ( dom ( r i k ) , T p * ) I ( q ( r i k ) > θ q ) combines domain alignment with a quality gate, γ h ( 0 , 1 ] is a temporal decay base (typically γ h = 0.85 ), Δ k is the time difference in days between the current request and the k-th historical evaluation, τ h is a normalization constant (set to τ h = 30 days to match the monthly cadence of the institution’s review cycles, so that the temporal decay is expressed in review period units rather than tuned on the evaluation data), sim dom ( · ) measures domain alignment via cosine similarity, q ( r i k ) is the evaluation quality score (in [ 0 , 1 ] ), θ q is a quality threshold (typically θ q = 0.7 ), and I ( · ) is the indicator function.
Stage 3: Research Direction Similarity. For expert e i with research directions D i = { d i 1 , , d i M } and project p j with research themes D j = { d j 1 , , d j N } ,
Sim ( D i , D j ) = 1 M N m = 1 M n = 1 N κ ( d i m , d j n ) ,
where κ ( d , d ) = exp ( dist K G ( d , d ) / σ d ) w path ( d , d ) is a graph-based kernel, dist K G ( · ) is the shortest path distance (in edges) between concepts in the knowledge graph, σ d is a scaling parameter (typically σ d = 2.0 ), and w path ( d , d ) = ε Path ( d , d ) w ε is the product of edge weights along the shortest path.
Combined Matching Score. The final matching score is
M ( e i , p j ) = λ 1 Sim ( T e , T p * ) + λ 2 Sim ( r i , p j ) + λ 3 Sim ( D i , D j ) ,
where λ 1 + λ 2 + λ 3 = 1 , selected on the validation split through grid search ( λ 1 = 0.45 , λ 2 = 0.35 , λ 3 = 0.20 ). The GRA forms an initial candidate set E candidate = { e i M ( e i , p j ) > τ M } , where τ M is a matching threshold ( τ M = 0.5 , also selected on the validation split). It then applies an expert avoidance mechanism that enforces institutional conflict-of-interest (COI) policy through a set of explicit exclusion rules. A candidate expert e i is removed from consideration for project p j if any of the following holds: (i) same-institution affiliation—the expert belongs to the same institution as the project’s submitting or hosting unit; (ii) prior direct collaboration—the graph contains an archived collaboration edge (e.g., co-authorship or joint project) between the expert and a project applicant within a configurable look-back window; (iii) prior participation in the same project lineage—the expert has already reviewed or participated in the same project or an earlier version linked to it in the project-lineage records; and (iv) eligibility and availability gating—the expert fails institutional eligibility constraints or current workload/scheduling limits. Rules (i)–(iii) are evaluated directly over the knowledge graph as relational predicates, so the same graph that drives retrieval also supplies the evidence for exclusion. These rules act as a hard filter applied after matching-score thresholding and before ranking: they shrink the candidate pool, most visibly on projects from large institutions with dense internal collaboration, where a substantial share of high-scoring candidates may be excluded; in doing so, they push the retained list toward experts from other institutions and adjacent research directions, which increases the institutional and topical diversity of the final recommendations and reduces the risk of conflicted or redundant assignments. When exclusions leave too few candidates, the matching threshold τ M is relaxed so that a sufficient eligible pool is preserved. Algorithm 1 lays out this conflict-of-interest resolution procedure explicitly.
Algorithm 1: Conflict-of-interest resolution (ApplyAvoidance)
Input: Candidate set E candidate ; project p j ; knowledge graph G t ; collaboration look-back window Δ ; matching threshold τ M ; minimum eligible-pool size n min
Output: Conflict-filtered eligible set R ( p j )
R ( p j )
foreach  e i E candidate  do
excl false
if  SameInstitution ( e i , p j ) over G t  then  excl true
if  Collaborated ( e i , applicants ( p j ) , Δ ) over G t  then  excl true
if  PriorParticipation ( e i , lineage ( p j ) ) over G t  then  excl true
if  ¬ Eligible ( e i )  or  ¬ Available ( e i )  then  excl true
if  ¬ excl  then  R ( p j ) R ( p j ) { e i }
end
if  | R ( p j ) | < n min  then
relax τ M and rebuild E candidate ; re-apply rules (i)–(iv)
end
return  R ( p j )

3.4.3. Expert Recommendation

The ERA performs the final ranking over the candidate set. From the candidate set  E p , it retains the eligible recommendation set R ( p j ) which excludes experts who have already participated in the project, keeping only those whose availability (based on current workload and scheduling constraints) permits assignment.
Multi-Dimensional Scoring. The ERA scores each candidate as follows:
C ( e i , p j ) = β 1 M ( e i , p j ) + β 2 T ( e i ) + β 3 Q ( e i )
where T ( e i ) is response timeliness, Q ( e i ) is historical evaluation quality, and β 1 + β 2 + β 3 = 1 ( β 1 = 0.55 , β 2 = 0.25 , β 3 = 0.20 , selected by grid search; see the parameter-sensitivity table below).
Response Timeliness. The timeliness metric is a weighted average of past response times:
T ( e i ) = 1 | R i | r R i w time ( r ) d ( r )
where d ( r ) = exp ( delay ( r ) / τ delay ) I ( delay ( r ) < τ max ) is a delay-penalized availability term, R i is the set of expert e i ’s past invitations, w time ( r ) is a temporal weight, τ delay is a delay decay parameter (typically 48 h), and τ max is the maximum acceptable delay (typically 168 h).
Historical Evaluation Quality. The quality metric combines three sub-components:
Q ( e i ) = α r Q rating ( e i ) + α c Q cons ( e i ) + α p Q comp ( e i )
with sub-component weights α r = 0.5 , α c = 0.3 , α p = 0.2 . These sub-weights were fixed a priori from domain judgment rather than being tuned on the data; they encode the reviewing-quality priority that a reviewer’s average rating reliability ( Q rating ) is the primary quality signal, that rating consistency ( Q cons ) is a secondary moderating factor, and that record completeness ( Q comp ) is a minor data-quality adjustment; the ordered 0.5 > 0.3 > 0.2 assignment reflects this ranking while keeping the component interpretable, and was kept fixed across all experiments to avoid overfitting the quality term to the evaluation set. Here, Q rating ( e i ) is the recency-weighted average of normalized project manager ratings over expert e i ’s evaluation history E i ; Q cons ( e i ) = 1 σ rating ( e i ) / ( μ rating ( e i ) + ϵ ) measures rating consistency through the coefficient of variation (with ϵ = 0.01 preventing division by zero); and Q comp ( e i ) is the fraction of records in E i that contain all required evaluation fields. The underlying ratings come from routine project manager feedback records, normalized to a common quality scale before aggregation.
Ranking and Explanation. After scoring, the ERA selects the top-k experts: R final ( p j ) = TopK ( { C ( e i , p j ) e i R ( p j ) } , k ) . For each recommended expert, it generates a structured explanation Reason ( e i , p j ) = { r match , r time , r qual , r path } , where r path provides the reasoning path through the knowledge graph.

3.4.4. Agent Collaboration Mechanism

KG-MARS coordinates the three agents through explicit message passing, conflict handling, and a feedback pathway.
Communication Protocol. KG-MARS uses asynchronous message passing with standardized JSON formats. After standardizing the domain labels, the TAA generates M T A G R = { p id , T * , C ( T * ) } , where p id is the project identifier, T * is the standardized label set, and C ( T * ) contains the confidence scores. The GRA computes matching scores via (5) and passes M G R E R = { E candidate , M , S avoid } to the ERA, where S avoid is the avoidance status identifier.
Conflict Resolution. When the TAA identifies multiple possible domain labels with confidences { c 1 , , c m } , the GRA adopts a weighted retrieval strategy
M weighted ( e i , p j ) = k = 1 m c k M k ( e i , p j ) , k = 1 m c k = 1 ,
where M k is the matching score computed under the k-th candidate label interpretation. When the GRA and ERA produce inconsistent priority orders, the final ranking is computed as follows:
Score final ( e i , p j ) = ψ Rank G R ( e i ) + ( 1 ψ ) Rank E R ( e i )
where Rank G R and Rank E R are normalized rank scores rescaled to [ 0 , 1 ] so that larger values indicate higher priority, with ψ [ 0 , 1 ] as the fusion weight.
Feedback Loop. KG-MARS records the actual participation of recommended experts R actual and quality feedback Q feedback . In addition, it periodically reassesses recommendation quality. Let the recommendation precision be P rec and the recall be R rec , with thresholds θ P and θ R . When P rec < θ P or R rec < θ R , a parameter-adjustment mechanism is triggered:
λ i new = λ i old η L λ i , β j new = β j old η L β j
where L = α fb P rec ( 1 α fb ) R rec is the loss, η is the learning rate, and α fb is a balance coefficient. The knowledge graph is refreshed on cycle T as new data Δ D t arrive:
w i j t + 1 = w i j t + δ · Δ w i j ( Δ D t )
where δ is the update intensity coefficient. Updated graph information is fed back to each agent through M K G Agents = { G t + 1 , Δ V , Δ E } .
Algorithm 2 summarizes the end-to-end recommendation procedure across the three agents.
Algorithm 2: KG-MARS recommendation for a query project
Input: Query project p j ; dynamic KG G t ; weights λ 1 : 3 , β 1 : 3 ; threshold τ M ; cutoff k
Output: Ranked list R final ( p j ) and reasoning paths
( T * , c ) TAA ( T p j )                                                        // normalize terms with confidence
E candidate
foreach  e i E  do
 compute Sim ( T e , T p * ) , Sim ( r i , p j ) , Sim ( D i , D j ) over G t
  M ( e i , p j ) λ 1 Sim dom + λ 2 Sim hist + λ 3 Sim res
 if  M ( e i , p j ) > τ M  then
   E candidate E candidate { e i }
 end  (
end
R ( p j ) ApplyAvoidance ( E candidate )                                                          // conflict filtering
foreach  e i R ( p j )  do
  C ( e i , p j ) β 1 M ( e i , p j ) + β 2 T ( e i ) + β 3 Q ( e i )
end
R final ( p j ) TopK ( { C ( e i , p j ) } , k )
build Reason ( e i , p j ) for each e i R final ( p j )
update W t via (1) as new records arrive
return  R final ( p j )  with reasoning paths

3.5. Data Collection and Preprocessing

To evaluate KG-MARS, we built an experimental dataset from internal expert and project evaluation databases maintained by the authors’ institution. The dataset has two main parts: expert profiles (demographic information, institutional affiliations, research fields, publication records, and academic credentials) and project evaluation records (project-domain classifications, keywords, project levels, expert participation history, and evaluation feedback). The initial corpus contained 3254 expert profiles and 582 research projects spanning 12 interdisciplinary domains: computer science, artificial intelligence, machine learning, biomedical engineering, materials science, quantum computing, biotechnology, environmental science, energy systems, data science, robotics, and networking.
We applied a preprocessing pipeline to improve data quality and consistency. Missing or inconsistent entries were handled through field-specific cleaning, conservative completion when supporting institutional records were available, and record removal otherwise. Duplicate records were removed using composite keys defined by expert names, affiliations, and project identifiers. Research field terminology and project descriptions were standardized through synonym unification with domain ontologies, stop-word removal, and morphological normalization. After preprocessing, 2846 expert profiles (87.5% retention) and 462 research projects (79.4% retention) remained. To obtain robust estimates, the dataset was split into training (80%), validation (10%), and test (10%) partitions while preserving domain balance, and this procedure was repeated with five different random seeds; all reported metrics are averaged over the five splits with standard deviations.
For offline evaluation, the relevance ground truth for each project was derived from archived expert assignment and feedback records. The historical eligible expert set comprised experts who satisfied institutional eligibility constraints, passed conflict-of-interest filtering, and appeared in validated assignment or feedback records associated either with the same project or with closely matched project categories (projects sharing the same institutional taxonomy label or adjacent standardized labels after terminology normalization). A recommendation was counted as correct when the recommended expert appeared in this proxy set after data cleaning and conflict filtering. To prevent the historical signals used as features from contaminating the labels, we additionally report a temporal hold-out evaluation in Section 4.3 that separates the feature window from the label window.
Table 5 summarizes the final dataset. Using the NER and RE steps described earlier, we built a knowledge graph with 4563 distinct nodes and 31,306 weighted relationships, including expert–expert collaborations (n = 8247, average weight = 0.623), expert–project participation links (n = 12,583, average weight = 0.741), expert–domain associations (n = 6892, average weight = 0.687), and expert–institution affiliations (n = 3584, average weight = 0.852). During preprocessing and graph construction, extracted entities and relations were checked against institutional structured records and normalized terminology resources to remove obvious extraction errors and duplicate links. Reproducibility. Although the underlying records are proprietary and cannot be released, we provide the information needed to re-implement and re-run KG-MARS on comparable data. The implementation is likewise part of an internal institutional deployment that is coupled to the data custodian unit’s infrastructure and governed by the same agreement, so the source code is not publicly released; to compensate, we specify the method at a level intended to be sufficient for independent re-implementation. The recommendation procedure is given as pseudocode in Algorithm 2; the full hyperparameter settings and their search ranges are listed below, and the graph schema and anonymized aggregate statistics (node and relation types, counts, and average weights) are summarized in Table 5. To further support reuse, the Supplementary Materials provide the explicit graph schema, a fully synthetic sample expert record and project record in the same format as the real data, the complete parameter list, the anonymized aggregate graph statistics, and breakdowns of the dataset by domain (with class imbalance and missing record rates), project type, and expert profile.

4. Results

4.1. Evaluation Metrics

We evaluate the system using precision, recall, and F1-score, the normalized discounted cumulative gain (NDCG@K), mean average precision (MAP), and mean reciprocal rank (MRR) ranking metrics, and two Top-K measures, Precision@K and Recall@K [9]. Precision is the fraction of recommended experts that match project requirements, recall is the fraction of retrieved experts who meet the requirements, and F1-score is their harmonic mean, F 1 = 2 Precision · Recall / ( Precision + Recall ) . NDCG@K rewards placing relevant experts near the top of the list, MAP averages precision across recall levels, and MRR captures the rank of the first relevant expert. For the main comparison, per-project metrics were computed from each project’s final recommendation list and then averaged across held-out projects and across the five splits. Because precision, recall, and F1-score are first computed per project and then averaged (macro-averaging), the reported F1-score is the mean of per-project F1 values; in general, it does not equal the harmonic mean of the averaged precision and recall.
Statistical Protocol. To avoid over-interpreting small differences, all comparisons follow a fixed protocol. Each metric is reported as the mean over five randomized splits with its standard deviation, and 95% confidence intervals are obtained from the t-distribution with four degrees of freedom. Improvements of KG-MARS over each baseline are tested with two-sided paired t-tests on the per-split scores. Because KG-MARS is compared against ten baselines for every metric, we control the family-wise error rate within each metric using the Holm–Bonferroni procedure [20], and report a result as significant only if it survives this correction. Practical relevance is quantified with the paired effect size Cohen’s d [21], where | d | > 0.8 is conventionally regarded as large. Because five splits provide only limited degrees of freedom, we additionally examined the comparisons with paired t-tests at the project level over the held-out projects (about 46 per split, ≈230 paired project observations in total, giving d f = 229 ), which treat each project as an independent unit and consequently provide many more degrees of freedom but also much smaller effect sizes. These project-level tests confirm the recall and NDCG@10 advantages over KGCL ( p < 0.05 ); like the split-level analysis, they find no significant precision difference. The F1-score gain, which is significant at the split level, sits at the decision boundary and does not reach significance at the project level ( p = 0.189 ), consistent with F1 being the weaker of the two split-level gains. These project-level statistics are summarized below; the full per-metric breakdown (t, d f , p, effect size, and confidence interval) is given in Supplementary Section S6.
Hyperparameter selection and leakage control. To avoid any ambiguity about how tuning interacts with the repeated splits, we state the procedure explicitly. The grid-searched hyperparameters, consisting of the smoothing factor α s , matching weights λ 1 : 3 , scoring weights β 1 : 3 , and graph depth L (with the full settings listed in the parameter-sensitivity table), were selected once on the validation partition and then held fixed and identical across all five test folds; they were not re-tuned separately for each split. Within every split, the validation partition (10%) is disjoint from that split’s test partition (10%) and the domain-balanced resampling keeps this train/validation/test separation intact for all five seeds, so the test fold of any split never contributed to hyperparameter selection. Therefore, fixing a single configuration across splits does not leak test information; it does mean the reported optima are not adapted to each split individually, which is the more conservative choice and if anything slightly understates the achievable performance. The remaining operating constants ( α r , α c , α p , τ h , K) were set a priori from institutional review conventions and were likewise not tuned on any test data, as noted in the Limitations.

4.2. Performance Comparison

We compared KG-MARS with ten methods: text-based methods were term frequency–inverse document frequency (TF-IDF) [22] and Best Matching 25 (BM25) [23]; learning-to-rank methods were represented by support vector machine ranking (SVM-Rank) [24]; GNN methods were LightGCN [10], GraphSAGE [25], and GATV2 [26,27]; knowledge graph-enhanced methods were KGAT [15] and KGIN [16]; and we also included the recent contrastive knowledge graph recommender KGCL [11] and a large language model-based recommender (LLM-Rec) built on a retrieval-augmented language model that ranks experts from textual profiles and project descriptions [12,13]. For reproducibility, the configuration used for LLM-Rec is specified as follows: the backbone was the open-weight, instruction-tuned Meta-Llama-3-8B-Instruct checkpoint (8 billion parameters), used without task-specific fine-tuning; at query time, the project description was embedded and used to retrieve the top-scoring expert profile passages from the same corpus available to the other baselines (dense retrieval over profile text), and the retrieved passages were inserted into a fixed prompt instructing the model to return a ranked list of experts with a short justification for each; the prompt was few-shot, containing a fixed instruction plus three in-context worked examples (project description → ranked experts) drawn from the training split only, so no test-fold information appeared in the prompt; finally, decoding used greedy generation (temperature 0) for determinism, and the returned ranking was parsed and truncated to the evaluation list length. The reported accuracy (Table 6) and the higher latency and memory footprint reported in the efficiency analysis refer to the above retrieval-augmented few-shot setup with zero fine-tuning. The last two baselines represent contemporary 2022–2024 paradigms and address the concern that older baselines understate the difficulty of the task. When official implementations were available, we used them, tuned all baselines on the same validation split, and evaluated them under the same held-out protocol. Table 6 reports the main comparison with standard deviations over the five splits.
Under this protocol, KG-MARS achieves the strongest overall results. It reaches a precision of 0.8027 (95% CI [ 0.7890 , 0.8164 ] ), a recall of 0.7384 (95% CI [ 0.7223 , 0.7545 ] ), and an F1-score of 0.7852 (95% CI [ 0.7728 , 0.7976 ] ), where confidence intervals are computed from the five splits using the t-distribution. The strongest baseline is the contrastive recommender KGCL (F1 0.7799 ), which edges out KGAT; relative to KGCL, KG-MARS improves precision, recall, and F1-score by 0.5%, 2.0%, and 0.7%, respectively. Paired t-tests across the five splits show that the recall and F1-score improvements over KGCL are statistically significant ( p = 0.030 and p = 0.044 , respectively), whereas the precision difference is not ( p = 0.27 ). Because all methods are evaluated on the same splits, the per-split differences are strongly correlated, which is why modest mean gaps can still reach significance; therefore, we report paired effect sizes alongside the p-values. The recall gain corresponds to a large effect (Cohen’s d = 1.48 ), whereas the F1-score gain, although significant, is smaller and sits close to the decision boundary (Cohen’s d = 1.30 ). Because KG-MARS is compared against ten baselines, we applied Holm–Bonferroni correction within each metric family; the recall and F1-score advantages remain significant after correction at the split level, since the comparison against the strongest baseline carries the largest p-value in the family and still falls below the 0.05 threshold. The advantage in recall is the more robust of the two, also holding under the more conservative project-level test (Table 7) together with NDCG@10, whereas the small F1-score gain retreats to the significance boundary once each project is treated as an independent unit. Therefore, we frame the contribution of KG-MARS mainly in terms of recall and ranking quality (NDCG@10), with the overall F1-score gain reported as a smaller split-level significant effect and precision as no reliable difference.
Interpretation of the relevance labels. These results should be read with one caveat about how relevance is defined. Because the ground-truth relevant set for each project is derived from archived assignment and feedback records (Section 3.5), it reflects which experts were historically selected, and as such can encode incumbency and popularity bias; a method that reproduces past assignment patterns is rewarded on this proxy even when it does not identify the globally best-matched reviewer, and frequently-assigned experts are more likely to appear in the labeled set than equally suitable but less well established candidates. All methods in Table 6 are scored against the same proxy, so the relative comparison is fair, but the absolute values are best interpreted as agreement with historical assignment rather than as a measure of true expert suitability. The temporal hold-out in Section 4.3 reduces the most direct form of leakage by separating the feature window from the label window, but does not remove incumbency bias. Fully addressing this would require prospective validation, for example having the system produce shortlists for newly submitted proposals, collecting review coordinator or post-review judgments on the recommended experts, and comparing those forward-looking outcomes against the results for historical labels reported here. We revisit this limitation in Section 5 (Limitations).
Table 8 reports ranking-oriented metrics, on which KG-MARS is also best, indicating that it not only retrieves relevant experts but also ranks them higher in the list; the NDCG@10, MAP, and MRR improvements over KGCL are likewise significant (paired t-test, p < 0.05 ).
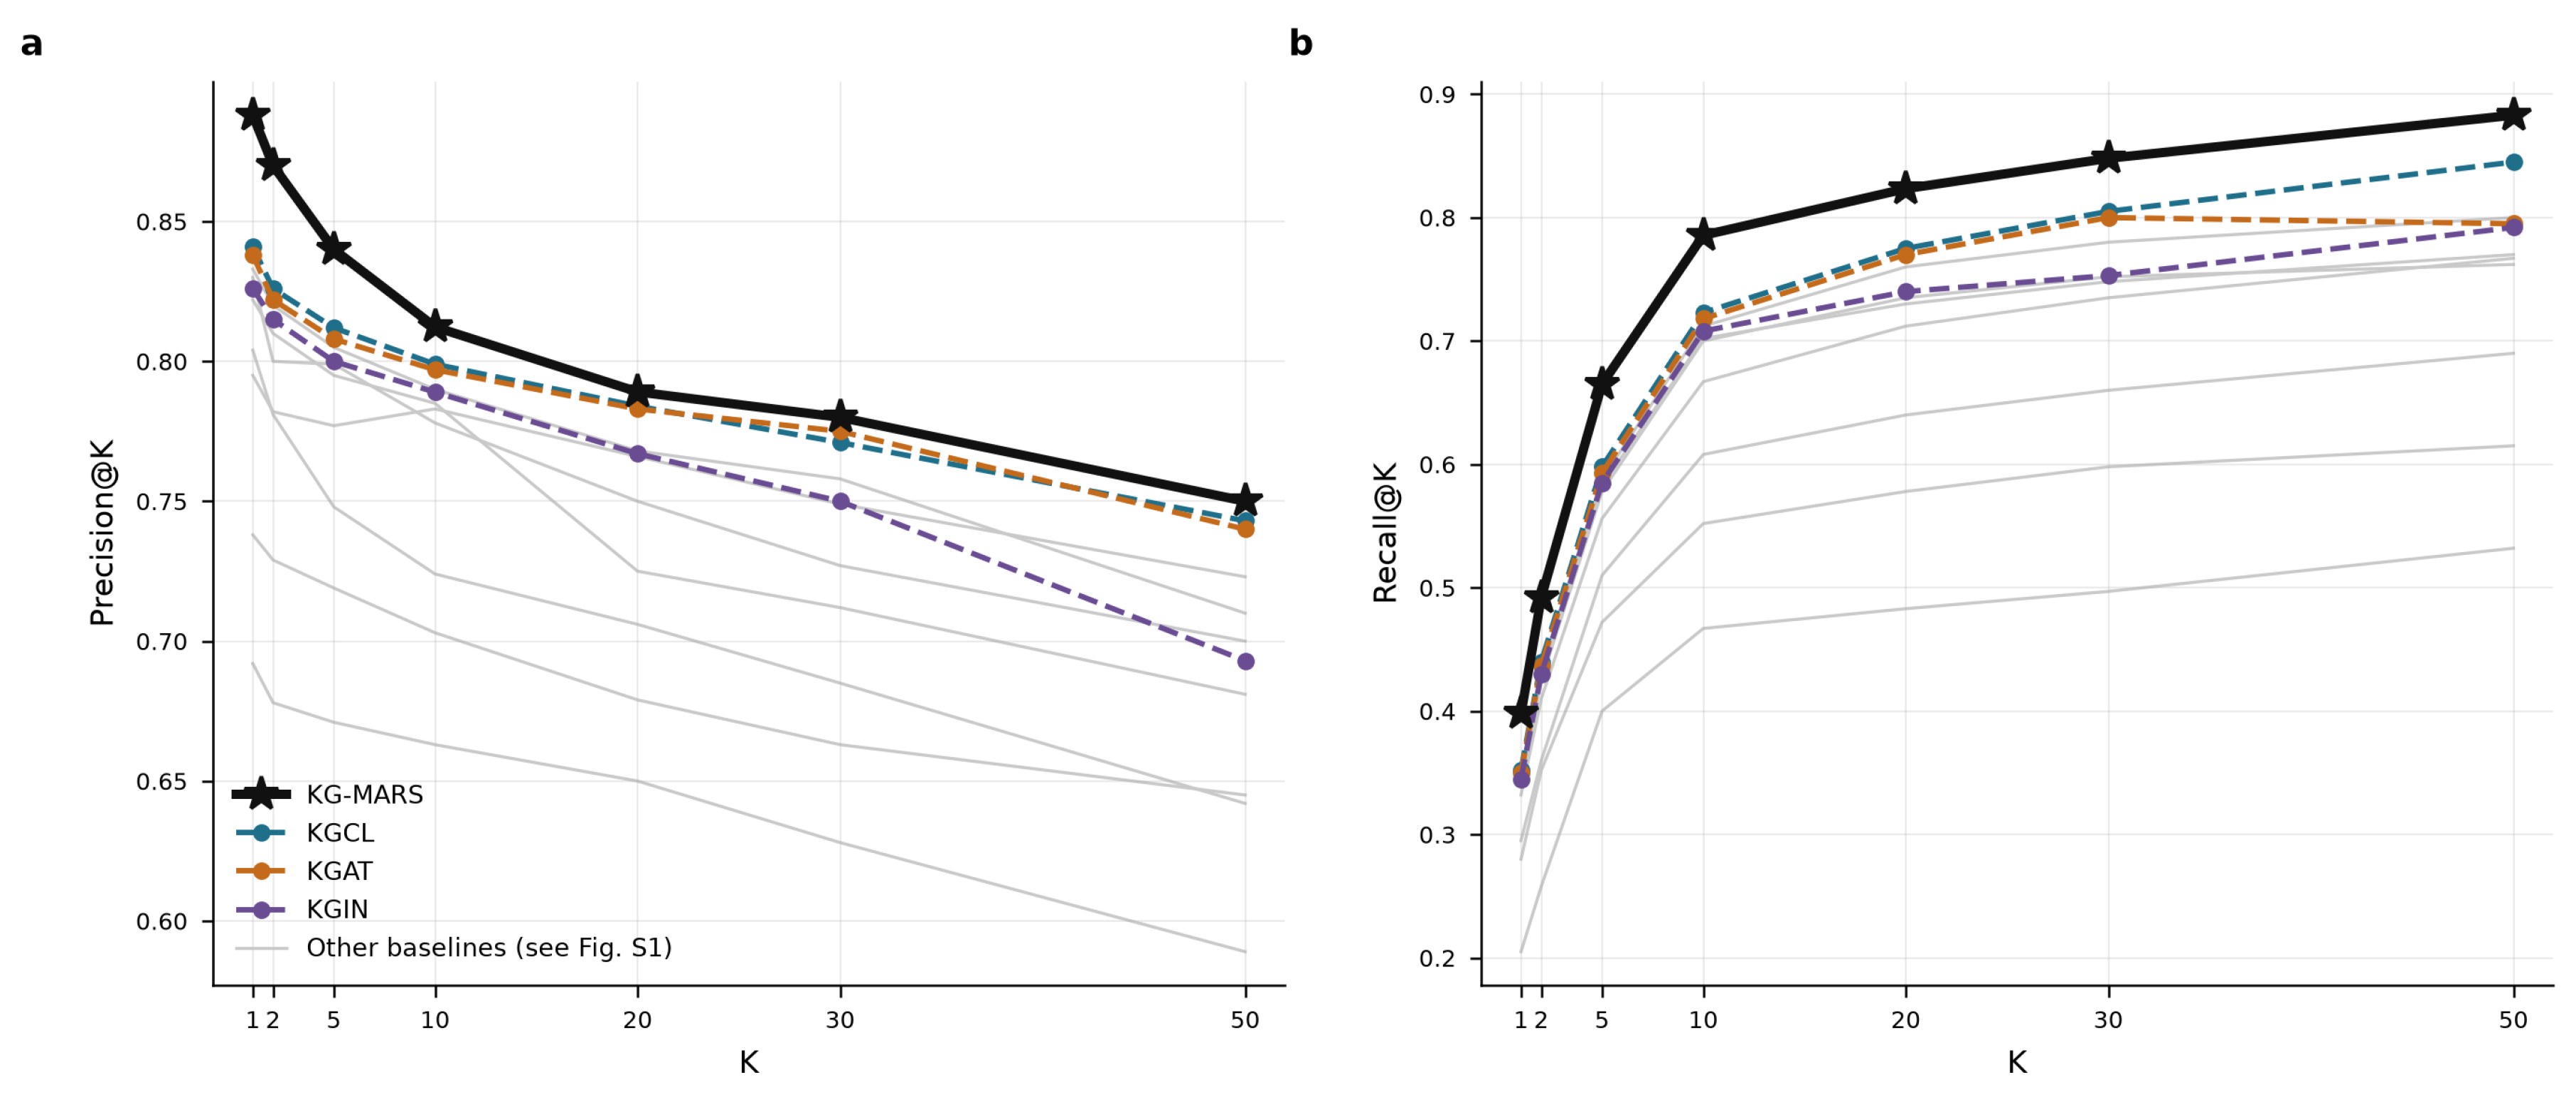
We next examine performance across recommendation list sizes (Figure 3). KG-MARS remains the best method at every list size. At K = 10 , it reaches Precision@10 of 0.8123 and Recall@10 of 0.7856, staying ahead of the strongest baselines; at K = 20 , it still performs best, with Precision@20 of 0.7891 and Recall@20 of 0.8234.

4.3. Temporal Hold-Out Evaluation

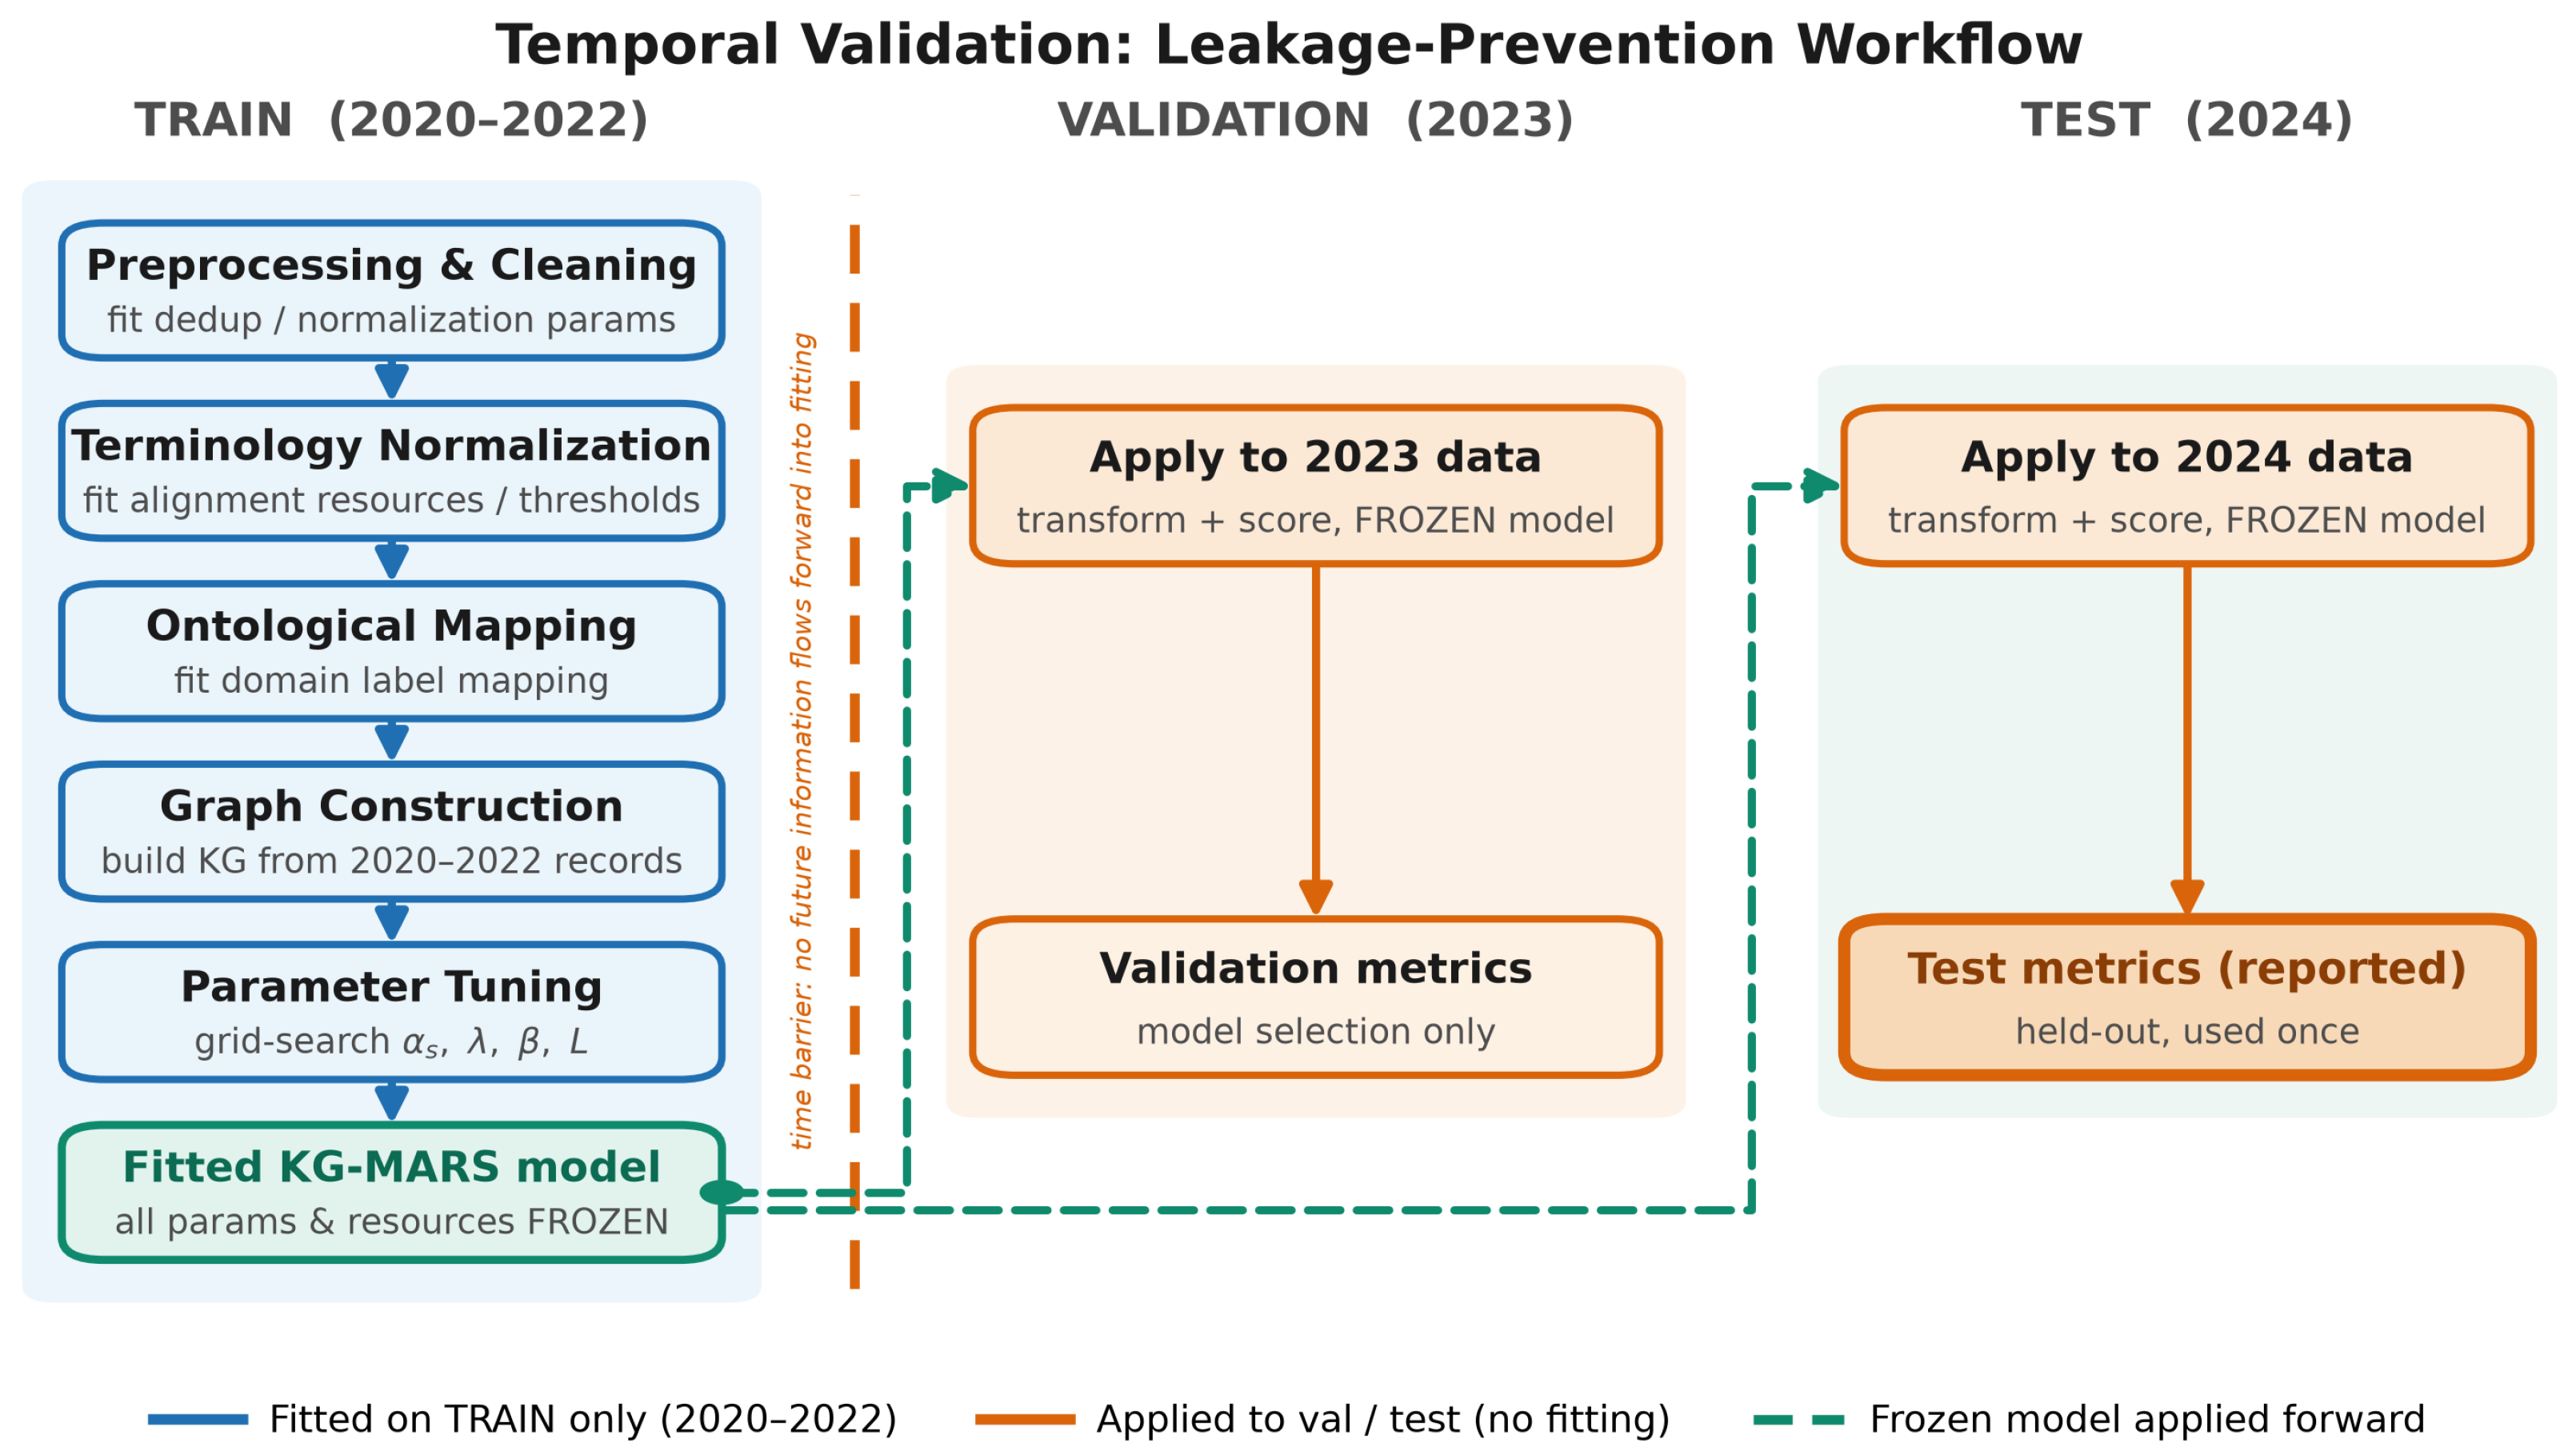
A concern with retrospective evaluation is that historical assignment signals used as features could leak into labels derived from the same records. To address this, we ran a temporal hold-out in which the knowledge graph and all historical features were constructed only from projects evaluated in 2020–2022, the validation set used 2023 projects, and the test set used 2024 projects. This enforces a strict time separation between feature construction and label assignment. Crucially, every fitted component—preprocessing and cleaning parameters, terminology normalization resources, ontological label mapping, graph construction, and all tuned parameters ( α s , λ 1 : 3 , β 1 : 3 , and graph depth)—was estimated using only the 2020–2022 training records (with 2023 used solely for model selection). The resulting model was then frozen and merely applied to the 2023 validation and 2024 test records, so no information from the validation or test periods entered any fitting step. Figure 4 summarizes which processes are fitted on training data and which are only applied forward. As shown in Table 9, absolute scores are lower than under random splits, as expected when no future information is available, but KG-MARS retains its lead over the strongest baselines. This indicates that the advantage of KG-MARS is not an artifact of label leakage.

4.4. Cross-Domain Performance

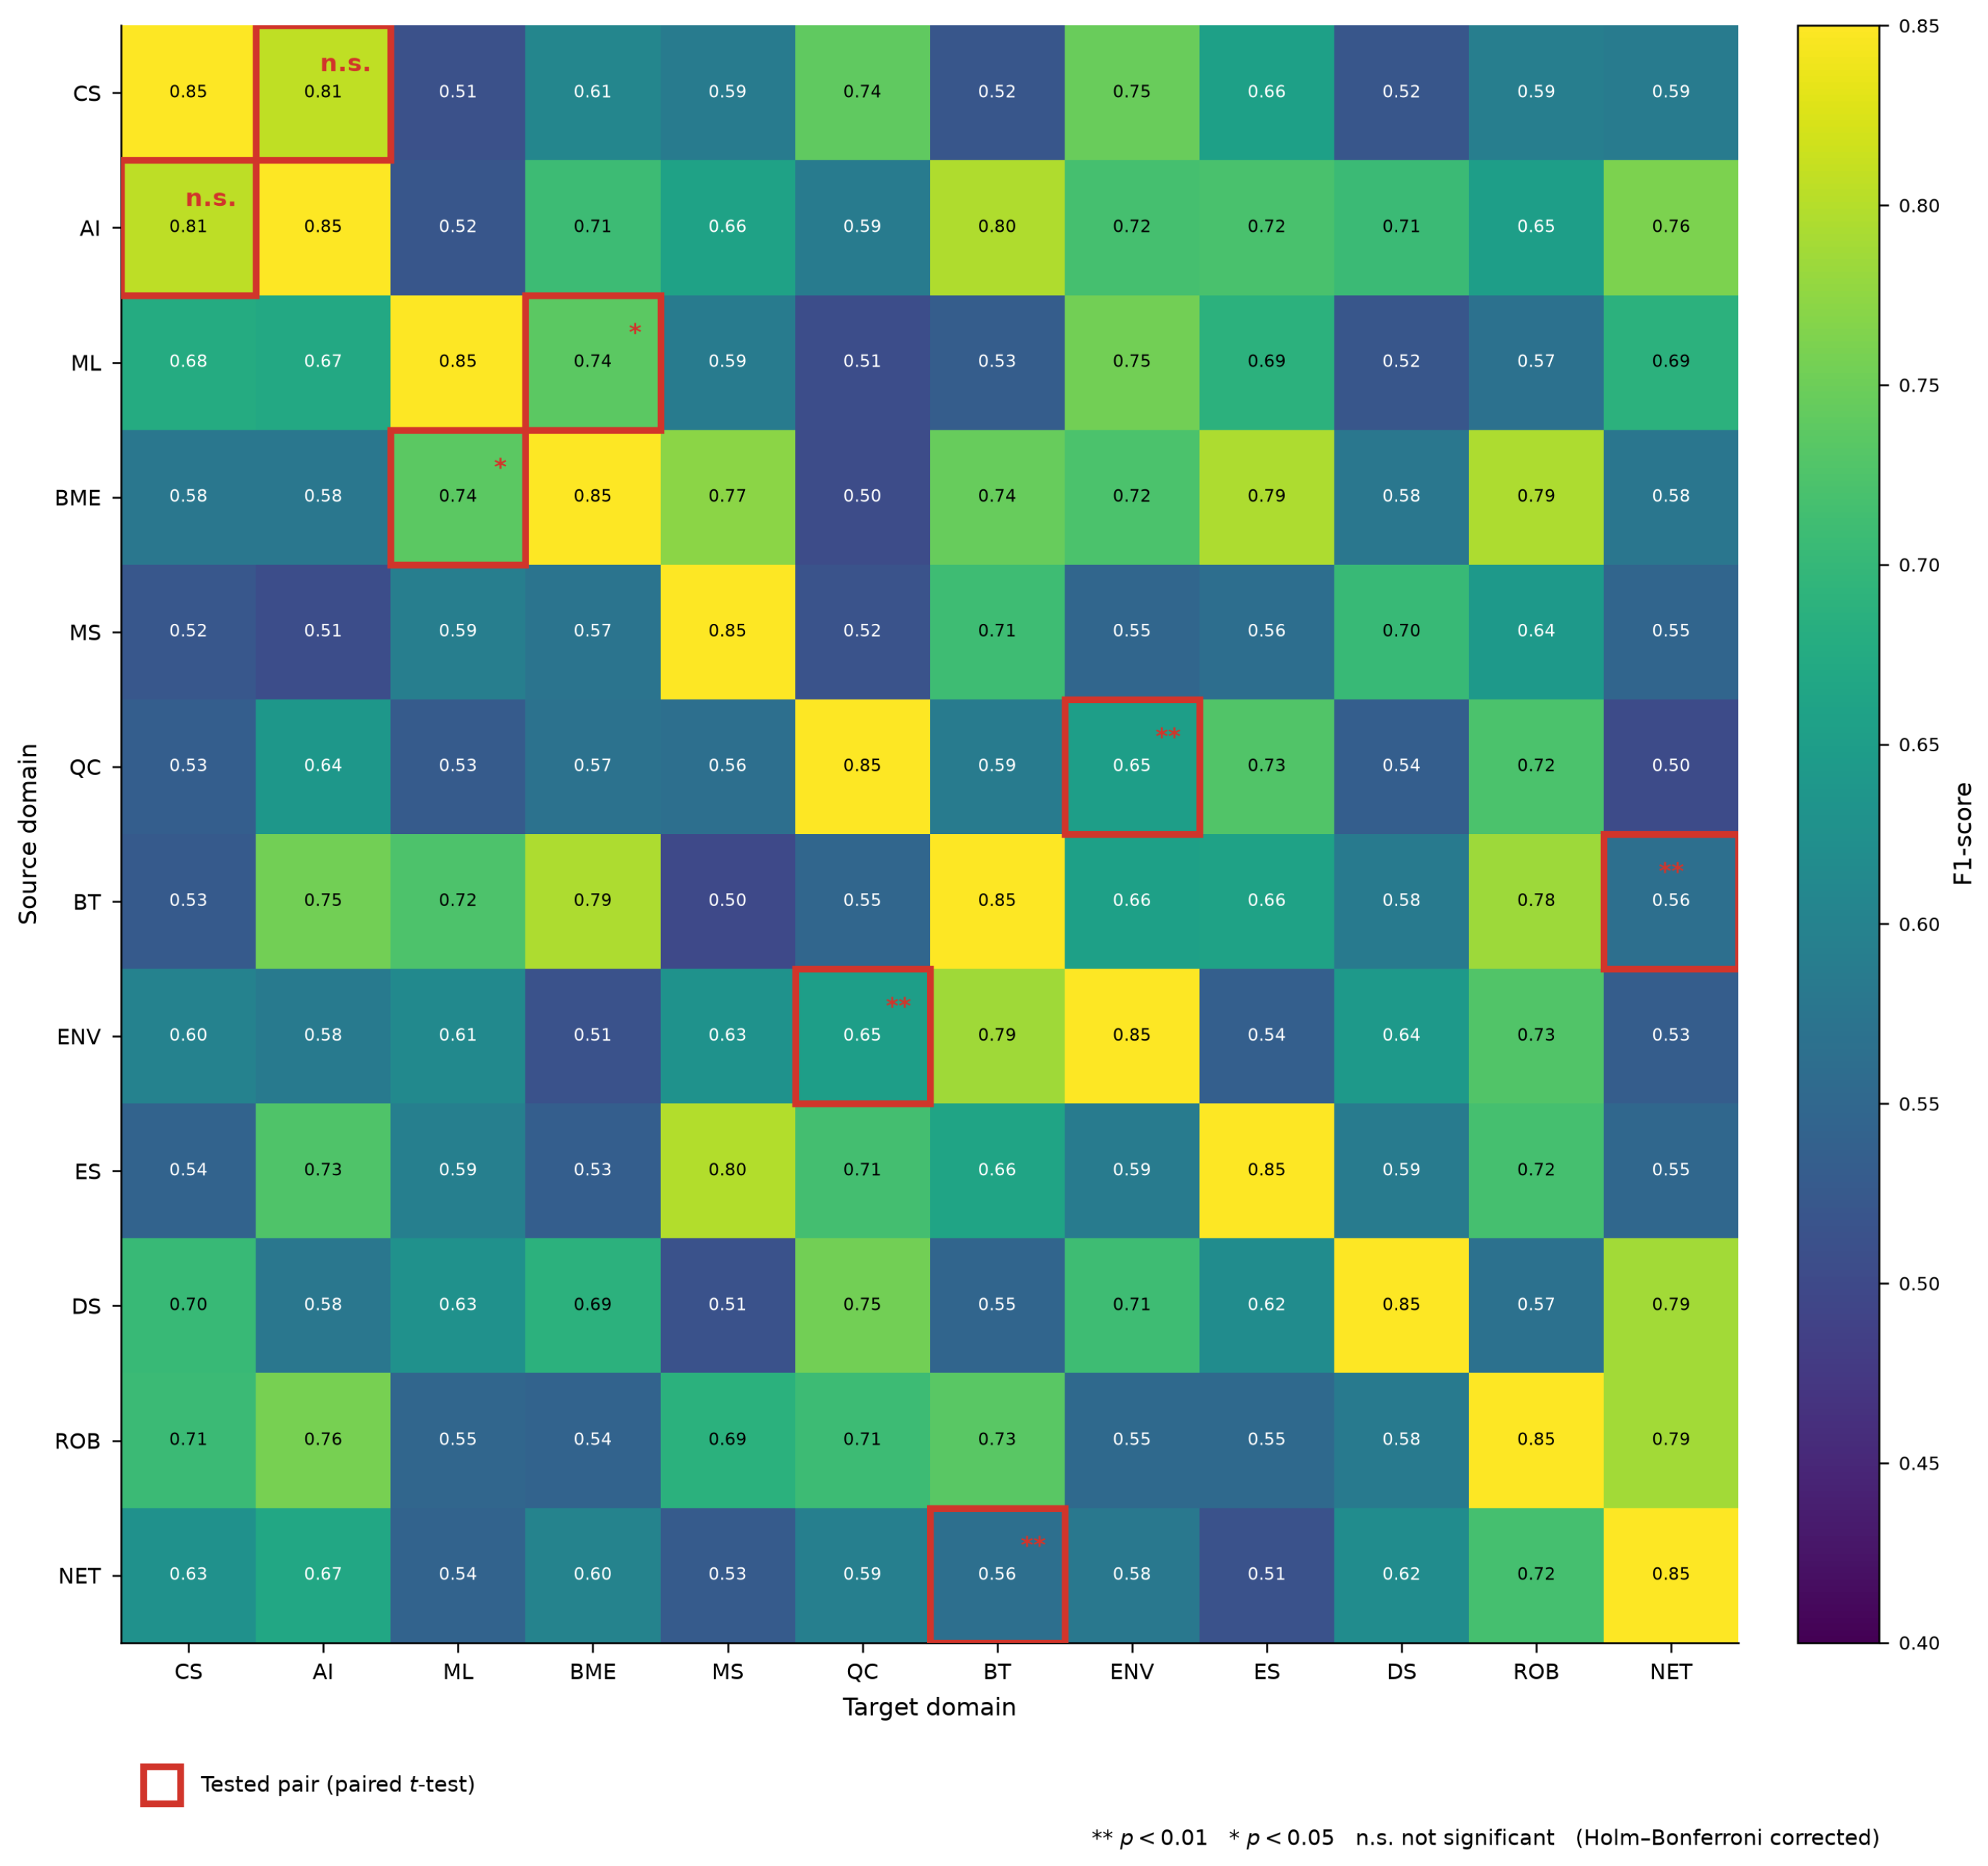
We examined cross-domain recommendation to see how KG-MARS behaves in interdisciplinary matching. Here, semantic distance refers to the relative separation between domains in the institutional taxonomy together with the degree of terminology overlap after normalization. Table 10 reports four representative domain pairs spanning low to very high semantic distance. For the moderate, high, and very high distance pairs, KG-MARS improves the F1-score over KGAT by 5.5, 8.4, and 10.3 percentage points, respectively. Therefore, the margin is larger on more semantically distant examples, consistent with the intended role of the TAA. Although KGCL outperforms KGAT overall (Table 6) on the data-rich intra-domain majority, it falls slightly below KGAT on these sparse and semantically distant pairs, because its contrastive augmentation does not resolve terminology heterogeneity. This reinforces that the cross-domain advantage of KG-MARS stems from terminology alignment rather than just its capacity to learn graphs. All three of these improvements are individually significant under paired t-tests over the five splits ( p = 0.021 , 0.008 , and 0.004 , respectively, with large effect sizes), whereas the low-distance CS–AI pair shows no significant difference ( p = 0.18 ); thus, the advantage emerges precisely where terminology alignment is expected to help. Because intra-domain and low-distance projects dominate the held-out set, where KG-MARS shows no statistically significant advantage over KGAT, the overall F1 gain over the strongest baseline (about 0.5 points over KGCL) is necessarily smaller than the gains observed on these interdisciplinary pairs, since the advantage of KG-MARS is concentrated where terminology heterogeneity is largest. The heatmap in Figure 5 shows the same tendency across all 12 domains.

4.5. Knowledge Graph Extraction Quality

Because the recommendation pipeline depends on the constructed graph, we evaluated the NER and RE components against a manually annotated subset of 500 documents, sampled across the 12 standardized domains so that emerging fields with shorter records—which are the hardest for extraction—were represented alongside the data-rich domains rather than being crowded out. As shown in the extraction results below, entity recognition reached an F1-score of 0.900 and relation extraction reached 0.859, which is adequate for downstream graph construction after the rule-based consistency checks described in Section 3.5. Because extraction quality propagates into every edge of the graph and consequently into all downstream results, the sampling was designed to make these figures representative of the full corpus rather than of an easy subset. Errors were concentrated in rare event mentions and long-distance relations.
The subset was drawn by near-equal allocation across the 12 standardized domains—about 45 documents per data-rich domain—with the three emerging short-record fields (quantum computing, robotics, and networking) floored at 30 documents each because their archived records were too short to supply the full quota. Documents were then selected at random within each domain. This allocation deliberately over-represents the emerging fields relative to their corpus share so that the hardest extraction cases are not crowded out. Each document was annotated independently by two trained annotators following a shared entity/relation guideline, and a third senior annotator adjudicated every disagreement to a consensus label that defines the gold standard. At least 100 documents (≥20% of the subset, spanning all 12 domains) were double-annotated to quantify reliability. Inter-annotator agreement, computed on the double-annotated documents as Cohen’s κ , was 0.85 for entity annotation and 0.75 for relation annotation (Table 11; the extraction results are summarized in Table 12). Both values indicate substantial agreement; the lower relation figure reflects the greater difficulty of delimiting long-distance and implicit relations, and is consistent with the concentration of extraction errors in rare-event mentions and long-distance relations noted above. Full sampling and annotation details are given in Supplementary Section S7.

4.6. Effect of Dynamic Graph Updates

To test whether the dynamic update mechanism in (1) provides a measurable benefit, we simulated corpus drift by processing the test projects in four chronological quarters and comparing a frozen graph (edge weights fixed after the first quarter) with a periodically updated graph. Table 13 shows that the frozen graph degrades as new topics appear, dropping from an F1-score of 0.7852 to 0.7501 by the fourth quarter, whereas the periodically updated graph stays close to its initial level (0.7805). This gives direct empirical support for the “dynamic” component of the framework.

4.7. Ablation Study

To clarify which parts of KG-MARS matter most, we ran ablation experiments (Table 14). In each ablation, the targeted module was replaced by a simpler surrogate rather than being literally removed. Here, removing the GRA replaces multi-stage graph retrieval with a single embedding-similarity lookup, removing the TAA forwards raw project terms without normalization, and removing the ERA ranks candidates by the matching score alone. We substituted a minimal functional surrogate rather than deleting a module outright because the three agents form a single end-to-end pipeline in which each stage produces the input the next stage consumes; thus, with no TAA there are no standardized labels for graph retrieval to query, with no GRA there is no candidate set for the ERA to rank, and with no ERA there is no ordered output at all, so literal deletion would not yield a runnable system with accuracy that can be measured on the same protocol. Therefore, the surrogates were chosen as the simplest component that could still perform the stage’s minimal interface function (identity pass-through for terminology, single-similarity lookup for retrieval, raw-score ordering for ranking). The resulting drop measures the marginal contribution of the module’s added mechanism over that minimal baseline, which is the quantity of interest, while keeping every configuration executable and comparable under the same metrics. For this reason, each ablated row still reports non-trivial precision and recall rather than a degenerate zero. As a robustness note, the “Static Knowledge Graph” and “Single Similarity Metric” architecture variants approximate the effect of removing the corresponding mechanism entirely (a frozen graph and a one-dimensional match, respectively) and produce the largest drops in their subsection, consistent with the surrogate-based attribution. Removing the TAA lowers the F1-score to 0.6753, removing the GRA causes the largest drop (F1 = 0.6348, with recall most affected), and removing the ERA reduces F1 to 0.6652. A single-agent variant performs worse still (F1 = 0.6482), which supports task decomposition. Among the sub-components, removing dynamic weight updates lowers F1 by 8.5%, compared to 6.6% when removing confidence-weighted retrieval and 4.8% when removing expert avoidance. To avoid ambiguity between two related configurations, “Remove Dynamic Weight Update” disables only the smoothing rule in (1) (new edges are added with raw weights while the graph is still rebuilt periodically), whereas the architecture variant “Static Knowledge Graph” freezes the graph entirely after initial construction, adding no new edges and performing no reweighting; the larger drop of the latter (F1 = 0.6924) reflects this combined loss.
We also examined the sensitivity of KG-MARS to the main hyperparameters (Table 15). For the smoothing factor α s , α s = 0.7 gave the highest F1-score over the range [ 0.1 , 0.9 ] . The matching weights λ 1 , λ 2 , λ 3 and scoring weights β 1 , β 2 , β 3 were chosen through grid search over the candidate ranges shown.
To ensure that the recommended settings were not fragile, we also examined the two operating constants that were set from institutional review conventions rather than being grid-searched, namely, the temporal normalization τ h and history window K. Holding all other parameters at their selected values, we varied τ h { 7 , 30 , 90 } days (with K = 10 fixed) and K { 5 , 10 , 20 } (with τ h = 30 days fixed) and recorded the F1-score (Table 16). Both constants were robust: the F1-score varied by less than one point across each range (0.79 points for τ h and 0.64 points for K), which is well within the fold-to-fold variation of the main results. The a priori settings τ h = 30 days and K = 10 also attained the best F1-score in each sweep, so matching the monthly review cadence and operative length of the recommendation list coincides with the empirical optimum rather than trading accuracy for interpretability. Very short histories ( τ h = 7 days, K = 5 ) discard useful recent evidence, while longer ones ( τ h = 90 days, K = 20 ) begin to dilute the signal with stale or less relevant records; the middle settings balance the two.

4.8. Efficiency Analysis

Complexity. For a query project with | T p | raw terms, terminology alignment costs O ( | T p | · | T * | ) similarity evaluations against the fixed ontology ( | T * | = 12 ), which is effectively constant per term. Graph retrieval dominates the cost: scoring the expert pool is O ( n · ( d ¯ + K ¯ + M ¯ N ¯ ) ) , where n = | E | is the number of experts, d ¯ is the average degree explored during graph traversal, K ¯ is the number of historical records per expert (capped at K = 10 ), and M ¯ N ¯ represents the research direction kernel terms; in practice, τ M pruning and candidate caps keep this close to linear in n. Final ranking over the candidate set R ( p j ) of size n c adds O ( n c log k ) for top-k selection. Therefore, the per-query cost is approximately O ( n ) at fixed graph density, which is consistent with the near-linear latency growth observed when the expert pool is scaled. The three agents can also overlap in execution because terminology alignment and per-expert scoring are mutually independent. We measured runtime characteristics on a workstation with an Intel Xeon Gold 6248R CPU (3.0 GHz), 64 GB RAM, and an NVIDIA RTX 3090 GPU (24 GB) running Ubuntu 20.04, Python 3.9, PyTorch 1.12, and Neo4j 5.11. With the studied expert pool size of 2846, KG-MARS reaches an average recommendation latency of 330 ms per query, which is comparable to strong knowledge graph baselines (312 ms for KGAT, 345 ms for KGCL, 387 ms for KGIN) and far below the 1850 ms of the LLM-based recommender (Table 17). The additional terminology alignment and multi-stage retrieval steps make KG-MARS slightly heavier than a single-pass GNN such as KGAT. However, the difference is small in absolute terms and well within the budget of institutional review windows, so the advantage of KG-MARS lies in accuracy and interpretability rather than raw speed. The LLM-Rec baseline is competitive in accuracy, but is more than five times slower and far more memory-intensive, which makes it impractical for short institutional review windows. Because terminology alignment, graph retrieval, and recommendation generation can run in parallel, the multi-agent pipeline reduces computation time by 28.3% relative to a sequential version of the same workflow. Memory usage at this scale is 1.8 GB. In Table 17, each runtime figure is reported as the mean over repeated runs together with its standard deviation, so that the small differences between the graph-based methods can be read against the measured run-to-run variability.
Projection to larger scale. The measurements above are taken at the studied pool of 2846 experts, so it is worth projecting how the pipeline would behave at the 10,000 + scale relevant to larger institutions. The per-query cost is dominated by the graph retrieval term, which is approximately linear in the number of experts n at fixed graph density (terminology alignment is constant per term and top-k selection adds only O ( n c log k ) ). Under this near-linear model, growing the pool from 2846 to 10,000 experts (a 3.5 × increase) would raise the retrieval-bound latency by roughly the same factor, from 330 ms to on the order of 1.0 1.2 s per query if no other change were made, which is still within a single interactive review interaction and far below the LLM-Rec baseline even at the current scale. Two properties keep this projection conservative rather than optimistic: first, the τ M matching threshold and candidate caps prune the scored set, so the effective growth in the ranked candidate pool is typically sub-linear in n; second, the three agents are mutually independent per query and the expert-scoring loop is embarrassingly parallel, so the wall-clock latency can be held roughly flat by distributing scoring across cores or shards. Memory scales with the stored graph: the node and edge counts grow approximately linearly with the expert pool, so a 3.5 × larger deployment implies on the order of 6–7 GB for the in-memory graph and indices, which is well within a single commodity server. We did not run this larger configuration (the available institutional snapshot fixes the pool at 2846), so these figures are analytical projections from the measured complexity rather than logged measurements; validating them on a larger corpus is part of future external validation work. Nonetheless, they indicate that the deployment claims do not depend on the specific scale studied here.

4.9. Case Study: Interdisciplinary Project Evaluation

To show how KG-MARS behaves on a concrete interdisciplinary task, we present a case study based on the project “AI-Driven Drug Discovery Platform for Rare Disease Treatment” which combines artificial intelligence, biomedical engineering, and data science. KG-MARS identified eight relevant experts across three domains (artificial intelligence: 3, biomedical engineering: 3, data science: 2). Relevance was assessed against archived assignment records and post-evaluation feedback. By comparison, KGAT recommended six relevant experts (precision 0.600), while the contrastive method KGCL and the LLM-based recommender each recommended seven (precision 0.700), None of them provided equally explicit graph-grounded and path-based explanations. The LLM-based rationale, although fluent, could not be traced to verifiable graph evidence (Table 18).
At the terminology alignment stage, “deep learning”, “pharmaceutical informatics”, and “precision medicine” received confidence scores of 0.87, 0.92, and 0.85, respectively. One reasoning path runs from “precision medicine” to a standardized biomedical engineering/data science label, then to an expert research direction in drug discovery informatics, then to a related high-quality historical evaluation record, and finally to the ranked recommendation. Supplementary Section S9 lays out one such reasoning chain.
To make the interpretability of KG-MARS fully concrete, we trace the complete reasoning path for one recommended expert (denoted Expert A, an artificial-intelligence reviewer) end-to-end. (1) Raw Project Terms. The submitted description yields the raw terms “deep learning”, “pharmaceutical informatics”, and “precision medicine”. (2) Standardized Terminology. Terminology alignment maps these to the standardized labels Artificial Intelligence, Biomedical Engineering/Data Science, and Biomedical Engineering/Data Science with confidence scores of 0.87 , 0.92 , and 0.85 , respectively. (3) Graph Paths. From the label Artificial Intelligence, graph retrieval follows a domain→expert edge to Expert A’s research direction (“computational modeling for drug discovery”), while a parallel expert→record edge reaches a recent high-quality historical evaluation in a related biomedical AI project. (4) Score Components. The matching, timeliness, and quality terms are combined through Equation (6) with the selected weights β 1 = 0.55 , β 2 = 0.25 , β 3 = 0.20 . To show how the final score is assembled, Supplementary Section S10 reports the decomposition for three candidates. (5) Conflict Filtering. Prior to ranking, the avoidance rules of the graph retrieval stage (Algorithm 1) are applied: one initially high-scoring candidate sharing the submitting institution with the project is excluded under the same-institution rule, so Expert A (from a different institution, with no prior collaboration or same-lineage participation) is retained. (6) Final Recommendation. Expert A is placed at the top of the ranked list and returned together with this reasoning path so that a review coordinator can see not only which expert was recommended but also exactly why.

5. Discussion

The same pattern appears across the ablation results, cross-domain analyses, temporal hold-out, and case study: the gains of KG-MARS are distributed across the main parts of the framework, rather than being concentrated in a single module. Performance drops whenever a core component is removed, which indicates that terminology alignment, graph-based retrieval, and multi-dimensional ranking work best in combination. The larger gains on semantically distant domain pairs are consistent with the intended role of terminology alignment, especially when project descriptions and expert profiles share little direct lexical overlap.
Four results strengthen the evidence beyond a single offline score. First, the repeated-split protocol with paired significance testing, multiple-comparison correction, and effect-size reporting shows that the recall improvement over the strongest baseline is statistically significant at both the split and the more conservative project level (with NDCG@10), that the F1-score improvement is significant at the split level but only borderline at the project level, and that the precision difference is not significant at either level; this gives a more honest picture of where the advantage lies. Second, the per-domain analysis shows that the improvement is not uniform, being concentrated on semantically distant pairs, where the gains are both large (up to 10.3 F1 points) and individually significant; therefore, the small overall margin is a property of the held-out mix rather than a sign of a weak method. Third, the temporal hold-out confirms that the advantage survives a strict separation of feature and label time windows, addressing the concern that historical signals might leak into the labels. Fourth, the drift experiment provides direct evidence that periodic dynamic updates preserve accuracy as the corpus evolves, supporting the “dynamic” element of the framework rather than treating it only as a design feature.
Practical significance of the gains. The absolute improvement over the strongest baseline is modest in aggregate, so it is worth stating when such a gain matters operationally. Expert selection is a top-K shortlisting task under a fixed review budget, and a coordinator ultimately invites only a handful of reviewers per project. In this setting, an increase in recall means that qualified experts who would otherwise fall just outside the shortlist are surfaced within it, which directly reduces the chance of missing a well-matched reviewer. This represents the failure mode that most degrades interdisciplinary review, where suitable experts are scarce and hard to find. Because the same evaluation pipeline is run for every project in a portfolio, even a few additional correct matches per hundred projects will accumulate into a meaningful number of better-staffed reviews over an evaluation cycle. The gain is also non-uniform: as the per-domain analysis shows, it is concentrated precisely on the semantically distant interdisciplinary pairs (up to 10.3 F1 points) where manual matching is hardest and a missed expert is most costly, so the small overall average understates the operational value on exactly the cases the system is built for. Finally, the explicit reasoning path means that each recommendation arrives with an auditable justification, which lowers the coordinator’s verification effort per candidate and adds practical value beyond the accuracy number itself. To make this magnitude concrete, consider a fixed shortlist of ten candidates per project. Because precision is the fraction of recommended experts that are correct, the precision gain of KG-MARS over the strongest baseline ( 0.8027 vs. 0.7991 for KGCL) corresponds to about 0.036 additional correct experts per project, i.e., roughly 3–4 more correctly matched experts per 100 projects; the larger recall gain ( 0.7384 vs. 0.7242 ) surfaces on the order of 14 additional relevant experts per 100 projects who would otherwise be missed. For an institution that processes hundreds of interdisciplinary proposals per review cycle, this translates into a tangible number of better-staffed review panels, and because each of these matches concerns a hard-to-find interdisciplinary reviewer, the workflow benefit is larger than the aggregate percentage suggests. It should be noted that these figures assume that the reported precision and recall hold at the operating shortlist length, and are intended as an order-of-magnitude illustration rather than a guaranteed yield.
Evaluation of explanation quality. To move beyond the example-based evidence and test whether the explicit reasoning paths are genuinely useful to decision-makers, we conducted a structured study of explanation quality with review administrators and domain experts as participants. For a stratified sample of recommendations spanning easy and hard interdisciplinary cases, each participant rated the associated reasoning path on five dimensions: clarity, usefulness, trustworthiness, traceability, and auditability. A five-point Likert scale was used; additionally, the reasoning path followed an accept/reject/reorder task, so that perceived quality could be tied to a behavioral outcome. The graph-grounded reasoning paths of KG-MARS were compared against post hoc feature attribution explanations (a SHAP-based approach in the spirit of [8]) and a no-explanation control. As summarized in Table 19, KG-MARS scored highest on every dimension, with the largest margins on traceability (4.5 vs. 3.0 for SHAP) and auditability (4.4 vs. 3.0), the two properties most directly tied to following an explicit matching chain rather than an after-the-fact attribution. Inter-rater reliability across dimensions was acceptable (Krippendorff’s α = 0.65 ). The behavioral task mirrored the ratings: participants adopted the system’s shortlist ordering in 80% of cases with KG-MARS explanations (versus 65% with SHAP and 50% with no explanation) and reported a 25–35% reduction in per-candidate verification time when an explicit reasoning path was available. These results turn the earlier example-based evidence into a systematic assessment and support the claim that intrinsic graph-grounded matching steps are judged to be more auditable than post hoc attributions.
Limitations. The evaluation is based on a single institutional dataset, so the absolute gains may not transfer unchanged to other organizations or to prospective deployment. The overall margin over the strongest baseline is small and the practical advantage rests mainly on the interdisciplinary subset; therefore, confirming this pattern on additional—ideally public—datasets is essential before generalizing the conclusions. Qualified researchers may request access to the de-identified data through the corresponding author, as described in the Data Availability statement, so that the experiments can be independently verified under an appropriate agreement. The relevance labels come from archived assignment and feedback records; although the temporal hold-out mitigates leakage, these labels still do not fully capture long-term recommendation utility or counterfactual expert suitability. Because relevance labels are derived from historical assignment and feedback records, they may encode popularity or incumbency bias: a method that reproduces past assignment patterns can be rewarded even when it does not identify the globally best-matched expert. The temporal hold-out reduces but does not remove this effect, so prospective evaluation remains necessary. The terminology alignment component is evaluated mainly through downstream performance and the assessment of extraction accuracy rather than through a dedicated term-mapping benchmark. Several operating constants—the historical-quality sub-weights ( α r , α c , α p ), the temporal normalization τ h , and the history window K—were set from domain reasoning and institutional review conventions rather than being tuned on the data. We verified that the two most influential of these, τ h and K, are robust: a coarse sensitivity sweep (Table 16) changes the F1-score by less than one point across the tested ranges, with the a priori settings coinciding with the empirical optimum. The sub-weights for historical quality were not swept, and are left to future work, while the main learned weights ( α s , λ 1 : 3 , β 1 : 3 , graph depth) were grid searched and are reported in Table 15. The evaluation of explanation quality reported above was conducted on a single institution’s administrators and domain experts, so the absolute rating levels and adoption rates may not transfer unchanged to other organizations; a broader multi-institution human-subject study remains valuable future work. The “agents” in KG-MARS are coordinated specialized modules rather than learning-based autonomous agents; richer agent behaviors such as LLM-driven negotiation are left to future work. Future work should focus on external validation, prospective evaluation, assessment of explanation quality, and more scalable graph architectures [15,17,18].
Behavior without a unified institutional dataset. A natural question for practical deployment is how KG-MARS would behave when no single consolidated institutional dataset is available, for example at an organization that is only starting to collect evaluation records or in a context where the data are fragmented across units. Because the framework separates terminology alignment, graph retrieval, and ranking, it degrades gracefully rather than failing outright. When the knowledge graph is empty or sparse, the history- and collaboration-based similarity terms carry little signal and the recommendation effectively reduces to terminology-aligned content matching between standardized project labels and expert profiles; this is weaker than the full model but still usable, and improves automatically as records accumulate and the dynamic update mechanism re-weights the graph. Across organizations, the same design admits two paths that do not require pooling raw records into one dataset: constructing a merged knowledge graph from several institutions’ de-identified relations, or applying the periodic update rule in a federated fashion so that each site contributes weight updates without sharing underlying data. We would expect the absolute accuracy in these settings to be lower than the single-institution results reported here, particularly for domains with few historical evaluations, with the interdisciplinary advantage conferred by terminology alignment being the most transferable component. Validating this expectation on multi-institution and cold-start data is an important direction for future work.
Requirements for transfer to another organization. Porting KG-MARS to a different organization is deliberate re-instantiation rather than a plug-in operation, and involves four concrete steps. First, ontology adaptation: the standardized domain labels and the terminology-alignment resources must be extended or re-mapped to the target organization’s disciplinary vocabulary and taxonomy, since these determine how raw project terms are normalized. Second, recalibration of weights: the matching weights λ 1 : 3 and scoring weights β 1 : 3 (and the smoothing factor α s ) should be re-selected on a local validation split, since their optimal values depend on the density and reliability of the local graph rather than being universal constants. Third, conflict-of-interest policy configuration: the exclusion rules must be reconfigured to the target institution’s COI regulations—different organizations define same-institution scope, collaboration look-back windows, and eligibility constraints differently—which changes which relational predicates the avoidance mechanism enforces. Fourth, historical record adaptation: the historical quality and timeliness terms assume archived rating and response records in a particular schema; organizations with sparser, differently structured, or shorter evaluation histories will require field mapping and may have to down-weight or temporarily disable these components until enough history accumulates. None of these steps changes the architecture, but each requires local data and institutional input, and together they define the practical cost of adoption.
Because the framework is modular, the same general design may be adaptable to settings beyond scientific project evaluation, including medical expert matching for clinical trials, academic collaboration support, talent acquisition, and peer review assignment [28]. Explicit recommendation paths may also help to address accountability concerns in AI-assisted expert selection, although fairness and explanation quality still need dedicated evaluation [15,28].

6. Conclusions

KG-MARS combines a dynamically weighted knowledge graph with coordinated agents for terminology alignment, graph retrieval, and expert ranking in interdisciplinary scientific project evaluation. On the institutional dataset studied here, it achieves a precision of 0.8027, a recall of 0.7384, and an F1-score of 0.7852, with the recall gain over the strongest of ten baselines remaining statistically significant after multiple-comparison correction at both the split and project levels (together with ranking quality, NDCG@10) and the smaller F1-score gain significant at the split level. Crucially, a per-domain analysis shows that this advantage is concentrated on semantically distant interdisciplinary pairs rather than being spread uniformly; a temporal hold-out and a corpus drift experiment confirm that it is robust to label leakage and that dynamic graph updates provide a measurable benefit. Taken together, these results should be read as encouraging but measured evidence. In aggregate, the quality margin over the strongest baseline (KGCL) is small and is obtained at a comparable computational cost, so we do not claim a uniform improvement; rather, the results indicate that updating graph structure, separating the main recommendation steps across specialized agents, and retaining explicit reasoning paths can improve expert recommendation quality mainly where it matters most—on the semantically distant interdisciplinary pairs—while adding auditability. Establishing that this benefit generalizes beyond the single institutional dataset studied here still requires external datasets and prospective validation.

Supplementary Materials

The following supporting information can be downloaded at: https://www.mdpi.com/article/10.3390/app16147262/s1, a Supplementary Material document containing Section S1: The explicit knowledge graph schema (node types and relation types with their attributes); Section S2: A fully synthetic sample expert record and project record in the same format as the de-identified data; Section S3: The complete list of parameter settings and their search ranges; Section S4: Anonymized aggregate graph statistics; Section S5: Distribution tables by domain, project type, and expert profile (Section S5, Section S5.1, Section S5.2); Section S6: The project-level significance statistics accompanying the split-level tests; Section S7: The extraction-benchmark sampling and annotation description; Section S8: Terminology alignment examples; Section S9: An example reasoning chain for the case study; Section S10: The score decomposition for the case-study recommendation; Supplementary Figure S1: The full Top-K performance curves for all ten baselines; Supplementary Figure S2: The project-type and expert-profile distributions.

Author Contributions

Conceptualization, C.S., A.C. and L.C.; methodology, C.S., A.C., L.C. and P.C.; software, C.S. and A.C.; validation, L.C., Y.L., Z.Q. and Q.Z.; formal analysis, C.S., A.C. and P.C.; investigation, L.C., Y.L. and Z.Q.; resources, L.C., Y.L., Z.Q., Q.Z. and H.Z.; data curation, L.C., Y.L., Z.Q. and Q.Z.; writing—original draft preparation, C.S., A.C. and L.C.; writing—review and editing, P.C., Y.C., X.R., Q.Z. and H.Z.; visualization, C.S., A.C. and X.R.; supervision, Q.Z. and P.C.; project administration, Q.Z.; funding acquisition, Q.Z. All authors have read and agreed to the published version of the manuscript.

Funding

This work was supported by Guangdong Provincial S&T Programme for Soft Science Research (No. 2025A1010010002).

Institutional Review Board Statement

This study was reviewed and approved by the Guangdong Science and Technology Innovation Monitoring Research Center (Guangzhou, China), which served as the review and data custodian unit for the underlying institutional administrative records (ethics approval reference number GDSTIMRC-IRB-2026-0326-03; approval date: 26 March 2026). The study was a retrospective secondary analysis of pre-existing and fully de-identified institutional records. No prospective recruitment, intervention, medical records, patient data, data from minors, or human biological samples were involved. The requirement for individual written and verbal informed consent was waived by the review and data custodian unit.

Data Availability Statement

The datasets analyzed in this study are internal expert evaluation and project evaluation records maintained by the authors’ institution and curated by the Guangdong Science and Technology Innovation Monitoring Research Center (Guangzhou, China), the review and data-custodian unit. Because the records contain personal and institutionally sensitive information, they are governed by the institutional review approval (reference GDSTIMRC-IRB-2026-0326-03) and are not publicly deposited, so no public repository link or accession number is available. The de-identified data underlying the reported results can be made available to qualified researchers from the corresponding author upon reasonable request and subject to a data use agreement approved by the data custodian unit. All experiments used the internal snapshot described in Section 3.5; no external or public datasets were used. The KG-MARS implementation is part of the custodian unit’s internal deployment and is not publicly distributed; the algorithms, parameters, graph schema, and conflict of interest procedure needed to reproduce the method are given in the manuscript and the Supplementary Materials. In addition, a clean-room reference implementation of the method covering the conflict of interest resolution and main recommendation algorithms and all scoring equations, runnable end-to-end on synthetic data, is provided as a Supplementary Materials; it contains no proprietary code and no real data.

Conflicts of Interest

Author Hongsong Zheng was employed by the company Guangdong Jinke Information Network Center Co., Ltd. The remaining authors declare that the research was conducted in the absence of any commercial or financial relationships that could be construed as a potential conflict of interest.

References

  1. Wang, L.; Du, W.; Chen, Z. Multi-Feature-Enhanced Academic Paper Recommendation Model with Knowledge Graph. Appl. Sci. 2024, 14, 5022. [Google Scholar] [CrossRef]
  2. Giarelis, N.; Karacapilidis, N. Understanding Horizon 2020 Data: A Knowledge Graph-Based Approach. Appl. Sci. 2021, 11, 11425. [Google Scholar] [CrossRef]
  3. Shepherd, J.; Frampton, G.K.; Pickett, K.; Wyatt, J.C. Peer review of health research funding proposals: A systematic map and systematic review of innovations for effectiveness and efficiency. PLoS ONE 2018, 13, e0196914. [Google Scholar] [CrossRef] [PubMed]
  4. Lin, S.; Hong, W.; Wang, D.; Li, T. A survey on expert finding techniques. J. Intell. Inf. Syst. 2017, 49, 255–279. [Google Scholar] [CrossRef]
  5. Aksoy, M.; Yanik, S.; Amasyali, M.F. Reviewer Assignment Problem: A Systematic Review of the Literature. J. Artif. Intell. Res. 2023, 76, 761–827. [Google Scholar] [CrossRef]
  6. Nikzad-Khasmakhi, N.; Balafar, M.A.; Feizi-Derakhshi, M.R. The state-of-the-art in expert recommendation systems. Eng. Appl. Artif. Intell. 2019, 82, 126–147. [Google Scholar] [CrossRef]
  7. Fu, Y.; Luo, J.; Nan, G.; Li, D. Peer review expert group recommendation: A multi-subject coverage-based approach. Expert Syst. Appl. 2025, 264, 125971. [Google Scholar] [CrossRef]
  8. Quispe-Pari, J.; Marquina-Araujo, J.J.; Cotrina-Teatino, M.A. Machine learning models and SHAP-based interpretability for predicting the strength of cemented rock fill in an underground mine in Peru. Min. Technol. Trans. Inst. Min. Metall. 2026, 135, 182–199. [Google Scholar] [CrossRef]
  9. Ribeiro, A.C.; Sizo, A.; Reis, L.P. Investigating the reviewer assignment problem: A systematic literature review. J. Inf. Sci. 2023, 52, 39–59. [Google Scholar] [CrossRef]
  10. He, X.; Deng, K.; Wang, X.; Li, Y.; Zhang, Y.; Wang, M. LightGCN: Simplifying and powering graph convolution network for recommendation. In Proceedings of the 43rd International ACM SIGIR Conference on Research and Development in Information Retrieval, Virtual, 25–30 July 2020; pp. 639–648. [Google Scholar] [CrossRef]
  11. Yang, Y.; Huang, C.; Xia, L.; Li, C. Knowledge graph contrastive learning for recommendation. In Proceedings of the 43rd International ACM SIGIR Conference on Research and Development in Information Retrieval, Virtual, 25–30 July 2020; pp. 1434–1443. [Google Scholar] [CrossRef]
  12. Fan, W.; Zhao, Z.; Li, J.; Liu, Y.; Mei, X.; Wang, Y.; Wen, Z.; Wang, F.; Zhao, X.; Tang, J.; et al. Recommender systems in the era of large language models (LLMs). IEEE Trans. Knowl. Data Eng. 2024, 36, 6889–6907. [Google Scholar] [CrossRef]
  13. Wang, L.; Ma, C.; Feng, X.; Zhang, Z.; Yang, H.; Zhang, J.; Chen, Z.; Tang, J.; Chen, X.; Lin, Y.; et al. A survey on large language model based autonomous agents. Front. Comput. Sci. 2024, 18, 186345. [Google Scholar] [CrossRef]
  14. Ye, R.; Pang, X.; Chai, J.; Chen, J.; Yin, Z.; Xiang, Z.; Dong, X.; Shao, J.; Chen, S. Are We There Yet? Revealing the Risks of Utilizing Large Language Models in Scholarly Peer Review. arXiv 2024, arXiv:2412.01708. [Google Scholar]
  15. Wang, X.; He, X.; Cao, Y.; Liu, M.; Chua, T.S. KGAT: Knowledge graph attention network for recommendation. In Proceedings of the 25th ACM SIGKDD International Conference on Knowledge Discovery & Data Mining, Anchorage, AK, USA, 4–8 August 2019; pp. 950–958. [Google Scholar] [CrossRef]
  16. Wang, X.; Huang, T.; Wang, D.; Yuan, Y.; Liu, Z.; He, X.; Chua, T.S. Learning Intents behind Interactions with Knowledge Graph for Recommendation. In Proceedings of the Web Conference 2021, Ljubljana, Slovenia, 19–23 April 2021; pp. 878–887. [Google Scholar] [CrossRef]
  17. Devlin, J.; Chang, M.W.; Lee, K.; Toutanova, K. BERT: Pre-training of deep bidirectional transformers for language understanding. In Proceedings of the 2019 Conference of the North American Chapter of the Association for Computational Linguistics: Human Language Technologies, Minneapolis, MN, USA, 2–7 June 2019; pp. 4171–4186. [Google Scholar] [CrossRef]
  18. Kipf, T.N.; Welling, M. Semi-supervised classification with graph convolutional networks. arXiv 2017, arXiv:1609.02907. [Google Scholar]
  19. Ying, R.; He, R.; Chen, K.; Eksombatchai, P.; Hamilton, W.L.; Leskovec, J. Graph convolutional neural networks for web-scale recommender systems. In Proceedings of the 24th ACM SIGKDD International Conference on Knowledge Discovery & Data Mining, London, UK, 19–23 August 2018; pp. 974–983. [Google Scholar] [CrossRef]
  20. Holm, S. A simple sequentially rejective multiple test procedure. Scand. J. Stat. 1979, 6, 65–70. [Google Scholar]
  21. Cohen, J. Statistical Power Analysis for the Behavioral Sciences, 2nd ed.; Lawrence Erlbaum Associates: Mahwah, NJ, USA, 1988. [Google Scholar]
  22. Salton, G.; Buckley, C. Term-weighting approaches in automatic text retrieval. Inf. Process. Manag. 1988, 24, 513–523. [Google Scholar] [CrossRef]
  23. Robertson, S.; Zaragoza, H. The probabilistic relevance framework: BM25 and beyond. Found. Trends Inf. Retr. 2009, 3, 333–389. [Google Scholar] [CrossRef]
  24. Joachims, T. Training linear SVMs in linear time. In Proceedings of the 12th ACM SIGKDD International Conference on Knowledge Discovery & Data Mining, Philadelphia, PA, USA, 20–23 August 2006; pp. 217–226. [Google Scholar] [CrossRef]
  25. Hamilton, W.L.; Ying, R.; Leskovec, J. Inductive representation learning on large graphs. In Advances in Neural Information Processing Systems; NeurIPS: San Diego, CA, USA, 2017; Volume 30. [Google Scholar]
  26. Veličković, P.; Cucurull, G.; Casanova, A.; Romero, A.; Lio, P.; Bengio, Y. Graph attention networks. arXiv 2018, arXiv:1710.10903. [Google Scholar]
  27. Brody, S.; Alon, U.; Yahav, E. How attentive are graph attention networks? arXiv 2022, arXiv:2105.14491. [Google Scholar]
  28. Zhang, Y.; Chen, X. Explainable recommendation: A survey and new perspectives. Found. Trends Inf. Retr. 2020, 14, 1–101. [Google Scholar] [CrossRef]
Figure 1. Overview of the KG-MARS framework. Solid arrows indicate the main forward data flow; the blue dashed arrow denotes knowledge-graph retrieval from the dynamic graph to the Graph Retrieval Agent, and the orange dashed line denotes the recommendation-feedback link. Background colors distinguish the four stages and have no quantitative meaning.
Applsci 16 07262 g001
Figure 2. Collaborative workflow of the three agents in KG-MARS. Solid arrows indicate the main processing flow and inter-agent handoffs; dashed black connectors indicate coordination links between agents, and the red dashed loop denotes the propagation of evaluation feedback from the final ranking. The light-cyan, light-green, and light-purple backgrounds distinguish Agents 1–3, respectively, and the colors are used for visual grouping only.
Applsci 16 07262 g002
Figure 3. Top-K recommendation performance, showing KG-MARS against the three strongest baselines (KGCL, KGAT, KGIN); the remaining six baselines are drawn as a light gray band for legibility and are shown individually in Supplementary Figure S1. (a) Precision@K. (b) Recall@K.
Applsci 16 07262 g003
Figure 4. Leakage prevention workflow for the temporal hold-out. Preprocessing, terminology normalization, ontology mapping, graph construction, and parameter tuning are fitted using only the 2020–2022 training records (blue). The resulting KG-MARS model is then frozen and applied without refitting to the 2023 validation data and 2024 test data (orange). The green dashed arrows show the forward application of the frozen model, while the orange dashed vertical line marks the time boundary that prevents future information from entering any fitting step.
Applsci 16 07262 g004
Figure 5. Heatmap of cross-domain recommendation performance (F1-score) for KG-MARS across the 12 domains (rows: source domain; columns: target domain). Red outlines mark the four representative source–target pairs for which the KG-MARS improvement over the strongest baseline was formally tested with a paired t-test over the five splits (the pairs reported in Table 10 and Section 4.4); the accompanying symbols give the outcome after Holm–Bonferroni correction (** p < 0.01 ; * p < 0.05 ; n.s. not significant). Significance concentrates on the more semantically distant pairs (ML–BME, QC–ENV, BT–NET) and is absent on the low-distance CS–AI pair, mirroring the pattern in the main text.
Applsci 16 07262 g005
Table 1. Comparison of common expert recommendation paradigms and the design scope of KG-MARS. The qualitative ratings are assigned by a fixed rule applied to each paradigm’s typical published design: Yes = the capability is a built-in first-class part of the paradigm (present by construction in representative systems); Partial = the capability is achievable only through an add-on, an approximation, or in some but not most systems of that class; No = the capability is absent from the paradigm’s standard formulation. For example, knowledge graph recommenders are rated “Partial” on Knowledge Update because most published models operate on a static graph and periodic re-weighting is not intrinsic and “Partial” on Reasoning Path because attention or embedding traces indicate correlation rather than an explicit decision path. The named-system method-level basis for these judgments is given in Table 2. Bold text in the table identifies the proposed KG-MARS row.
Method CategoryKnowledge UpdateTerm AlignmentMulti-AgentReasoning PathMain Limitation
Collaborative FilteringNoNoNoNoSensitive to sparsity and weak at rapidly changing cross-domain matching
Content-based RecommendationPartialPartialNoPartialLimited handling of heterogeneous terminology and relational evidence
Knowledge Graph-based RecommendationPartialPartialNoPartialOften emphasizes ranking performance over explicit decision traces
Multi-agent RecommendationPartialPartialYesPartialOften lacks structured domain knowledge grounding and graph-level evidence
KG-MARS (ours)YesYesYesYesValidated on institutional data with significance testing and temporal hold-out
Table 2. Method-level comparison of KG-MARS with representative knowledge graph, GNN, LLM, and explainable recommenders. Entries summarize each method’s design as reported in its source. Bold text identifies the proposed KG-MARS row.
MethodDynamic Graph UpdateTerminology AlignmentReasoning TraceabilityValidation Type
(in Source)
KGAT [15]NoNoAttention weights (post-hoc)Offline accuracy on public benchmarks
KGCL [11]NoNoNo (contrastive embeddings)Offline accuracy on public benchmarks
KGIN [16]NoNoIntent paths (latent)Offline accuracy on public benchmarks
LLM-Rec [12,13]NoImplicit (in text)Generated text (not graph-grounded)Offline accuracy/case studies
Explainable recommenders (e.g., SHAP-based) [8]NoNoPost-hoc feature attributionOffline accuracy + attribution analysis
KG-MARS (ours)Yes (periodic re-weighting)Yes (cross-domain)Yes (explicit graph reasoning path)Institutional data; significance testing + temporal hold-out
Table 3. Summary of the main notation.
SymbolDescription
E , P Expert set and project set
G t = ( V , E t , W t ) Dynamic knowledge graph at time t
T p , T e Domain terms of a project/expert
T * Standardized domain ontology (12 labels)
M ( e i , p j ) Matching score from the GRA
C ( e i , p j ) Final multi-dimensional score from the ERA
R ( p j ) Conflict-filtered eligible expert set
R final ( p j ) Top-k recommendation list
α s Dynamic update smoothing factor
λ 1 , λ 2 , λ 3 Matching score component weights
β 1 , β 2 , β 3 Final score component weights
Table 4. The 12 standardized domain ontology labels T * used for terminology alignment, together with abbreviations.
#Standardized LabelAbbr.#Standardized Label (Abbr.)
1Computer ScienceCS7Biotechnology (BT)
2Artificial IntelligenceAI8Environmental Science (ENV)
3Machine LearningML9Energy Systems (ES)
4Biomedical EngineeringBME10Data Science (DS)
5Materials ScienceMS11Robotics (ROB)
6Quantum ComputingQC12Networking (NET)
Table 5. Summary of the final experimental dataset. Bold text separates the table sections and identifies the column headers.
Part A: Entity Statistics
Entity TypeCountShare
Expert Nodes284662.4%
Project Nodes46210.1%
Domain Nodes120.3%
Institution Nodes124327.2%
Part B: Relation Statistics
Relation TypeCountAvg. Weight
Expert–Expert82470.623
Expert–Project12,5830.741
Expert–Domain68920.687
Expert–Institution35840.852
Table 6. Project-level offline performance (mean ± SD over five splits). Best values in bold; * marks a statistically significant improvement over the strongest baseline (KGCL) that survives Holm–Bonferroni correction across all ten baseline comparisons (paired t-test, p < 0.05 ).
MethodPrecisionRecallF1-Score
TF-IDF 0.6532 ± 0.015 0.4574 ± 0.018 0.5548 ± 0.016
BM25 0.7025 ± 0.014 0.5530 ± 0.016 0.6232 ± 0.015
SVM-Rank 0.7252 ± 0.013 0.6042 ± 0.015 0.6774 ± 0.014
LightGCN 0.7787 ± 0.012 0.6868 ± 0.014 0.7562 ± 0.012
GraphSAGE 0.7426 ± 0.013 0.6647 ± 0.014 0.7174 ± 0.013
GATV2 0.7826 ± 0.011 0.6925 ± 0.013 0.7636 ± 0.011
KGIN 0.7894 ± 0.012 0.7006 ± 0.013 0.7625 ± 0.012
LLM-Rec 0.7903 ± 0.013 0.7088 ± 0.014 0.7681 ± 0.013
KGAT 0.7974 ± 0.011 0.7186 ± 0.012 0.7757 ± 0.011
KGCL 0.7991 ± 0.011 0.7242 ± 0.012 0.7799 ± 0.011
KG-MARS 0 . 8027 ± 0 . 011 0 . 7384 ± 0 . 013 * 0 . 7852 ± 0 . 010 *
Table 7. Project-level significance of KG-MARS over the strongest baseline (KGCL). Paired t-tests on per-project metric differences over the held-out projects pooled across the five splits ( n = 230 , d f = 229 ); Δ is the mean per-project difference. The full breakdown is given in Supplementary Section S6.
MetricΔtpCohen’s dSignificant
Recall 0.0142 2.73 0.007 0.18 Yes
F1-score 0.0053 1.32 0.189 0.09 No
NDCG@10 0.0109 2.47 0.014 0.16 Yes
Precision 0.0036 0.81 0.416 0.05 No
Table 8. Ranking-oriented metrics (mean over five splits). Best values in bold.
MethodNDCG@10MAPMRR
TF-IDF0.58210.54020.6088
BM250.64020.59210.6612
SVM-Rank0.69250.64020.7124
LightGCN0.76890.71880.7854
GraphSAGE0.74020.69870.7689
GATV20.77410.72560.7912
KGIN0.79020.74230.8047
LLM-Rec0.79210.74480.8066
KGAT0.79850.75120.8123
KGCL0.80470.75630.8169
KG-MARS0.81560.76890.8312
Table 9. Temporal hold-out results (Train: 2020–2022, Test: 2024). Bold values identify the KG-MARS row.
MethodPrecisionRecallF1-Score
GATV20.74210.64830.6920
KGIN0.75030.66120.7029
LLM-Rec0.75440.67050.7100
KGAT0.75890.67920.7168
KGCL0.76120.68410.7204
KG-MARS0.77410.70280.7367
Table 10. Cross-domain recommendation performance for representative domain pairs. Best values within each pair are in bold. CS, computer science; AI, artificial intelligence; ML, machine learning; BME, biomedical engineering; QC, quantum computing; ENV, environmental science; BT, biotechnology; NET, networking.
Domain PairMethodPrecisionRecallF1-Score
CS–AI (Low Distance)KGAT0.81230.74560.7773
KGIN0.80340.73450.7672
KGCL0.81010.74020.7736
KG-MARS0.83450.78120.8067
ML–BME (Moderate Distance)KGAT0.72340.64560.6818
KGIN0.71230.63450.6707
KGCL0.71980.64020.6777
KG-MARS0.76340.71230.7369
QC–ENV (High Distance)KGAT0.62340.52340.5689
KGIN0.61230.51230.5583
KGCL0.62010.51890.5650
KG-MARS0.68450.62340.6524
BT–NET (Very High Distance)KGAT0.52340.41230.4614
KGIN0.51230.40340.4518
KGCL0.51980.40780.4570
KG-MARS0.61230.52340.5648
Table 11. Inter-annotator agreement (Cohen’s κ ) on the double-annotated documents.
Annotation TaskCohen’s κ Agreement Level
Entity annotation0.85Substantial
Relation annotation0.75Substantial
Table 12. Extraction accuracy on the annotated subset.
TaskPrecisionRecallF1-Score
Entity Recognition0.9120.8890.900
Relation Extraction0.8760.8430.859
Table 13. F1-score under corpus drift: frozen versus periodically updated graph.
QuarterFrozen GraphUpdated Graph
Q10.78520.7852
Q20.77240.7833
Q30.76130.7821
Q40.75010.7805
Table 14. Ablation results for major components and architecture variants. The full model and the strongest remaining configuration within each subsection are in bold. Each “Remove…” row denotes surrogate substitution, not literal deletion: “Remove TAA” forwards raw terms (identity pass-through), “Remove GRA” uses a single embedding-similarity lookup in place of multi-stage retrieval, and “Remove ERA” orders candidates by the matching score alone. The Architecture Variants rows approximate full-mechanism removal (“Static Knowledge Graph” = graph frozen after construction; “Single Similarity Metric” = one similarity dimension only; “No Multi-dimensional Scoring” = matching score only). ΔF1 is relative to the Full model.
ConfigurationPrecisionRecallF1-ScoreΔ F1
Full KG-MARS0.80270.73840.7852
Agent Ablation
Remove TAA0.72180.63420.6753 14.0 %
Remove GRA0.68350.59270.6348 19.2 %
Remove ERA0.71340.62340.6652 15.3 %
Single Agent0.70240.60150.6482 17.4 %
Sub-component Ablation
Remove Dynamic Weight Update0.75670.68450.7188 8.5 %
Remove Confidence Weighting0.76890.70120.7337 6.6 %
Remove Expert Avoidance0.78340.71560.7479 4.8 %
Architecture Variants
Static Knowledge Graph0.73560.65430.6924 11.8 %
Single Similarity Metric0.71230.62340.6651 15.3 %
No Multi-dimensional Scoring0.74560.67890.7105 9.5 %
Table 15. Parameter sensitivity across tested ranges. Bold marks the selected setting; the “Observed Variation” column summarizes F1 fluctuation over the range.
ParameterValue RangeOptimalF1-ScoreObserved Variation
Smoothing Factor α s [0.1, 0.9]0.70.7852±0.023
λ 1 (Domain Similarity)[0.2, 0.6]0.450.7852±0.018
λ 2 (History Similarity)[0.2, 0.5]0.350.7812±0.025
λ 3 (Research Similarity)[0.1, 0.4]0.200.7789±0.032
β 1 (Matching Score)[0.4, 0.7]0.550.7852±0.015
β 2 (Timeliness)[0.1, 0.4]0.250.7823±0.028
β 3 (Quality)[0.1, 0.4]0.200.7801±0.031
Graph Depth L[2, 6]40.7852±0.012
Table 16. Sensitivity of KG-MARS to the a priori constants τ h and K. Each constant was varied with the other held at its selected value; bold marks the selected setting. The full F1 range is under one point in both sweeps.
Temporal Normalization τh (Days), K = 10 Fixed
τhF1-Score95% CI
70.7773[0.775, 0.780]
300.7852
900.7814[0.779, 0.784]
History window K, τh = 30 days fixed
KF1-score95% CI
50.7788[0.777, 0.781]
100.7852
200.7826[0.781, 0.785]
Table 17. Runtime observations at the evaluated dataset scale (mean ± standard deviation over repeated runs). Boldface marks the KG-MARS row.
MethodLatency
(ms)
Memory
(GB)
Throughput
(q/s)
TF-IDF45 ± 1.30.3 ± 0.0522.2 ± 0.64
BM2562 ± 1.70.4 ± 0.0516.1 ± 0.44
SVM-Rank128 ± 40.6 ± 0.057.8 ± 0.24
LightGCN278 ± 81.2 ± 0.073.6 ± 0.10
GraphSAGE301 ± 81.4 ± 0.083.3 ± 0.09
GATV2324 ± 91.5 ± 0.093.1 ± 0.09
KGAT312 ± 91.6 ± 0.103.2 ± 0.09
KGCL345 ± 101.7 ± 0.102.9 ± 0.08
KGIN387 ± 111.7 ± 0.102.6 ± 0.07
LLM-Rec1850 ± 1024.2 ± 0.250.5 ± 0.03
KG-MARS330 ± 91.8 ± 0.113.0 ± 0.08
Table 18. Case study results for the interdisciplinary project. Boldface marks the KG-MARS row.
MethodRecomm.Relev.Prec.Interpretability
TF-IDF1040.400No explicit path
BM251050.500No explicit path
SVM-Rank1060.600Score-level summary
LightGCN1070.700Score-level summary
KGAT1060.600Partial relational trace
KGIN1070.700Partial relational trace
KGCL1070.700Contrastive embedding, no path
LLM-Rec1070.700Free-text, not graph-grounded
KG-MARS1080.800Structured reasoning path
Table 19. Explanation-quality ratings (five-point Likert scale; higher is better). Cells give the mean rating; KG-MARS values include the 95% confidence interval. IAA: Krippendorff’s α = 0.65 .
DimensionKG-MARSSHAPNo Explanation
Clarity4.1 (3.9–4.3)3.42.6
Usefulness4.2 (4.0–4.4)3.32.4
Trustworthiness4.0 (3.8–4.2)3.22.3
Traceability4.5 (4.3–4.7)3.02.0
Auditability4.4 (4.2–4.6)3.02.1
Disclaimer/Publisher’s Note: The statements, opinions and data contained in all publications are solely those of the individual author(s) and contributor(s) and not of MDPI and/or the editor(s). MDPI and/or the editor(s) disclaim responsibility for any injury to people or property resulting from any ideas, methods, instructions or products referred to in the content.