3.1. Crystallization of Na2SO4 from Feeds 1, 2, and 3 at 30 °C
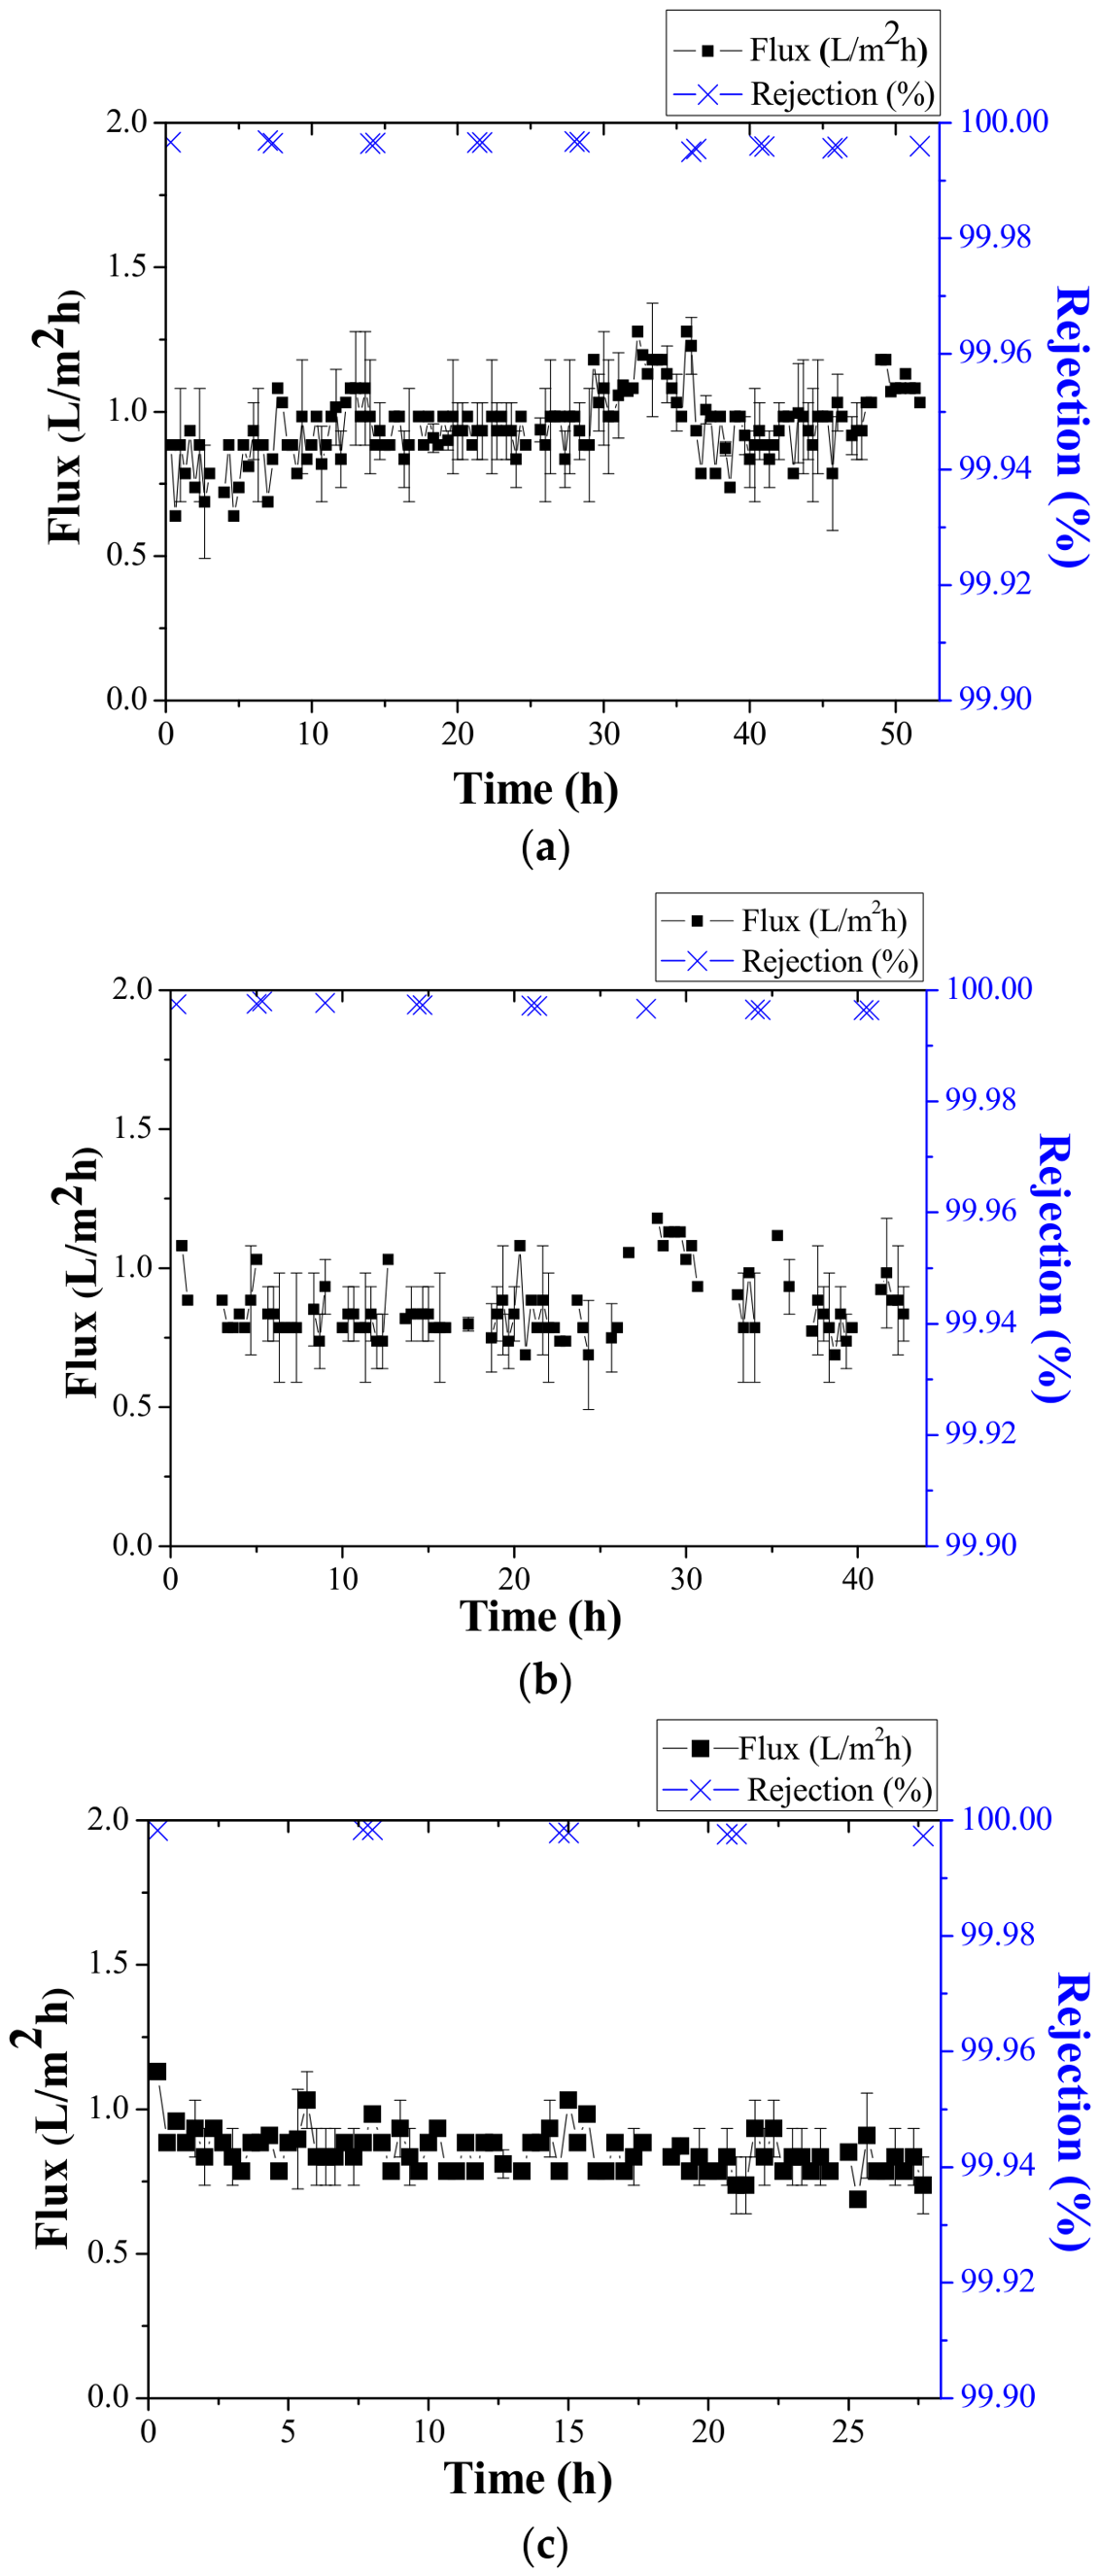
Figure 2 shows the average transmembrane flux and salt rejections associated with the three feeds investigated. It can be seen that the salt rejections are all above 99.99%, showing the excellent separation ability of the commercial PP hollow-fiber membrane. The total operation time varies among the three used feeds due to differences in their compositions, which affect the time required for crystal formation. The flux of
Feed 1, around 1 L/m
2h, proved slightly higher than that of
Feeds 2 and
3 (about 0.8 L/m
2h). This is due to the relatively lower concentration of
Feed 1 (325.35 g/L) compared to
Feed 2 (364.7887 g/L) and
Feed 3 (360.9 g/L). The lower concentration solution has a higher activity coefficient of water and water vapor pressure. The driving force was therefore increased for vapor to pass through the membrane pores [
23]. At a lower feed concentration, the concentration polarization phenomenon is less severe than that at a higher feed concentration [
24,
25]. Also, the error bar of the fluxes for
Feed 1 and
Feed 2 is larger than that of
Feed 3, which means that the flux fluctuation for
Feeds 1 and
2 are larger. The flux obtained with
Feed 3 proves more stable compared with that of
Feeds 1 and
2. The crystals of Na
2SO
4 are obtained when the concentration of the feed approaches solubility (i.e., 2.55 mol/L for
Feed 1; 2.02 mol/L for
Feed 2; and 2.3 mol/L for
Feed 3, respectively at 30 °C), as will be further analyzed in the next section. There is almost no flux decline throughout the experimental operation period, indicating no scaling and/or fouling on the membrane. Also, the conductivity of the permeate remained at a low level (around 20 μS/cm) and the membrane maintained its hydrophobicity during the experimentation, indicating that no wetting occurred.
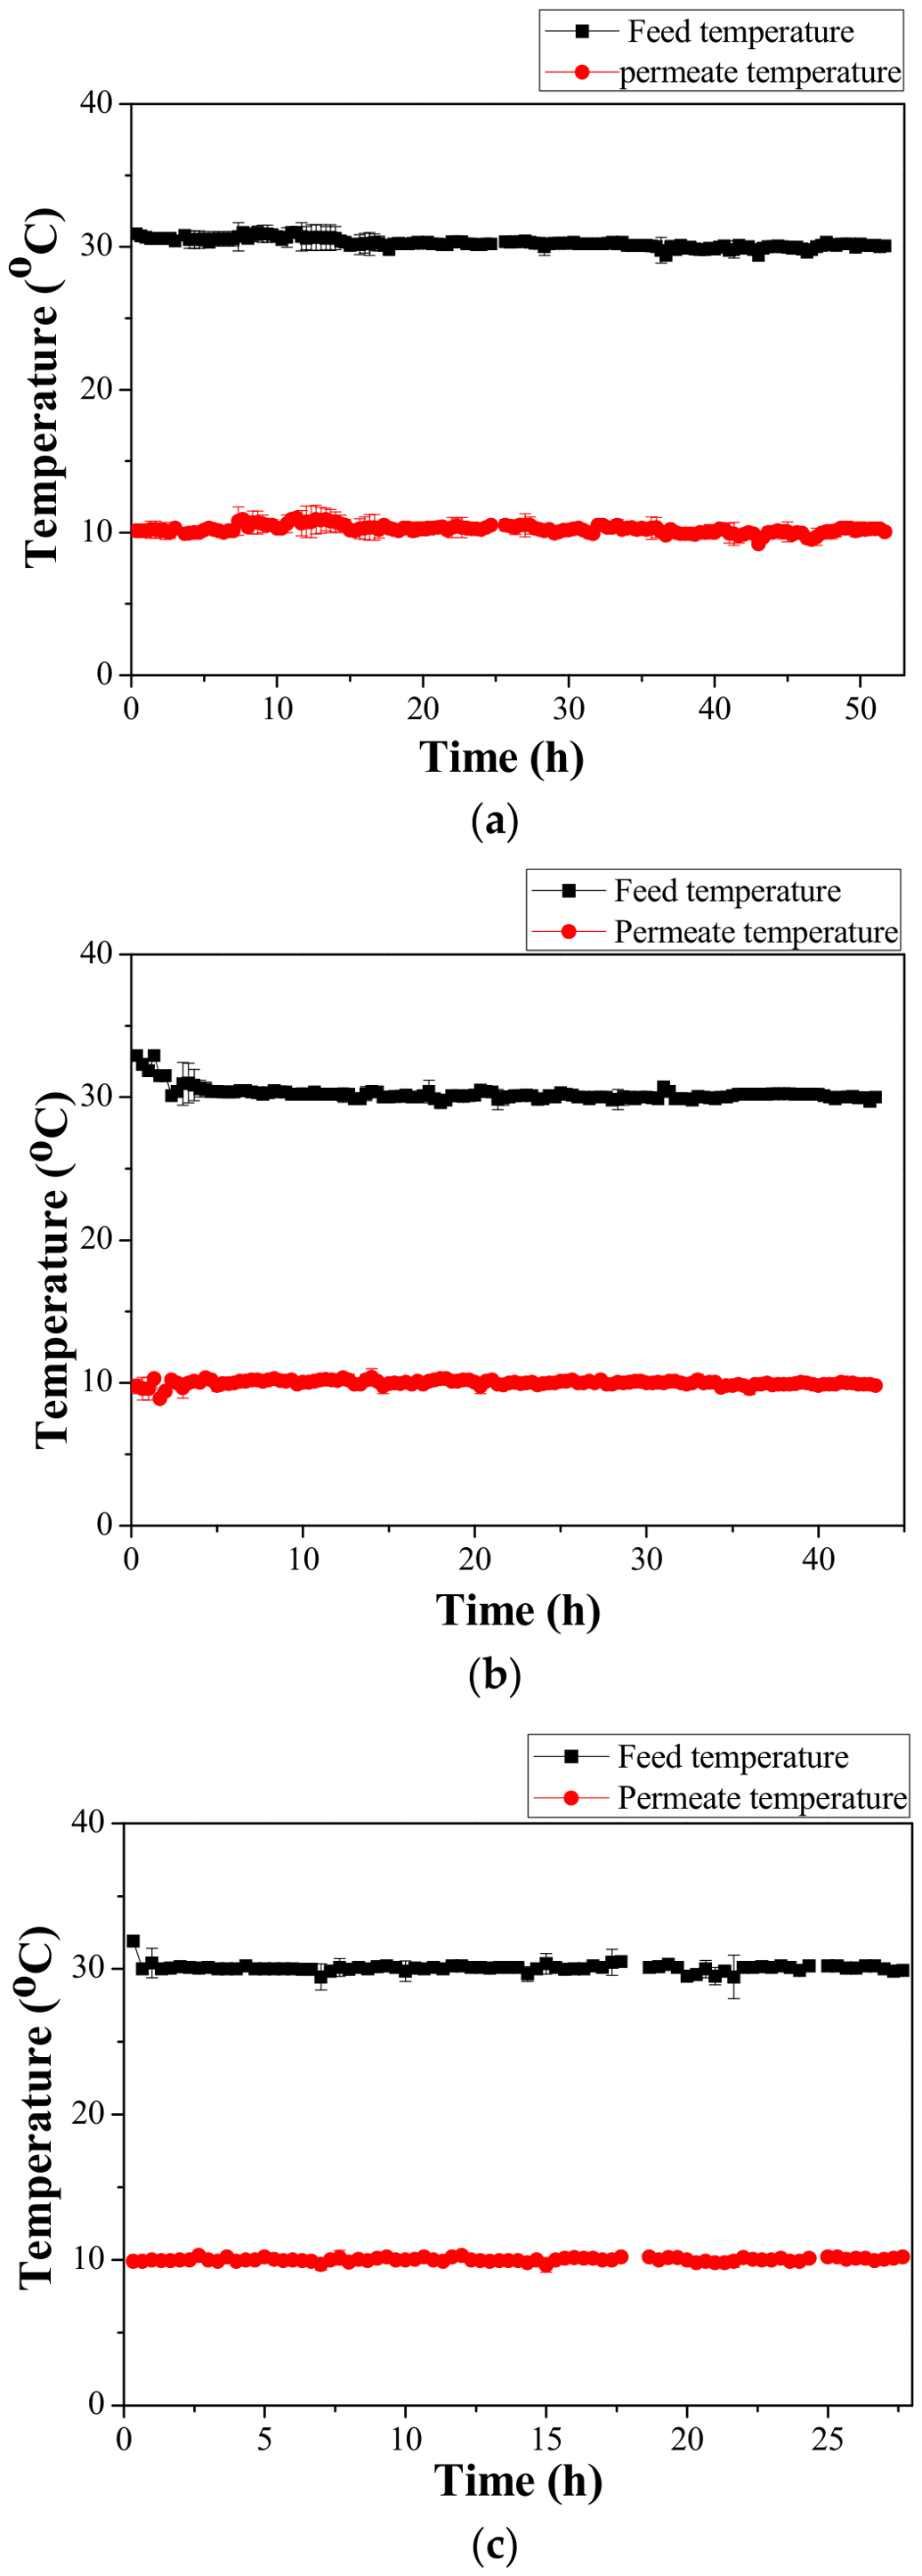
Figure 3 presents the temperature fluctuations during the tests. It can be seen that the temperature remained stable on both sides of the membrane in all three tests. This ensured a stable temperature gradient of 20 °C throughout the tests. Therefore, any flux variations recorded during the experiments had to be attributed only to the feed-side concentration.
Table 4 lists the average time in which the first crystals of
Feed 1,
Feed 2, and
Feed 3 occurred. The obtained average crystallization times differ from one feed to another, due to the diverse initial concentration of the salt mixtures and solubility of Na
2SO
4, as illustrated by
Table 3. Moreover, good repeatability of the tests carried out can be observed.
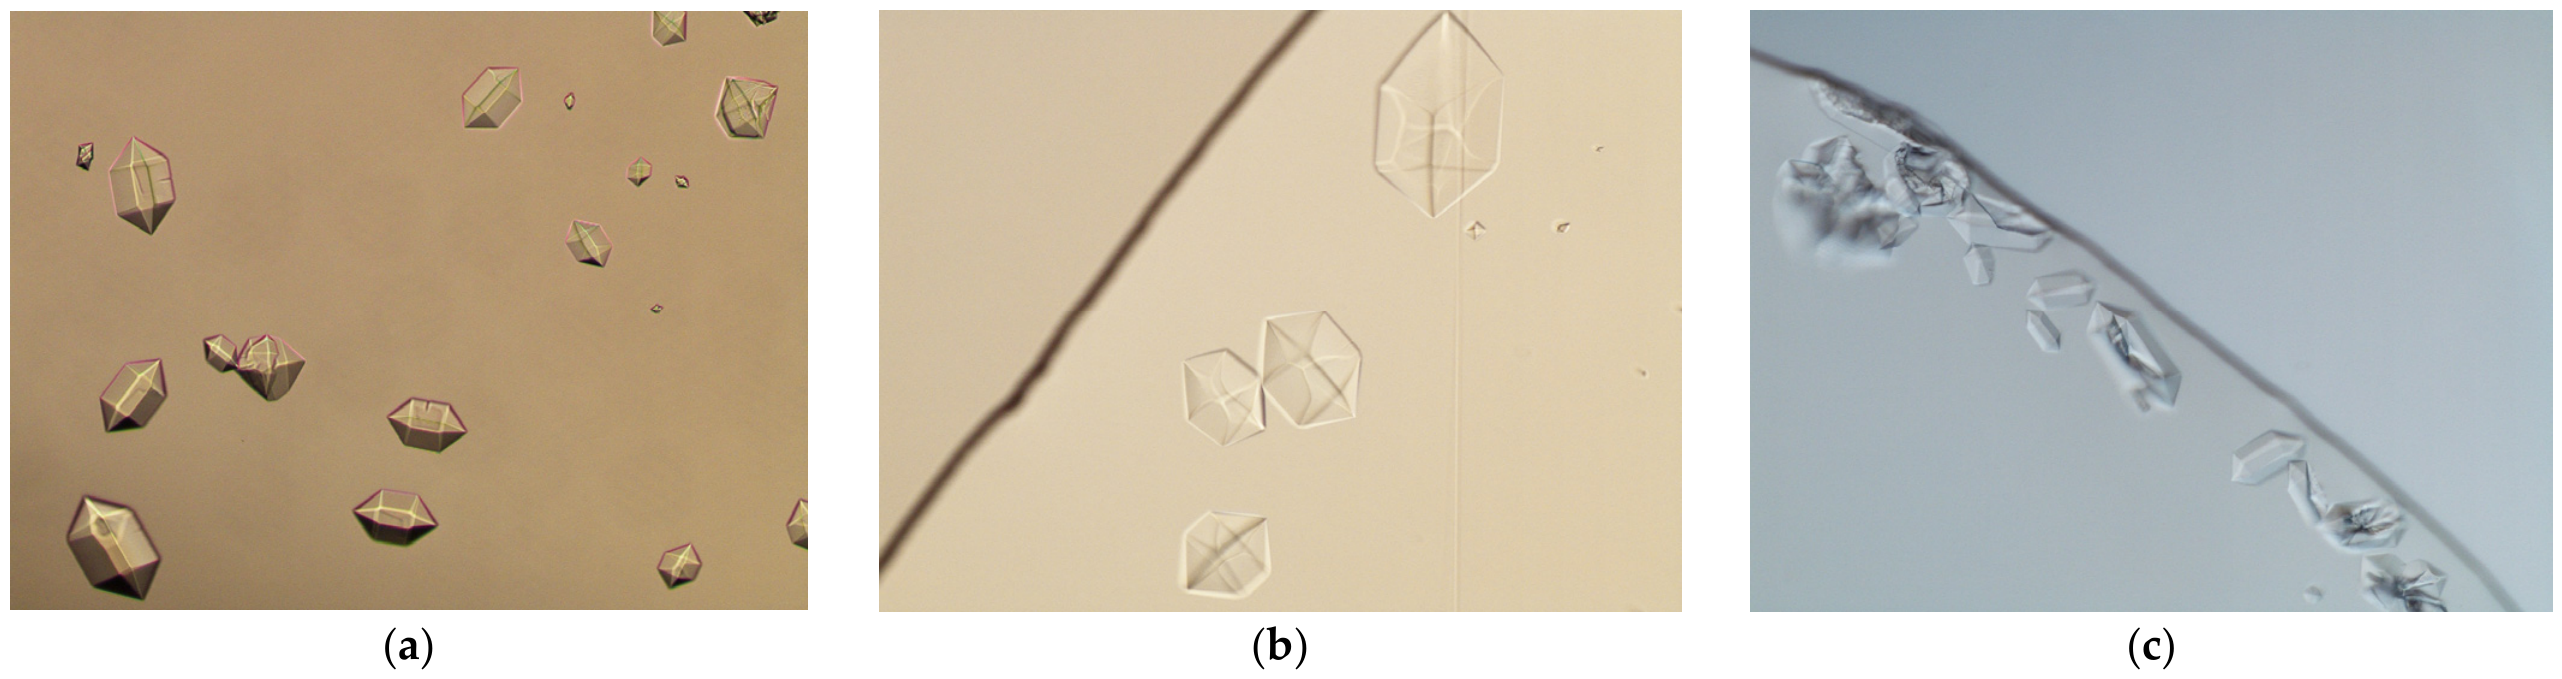
Figure 4 shows the microscope images of the crystals obtained in each experiment as soon as the crystals occurred. All the Na
2SO
4 crystals produced exhibit a hexagonal morphology, corresponding to thenardite phase V [
26]. This is in agreement with the crystal morphology from the literature [
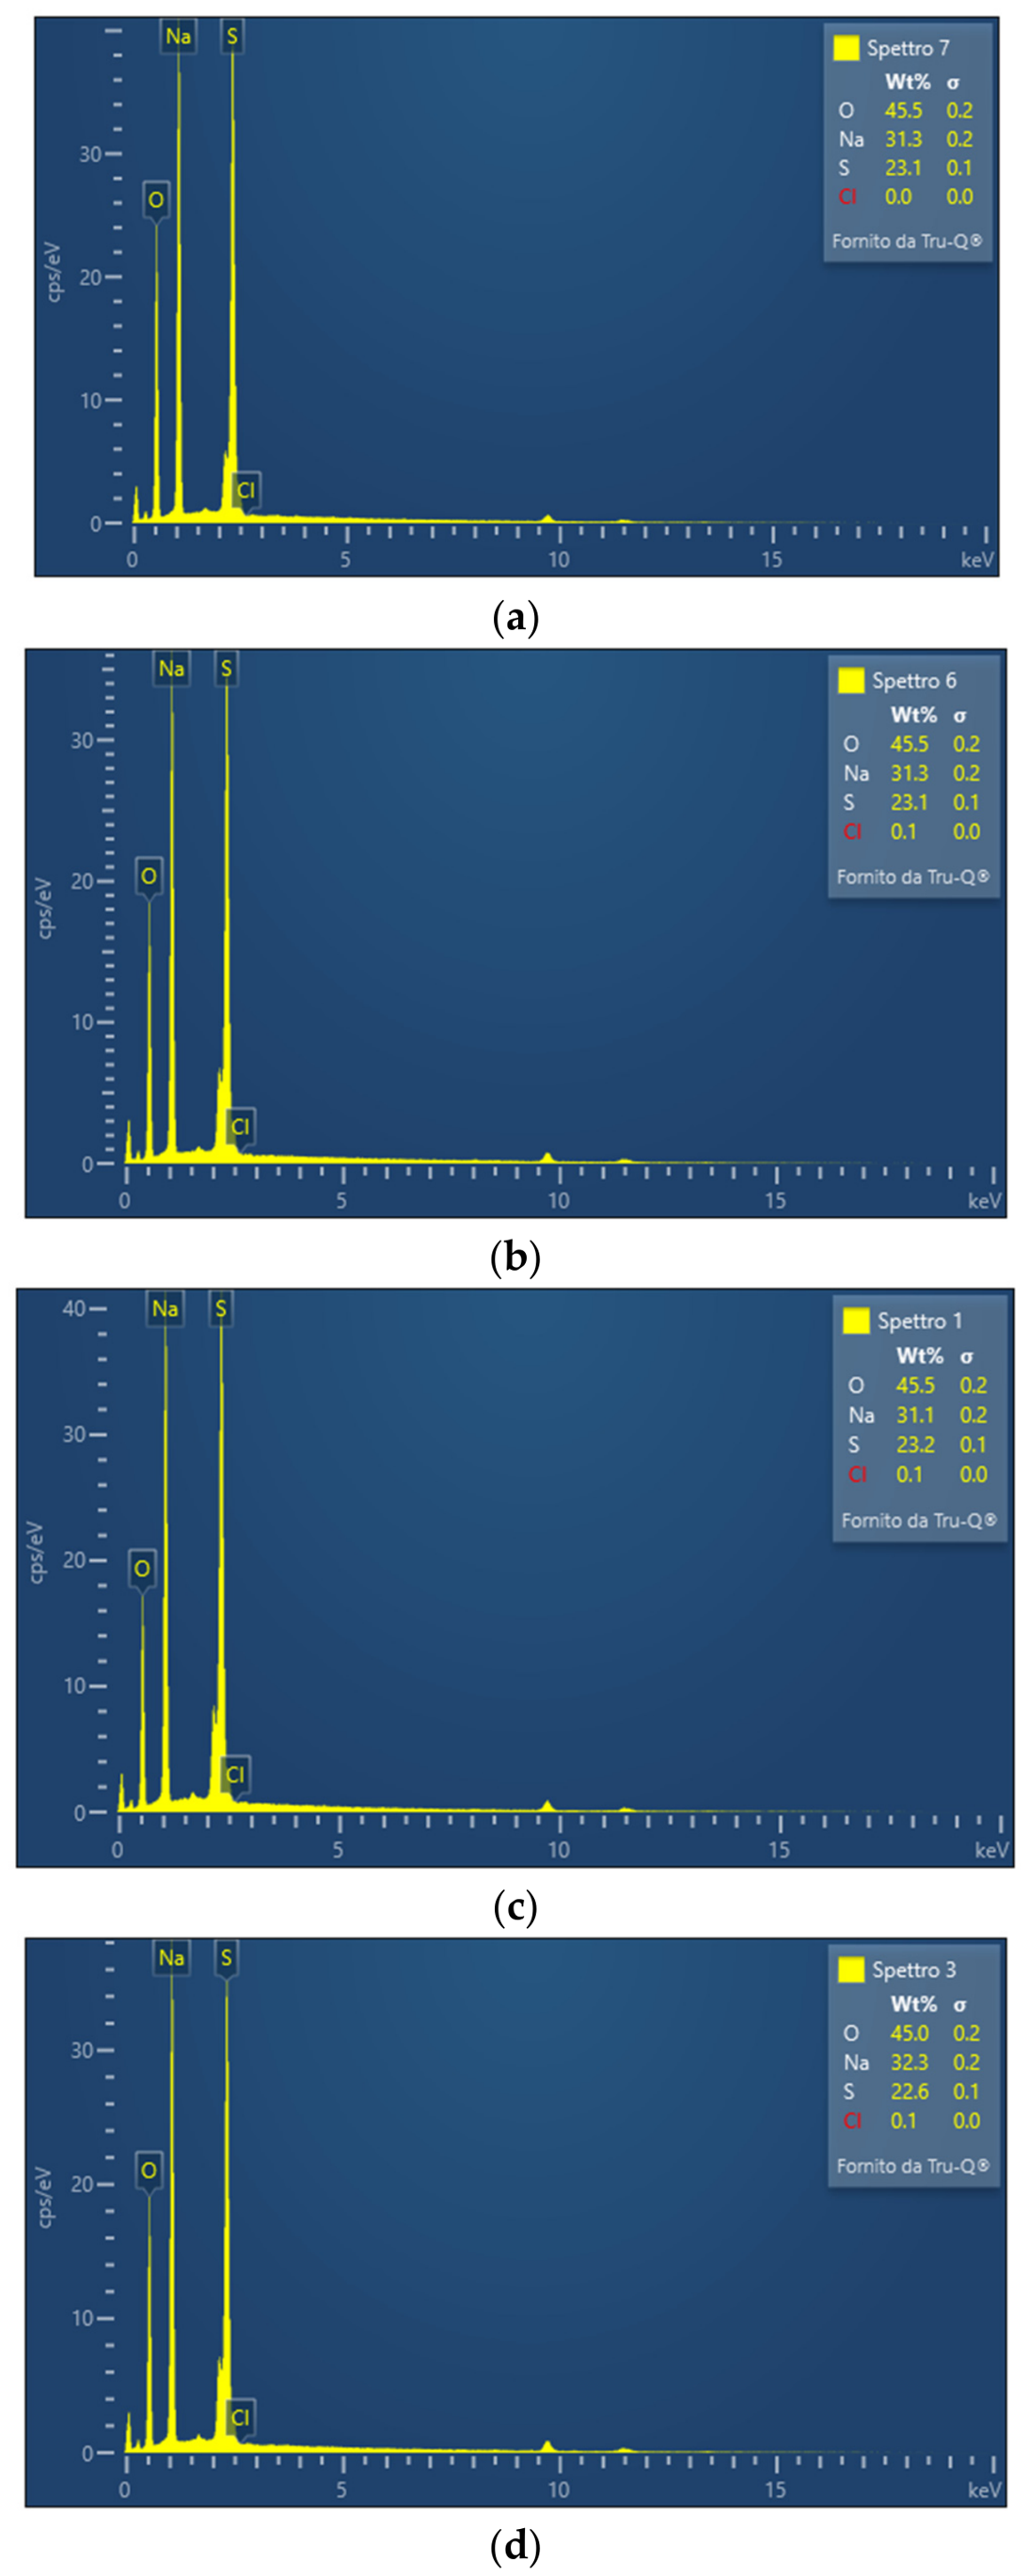
26]. The crystals obtained in the experiment gradually expanded, which indicates their growth as the crystallization test progressed. The purity of the obtained salts was analyzed by FTIR and EDX (see
Section 3.3 and
Section 3.4).
For each feed,
Table 5 presents the data of the total experimental time and the middle diameter (d
m) of the obtained crystals. It also includes the values of the coefficient of variation (CV), which has been calculated according to the following Equation (1):
where PD is the crystal length at the indicated percentage. It follows that lower CVs are associated with a narrow crystal size distribution (CSD).
The CVs of the three feeds reported in the table were similar, with values of approximately 30%, indicating a narrow crystal size distribution (CSD). When compared with single-salt Na
2SO
4 crystals recovered by MCr at a similar feed temperature reported in the literature [
7], the presence of NaCl appears to slightly influence the CV, reducing it from about 40% to around 30%. As the NaCl content in the feed increases, the CV tends to decrease further, resulting in a narrower CSD [
7]. Moreover, the measured crystal size (middle length) shows a decreasing trend with increasing NaCl fraction (molar ratio) in the feed solution (
Feed 1 Feed 3 Feed 2).
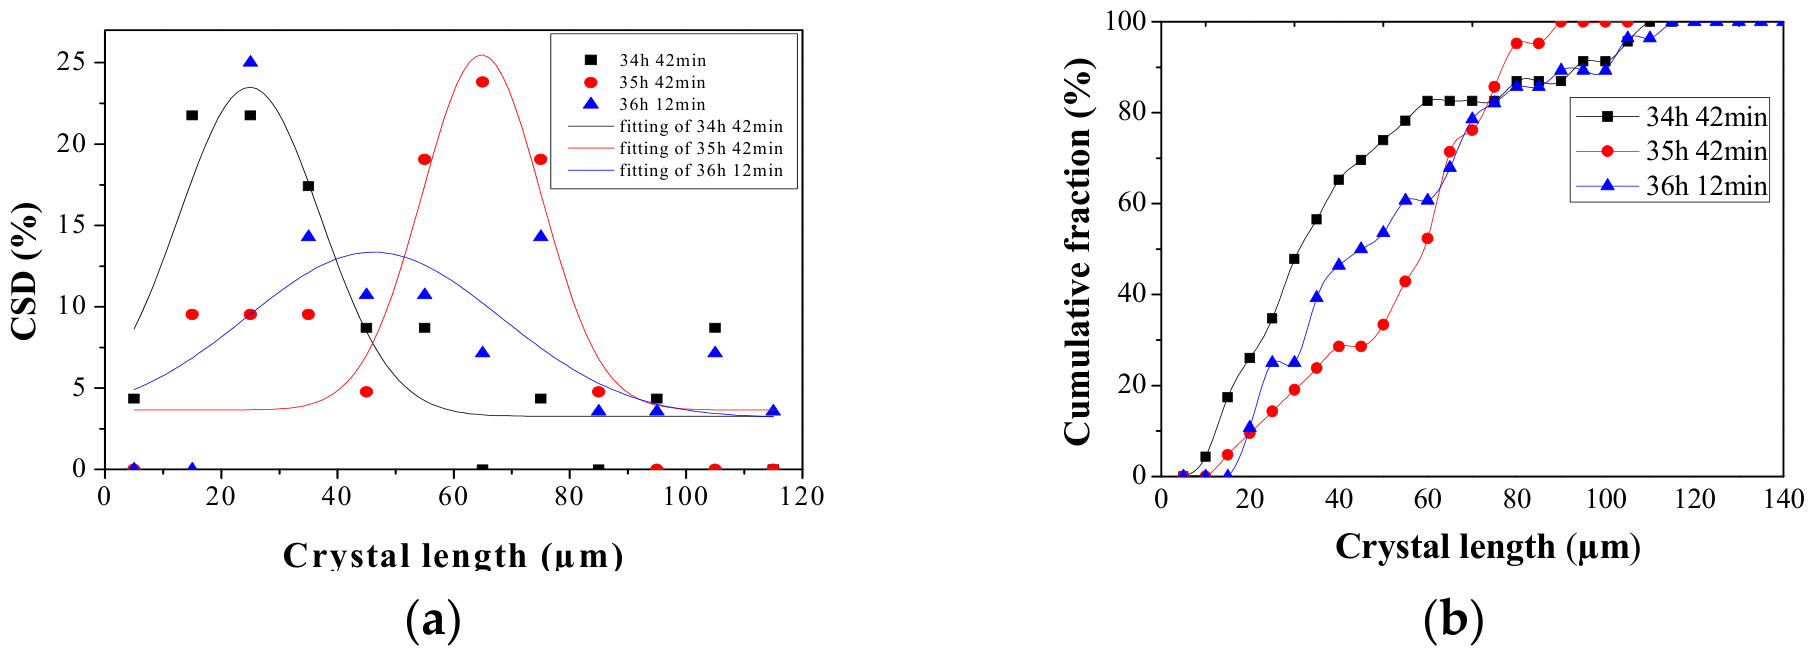
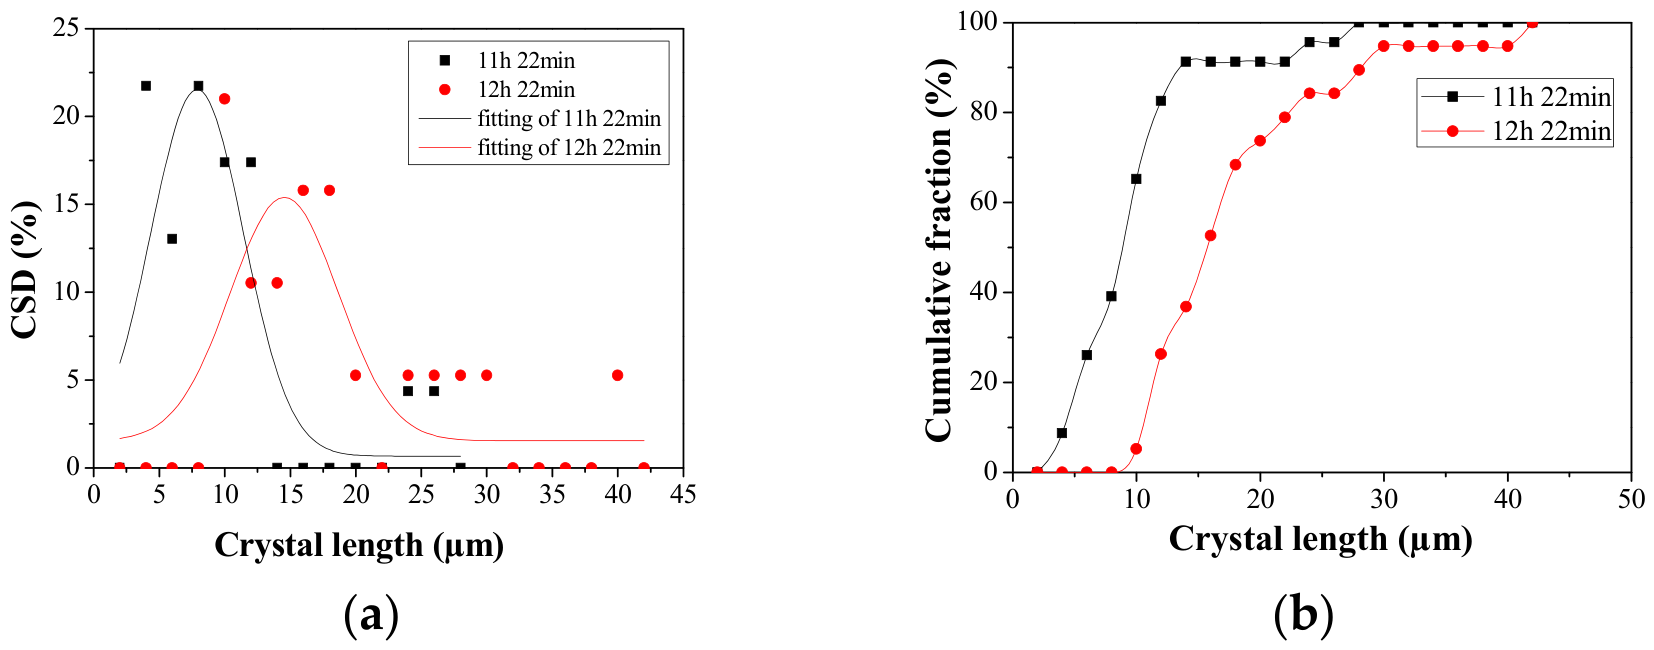
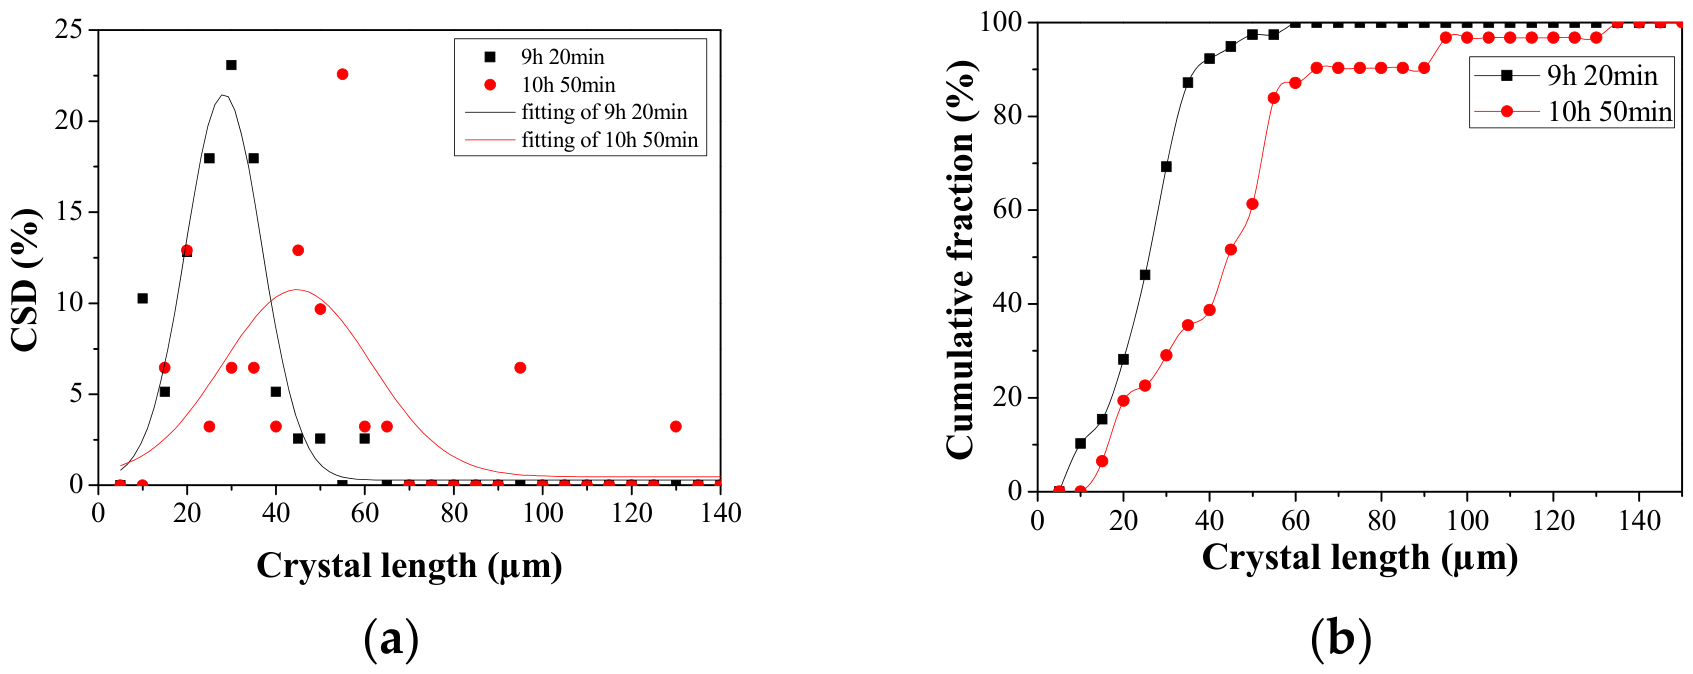
The crystal size distribution (CSD) and the cumulative distribution fraction for
Feed 1,
Feed 2, and
Feed 3 are reported in
Figure 5,
Figure 6 and
Figure 7, respectively. The CSD curves were fitted using a symmetric normal distribution (Gauss) model. During the fitting procedure, a small number of data points that were identified as outliers and deviated significantly from the main distribution were excluded in order to obtain a representative fit of the dominant particle population. The discussion of the CSD peak positions is based on the fitted distributions representing the main crystal population rather than on the excluded outlier data. The trends reported in
Figure 5,
Figure 6 and
Figure 7 show, for the three feeds, the shift of the curves towards larger dimensions, which is indicative of the growth process of the crystalline material as time passes.
Figure 5a refers to the CSD of
Feed 1, at different crystallization times. It can be observed that the CSD of the first sample, promptly removed from the setup as soon as the crystals are visible, was very narrow at the length of 25 μm. Due to the crystal growth, the peak of the CSD curve moved at around 65 μm after 1 h since the start of crystallization. As the experimental time continued to 30 min, the peak moved back instead (around 43 μm), which was probably due to the precipitation of the big crystals and the formation and growth of the new smaller crystals.
Figure 6a shows that the peak of the CSD curve shifts to the right after 1 h of the
Feed 2 crystallization test, from around 5–10 μm to about 15 μm, again indicating the gradual growth of crystal size over time.
From
Figure 7a, it can be seen that at the time of 9 h 20 min, the crystal size shows a narrow distribution and the peak occurred at around 30 μm. After about 1 h 30 min, the peak moved to 45 μm, indicating the growth of the crystals. However, the distribution enlarges, indicating the formation of new crystals (as also proved by the increase in CV in
Table 5). The CSDs of Na
2SO
4 crystals for the other two feeds also showed a similar growth trend. The cumulative fractions for all three feeds gradually reach their 100% status from 0% in terms of crystal length. The sharper slope (the black line) for
Feeds 2 and
3 compared to
Feed 1 indicates that more crystals emerged in the smaller crystal size range. This means that when the percentage of NaCl (molar ratio) is more than 50% in the feed solution (
Feeds 2 and
3), the crystal sizes tend to be smaller (which agrees with the data in
Table 5).
3.2. Crystallization of Na2SO4 from Feed 1 at 45 °C
As indicated above, if crystallization occurs at temperatures above 30 °C, Na
2SO
4 crystals present a different crystal morphology [
21]. For this reason, tests aimed at a different crystallizing polymorphic form of Na
2SO
4 were performed at around 45 °C. Among the feed compositions proposed in
Table 3,
Feed 1 was selected for the test due to its relatively high concentration of Na
2SO
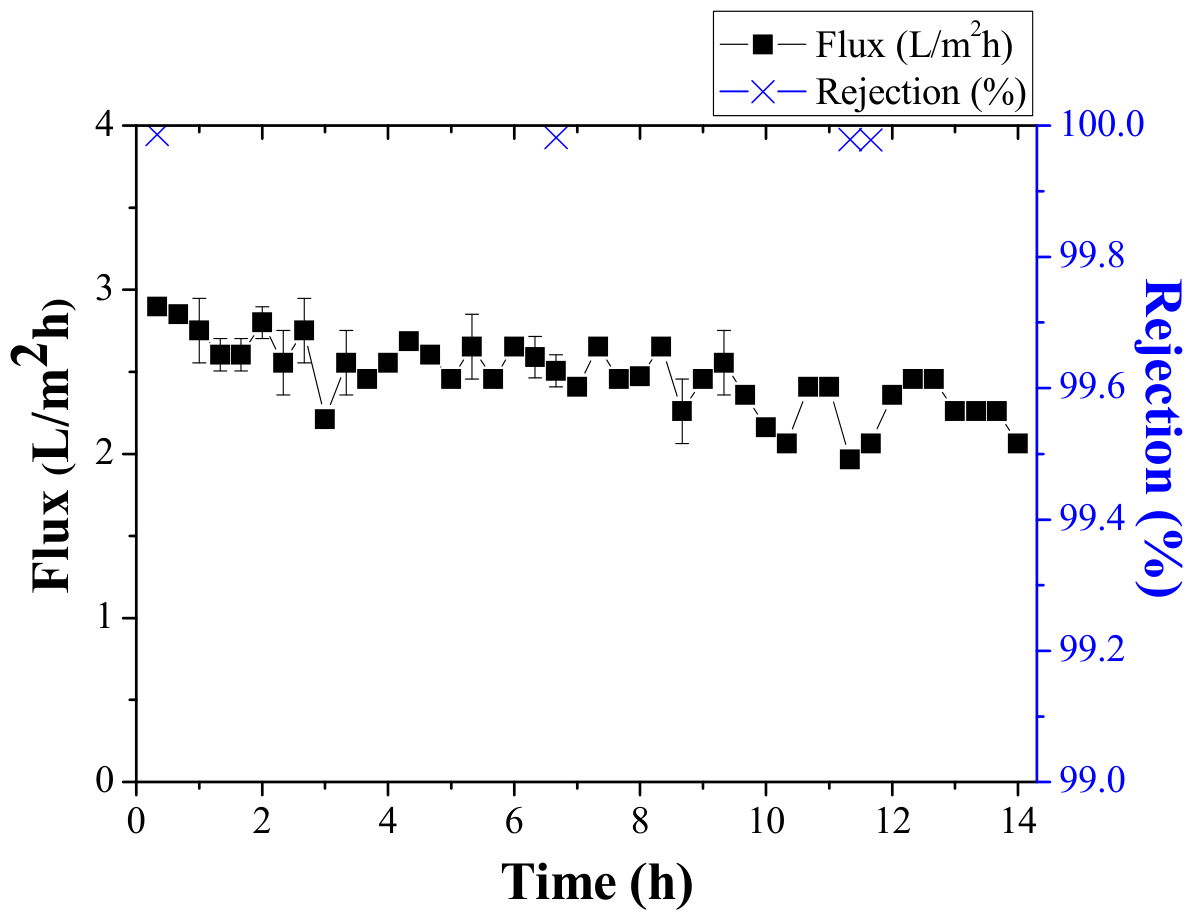
4. The trend of flux and salt rejection over time is shown in
Figure 8. Compared to
Figure 2a, the flux increased by about 2.5 times, with an average value of around 2.5 L/m
2h, due to the higher temperature applied on the feed side. The flux shows a slight decline with operation time. This indicates that the membrane fouling phenomenon occurred gradually (caused by the increase in concentration feed-side). This phenomenon is due to the increase in driving force with temperature and, therefore, higher transport of water vapor passing through the membrane pores, which increases the concentration of ions more quickly than at a lower temperature. Therefore, the concentration polarization phenomenon is more severe than that at the lower temperature. Also, the fast transport of water vapor strengthened the crystals blocking on the membrane surface and increased the fouling phenomenon. Moreover, the temperature polarization at this higher temperature was more severe than that at a lower temperature [
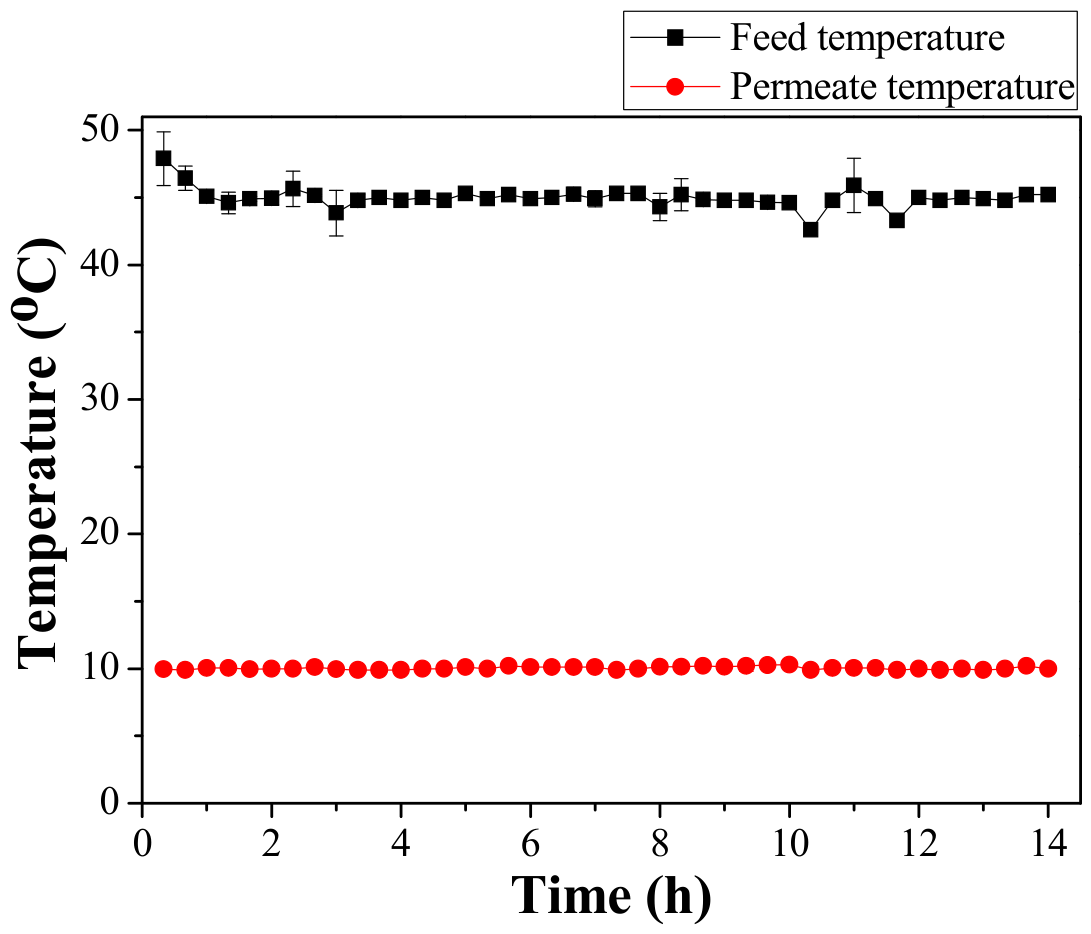
27]. Salt rejections all remained above 99.99%, indicating no membrane wetting. The temperatures on the feed and permeate side are shown in
Figure 9. It can be observed that the temperature gradient between the two sides of the membrane is almost stable along the test and equal to around 35 °C.
The morphology of the obtained crystals is presented in
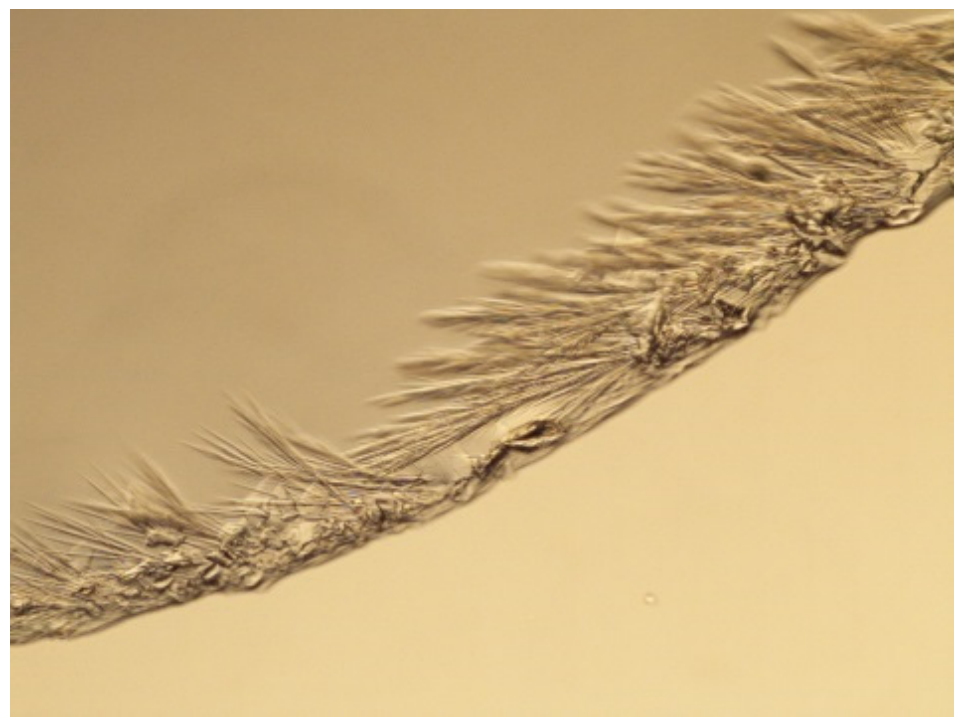
Figure 10. Crystals present a particular needle shape, which is very different from those exhibited by crystals produced at 30 °C (see
Figure 4). They correspond to metastable thernadite phase III, as estimated in the previous
Figure S2, showing the relationship of the crystal type with temperature. This is also in accordance with the images from the literature [
28,
29] and confirms that by changing the condition of the crystallization environment (such as temperature), it is possible to adjust the crystal type and morphology.
Table 6 presents the total experimental time, middle diameter (d
m) of crystals, and CV of two samples taken from
Feed 1 at 45 °C. Their CSD and cumulative fraction are presented in
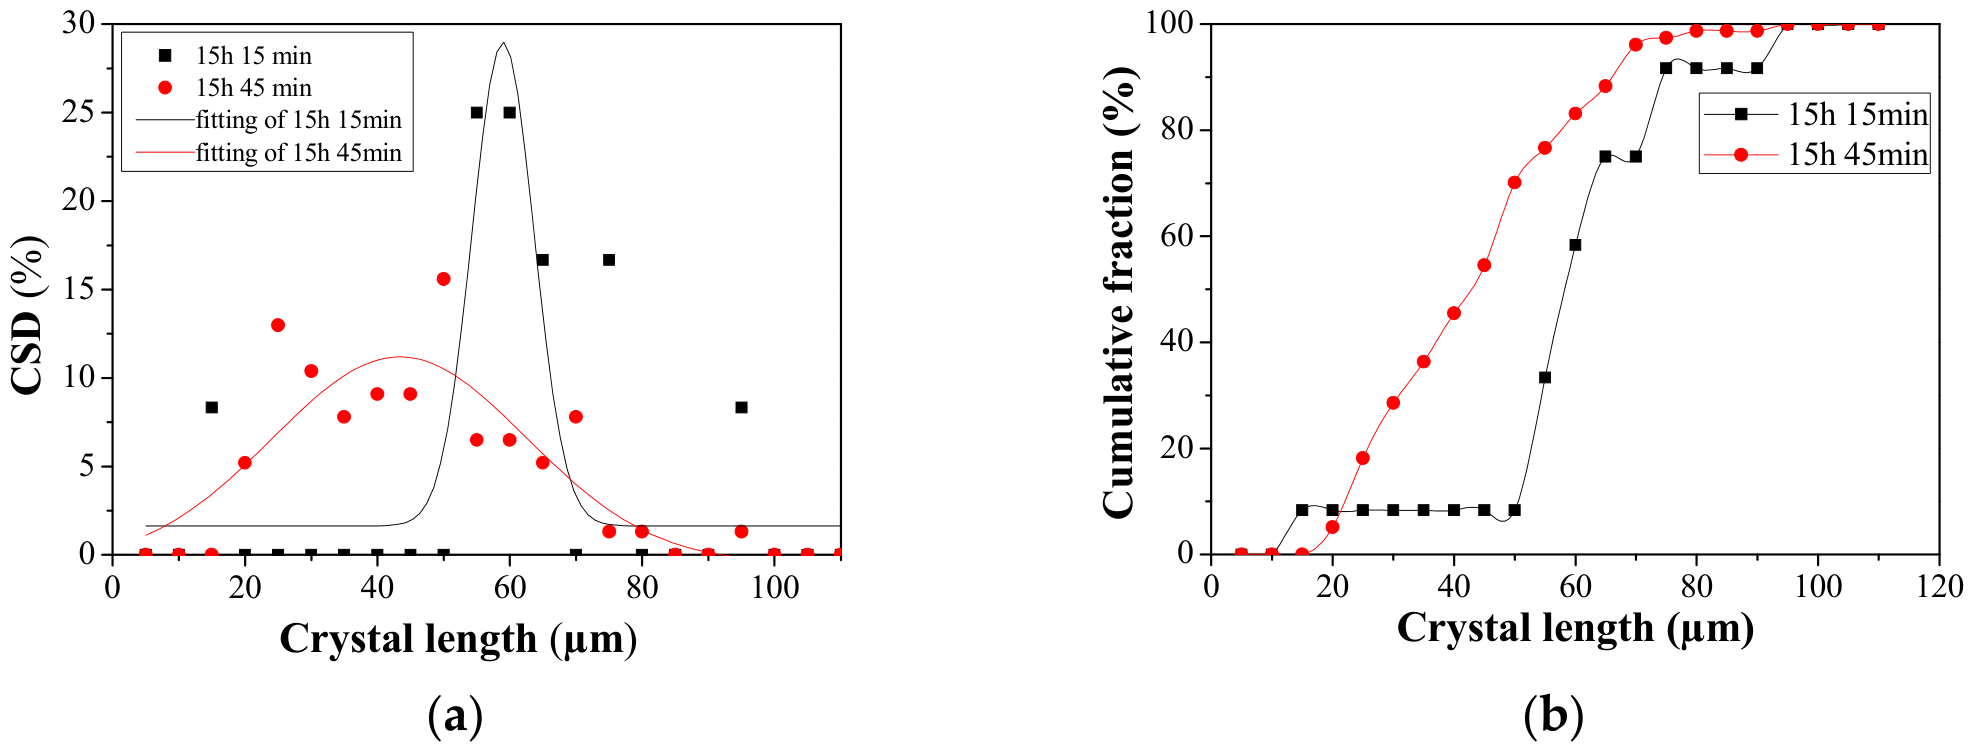
Figure 11, where (a) it is noted that a peak occurred at 58 μm at the test time of 15 h 15 min, while the highest peak moved back to 40–50 μm after 30 min, which is due to the growth of previously formed crystals and, at the same time, the formation of new crystals in this 30 min (as proved by the measured crystals smaller than 20 μm). Compared with the CVs achieved at a lower feed temperature of 30 °C (see
Table 5), the CVs show smaller values, indicating a narrower crystal size distribution around the average size. This is probably due to the crystal morphology obtained at this temperature (i.e., needle shape), where the length of the crystals tends to grow faster and longer than the hexagonal shape (as they grow only in one direction (length direction) without considering the width direction of the hexagonal shape).
The cumulative fraction shown in
Figure 11b exhibits a steeper slope for the curve recorded at 15 h 15 min in the size range of approximately 50–80 μm, indicating a higher proportion of crystals within this interval and thus a narrower crystal size distribution. This observation is consistent with the sharp peak observed in
Figure 11a. In contrast, after 30 min, the curve corresponding to 15 h 45 min in
Figure 11b becomes less steep, reflecting a broader crystal size distribution, as also evidenced by the wider CSD profile shown in
Figure 11a.
3.3. FTIR Analysis of the Obtained Crystals
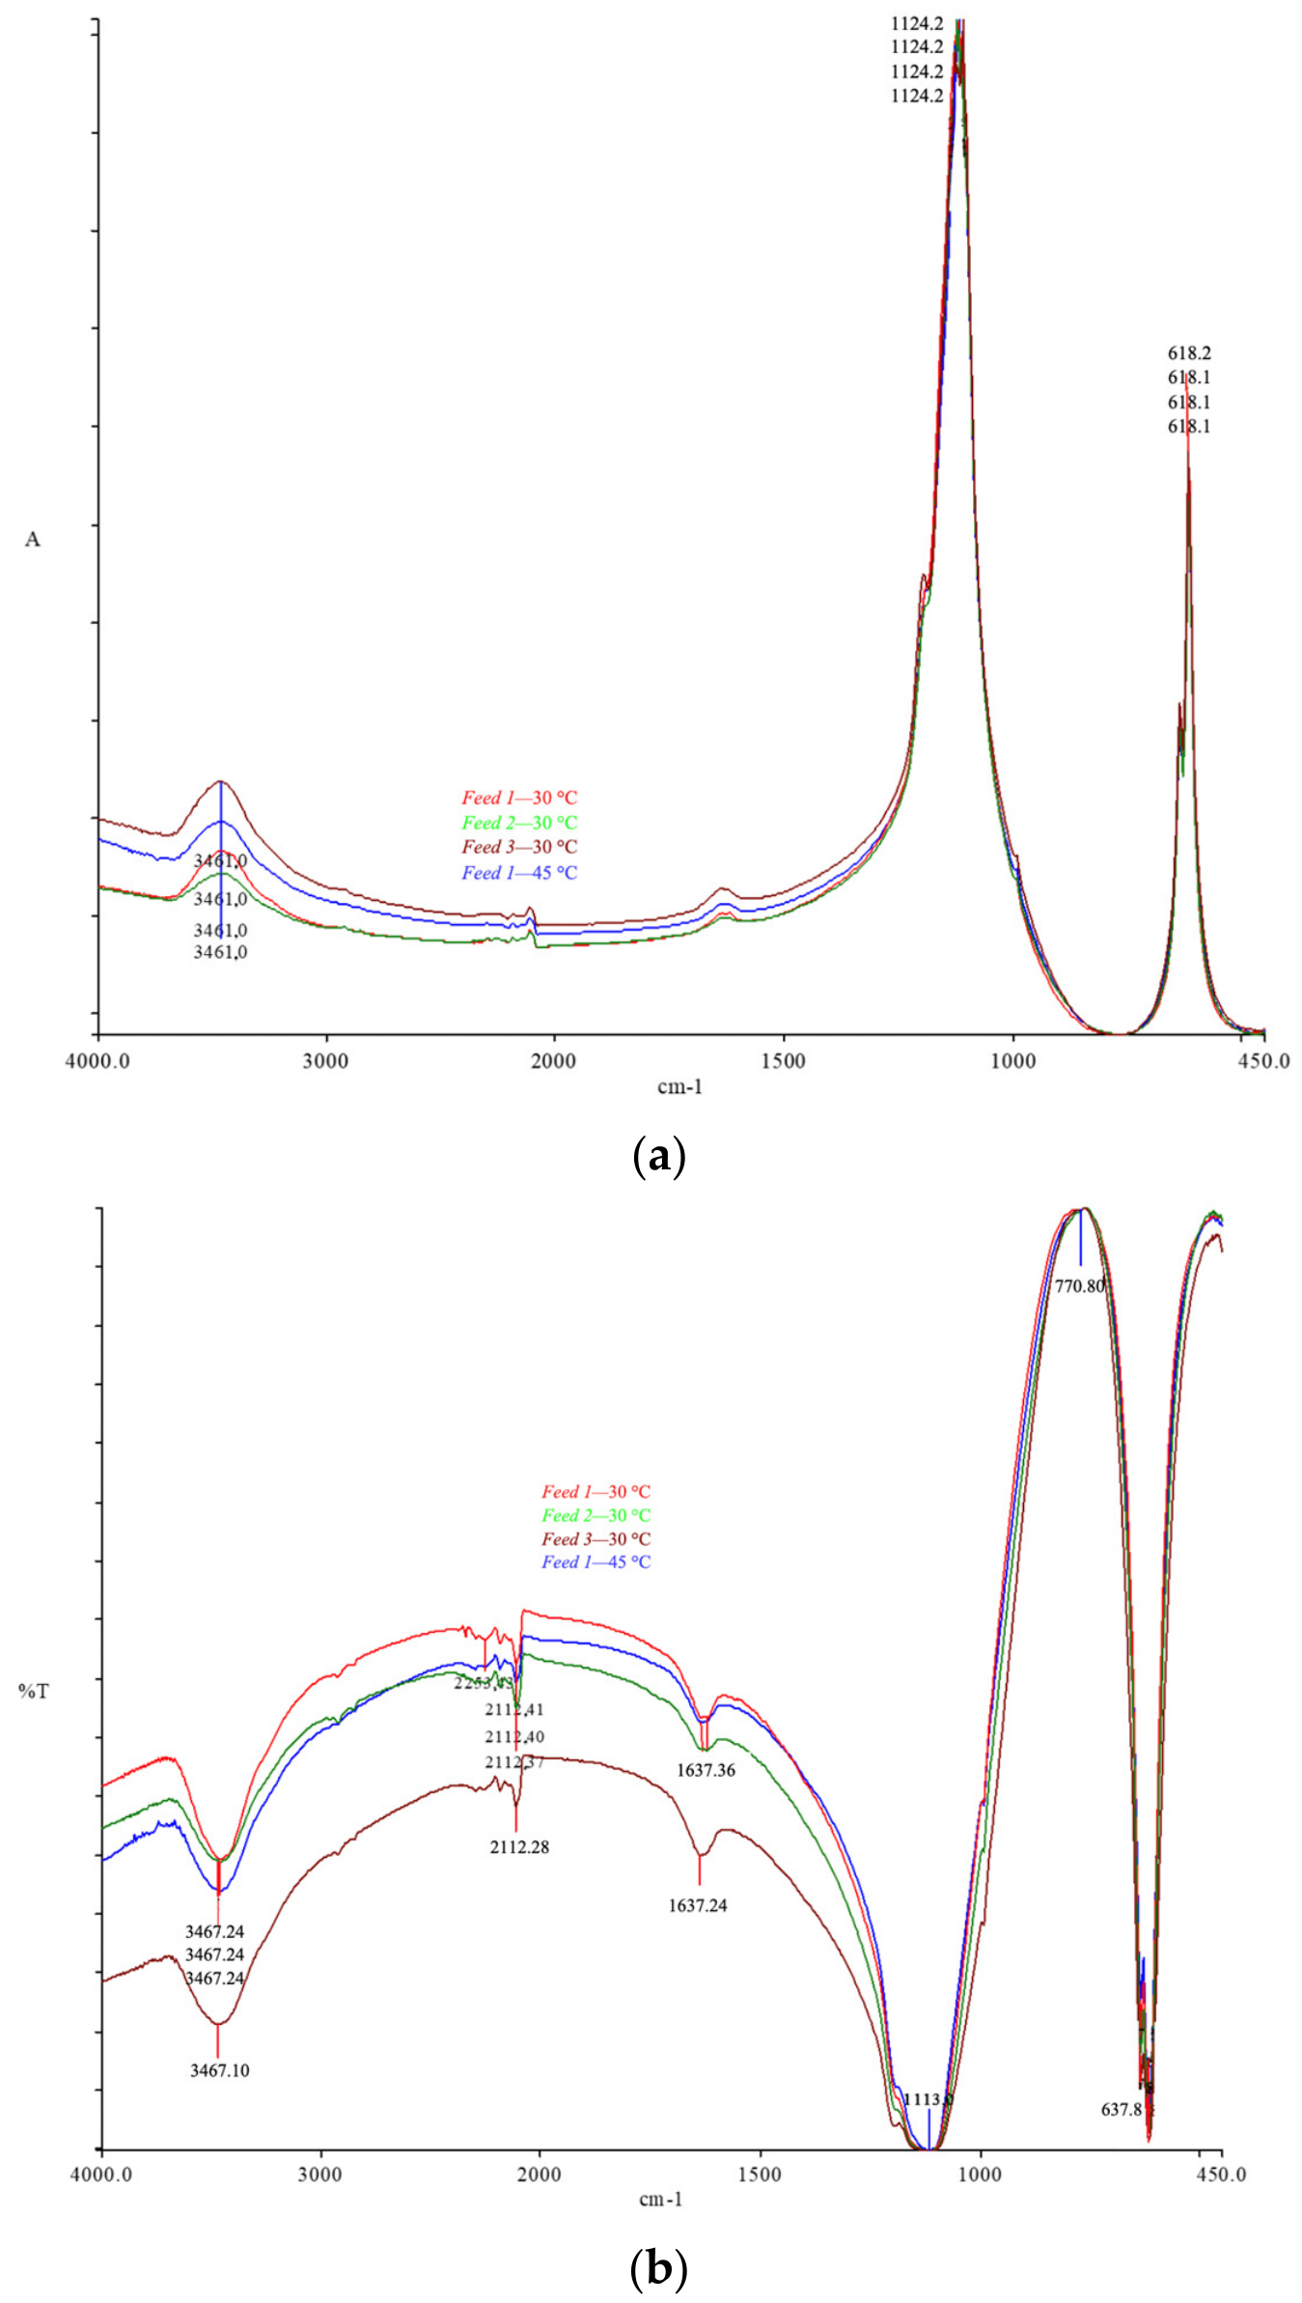
Figure 12 illustrates the FTIR spectra of salts obtained from
Feeds 1,
2, and
3. Both
Figure 12a,b report the frequency of light (cm
−1) on the
x-axis. Regarding the ordinates, the former displays the absorbance while the values of transmittance are plotted in the latter.
Fourier transform infrared (FTIR) spectroscopy is a rapid and not-destructive technique, which is extremely useful for confirming the identity of pure compounds [
30,
31]. The major advantage of the FTIR technique over other spectroscopic methods is that practically all compounds show the absorption/emission characteristic in the IR spectral region, and based on this property, they can be analyzed both quantitatively and qualitatively [
32]. It is a form of vibrational spectroscopy that makes it possible to identify the functional groups within molecules. In effect, when a material is irradiated by a specific wavelength of light, its functional groups vibrate (either through stretching or bending). In FTIR spectra, the intensity of these vibrations and the corresponding frequency of light are reported on the
y-axis and
x-axis, respectively. The ordinate is generally expressed as %T or %A, depending on whether the physical property under consideration is transmittance or absorbance [
33].
By observing
Figure 12a,b it can be qualitatively stated that the salts obtained at 30 °C for
Feeds 1,
2, and
3 and at 45 °C for
Feed 1 show a similar trend under the FTIR spectrum: From the transmittance image presented in
Figure 12b, it can be observed that two peaks occurred at around 1100 cm
−1 and 630 cm
−1; and the absorbance image presents a peak at around 610 cm
−1. These results are consistent with the peak characteristics of Na
2SO
4, proving that the obtained salts from all feed solutions are all Na
2SO
4 (thenardite anhydrous form).