Article

Empirical Effective Strain Model for CFRP Plates Bonded to Concrete Using the Externally Bonded Reinforcement on the Grooves


1
Korea Carbon Industry Promotion Agency, 110-11 Banryong-ro, Jeonju 54853, Republic of Korea
2
Department of Civil Engineering, Chungbuk National University, 1 Chungdae-ro, Seowon-gu, Cheongju 28644, Republic of Korea
3
Polytechnic Institute, Bowen School of Construction, Purdue University, West Lafayette, IN 47909, USA
*
Author to whom correspondence should be addressed.
Appl. Sci. 2026, 16(14), 7125; https://doi.org/10.3390/app16147125
Submission received: 17 June 2026 / Revised: 13 July 2026 / Accepted: 13 July 2026 / Published: 16 July 2026
(This article belongs to the Section Civil Engineering)

Abstract

Externally bonded reinforcement (EBR) using fiber reinforced polymer (FRP) is one of the most widely used techniques for strengthening reinforced concrete (RC) structures. However, early debonding of the concrete surface layer in the EBR method limits its structural performance. Recently, the externally bonded reinforcement on grooves (EBROG) method has emerged as a promising alternative. This study experimentally investigates the bond behavior between CFRP plates and concrete strengthened using the EBROG method. A total of 78 specimens were fabricated and evaluated using single-lap shear tests. The investigated parameters include groove dimensions, number of grooves, and concrete compressive strength. A digital image correlation (DIC) system was used to measure displacement. Unlike the EBR method, no debonding of the concrete surface layer occurred in the EBROG specimens, and the bond strength improved by 49.56–154.48% without additional surface treatment. Increased groove dimensions and a greater number of grooves significantly enhanced the bond performance. Higher concrete compressive strength and larger groove dimensions also delayed the onset of debonding. Based on the experimental results, a new effective strain model was proposed, and flexural capacity predictions using this model showed higher accuracy than those obtained from existing models.

1. Introduction

In the repair and rehabilitation of reinforced concrete (RC) structures, debonding of fiber reinforced polymer (FRP) is considered one of the primary causes of structural performance degradation. The performance of the strengthening system depends on a stable bond between the FRP and the concrete substrate, and any damage to this bond can significantly reduce the structural capacity [1,2,3,4,5]. Accordingly, many researchers have conducted various studies to investigate the bond behavior between FRP and concrete [6,7,8,9]. Previous studies have identified the critical stress and effective strain at which debonding of FRP occurs in strengthened RC members, some of which have been incorporated into current design codes for FRP-strengthened RC structures [10,11,12,13].
Most previous studies on FRP-strengthened RC members have focused on externally bonded reinforcement (EBR) or near surface mounted (NSM) methods. The EBR method enhances structural performance by bonding FRP to the tension face of RC members using epoxy resin. Surface preparation prior to bonding is known to be a critical step for ensuring the effectiveness of the EBR method [14,15,16]. Due to its ease of construction and rapid installation, the EBR method has been widely used worldwide, and its effectiveness has been demonstrated not only for flexural members but also for members subjected to shear and compressive forces [17,18,19,20,21,22]. However, premature debonding at the interface in the EBR method is a key factor limiting structural performance before FRP reaches its ultimate tensile strength [23,24]. As a result, design codes typically consider the failure mode of FRP-strengthened RC members as brittle failure due to debonding, with ultimate capacity defined by the effective strain at debonding initiation rather than the tensile capacity of FRP [25,26,27]. To overcome the limitations of the EBR method, the NSM method was introduced, in which grooves are cut into the concrete cover and reinforcement is embedded. The NSM method provides a larger bond area relative to the amount of reinforcement, thus delaying debonding more effectively than the EBR method. Notably, some studies have reported failure modes caused by rupture of the FRP, indicating that the NSM method could serve as an effective alternative to the EBR method [28,29,30,31]. However, the groove dimensions required for applying the NSM method are constrained by the concrete cover thickness and potential interference with reinforcing bars, which limits the amount of FRP reinforcement that can be applied.
To address these constraints, Mostofinejad and Mahmoudabadi [32] proposed the externally bonded reinforcement on grooves (EBROG) method. This method involves cutting grooves on the concrete surface, filling them with epoxy, and then bonding FRP over the grooves. Their study demonstrated that the EBROG method could distribute interfacial stress deeper into the concrete, delay FRP debonding, and increase bond strength by up to 80%. The superior strengthening performance of the EBROG method has led to extensive subsequent research [33,34,35,36,37,38,39]. Sabzi et al. [40] investigated the effect of the EBROG method on flexural performance and failure mechanisms. They reported that EBROG-strengthening increased ultimate load capacity compared to EBR and improved the tensile capacity of CFRP sheets by approximately 6%. Mostofinejad and Kashani [41] experimentally evaluated the shear performance of EBROG-strengthened members and found that EBROG improved ultimate load capacity by up to 15% compared to EBR. They also observed that the failure mode of some EBROG-strengthened specimens shifted from shear to flexural failure.
Studies on RC members strengthened using the EBROG method have demonstrated not only superior performance compared to the EBR method, but also underscored the importance of understanding the bond characteristics between FRP and concrete. Accordingly, several experimental studies have investigated the effects of various parameters on the bond behavior of EBROG systems. Hosseini and Mostofinejad [42] employed particle image velocimetry (PIV) to investigate the bond behavior of CFRP-to-concrete interfaces in the EBROG method and found that groove width had an effect on interfacial failure. Moghaddas and Mostofinejad [43] investigated the effects of concrete compressive strength, CFRP sheet width, and groove width on the bond strength of CFRP–to-concrete joints strengthened using the EBROG method. They reported that as the concrete compressive strength increased, the bond strength improvement of EBROG specimens compared to EBR specimens decreased, while increases in CFRP sheet stiffness and groove width led to greater improvements in bond strength. However, most EBROG studies have used CFRP sheets with thicknesses ranging from 0.11 mm to 0.17 mm [44]. Compared with CFRP sheets or cloth, CFRP plates possess higher axial stiffness, greater thickness, and lower deformability, which may lead to different load-transfer characteristics at the CFRP–concrete interface. While flexible CFRP sheets can more easily conform to local deformation of the concrete surface, CFRP plates tend to induce higher interfacial shear and peeling stresses near the loaded end [45,46]. In the EBROG method, the epoxy-filled grooves therefore play a critical role in providing mechanical anchorage, increasing the effective bonded area, and transferring interfacial stresses deeper into the concrete substrate. Consequently, the bond-transfer mechanism of CFRP plates strengthened using the EBROG method may differ from that of CFRP sheets, requiring separate experimental and analytical investigation.
Therefore, the primary objective of this study is to evaluate the bond performance of CFRP plates applied using the EBROG method and, based on the findings, propose an effective strain model suitable for application in RC members. To achieve this, an experimental investigation was conducted considering key parameters such as concrete compressive strength, number of grooves, and groove dimensions. Furthermore, based on the test results, an effective strain model for CFRP plates bonded using the EBROG method was proposed, and the accuracy of the proposed model was evaluated through comparison with experimental data from RC members strengthened by the EBROG method.

2. Experimental Program

2.1. Specifications of the Specimens

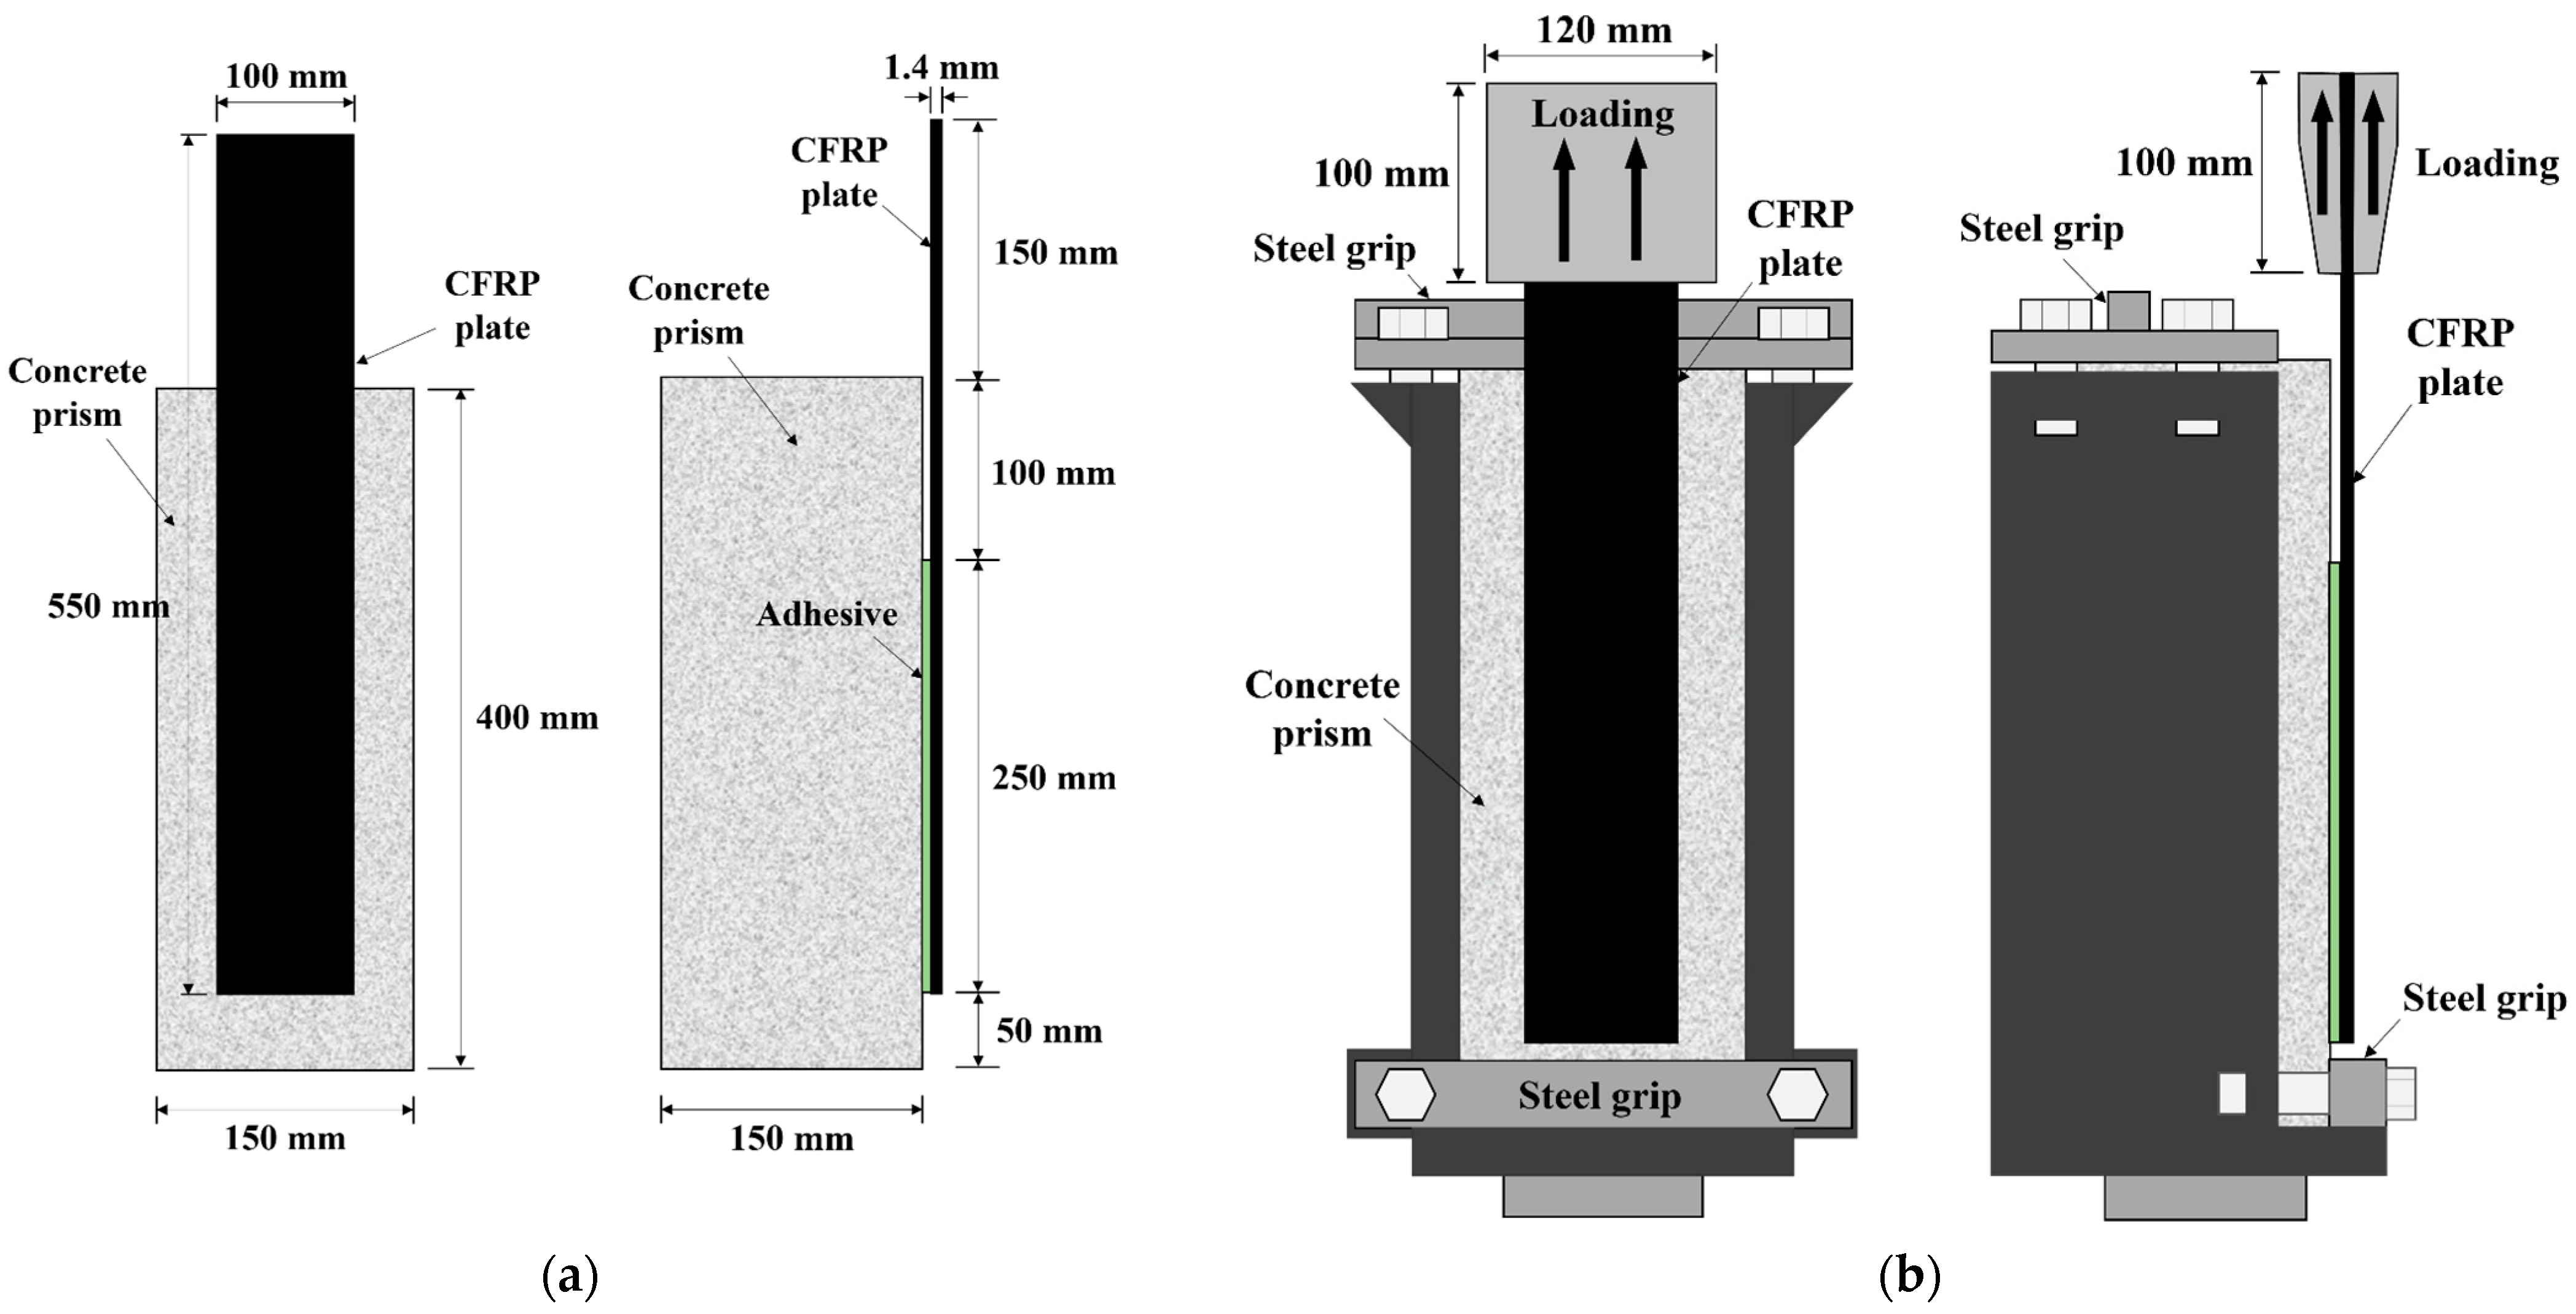
In this study, 150 × 150 × 400 mm (width × height × length) concrete prisms were fabricated to evaluate the bond behavior between CFRP and concrete. A total of 39 concrete prisms were prepared. After 28 days of curing, surface treatments were applied to one side of each prism according to the EBR and EBROG methods. The bond behavior was assessed through single-lap shear tests on the concrete prisms. For repeated testing, the opposite side of each prism was used, ensuring consistent testing conditions under identical concrete properties. To minimize any potential influence of the first test on the repeated test, the opposite face of each concrete prism was reused only after confirming that cracking or delamination had not propagated to the subsequent test surface. Single-lap shear loading primarily induces localized damage around the bonded interface, and no through-thickness cracks affecting the opposite face were observed in the prisms reused in this study. Figure 1 shows the dimensions and loading arrangement of the specimens used for the single-lap shear tests. The width, bonded length, and thickness of the CFRP plate bonded to the concrete prism were 100 mm, 250 mm, and 1.4 mm, respectively.
The initial 100 mm section of the CFRP plate was left unbonded in accordance with the single-lap shear test configuration reported by Mazzotti et al. [47]. This unbonded length was provided to ensure sufficient gripping and stable load introduction into the CFRP plate before the tensile force was transferred to the bonded CFRP–concrete interface. In addition, the unbonded region can reduce local stress concentration near the loaded end and prevent premature failure at the CFRP–concrete interface. The bonded length of the CFRP was set to 250 mm, which is 30 mm longer than the maximum effective bond length of 220 mm suggested in previous studies on the EBROG method [48].

2.2. Material Properties

Table 1 presents the concrete mix designs used in this study. The maximum coarse aggregate size was 25 mm, and the target compressive strengths were 25, 35, and 45 MPa. For each mix condition, three cylindrical specimens with dimensions of 100 × 200 mm were cast during the concrete placement. These cylinders were cured and demolded under the same conditions as the test specimens. On the day of the single-lap shear test, compressive strength tests were conducted in accordance with ASTM C39/C39M-17 [49].
Table 2 summarizes the material properties of the CFRP plate and epoxy resin used in this study. To investigate the bond behavior of CFRP-to-concrete strengthened with the EBROG method, CFRP plates with a thickness of 1.4 mm and width of 100 mm were used. According to the supplier, the tensile strength, elastic modulus, and elongation of the CFRP plate are 3510 MPa, 176 GPa, and 1.99%, respectively. Two-part epoxy resin was used to bond the CFRP plate to the concrete. The mechanical properties of the epoxy resin, as provided by the manufacturer’s catalog, are summarized in Table 2, with an elastic modulus, tensile strength, and compressive strength of 4.65 GPa, 38.5 MPa, and 113 MPa, respectively.

2.3. Testing Layout and Strengthening Procedure

The specifications of the CFRP-to-concrete used to evaluate the bond behavior of specimens strengthened with the EBR and EBROG methods are summarized in Table 3.
In this study, a total of 39 concrete prisms were prepared, and two opposite faces of each prism were used as bonded test faces, resulting in 78 single-lap shear tests. In this experimental program, the concrete compressive strength, number of grooves, and groove dimensions were selected as parameters. Specimens were fabricated for each combination of variables to analyze the influence of each parameter on bond performance. The groove depth was set to 10 mm, considering the concrete cover thickness and construction limitations arising from the high viscosity of the epoxy resin. Previous studies have shown that a groove depth of 10 mm is effective in enhancing bond performance while maintaining structural efficiency [32,43]. To prevent excessive stress concentration around the grooves during the single-lap shear tests, the maximum groove width was limited to 10 mm [46]. Accordingly, four groove combinations were considered: 5 × 5, 5 × 10, 10 × 5, and 10 × 10 mm (width × depth). To increase bond capacity across the width of the CFRP plate and compensate for the limited groove width, up to three grooves were introduced.
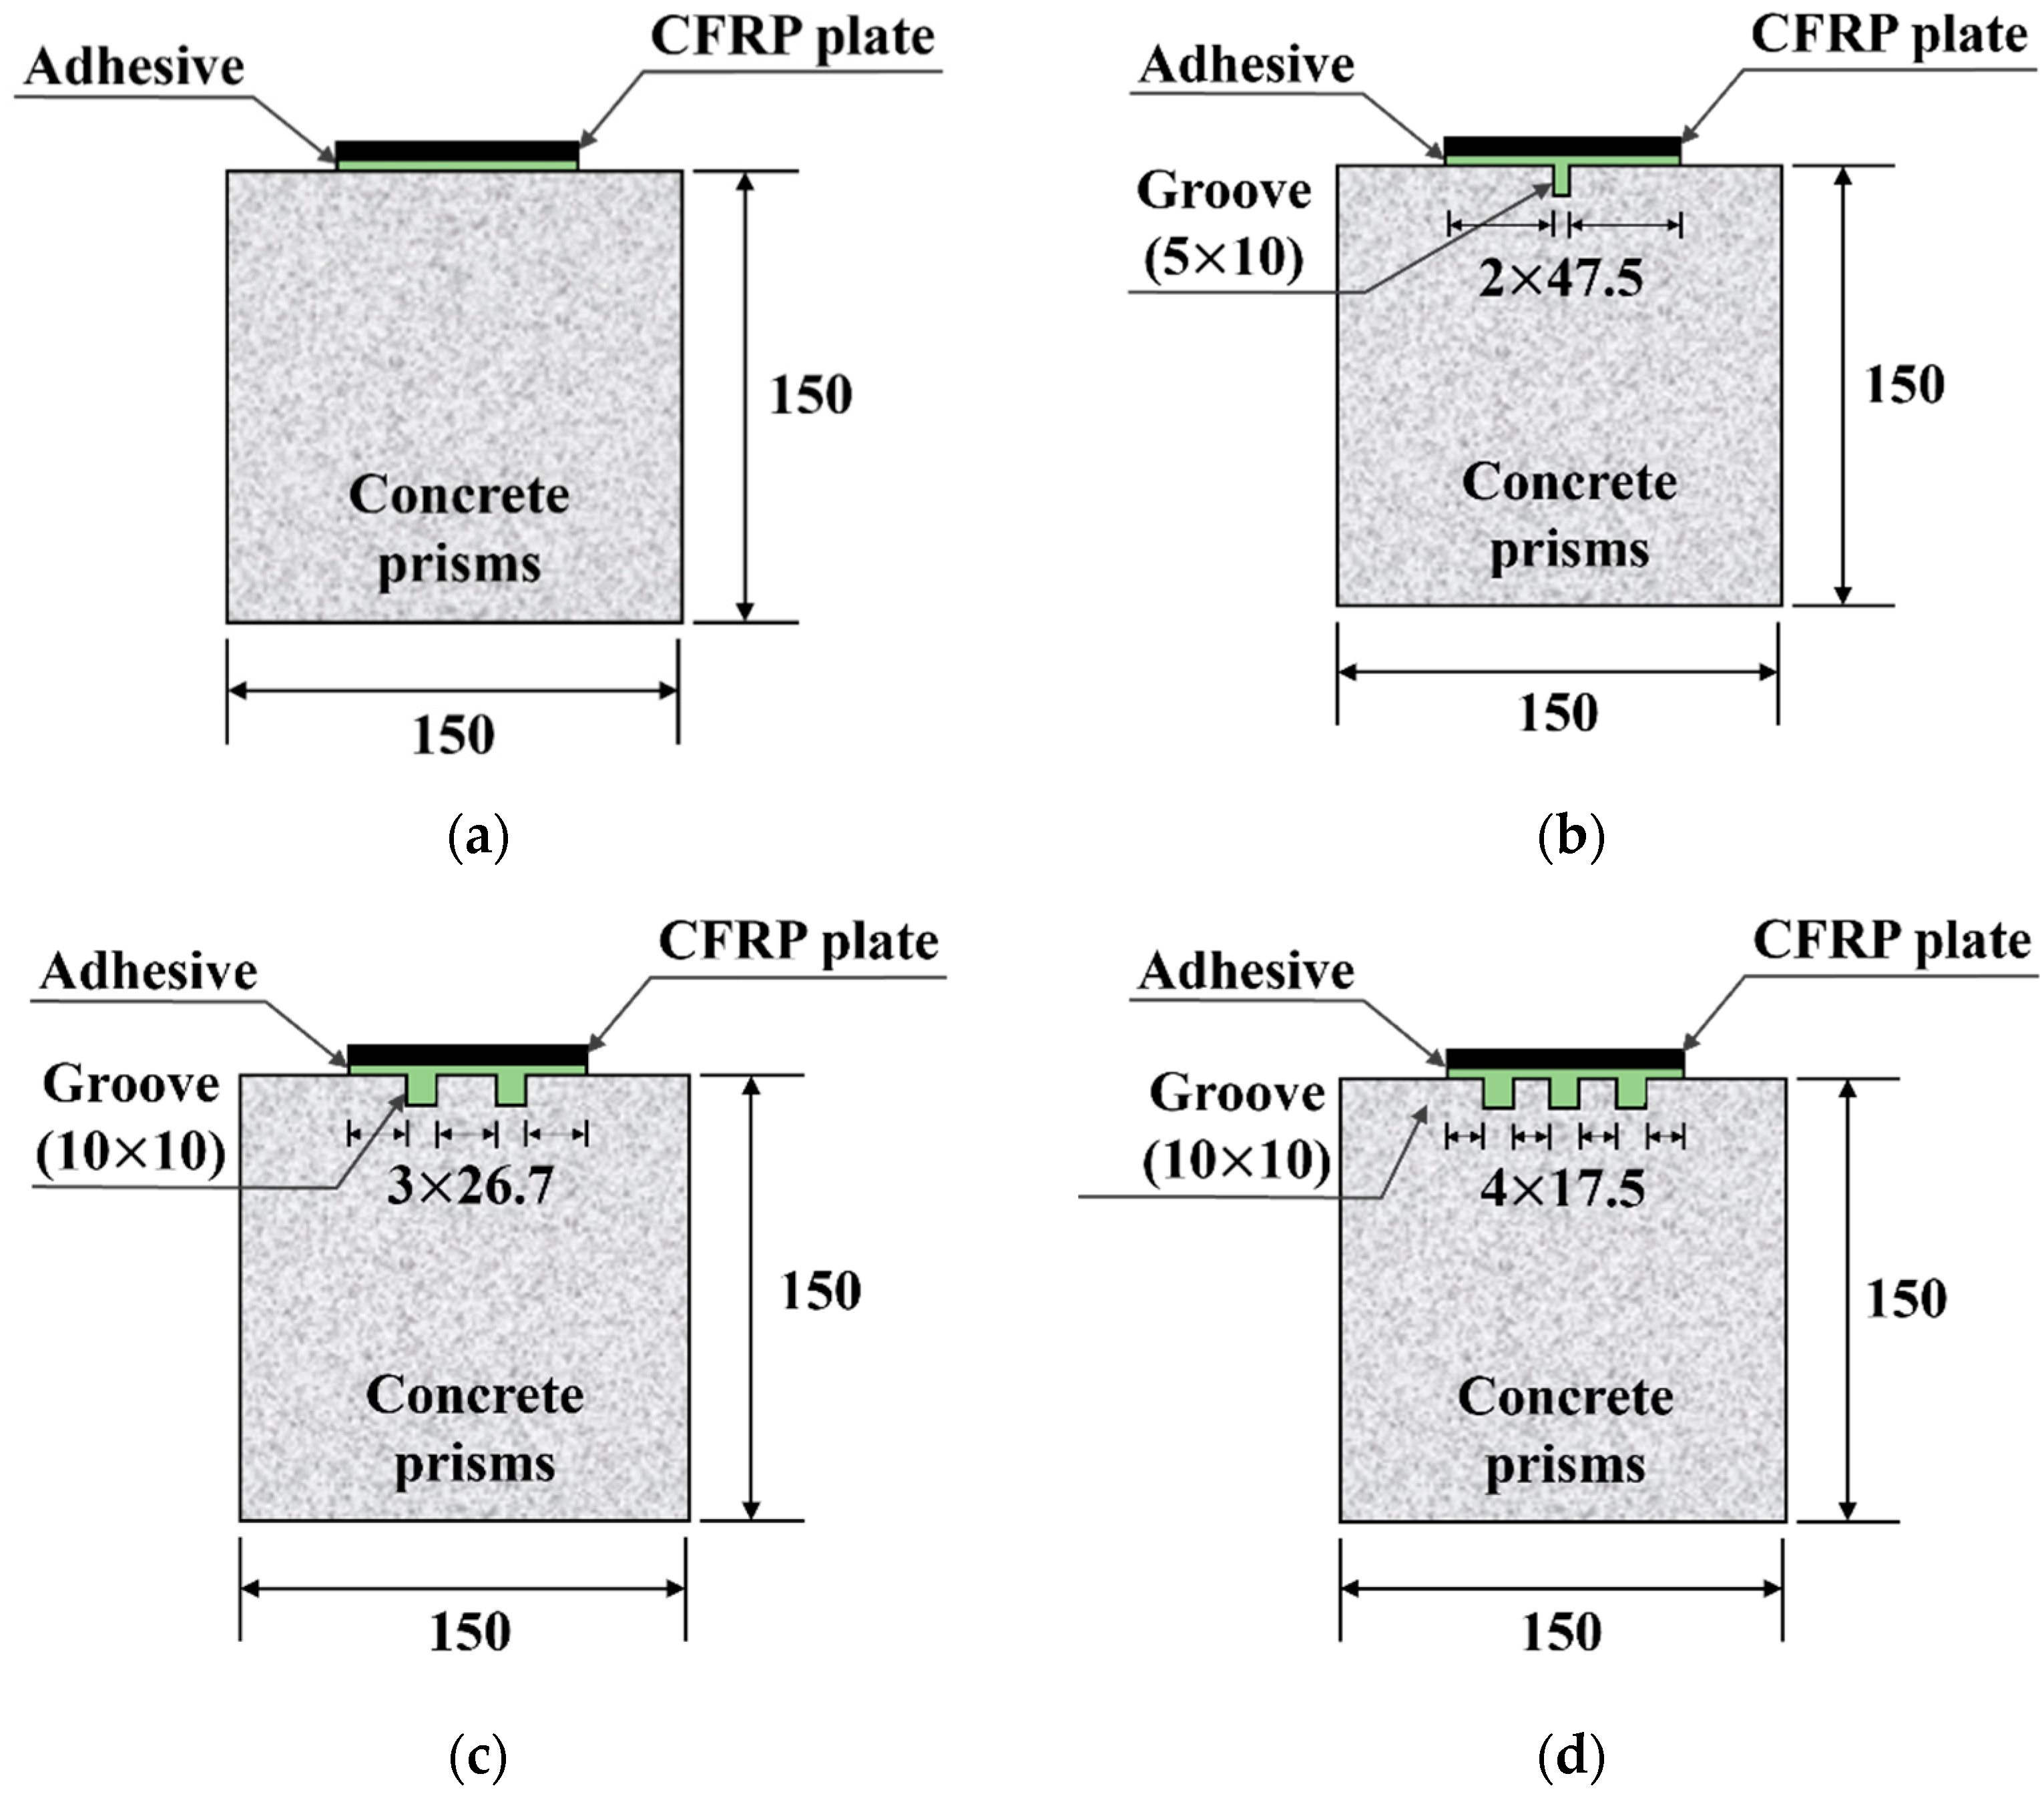
In Table 3, specimen names beginning with “E” denote the EBR method, while “G” indicates the EBROG method. The subsequent numbers indicate the design compressive strength of the concrete, number of grooves, groove width, and groove depth, respectively. The final numbers, “1” and “2,” denote the first and second tests conducted for each specimen configuration, respectively. For example, “G-25-1-5-10-1” refers to the first specimen strengthened using the EBROG method, with a concrete compressive strength of 25 MPa, one groove, and groove dimensions of 5 mm width and 10 mm depth. Figure 2 presents representative strengthening details for specimens using both the EBR and EBROG methods. When multiple grooves were applied to a single specimen, the grooves were uniformly distributed within the 100 mm width of the CFRP plate. The clear spacing between adjacent grooves and between the outer grooves and the CFRP plate edges was calculated as ( b f n g b g ) / ( n g + 1 ) , where bf is the CFRP plate width, ng is the number of grooves, and bg is the groove width. For example, for one 5 mm wide groove, the spacing on each side was 47.5 mm. For two 10 mm wide grooves, three equal spacings of 26.7 mm were provided, whereas for three 10 mm wide grooves, four equal spacings of 17.5 mm were used, as shown in Figure 2.
The strengthening procedures for the EBR and EBROG methods were as follows. CFRP plates were cut to a length of 550 mm for use in both methods. In the EBR method, a grinding machine was used to remove the weak surface layer of the concrete. The loose particles were cleared using an air jet. An epoxy resin layer approximately 2 mm thick was applied to the bonding surface, after which the CFRP plate was attached. In contrast, the EBROG method did not require any initial surface preparation. Grooves in the EBROG specimens were formed using a machine equipped with a 1.5 mm thick circular blade. To ensure a uniform groove depth across the entire bonding area, the groove length was cut approximately 20 mm longer than the planned bonding length. Afterward, the loose particles were removed using an air jet, as in the EBR method. Epoxy resin was applied to both the concrete surface and the inside of the grooves, and the CFRP plate was bonded to the surface over the grooves.

2.4. Test Setup and Instrumentation

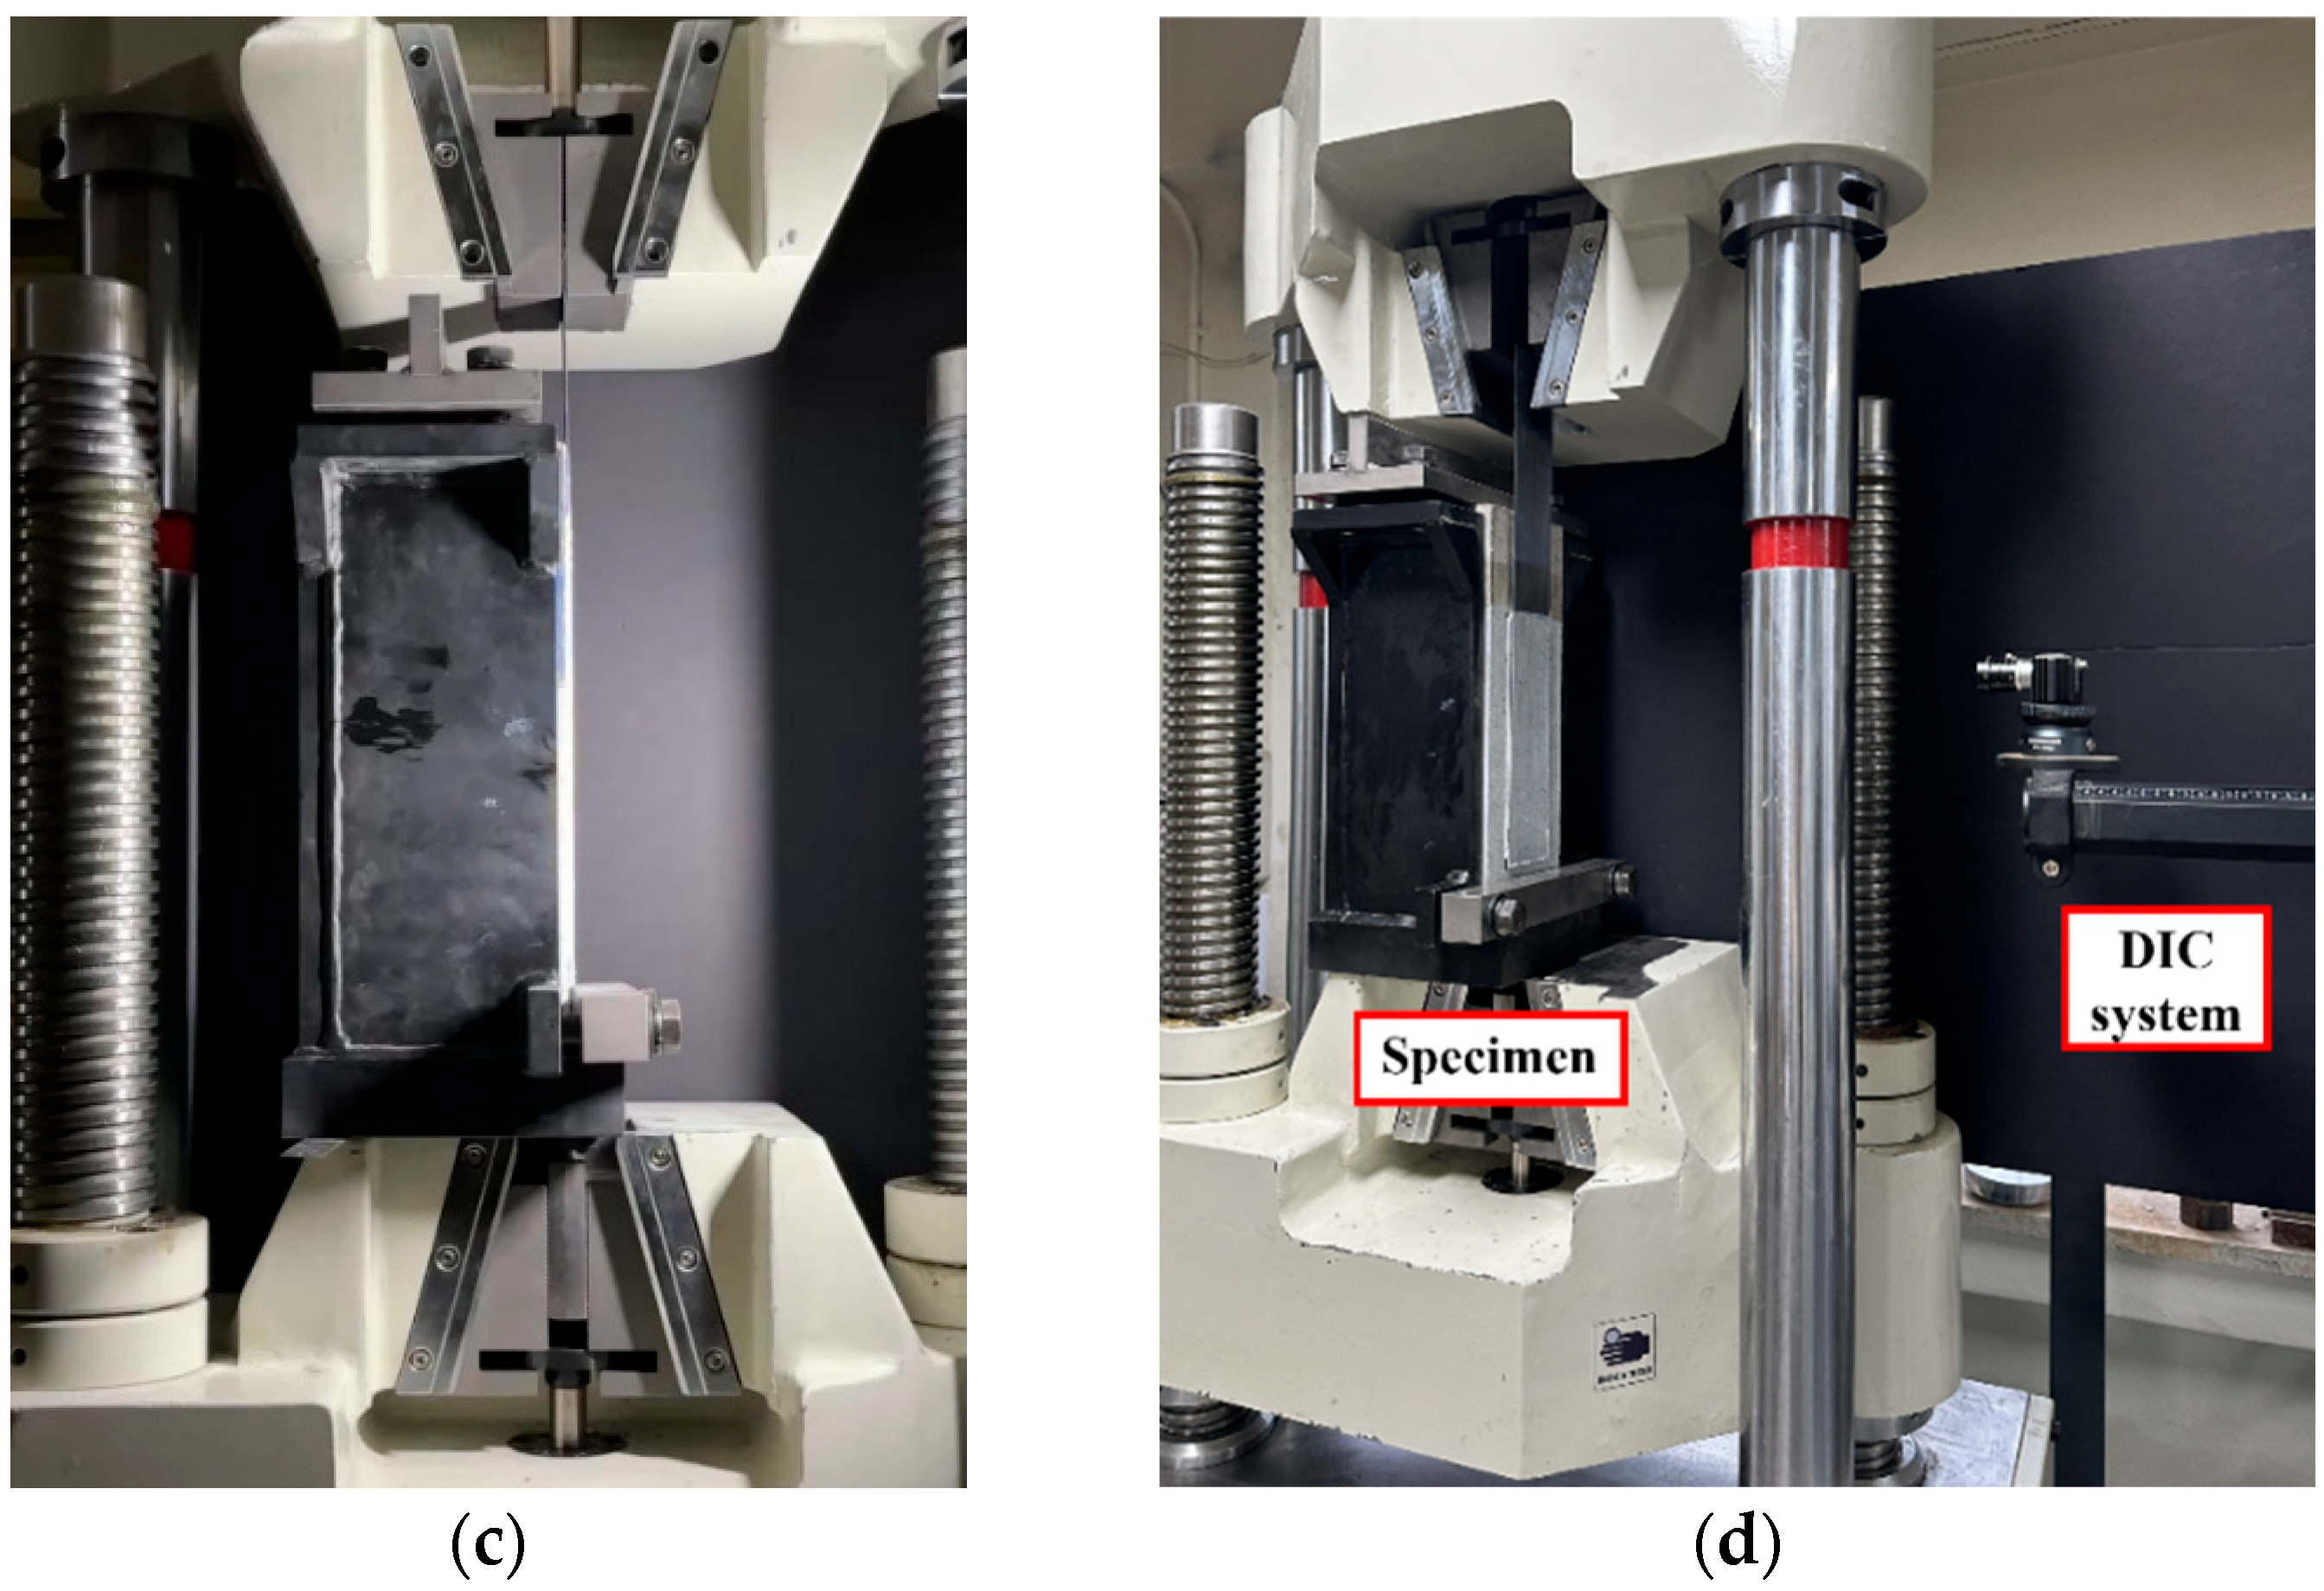
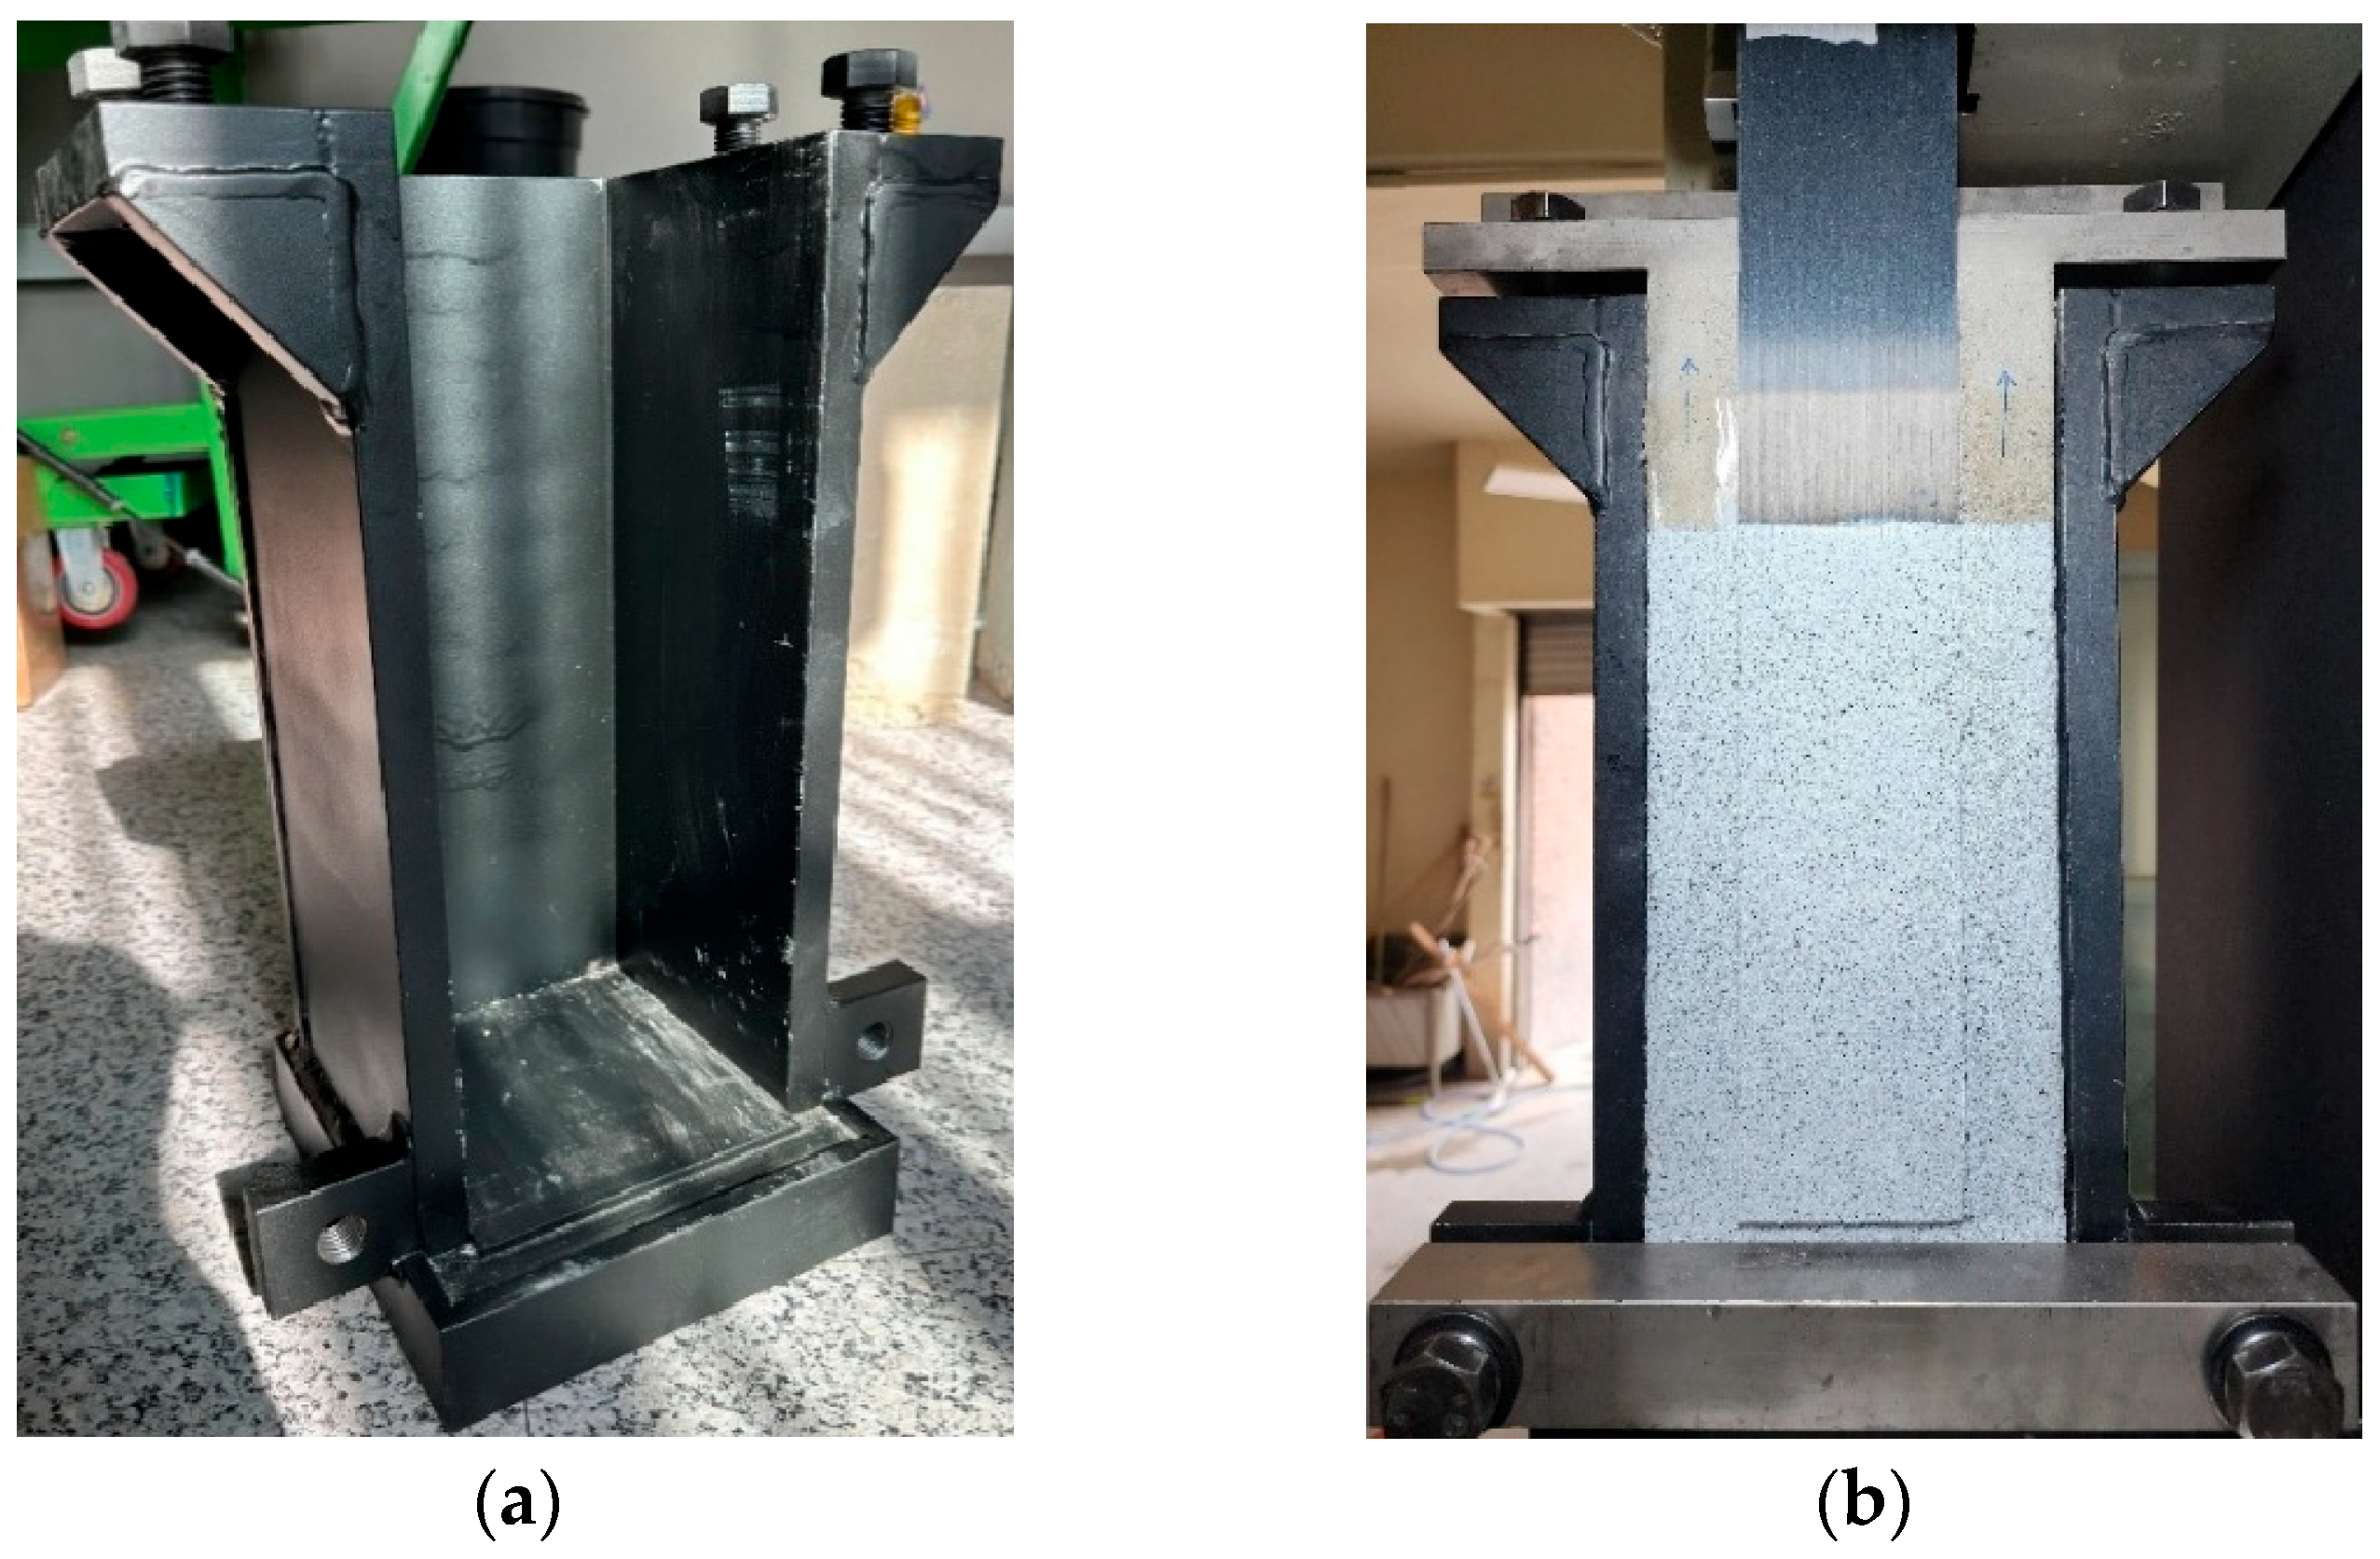
The single-lap shear tests were conducted using a universal testing machine (UTM) with a 300 kN capacity, and the load was applied to the specimens under displacement control at a rate of 0.2 mm/min. Each specimen was securely fixed using a concrete frame with internal dimensions of 150 × 150 × 400 mm. Figure 3 presents the experimental setup for the single-lap shear test conducted in this study. Each specimen was firmly fixed using a concrete frame with internal dimensions of 150 × 150 × 400 mm, as shown in Figure 3a.
To measure the deformation of the bonded region of the CFRP, a digital image correlation (DIC) system was employed. DIC is a non-contact, image-based measurement technique capable of precisely capturing minute displacements on the specimen surface. During the test, the displacement field across the entire surface was calculated using Mercury RT software (Version 3.2.1.0), the DIC system’s processing tool. Simultaneously, the load measured by the load cell was recorded along with the image data from the DIC system. To measure the deformation of the CFRP plate using DIC, a high-contrast random speckle pattern was uniformly applied to the specimen surface, as shown in Figure 3b. Displacement was extracted based on the differences between consecutive image frames, with the frame rate set at 1 frame per second (FPS = 1). To enhance measurement reliability, camera calibration and lighting conditions were adjusted in advance. The virtual patch spacing was set to 20 pixels, and the patch size to 40 pixels. The total measurement area was 150 × 350 mm. The specimen bonded with the CFRP plate was installed in the UTM for the single-lap shear test, as shown in Figure 3c. Figure 3d shows the overall test configuration with the DIC system positioned to capture the bonded region. The load measured by the load cell and the DIC-based displacement data were recorded simultaneously on the same time axis.

3. Experimental Results and Discussion

3.1. Failure Modes

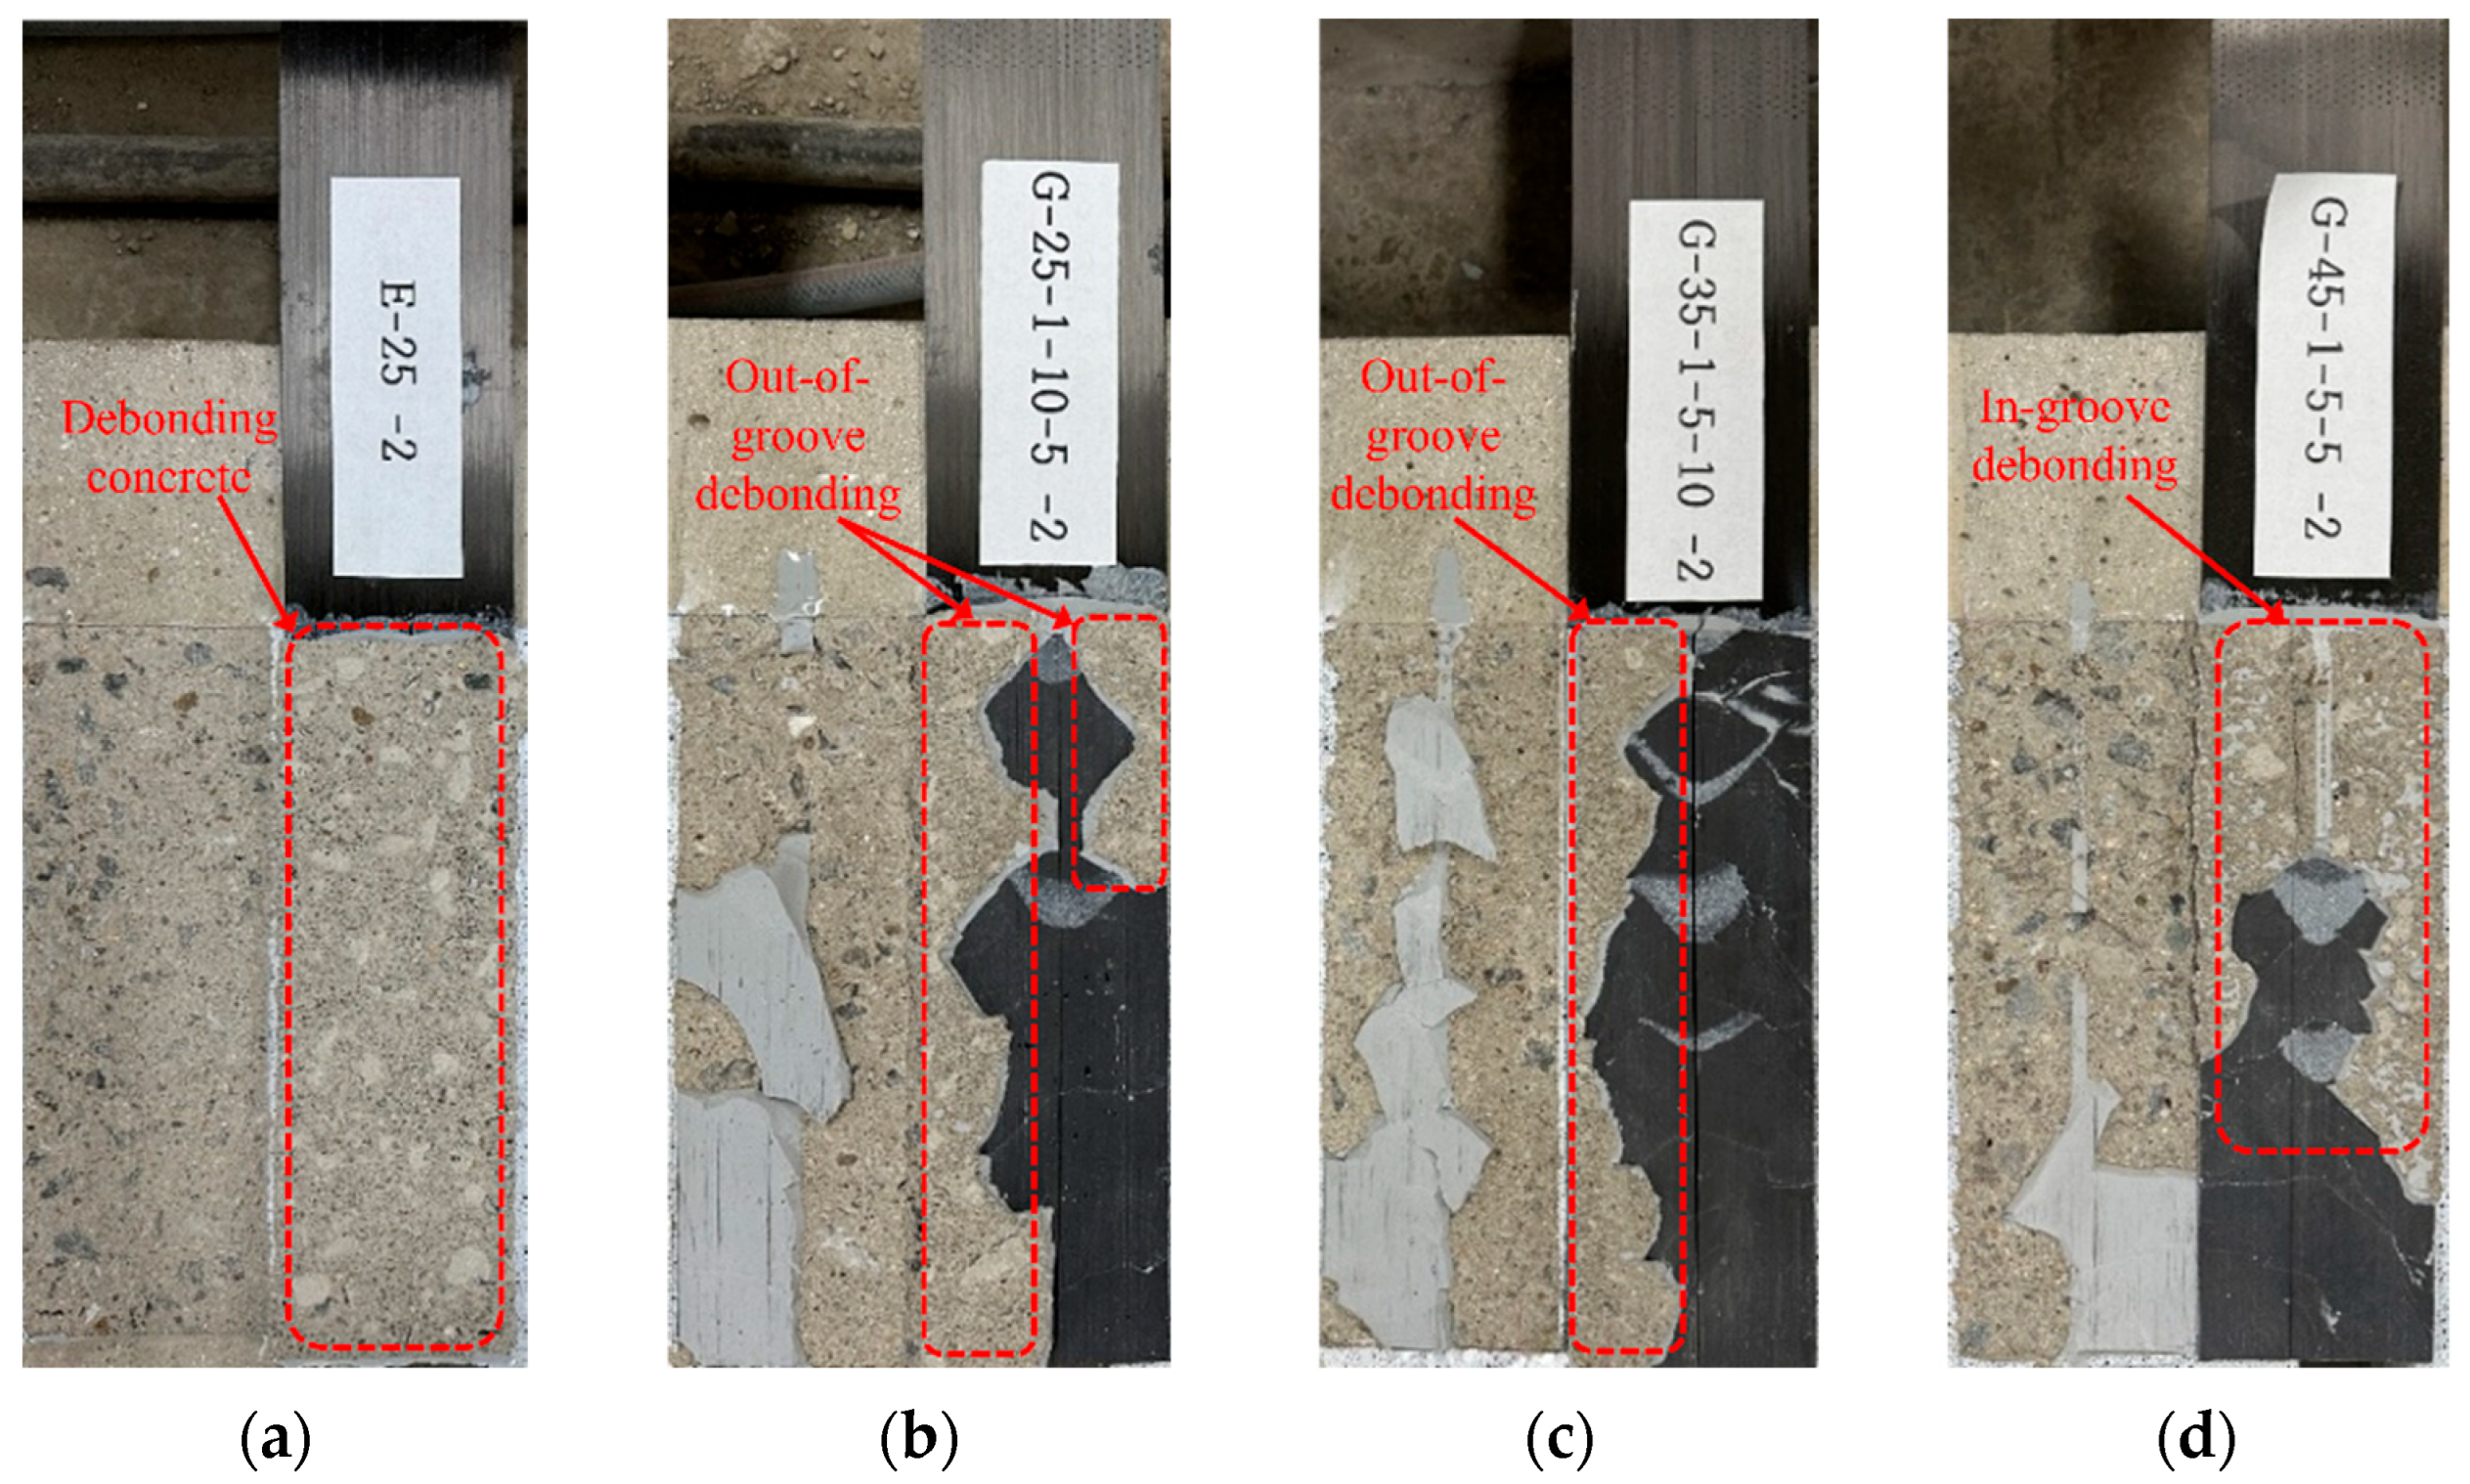
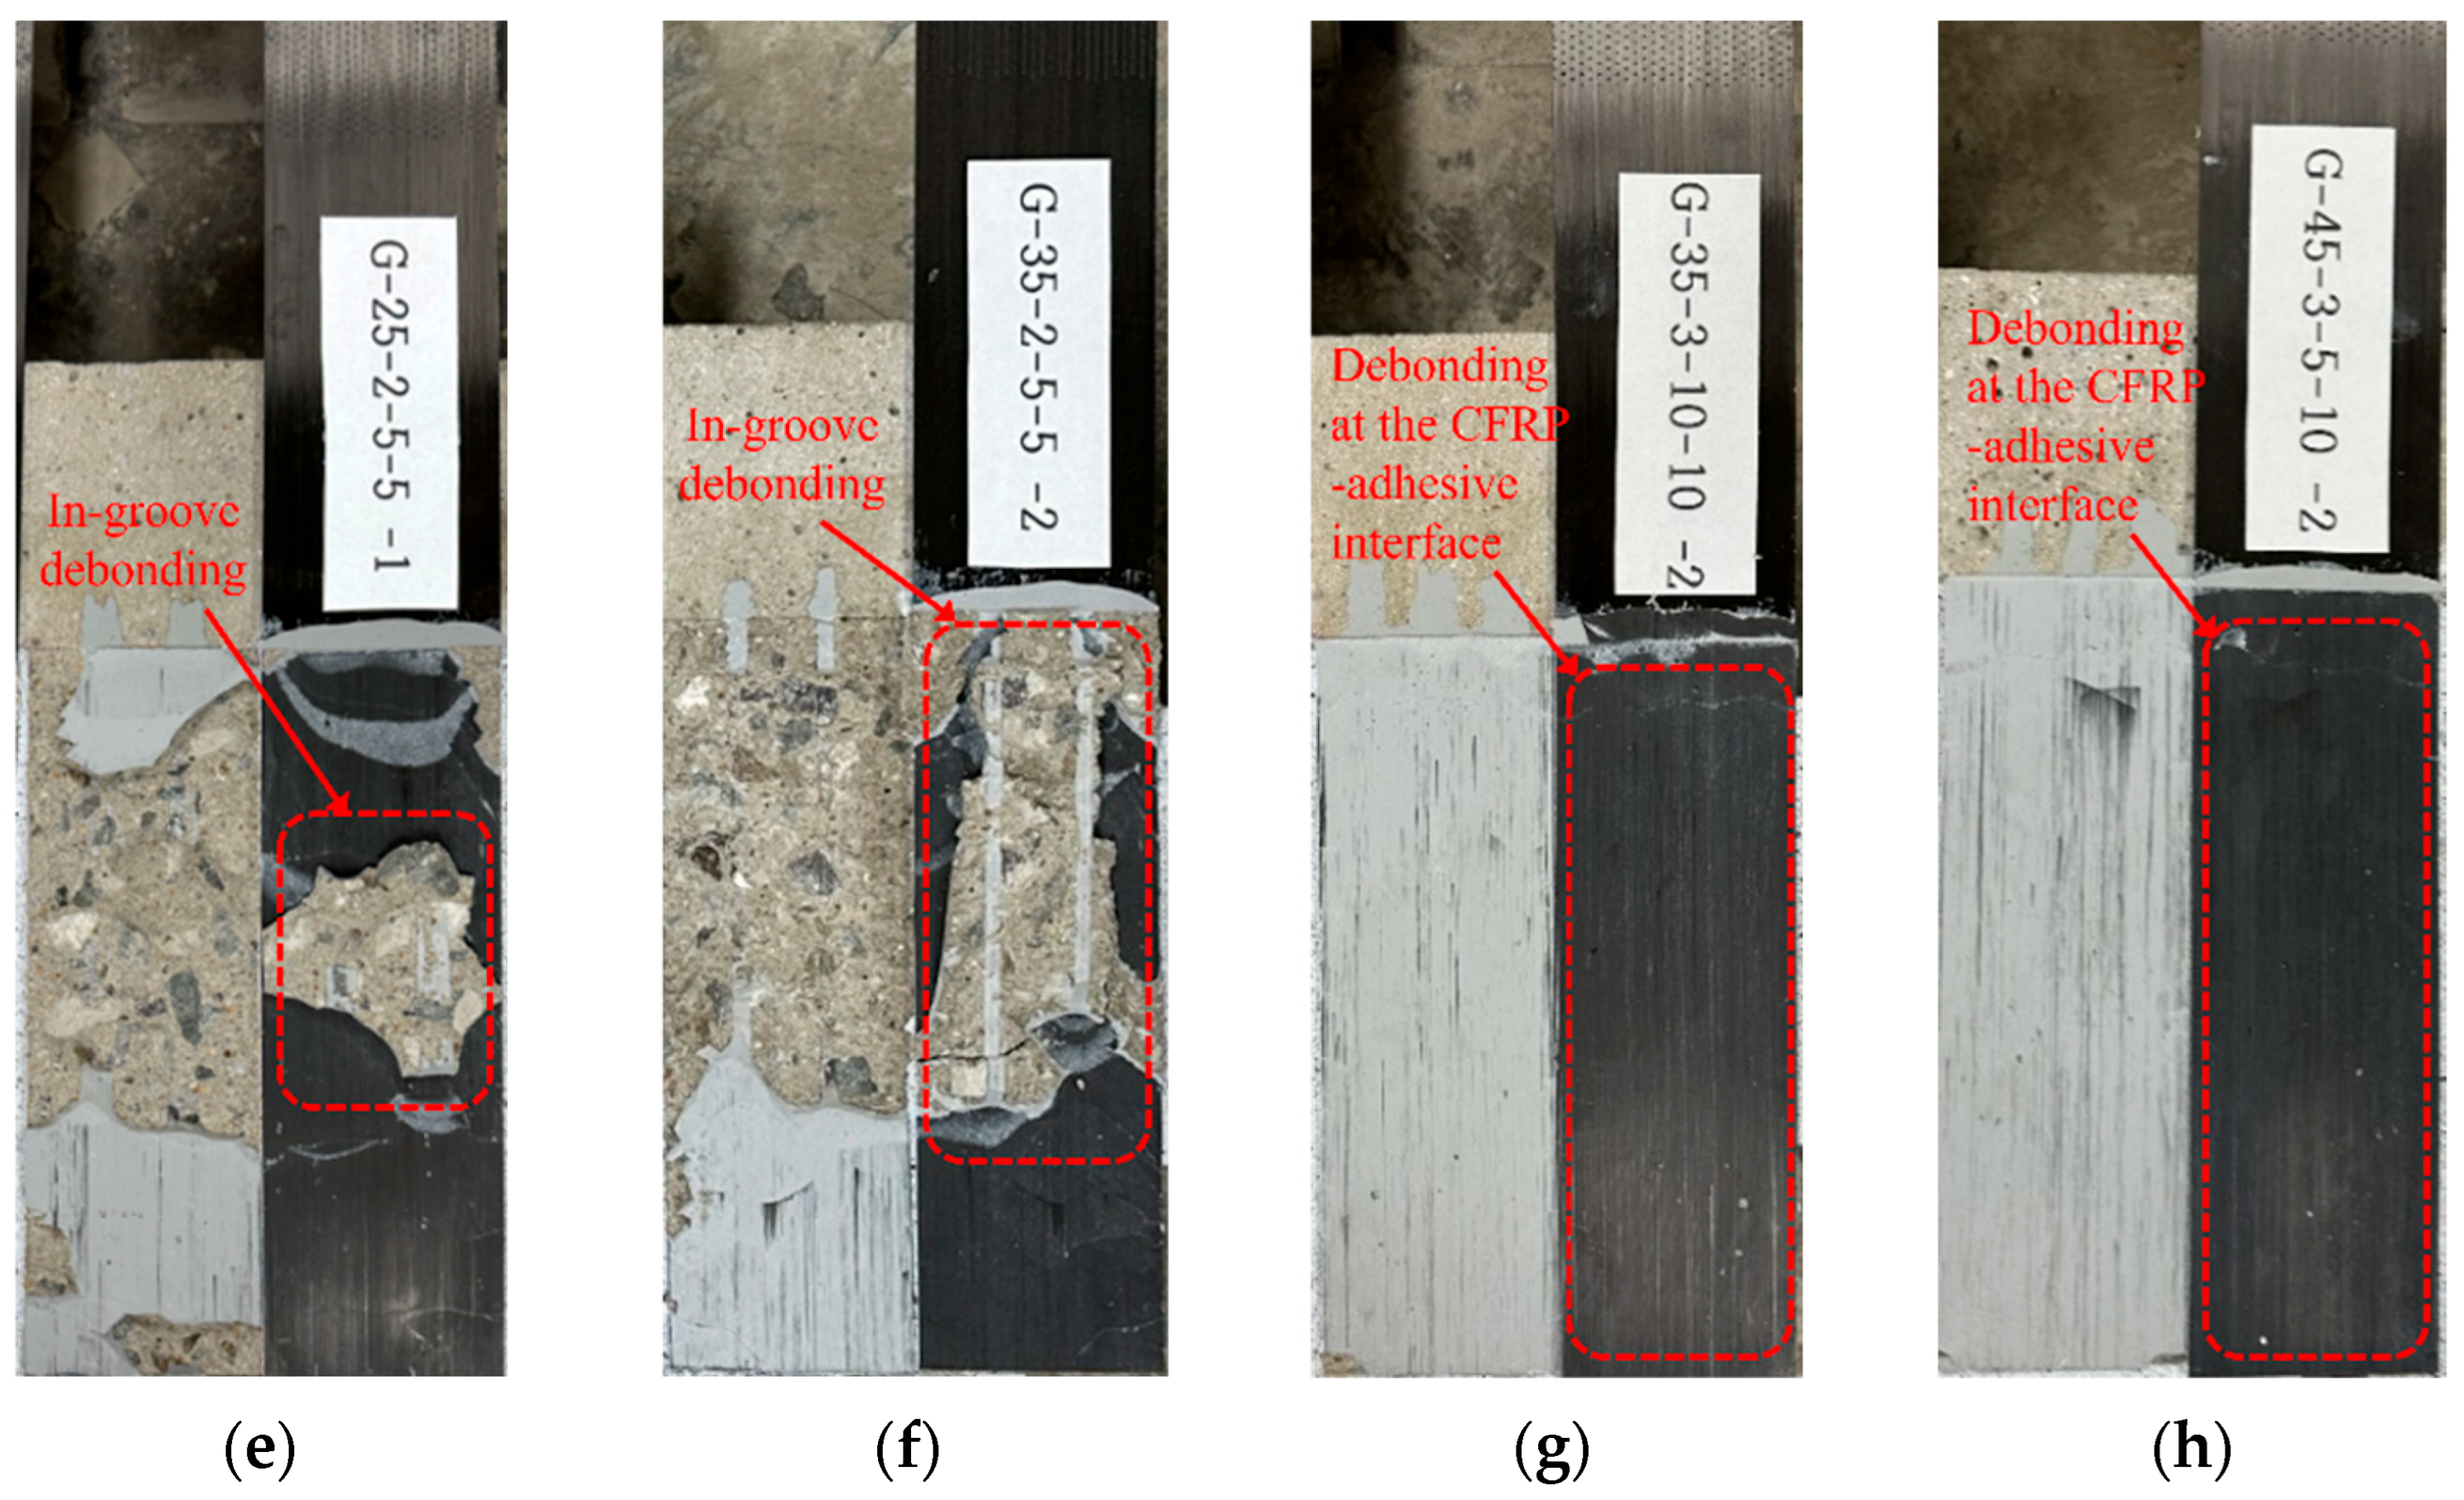
Figure 4 presents typical failure modes observed in the single-lap shear tests of specimens strengthened using the EBROG method. The failure modes for all specimens are summarized in Table 3. Four distinct failure modes were identified through the experiments. The first mode is debonding in concrete (DC), characterized by the detachment of a thin layer of concrete along with the adhesive. The second is out-of-groove debonding (OGD), where there is part of the concrete substrate outside the longitudinal groove debonding together with the CFRP plate. The third is in-groove debonding (IGD), where the concrete within the groove detaches with the CFRP plate. The last is debonding at the CFRP–adhesive interface (F/A), which occurs at the interface between the epoxy and the CFRP plate.
As shown in Figure 4a, the EBR specimens exhibited the DC failure mode, where there is a thin layer of concrete debonding together with the CFRP plate. This type of failure at the bond interface is attributed to the relatively low strength of the concrete compared to the epoxy and CFRP plate in the EBR-strengthened specimens. In contrast, the EBROG specimens, as shown in Figure 4b–h, did not exhibit concrete layer debonding across the entire bonded surface of the CFRP plate due to the improved concrete interface. Figure 4b,c show the failure modes of specimens with a single groove, exhibiting OGD, where there is first a thin concrete layer outside the groove debonding, followed by rupture along the groove. This failure is associated with the lack of surface treatment outside the groove. OGD was primarily observed in specimens with lower concrete strength, indicating that the bond enhancement provided by the groove was insufficient to compensate for weak bonding in the untreated regions.
As shown in Figure 4d–f, IGD was mainly observed in specimens with higher concrete compressive strength, fewer than two grooves, and a groove depth of 5 mm. This suggests that with increased concrete compressive strength and groove dimensions, the shear stress between the CFRP plate and concrete was effectively transferred into the concrete matrix, resulting in improved bond performance. Meanwhile, the F/A failure mode was predominantly observed in EBROG specimens with three grooves and a concrete compressive strength of 45 MPa. This is consistent with the findings of Moshiri et al. [48], indicating that the bond between all components was effectively maintained due to the enhanced bonding provided by the EBROG method.

3.2. Bond Strength

All experimental results for the specimens strengthened using the EBR and EBROG methods are summarized in Table 3. The bond strength obtained from the single-lap shear tests is denoted as P u , and the average bond strength P u , a v g . measured from two EBROG specimens under the same test conditions was compared with that of the EBR specimens. The bond strengths of the EBR-strengthened specimens were 24.0 MPa, 29.83 MPa, and 36.08 MPa for concrete compressive strengths of 25 MPa, 35 MPa, and 45 MPa, respectively. The EBROG specimens exhibited an increase in bond strength ranging from 49.56% to 154.48% compared to the EBR specimens. It is noteworthy that the improved bond strength was achieved simply by introducing longitudinal grooves, without the need for additional surface treatment as required in the EBR method. To quantitatively evaluate the repeatability of the single-lap shear test results and the possible variability associated with the repeated use of opposite faces of the concrete prisms, the standard deviation (SD) and coefficient of variation (CV) of the specimens were calculated and reported in Table 3. For the EBROG specimens, the CV values ranged from 0.04% to 5.61%, with an average value of approximately 2.15%. Most EBROG duplicate groups showed CV values lower than 5%, indicating relatively low variability in the repeated tests.
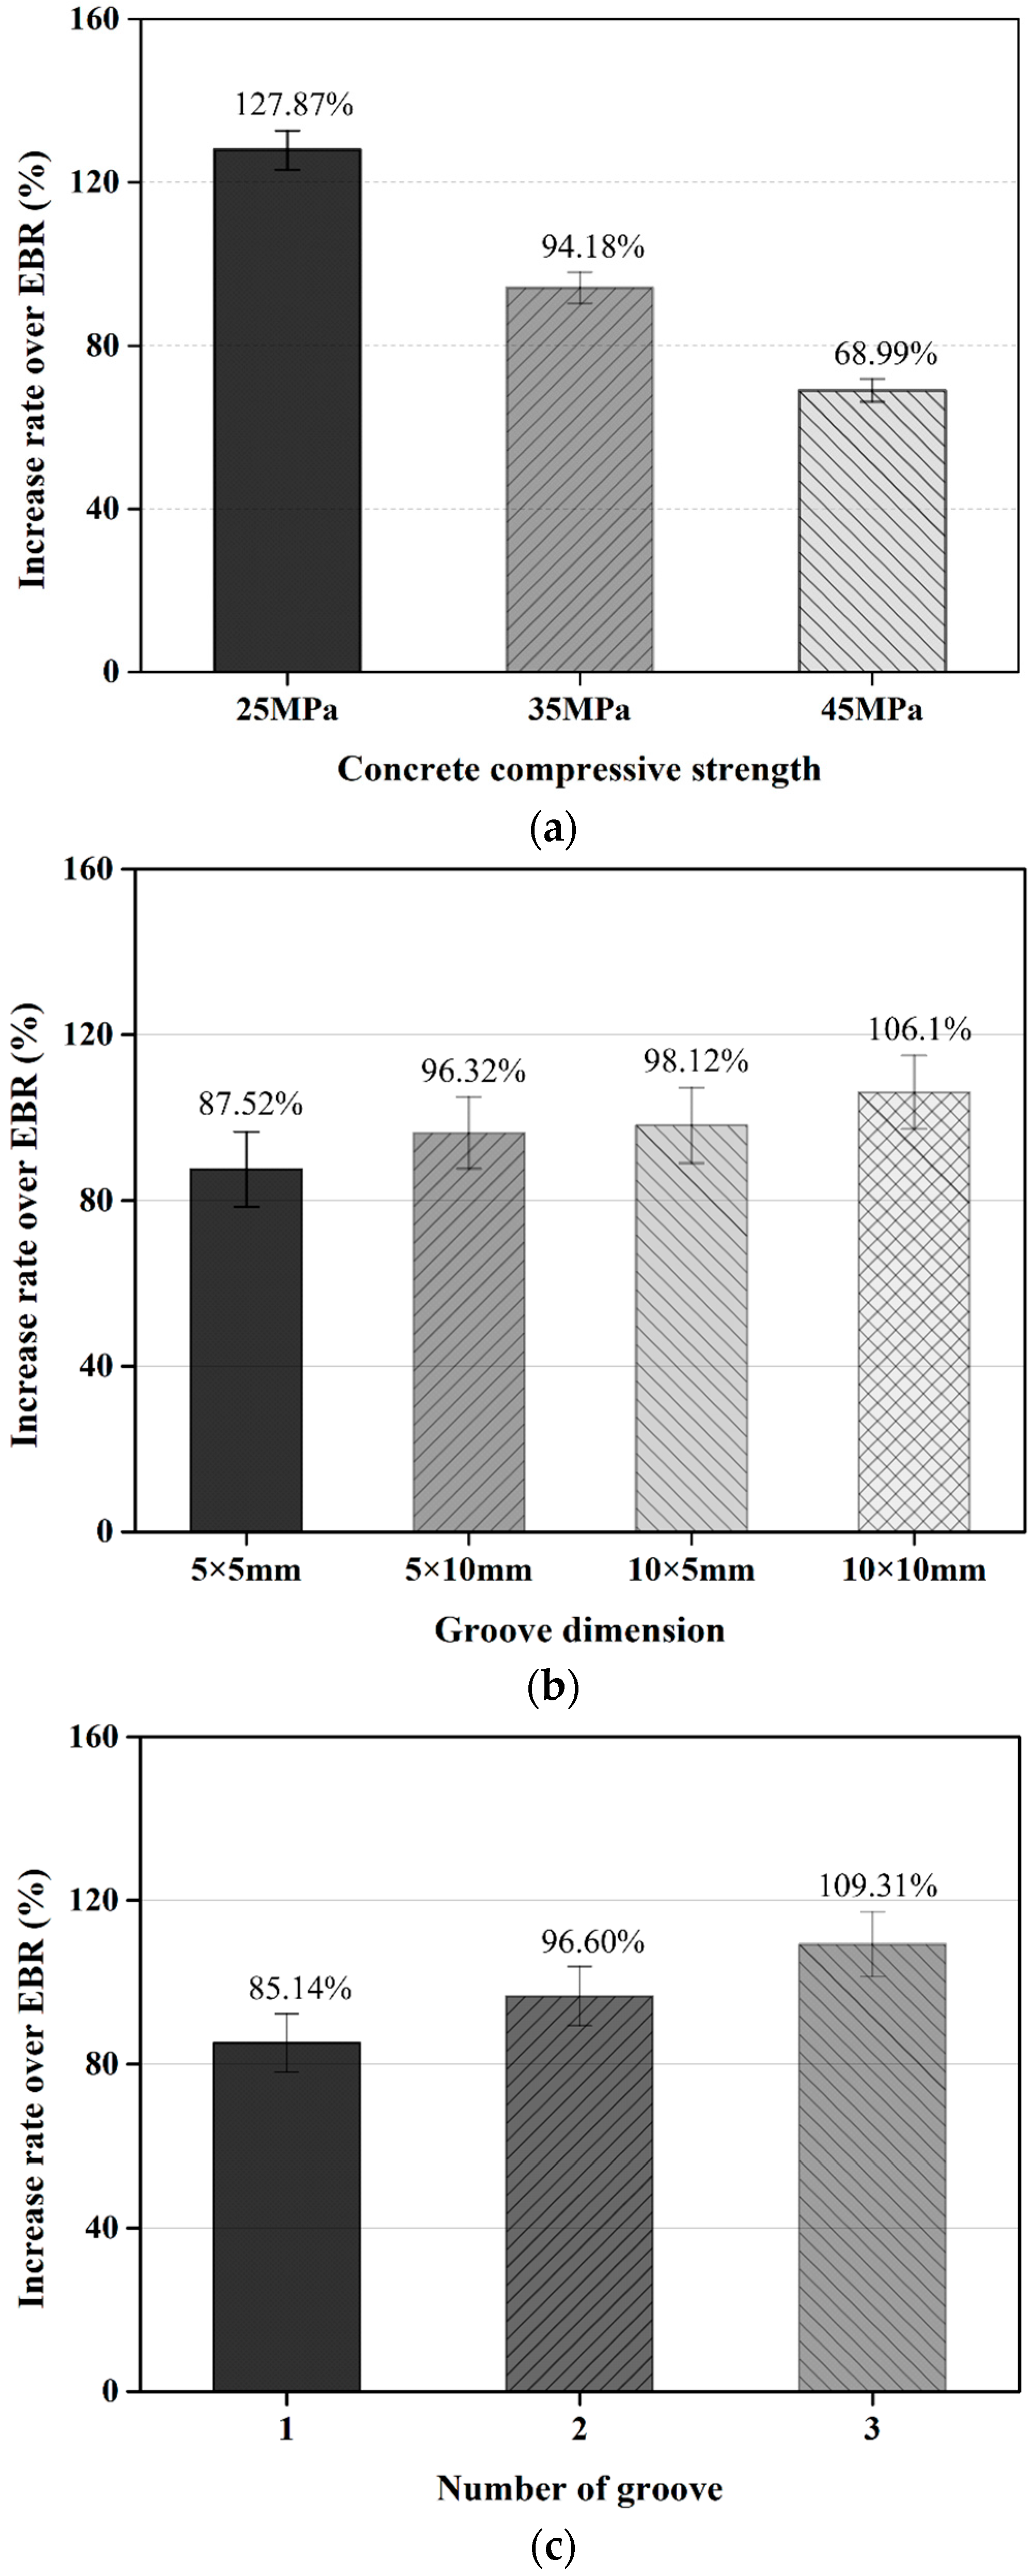
Figure 5 summarizes the effects of the key parameters using the average bond strength increase ratios of the EBROG specimens relative to the EBR controls, including the influences of concrete compressive strength, groove dimensions, and the number of grooves. Figure 5a shows the effect of concrete compressive strength on the EBROG-to-EBR bond strength ratio. When the concrete compressive strength was 25 MPa, the bond strength of the EBROG specimens increased by 127.87% relative to the EBR specimens. When expressed as an improvement ratio relative to the EBR controls, this ratio decreased to 94.18% and 68.99% at 35 MPa and 45 MPa, respectively, because the bond strength of the EBR specimens also increased with concrete compressive strength. In contrast, for EBROG specimens with the same groove configuration, the bond strength increased by 5.94% as the concrete strength increased from 25 MPa to 35 MPa, and by 5.40% as it increased from 35 MPa to 45 MPa, indicating a slight upward trend. These results suggest that the EBROG method provides a relatively greater improvement over the EBR method in lower-strength concrete, whereas increasing concrete compressive strength contributes to a gradual increase in the absolute bond strength of EBROG specimens.
Figure 5b presents the bond strength improvement ratio as a function of groove dimensions. When the groove size was 5 × 5 mm, the bond strength of the EBROG specimen increased by 87.52% compared with the EBR specimen. For specimens with groove dimensions of 5 × 10 mm and 10 × 5 mm, the bond strength improvement ratios relative to the EBR specimen were 96.32% and 98.12%, respectively. This trend is consistent with that reported by Moghaddas and Mostofinejad [43], indicating that even when the groove cross-sectional area is the same, increasing the groove width can further enhance bond performance. The specimen with a 10 × 10 mm groove exhibited the highest bond strength improvement ratio of 106.1%, representing the best performance among all groove configurations considered in this study. This is attributed to the simultaneous increase in groove width and depth, which enlarges the epoxy-filled volume and the bonded area, and promotes deeper load transfer into the concrete substrate, thereby improving the interfacial shear resistance. It should be noted that the comparison between the EBR and EBROG specimens does not represent the isolated effect of groove geometry alone. The EBR specimens were bonded after surface grinding, whereas the EBROG specimens were prepared by groove cutting and cleaning without additional grinding of the out-of-groove surface. Therefore, the measured bond-strength improvement reflects the combined effects of groove-induced mechanical anchorage, increased bonded area, newly exposed concrete surfaces inside the grooves, epoxy-filled groove confinement, and the actual EBROG surface condition adopted in this study.
Figure 5c shows the effect of the number of grooves on the bond strength improvement ratio of the EBROG specimens relative to the EBR control specimens. With a single groove, the average bond strength of the EBROG specimens increased by 85.14% compared with the EBR specimens. As the number of grooves increased to two and three, the improvement ratio increased stepwise to 96.60% and 109.31%, respectively. This indicates that increasing the groove number not only enlarges the effective bonded area but also promotes a more distributed interfacial shear stress transfer and mobilizes greater participation of the concrete substrate, thereby enhancing overall bond performance. Among the key parameters considered in this study, the influence of groove number on bond enhancement was the second most pronounced, following the effect of concrete compressive strength. These results suggest that groove number is a critical design parameter for improving the bond performance of the EBROG method, and that adjusting the number of grooves can be an efficient means of achieving greater bond enhancement, particularly when the CFRP plate width is fixed.

3.3. Load–Slip Behavior

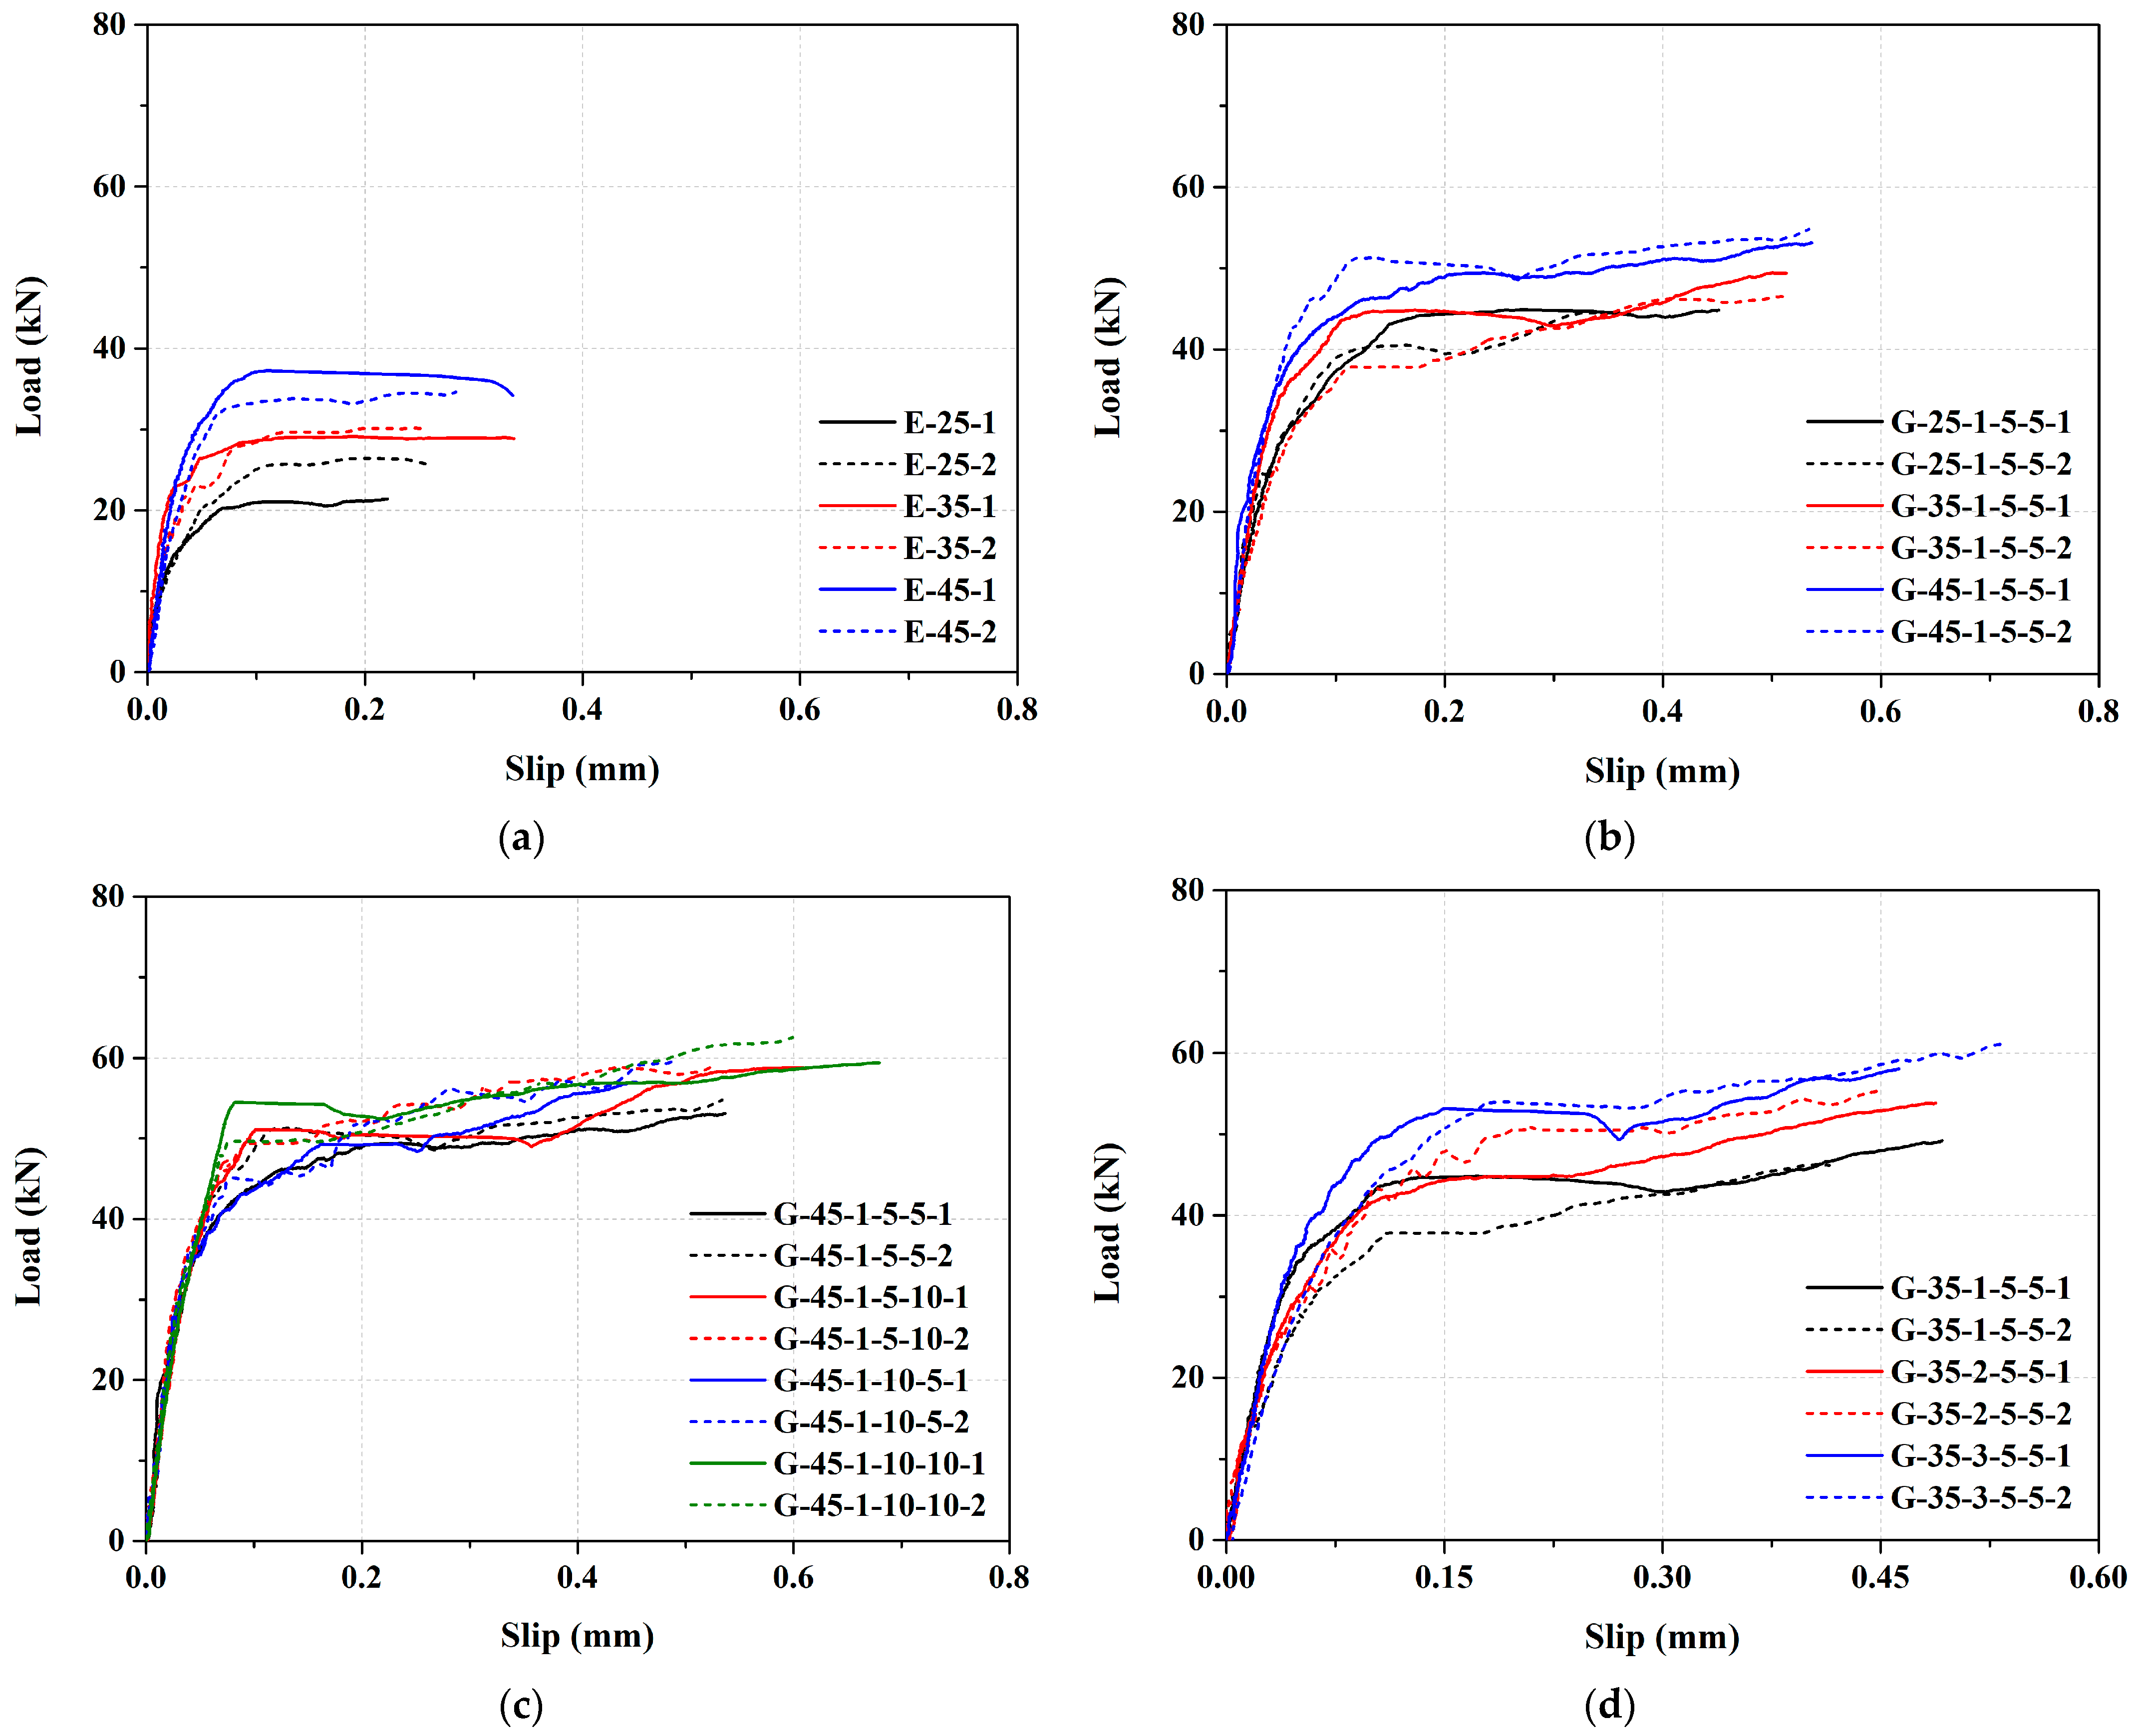
Figure 6 presents the load–slip curves of the specimens measured through the single-lap shear tests. In this case, slip was calculated as the difference between the average displacement values of the concrete surfaces on either side at the mid-point of the loaded end of the CFRP plate. Figure 6a shows the load–slip behavior of the EBR specimen, which exhibited two distinct phases, an elastic phase and a softening phase. In the initial elastic phase, the load and slip increased linearly, continuing up to approximately 75% of the ultimate load. Subsequently, the curve entered the softening phase, where the slope gradually decreased due to the reduction in bond strength between the CFRP plate and the concrete. Ultimately, failure occurred due to debonding at the interface between the CFRP plate and the concrete, accompanied by the propagation of microcracks in the concrete surface layer.
Figure 6b–d show the load–slip curves of the EBROG specimens. Unlike the EBR specimens, the EBROG specimens exhibited an additional hardening phase following the elastic and softening phases. The hardening phase observed in the EBROG specimens can be attributed to the progressive activation of the epoxy-filled grooves after local slip or partial debonding occurs near the loaded end. In the EBR specimens, once debonding initiates at the CFRP–concrete interface, the load-transfer capacity rapidly decreases because the interfacial resistance is mainly provided by the shallow concrete surface layer. In contrast, in the EBROG specimens, the grooves provide additional mechanical interlocking and anchorage between the CFRP plate, epoxy resin, and concrete substrate. Therefore, even after the initial reduction in interfacial stiffness, the load can be redistributed from the damaged surface interface to the groove regions and deeper concrete substrate. This progressive engagement of the grooves increases the resistance against further slip and allows the specimen to sustain additional load before final failure. This behavior aligns with the findings of Codina et al. [50], and confirms that the grooves introduced by the EBROG method not only delay debonding but also enhance load-carrying capacity. Furthermore, as shown in Figure 6b,d, both bond strength and slip increased with increasing concrete compressive strength and an increased number of grooves in the EBROG specimens. This can be attributed to the improved resistance of the concrete substrate with higher concrete compressive strength and the enhanced interfacial shear resistance due to the increased bonding area from a higher number of grooves. Additionally, Figure 6c presents that both bond strength and slip tended to increase with increasing groove dimensions. However, the difference in bond performance between the specimens with 5 × 10 mm and 10 × 5 mm grooves was negligible. This suggests that even when the aspect ratio between width and depth varies, grooves with the same cross-sectional area contribute similarly to the bond performance at the CFRP-to-concrete interface.

3.4. Slip Behavior Along CFRP Plate

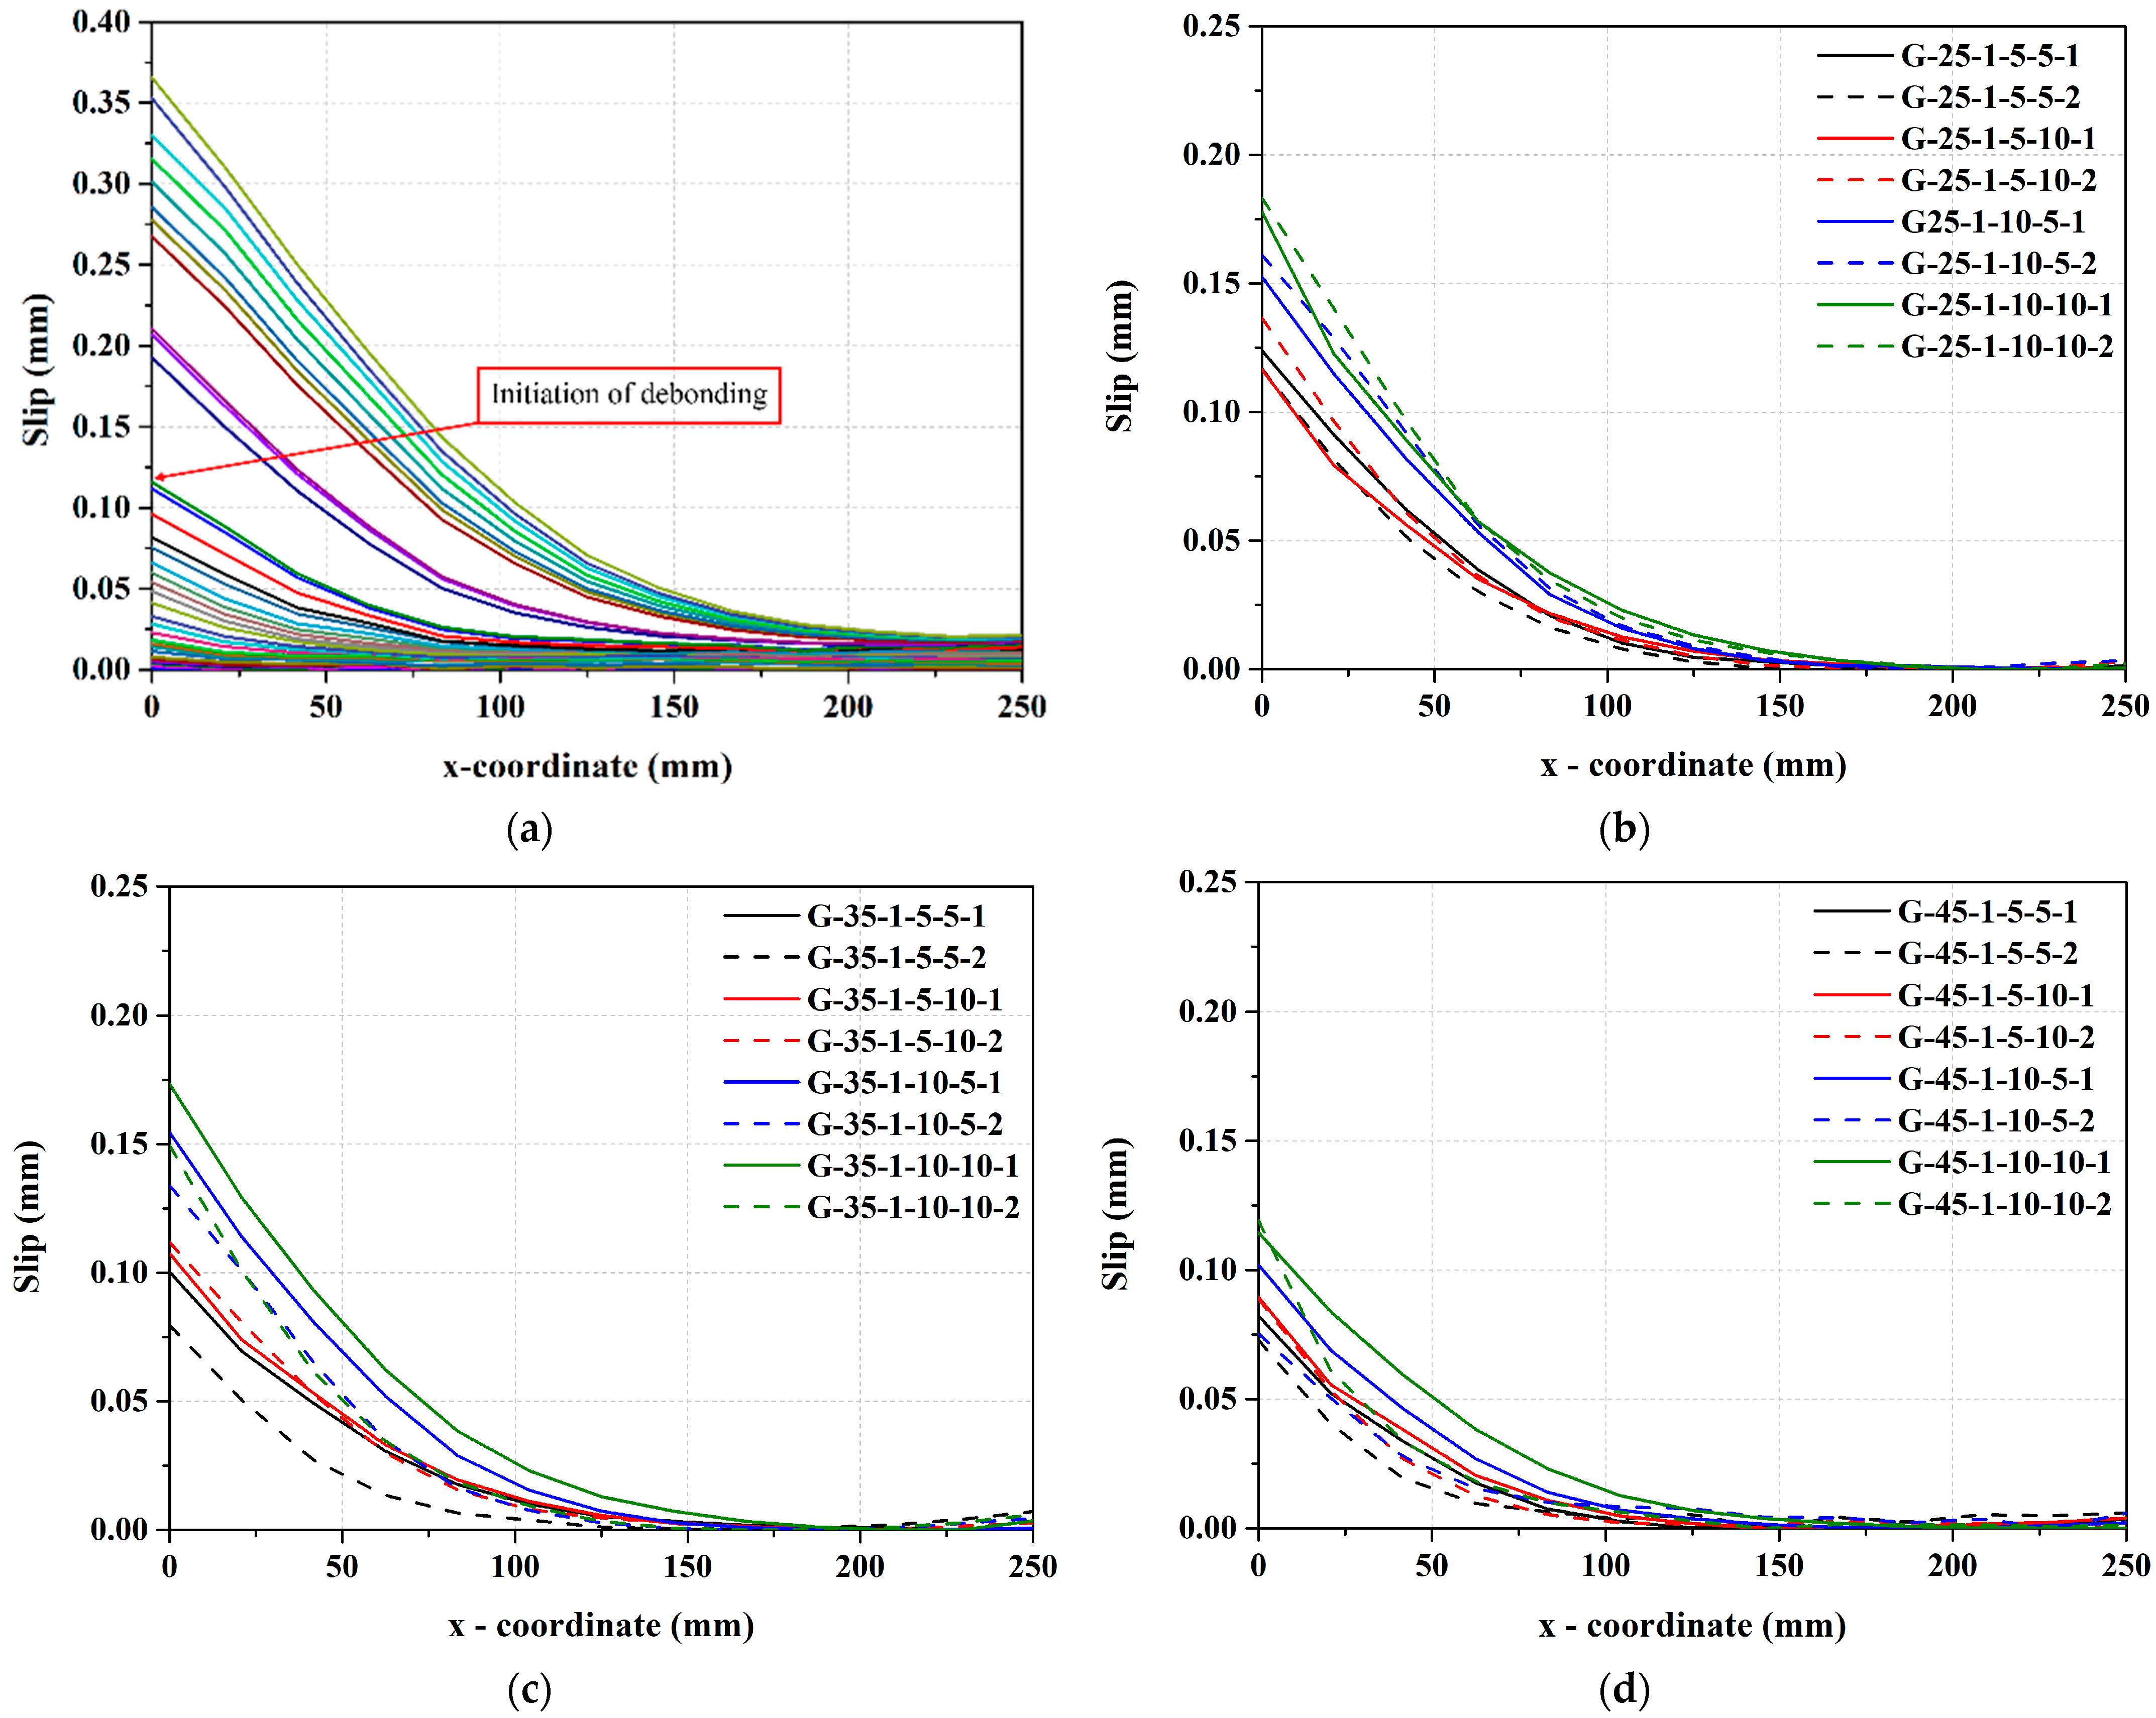
Figure 7 presents the slip distribution measured along the CFRP plate under various parameters. Figure 7a shows the slip–x-coordinate distribution at different load levels for specimen G-35-1-5-10-2, where each curve represents 2% load increments. As the load increased, the slip along the x-coordinate also increased, with a rapid increase in slip observed near the loaded end after approximately 0.12 mm. This indicates the initiation of debonding between the CFRP plate and the concrete. Figure 7b–d compare the slip–x-coordinate curves at the onset of debonding for concrete compressive strengths of 25 MPa, 35 MPa, and 45 MPa, respectively, based on the debonding initiation region shown in Figure 7a. In specimens strengthened using the EBROG method, the slip tended to decrease toward the anchored end due to the high bond strength between the CFRP plate and concrete. Additionally, as the concrete compressive strength increased, the slip at which debonding occurred tended to decrease. This suggests that higher-strength concrete provides greater interfacial resistance with the CFRP plate but induces more brittle behavior due to reduced deformability. In contrast, an increase in groove dimensions delayed the onset of slip. This is because larger grooves increased the bonding area between the CFRP plate and concrete and more effectively distributed interfacial shear stresses deeper into the substrate, resulting in a stronger bond. In particular, deep and wide grooves were shown to effectively delay the initial occurrence of debonding in the CFRP plate.

4. Analytical Model for Predicting Flexural Capacity

4.1. Proposed Effective Strain Model for EBROG Method

In this study, an empirical model was proposed to predict the effective strain of CFRP plate–concrete joints bonded using the EBROG method based on the results of single-lap shear tests. The proposed model for predicting the effective strain of CFRP plates incorporates all major parameters considered in this study, including concrete compressive strength, number of grooves, groove width, and groove depth. Ghaleh and Mostofinejad [46] adopted a general power function form to numerically represent the influence of each parameter. In this study, the power function expressed in Equation (1) was used to reflect the effect of each parameter on the effective strain. A power-law formulation was adopted because the governing parameters in the EBROG system, including concrete compressive strength, number of grooves, groove width, and groove depth, simultaneously influence the effective bonded area, mechanical anchorage, interfacial shear stress transfer, and stress redistribution into the concrete substrate. Therefore, the power-law form is suitable for representing the scaling effects of these material and geometric parameters. In addition, by applying a logarithmic transformation, the nonlinear power-law relationship can be converted into a linear multivariable regression model, allowing the coefficients to be determined using ordinary least-squares regression in a transparent and reproducible manner.
G f = K g · f c α 1 · ( b f n g ) α 2 · b g α 3 · h g α 4
Here, K g is a correction factor based on the experimental results, b f is the width of the FRP, and α 1 ,   α 2 ,   α 3 and α 4 represent the coefficients corresponding to each parameter.
Equation (2) is a fracture mechanics-based bond strength model used to calculate the fracture energy at the CFRP plate-to-concrete interface in specimens strengthened using the EBROG method. By dividing this equation by the cross-sectional area and elastic modulus of the CFRP plate, it can be transformed into Equation (3), which provides a form suitable for estimating the effective strain [51].
P m a x = b f 2 G f E f t f
ε e f f = 2 G f E f t f
Here, t f and E f represent the thickness and elastic modulus of the FRP, respectively, while G f denotes the fracture energy per unit width.
Applying a logarithmic transformation to the variables, Equation (1) can be rewritten as a linear multivariable model, as shown in Equation (4). The coefficients a0, a1, a2, a3, and a4 were determined using ordinary least-squares regression. After logarithmic transformation, the nonlinear power-law relationship was converted into a linear multivariable regression model. The regression coefficients were obtained by minimizing the sum of squared residuals between the experimental and predicted log ( G f ) values. In matrix form, the coefficient vector a was calculated as Equation (5). The values obtained through this process were −0.376, 0.353, −0.216, 0.125, and 0.136, respectively.
y = a 0 + a 1 x 1 + a 2 x 2 + a 3 x 3 + a 4 x 4
a = ( X T X ) 1 X T y
Here, y , a 0 , x 1 , x 2 , x 3 and x 4 represent l o g ( G f ) ,   l o g ( K g ) ,   l o g ( f c ) ,   l o g ( b f n g ) ,   l o g ( b g ) and l o g ( h g ) respectively. X is the matrix composed of the logarithmically transformed independent variables, and y is the vector of experimental l o g ( G f ) values. To improve the statistical transparency of the proposed empirical model, additional regression statistics were calculated. The R2, p-values, and 95% confidence interval(CI)s of the regression coefficients were added to Table 4. The regression model showed an R2 value of 0.84, indicating reasonable agreement between the experimental and predicted values within the calibration dataset. In addition, the p-values and 95% CIs provide quantitative information on the statistical significance and uncertainty of each regression parameter.
By substituting these coefficients into Equation (1), the relationship for the effective strain of CFRP plates strengthened with the EBROG method is derived as Equation (6). Furthermore, incorporating this into Equation (3) results in the proposed effective strain model in the form of Equation (7).
G f = 0.42 · f c 0.353 · ( b f n g ) 0.216 · b g 0.125 · h g 0.136
ε e f f ,   p r o p . = 0.917 · ( E f t f ) 0.5 · f c 0.176 · ( b f n g ) 0.108 · b g 0.0622 · h g 0.0681
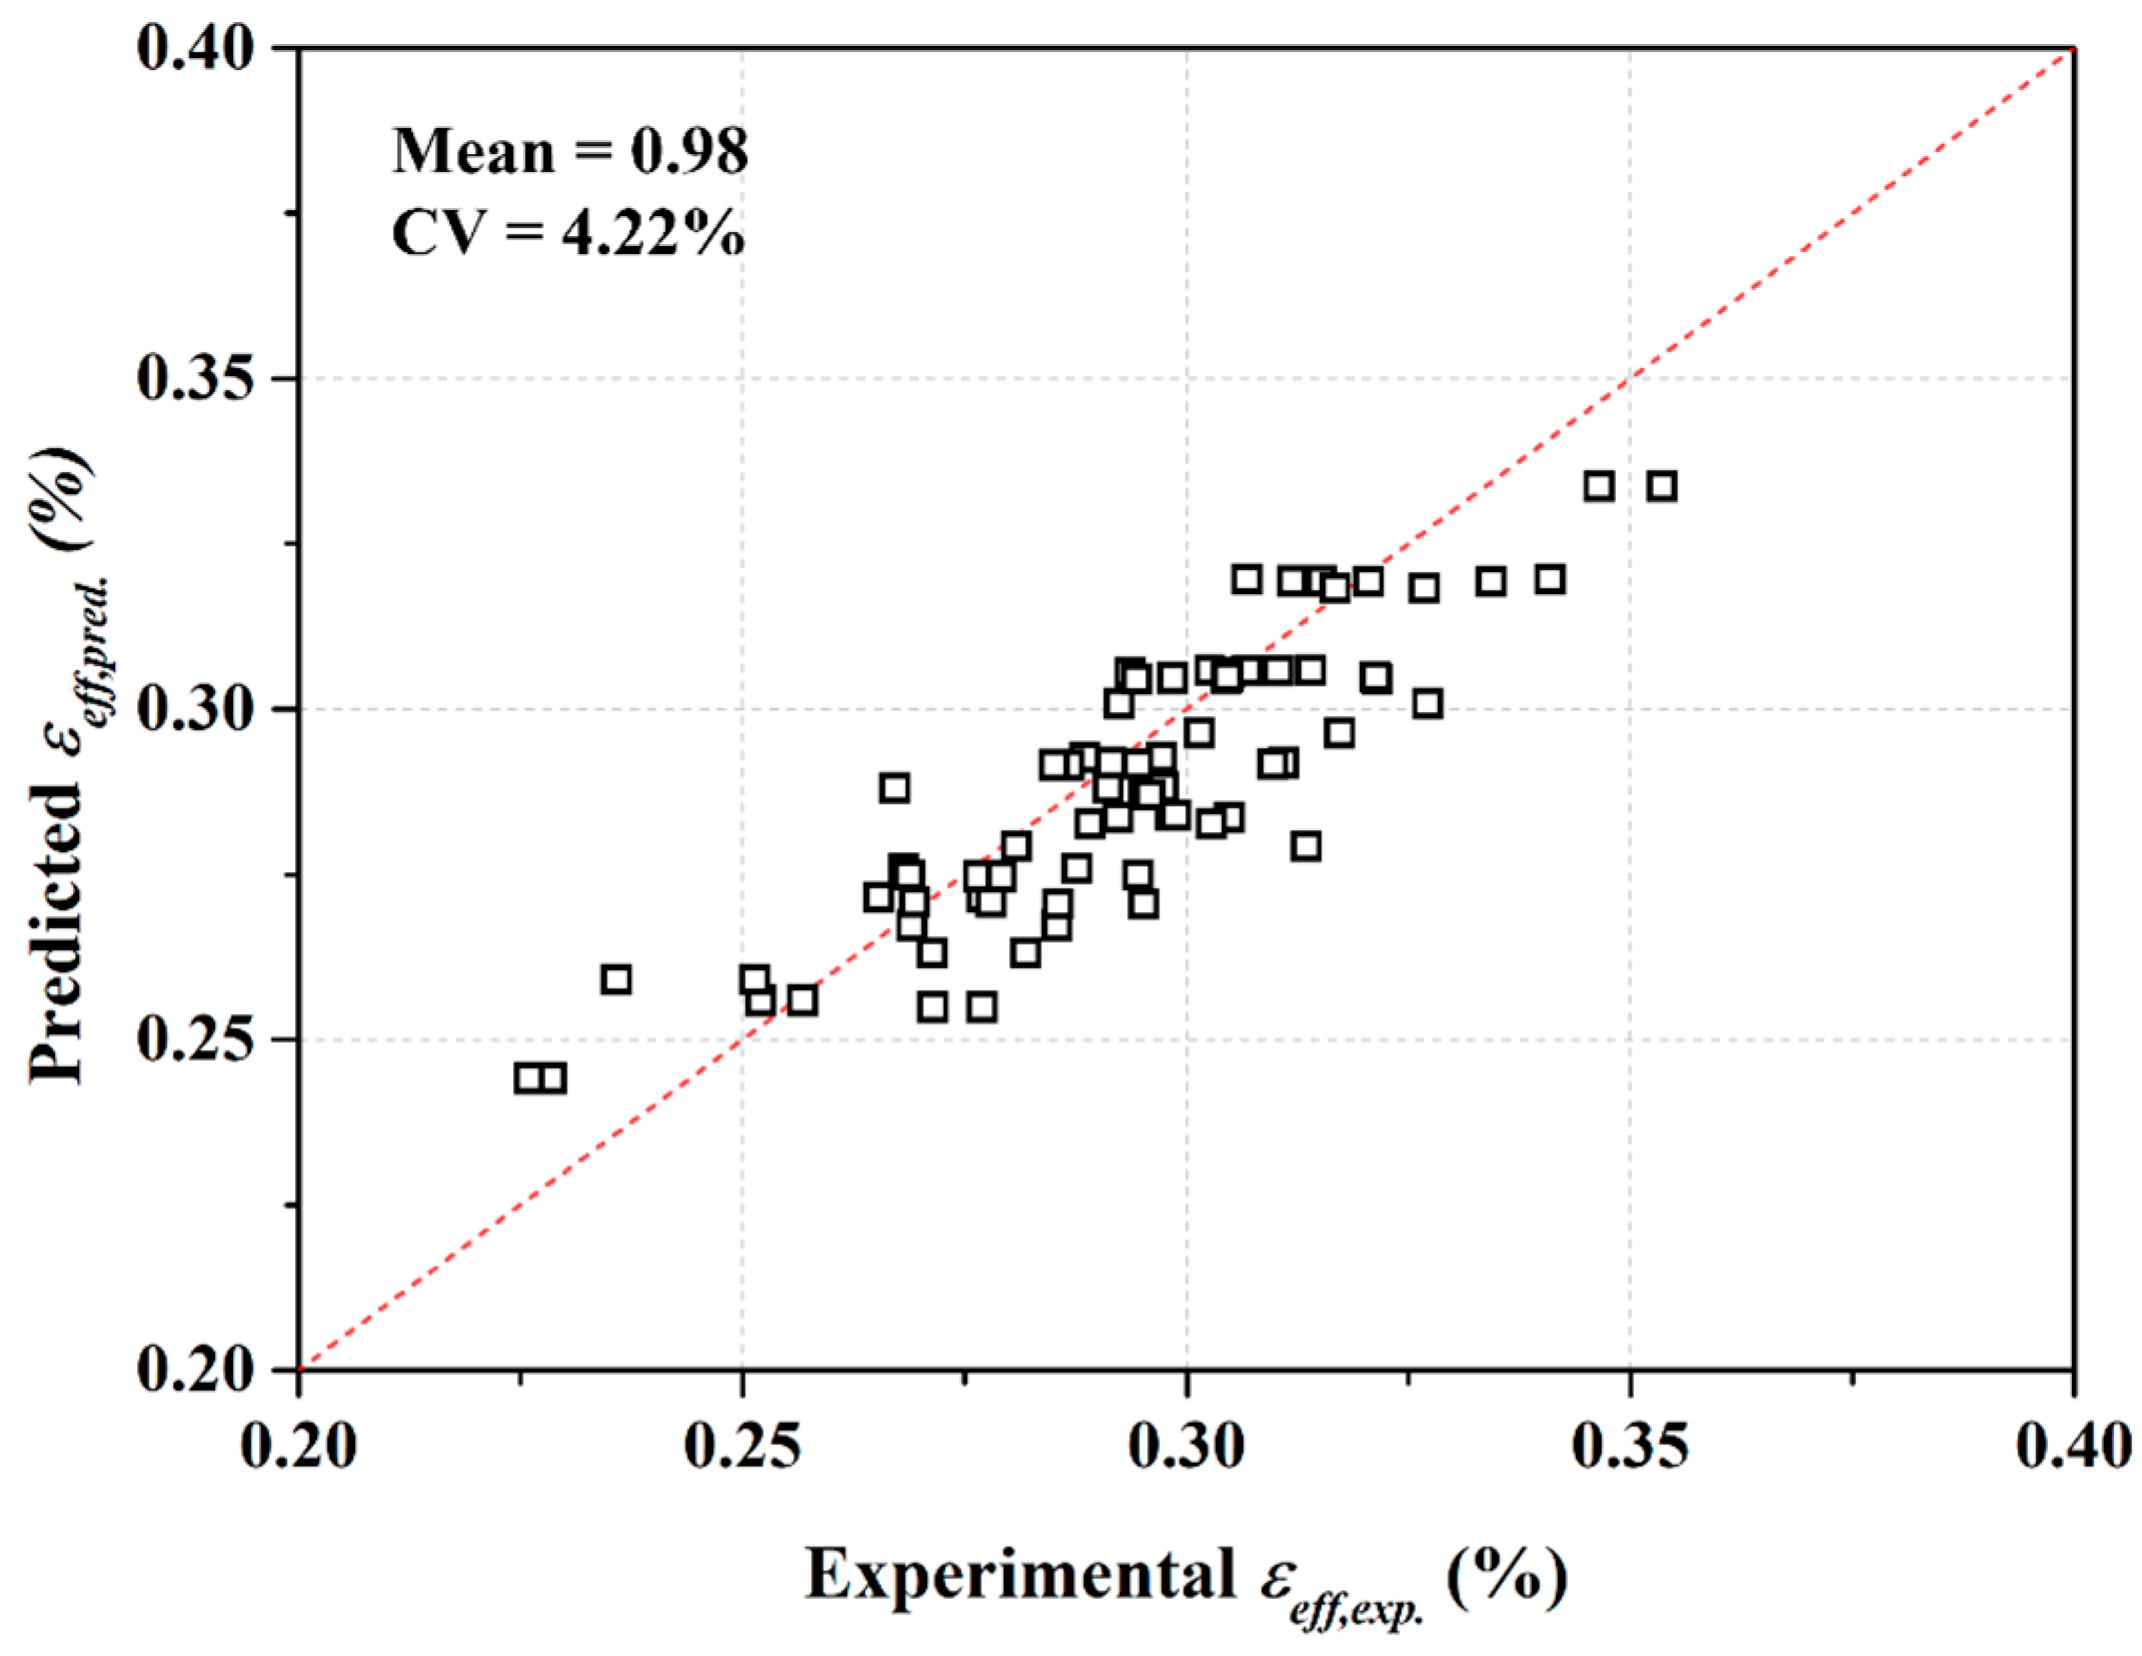
Figure 8 presents the predicted effective strain of CFRP plates strengthened using the EBROG method, based on the proposed model. The closer the predicted values are to the bisector of the coordinate axes, the smaller the deviation from the actual values, indicating higher prediction accuracy. The proposed model achieved a mean prediction ratio of 0.98 and a coefficient of variation (CV) of 4.22%, demonstrating high accuracy and low variability. These results indicate that the empirical model developed in this study can predict the effective strain of CFRP plates strengthened using the EBROG method with high precision. It should also be noted that the calibration database is limited to the experimental variables considered in this study. The calibration database was based on one CFRP plate type, one adhesive system, one bonded length, one CFRP plate width, concrete compressive strengths ranging from 22.35 to 46.85 MPa, groove widths and depths of 5 and 10 mm, and one-to-three grooves. Therefore, the proposed equation should be regarded as a preliminary empirical model applicable within the tested parameter range, rather than as a generalized design expression. Further validation using independent experimental datasets with different CFRP plate types, adhesive systems, bonded lengths, plate widths, groove configurations, concrete strengths, and member-scale test results is required before the model can be generalized for design applications. The bonded length was fixed at 250 mm in all single-lap shear specimens; therefore, the sensitivity of the proposed model to bonded length could not be independently evaluated. The adopted bonded length was selected to be longer than the effective bond length reported in previous EBROG bond studies; thus, the specimens were expected to develop sufficient bond resistance within the present test configuration. However, because bonded length was not varied in the calibration database, the proposed model does not explicitly account for length-dependent debonding behavior. Accordingly, the bond-length effect remains unverified and should be investigated in future studies using specimens with independently varied bonded lengths.
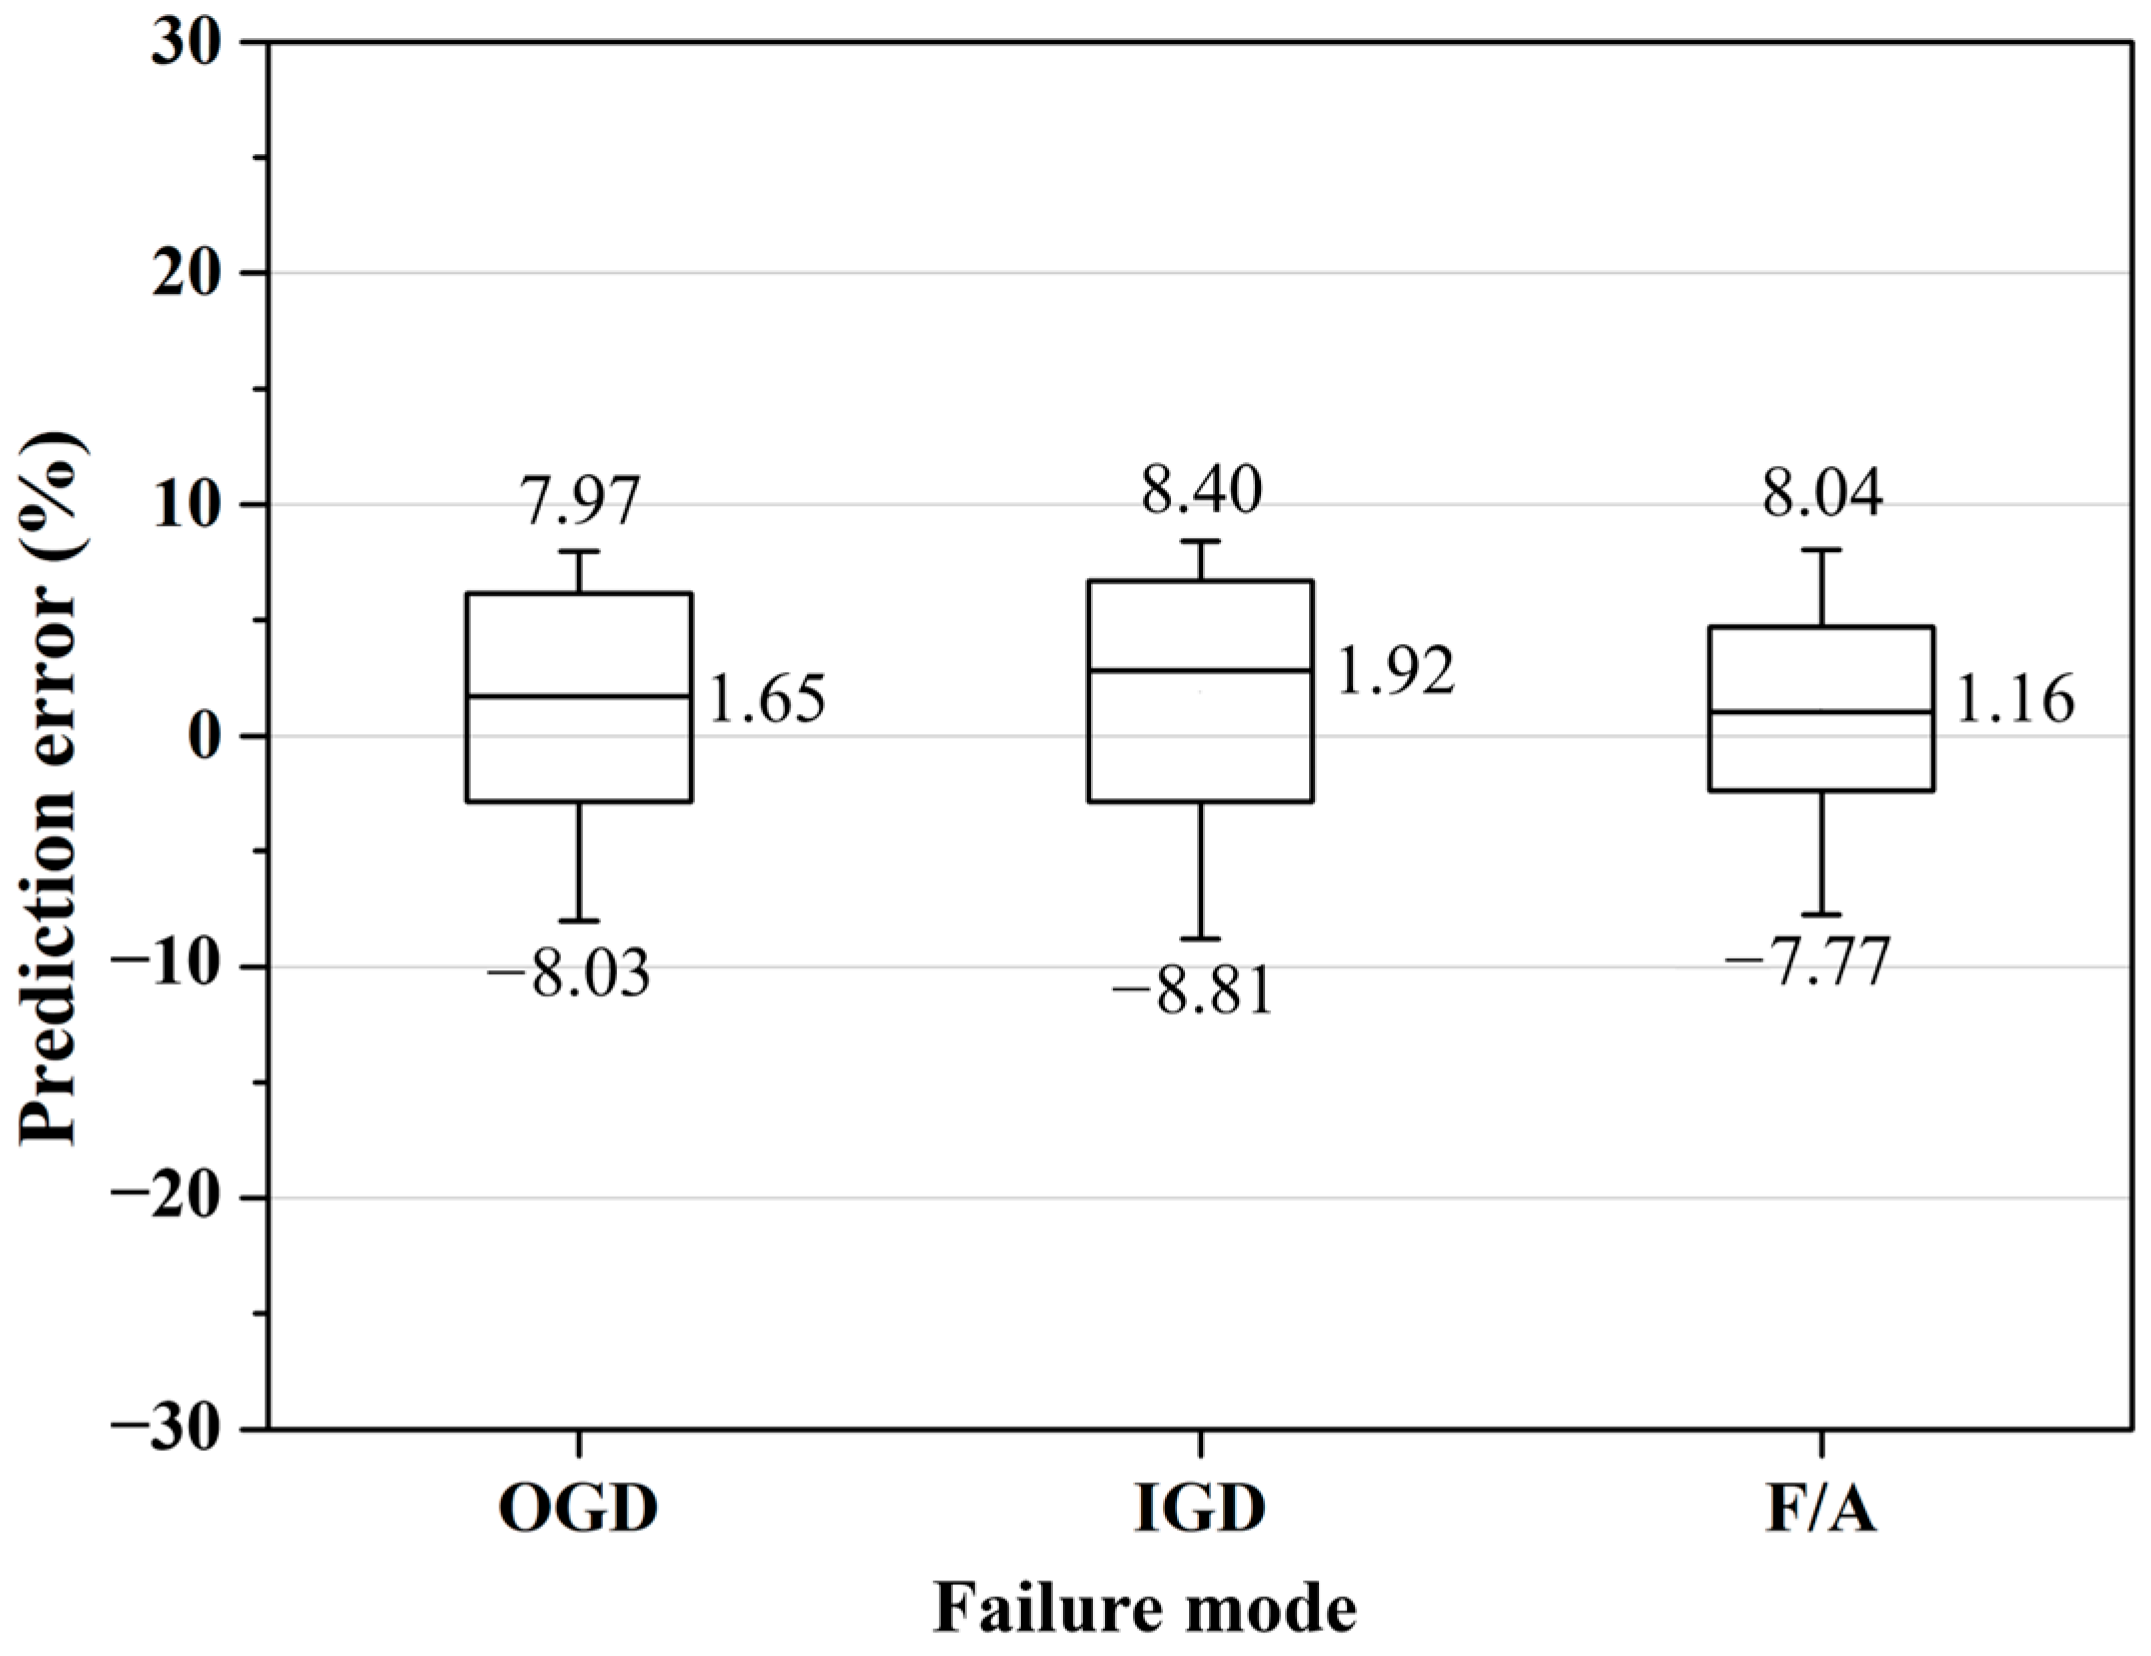
To examine whether the prediction accuracy of the proposed model depends on the failure mechanism, the prediction errors were grouped according to the observed failure modes, as shown in Figure 9. The mean prediction errors for the OGD, IGD, and F/A specimens were 1.65%, 1.92%, and 1.16%, respectively. The error ranges were −8.03% to 7.97%, −8.81% to 8.40%, and −7.77% to 8.04% for OGD, IGD, and F/A, respectively. These results indicate that no clear failure-mode-dependent bias was observed within the calibration dataset. Nevertheless, different failure modes may involve different local debonding mechanisms; therefore, additional experimental data are required to verify whether the proposed model maintains comparable prediction accuracy for each failure mechanism under broader material and geometric conditions.

4.2. Accuracy of Flexural Capacity Using the Proposed Model

In this study, the applicability of the proposed effective strain model was evaluated for predicting the flexural capacity of RC members strengthened with CFRP plates using the EBROG method. Generally, the flexural capacity of RC members strengthened with the EBROG method is governed by the effective strain at the onset of CFRP plate debonding, indicating that debonding is the dominant failure mechanism affecting structural performance. However, effective strain models based on single-lap shear tests do not account for RC member deformation, internal reinforcement behavior in concrete, or the effects of multiple flexural cracks induced by flexural loading. Consequently, discrepancies arise when predicting the effective strain of FRP in RC members [52]. In this study, following Teng et al. [52], a correction factor η was introduced to account for the difference in debonding conditions between single-lap shear tests and intermediate crack (IC) debonding in actual RC members. Specifically, η was derived from the coefficient α = 0.544 reported for IC debonding beams as η = 1 / α . Accordingly, the effective strain used in the section analysis of the strengthened RC members was defined as η ε e f f . Therefore, in this study, the proposed effective strain model was modified using the correction factor to predict the flexural capacity of RC members strengthened by the EBROG method. It should be noted that the correction factor α proposed by Teng et al. [52] was originally derived for EBR-strengthened RC members, not for EBROG-strengthened specimens. Therefore, this factor should not be interpreted as an EBROG-specific calibration parameter or as a direct representation of the mechanical interlocking effect provided by the grooves. In the present study, α was used as an empirical conversion factor to account for the difference between the effective strain obtained from single-lap shear bond tests and that developed in RC flexural members. The proposed effective-strain model was developed based on bond test results, whereas RC beams exhibit more complex member-level behavior, including flexural cracking, strain localization, interaction between internal steel reinforcement and externally bonded CFRP plates, curvature-dependent deformation, and member-level stress redistribution. Because an EBROG-specific correction factor based on a sufficiently large number of beam tests is not currently available, the factor proposed by Teng et al. [52] was adopted as a preliminary approximation to convert bond-level effective strain into member-level flexural response. The flexural capacity was calculated using the equivalent rectangular stress block concept presented in ACI 440.2R-17 [25], as shown in Equations (8) and (9).
M n = A s t E s t ε s t ( d β 1 c 2 ) + A s c E s c ε s c ( β 1 c 2 d c ) + A f E f ε f ( d f β 1 c 2 )
P n = 2 M n s
Here, A s t and A s c represent the cross-sectional areas of the tensile and compressive reinforcement, respectively, and E s t and E s c are the elastic moduli of the tensile and compressive reinforcement, respectively. ε s t , ε s c and ε f denote the strains of the tensile reinforcement, compressive reinforcement, and FRP plate, respectively, used in flexural strength calculations. d , d c and d f refer to the effective depths of the tensile reinforcement, compressive reinforcement, and FRP, respectively. Additionally, c indicates the neutral axis depth, and β 1 is the factor for the equivalent rectangular stress block defined in ACI 318-19 [53].
To date, as far as the authors are aware, no effective strain model has been proposed for predicting the flexural capacity of RC members strengthened with CFRP plates using the EBROG method. Therefore, this study compares the performance of the proposed EBROG-based effective strain model and existing models developed for the EBR method. The effective strain models for RC members strengthened using the EBR method, as reported in design codes and the previous literature, are summarized in Table 5. Among the existing design codes, ACI 440.2R-17 [25] and CNR-DT 200/R1 [54] provide effective strain models for predicting the flexural capacity of RC members strengthened with the EBR method, and the corresponding equations are listed in Table 5. Here, f c m and f c t m represent the mean compressive and mean tensile strengths of concrete, respectively. In addition, effective strain models proposed through experimental and numerical studies by Chen and Teng [55] and Lu et al. [56] were used. The model by Chen and Teng [55] is one of the most widely recognized models for estimating the effective strain of CFRP plate-to-concrete interfaces. In this model, β p and β l are coefficients related to the bonded width and bonded length of the FRP plate, b is the width of the RC member, and L and L e refer to the bonded length and effective bonded length, respectively. Lu et al. [56] proposed a model capable of predicting the effective strain of the FRP plate in regions locally affected by flexural cracks. Here, n f is the number of FRP layers, and L d and L e e represent the bonded length and the distance from the loaded section to the end of the cracked region, respectively. τ m a x is the maximum shear stress, β w is the width ratio coefficient of the FRP to the concrete, and f t denotes the tensile strength of the concrete.
To validate the applicability of the proposed model, experimental results from previous studies by Codina et al. [50] and Hong et al. [57] on RC members strengthened with CFRP plates using the EBROG method were collected. These studies evaluated the flexural behavior of CFRP-strengthened RC members employing the EBROG technique, and the experimental variables and material properties are summarized in Table 6.
To assess the appropriateness of the proposed model, a comparative analysis was conducted against several existing models, and the flexural capacity prediction results are presented in Table 6. The predictive performance of each model was evaluated using numerical indicators such as the mean, CV, and mean absolute error (MAE). The mean indicates the extent of underestimation or overestimation by each model, while the CV, defined as the ratio of the standard deviation to the mean, represents the degree of variation between the experimental and predicted results. MAE expresses the prediction error relative to the actual results as a percentage and serves as a key metric for assessing model accuracy. Each of these numerical indicators was calculated using Equations (10)–(12).
M e a n = 1 n i = 1 n F p r e d . i F e x p . i
C V = 1 M e a n 1 n i = 1 n ( F p r e d . i F e x p . i F p r e d . m e a n F e x p . m e a n ) 2
M A E = 1 n i = 1 n | F p r e d . i F e x p . i F e x p . i |
Here, n denotes the number of data points, while F p r e d . i and F e x p . i represent the predicted and experimental results, respectively. F p r e d . m e a n and F e x p . m e a n denote the means of the predicted and experimental results, respectively.
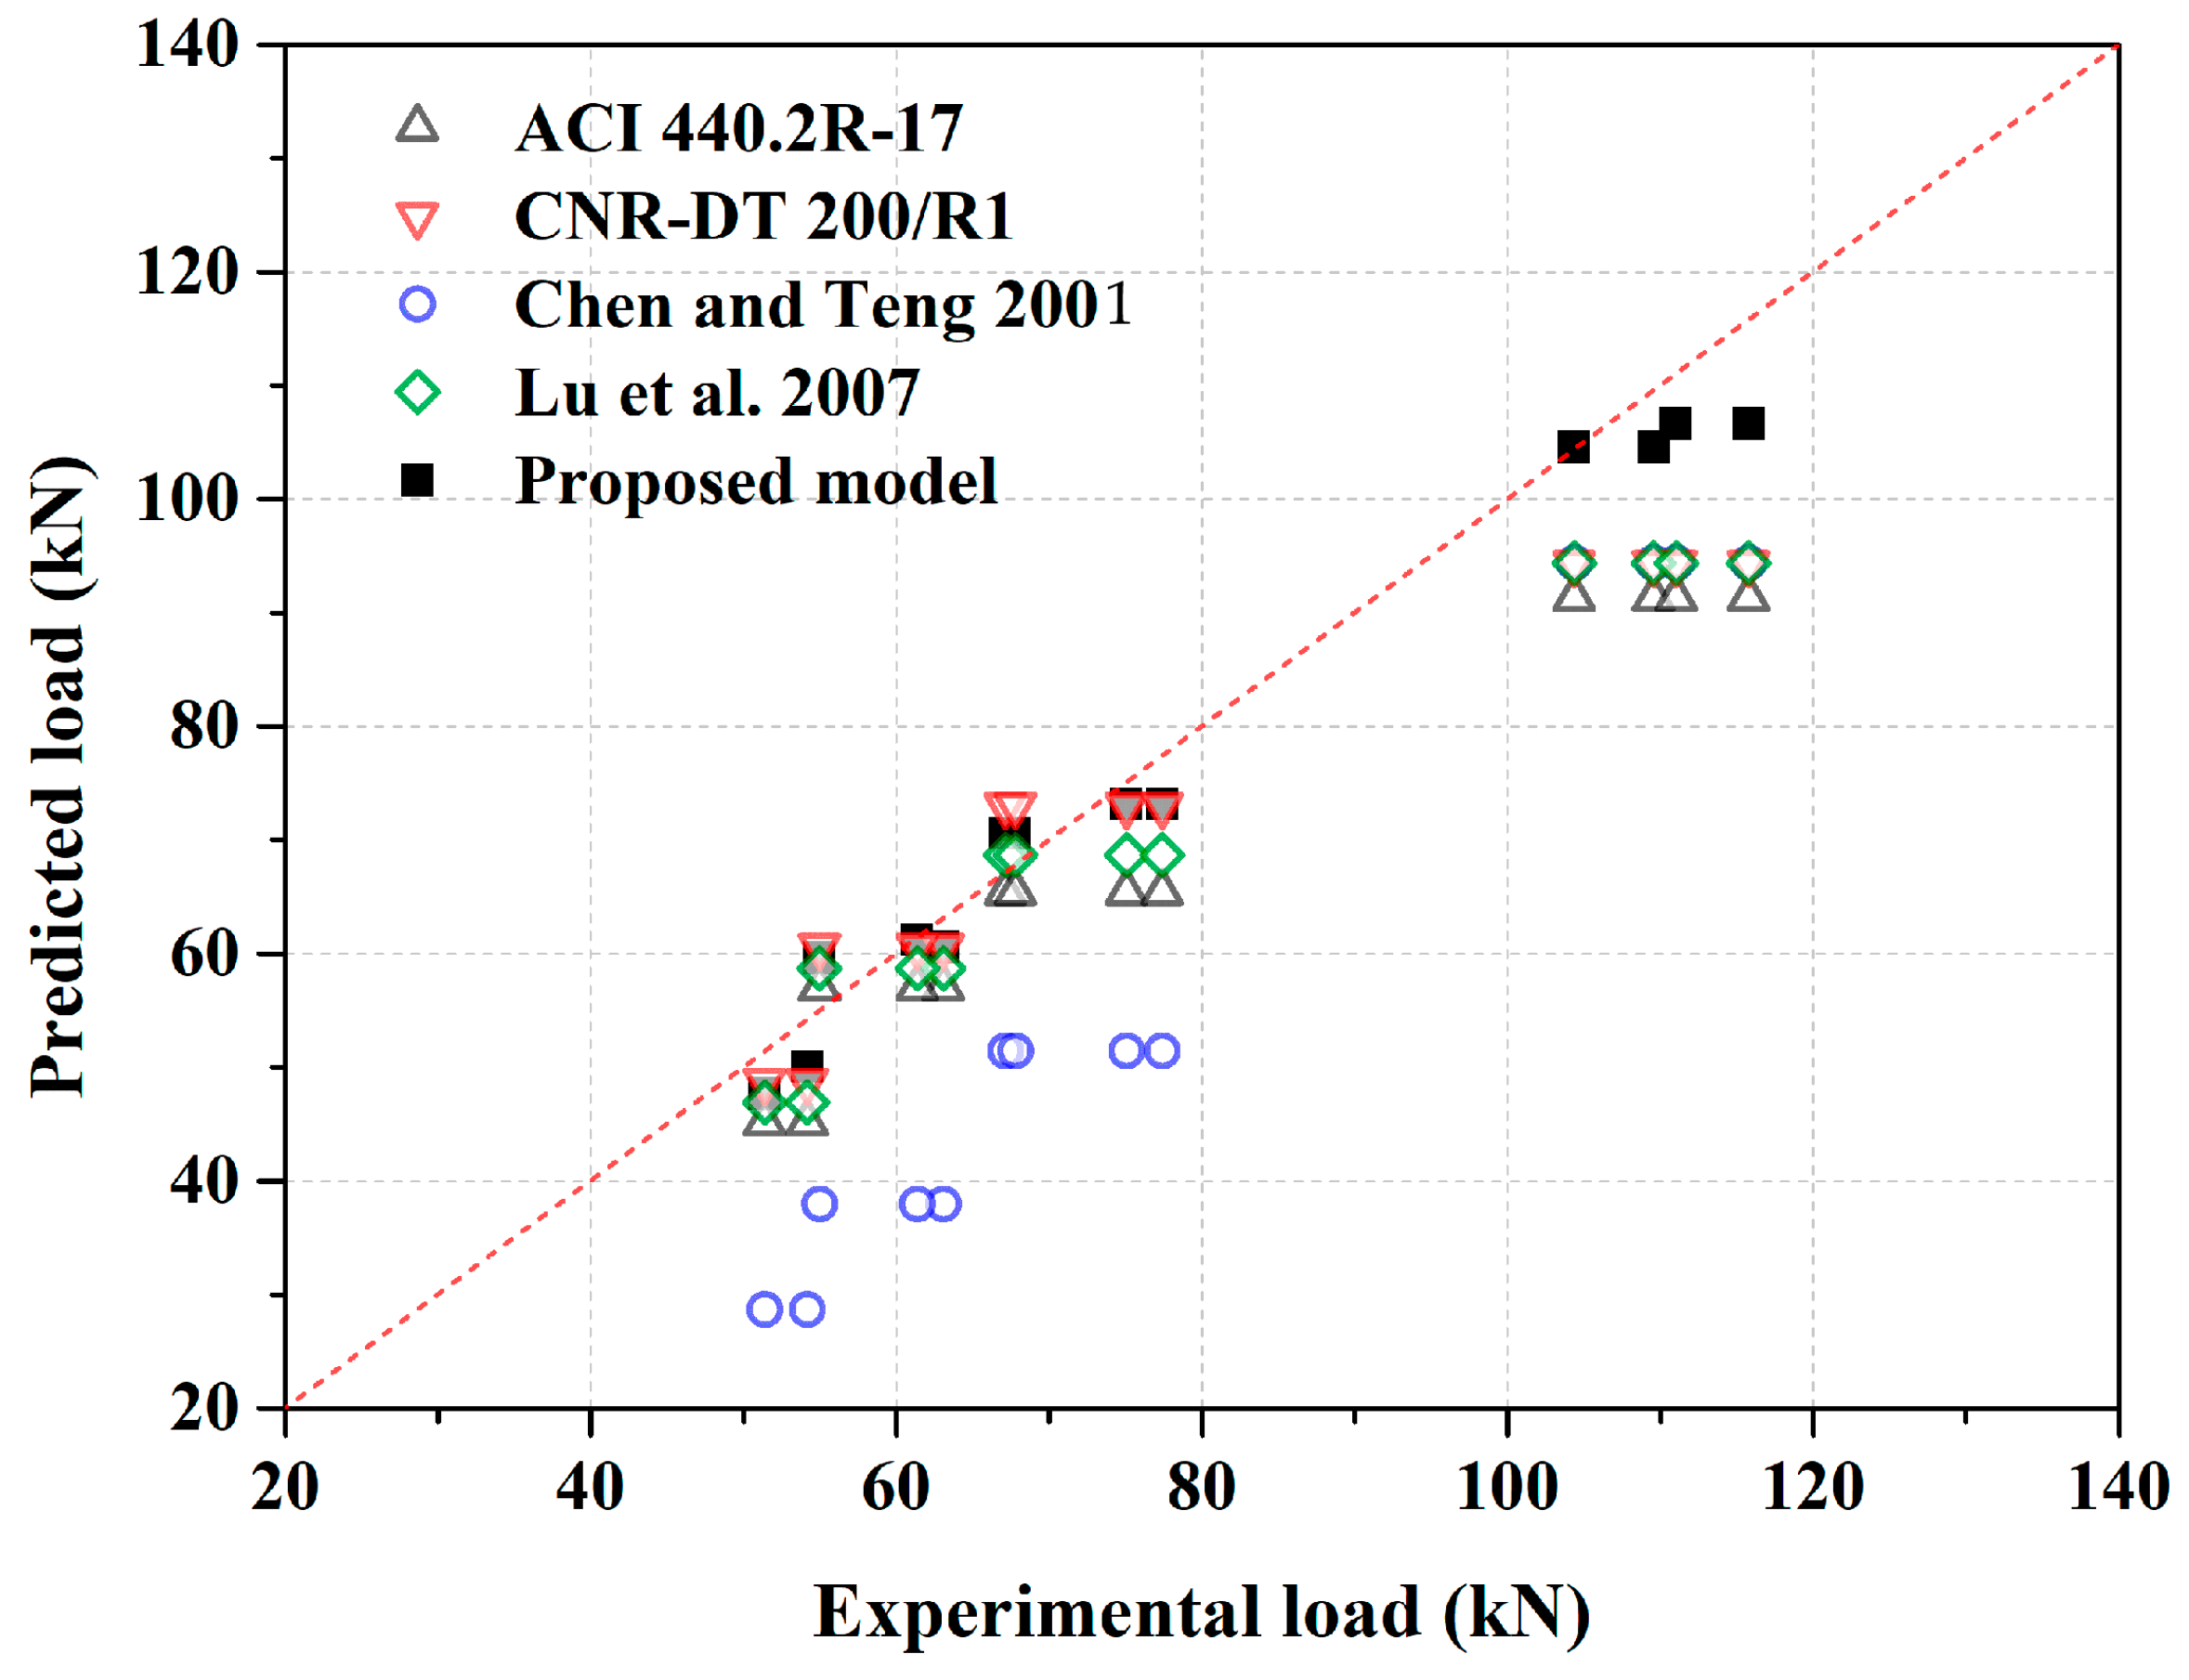
Figure 10 and Table 6 present a comparison between the flexural capacities predicted by the proposed model and those predicted by existing models against experimental results. Among the existing models, the coefficients of variation (CV) for ACI 440.2R-17 [25], CNR-DT 200/R1 [54], Chen and Teng [55], and Lu et al. [56] were 7.62%, 9.23%, 16.24%, and 7.73%, respectively, indicating relatively large dispersions. Overall, these models tended to underestimate the flexural capacity of RC members strengthened using the EBROG method. In particular, the prediction accuracy of the existing models deteriorated as the width of the CFRP plate or the number of grooves in the EBROG method increased. This is because these models do not account for the geometric characteristics of the grooves and the associated enhancement in bond performance.
In contrast, the proposed model exhibited excellent accuracy and low variability, with a mean value of 0.98, CV of 5.11%, and MAE of 4.73%. This improvement is attributed to the inclusion of parameters specific to the EBROG method, such as the number and dimensions of grooves, which are not considered in existing EBR-based models. The correction factor used for flexural strength prediction is greater than unity; therefore, its application may increase the predicted flexural strength. Specifically, η increases the bond-level effective strain obtained from the single-lap shear tests when it is converted into the effective strain used for member-level flexural strength calculations. This indicates that the use of correction factor is not inherently conservative and may result in potentially unconservative predictions if applied to EBROG-strengthened RC members outside the range of the available member-level data, because the flexural strength may be overestimated. However, within the limited RC beam database considered in this study, the proposed model showed a mean prediction ratio of 0.98, suggesting that it did not show a systematic overestimation of the flexural strength of the collected EBROG-strengthened specimens. Although the correction factor provides a practical means of relating the effective strain obtained from single-lap shear tests to the flexural response of RC members, the present approach should be regarded as a preliminary member-level evaluation rather than a comprehensive EBROG design model. In particular, member-level behavior can be influenced by multiple flexural cracks, crack spacing, reinforcement ratio, moment gradient, development length, curvature distribution, and the interaction between internal steel reinforcement and externally bonded CFRP plates. These parameters may affect CFRP strain localization, interfacial stress redistribution, and debonding propagation. Crack spacing can influence whether CFRP strain is distributed over multiple cracks or concentrated near a dominant crack. Reinforcement ratio and moment gradient can affect curvature distribution and CFRP strain development along the member, while development length may determine whether the CFRP plate can fully mobilize its bond capacity before debonding. It should be noted that the validation of the proposed model was performed using a limited number of RC beam test results available in the literature. Therefore, the flexural-capacity comparison presented in this study should be interpreted as a preliminary assessment using available literature data. Further member-scale experiments and analytical studies are needed to develop EBROG design formulations that explicitly account for these member-level parameters. Nevertheless, in the absence of established design guidelines for RC members strengthened with CFRP plates using the EBROG method, the proposed model provides a promising foundation for practical flexural capacity prediction.

5. Conclusions

In this study, the bond behavior between CFRP plates and concrete strengthened using the EBROG method was investigated through both experimental and analytical approaches. Single-lap shear tests were performed on specimens strengthened using the EBR and EBROG methods, and bond behavior was analyzed using a DIC system. Based on the experimental results, an effective strain model was proposed, and its applicability to RC members was evaluated. The conclusions drawn from this study are as follows.
  • While the EBR specimens exhibited debonding in concrete failure at the concrete surface, the EBROG specimens predominantly showed cohesive failure within the groove region or adhesive interface, rather than debonding in concrete failure. This indicates that the EBROG method provides a more suitable bonding interface between the CFRP plate and concrete.
  • Without requiring additional surface treatment, the EBROG method improved the bond strength by 49.56% to 154.48% compared to the EBR method. The enhancement in bond strength decreased with increasing concrete compressive strength, but increased with larger groove dimensions and a greater number of grooves.
  • The load–slip curve exhibited two-stage elastic and softening behavior in the EBR specimens, whereas the EBROG specimens exhibited an additional hardening stage after the softening phase. This hardening behavior suggests that, despite the reduction in stiffness toward failure, the confinement provided by the grooves enhanced the load carrying capacity.
  • The localized slip along the CFRP plate initiated near the loaded end and gradually decreased toward the free end. As the concrete compressive strength increased, the slip at the onset of debonding decreased. Moreover, larger groove dimensions delayed the initiation of debonding.
  • An effective strain model was proposed to estimate the effective strain of CFRP plates in EBROG-strengthened members. Although the proposed model showed reasonable agreement with the experimental results, its applicability is limited to the parameter range considered in this study, including concrete compressive strength, groove geometry, bonded length, adhesive system, and CFRP plate configuration. Therefore, the proposed equation should be regarded as a preliminary empirical model for EBROG-strengthened CFRP plates.
  • Future studies should further investigate broader groove configurations, different CFRP plate dimensions and adhesive systems, bond-length effects, fatigue and cyclic loading behavior, long-term durability, environmental exposure, and member-scale RC beam or slab tests. These efforts will provide a more comprehensive understanding of the stress-transfer mechanism and support the development of reliable design recommendations for CFRP plate reinforcement using the EBROG method.

Author Contributions

Conceptualization, K.H. and S.J.; methodology, S.J.; software, K.K. and C.J.; validation, S.J., and C.J.; investigation, S.J., K.K. and C.J.; resources, K.H.; data curation, S.J. and C.J.; writing—original draft preparation, K.H.; writing—review and editing, S.J.; visualization, K.H. and S.J.; supervision, C.J.; project administration, S.J.; funding acquisition, K.H. All authors have read and agreed to the published version of the manuscript.

Funding

This research was funded by the Chungbuk National University NUDP program (2024).

Institutional Review Board Statement

Not applicable.

Informed Consent Statement

Not applicable.

Data Availability Statement

The raw data supporting the conclusions of this article will be made available by the authors on request.

Acknowledgments

This work was supported by Chungbuk National University NUDP program (2024).

Conflicts of Interest

The authors declare no conflicts of interest.

References

  1. Teng, J.G.; Chen, J.F.; Smith, S.T.; Lam, L. Behaviour and strength of FRP-strengthened RC structures: A state-of-the-art review. Proc. Inst. Civ. Eng. Struct. Build. 2003, 156, 51–62. [Google Scholar] [CrossRef]
  2. Buyukozturk, O.; Gunes, O.; Karaca, E. Progress on understanding debonding problems in reinforced concrete and steel members strengthened using FRP composites. Constr. Build. Mater. 2004, 18, 9–19. [Google Scholar] [CrossRef]
  3. Thomsen, H.; Spacone, E.; Limkatanyu, S.; Camata, G. Failure mode analyses of reinforced concrete beams strengthened in flexure with externally bonded fiber-reinforced polymers. J. Compos. Constr. 2004, 8, 123–131. [Google Scholar] [CrossRef]
  4. Chalioris, C.E.; Thermou, G.E.; Pantazopoulou, S.J. Behaviour of rehabilitated RC beams with self-compacting concrete jacketing—Analytical model and test results. Constr. Build. Mater. 2014, 55, 257–273. [Google Scholar] [CrossRef]
  5. Baloch, W.L.; Siad, H.; Lachemi, M.; Sahmaran, M. A review on the durability of concrete-to-concrete bond in recent rehabilitated structures. J. Build. Eng. 2021, 44, 103315. [Google Scholar] [CrossRef]
  6. Haghani, R. Analysis of adhesive joints used to bond FRP laminates to steel members—A numerical and experimental study. Constr. Build. Mater. 2010, 24, 2243–2251. [Google Scholar] [CrossRef]
  7. Mostofinejad, D.; Arefian, B. Generic assessment of effective bond length of FRP-concrete joint based on the initiation of debonding: Experimental and analytical investigation. Compos. Struct. 2021, 277, 114625. [Google Scholar] [CrossRef]
  8. Ceroni, F.; Ianniciello, M.; Pecce, M. Bond behavior of FRP carbon plates externally bonded over steel and concrete elements: Experimental outcomes and numerical investigations. Compos. Part B Eng. 2016, 92, 434–446. [Google Scholar] [CrossRef]
  9. Chen, C.; Cheng, L. Predicting flexural fatigue performance of RC beams strengthened with externally bonded FRP due to FRP debonding. J. Bridge Eng. 2017, 22, 04017082. [Google Scholar] [CrossRef]
  10. Leung, C.K.; Ng, M.Y.; Luk, H.C. Empirical approach for determining ultimate FRP strain in FRP-strengthened concrete beams. J. Compos. Constr. 2006, 10, 125–138. [Google Scholar] [CrossRef]
  11. Fico, R.; Prota, A.; Manfredi, G. Assessment of Eurocode-like design equations for the shear capacity of FRP RC members. Compos. Part B Eng. 2008, 39, 792–806. [Google Scholar] [CrossRef]
  12. Lee, J.Y.; Hwang, H.B.; Doh, J.H. Effective strain of RC beams strengthened in shear with FRP. Compos. Part B Eng. 2012, 43, 754–765. [Google Scholar] [CrossRef]
  13. Turco, A.; Bocciarelli, M.; Nanni, A.; Poggi, C. Influence of width and thickness of composite laminates on the flexural behavior of reinforced concrete beams and slabs. Compos. Struct. 2017, 178, 186–194. [Google Scholar] [CrossRef]
  14. Toutanji, H.; Ortiz, G. The effect of surface preparation on the bond interface between FRP sheets and concrete members. Compos. Struct. 2001, 53, 457–462. [Google Scholar] [CrossRef]
  15. Mohammadi, M.; Mostofinejad, D.; Barghian, M. Effects of surface preparation method on FRP-concrete bond strength under alkaline conditions. J. Compos. Constr. 2017, 21, 04017010. [Google Scholar] [CrossRef]
  16. Chen, C.; Li, X.; Zhao, D.; Huang, Z.; Sui, L.; Xing, F.; Zhou, Y. Mechanism of surface preparation on FRP-concrete bond performance: A quantitative study. Compos. Part B Eng. 2019, 163, 193–206. [Google Scholar] [CrossRef]
  17. Matthys, S.; Triantafillou, T. Shear and torsion strengthening with externally bonded FRP reinforcement. In Proceedings of the International Workshop on Composites in Construction: A Reality, Capri, Italy, 20–21 July 2001; American Society of Civil Engineers: Reston, VA, USA, 2002; pp. 203–212. [Google Scholar]
  18. Monti, G.; D’Antino, T.; Lignola, G.P.; Pellegrino, C.; Petrone, F. Shear strengthening of RC elements by means of EBR FRP systems. In Design Procedures for the Use of Composites in Strengthening of Reinforced Concrete Structures: State-of-the-Art Report of the RILEM Technical Committee 234-DUC; Pellegrino, C., Sena-Cruz, J., Eds.; Springer: Dordrecht, The Netherlands, 2016; Volume 19, pp. 97–130. [Google Scholar]
  19. Shin, J.; Scott, D.W.; Stewart, L.K.; Yang, C.S.; Wright, T.R.; DesRoches, R. Dynamic response of a full-scale reinforced concrete building frame retrofitted with FRP column jackets. Eng. Struct. 2016, 125, 244–253. [Google Scholar] [CrossRef]
  20. Oller, E.; Pujol, M.; Marí, A. Contribution of externally bonded FRP shear reinforcement to the shear strength of RC beams. Compos. Part B Eng. 2019, 164, 235–248. [Google Scholar] [CrossRef]
  21. Feng, P.; Li, Z.; Wang, J.; Liu, T. Novel joint for pultruded FRP beams and concrete-filled FRP columns: Conceptual and experimental investigations. Compos. Struct. 2022, 287, 115339. [Google Scholar] [CrossRef]
  22. Liao, J.; Zeng, J.J.; Zhuge, Y.; Zheng, Y.; Ma, G.; Zhang, L. FRP-confined concrete columns with a stress reduction-recovery behavior: A state-of-the-art review, design recommendations and model assessments. Compos. Struct. 2023, 321, 117313. [Google Scholar] [CrossRef]
  23. Wu, Z.M.; Hu, C.H.; Wu, Y.F.; Zheng, J.J. Application of improved hybrid bonded FRP technique to FRP debonding prevention. Constr. Build. Mater. 2011, 25, 2898–2905. [Google Scholar] [CrossRef]
  24. Biscaia, H.C.; Micaelo, R.; Teixeira, J.; Chastre, C. Delamination process analysis of FRP-to-parent material bonded joints with and without anchorage systems using the distinct element method. Compos. Struct. 2014, 116, 104–119. [Google Scholar] [CrossRef]
  25. ACI 440.2R-17; Guide for the Design and Construction of Externally Bonded FRP Systems for Strengthening Concrete Structures. American Concrete Institute: Farmington Hills, MI, USA, 2017.
  26. HB 305-2008; Design Handbook for RC Structures Retrofitted with FRP and Metal Plates: Beams and Slabs. Standards Australia: Sydney, NSW, Australia, 2008.
  27. Fédération Internationale du Béton (fib). Externally Bonded FRP Reinforcement for RC Structures; Bulletin 14; fib: Lausanne, Switzerland, 2001. [Google Scholar]
  28. De Lorenzis, L.; Teng, J.G. Near-surface mounted FRP reinforcement: An emerging technique for strengthening structures. Compos. Part B Eng. 2007, 38, 119–143. [Google Scholar] [CrossRef]
  29. Rizzo, A.; De Lorenzis, L. Behavior and capacity of RC beams strengthened in shear with NSM FRP reinforcement. Constr. Build. Mater. 2009, 23, 1555–1567. [Google Scholar] [CrossRef]
  30. Mansouri, S.; Morshed, R.; Mostofinejad, D. Using NSM pre-stressed rebars for flexural strengthening of RC beams subjected to constant loading. Structures 2022, 43, 1478–1491. [Google Scholar] [CrossRef]
  31. Megahed, F.A.; Seleem, M.H.; Badawy, A.A.M.; Sharaky, I.A. The flexural response of RC beams strengthened by EB/NSM techniques using FRP and metal materials: A state-of-the-art review. Innov. Infrastruct. Solut. 2023, 8, 289. [Google Scholar] [CrossRef]
  32. Mostofinejad, D.; Mahmoudabadi, E. Grooving as alternative method of surface preparation to postpone debonding of FRP laminates in concrete beams. J. Compos. Constr. 2010, 14, 804–811. [Google Scholar] [CrossRef]
  33. Mostofinejad, D.; Akhlaghi, A. Experimental investigation of the efficacy of EBROG method in seismic rehabilitation of deficient reinforced concrete beam–column joints using CFRP sheets. J. Compos. Constr. 2017, 21, 04016116. [Google Scholar] [CrossRef]
  34. Moshiri, N.; Czaderski, C.; Mostofinejad, D.; Hosseini, A.; Sanginabadi, K.; Breveglieri, M.; Motavalli, M. Flexural strengthening of RC slabs with nonprestressed and prestressed CFRP strips using EBROG method. Compos. Part B Eng. 2020, 201, 108359. [Google Scholar] [CrossRef]
  35. Shabani, E.; Mostofinejad, D.; Saljoughian, A. Bond behavior of prestressed FRP sheet-concrete joints: Comparison of EBROG and EBR methods. Constr. Build. Mater. 2023, 400, 132752. [Google Scholar] [CrossRef]
  36. Cetin, K.; Altiok, T.Y.; Demir, A. Experimental investigation of EBROG and bore-epoxy anchorage methods used for interior RC beam-column joints strengthened with CFRP sheets. Structures 2024, 66, 106874. [Google Scholar] [CrossRef]
  37. Nagheh, E.; Mostofinejad, D.; Saljoughian, A. Shear strengthening of RC arches with FRP composites using EBR and EBROG methods: Experimental and theoretical study. Constr. Build. Mater. 2024, 427, 136212. [Google Scholar] [CrossRef]
  38. Heydari, P.; Mostofinejad, D.; Eftekhar, M.R.; Saljoughian, A. Seismic flexural rehabilitation of RC coupling beams with FRP sheets: Evaluation of EBROG technique. Structures 2024, 68, 107076. [Google Scholar] [CrossRef]
  39. Zamani, R.; Talaeitaba, S.B.; Mostofinejad, D. Strengthening of two-way RC flat slabs for punching shear using steel dowels and CFRP sheet with EBROG and EBRIG methods: An experimental study. Iran. J. Sci. Technol. Trans. Civ. Eng. 2026, 50, 123–140. [Google Scholar]
  40. Sabzi, J.; Esfahani, M.R.; Ozbakkaloglu, T.; Farahi, B. Effect of concrete strength and longitudinal reinforcement arrangement on the performance of reinforced concrete beams strengthened using EBR and EBROG methods. Eng. Struct. 2020, 205, 110072. [Google Scholar] [CrossRef]
  41. Mostofinejad, D.; Kashani, A.T. Experimental study on effect of EBR and EBROG methods on debonding of FRP sheets used for shear strengthening of RC beams. Compos. Part B Eng. 2013, 45, 1704–1713. [Google Scholar] [CrossRef]
  42. Hosseini, A.; Mostofinejad, D. Effect of groove characteristics on CFRP-to-concrete bond behavior of EBROG joints: Experimental study using particle image velocimetry (PIV). Constr. Build. Mater. 2013, 49, 364–373. [Google Scholar] [CrossRef]
  43. Moghaddas, A.; Mostofinejad, D. Empirical FRP-concrete bond strength model for externally bonded reinforcement on grooves. J. Compos. Constr. 2019, 23, 04018080. [Google Scholar] [CrossRef]
  44. Moghaddas, A.; Mostofinejad, D.; Ilia, E. Empirical FRP-concrete effective bond length model for externally bonded reinforcement on the grooves. Compos. Part B Eng. 2019, 172, 323–338. [Google Scholar] [CrossRef]
  45. Feldfogel, S.; Rabinovitch, O. Full scale analysis of FRP strengthened plates with irregular layouts. Int. J. Mech. Sci. 2016, 113, 239–259. [Google Scholar] [CrossRef]
  46. Zamani Ghaleh, R.; Mostofinejad, D. Empirical expression for failure strain in EBROG-bonded FRP–concrete joints. J. Compos. Constr. 2022, 26, 04022036. [Google Scholar] [CrossRef]
  47. Mazzotti, C.; Savoia, M.; Ferracuti, B. An experimental study on delamination of FRP plates bonded to concrete. Constr. Build. Mater. 2008, 22, 1409–1421. [Google Scholar] [CrossRef]
  48. Moshiri, N.; Tajmir-Riahi, A.; Mostofinejad, D.; Czaderski, C.; Motavalli, M. Experimental and analytical study on CFRP strips-to-concrete bonded joints using EBROG method. Compos. Part B Eng. 2019, 158, 437–447. [Google Scholar] [CrossRef]
  49. ASTM C39/C39M-17; Standard Test Method for Compressive Strength of Cylindrical Concrete Specimens. ASTM International: West Conshohocken, PA, USA, 2017.
  50. Codina, A.; Barris, C.; Jahani, Y.; Baena, M.; Torres, L. Experimental and theoretical study on the flexural behaviour of RC beams strengthened with externally bonded reinforcement on grooves CFRP laminates. Eng. Struct. 2024, 299, 117091. [Google Scholar] [CrossRef]
  51. Yuan, H.; Teng, J.G.; Seracino, R.; Wu, Z.S.; Yao, J. Full-range behavior of FRP-to-concrete bonded joints. Eng. Struct. 2004, 26, 553–565. [Google Scholar] [CrossRef]
  52. Teng, J.G.; Smith, S.T.; Yao, J.; Chen, J.F. Intermediate crack-induced debonding in RC beams and slabs. Constr. Build. Mater. 2003, 17, 447–462. [Google Scholar] [CrossRef]
  53. ACI 318-19; Building Code Requirements for Structural Concrete and Commentary. American Concrete Institute: Farmington Hills, MI, USA, 2019.
  54. CNR-DT 200 R1/2013; Guide for the Design and Construction of Externally Bonded FRP Systems for Strengthening Existing Structures—Materials, RC and PC Structures, Masonry Structures. Consiglio Nazionale delle Ricerche: Rome, Italy, 2014.
  55. Chen, J.F.; Teng, J.G. Anchorage strength models for FRP and steel plates bonded to concrete. J. Struct. Eng. 2001, 127, 784–791. [Google Scholar] [CrossRef]
  56. Lu, X.Z.; Teng, J.G.; Ye, L.P.; Jiang, J.J. Intermediate crack debonding in FRP-strengthened RC beams: FE analysis and strength model. J. Compos. Constr. 2007, 11, 161–174. [Google Scholar] [CrossRef]
  57. Hong, K.N.; Ji, S.W.; Son, D.G. Experimental study to evaluate the flexural behavior of RC slabs strengthened with CFRP plates using the EBROG method. Constr. Build. Mater. 2025, 483, 141732. [Google Scholar] [CrossRef]
Figure 1. Dimensions and loading arrangement of the specimen. (a) Specimen dimensions; (b) loading arrangement.
Applsci 16 07125 g001
Figure 2. Cross-section of the specimens (unit: mm). (a) E-25; (b) G-25-1-5-10; (c) G-25-2-10-10; (d) G-25-3-10-10.
Applsci 16 07125 g002
Figure 3. Test setup and instrumentation for single-lap shear test. (a) Steel gripping fixture; (b) specimen installed in the fixture; (c) specimens installed in the UTM; (d) test setup with the DIC system.
Applsci 16 07125 g003aApplsci 16 07125 g003b
Figure 4. Failure modes of the specimens. (a) E-25-2; (b) G-25-1-10-5-2; (c) G-35-1-5-10-2; (d) G-45-1-5-5-2; (e) G-25-2-5-5-1; (f) G-35-2-5-5-2; (g) G-35-3-10-10-2; (h) G-45-3-5-10-2.
Applsci 16 07125 g004aApplsci 16 07125 g004b
Figure 5. Average increase rate in bond strength of EBROG specimens compared to EBR for variables. (a) Concrete compressive strengths; (b) groove dimensions; (c) number of grooves.
Applsci 16 07125 g005
Figure 6. Load–slip curves. (a) EBR; (b) Concrete compressive strength; (c) groove dimension; (d) number of grooves.
Applsci 16 07125 g006
Figure 7. Slip distributions along x-coordinate. (a) G-35-1-5-10-2; (b) 25 MPa; (c) 35 MPa; (d) 45 MPa.
Applsci 16 07125 g007
Figure 8. Comparison of predicted and experimental effective strains.
Applsci 16 07125 g008
Figure 9. Prediction error of the proposed effective strain model according to failure modes.
Applsci 16 07125 g009
Figure 10. Comparison of predicted by the proposed model and existing design model [25,54,55,56].
Applsci 16 07125 g010
Table 1. Concrete mix design.
Design Strength
(MPa)
Slump
(mm)
Air Content
(%)
W/B
(%)
S/a
(%)
C
(kg/m3)
FA
(kg/m3)
CA
(kg/m3)
Admixture
(kg/m3)
251801.260.047.4221800.0924.31.5
351752.048.045.0287743.3942.71.9
451002.038.047.1361844.0984.26.0
Note: W/B = water-to-binder ratio; S/a = sand-to-aggregate ratio; C = cement; FA = fine aggregate; CA = coarse aggregate.
Table 2. Material properties of CFRP plate and epoxy resin.
MaterialElastic
Modulus
(GPa)
Tensile
Strength
(MPa)
Compressive
Strength
(MPa)
Elongation
(%)
CFRP plate1763510-1.99
Epoxy resin4.6538.5113-
Table 3. Specification of specimens and test results.
Specimen f c
(MPa)
n g b g
(mm)
h g
(mm)
P u
(kN)
P u , a v g .
(kN)
SDCV
(%)
Increase
in P u , a v g .
(%)
Failure
Mode
E-25-122.35---21.41 24.00 2.59 10.79 DC
E-25-224.76---26.59 DC
E-35-132.37---29.54 29.83 0.29 0.96 DC
E-35-235.82---30.11 DC
E-45-143.21---37.52 36.08 1.45 4.01 DC
E-45-244.37---34.63 DC
G-25-1-5-5 -126.6715545.05 44.80 0.25 0.56 86.67 OGD
G-25-1-5-5 -224.3415544.55 OGD
G-25-1-5-10 -122.35151049.69 50.15 0.46 0.92 108.96 OGD
G-25-1-5-10 -223.21151050.61 OGD
G-25-1-10-5 -126.67110553.52 54.06 0.54 1.00 125.25 OGD
G-25-1-10-5 -224.34110554.60 OGD
G-25-1-10-10-122.351101053.04 54.66 1.62 2.95 127.73 OGD
G-25-1-10-10-223.211101056.27 OGD
G-35-1-5-5 -132.3715549.56 48.03 1.53 3.19 61.04 IGD
G-35-1-5-5 -234.7115546.50 IGD
G-35-1-5-10 -133.32151052.31 53.46 1.15 2.14 79.23 OGD
G-35-1-5-10 -234.71151054.60 OGD
G-35-1-10-5 -132.37110556.29 57.25 0.96 1.67 91.94 IGD
G-35-1-10-5 -237.35110558.20 IGD
G-35-1-10-10-133.321101060.10 58.86 1.24 2.11 97.35 OGD
G-35-1-10-10-237.351101057.62 OGD
G-45-1-5-5 -142.115553.11 53.96 0.84 1.57 49.56 IGD
G-45-1-5-5 -245.6415554.80 IGD
G-45-1-5-10 -142.1151058.78 58.85 0.06 0.11 63.12 IGD
G-45-1-5-10 -245.64151058.91 IGD
G-45-1-10-5 -143.21110557.00 58.35 1.35 2.31 61.75 OGD
G-45-1-10-5 -246.85110559.70 OGD
G-45-1-10-10-143.211101059.43 60.99 1.56 2.56 69.04 OGD
G-45-1-10-10-246.851101062.55 IGD
G-25-2-5-5-126.6725555.57 54.54 1.04 1.90 127.23 IGD
G-25-2-5-5-225.9925553.50 IGD
G-25-2-5-10-122.35251052.87 54.79 1.92 3.50 128.29 F/A
G-25-2-5-10-225.99251056.71 F/A
G-25-2-10-5-126.67210554.52 54.78 0.25 0.47 128.23 F/A
G-25-2-10-5-224.73210555.03 F/A
G-25-2-10-10-122.352101052.68 55.04 2.36 4.29 129.33 F/A
G-25-2-10-10-224.732101057.40 F/A
G-35-2-5-5-132.3725561.82 58.60 3.23 5.50 96.46 IGD
G-35-2-5-5-234.6625555.37 IGD
G-35-2-5-10-132.37251058.60 57.74 0.86 1.49 93.60 OGD
G-35-2-5-10-234.66251056.88 OGD
G-35-2-10-5-136.34210556.53 56.37 0.16 0.28 89.00IGD
G-35-2-10-5-236.10210556.21 IGD
G-35-2-10-10-136.342101060.10 59.00 1.11 1.87 97.80 F/A
G-35-2-10-10-236.102101057.89 F/A
G-45-2-5-5-142.125557.47 59.39 1.92 3.23 64.63 OGD
G-45-2-5-5-246.8225561.31 OGD
G-45-2-5-10-143.21251059.66 60.79 1.13 1.86 68.51 F/A
G-45-2-5-10-246.82251061.92 F/A
G-45-2-10-5-143.21210558.84 59.43 0.59 0.99 64.74 F/A
G-45-2-10-5-245.96210560.02 F/A
G-45-2-10-10-142.12101061.50 61.83 0.32 0.53 71.37 F/A
G-45-2-10-10-245.962101062.15 F/A
G-25-3-5-5-126.6735558.06 55.53 2.54 4.57 131.35 F/A
G-25-3-5-5-225.4735552.99 F/A
G-25-3-5-10-126.67351058.57 58.60 0.02 0.04 144.15 F/A
G-25-3-5-10-225.47351058.62 F/A
G-25-3-10-5-122.35310558.20 58.27 0.06 0.11 142.77 F/A
G-25-3-10-5-223.49310558.33 F/A
G-25-3-10-10-122.353101064.50 61.08 3.43 5.61 154.48 F/A
G-25-3-10-10-223.493101057.65 F/A
G-35-3-5-5-132.3735558.06 59.57 1.51 2.53 99.73 F/A
G-35-3-5-5-234.1335561.08 F/A
G-35-3-5-10-132.37351060.49 60.84 0.34 0.57 103.97 F/A
G-35-3-5-10-234.13351061.18 F/A
G-35-3-10-5-136.34310558.03 60.71 2.68 4.41 103.54 F/A
G-35-3-10-5-237.88310563.38 F/A
G-35-3-10-10-136.343101063.20 64.56 1.36 2.11 116.46 F/A
G-35-3-10-10-237.883101065.92 F/A
G-45-3-5-5-143.2135560.06 61.71 1.65 2.67 71.05 F/A
G-45-3-5-5-244.7635563.35 F/A
G-45-3-5-10-143.21351060.50 63.86 3.36 5.26 77.02 F/A
G-45-3-5-10-244.76351067.22 F/A
G-45-3-10-5-142.10310564.43 63.45 0.99 1.55 75.87 F/A
G-45-3-10-5-246.35310562.46 F/A
G-45-3-10-10-142.103101069.71 69.01 0.70 1.02 91.27 F/A
G-45-3-10-10-246.353101068.30 F/A
Note: f c = concrete compressive strength; n g = number of grooves; b g = width of groove; h g = depth of groove; P u = bond strength; P u , a v g . = average bond strength of identical specimens; DC = debonding concrete; OGD = out-of-groove debonding; IGD = in-groove debonding; F/A = debonding at the CFRP–adhesive interface.
Table 4. Regression analysis results of the proposed model.
ParameterCoefficientp-Value95% CI
a 0 −0.376<0.001[−0.569, −0.183]
a 1 0.353<0.001[0.255, 0.451]
a 2 −0.216<0.001[−0.268, −0.164]
a 3 0.125<0.001[0.056, 0.193]
a 4 0.136<0.001[0.068, 0.204]
Table 5. Summary of effective strain model in EBR method.
ReferenceModelDescription
ACI 440.2R-17 [25] ε e f f , A C I = 0.41 f c n E f t f 0.9 ε f u
CNR-DT 200/R1 [54] ε e f f , C N R = k q 2 k b 0.32 f c m f c t m E f t f k q = { 1.00 f o r   c o n c e n t r a t e d   l o a d s 1.25 f o r   d i s t r i b u t e d   l o a d s
Chen and Teng [55] ε e f f ,   C & T = 0.427 β p β L f c L e E f t f β p = 2 ( b f / b ) 1 + ( b f / b ) , β l = { 1 , L L e s i n π L 2 L e L < L e , L e = E f t f f c
Lu et al. [56] ε e f f , L u = 0.114 ( 4.41 α ) τ m a x n f n E f t f α = 3.41 L e e L d , L e e = 0.228 n E f t f , τ m a x = 1.5 β w f t ,
β w = 2.25 ( b f / b ) 1.25 + ( b f / b ) , f t = 0.63 f c
Table 6. Parameters and prediction results of collected test specimens.
Ref.Specimen b
(mm)
h
(mm)
b f
(mm)
t f
(mm)
b g
(mm)
h g
(mm)
n g
(mm)
ACI 440.2R-17 [25]CNR-DT 200/R1
[54]
Chen and Teng
[55]
Lu et al. [56]Proposed
Model
P A C I 440 / P e x p . P C N R
/ P e x p .
P C & T
/ P e x p .
P L u
/ P e x p .
P p r o p . / P e x p .
[50]EBROG-d8-1g140180501.4101310.880.950.560.910.93
EBROG-d8-2g140180501.451320.830.900.530.870.92
EBROG-d10-1g140180501.4101311.041.100.691.071.08
EBROG-d10-2g140180501.451320.900.960.600.930.96
EBROG-d10-3g140180501.43.51330.930.990.620.961.00
[57]GM50-1500240501.7101210.971.090.771.021.05
GM50-1B500240501.7101210.961.080.761.011.04
GM50-2500240501.7101220.870.970.690.910.97
GM50-2B500240501.7101220.840.940.660.890.94
GM100-35002401001.7101230.871.000.900.901.00
GM100-3B5002401001.7101230.830.950.860.860.95
GM100-45002401001.7101240.820.940.850.850.96
GM100-4B5002401001.7101240.790.900.820.810.92
Mean 0.890.950.720.920.98
CV (%) 7.629.2316.247.735.11
MAE (%) 11.748.6528.429.294.73
Disclaimer/Publisher’s Note: The statements, opinions and data contained in all publications are solely those of the individual author(s) and contributor(s) and not of MDPI and/or the editor(s). MDPI and/or the editor(s) disclaim responsibility for any injury to people or property resulting from any ideas, methods, instructions or products referred to in the content.