Article

A Machine Learning-Based Design Framework for Predicting the Minimum Laminate Configuration of Type IV Composite Overwrapped Pressure Vessels

School of Mechanical Engineering, Kookmin University, 77, Jeongneung-ro, Seoul 02707, Republic of Korea
*
Author to whom correspondence should be addressed.
Appl. Sci. 2026, 16(14), 7066; https://doi.org/10.3390/app16147066
Submission received: 13 June 2026 / Revised: 10 July 2026 / Accepted: 11 July 2026 / Published: 14 July 2026

Abstract

Type IV composite hydrogen storage vessels must ensure structural safety under high internal pressure, and determining the optimal laminate configuration typically requires repetitive finite element analysis (FEA), leading to significant computational cost during the early design stage. To address this limitation, this study proposes a machine learning (ML)-based design-assistance framework for predicting the minimum laminate configuration required to satisfy structural safety based on the Tsai–Wu failure criterion. Three geometric design variables—liner radius, liner length, and polar hole radius—were used as inputs, and a dataset was generated using ANSYS Workbench-based FEA. Five ML models—SVR, GPR, RF, XGBoost, and MLP—were applied and evaluated using leave-one-out cross-validation (LOOCV) and an independent test set. All models achieved high predictive accuracy, with LOOCV R2 values ranging from 0.9801 to 0.9907 and test-set R2 values from 0.9866 to 0.9949, while maintaining MAPE below 6%. The consistent performance between LOOCV and the independent test set indicates stable predictive behavior. Learning curve analysis demonstrated stable convergence and a small performance gap between training and validation, suggesting stable predictive behavior within the considered design space. Feature importance analysis using the RF model identified the liner radius as the dominant parameter, while the influence of liner length was relatively minor. These results demonstrate that the proposed ML-based surrogate model can serve as an efficient tool for rapid design decision-making, reducing reliance on repetitive FEA in the early design stage.

1. Introduction

Hydrogen has attracted increasing global attention as an alternative energy source for achieving carbon neutrality and reducing dependence on fossil fuels [1,2,3]. Owing to its high energy density and zero greenhouse gas emissions during combustion, hydrogen is considered a promising clean energy source for various applications [4,5,6]. However, due to its low volumetric energy density, efficient storage technologies are essential, and high-pressure gaseous storage has emerged as the most widely adopted method [7,8].
Composite overwrapped pressure vessels play a critical role in high-pressure hydrogen storage systems [9,10]. In particular, Type IV vessels, which consist of a polymer liner reinforced with carbon fiber-reinforced polymer (CFRP) through filament winding, are widely used in hydrogen mobility applications due to their lightweight characteristics and superior mechanical performance [11,12,13,14]. These vessels must simultaneously satisfy both lightweight design requirements and structural safety, making advanced design methodologies essential.
A key challenge in the structural design of Type IV composite pressure vessels is determining an appropriate laminate configuration that prevents failure under high internal pressure conditions [15]. Finite element analysis (FEA)-based structural evaluation has been widely employed as a standard approach for this purpose. Park et al. [16] combined netting analysis with FEA to optimize composite layer configurations and boss geometry while ensuring structural safety. Reda et al. [17] investigated the effect of winding angles on mechanical performance using ANSYS 2025 R2 Workbench-based FEA and netting analysis for Type IV vessels composed of a nylon 6 liner and CFRP. Farhood et al. [18] evaluated the influence of stacking sequence and winding angles on burst pressure using Tsai–Wu and maximum stress criteria. Atul et al. [19] analyzed stress distribution and failure behavior under varying winding angles using ANSYS ACP and validated the results with classical lamination theory (CLT). Regassa et al. [20] employed Abaqus to evaluate burst pressure for various laminate configurations and identified optimal winding patterns.
Although FEA-based approaches enable detailed evaluation of the structural behavior of composite pressure vessels, they often require iterative simulations across multiple design configurations, leading to substantial computational cost and time consumption [4,16,17,18,19,20]. This limitation becomes particularly significant during the early design stage, where extensive exploration of geometric configurations is required, thereby reducing design efficiency.
To overcome these limitations, machine learning (ML)-based approaches have been increasingly applied to composite structure design for predicting structural responses and enabling optimal design. Shaik et al. [21] utilized FEA-generated data to predict burst pressure in thin-walled pressure vessels using XGBoost and Random Forest models, demonstrating that ML can significantly accelerate structural evaluation compared to conventional FEA. Santos et al. [22] applied various ML models, including GPR, kPCA-Lasso, and ensemble methods, to predict burst strength based on filament winding process data, achieving high prediction accuracy, particularly with ensemble approaches. Kadri et al. [23] employed a Bi-LSTM deep learning model to predict ductile damage in Type IV hydrogen tank composites, demonstrating the effectiveness of hybrid FEM–ML frameworks. Li et al. [24] combined Kriging surrogate models with response surface methods to perform reliability analysis and particle swarm optimization (PSO)-based design optimization of composite hydrogen storage vessels. Koutsawa and Bouhala [25] used polynomial chaos expansion (PCE) surrogate models to quantify uncertainty in Type IV vessel design and identify key design variables. Li et al. [26] proposed a hybrid framework integrating FEA and artificial neural networks (ANNs) to optimize laminate design by simultaneously considering filament winding parameters and dome geometry. Alcántar et al. [27] applied genetic algorithms (GA) and simulated annealing (SA) to achieve lightweight optimization of Type IV composite pressure vessels, resulting in up to 11.2% weight reduction. Wang et al. [28] combined FEM-generated data with multi-layer deep neural networks (DNNs) to predict failure indices and performed efficient layup optimization using transfer learning and GA.
However, existing ML-based studies primarily focus on predicting structural responses—such as burst pressure, strength, and damage states—for vessels with fixed geometries, or on optimization under limited design conditions [21,22,23,26,28]. In contrast, ML frameworks that directly support design decision-making by predicting the minimum required laminate configuration for arbitrarily given geometric parameters, remain underexplored. Furthermore, despite the high cost of FEA-based data generation, which limits the availability of large datasets, systematic evaluation and comparison of ML model generalization performance under small-data conditions remain relatively limited.
Therefore, this study proposes an ML-based early design-assistance framework based on the selected geometric design parameters for directly predicting the minimum laminate configuration required to ensure structural safety in Type IV hydrogen storage vessels. Identifying this minimum laminate sequence is critical for achieving lightweight design while maintaining structural integrity, yet it typically requires iterative FEA-based evaluation. To address this challenge, three key geometric design variables—liner radius, liner length, and polar hole radius—are used as inputs. Based on FEA-generated data, five ML models—Support Vector Regression (SVR), Gaussian Process Regression (GPR), Random Forest (RF), eXtreme Gradient Boosting (XGBoost), and Multi-Layer Perceptron (MLP)—are applied. The generalization performance of these models is systematically evaluated using leave-one-out cross-validation (LOOCV) and an independent test set, providing a direct and efficient alternative to conventional iterative FEA-based design approaches. Unlike previous studies that primarily focused on predicting structural responses, the proposed framework directly supports preliminary design by estimating the minimum laminate configuration from geometric design parameters.

2. Methodology

2.1. Type IV Vessel Design and Input Variables

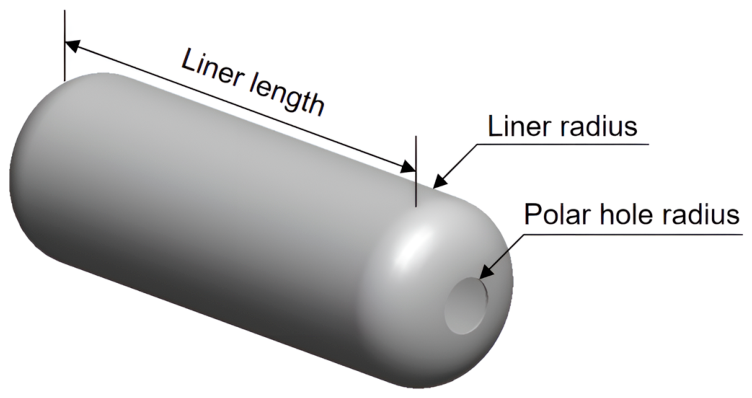
The pressure vessel consists of a cylindrical section and dome regions. In this study, an isotensoid dome profile was adopted, as it is known to provide favorable stress distribution and reduce stress concentration under internal pressure conditions [29,30]. The geometry and key design parameters of the Type IV composite pressure vessel are illustrated in Figure 1. Three key geometric design variables were selected as inputs: liner radius (r), liner length (L), and polar hole radius (rp). These variables were chosen as primary geometric parameters governing the structural behavior and load distribution of the pressure vessel. The selected parameter ranges are summarized in Table 1. It should be noted that polar hole radii of 16 mm and 18 mm were applied only to liner radius cases of 50 mm and 60 mm. This constraint was introduced to ensure physically realistic design configurations, as larger liner radii require proportionally larger polar openings. Accordingly, the range of polar hole sizes was extended for larger vessel geometries to avoid impractical design combinations. In total, 60 design configurations were generated for subsequent FEA-based analysis.

2.2. FEA-Based Dataset Generation

The finite element mesh for both the CFRP overwrap and the liner was first generated separately in ANSYS Workbench. The generated mesh was then imported into ANSYS ACP-Pre, where the composite layup, including the stacking sequence, ply orientations, and layer thicknesses, was defined. The liner material was modeled as polyamide 6 (PA6), while the composite layers were modeled using carbon fiber/epoxy. The material properties of PA6 and carbon fiber/epoxy were obtained from the ANSYS Engineering Data library and are summarized in Table 2 and Table 3, respectively.
The composite structure consisted of hoop and helical layers. The hoop layers were designed to primarily sustain circumferential loads, while the helical layers contributed to both axial and dome-region load transfer. The thickness and winding angle of the hoop layers were set to 0.03 mm and 90°, respectively. The helical layers had a thickness of 0.06 mm and were assigned a winding angle corresponding to the minimum winding angle (α). The minimum winding angle (α) was determined to ensure stable fiber placement without slippage in the dome region during the filament winding process, and was calculated using Equation (1) [16], given by:
sin α = r p r
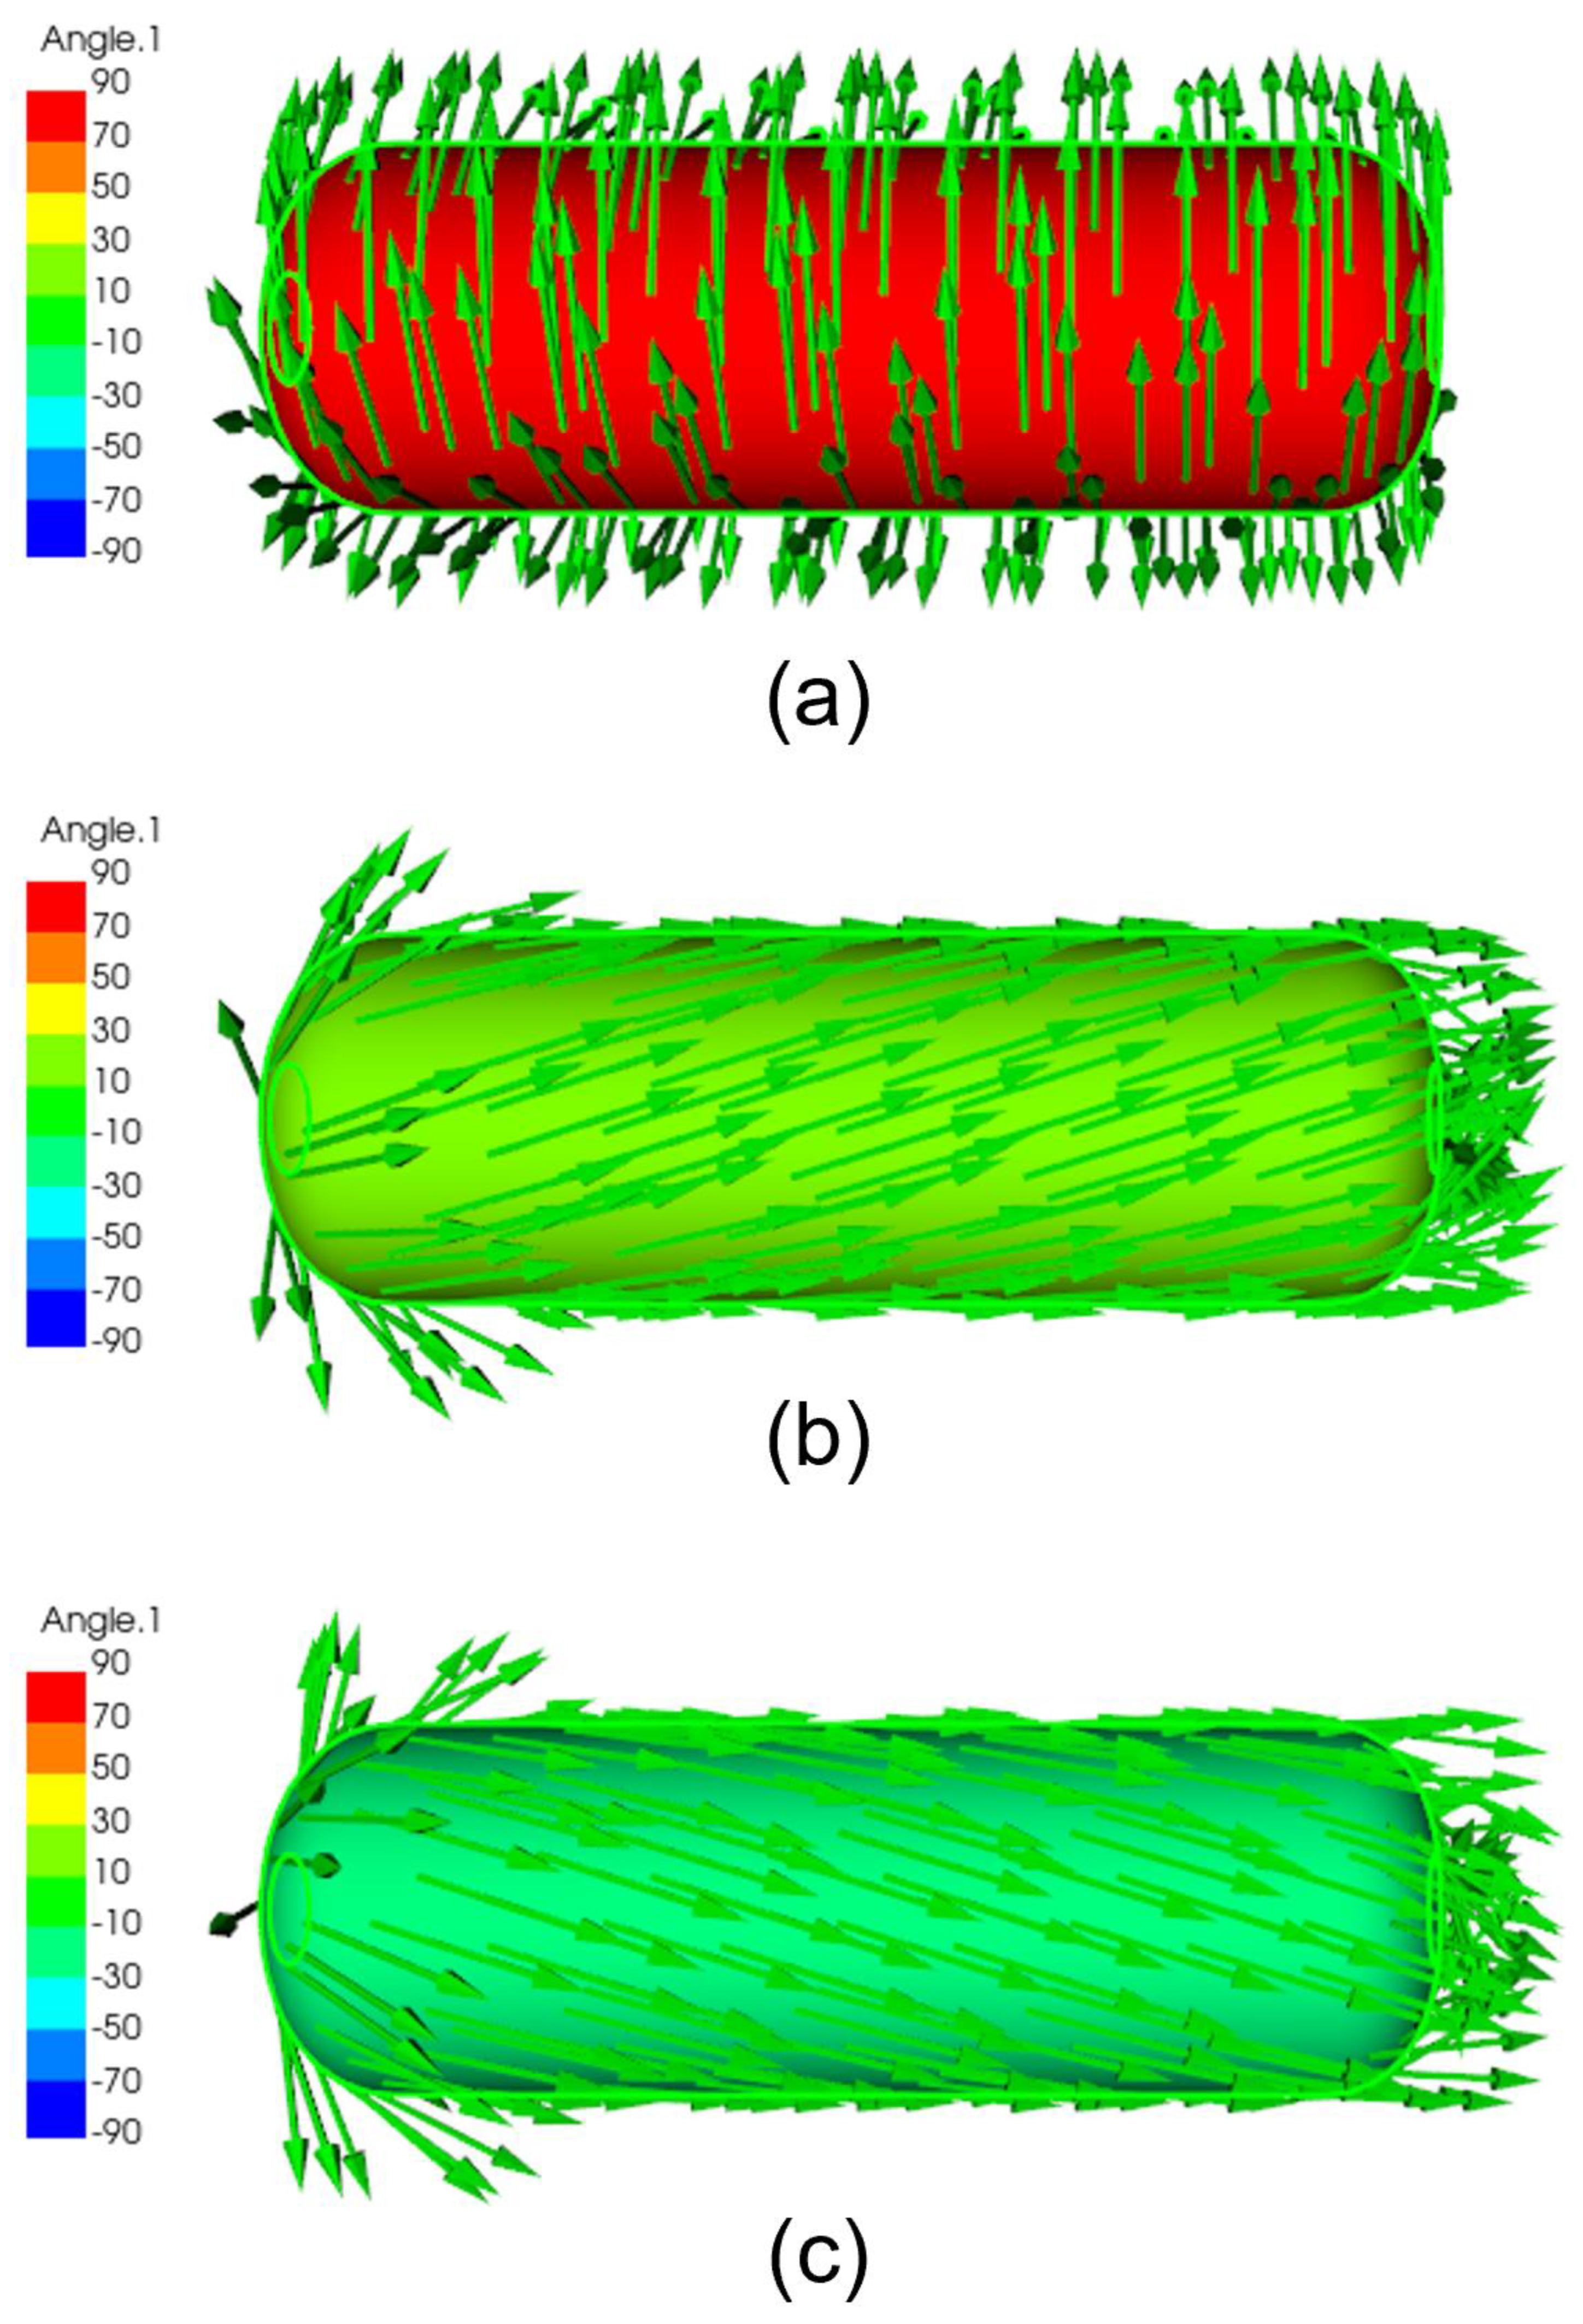
where α is the minimum winding angle, r is the liner radius, and r p is the polar hole radius. The stacking sequence was defined as repeated sets of [90°/90°/±α°], representing the combination of hoop and helical layers. The corresponding fiber orientations implemented in ANSYS ACP-Pre are illustrated in Figure 2.
An internal pressure of 78.75 MPa was applied, corresponding to the operating pressure of 35 MPa with a safety factor of 2.25. This loading condition reflects standard design requirements for high-pressure hydrogen storage vessels [16]. For the finite element modeling, SOLID185 (an 8-node hexahedral element) was utilized for the CFRP composite layers, while SOLID187 (a 10-node tetrahedral element) was employed for the liner. To ensure the accuracy of the FEA results for each design configuration, a mesh independence study was conducted by testing various mesh sizes ranging from 1 mm to 6 mm. Structural failure was evaluated using the Tsai–Wu failure criterion. The Tsai–Wu failure criterion can be expressed as:
I R F = F i σ i + F i j σ i σ j
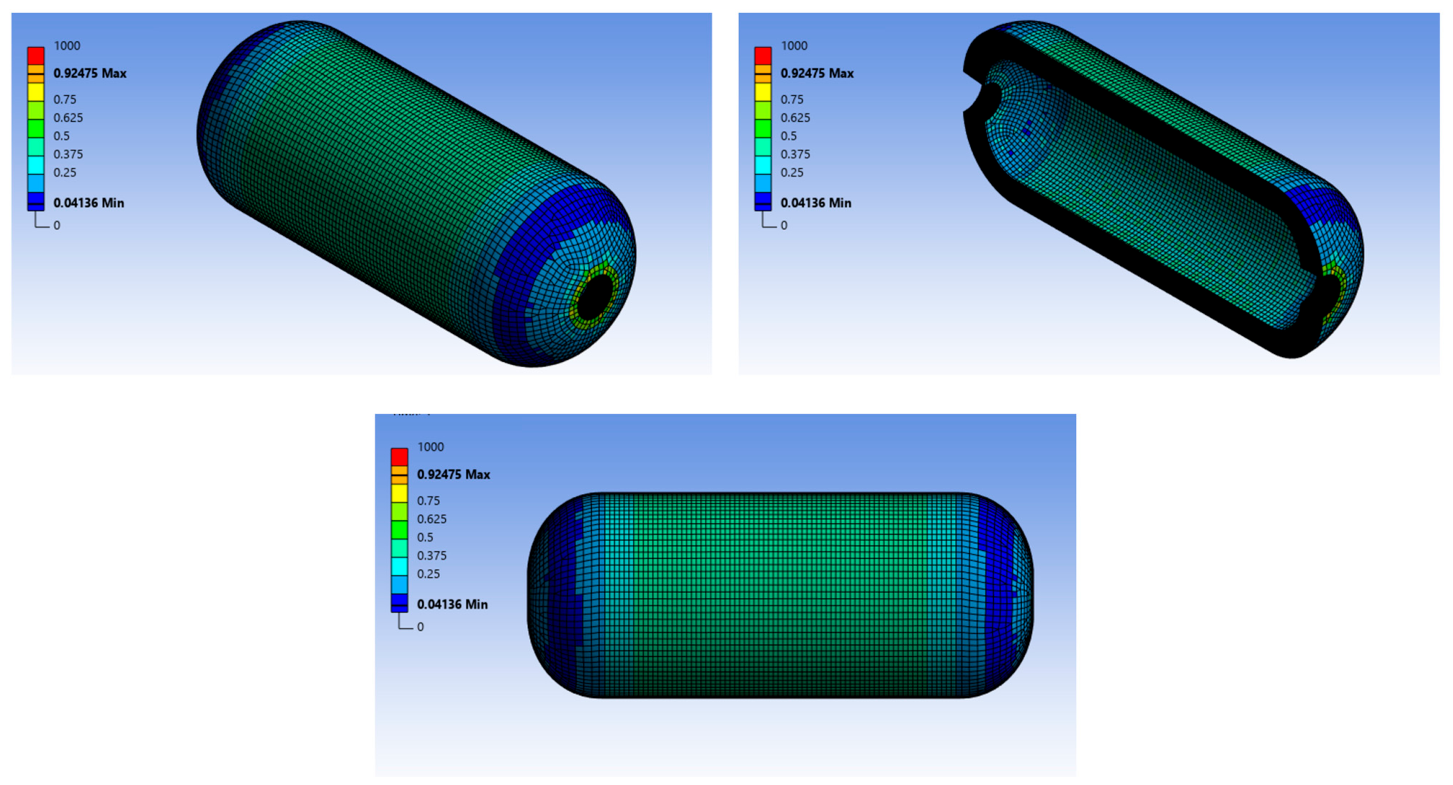
where i, j = 1,…,6, F i and F i j are the material strength coefficients determined from the composite strength properties, and σ i is the stress components expressed in Voigt notation. In this study, the inverse reserve factor (IRF) was used as the failure index, where IRF < 1 indicates a safe condition, IRF = 1 represents the onset of failure, and IRF > 1 indicates failure [31]. A representative distribution of the Tsai–Wu failure index (IRF) obtained from FEA is presented in Figure 3.
To determine the target output—the minimum number of laminate sets (N)—a systematic iterative FEA procedure was conducted for each design configuration. After calculating the corresponding minimum winding angle (α), a monotonic search was performed by increasing N in increments of one set. At each step, the maximum Tsai–Wu inverse reserve factor (IRF) across the vessel was evaluated. The convergence criterion was defined as the first instance where the maximum IRF fell below 1.0 (max IRF < 1). To strictly verify that the identified N was the absolute minimum, the preceding configuration (N-1) was also evaluated to confirm that it exhibited structural failure (max IRF ≥ 1). This complete iterative procedure was repeated for all generated design cases to build the final dataset. The resulting minimum laminate sets ranged from 5 to 20, with a mean of 12.27 and a standard deviation of 4.26.

2.3. Data Splitting Strategy

To ensure an objective evaluation of model generalization performance and to prevent overfitting, the dataset was divided into a training–validation set (50 samples) and an independent test set (10 samples). The test set was strictly excluded from all training and hyperparameter optimization processes and was used solely for final model evaluation. Stratified random sampling based on liner radius was employed to maintain a balanced distribution of geometric configurations across both datasets. Specifically, four liner radius categories (30, 40, 50, and 60 mm) were proportionally represented in both the training–validation and test sets. This approach was adopted to minimize potential data imbalance and evaluation bias that may arise from simple random sampling. The resulting test set consisted of 2, 2, 3, and 3 samples for liner radii of 30, 40, 50, and 60 mm, respectively. To further assess model generalization under limited data conditions, leave-one-out cross-validation (LOOCV) was applied to the training–validation set. LOOCV was selected due to the limited dataset size, as it allows the model to be trained on nearly the entire training dataset in each iteration while providing an estimate of predictive error within the considered design space.

2.4. Machine Learning Models

Five machine learning models with different learning mechanisms were employed to predict the minimum laminate configuration of the Type IV hydrogen storage vessels: Support Vector Regression (SVR), Gaussian Process Regression (GPR), Random Forest (RF), eXtreme Gradient Boosting (XGBoost), and Multi-Layer Perceptron (MLP). These models represent kernel-based methods (SVR, GPR), ensemble-based methods (RF, XGBoost), and neural network-based methods (MLP). SVR is a regression model based on structural risk minimization, which aims to find an optimal function within a specified error margin while maintaining generalization capability [32,33]. GPR is a Bayesian nonparametric model that provides probabilistic predictions and uncertainty estimation, making it suitable for small datasets [34,35]. RF and XGBoost are ensemble-based models that improve prediction accuracy by aggregating multiple decision trees and minimizing residual errors, respectively [36,37]. MLP is a feedforward neural network capable of capturing nonlinear relationships between inputs and outputs [38]. These models were selected to systematically compare their generalization performance across diverse learning paradigms, particularly under limited data conditions.

2.5. Model Evaluation Metrics

The performance of the machine learning models was evaluated using four standard regression metrics: the coefficient of determination (R2), root mean squared error (RMSE), mean absolute error (MAE), and mean absolute percentage error (MAPE).
R2 measures the proportion of variance in the target variable that is explained by the model, and is defined as:
R 2 = 1 i = 1 n y i y i ^ 2 i = 1 n y i y ¯ 2
where y i is the actual value, y i ^ is the predicted value, y ¯ is the mean of actual values and n is the number of samples.
RMSE represents the square root of the mean squared error and penalizes larger deviations more heavily:
R M S E = 1 n i = 1 n ( y i y i ^ ) 2
MAE measures the average absolute difference between predicted and actual values:
M A E = 1 n i = 1 n y i y i ^
MAPE expresses the prediction error as a percentage, allowing relative comparison of model performance:
M A P E = 100 n i = 1 n y i y i ^ y i
In general, a higher R2 value and lower RMSE, MAE, and MAPE values indicate better model performance.

2.6. Hyperparameter Optimization

Hyperparameter optimization was performed using grid search on the training–validation dataset (50 samples). The search ranges and optimal hyperparameters for each model are summarized in Table 4. For GPR, hyperparameters were automatically optimized during model training by maximizing the log-marginal likelihood (LML) and were, therefore, excluded from the grid search process.

3. Results and Discussion

3.1. Cross-Validation Performance Evaluation

To quantitatively evaluate model performance and assess generalization capability under limited data conditions, leave-one-out cross-validation (LOOCV) was applied to the training–validation dataset. Given the relatively small dataset size (50 samples), LOOCV enables efficient utilization of available data by training the model on all but one sample in each iteration, thereby providing a robust estimate of model performance. The LOOCV results are summarized in Table 5, and the relationship between predicted and actual laminate counts is illustrated in Figure 4. Among the evaluated models, SVR achieved the best performance, with an R2 of 0.9907, RMSE of 0.3909, MAE of 0.2978, and MAPE of 2.54%. XGBoost also demonstrated strong performance, with an R2 of 0.9894 and MAPE of 2.71%. MLP, GPR, and RF followed with slightly lower but still competitive performance. Overall, all models exhibited high predictive accuracy, with R2 values exceeding 0.98 and MAPE below 5%. These results indicate that the proposed approach provides reliable predictions across different model architectures. In particular, the consistently low prediction errors observed in SVR and XGBoost suggest their strong suitability for this problem.
To further assess the robustness of the proposed models, additional 5-fold cross-validation was performed. The results are summarized in Table 6. The results showed consistently high predictive performance across all models, confirming the robustness of the proposed framework.

3.2. Independent Test Set Evaluation

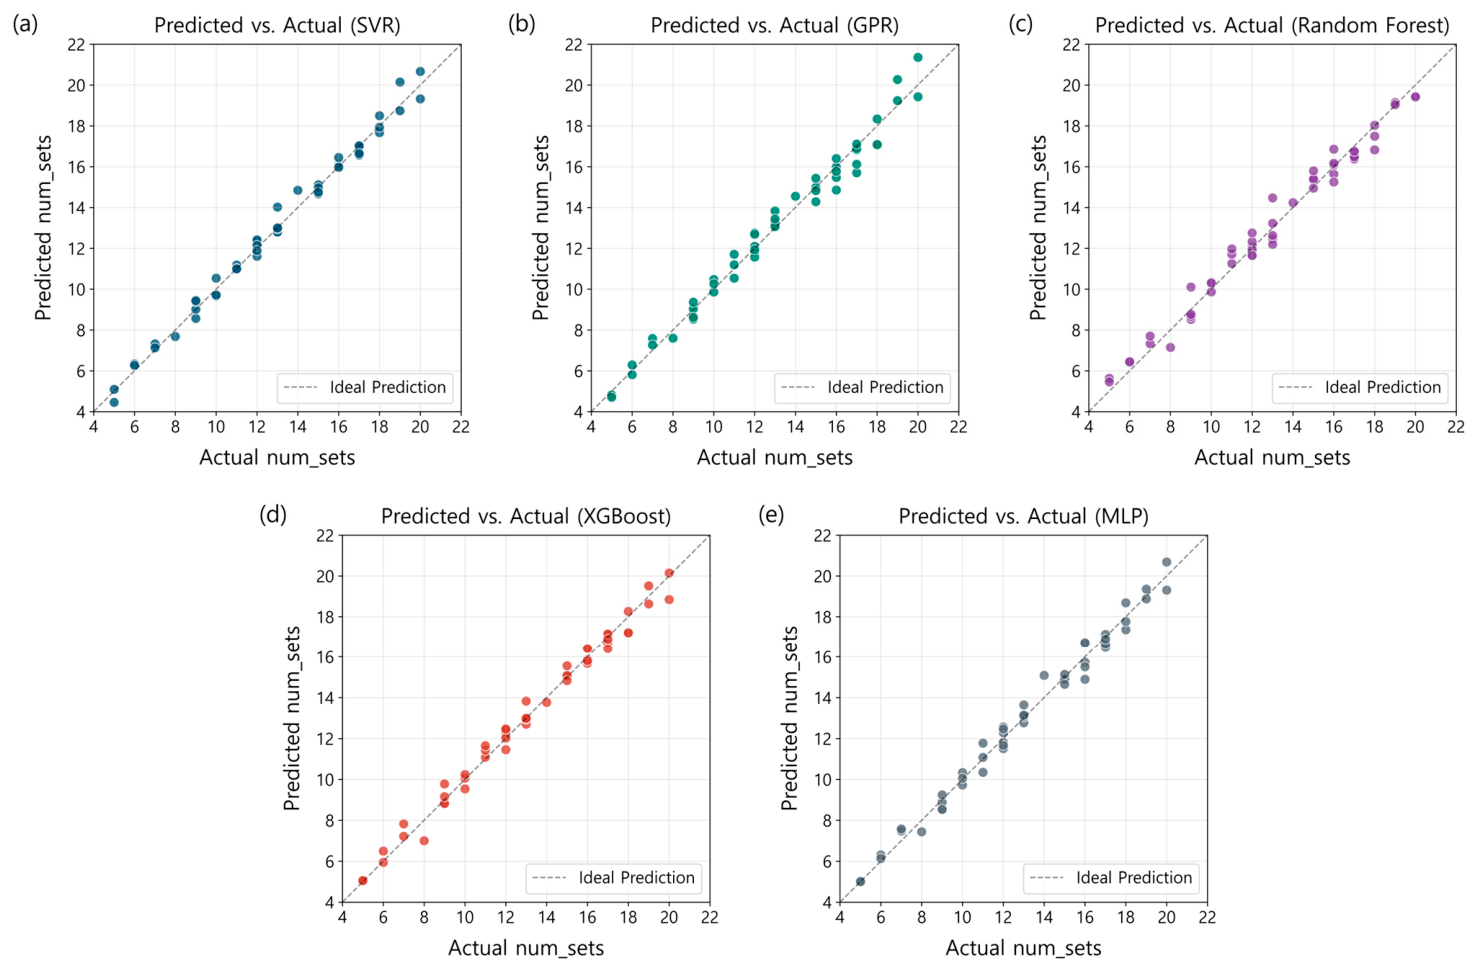
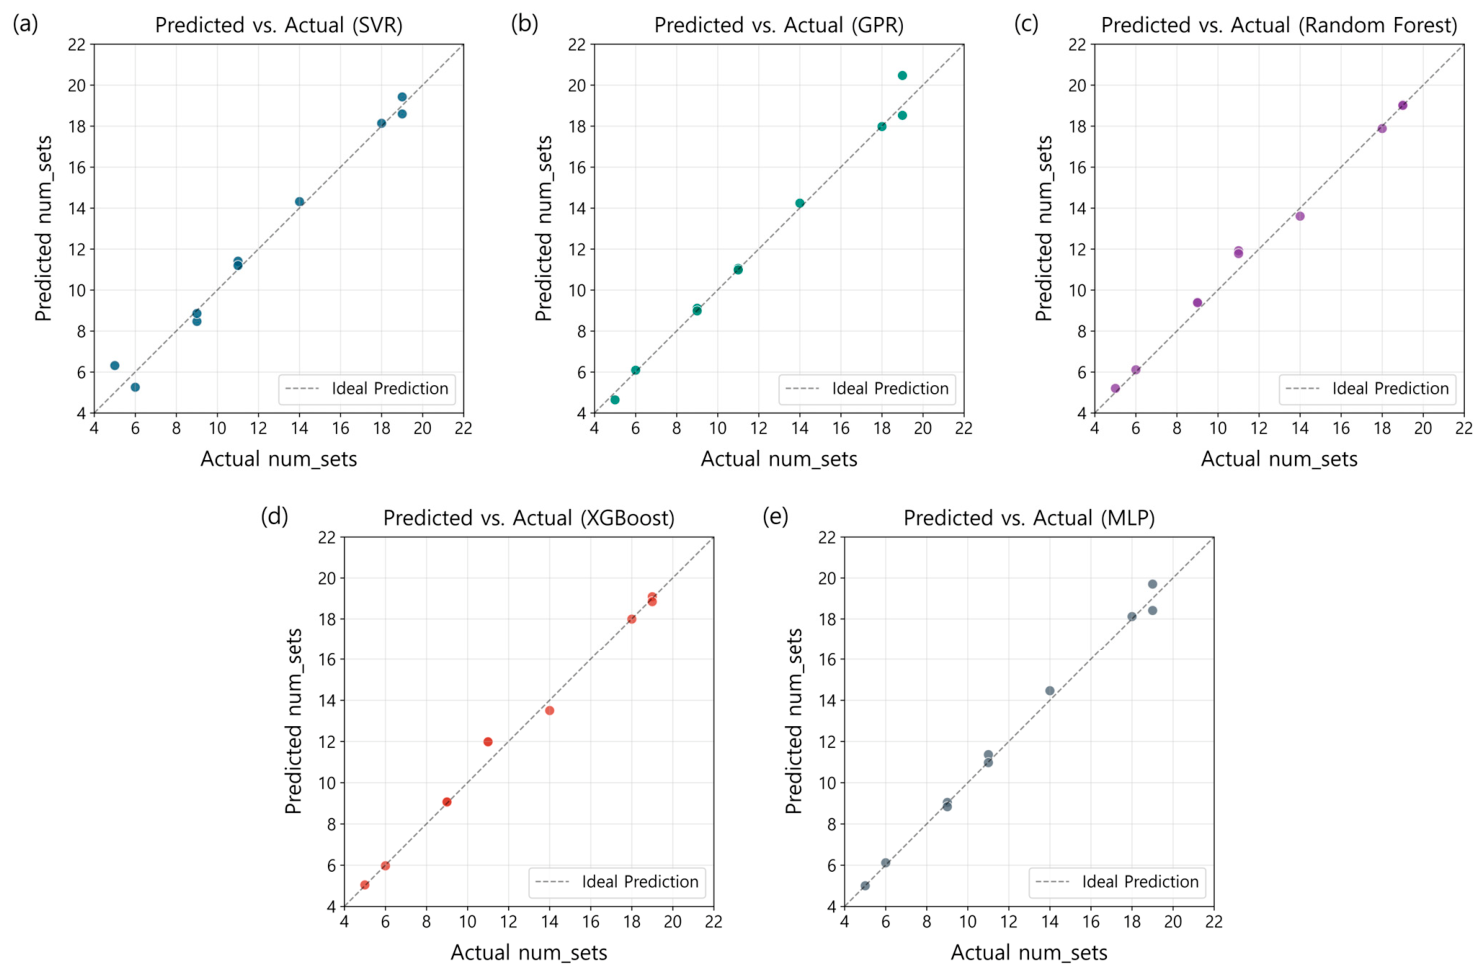
To further evaluate the generalization performance of the models, an independent test set consisting of 10 samples was used. This dataset was completely excluded from the training and validation processes, ensuring an unbiased assessment of model performance. The test set results are summarized in Table 7, and the relationship between predicted and actual laminate counts for the independent test set is illustrated in Figure 5. All models maintained high predictive accuracy on the independent test set, with R2 values ranging from 0.9866 to 0.9949 and MAPE below 6%. Notably, the performance observed on the test set is consistent with the LOOCV results, indicating that the models generalize well to unseen data despite the limited dataset size. Among the models, SVR and XGBoost continued to exhibit strong performance, while the remaining models also demonstrated stable and reliable predictions. These results confirm that the proposed ML framework can effectively predict the minimum laminate configuration for new design conditions. Figure 5 presents a parity plot comparing the predicted and actual minimum laminate configurations for the independent test set. The close agreement between the predicted and actual values further demonstrates the predictive performance and practical applicability of the proposed framework.

3.3. Learning Curve Analysis

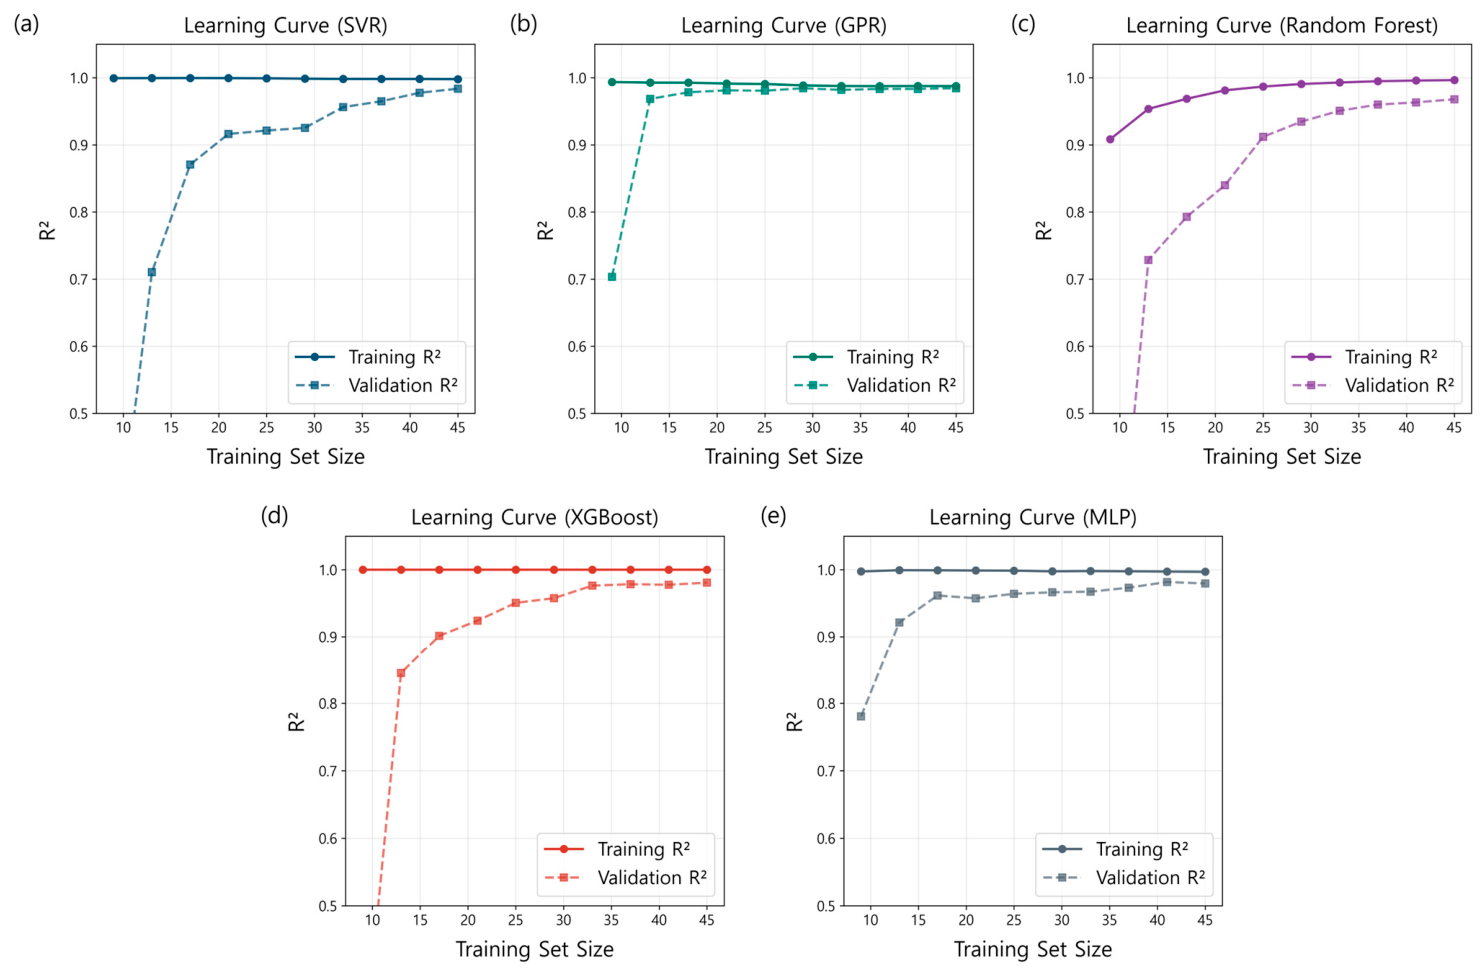
To further investigate model performance under limited data conditions, learning curve analysis was conducted. The learning curves for the five models are presented in Figure 6. As the number of training samples increased, all models exhibited stable convergence, with both training and validation errors decreasing. The performance gap between training and validation remained small across all models, indicating minimal overfitting. These results suggest stable predictive behavior within the considered design space. In particular, the consistent convergence behavior suggests that the proposed framework can effectively capture the relationship between geometric parameters and the required laminate configuration without requiring large-scale datasets. It should be noted that the learning curves are intended to illustrate the convergence behavior of the proposed models for the present dataset rather than to define a general minimum data requirement.

3.4. Feature Importance Analysis

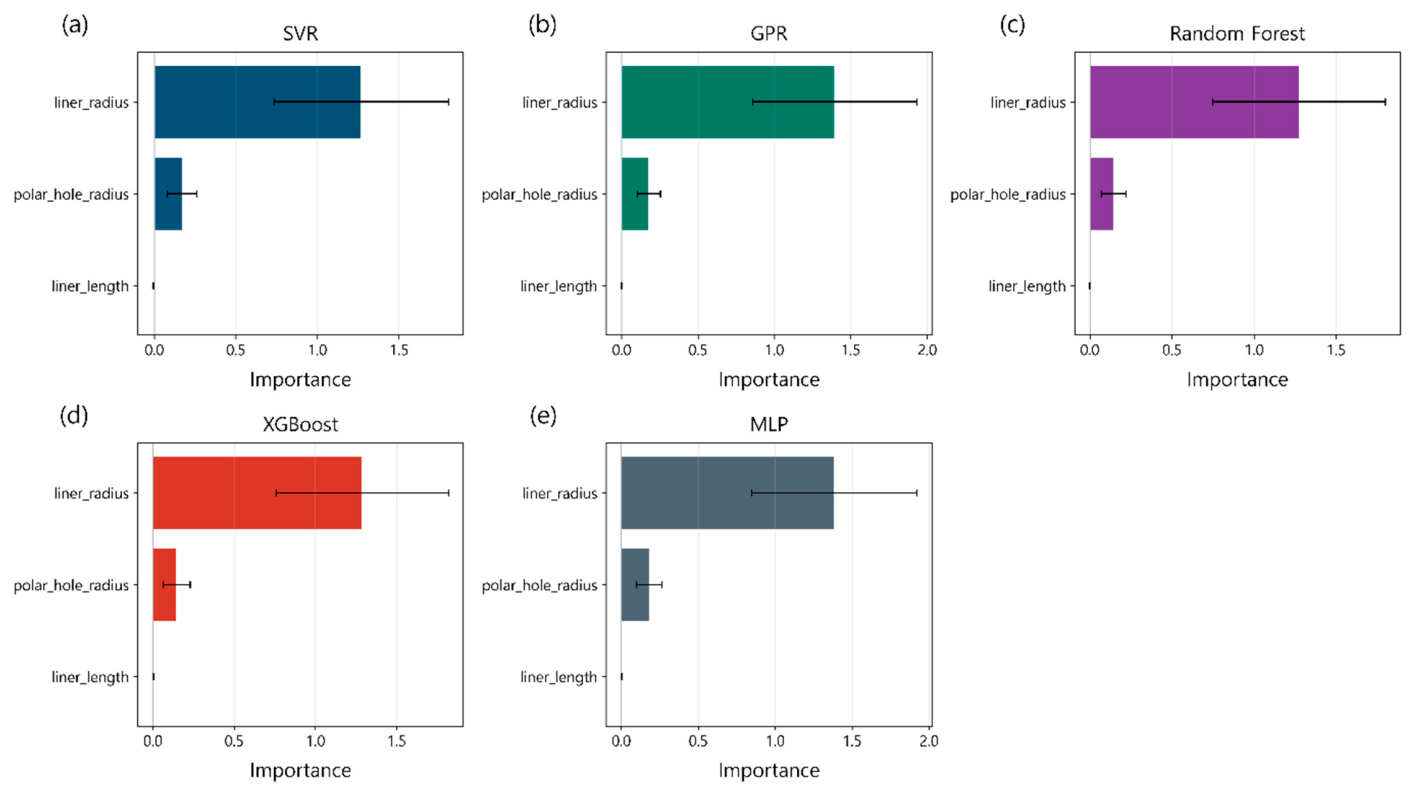
To identify the relative influence of the input variables on the predicted laminate configuration, permutation feature importance analysis was conducted for all five machine learning models (SVR, GPR, RF, XGBoost, and MLP). The results are presented in Figure 7. Among the three geometric design variables, the liner radius exhibited the highest importance, indicating that it is the dominant factor governing the required laminate configuration. In contrast, the liner length showed relatively low importance, suggesting a minor influence on structural requirements. The polar hole radius demonstrated moderate importance. These results can be interpreted from a structural perspective. The liner radius directly affects the stress distribution under internal pressure, leading to significant changes in the required laminate thickness. On the other hand, the liner length has a relatively smaller impact on stress concentration and load distribution, resulting in a reduced influence on laminate configuration. These results are consistent with established pressure vessel mechanics, where the liner radius has the greatest influence on hoop stress under internal pressure. This agreement indicates that the proposed machine learning model successfully captures physically meaningful relationships governing the required laminate configuration.

4. Conclusions

This study proposed a machine learning (ML)-based design-assistance framework for predicting the minimum laminate configuration required to satisfy the Tsai–Wu failure criterion for Type IV composite overwrapped pressure vessels. Three key geometric design variables—liner radius, liner length, and polar hole radius—were used as inputs, and five ML models were applied based on FEA-generated data.
The results demonstrated that all models achieved high predictive accuracy, with R2 values exceeding 0.98 and MAPE below 6% in both cross-validation and independent test evaluations. The consistent performance across LOOCV and the test set confirms the robustness and generalization capability of the proposed framework, even under limited data conditions.
In addition, learning curve analysis revealed stable convergence behavior with minimal overfitting, indicating that reliable performance can be achieved even with relatively limited training data. Furthermore, feature importance analysis identified the liner radius as the dominant design parameter. These findings provide meaningful design insights by clarifying the relative influence of geometric variables on laminate configuration.
Overall, the proposed framework offers a practical approach for predicting the minimum laminate configuration and has the potential to reduce the reliance on repetitive FEA simulations during the early design stage. Future work will extend the proposed framework by incorporating additional design and operational factors, including winding-angle optimization, material variability, laminate thickness variation, manufacturing defects, residual stresses, and environmental loading, to further improve its applicability to practical composite pressure vessel design.


Author Contributions

Conceptualization, H.Y.; methodology, H.Y.; supervision, H.Y.; investigation, J.A.; data curation, J.A.; formal analysis, J.A.; writing—original draft preparation, J.A.; writing—review and editing, H.Y. All authors have read and agreed to the published version of the manuscript.

Funding

This research was funded by the National Research Foundation of Korea (NRF) grant funded by the Korea government (MSIT) (RS-2026-25493833).

Institutional Review Board Statement

Not applicable.

Informed Consent Statement

Not applicable.

Data Availability Statement

The raw data supporting the conclusions of this article will be made available by the authors on request.

Conflicts of Interest

The authors declare no conflicts of interest.

References

  1. Nachtane, M.; Idrissi, M.E.F.; Tarfaoui, M.; Qarssis, Y.; Abichou, A.; Faik, A. Deep learning-driven predictive tools for damage prediction and optimization in composite hydrogen storage tanks. Compos. Commun. 2024, 51, 102079. [Google Scholar] [CrossRef]
  2. Roh, H.S.; Hua, T.Q.; Ahluwalia, R.K. Optimization of carbon fiber usage in Type 4 hydrogen storage tanks for fuel cell automobiles. Int. J. Hydrogen Energy 2013, 38, 12795–12802. [Google Scholar] [CrossRef]
  3. Zhang, M.; Lv, H.; Kang, H.; Zhou, W.; Zhang, C. A literature review of failure prediction and analysis methods for composite high-pressure hydrogen storage tanks. Int. J. Hydrogen Energy 2019, 44, 25777–25799. [Google Scholar] [CrossRef]
  4. Liu, P.F.; Chu, J.K.; Hou, S.J.; Xu, P.; Zheng, J.Y. Numerical simulation and optimal design for composite high-pressure hydrogen storage vessel: A review. Renew. Sustain. Energy Rev. 2012, 16, 1817–1827. [Google Scholar] [CrossRef]
  5. Siddiqui, M.J.; Balguri, P.K.; Haripriya, K.; Rajendran, A.R.; Patil, I.V. Analysis of type IV hydrogen pressure vessel with S-glass, carbon fiber T700 and Kevlar composite materials. Mater. Today Proc. 2023; in press. [CrossRef]
  6. Ramirez, J.P.B.; Halm, D.; Grandidier, J.C.; Villalonga, S.; Nony, F. 700 bar type IV high pressure hydrogen storage vessel burst–simulation and experimental validation. Int. J. Hydrogen Energy 2015, 40, 13183–13192. [Google Scholar] [CrossRef]
  7. Abdalla, A.M.; Hossain, S.; Nisfindy, O.B.; Azad, A.T.; Dawood, M.; Azad, A.K. Hydrogen production, storage, transportation and key challenges with applications: A review. Energy Convers. Manag. 2018, 165, 602–627. [Google Scholar] [CrossRef]
  8. Usman, M.R. Hydrogen storage methods: Review and current status. Renew. Sustain. Energy Rev. 2022, 167, 112743. [Google Scholar] [CrossRef]
  9. Rocha, H.; Antunes, P.; Lafont, U.; Nunes, J.P. Processing and structural health monitoring of a composite overwrapped pressure vessel for hydrogen storage. Struct. Health Monit. 2024, 23, 2391–2406. [Google Scholar] [CrossRef]
  10. Barthélémy, H.; Weber, M.; Barbier, F. Hydrogen storage: Recent improvements and industrial perspectives. Int. J. Hydrogen Energy 2017, 42, 7254–7262. [Google Scholar] [CrossRef]
  11. Barthélémy, H. Hydrogen storage–industrial prospectives. Int. J. Hydrogen Energy 2012, 37, 17364–17372. [Google Scholar] [CrossRef]
  12. Eko, A.J.; Epaarachchi, J.; Jewewantha, J.; Zeng, X. A review of type IV composite overwrapped pressure vessels. Int. J. Hydrogen Energy 2025, 109, 551–573. [Google Scholar] [CrossRef]
  13. Tan, Y.; Liu, W.; Bai, Y. Analysis and optimal design of boss for Type-IV pressure vessel. Int. J. Hydrogen Energy 2025, 166, 150936. [Google Scholar] [CrossRef]
  14. Shin, H.K.; Ha, S.K. Techno-economic analysis of type III and IV composite hydrogen storage tanks for fuel cell vehicles. Adv. Compos. Mater. 2024, 33, 527–559. [Google Scholar] [CrossRef]
  15. Khan, S.; Kumar, A. Failure analysis in advance cylindrical composite pressure vessel under pressure & temperature for hydrogen storage: A comprehensive review. Polym. Compos. 2025, 46, 2933–2973. [Google Scholar] [CrossRef]
  16. Park, G.; Jang, H.; Kim, C. Design of composite layer and liner for structure safety of hydrogen pressure vessel (type 4). J. Mech. Sci. Technol. 2021, 35, 3507–3517. [Google Scholar] [CrossRef]
  17. Reda, R.; Khamis, M.; Ragab, A.E.; Elsayed, A.; Negm, A.M. Numerical analysis of the impact of winding angles on the mechanical performance of filament wound type 4 composite pressure vessels for compressed hydrogen gas storage. Heliyon 2024, 10, e33796. [Google Scholar] [CrossRef] [PubMed]
  18. Farhood, N.H.; Karuppanan, S.; Ya, H.H.; Baharom, M.A. Burst pressure investigation of filament wound type IV composite pressure vessel. AIP Conf. Proc. 2017, 1901, 030017. [Google Scholar] [CrossRef]
  19. Atul, S.T.; Bhat, S.S.; Chavan, S.S.; Kamble, S.B.; Kulkarni, A.P.; Sangale, S.B. Finite element analysis of composite overwrapped pressure vessel for hydrogen storage. In Proceedings of the 2016 International Conference on Advances in Computing, Communications and Informatics (ICACCI), Jaipur, India, 21–24 September 2016; pp. 430–436. [Google Scholar] [CrossRef]
  20. Regassa, Y.; Gari, J.; Lemu, H.G. Composite overwrapped pressure vessel design optimization using numerical method. J. Compos. Sci. 2022, 6, 229. [Google Scholar] [CrossRef]
  21. Shaik, N.B.; Aluru, V.; Jongkittinarukorn, K.; Aluru, P. Optimizing structural integrity of a pressure vessel via finite element analysis and machine learning based XGBoost approaches. Sci. Rep. 2025, 15, 11485. [Google Scholar] [CrossRef] [PubMed]
  22. Santos, R.; Vandepitte, D.; Moens, D. Prediction of composite pressure vessels’ burst strength through machine learning. Compos. Struct. 2025, 351, 118617. [Google Scholar] [CrossRef]
  23. Kadri, K.; Kallel, A.; Guerard, G.; Ben Abdallah, A.; Ballut, S.; Fitoussi, J.; Shirinbayan, M. Prediction of ductile damage in composite material used in type IV hydrogen tanks by artificial neural network and machine learning with finite element modeling approach. Energy Technol. 2025, 13, 2401045. [Google Scholar] [CrossRef]
  24. Li, W.; Lv, H.; Zhang, L.; He, P.; Zhang, C. Reliability analysis and optimization design of hydrogen storage composite pressure vessel with hybrid random-fuzzy uncertainties. J. Reinf. Plast. Compos. 2025, 44, 358–374. [Google Scholar] [CrossRef]
  25. Koutsawa, Y.; Bouhala, L. Uncertainty analysis in the design of Type-IV composite pressure vessels for hydrogen storage. Compos. Part C Open Access 2025, 16, 100544. [Google Scholar] [CrossRef]
  26. Li, F.; Chen, X.; Xu, P.; Fan, Z.; Wang, Q.; Lyu, C.; Zhang, Q.; Yu, H.; Wu, H. Optimal design of thin-layered composites for type IV vessels: Finite element analysis enhanced by ANN. Thin-Walled Struct. 2023, 187, 110752. [Google Scholar] [CrossRef]
  27. Alcántar, V.; Aceves, S.M.; Ledesma, E.; Ledesma, S.; Aguilera, E. Optimization of Type 4 composite pressure vessels using genetic algorithms and simulated annealing. Int. J. Hydrogen Energy 2017, 42, 15770–15781. [Google Scholar] [CrossRef]
  28. Wang, Q.; Qin, H.; Jia, L.; Li, Z.; Zhang, G.; Li, Y.; Liu, Y. Failure prediction and optimization for composite pressure vessel combining FEM simulation and machine learning approach. Compos. Struct. 2024, 337, 118099. [Google Scholar] [CrossRef]
  29. Cho, S.M.; Kim, K.S.; Lee, S.K.; Jung, G.S.; Lee, S.K.; Lyu, S.K. Effect of dome curvature on failure mode of type4 composite pressure vessel. Int. J. Precis. Eng. Manuf. 2018, 19, 405–410. [Google Scholar] [CrossRef]
  30. Zu, L.; Koussios, S.; Beukers, A. Design of filament-wound isotensoid pressure vessels with unequal polar openings. Compos. Struct. 2010, 92, 2307–2313. [Google Scholar] [CrossRef]
  31. Sanz-Corretge, J.; Pham, T.D.; Trinh, L.; Leahy, P.G. Spectral method to determine the Tsai-Wu probability of failure of a composite laminate subjected to random vibrations. Compos. Part C Open Access 2025, 18, 100683. [Google Scholar] [CrossRef]
  32. Awad, M.; Khanna, R. Support vector regression. In Efficient Learning Machines: Theories, Concepts, and Applications for Engineers and System Designers; Apress: Berkeley, CA, USA, 2015; pp. 67–80. [Google Scholar]
  33. Wittek, P. Regression analysis. In Quantum Machine Learning; Academic Press: Cambridge, MA, USA, 2014; pp. 85–88. [Google Scholar]
  34. Schulz, E.; Speekenbrink, M.; Krause, A. A tutorial on Gaussian process regression: Modelling, exploring, and exploiting functions. J. Math. Psychol. 2018, 85, 1–16. [Google Scholar] [CrossRef]
  35. Williams, C.K.I.; Rasmussen, C.E. Gaussian Processes for Machine Learning; MIT Press: Cambridge, MA, USA, 2006. [Google Scholar]
  36. Breiman, L. Random forests. Mach. Learn. 2001, 45, 5–32. [Google Scholar] [CrossRef]
  37. Chen, T.; Guestrin, C. XGBoost: A scalable tree boosting system. In Proceedings of the 22nd ACM SIGKDD International Conference on Knowledge Discovery and Data Mining, San Francisco, CA, USA, 13–17 August 2016; pp. 785–794. [Google Scholar] [CrossRef]
  38. Goodfellow, I.; Bengio, Y.; Courville, A. Deep Learning; MIT Press: Cambridge, MA, USA, 2016. [Google Scholar]
Figure 1. Geometric parameters of the Type IV composite pressure vessel.
Applsci 16 07066 g001
Figure 2. Fiber orientation of hoop and helical layers: (a) 90° hoop layer, (b) +α°, and (c) −α° helical layers.
Applsci 16 07066 g002
Figure 3. Distribution of the Tsai–Wu failure index (IRF) in the Type IV composite pressure vessel.
Applsci 16 07066 g003
Figure 4. Predicted versus actual laminate counts obtained from LOOCV for five machine learning models: (a) SVR, (b) GPR, (c) RF, (d) XGBoost, and (e) MLP.
Applsci 16 07066 g004
Figure 5. Predicted versus actual laminate counts obtained from independent test dataset for five machine learning models: (a) SVR, (b) GPR, (c) RF, (d) XGBoost, and (e) MLP.
Applsci 16 07066 g005
Figure 6. Learning curves for five machine learning models: (a) SVR, (b) GPR, (c) RF, (d) XGBoost, and (e) MLP.
Applsci 16 07066 g006
Figure 7. Permutation feature importance of the input variables for the five machine learning models: (a) SVR, (b) GPR, (c) RF, (d) XGBoost, and (e) MLP.
Applsci 16 07066 g007
Table 1. Pressure vessel design parameters.
VariableSymbolValues (mm)
Liner radiusr30, 40, 50, 60
Liner lengthL220, 260, 300
Polar hole radiusrp8, 10, 12, 14, 16 1, 18 1
1 Applied only to liner radii of 50 and 60 mm, as larger radii require proportionally larger polar hole sizes for physically realistic configurations.
Table 2. Material properties of PA6.
PropertyValues
Young’s Modulus (MPa)1111
Poisson’s Ratio0.3499
Tensile Yield Strength (MPa)36.74
Tensile Ultimate Strength (MPa)71.89
Table 3. Material properties of carbon fiber/epoxy.
Property Values
Young’s Modulus X direction (MPa) E 1 209,000
Young’s Modulus Y, Z direction (MPa) E 2 = E 3 9450
Poisson’s Ratio XY, XZ v 12 = v 13 0.27
Poisson’s Ratio YZ v 23 0.4
Shear Modulus XY, XZ (MPa) G 12 = G 13 5500
Shear Modulus YZ (MPa) G 23 3900
Table 4. Hyperparameter search space and optimal values for each model.
ModelHyperparameterSearch SpaceOptimal Value
SVRC[0.1, 1, 10, 100]10
epsilon[0.001, 0.01, 0.1]0.001
gamma[scale, auto]auto
GPR-
RFn_estimators[50, 100, 200, 300]200
max_depth[3, 4, 5, 6, 7]6
min_samples_split[2, 3, 4, 5]2
XGBoostlearning_rate[0.01, 0.05, 0.1, 0.2]0.2
max_depth[3, 4, 5, 6, 7]5
n_estimators[50, 100, 200, 300]100
subsample[0.7, 0.8, 0.9, 1.0]0.8
MLPhidden_layer_sizes[(16, 8), (24, 12), (32, 16), (64, 32), (128, 64), (24, 24, 12), (32, 32, 16), (64, 64, 32)](24, 12)
activation[relu, tanh, logistic]relu
learning_rate_init[0.001, 0.01, 0.1]0.01
Table 5. LOOCV performance evaluation on training dataset.
ModelLOOCV (Training Set) Evaluation
R2RMSEMAEMAPE
SVR0.99070.39090.29782.54%
GPR0.9810.55770.43843.46%
RF0.98010.57030.47814.28%
XGBoost0.98940.41630.32632.71%
MLP0.98710.46040.37843.05%
Table 6. 5-fold performance evaluation on training dataset.
Model5-Fold (Training Set) Evaluation
R2RMSEMAEMAPE
SVR0.97940.58090.46353.86%
GPR0.98270.53190.41383.32%
RF0.97060.69380.58335.43%
XGBoost0.98620.47470.36023.08%
MLP0.98410.51060.37983.04%
Table 7. Performance evaluation on independent test dataset.
ModelTest Set Evaluation
R2RMSEMAEMAPE
SVR0.98660.57020.46185.90%
GPR0.98930.50930.28622.29%
RF0.99070.47530.3793.93%
XGBoost0.99130.46080.30882.90%
MLP0.99490.35300.25861.86%
Disclaimer/Publisher’s Note: The statements, opinions and data contained in all publications are solely those of the individual author(s) and contributor(s) and not of MDPI and/or the editor(s). MDPI and/or the editor(s) disclaim responsibility for any injury to people or property resulting from any ideas, methods, instructions or products referred to in the content.