Article

A Method for Detecting Multiple Types of Defects in Concrete Dams Based on an Improved YOLOv12 Model

College of Hydraulic Science and Engineering, Yangzhou University, Yangzhou 225009, China
*
Author to whom correspondence should be addressed.
Appl. Sci. 2026, 16(14), 6942; https://doi.org/10.3390/app16146942
Submission received: 5 June 2026 / Revised: 26 June 2026 / Accepted: 3 July 2026 / Published: 10 July 2026

Abstract

Accurate detection and characterization of surface defects in concrete dams is vital for ensuring safe operation. To address the limitations of existing research focused solely on cracks and the challenges traditional convolutional networks face in adapting to deformation and multiscale features, this study introduces DCN-YOLO, a deformable convolution-augmented framework for the simultaneous detection and classification of multiple defect types from UAV-acquired imagery. The model outputs bounding box localizations and categorical labels. Based on YOLOv12, this proposed model integrates DCNv4 deformable convolutions with the C3k2 module. By leveraging adaptive sampling offsets and dynamic modulation, the proposed model enhances geometric modeling for irregular defects, improving the detection of small and medium defects while achieving an acceptable trade-off in inference efficiency. To address multiple defect coexistence, we adopt Binary Cross-Entropy (BCE) loss to decouple classification and localization, improving training stability in multi-label scenarios. A Multi-defects dataset was created using UAV images, and performance was validated on the CrackSeg public dataset. The proposed model achieved 77.4% ± 0.2% overall precision under complex conditions, exceeding the YOLOv12l baseline by 7.1% and improving mAP50-95 by 4.2%. It demonstrated competitive performance in detecting cracks, aggregate exposure, and construction joints, thereby providing a potentially robust and efficient approach for intelligent inspection of concrete dam surface defects.

1. Introduction

Concrete dams are critical facilities in modern water conservancy engineering, serving core functions such as flood control, flow regulation, hydropower generation, and water resource allocation [1]. As a vital component of the national water network, concrete dams have a wide-reaching impact; should a failure occur, it would precipitate catastrophic human casualties and extensive destruction of downstream infrastructure and economic assets [2]. During the normal service life of a concrete dam, various defects may develop in the dam body due to thermal stress, load effects, hydrochemical attack, and the inherent properties of the concrete, cracks and aggregate exposure being the most common [3].
The formation of cracks in concrete dams is governed by a complex interplay of thermal, hygral, and mechanical processes during the early-age and long-term service stages. During the hydration of cement, the exothermic reaction generates substantial heat within the massive concrete structure, The low thermal conductivity of concrete impedes rapid heat dissipation to the surroundings [4]. As the core temperature rises significantly above the ambient temperature, the subsequent cooling phase induces thermal contraction. When this contraction is restrained—either internally by temperature gradients across the cross-section or externally by the foundation or adjacent structural elements—tensile stresses accumulate. Concurrently, autogenous shrinkage arising from self-desiccation during cement hydration, together with drying shrinkage due to moisture loss to the environment, further contributes to volumetric contraction [5]. Although tensile creep provides partial stress relaxation, the rate of stress development often outpaces the gain in tensile strength of the still-maturing concrete. Once the accumulated tensile stress exceeds the time-dependent tensile capacity, cracking initiates. These early-age thermal-shrinkage cracks, initially microscopic, can propagate over time under the combined effects of sustained loading, cyclic temperature variations, and chemical deterioration, ultimately evolving into macroscopic pathways that compromise structural integrity and facilitate seepage. Recent advances in computational modeling have enabled more accurate prediction of this stress evolution; for instance, deep learning-based sequential learning frameworks have been applied to forecast early-age concrete stress development, bridging the gap between structural mechanics and intelligent monitoring methodologies [6]. Furthermore, investigations into creep-damage coupling have revealed that sustained high stress levels at early ages accelerate microcrack propagation, highlighting the critical importance of early detection and intervention [7].
Furthermore, construction joints in concrete dams are essential structural features but also represent critical weak points. During the dam’s service life, seepage or cracks are prone to develop at these joints; if left unmonitored, this could lead to serious accidents. Therefore, real-time monitoring of various defects in concrete dams is a crucial aspect of their operation and maintenance.
Traditional dam safety monitoring has primarily relied on manual inspection, which, although widely used, has achieved limited effectiveness. However, manual inspection is associated with issues such as excessive safety risks, significant time consumption, high labor and material costs, and low efficiency [8]. Given the complex operating environment of concrete dams, where various defects overlap and transform into one another, manual inspection is prone to misjudgments [9]. To systematically evaluate the structural integrity state of visible distress manifestations on concrete dam surfaces, advanced monitoring instruments such as optical fibers [10], strain gauges [11], and piezoelectric aggregates [12] have been deployed. Despite the proliferation of high-precision sensing apparatus for concrete defect detection, existing methodologies predominantly remain confined to controlled indoor environments, leaving their efficacy under uncontrolled field conditions, such as large-scale dam surfaces and largely unverified [13]. Due to the massive scale of dam structures, the costs of manually installing, embedding, and maintaining sensors are prohibitively high. Furthermore, the complex environmental conditions during dam construction and normal operation, coupled with numerous external influencing factors, mean that sensors can only determine the approximate location of defects. It is difficult to pinpoint the exact coordinates of defects, resulting in ambiguous information during engineering operation and maintenance, as well as low long-term survival rates of sensors. Consequently, the potential for saving manpower and material resources is limited, and the practicality of these methods in real-world scenarios is poor, consequently impeding their adoption in basin-wide dam surface inspection protocols. Accordingly, the formulation of computationally efficient and economically viable multi-defect inspection frameworks has emerged as a pressing research imperative within the domain of hydraulic infrastructure structural health monitoring.
The operational capabilities of unmanned aerial vehicles (UAVs) and aerial photography technology have expanded substantially, deployment costs have decreased significantly, leading to their widespread application in the health monitoring of hydraulic structures. UAVs can quickly acquire high-resolution imagery, effectively supporting the early identification of surface defects such as cracks and exposed aggregate. Previous studies have utilized them for crack detection in large-scale concrete structures [14,15]. He et al. [16] reviewed UAV-based sensors for power system inspection, covering imaging (visible, IR, UV, depth, compound-eye) and non-imaging (LiDAR, radar, vibration/acoustic, ultrasonic, X-ray, gas, magnetic) types, with their principles, targets, ranges, and applications. They also identified trends—multi-sensor fusion, edge AI, UAV clustering, cloud platforms, and collaborative unmanned systems—and emphasized that deep integration of multi-sensor fusion and AI is critical for intelligent automation. Morgenthal et al. [17] proposed a comprehensive framework for automated UAS-based structural condition assessment of bridges, encompassing flight planning, image acquisition, 3D reconstruction, and damage detection. This framework integrates Structure-from-Motion (SfM) photogrammetry with machine learning-based defect classification, enabling millimeter-level crack detection and geometric quantification. The methodology has been validated on multiple bridge structures across Germany, demonstrating the operational feasibility of end-to-end autonomous inspection workflows. Their work represents one of the most complete European contributions to UAV-based structural health monitoring, bridging the gap between aerial data acquisition and engineering decision support [18]. Regarding data accuracy, Zhao et al. [19] proposed an image-to-BIM registration method for concrete dams, controlling positioning errors to the sub-meter level and enabling precise defect localization in complex hydraulic structures. Zhao et al. [20] addressed the challenge of missing control points in emergency monitoring by optimizing the Ground Control Point (GCP) deployment strategy. To address the scarcity of underwater inspection data, Huang et al. [21] used a CycleGAN model to convert above-water crack images into underwater-style images, providing a data foundation for intelligent underwater concrete damage detection. At the inspection system level, Chen et al. [22] proposed a “parent-child” collaborative robot architecture and a three-tier progressive visual inspection system, integrating digital twin technology to achieve millimeter-level defect identification and closed-loop control in ultra-long-span tunnels; and Villarino et al. [23] developed a comprehensive UAV inspection methodology covering flight planning, data acquisition, and damage identification, providing a systematic framework for automated inspections of hydraulic structures. In summary, unlike conventional manual inspection that relies on scaffolding and close-range photography, UAV-based acquisition enables non-contact surveying of dam surfaces under complex topographic constraints. In the context of concrete dam safety monitoring, the integration of UAV photogrammetry with defect detection algorithms offers a dual advantage: millimeter-level spatial resolution from low-altitude tilt photography, and automated identification of multiscale damages through deep feature extraction. This study leverages UAV platforms specifically for capturing textured surfaces of massive hydraulic structures, where accessibility and safety limitations render traditional methods impractical. This study also utilizes UAV technology as the fundamental platform for data collection.
Artificial intelligence (AI) technology has achieved significant breakthroughs in recent years, and deep learning (DL) [24] has been widely applied in the field of building defect detection, demonstrating competitive performance [25,26,27]. Bazrafshan and Ebrahimkhanlou [28] demonstrated that machine learning models remain effective at detecting AI-generated images, with unsupervised methods proving more practical in real-world scenarios where the type of generative model is unknown. Early applications of deep learning to concrete crack detection demonstrated the superiority of learned features over hand-crafted descriptors. Paal et al. [29] proposed a machine-vision framework for automated post-earthquake RC column damage assessment, combining edge-based detection, percolation crack analysis, and entropy–CMYK spalling segmentation to quantify ATC-20 damage states (D0–F6). Tested on 50 images, it achieved 88.5% classification and 79.04% mechanism identification accuracies, enabling rapid post-disaster structural evaluation. Building upon quality assessment foundations. Chen and Jahanshahi [30] proposed NB-CNN, a hybrid framework that fuses convolutional neural network features with Naïve Bayes classification to enhance detection robustness under variable illumination and surface textures. Their work established the feasibility of CNN-based approaches for automated infrastructure inspection, paving the way for subsequent end-to-end detection architectures. Dorafshan et al. [31] conducted a comprehensive benchmarking of deep convolutional neural networks against classical edge detectors (Canny, Sobel, LoG) on the SDNET2018 dataset, demonstrating that CNN architectures achieve 20–40% absolute improvement in F1-score while exhibiting substantially greater robustness to noise and illumination variations. Their findings established the empirical foundation for the widespread adoption of deep learning in subsequent infrastructure inspection research. Bhowmick et al. [32] proposed an automated framework for crack detection and quantification on concrete structures using unmanned aerial vehicles (UAVs) equipped with vision systems and deep learning algorithms, addressing the limitations of conventional manual inspection methods that are time-consuming, error-prone, and incapable of accessing inaccessible regions of large-scale structures. Bazrafshan et al. [33] were the first to establish an objective, reproducible mapping from surface crack images to code-compliant stiffness reduction factors, thereby eliminating the typical crack pattern comparison process in FEMA 306 that relies on inspectors’ subjective judgments and providing a scalable decision-support tool for rapid post-earthquake structural assessment.
Regarding the task of detecting surface defects in concrete dams, current literature has primarily emphasized optimizing network architectures and integrating multiscale features. Li et al. [34] constructed a dedicated dataset, employed a deep residual network (ResNet50), and designed a partial-layer fine-tuning strategy combined with transfer learning and Gradient-Weighted Activation Maps (GradCAM) to significantly enhance the model’s adaptability and generalization performance on concrete dam images. Su et al. proposed a novel deep separable convolutional network (MODSConv) that preserves original channel information, designed the first Coordinate Attention (DAF-CA) that simultaneously integrates mean and saliency information to facilitate the detection of fine cracks, constructed the GRF-SPPF module to significantly reduce false positive rates under lighting and blur conditions, and proposed that the MODSNet backbone and MODL-Head decoupled head can maintain a unified feature dimension that is universally applicable within the YOLO architecture [35].
The YOLO series of models is widely used image detection models today. Pang et al. [36] were the first to integrate the Content Guided Block + iPSA + ADWConv architecture into the YOLOv9 framework to construct an efficient, multi-module feature extraction system. This improved YOLOv9 for multi-defect video tracking in engineering scenarios, achieving a favorable trade-off among accuracy, parameter efficiency, and floating-point operations per second (FLOPs). Zhou et al. [37] employed a multi-module collaborative approach combining VanillaNet, BiFPN, and a newly added P2 small-object detection layer to enhance the detection capability of small objects (such as bubbles and fine cracks in sealant) on glass curtain walls, thereby resolving the long-standing bottleneck in small-object recognition within the YOLO series. Zhang et al. [38] proposed CR-YOLO, a deep modification of YOLOv4 based on a lightweight PSPNet + PAM architecture, making it better suited for features such as narrow, low-contrast, and high-noise cracks. They constructed the first two-stage “detection-segmentation” framework for bridge cracks, first performing rapid localization followed by precise contour extraction to ensure engineering applicability.
In 2023, Zhao [39] proposed RT-DETR (Real-Time Detection Transformer), the first end-to-end Transformer-based detector to incorporate an attention mechanism architecture to achieve real-time performance. This model surpassed the trade-offs in speed and accuracy observed in the YOLO series of that time, providing a new technical paradigm for real-time object detection. In summary, with the advancement of attention mechanism technology, attention mechanisms have endowed networks with dynamic feature selection capabilities by explicitly modeling the interdependencies among features, effectively addressing the shortcomings of CNNs in terms of global context awareness and focusing on key regions. In recent years, the integration of attention mechanisms with CNNs has become increasingly tight. YOLOv12 [40] achieved further performance improvements by introducing regional attention (Region Attention), significantly enhancing the model’s robustness in complex scenes while maintaining the hardware-friendliness of convolutional operations. This version also serves as the foundation for the research in this paper.
In summary, research on the safety monitoring of concrete dams currently faces several key challenges. Due to the complex operating environment of concrete dams, the dam body often exhibits multiple types of damage and defects simultaneously, such as cracks, aggregate exposure, and construction joints. Furthermore, because these defects vary in their formation mechanisms and evolution patterns, they exhibit significant differences in their spatial distribution. Traditional monitoring methods rely on sensors embedded within the dam body, making it difficult to meet the demands for large-scale, high-efficiency monitoring. In contrast, visual monitoring methods based on UAV technology offer significant advantages such as mobility, flexibility, cost-effectiveness, and wide coverage. These methods can save substantial construction and maintenance costs and have become an important direction for the development of concrete dam safety monitoring. Furthermore, although deep learning methods have made significant progress in this field, existing research still faces severe challenges in practical engineering applications. On the one hand, while classification and segmentation methods based on convolutional neural networks can locate cracks, most studies are limited to the analysis of cracks as a single defect. There is a lack of focus on the ability to detect multiple defect categories simultaneously, making it difficult to adapt to the complex conditions where multiple damages coexist within the dam body. On the other hand, the local connectivity characteristics of traditional convolutional neural networks limit their ability to model long-range dependencies. Furthermore, since they treat features across all spatial locations and channels identically, they struggle to adapt to the non-uniform distribution of surface defects and the multiscale deformation characteristics of concrete dams.
Existing quantitative assessment frameworks predominantly focus on single defect types—particularly cracks—due to the complexity of multi-class feature interactions. Momeni and Dolatshahi [41] confined their analysis to crack patterns in RC shear walls, acknowledging that aggregate exposure and construction joint deterioration introduce additional confounding variables. The multi-defect detection capability of DCN-YOLO addresses this gap by simultaneously identifying cracks, exposed aggregate, and construction joints, providing a comprehensive feature set for future development of multi-modal damage index models that account for synergistic defect interactions.
To address the shortcomings of existing concrete dam defect detection methods in terms of multi-object collaborative recognition and small-scale target detection, we propose an improved YOLOv12 multi-defect detection model tailored for UAV aerial imagery. This model achieves simultaneous detection and classification of multiple types of surface defects on the dam body through a single forward inference, significantly enhancing the operational efficiency and engineering practicality of surface defect inspections. To further enhance the model’s ability to characterize small-scale surface defects on concrete dams, we introduce Deformable Convolutional Networks (DCNs). Through adaptive sampling point shifts and dynamic modulation mechanisms, the model’s geometric modeling capabilities for irregularly shaped surface defects are strengthened, effectively mitigating the issue of missed detections under complex conditions. This approach achieves a dual improvement in both detection accuracy and robustness for surface defect detection on concrete dams in complex scenarios.
The main content and contributions of this study are as follows:
(1) We introduce Deformable Convolution Network v4 (DCNv4) into the YOLO series of backbone networks. By dynamically learning offsets and modulation scalars, it enables the sampling points of the convolutional kernels to conform to the geometric contours of the objects. This addresses the limitations of traditional convolutional operations, which are constrained by fixed geometric structures and lack adaptability in sampling positions when dealing with object deformations, scale changes, and dense occlusions, thereby alleviating the sampling rigidity issue of traditional convolutions in geometrically deformed scenarios.
(2) Through extensive ablation and comparative studies, this paper investigates the impact of operator insertion positions and quantities on the model’s robustness and generalization capabilities, identifies model improvement strategies, and selects the model best suited for multi-defect object detection tasks.
(3) Building on the above research, we propose a method based on UAV for detecting multiple defect types in concrete dams. We use concrete dams under complex conditions as the detection scenario—including oblique views, overexposed scenes, and blurry backgrounds—to evaluate the model’s capabilities. Experimental results demonstrate that our model achieves superior performance compared to single-defect detection methods when addressing multi-defect detection tasks.

2. Methodology

2.1. Research Framework

We used drones to identify surface defects in concrete dams and establish the Multi-defect dataset. Using image detection techniques, a multi-object defect detection model based on YOLOv12 was developed. By incorporating the variable convolutions of DCNv4 into the C3k2 module of the YOLO series, accurate detection of surface defects in concrete dams was achieved. The specific workflow is shown in Figure 1. The detailed procedure is outlined as follows:
(1) Image acquisition. First, a drone was used to capture images of the dam surface, resulting in raw images with dimensions of 4056 × 3040. Next, to meet the training requirements of the image detection model, the raw images were cropped into smaller 512 × 512 images.
(2) Database Construction. Images containing various defects were selected. These were first divided into training, test, and validation sets in an 8:1:1 ratio. After processing—including image enhancement, horizontal flipping, and rotation—the images were manually annotated using the LabelMe annotation software v5.8.3 to identify the types of defects and their locations. During the annotation process, some images were manually excluded due to poor quality, resulting in a final image ratio of 67:17:17. The annotated images obtained through these steps were then filtered and organized for use in model training and result analysis.
(3) Module validation. By combining DCNv4 with the C3k2 operator, we constructed the C3k2_DCNv4 operator. We then inserted the C3k2_DCNv4 operator into layers P2 and P3 of the YOLOv12 model to build the DCN-YOLO model. We trained the model using the training set, and performed predictions on the test and validation sets. The results were used to validate the module’s effectiveness. To demonstrate the superiority of the added module, we included C3k2-GroupMamba, A2C2f-CGLU-DYT, and a P2 small-object detection layer for comparative analysis.
(4) Performance Evaluation. To comprehensively evaluate the performance of the proposed model, YOLOv10l, YOLOv12l, Faster R-CNN, and FCOS were selected as comparison models. A multi-model prediction analysis was conducted using our self-built Multi-defect dataset and the CrackSeg dataset. Based on the prediction results of each model, the optimal detection model was identified to validate the effectiveness of defect extraction and annotation, as well as the superiority of the proposed DCN-YOLO model.

2.2. Theoretical Approach

2.2.1. YOLOv12

The transition from region-proposal-based two-stage detectors (exemplified by Faster R-CNN [42]) to unified single-shot architectures was initiated by Redmon et al. [43] through the debut of You Only Look Once (YOLO) in 2015. Over the ensuing decade, this architectural lineage has undergone progressive refinement via the assimilation of successive technical innovations [44], encompassing Cross-Stage Partial Networks (CSPNet) [45,46], C2f modules [47], Generalized Efficient Layer Aggregation Networks (GELAN) [48,49], NMS-free training paradigms [50], and C3k2 bottlenecks [51]. These cumulative enhancements have collectively endowed YOLO variants with the capacity for high-throughput, high-fidelity object detection at markedly reduced computational cost.
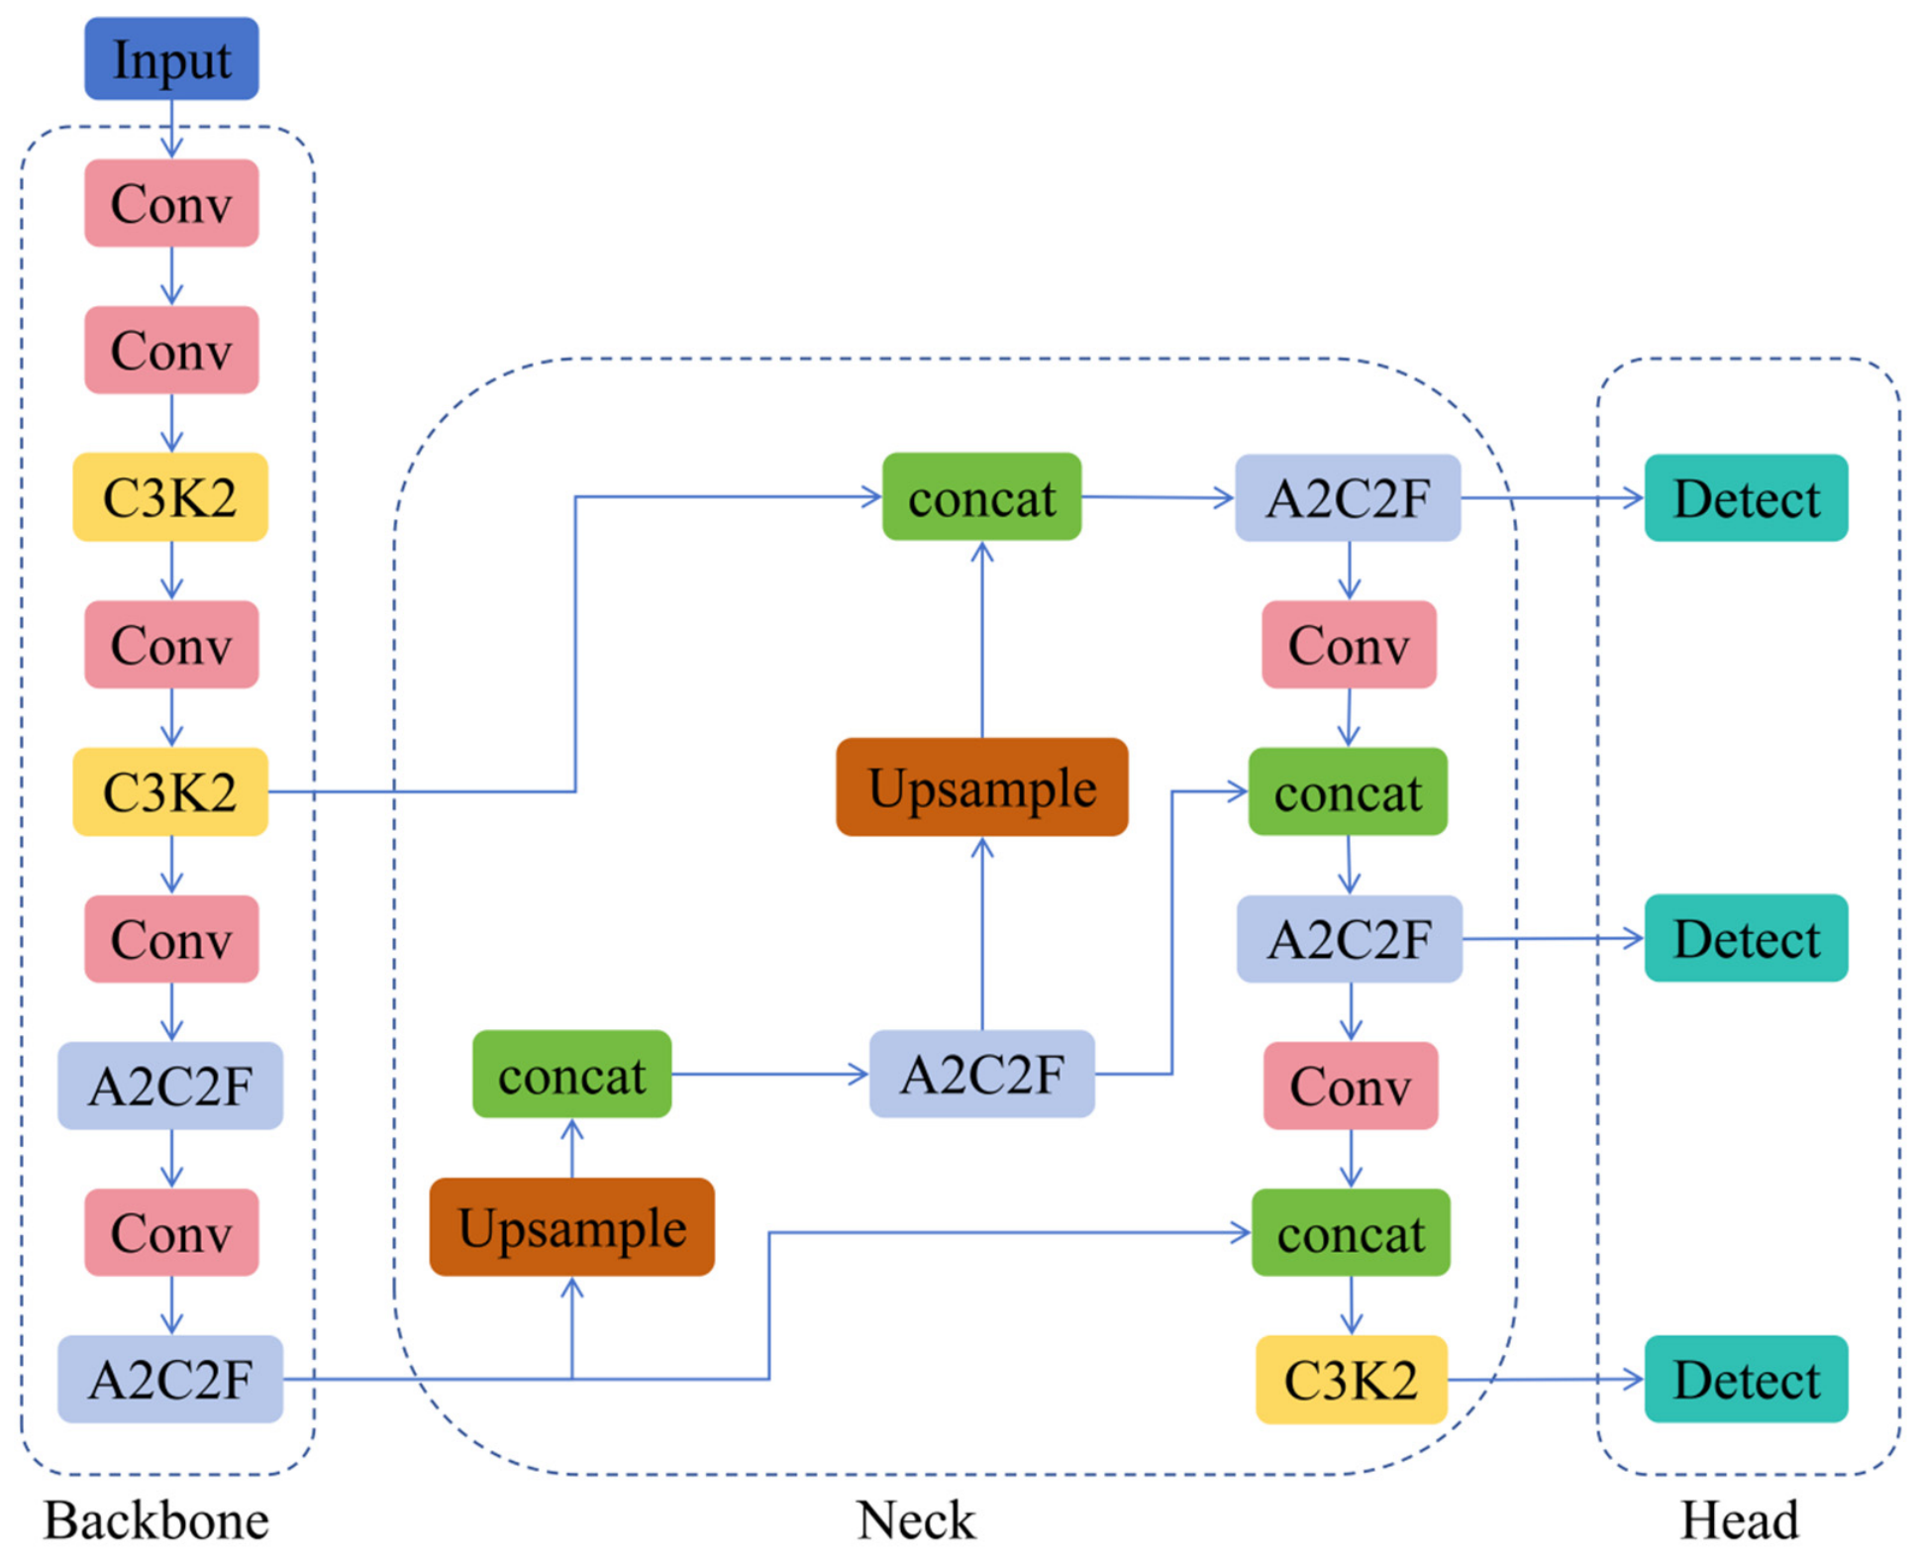
More recently, Tian et al. [41] advanced this trajectory with YOLOv12 (2025), which preserves the canonical three-part topology, backbone, neck, and head, while embedding Area Attention (A2) modules and Residual Efficient Layer Aggregation Networks (R-ELAN). This configuration achieves superior detection accuracy relative to antecedent versions without incurring the latency penalties typically associated with attention mechanisms, as depicted schematically in Figure 2.
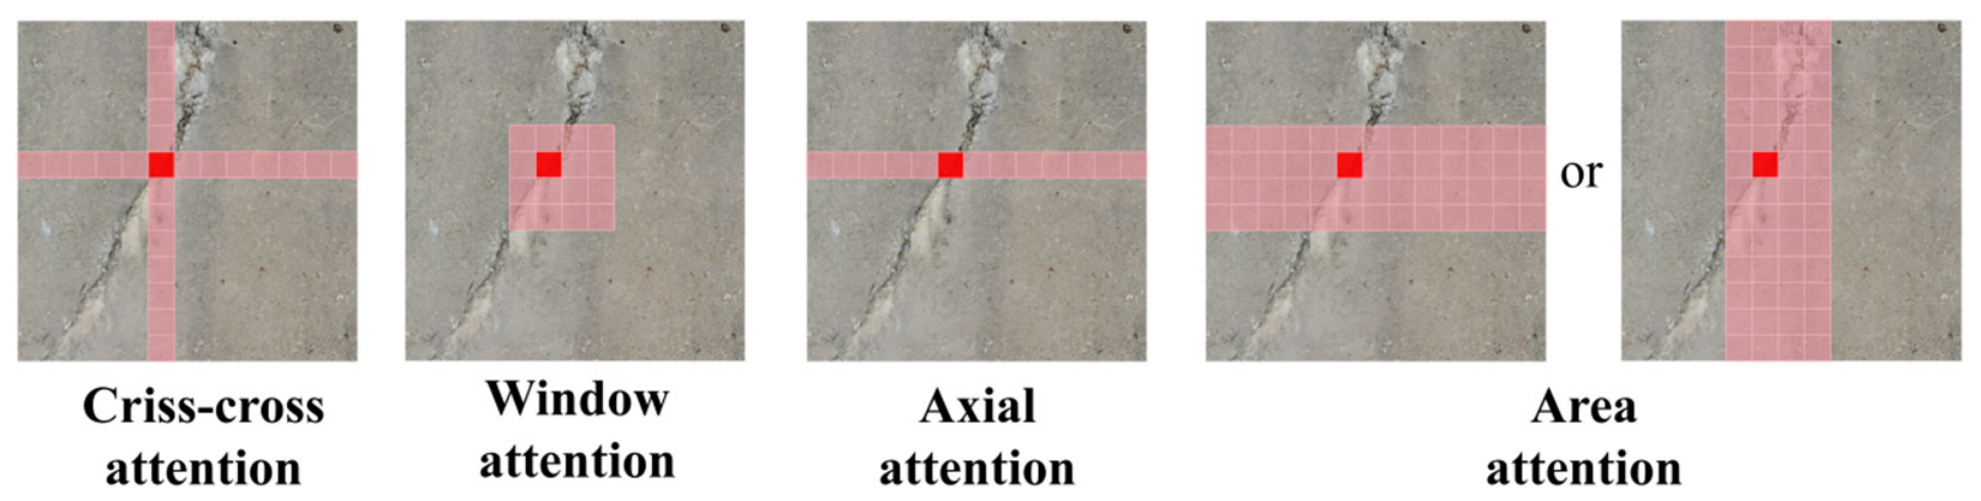
To address the computational bottleneck of global self-attention in high-resolution dam imagery, YOLOv12 adopts a regional attention mechanism that partitions feature maps along a single spatial axis. Rather than computing pairwise interactions across the full (H, W) resolution, the module processes horizontal or vertical strips sequentially, reducing the quadratic complexity to linear while preserving receptive field coverage. For concrete surface inspection, this design is particularly relevant because dam defects (cracks, joints) typically exhibit elongated aspect ratios that align with strip-wise feature aggregation. Figure 3 compares Area Attention with several representative local attention mechanisms currently in use. This eliminates the need for explicit windowing and requires only a simple reshaping operation, thereby achieving faster processing speeds. It addresses the issues of global dependency degradation [52], instability [53], and distribution sensitivity [54] found in traditional linear attention, as well as the low-rank bottleneck [53,55]. However, when applied to YOLO with an input resolution of 640 × 640, it offers only limited speed advantages.
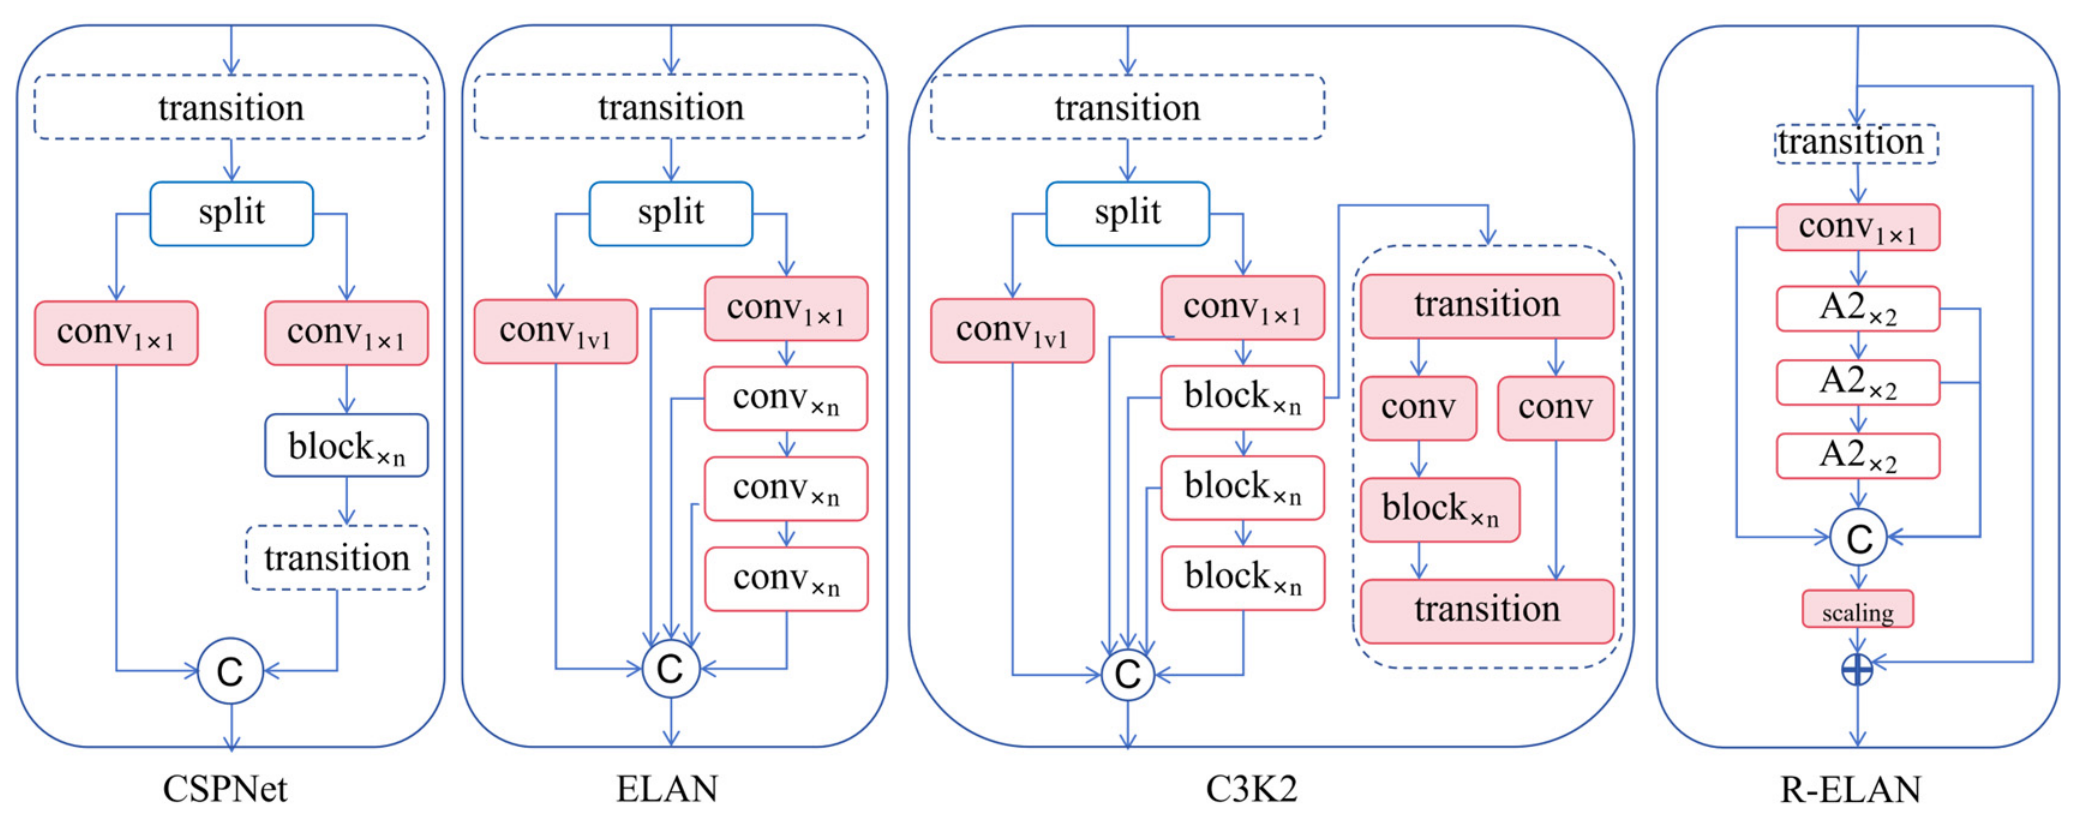
R-ELAN was formulated to rectify the vanishing gradients and missing residual connectivity observed in standard ELAN [56] architectures, deficiencies that become critical when training deep networks on high-resolution concrete dam imagery. By embedding input-to-output shortcuts scaled at 0.01 throughout each block, the architecture stabilizes the optimization trajectory even in attention-gated configurations where training dynamics are inherently volatile. A dimensionality adaptation layer first condenses the channel space to produce a consolidated feature representation, which then propagates through stacked blocks in a bottleneck topology. Figure 4 schematically contrasts this construction with prevailing alternatives; the approach sustains robust feature aggregation while lowering computational expenditure and memory allocation, rendering it viable for UAV-deployed inspection tasks.

2.2.2. DCNv4

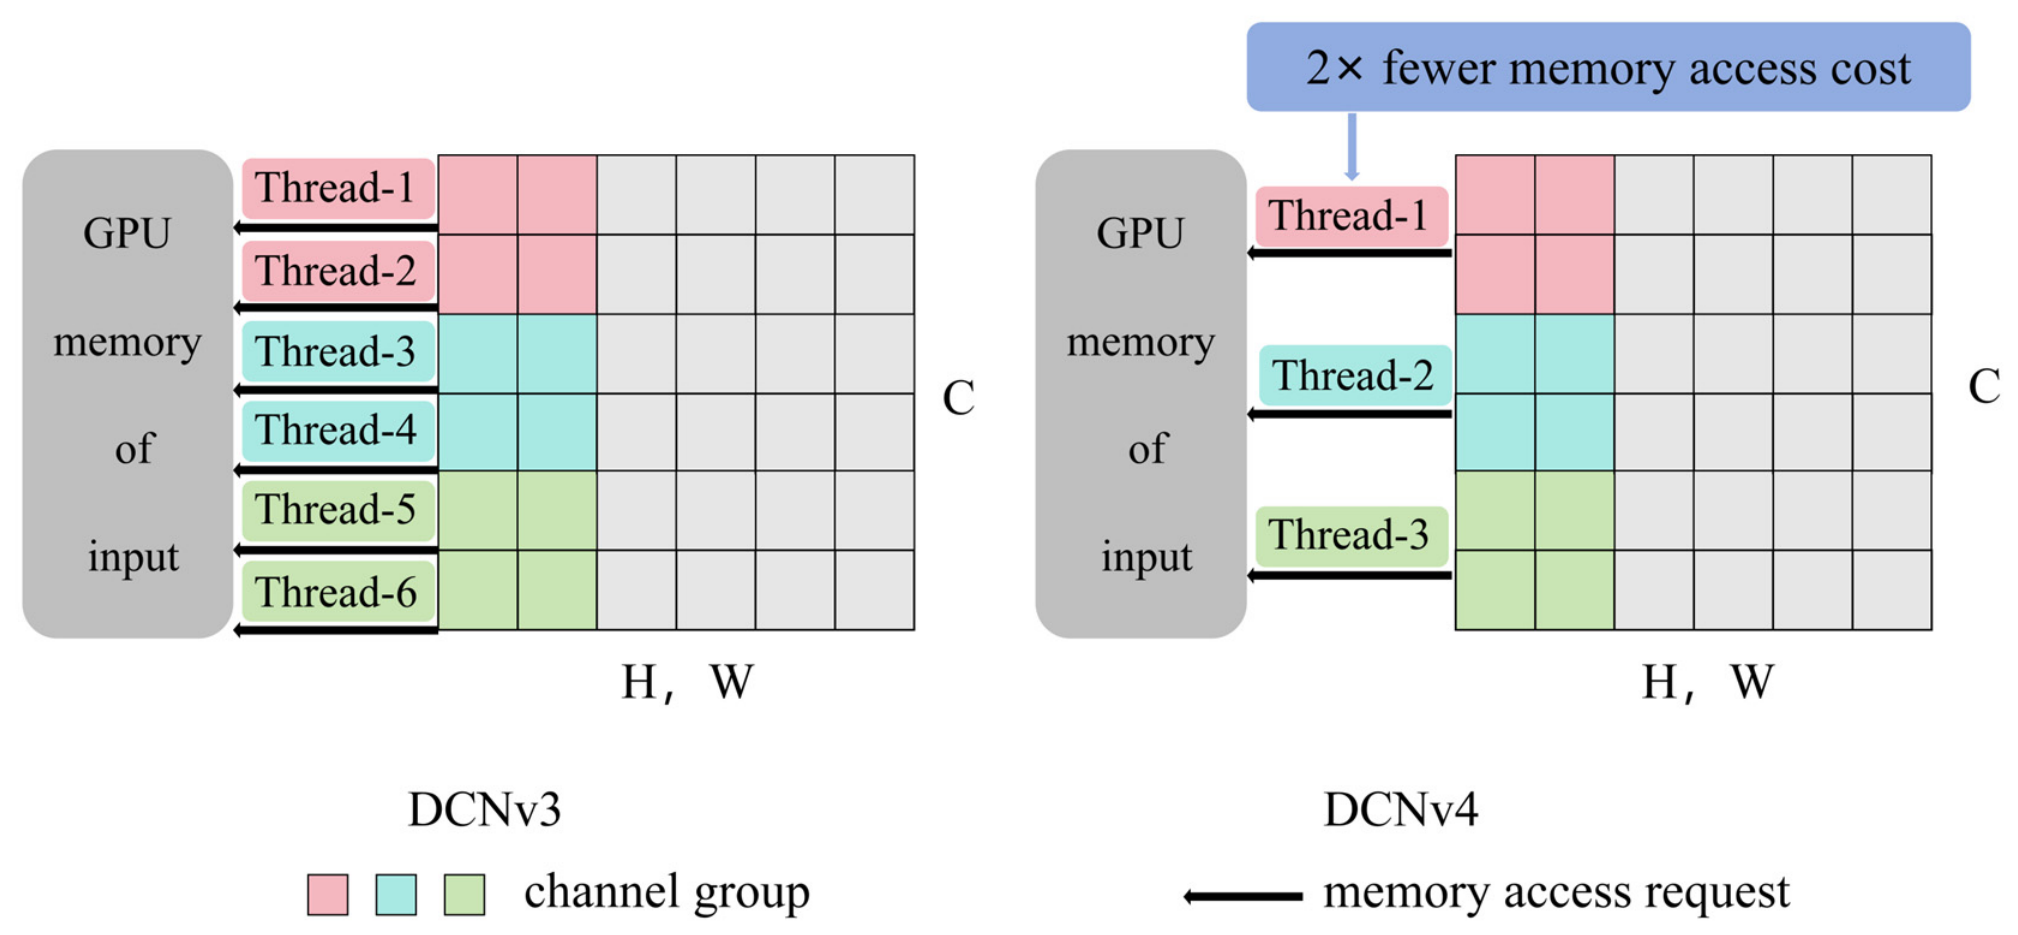
Rigid grid sampling is an inherent assumption of standard convolution [57], but it leads to difficulties in adapting to geometric changes such as scale, pose, and part deformation. The dynamic sampling mechanism is a major innovation in Deformable Convolutional Networks. By introducing learnable offsets for each sampling position, DCNs allow the sampling positions of convolutional kernels to deform, thereby achieving a “content-adaptive” receptive field. This technique was first proposed in 2017 [56], but earlier versions (v1–v3) [58,59,60] suffered from either insufficient dynamic range or heavy memory access overhead.
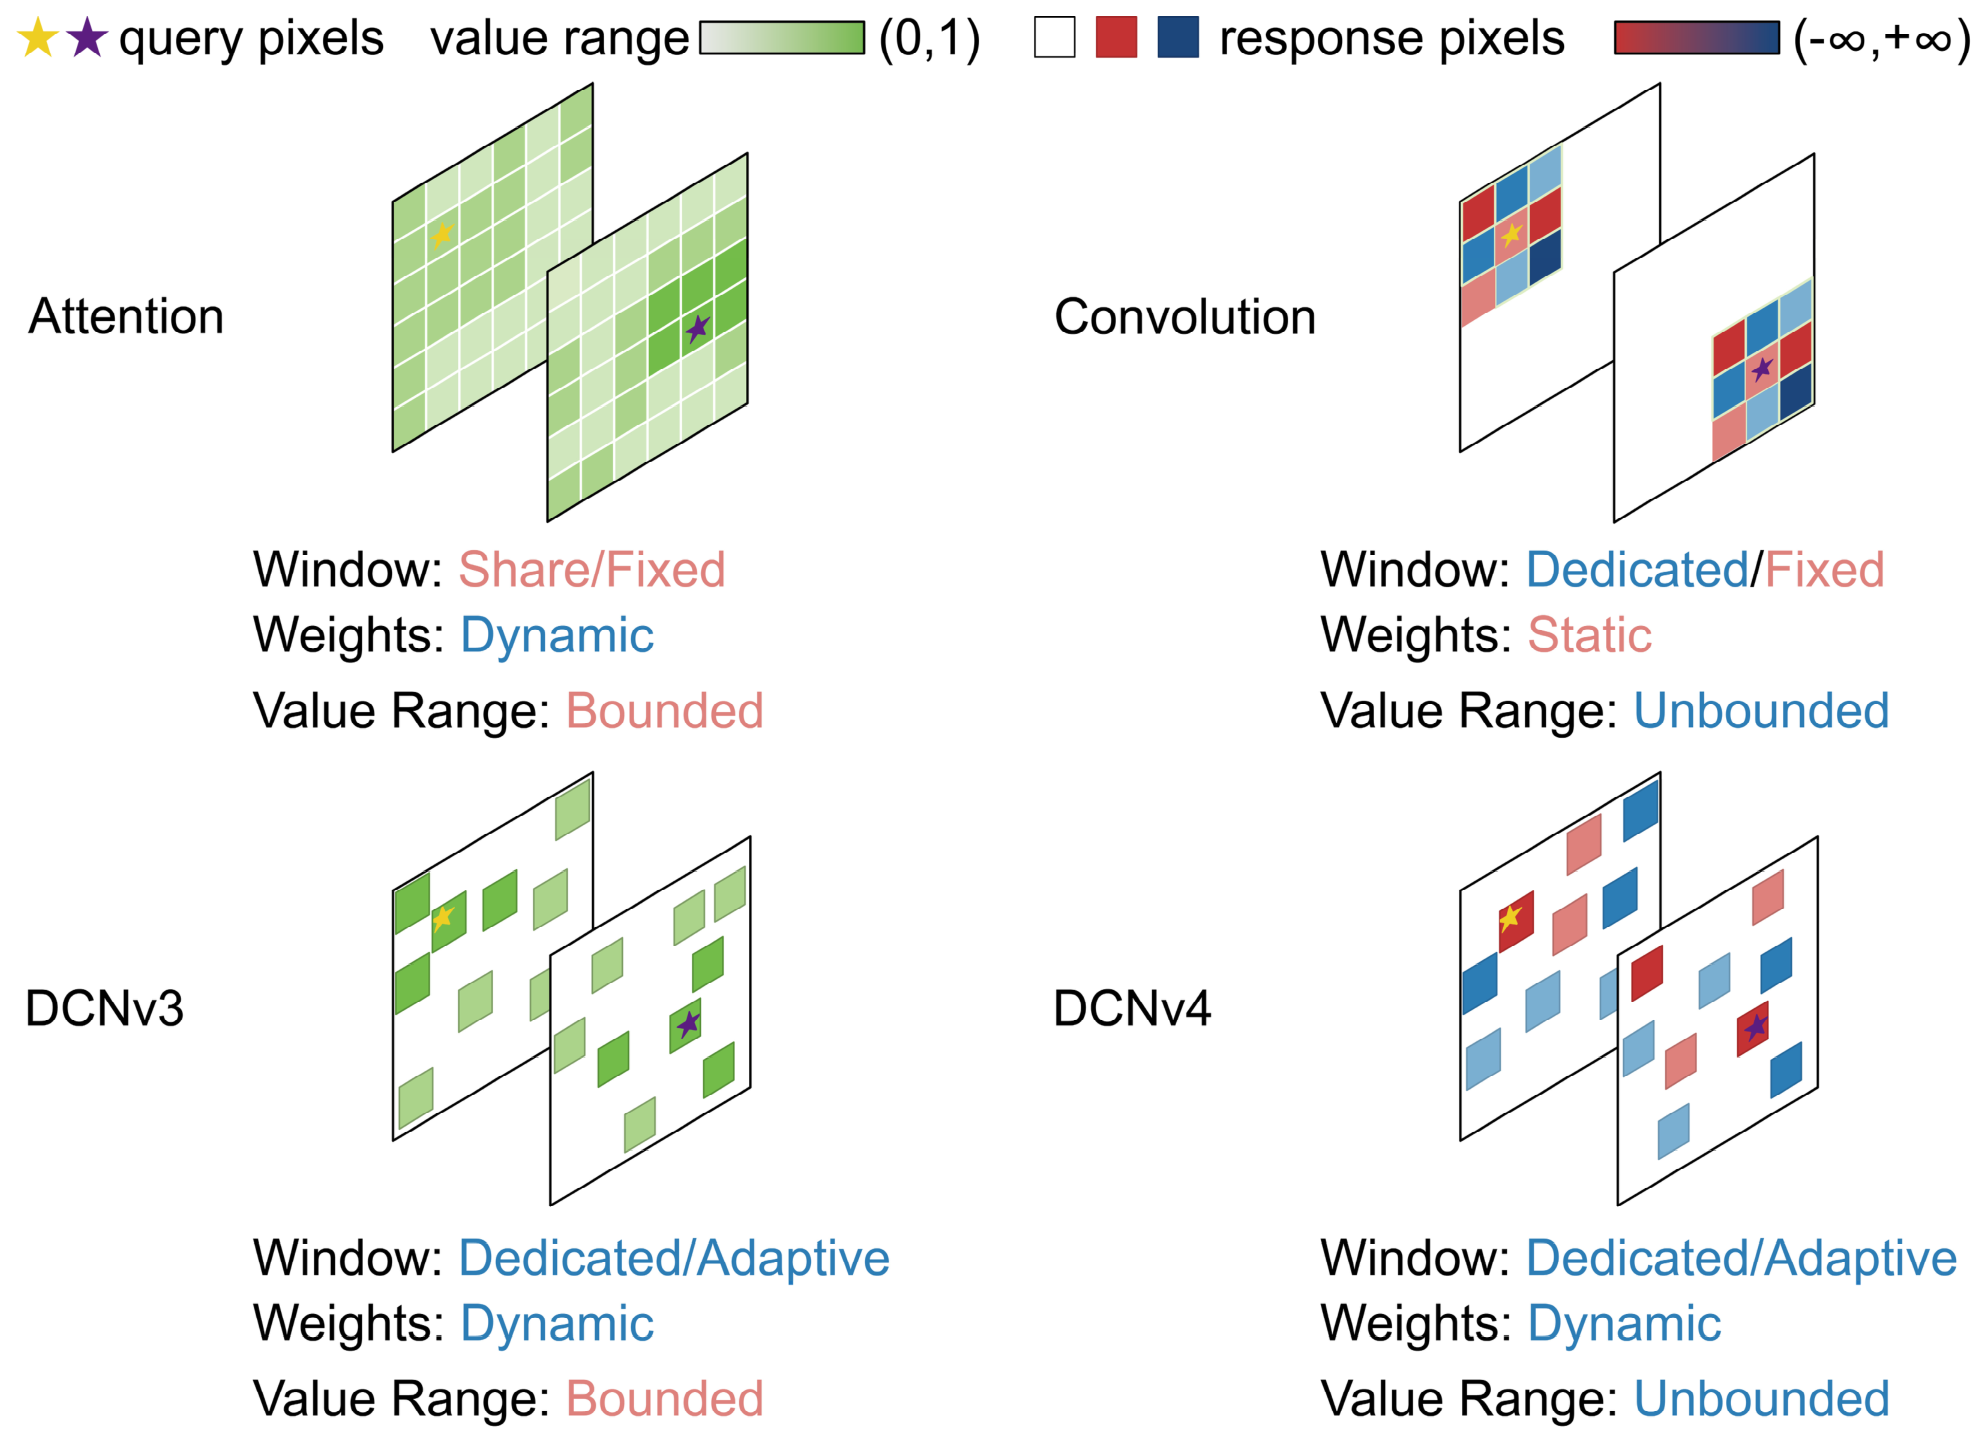
To accommodate the geometric variability of concrete dam surface defects (e.g., curved cracks and irregular aggregate boundaries), the aggregation mechanism must satisfy three criteria simultaneously: receptive field adaptivity, input-dependent weighting, and unconstrained response magnitude. As illustrated in Figure 5, attention fulfills only the second criterion via shared fixed windows with dynamic yet Softmax-gated (bounded) weights. Convolution offers dedicated fixed windows and unbounded responses, but its weights are input-agnostic. DCNv3 achieves adaptive windows and dynamic weighting, yet still constrains values to a bounded range. DCNv4 uniquely satisfies all three criteria simultaneously among the variants compared—adaptive dedicated windows, dynamic weights, and an unbounded value range—making it inherently suitable for non-rigid deformations in dam imagery.
The DCNv4 [61] study found that convolutional weights do not need to be normalized, whereas Softmax actually limits expressive power and slows convergence. Therefore, the v4 revision streamlines this operator by unifying offset prediction and weight modulation within a single linear projection, eliminating intermediate normalization layers. Figure 6 illustrates the effectiveness of these optimizations. Memory access is significantly improved through a contiguous memory layout, vectorized loading of memory instructions, and half-precision support, which substantially enhances memory bandwidth utilization. Consequently, the receptive field adapts to non-rigid deformations without the latency penalty critical for real-time UAV inspection.

2.2.3. Binary Cross-Entropy Loss

The BCE loss function [62] is commonly used in binary classification tasks. It naturally supports scenarios where a single object can have multiple labels, making it well-suited for the multi-object detection application described in this paper. The YOLO series of detection heads ultimately outputs C independent sigmoid scores, which are isomorphic to the sigmoid activation in BCE. This eliminates the need for an additional Softmax layer, reduces one exponential operation, and not only speeds up processing but also minimizes quantization error; In the task of detecting surface defects in concrete structures, the three target categories—cracks, exposed aggregate, and construction joints, exhibit extreme foreground-background imbalance, and require high-precision edge localization. These three types of defects may coexist in the same image or be absent simultaneously.
l n = ( y n × log ( z n ) + ( 1 y n ) × log ( 1 z n ) )
Here, y n represents the label value, z n represents the predicted value, and l n represents the loss value for each label.
BCE treats each class as an independent Bernoulli distribution, allowing the output vector to contain multiple 1s simultaneously, and thus naturally supports multi-label learning; whereas traditional Softmax-Cross-Entropy forces a single label, which contradicts the reality that defects coexist. Furthermore, for various types of defects, background pixels in concrete images often account for a much larger proportion than the defect pixels themselves. Even when positive samples are scarce, this approach can still provide a constant non-zero gradient for positive examples, thereby preventing gradient vanishing; Since BCE only supervises “presence” rather than “exact pixel values,” it decouples the localization sub-task (handled by L1 regression/Loss) from the classification sub-task, preventing the classification loss from excessively penalizing boundary shifts and thereby accelerating training convergence. In summary, this paper selects BCE rather than multi-class cross-entropy, providing the optimal choice for multi-object detection of concrete defects due to its mathematically concise form, stable gradients, and ease of engineering deployment.

2.2.4. Improved C3k2_DCNv4

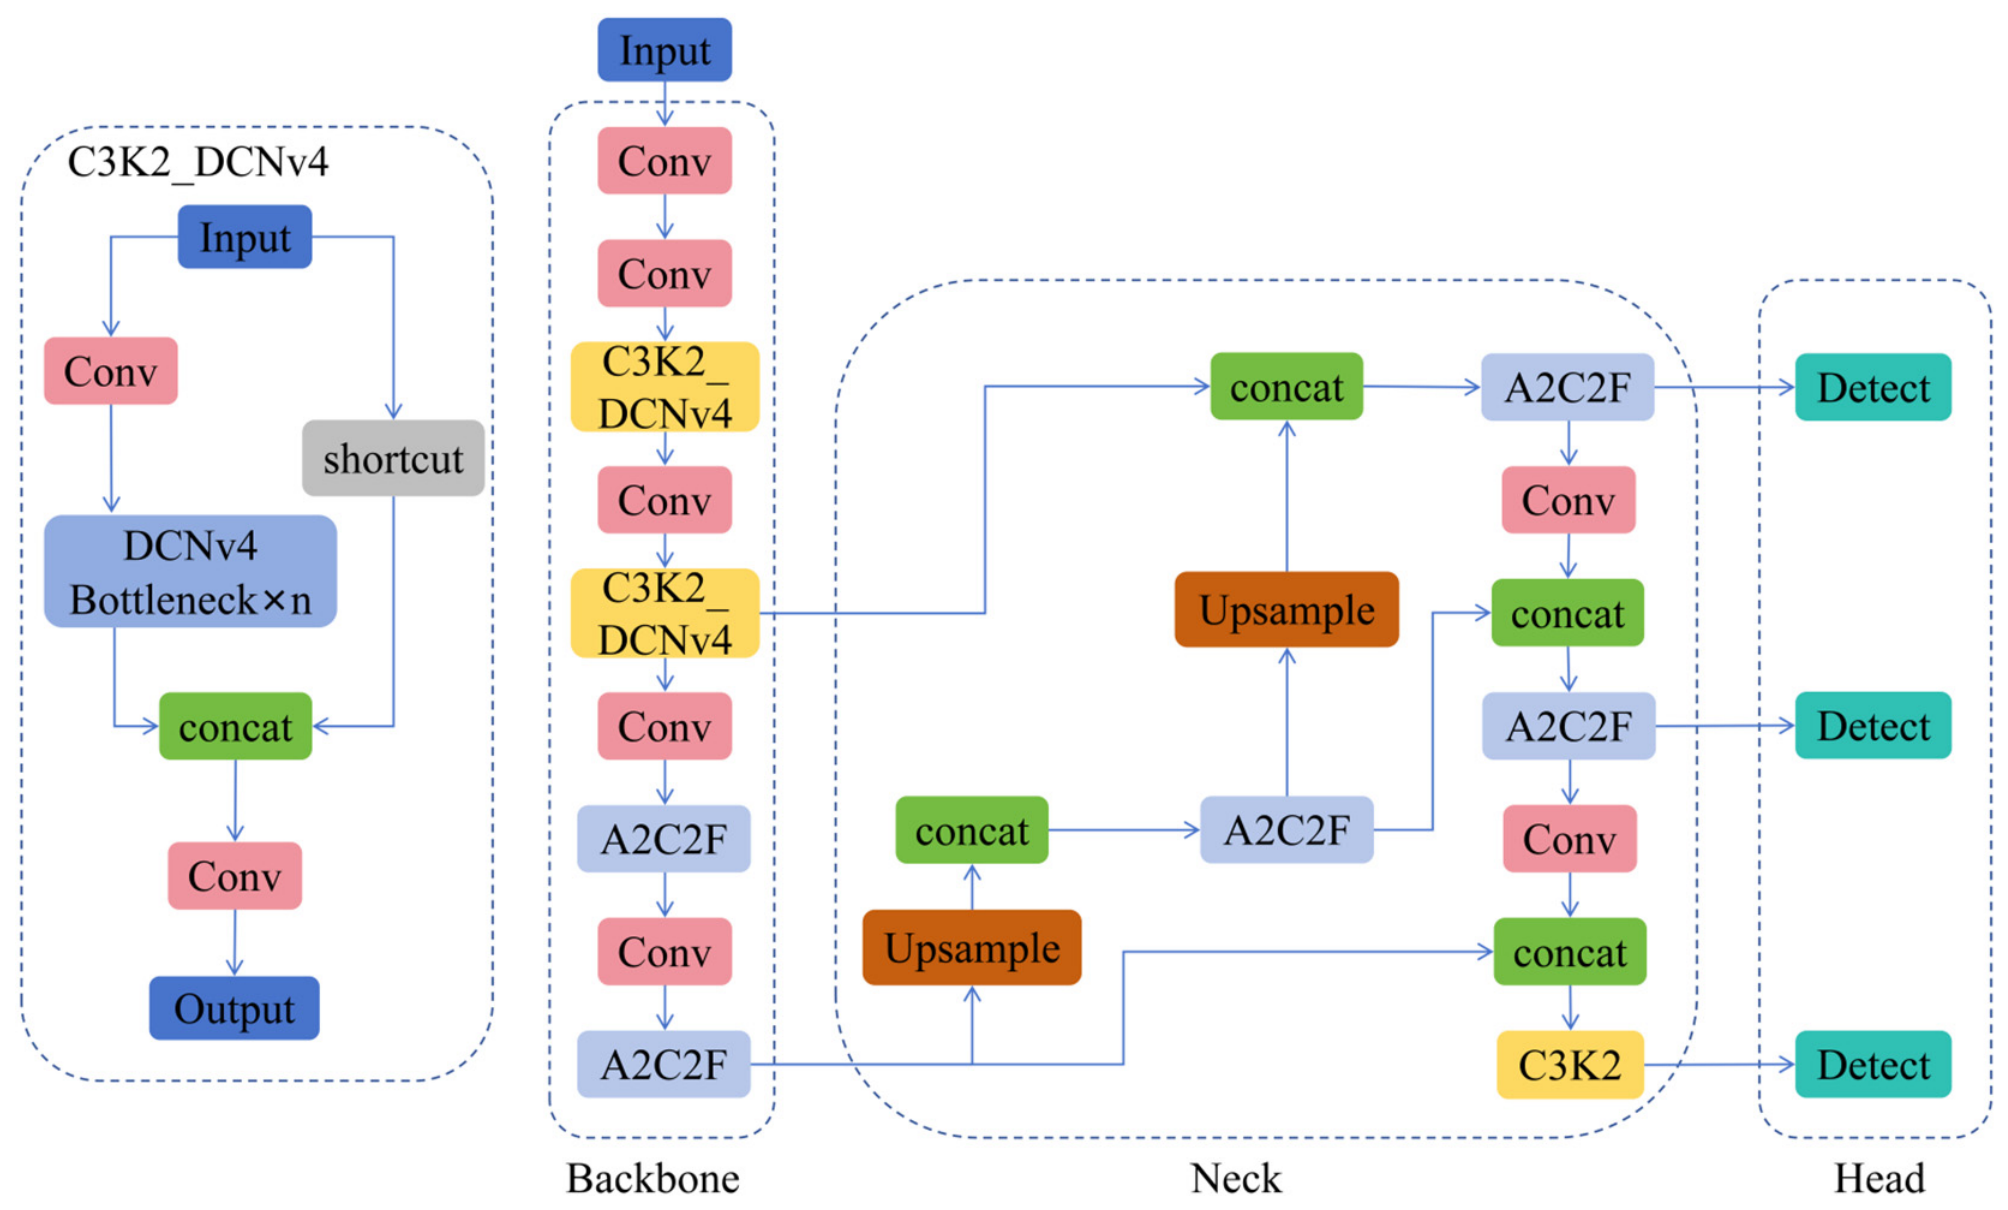
Surface defects in concrete dams exhibit distinct non-rigid geometric characteristics: crack paths are curved and variable, aggregate distribution is irregular, and construction joint edges are blurred and of varying widths. Standard convolutions with fixed rectangular sampling grids struggle to effectively capture the complete features of such deformable targets, often leading to the omission of slender cracks and positioning errors at aggregate edges. Therefore, we employ the improved C3k2_DCNv4 deformable feature extraction operator to address the non-rigid deformation characteristics of surface defects in concrete dams; its structure is shown in Figure 7.
This operator is based on the CSP (Cross Stage Partial) dual-branch architecture. It introduces the DCNv4 deformable convolution mechanism into the native C3k2 module while disabling the C3k multiscale kernels to avoid computational redundancy caused by their combination with DCNv4, thereby achieving synergistic optimization of geometrically adaptive feature extraction and lightweight design. C3k2_DCNv4 employs a channel scaling strategy with a scaling factor of e = 0.25 to offset the additional performance overhead caused by DCNv4’s deformable computations, thereby achieving an acceptable trade-off between detection accuracy and inference throughput, with the 30 FPS throughput meeting real-time requirements for UAV-based inspection workflows. In the CSP dual-branch structure, the direct connection branch contains no convolution operations and only passes shallow-layer features, further reducing redundant computations.
We embed DCNv4’s deformable kernels into the C3k2 bottleneck to enhance feature extraction for geometrically variable defects. The hybrid module preserves the original multi-branch fusion topology but replaces fixed-grid convolutions with adaptive sampling. This substitution proves effective for concrete dam scenarios where background textures (weathering stains, water stains) exhibit high intraclass variance, as the learnable offsets recalibrate sampling locations toward discriminative edges rather than homogeneous regions. This operator retains the same interface format as the original C3k2. By adjusting the parameter ‘c3k’, users can dynamically enable or disable the DCNv4 enhancement branch, facilitating flexible insertion at different levels of the model. This allows for secondary innovation without modifying the overall network architecture, offering high engineering reusability.
Following experimental validation, the modified C3k2_DCNv4 was deployed at layers P2 and P3 of the backbone network, corresponding to the small-to-medium-scale feature extraction layers. This position lies at the transition zone between shallow-level details and deep-level semantics, where DCNv4’s deformation modeling capability is critical for enhancing crack contours and distinguishing aggregate edges. The detection head reuses the native C3k2 module to ensure inference speed, achieving a balance between the model’s accuracy and speed.

2.2.5. Evaluation Criteria

Model efficacy was quantified through a four-dimensional evaluation protocol encompassing: Precision, reflecting the reliability of positive predictions; recall, measuring the completeness of defect retrieval; mAP50, computed at a single IoU threshold of 0.5; and mAP50-95, averaged across ten IoU strata from 0.5 to 0.95 at 0.05 increments [63].
m A P = 1 N i = 1 N A P i
P r e c i s i o n = T r u e P o s i t i v e s ( T P ) T r u e P o s i t i v e s ( T P ) + F a l s e P o s i t i v e s ( F P )
R e c a l l = T r u e P o s i t i v e s ( T P ) T r u e P o s i t i v e s ( T P ) + F a l s e N e g a t i v e s ( F N )
In these formulas, T P refers to the number of samples that the model correctly predicts as positive, F P refers to the number of samples that the model incorrectly predicts as positive, and F N refers to the number of samples that the model incorrectly predicts as negative.

3. Experiments and Results

3.1. Project Case Studies

3.1.1. Project Overview

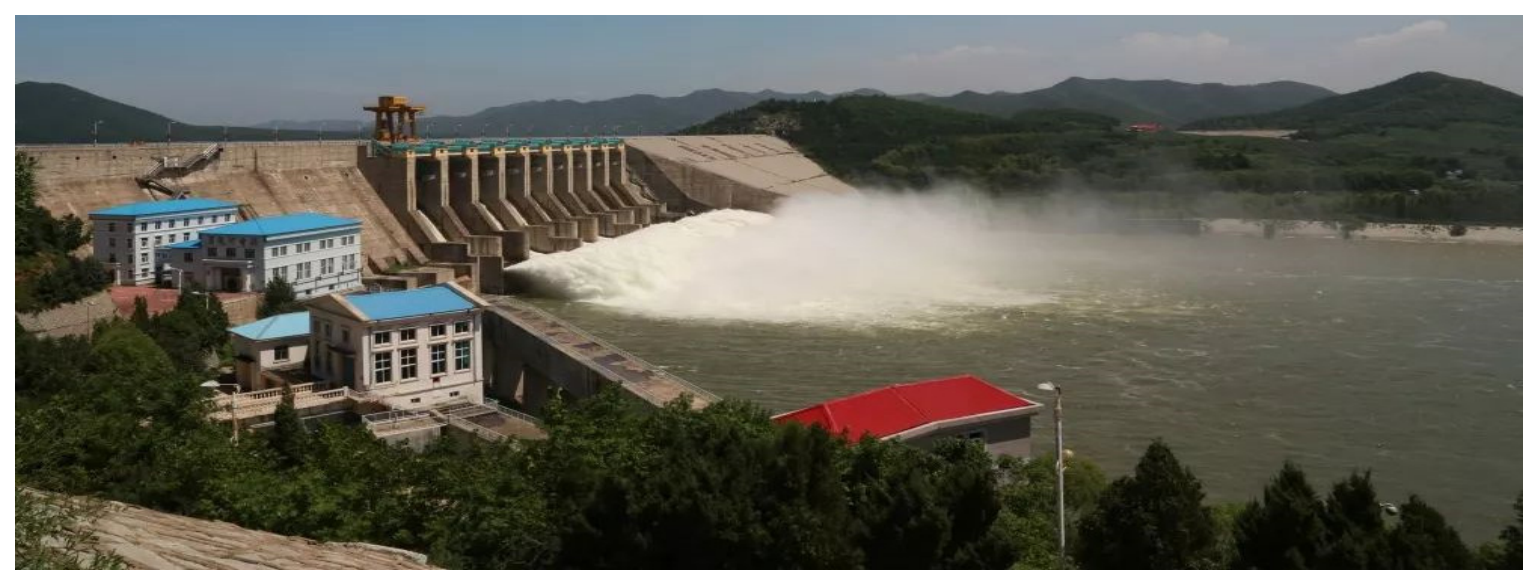
Constructed in 1986, this Class II hydraulic complex constitutes a multipurpose reservoir project with its principal design objective oriented toward municipal water supply. Beyond this primary function, the facility concurrently delivers ancillary engineering services encompassing flood peak attenuation, hydroelectric energy conversion, agricultural irrigation, fishery cultivation, and eco-tourism development. Characterized by a total storage capacity of 934 million cubic meters, including 714 million cubic meters at normal pool level and 70 million cubic meters of dead storage, the reservoir drains a catchment of 2085 square kilometers. The impounding structure is configured as a concrete gravity dam with a crest elevation of 53.5 meters above foundation, a longitudinal crest extent of 411 meters, and a transverse crest dimension of 10 meters [64]. Decades of service under variable hydraulic and climatic regimes have induced multiple categories of surface defects within the concrete structure. In the absence of timely inspection and remediation, such deficiencies would escalate into severe hazards for downstream communities and engineered infrastructure. Figure 8 presents the downstream panoramic view of the dam investigated in this study.

3.1.2. Data Collection and Processing

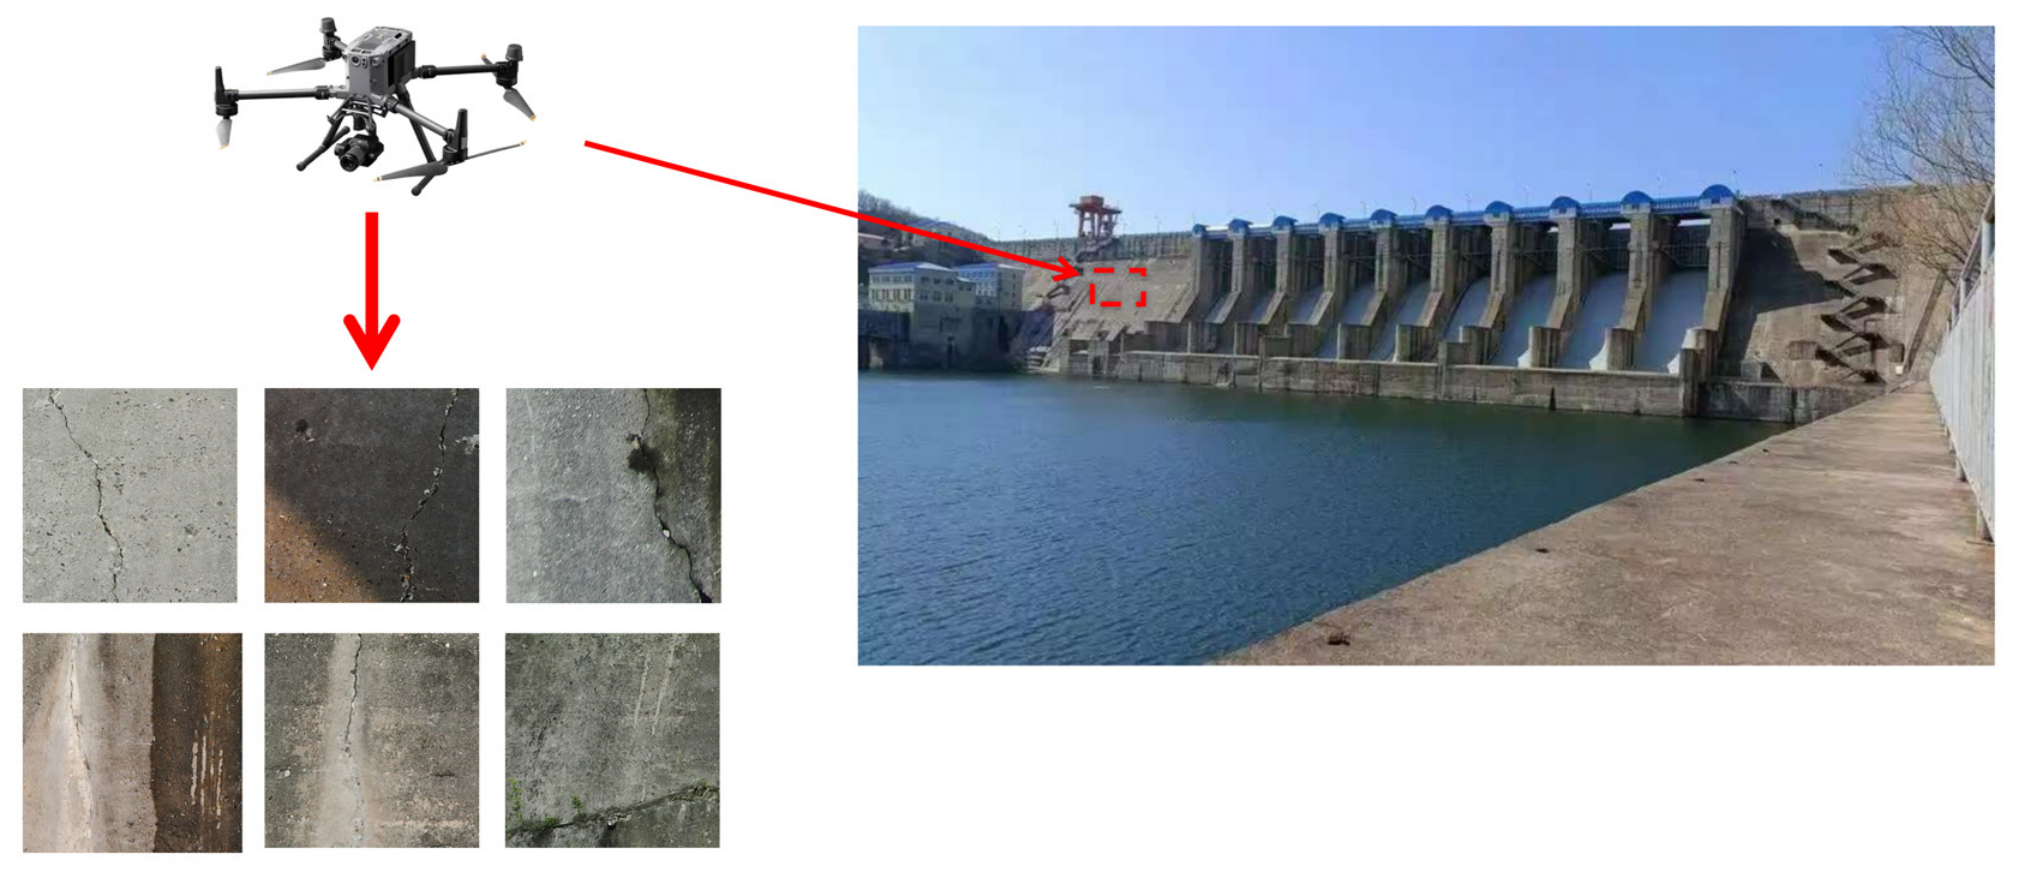
To capture images of cracks for model training and testing, a DJI M300 RTK UAV equipped with an H20 camera (with a resolution of 4056 × 3040 pixels) was used to photograph the dam surface. Figure 9 shows a downstream view of the concrete dam studied in this paper; the drone used to capture the images; and a schematic diagram of concrete defects obtained by cropping the drone imagery.
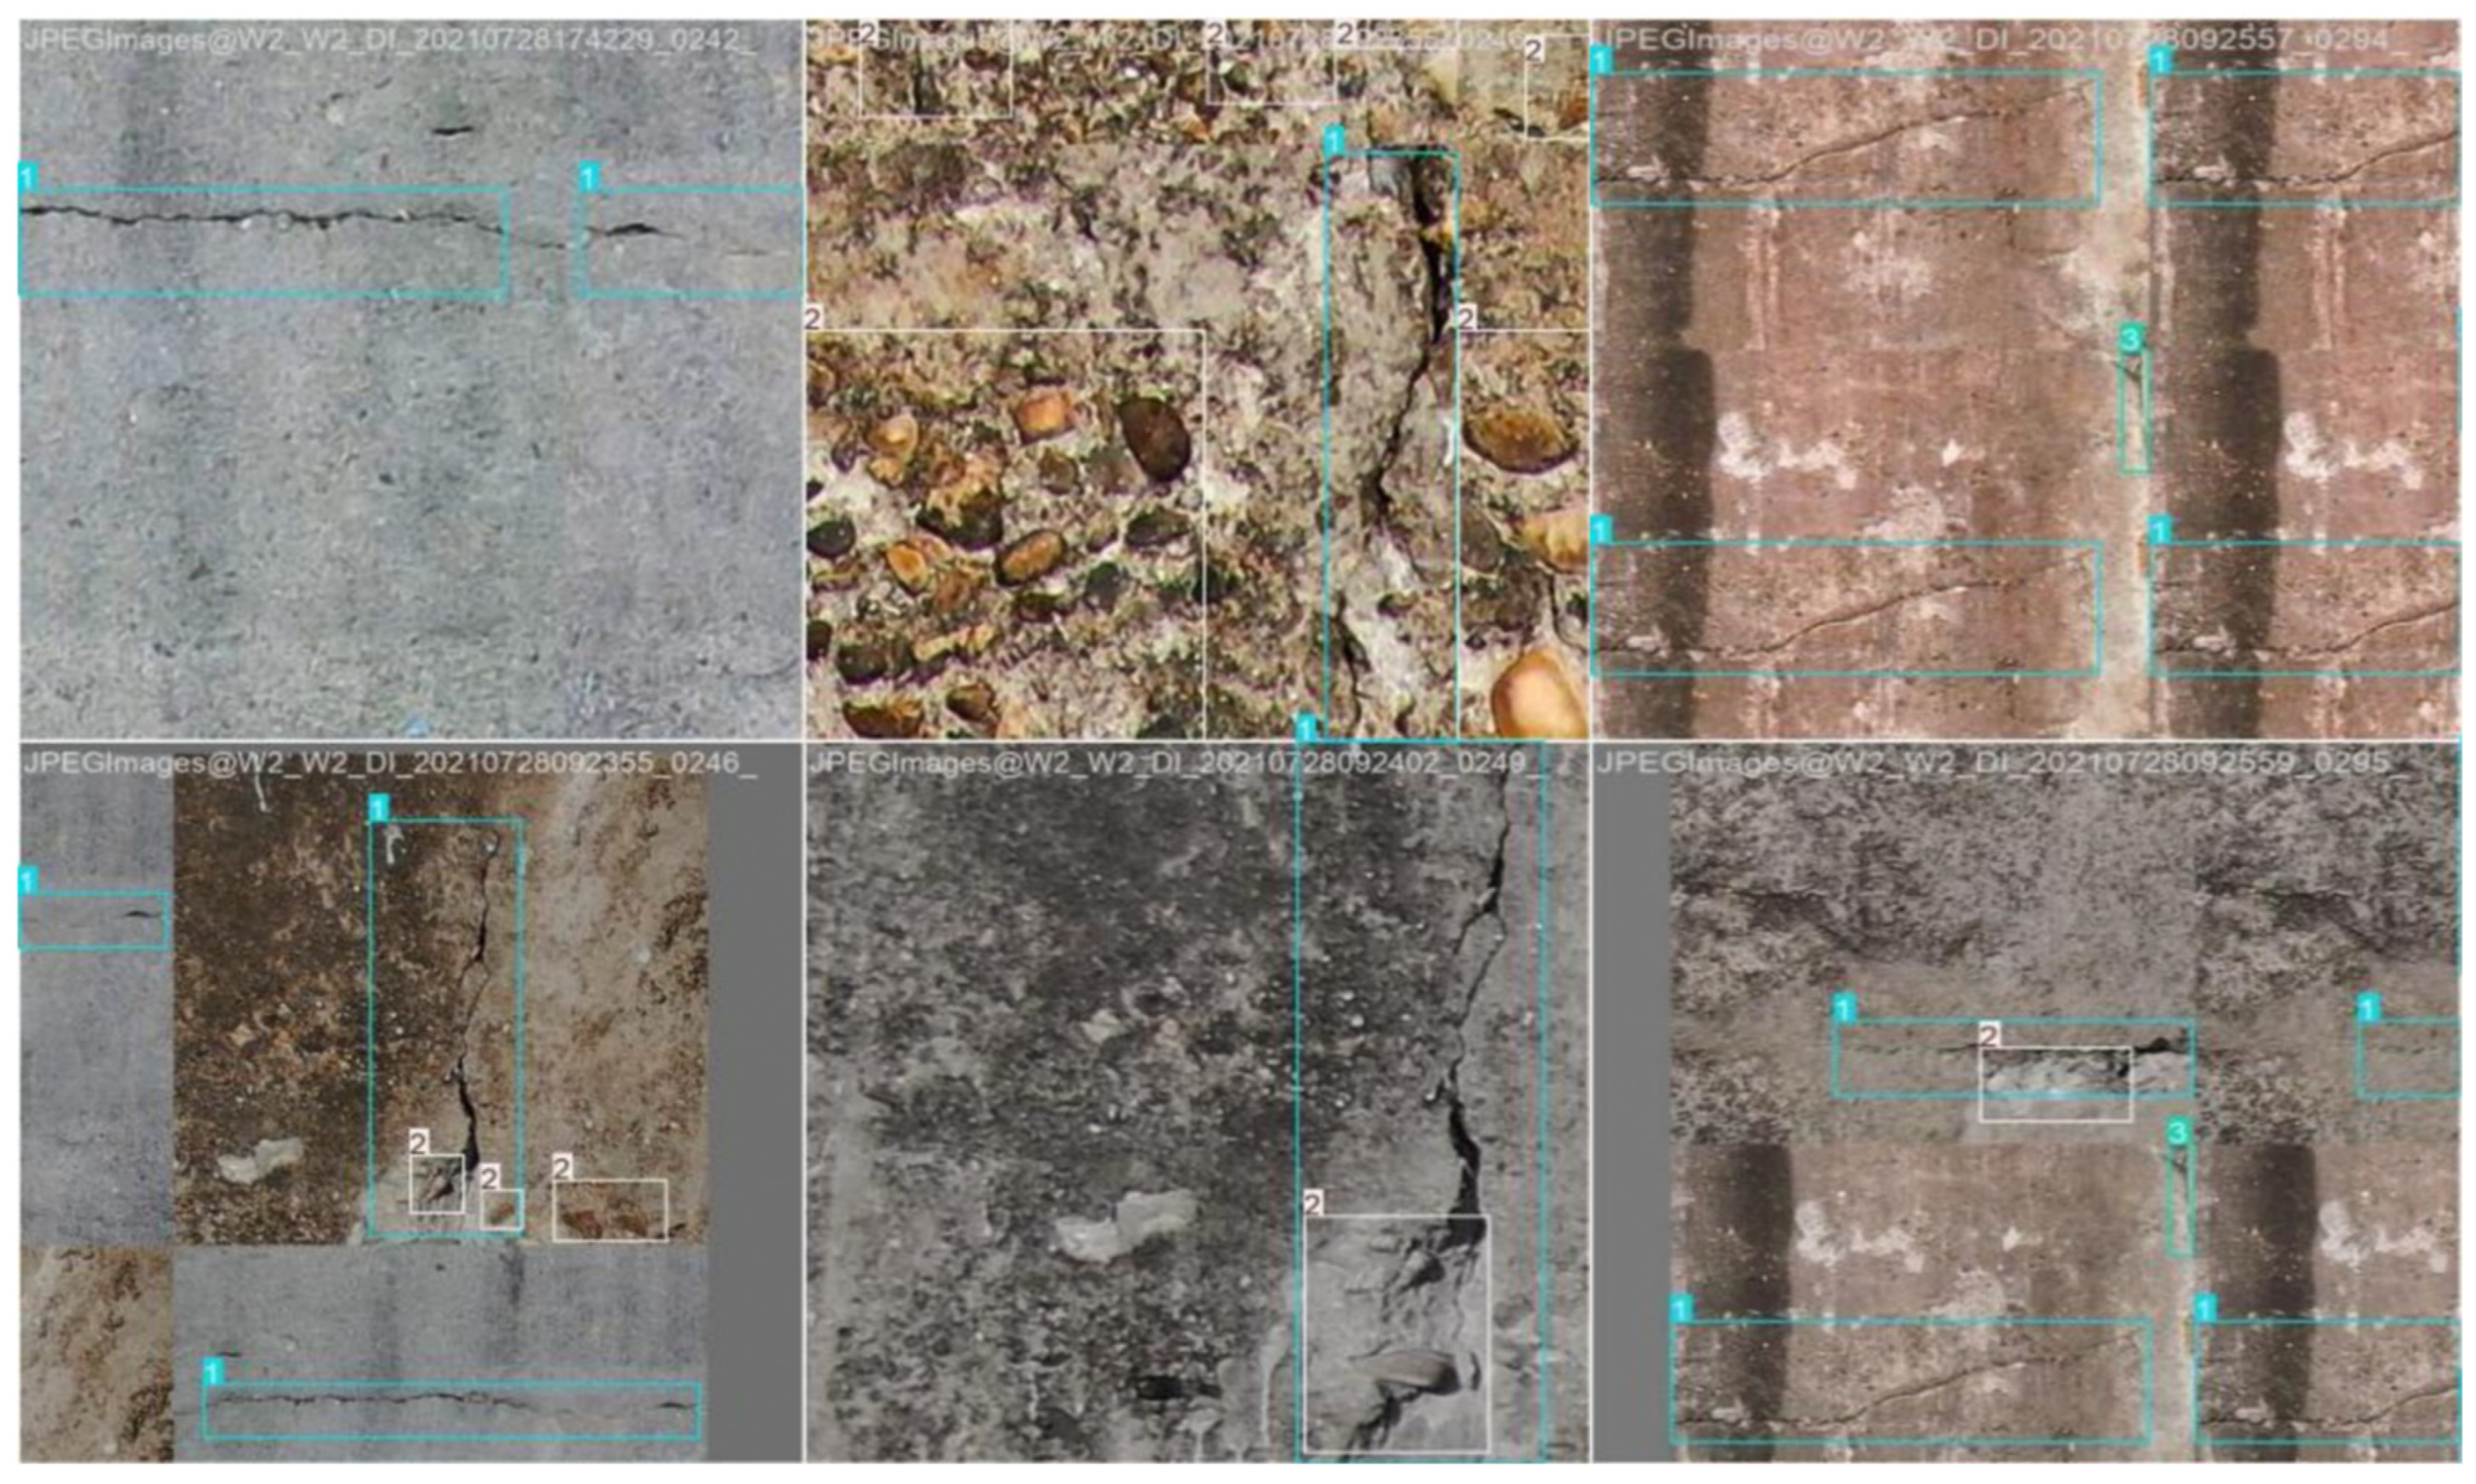
After filtering and cropping the captured images, a final set of 2756 surface defect images with a resolution of 512 × 512 was compiled. Following this screening and organization process, 1902 images were manually annotated. The annotation process for various defect targets was based on the open-source annotation tool LabelMe, which included: raw image acquisition, manual annotation of target types, conversion to JSON files, and the generation of final visualized annotated images. All defect annotation data are stored in JSON files. The information in these JSON files is processed by data scripts to generate visualizations and convert the data into actual values and annotation visualizations, thereby extracting annotation information that includes both the image itself and the corresponding defects. The annotation results are shown in Figure 10, where Label 1 represents the “crack” defect studied in the self-built “Multi defects” dataset of this paper, Label 2 represents the “aggregate” defect, and Label 3 represents the “construction joint” defect.
Stratified random sampling was applied to apportion the annotated dataset into three disjoint subsets: a training pool of 1268 images (67%), a validation pool of 317 images (17%), and a hold-out test pool of 317 images (17%). After splitting the dataset, during the manual annotation process, some images were found to be of poor quality—either showing no damage or being completely covered in damage. After screening the images for quality, only those with high image quality were retained as the final dataset for experimentation. Table 1 shows detailed information about Multi-defects.
It should be noted that the Multi-defect dataset, while representing a medium-scale contribution within the niche domain of concrete dam defect detection (where publicly available object detection datasets typically contain only a few hundred images), remains modest by general deep learning standards. The high cost of labor-intensive manual annotation constrain dataset expansion. To mitigate this, we employ extensive data augmentation.

3.2. Analysis of Results

3.2.1. Model Training

The experiment was conducted on a server running Ubuntu 20.04 LTS, equipped with an NVIDIA GeForce RTX 3090 GPU. All deep learning algorithms were implemented using PyTorch 2.0.0 with CUDA version 11.7. Training utilized the AdamW optimizer, with Python 3.8 as the programming language and a maximum of 300 epochs.
To ensure statistical robustness and mitigate random seed variance, each model configuration was trained independently for three runs with different random seeds (42, 123, and 2024). The reported metrics in all tables represent the mean ± standard deviation across these three runs unless otherwise specified.
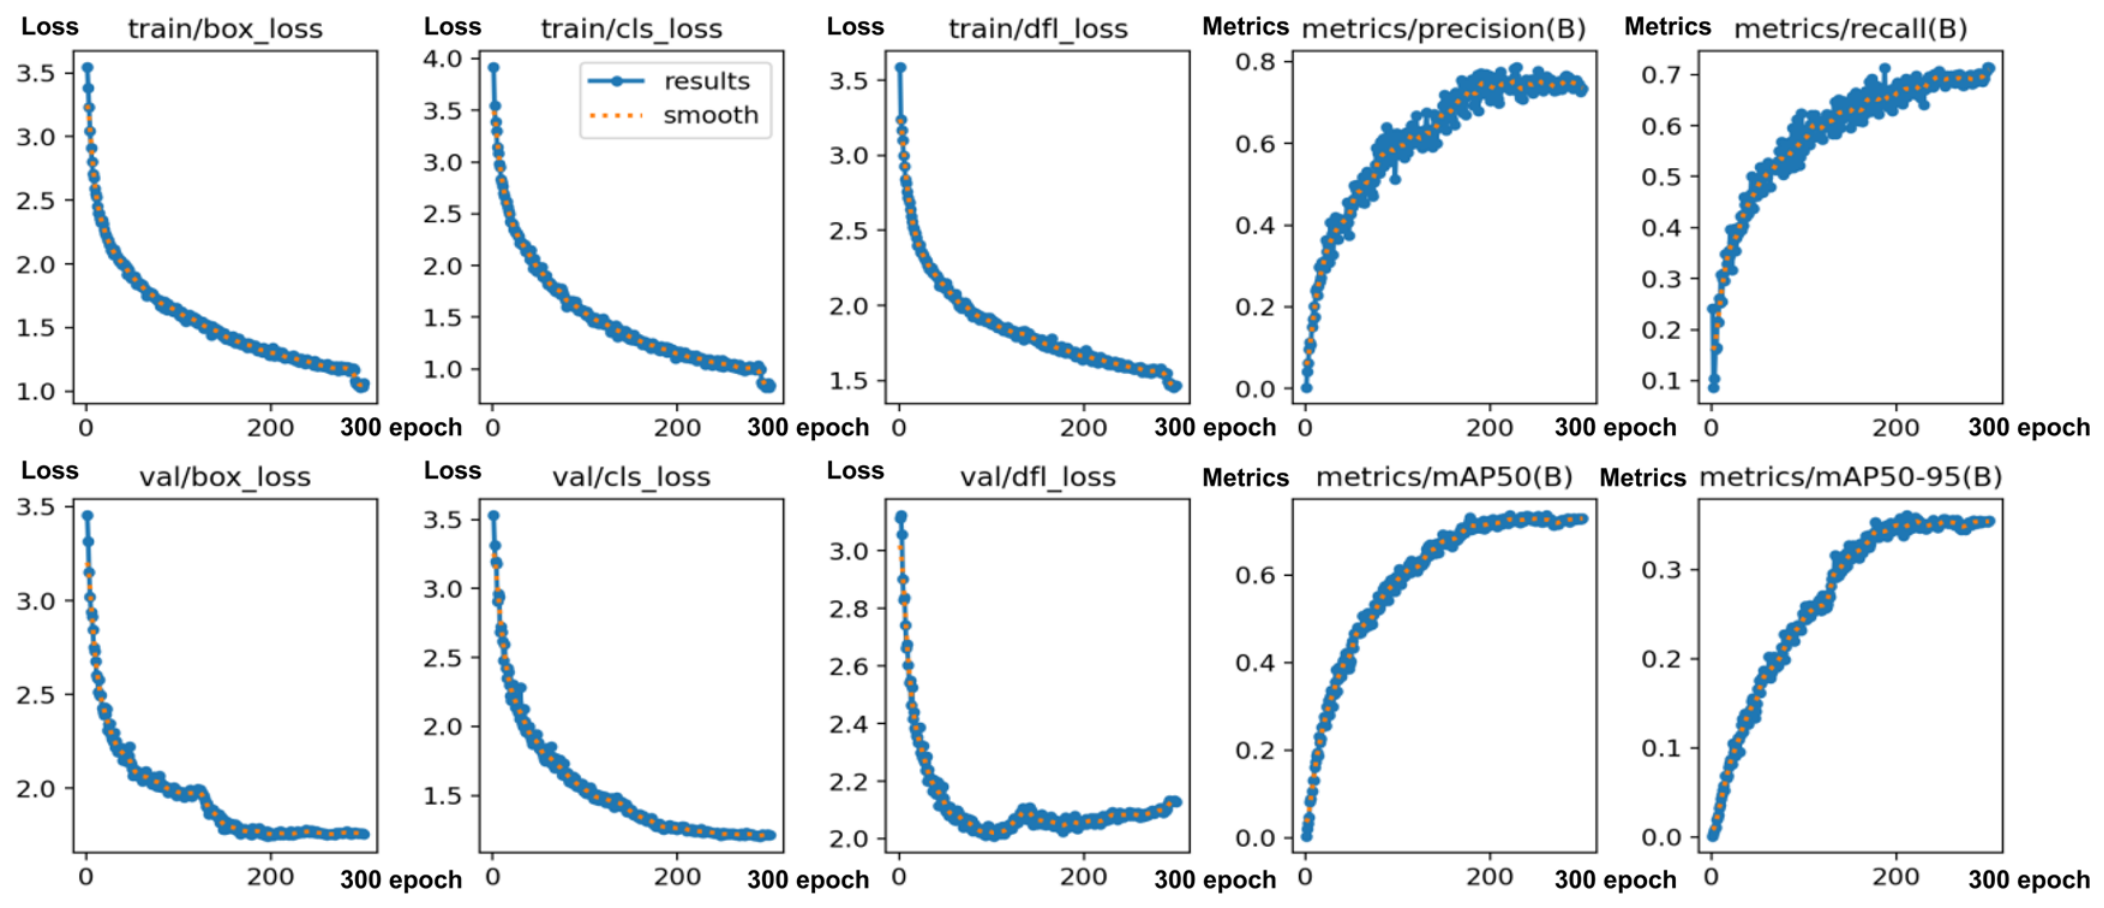
Figure 11 visualizes the convergence behavior of the DCN-YOLO training process across ten monitoring panels, organized into three functional groups. The first row tracks optimization progress through training losses: bounding box localization error (box_loss), category classification error (cls_loss), and distribution focal loss (dfl_loss). The second row mirrors these quantities on the validation split (val/box_loss, val/cls_loss, val/dfl_loss), enabling overfitting diagnosis. The remaining panels quantify detection efficacy via precision, recall, and mean average precision computed at an IoU threshold of 0.5 (mAP50) and averaged across ten thresholds from 0.5 to 0.95 (mAP50-95).
As shown in Figure 11, at the loss function level, the bounding box regression loss, classification loss, and distribution focal loss for both the training set and the validation set exhibit a monotonically decreasing trend. Furthermore, the validation set curve shows no signs of a significant rebound, indicating that the model possesses good generalization performance and has not suffered from overfitting. In terms of evaluation metrics, precision, recall, mAP50, and mAP50-95 all improved steadily during training and gradually converged after 150 epochs, with performance growth leveling off. Based on the above analysis, the model has achieved a satisfactory state of convergence at 150 epochs, and further training would yield only limited performance gains.

3.2.2. Ablation Experiments and Module Performance Validation

The YOLOv12 series is divided into five versions based on file size: n (minimal), s (small), m (medium), l (large), and x (extra-large). Since concrete surface defects are characterized by small pixel size and low contrast, and to improve model accuracy while reducing false negatives and false positives—while also minimizing the increase in inference cost—YOLOv12l (large version) was selected for the improvement experiments.
As introduced earlier, we modified YOLOv12l by integrating the state-of-the-art Mamba module [65] C3k2-GroupMamba (hereinafter referred to as CG), the DCN deformable convolutional network [61] C3k2_DCNv4 (hereinafter referred to as CD), and the modified attention mechanism [66] A2C2f-CGLU-DYT (hereinafter referred to as ACD). To disentangle the synergistic versus antagonistic interactions among the proposed architectural modifications, controlled ablation protocols were established in which the C3k2_DCNv4 deformable bottleneck, the CG feature recalibration module, and the ACD attention mechanism were selectively disabled and recombined. The experiments utilized our self-built Multi-defects dataset. We evaluated the effectiveness of the model improvements using four evaluation metrics: precision, recall, mean average precision (mAP50) with an IoU threshold of 0.5, and mean average precision (mAP50-95) with an IoU threshold ranging from 0.5 to 0.95.
Table 2 shows the model performance metrics after modifications to each module. In the experiments, the first group consists of the unmodified original YOLOv12l model, while the eighth group consists of the improved DCN-YOLO model, which was found to have the best overall performance based on analysis. As shown in Experiments 1 and 6, adding the CD operator to the P2 layer increased the precision value by 0.7% and the recall value by 2.6% compared to the original YOLOv12l, demonstrating the effectiveness of the CD operator. Considering that the detection targets in this study are predominantly small to medium-sized, we attempted to add the CD operator to the P3 layer of the model to enhance its detection capability for medium-sized targets. In Experiment 8, based on Experiment 6, the DCN-YOLO model with the modified CD operator in the P3 layer achieved the best overall performance across all defects, Compared to the original YOLOv12, this version achieves a 0.6% improvement in mAP50, a 4.2% improvement in mAP50-95, and a 7.1% increase in precision. Compared to Group 6, which added layers only to the P2 layer, this version achieves a modest 1.58% improvement in mAP50 and a significant 5.4% improvement in mAP50-95, and a 6.4% increase in precision. In terms of computational efficiency, there were improvements of 0.11 M in parameters and 1.30 G in GFLOPs. Although recall values showed a slight decline, the overall improvement in accuracy can significantly reduce the workload required for manual verification, Furthermore, although the FPS value has declined compared to the original YOLOv12 model, it remains at approximately 30 FPS, which is within an acceptable range. Therefore, based on a comprehensive analysis of computational efficiency and accuracy, as well as the cost-saving considerations addressed in this study, the approach involving comprehensive improvements to both the p2 and p3 layers was ultimately selected.
As shown in Experiments 2 and 3, after introducing the CG module and the ACD mechanism into the model, respectively, the overall precision improved by 5.4% and 4%, while mAP50 and mAP50-95 increased by 0.5%, 1.4%, 0.4%, and 4.4%, respectively; however, the recall values decreased. Furthermore, in Experiment 4, combining the two improvement modules resulted in a significant regression in precision compared to the improvements achieved by each module individually. Experiment 5 attempted to add a p2 sub-object detection layer, but the improvements it brought to the model’s metrics were negligible.
Based on the results of Experiments 2–6, Experiment 7 combined the ACD and CD models (jointly improved in layers P2 and P3), which demonstrated the best computational efficiency. However, an integrated assessment of the experimental results indicates that while this combination improves computational efficiency, its overall detection accuracy declines compared to the DCN-YOLO model: although it achieved a slight improvement in accuracy for aggregate and construction joint defects, its accuracy for crack detection decreased significantly.
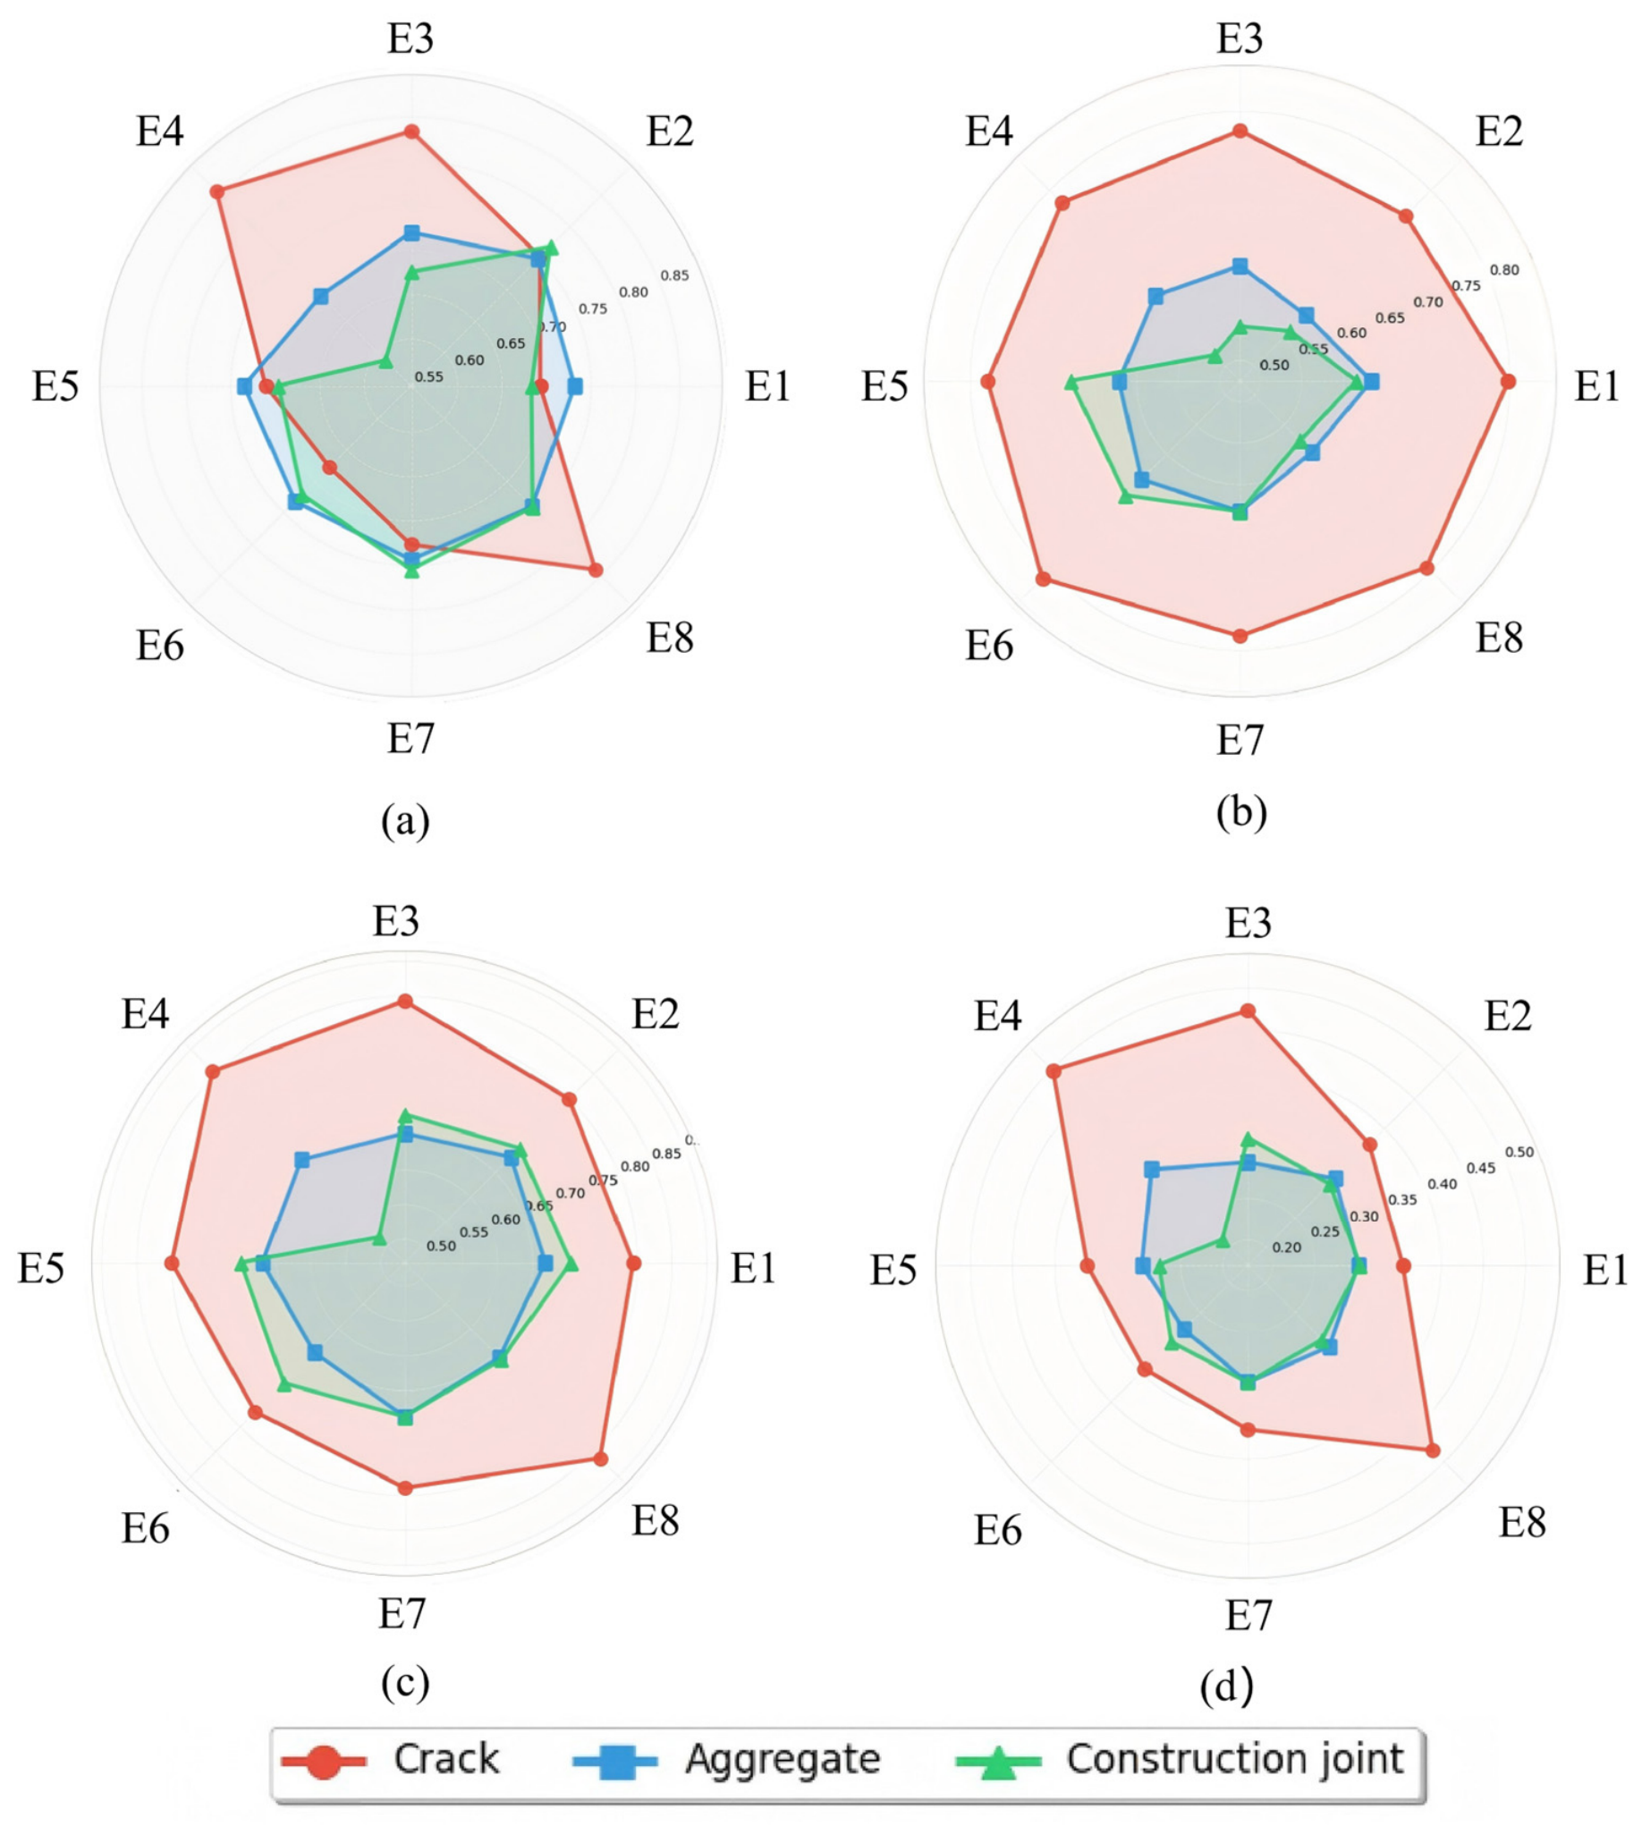
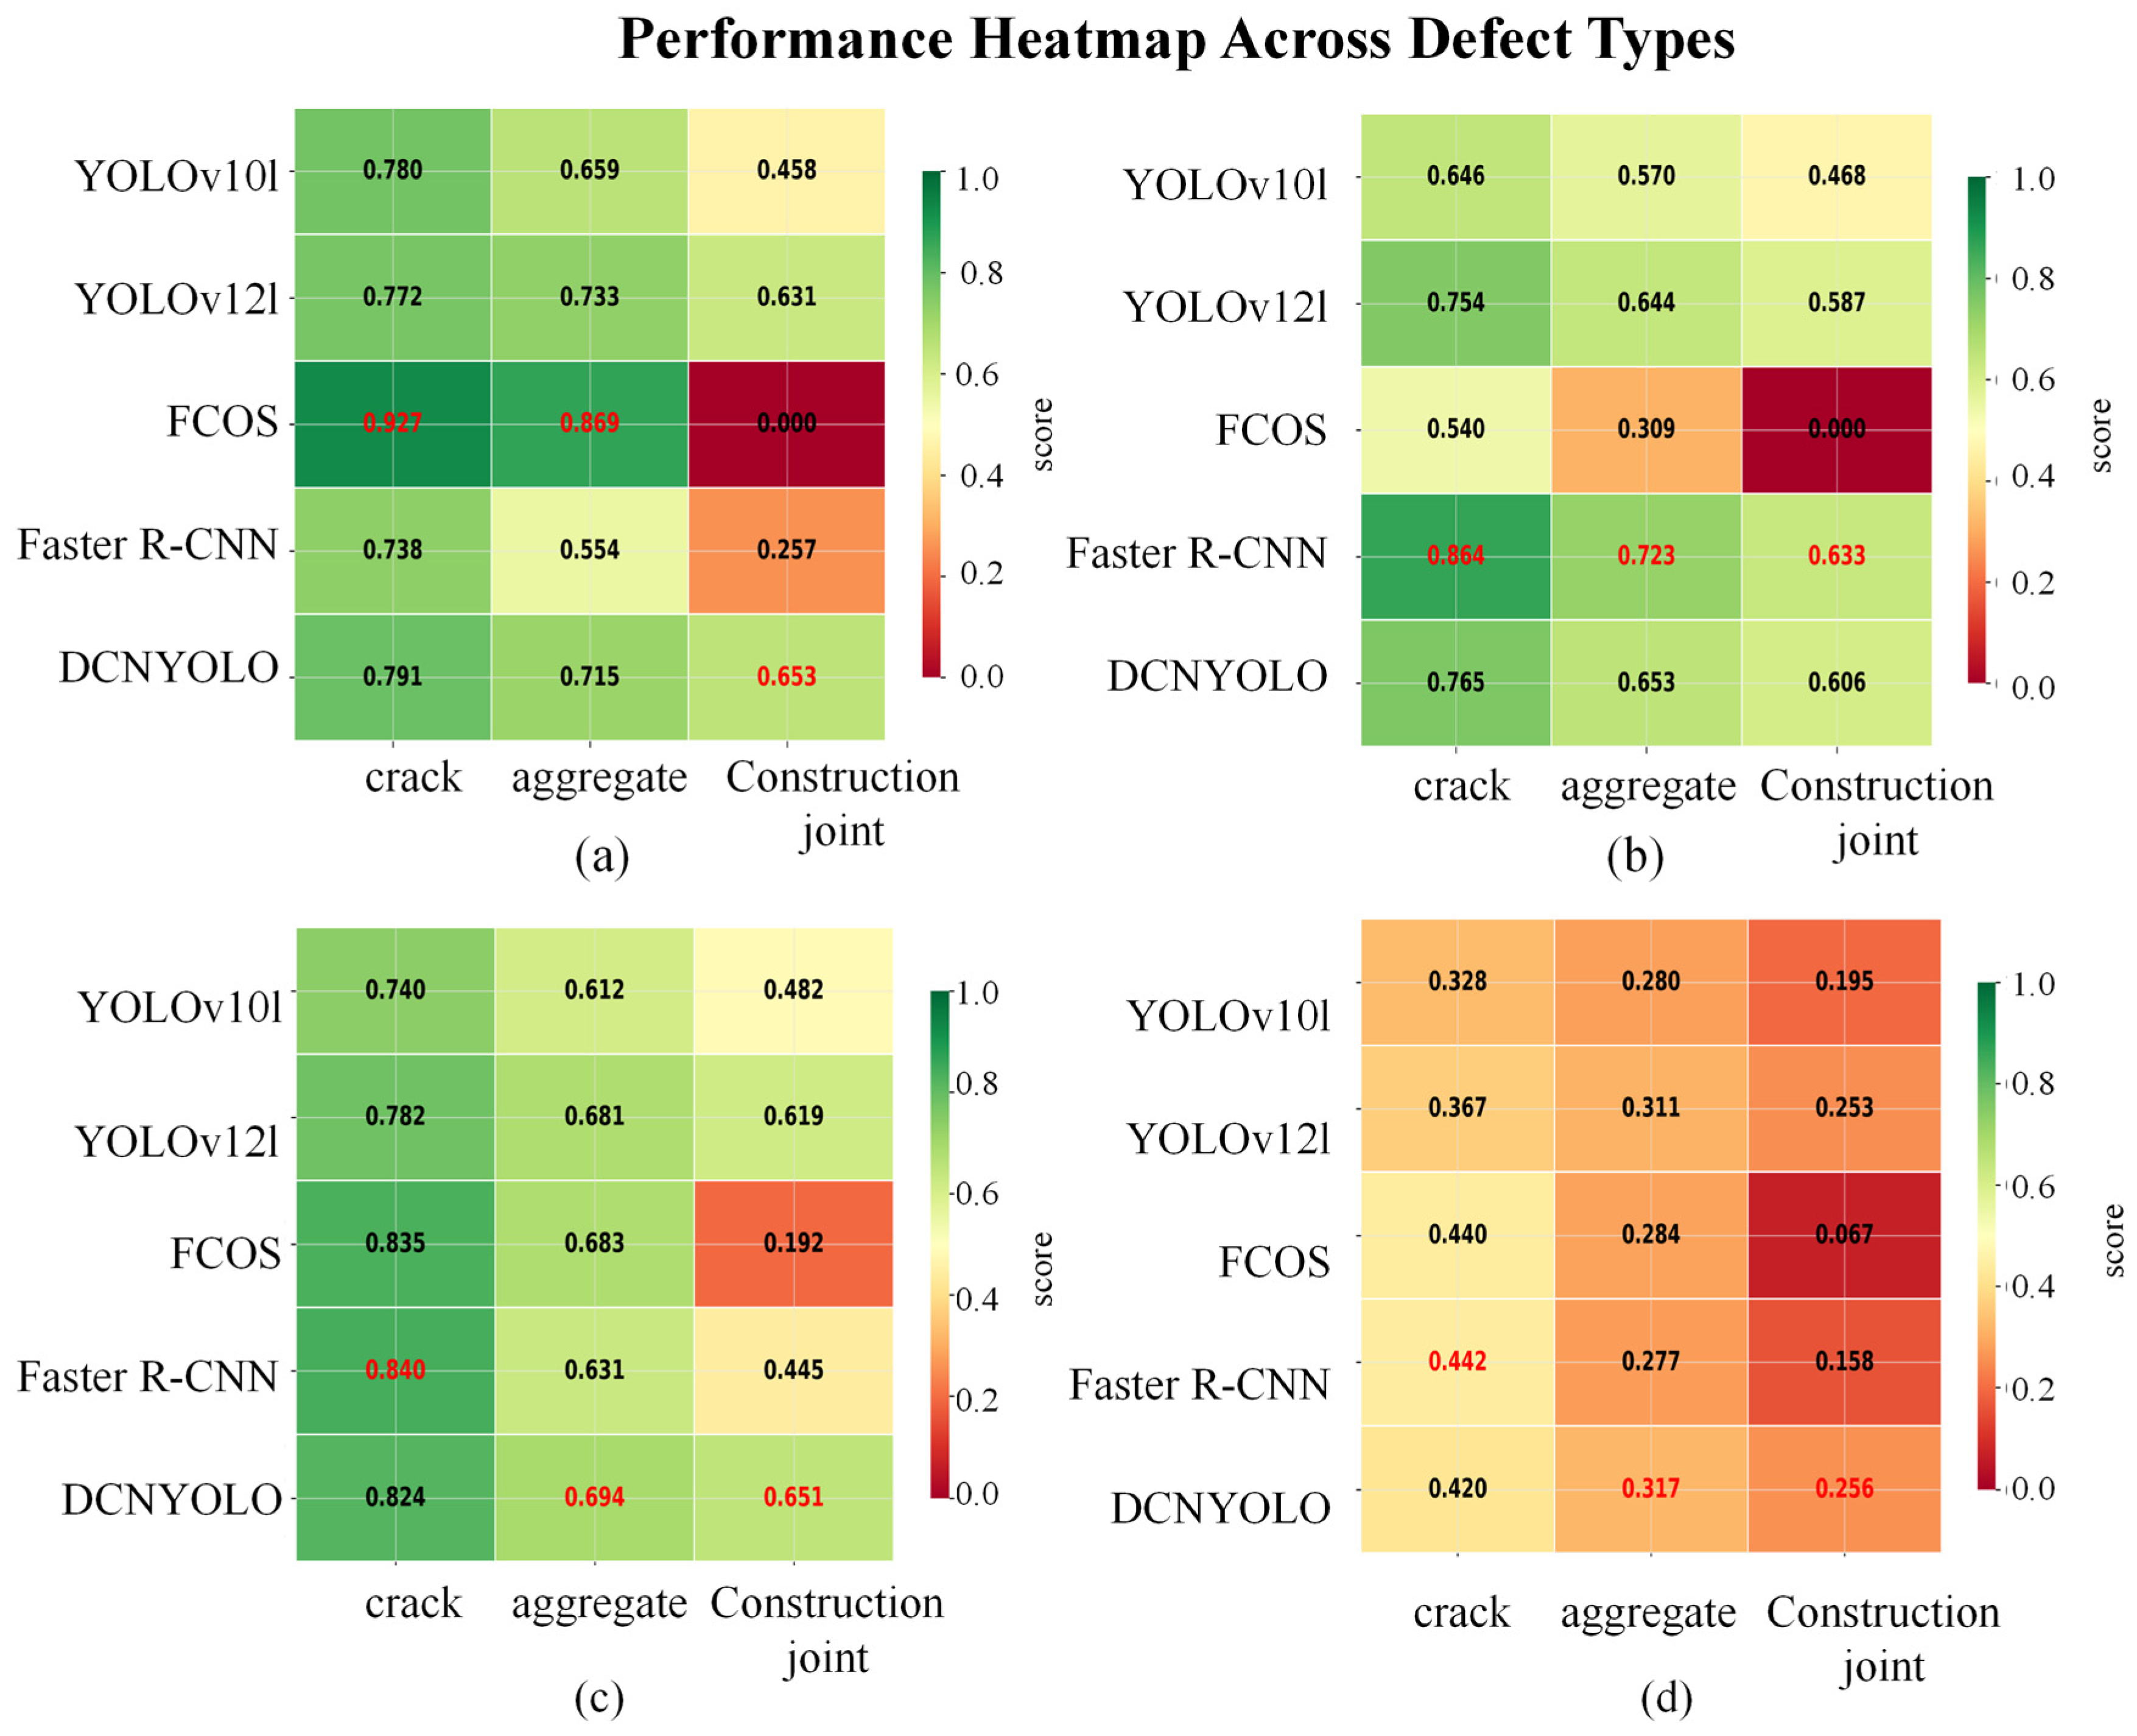
Figure 12 shows a scatter plot of performance metrics for each model when performing single-object detection, while Figure 13 displays the detection results in complex scenes. When detecting a single type of defect—such as cracks, aggregates, or construction joints—from the three defect categories studied in this paper, the YOLOv12-C3k2-GroupMamba-A2C2f-CGLU-DYT model, which incorporates the CG module and ACD mechanism, performed best in crack detection. However, it exhibited significant performance degradation for both aggregate and construction joint defects, with overall performance substantially inferior to the baseline model; therefore, it is not suitable for the multi-object defect detection task in this study. Although DCN-YOLO did not achieve the highest accuracy for any single defect type, it demonstrated excellent balanced performance: for crack detection, its accuracy reached 84%, only 1.7% lower than the best model (YOLOv12-C3k2-GroupMamba-A2C2f-CGLU-DYT), indicating outstanding overall performance; For aggregate defect detection, its accuracy is 74%. Although it ranks third among all models, the gap with the best accuracy (75%) is only 1%, and it differs by only 0.3% from the second-place model (YOLOv12-A2C2f-CGLU-DYT-DCNv4); the two can be considered equivalent in performance; In construction joint detection, the model’s accuracy remains second only to YOLOv12-C3k2-GroupMamba and YOLOv12-A2C2f-CGLU-DYT-DCNv4, with a gap of 2.8% from the best result, which meets the requirements for engineering applications.
Although in engineering applications, the cost of missed detections far exceeds that of false positives, areas flagged by the model still require manual review. If one focuses solely on achieving a high recall rate to avoid missed detections while neglecting the model’s precision—which leads to a large number of false positives—it will result in a significant workload requiring manual review, thereby consuming substantial human and material resources. The research approach in this paper focuses on how to minimize the inspection costs for dams through the use of the model; therefore, a relatively conservative, accuracy-first strategy was adopted. At the same time, thanks to the portability, ease of deployment, and efficiency of UAVs, it is possible to capture images of the same area from different altitudes and angles during inspection missions. This enhances the model’s probability of detecting damage, thereby reducing the likelihood of missed detections that might result from a lower recall value.
In summary, the DCN-YOLO model demonstrated excellent overall performance and was ultimately identified as the optimal solution. For different types of defects, the model maintained consistently high accuracy, demonstrating strong adaptability to operational conditions and engineering generalization capabilities, and showing good potential for application development. Upon synthesizing the quantitative evidence across all evaluated performance dimensions, DCN-YOLO was selected as the optimal architectural candidate for subsequent investigation, by virtue of its superior equilibrium between detection precision and recall under the adverse imaging conditions characteristic of UAV-based dam inspection. This selection mitigates the operational hazards associated with both missed defects and spurious alarms in safety-critical structural assessment workflows.

3.2.3. Comparison of Different Models and Metrics

To contextualize the relative efficacy of the proposed DCN-YOLO architecture, its detection behavior was benchmarked against four established reference architectures spanning both single-stage (YOLOv10l, YOLOv12l, FCOS) and two-stage (Faster R-CNN) paradigms. The quantitative comparative outcomes are collated in Table 3.
In the multi-object detection task using our self-built Multi defects dataset, the DCN-YOLO model demonstrated superior overall performance. Specifically, for the mAP50 and mAP50-95 metrics, the method proposed in this paper also maintained a leading position among the compared models, achieving the best results with an overall mAP50 of 72.8% and an overall mAP50-95 of 36.1%. For crack defects, mAP50 and mAP50-95 were 86.3% and 48.1%, respectively—both the best results; for aggregate defects, mAP50-95 was 30.7%—the best result; while the mAP50 and mAP50-95 values for other defects did not reach the top, they remained at a leading level overall, validating the model’s balanced performance in terms of detection accuracy and localization precision. DCN-YOLO ranks as the second-best model in terms of precision, trailing only the FCOS model, which achieved the highest precision score: its overall precision reached 77.4%, with a detection accuracy of 84% for cracks, and 74% for exposed aggregate detection, and 74.1% for construction joint detection. Although the FCOS model achieved the highest precision score, its recall was the lowest among all models, indicating that FCOS suffers from severe missed detections in multi-object detection tasks, making it difficult to meet the demands of practical engineering applications. Regarding the recall metric, although the method proposed in this paper is slightly lower than the best models, YOLOv12l and Faster R-CNN, it still holds a significant advantage over other models such as YOLOv10l and FCOS. Furthermore, while YOLOv12l and Faster R-CNN have higher recall metrics than the model in this paper, their precision values are significantly lower than those of DCN-YOLO, and they also perform worse than DCN-YOLO in terms of mAP. Therefore, based on a comprehensive analysis of the four metrics, although DCN-YOLO shows a slight decline in recall compared to the original YOLOv12l, this is within an acceptable range when considered alongside the improvements it brings in precision, mAP50, and mAP50-95.
In experiments on simultaneous multi-object defect detection, both the FCOS and Faster R-CNN models failed to detect crack defects. The reasons for this failure lie, on the one hand, in the inherent limitations of the region proposal mechanism in two-stage detectors when handling dense small objects; on the other hand, scenarios involving multiple coexisting defect categories introduce more severe inter-class interference and background noise compared to single-object detection, making it difficult for these models to effectively extract discriminative features of cracks. This phenomenon indirectly validates that the DCN-YOLO model proposed in this paper possesses excellent feature representation and noise suppression capabilities in multi-task parallel detection scenarios, enabling stable and reliable multi-class defect recognition in complex backgrounds.
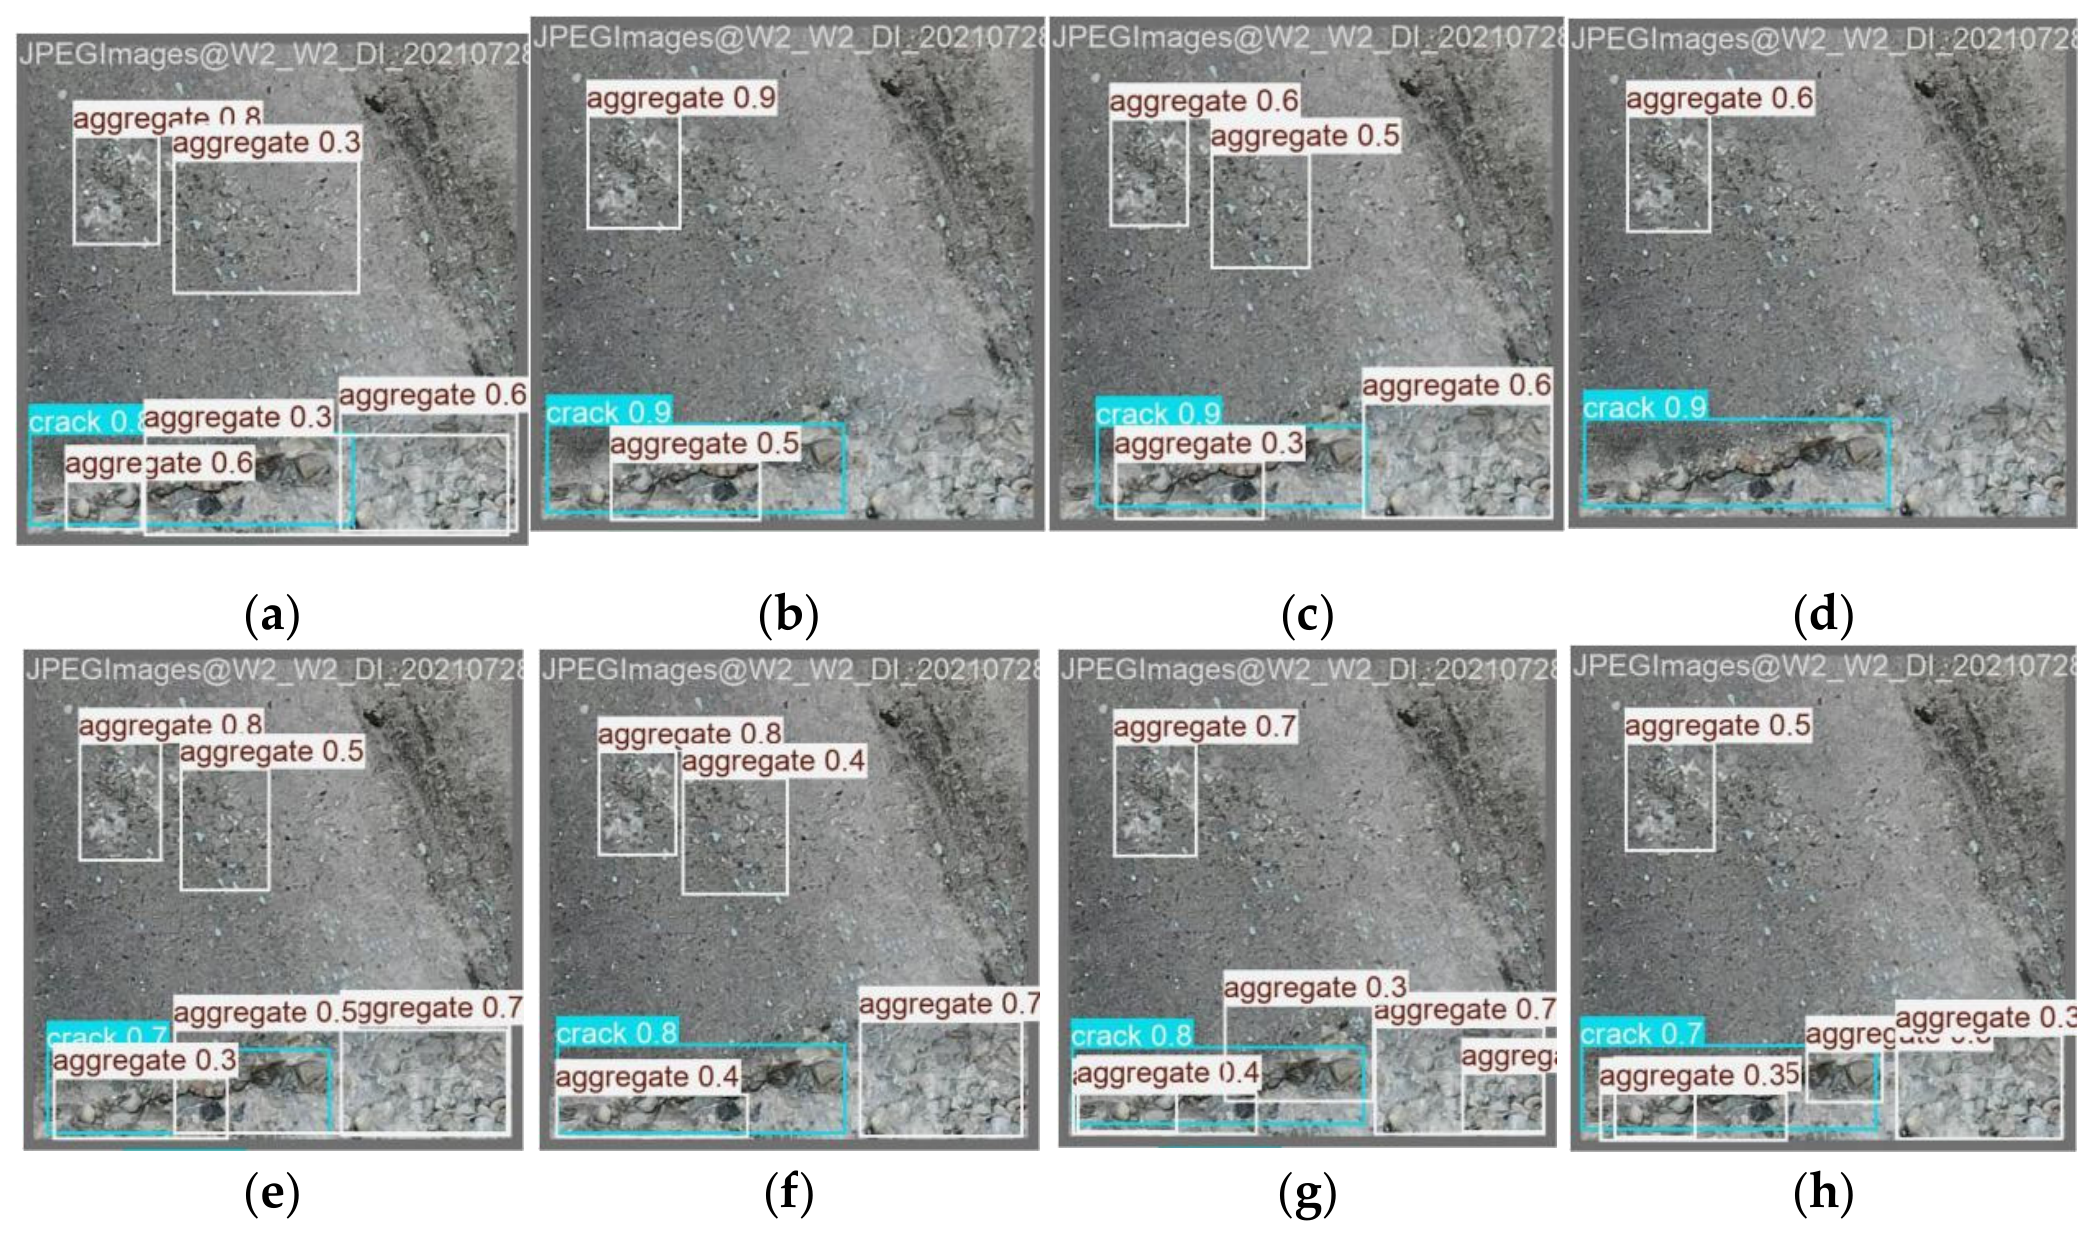
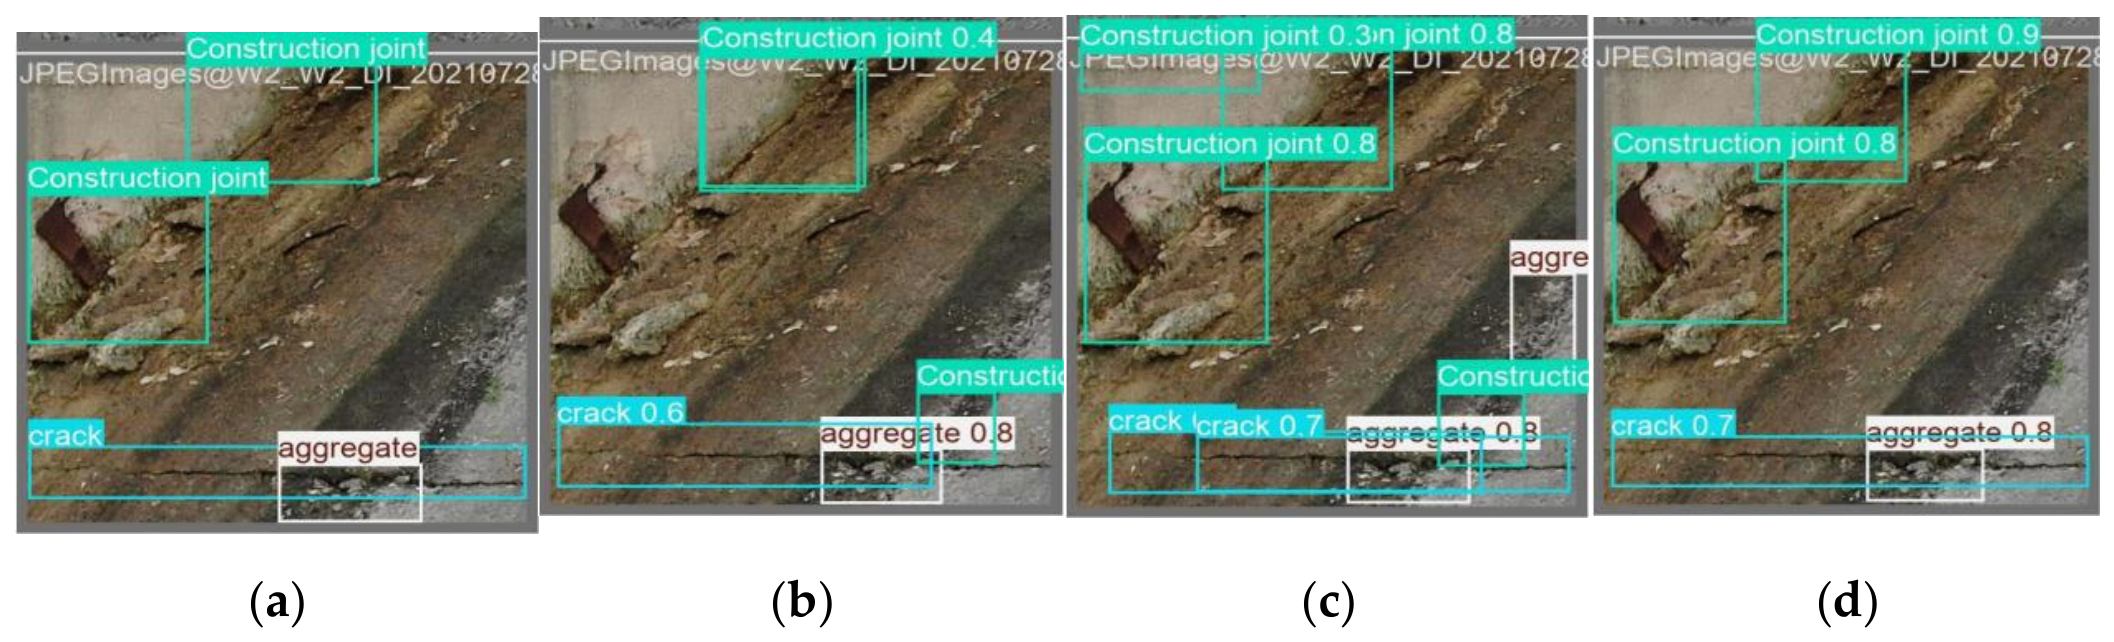
Figure 14 visually illustrates the defect detection performance of each model in scenarios where multiple defects coexist. Both YOLOv10l and YOLOv12l exhibit instances of missed and false-positive detections for construction joints; YOLOv10l exhibited significant missed detections in crack regions, failing to fully annotate all crack pixels; whereas YOLOv12l can detect cracks, it suffers from overlapping and clustered bounding boxes, as well as false positives for exposed aggregate. In contrast, the DCN-YOLO model achieved complete detection of all three defect types, with no missed or false positives, precise bounding box localization, and high agreement with manually annotated ground truth. These results clearly demonstrate that the method proposed in this paper, through the synergistic interaction of the DCNv4 dynamic sampling mechanism and the BCE multi-label optimization strategy, effectively enhances the ability to distinguish features of narrow cracks, low-contrast aggregates, and sparse construction joints, while suppressing cross-category interference, thereby significantly improving the robustness and accuracy of multi-object defect detection. In summary, across four sets of typical scenarios, the DCN-YOLO model consistently demonstrated optimal detection completeness and localization accuracy, validating the effectiveness of the proposed improvement strategy under complex conditions.

3.2.4. In-Depth Analysis and Validation of Model Performance

(1) Performing multi-object detection using a self-built multi-defect dataset
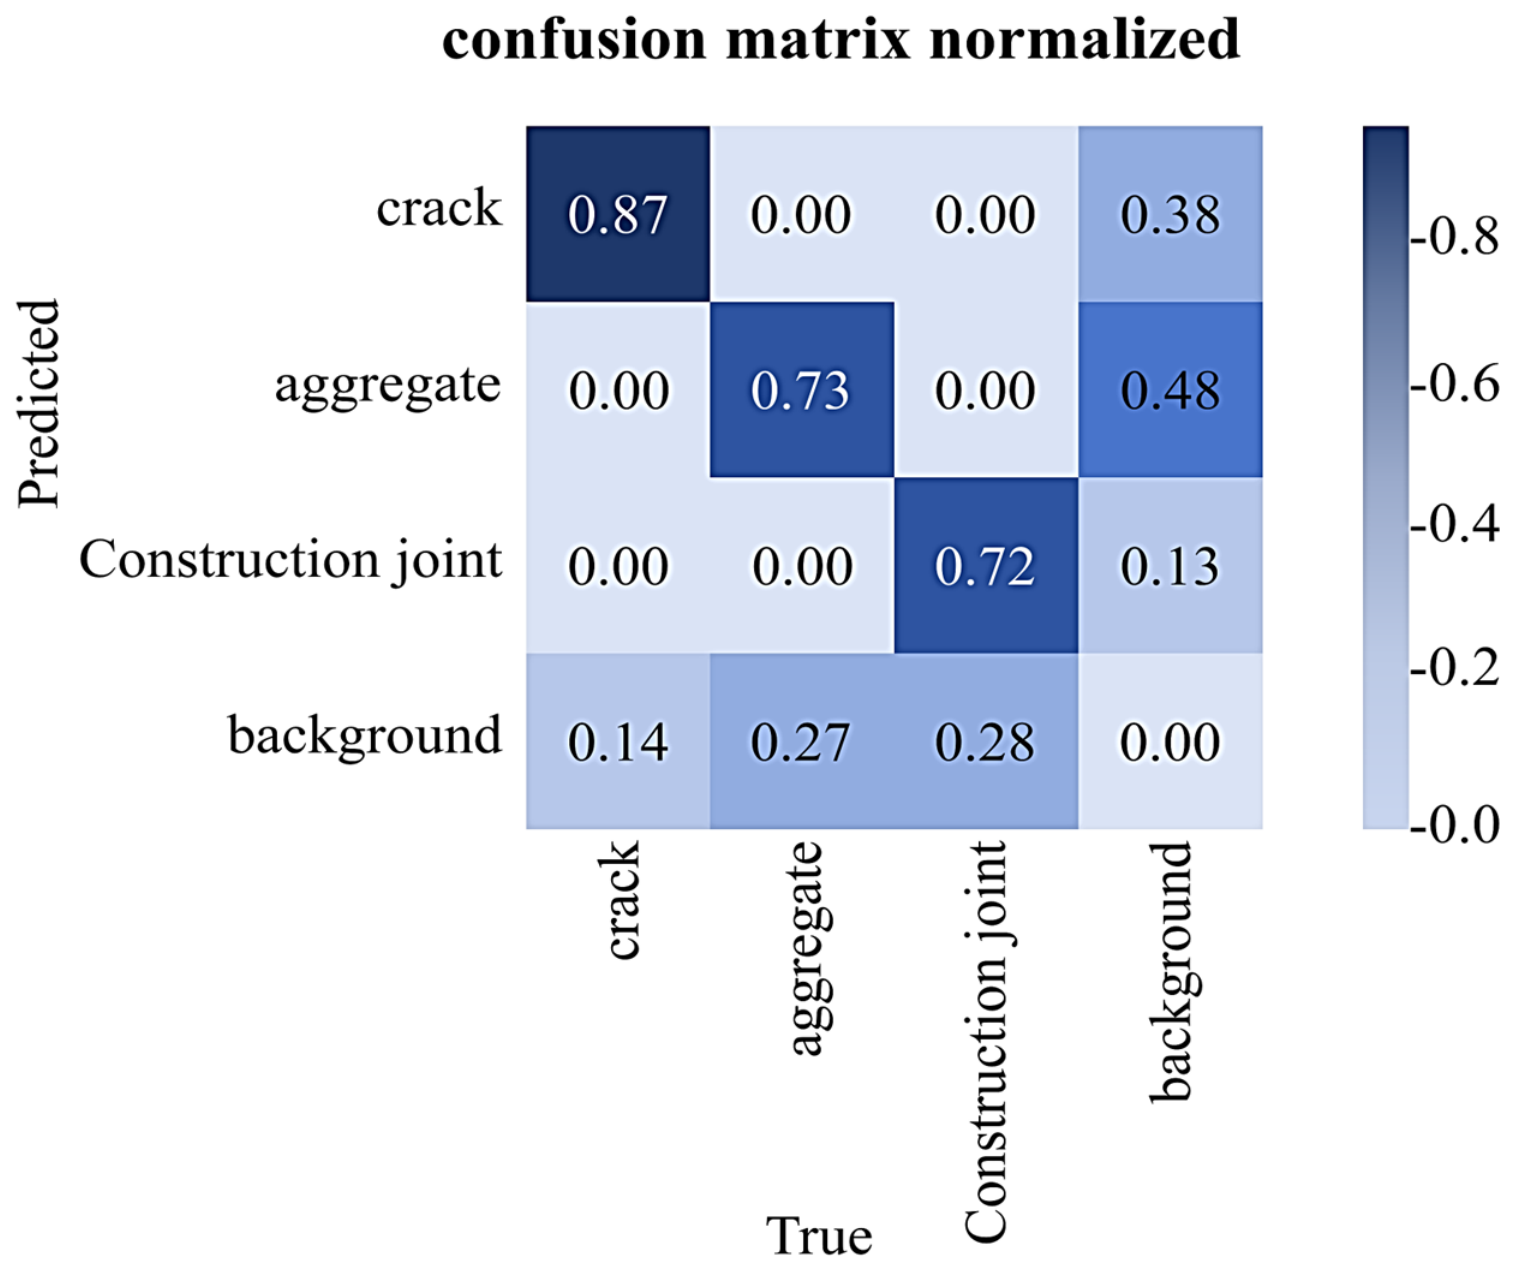
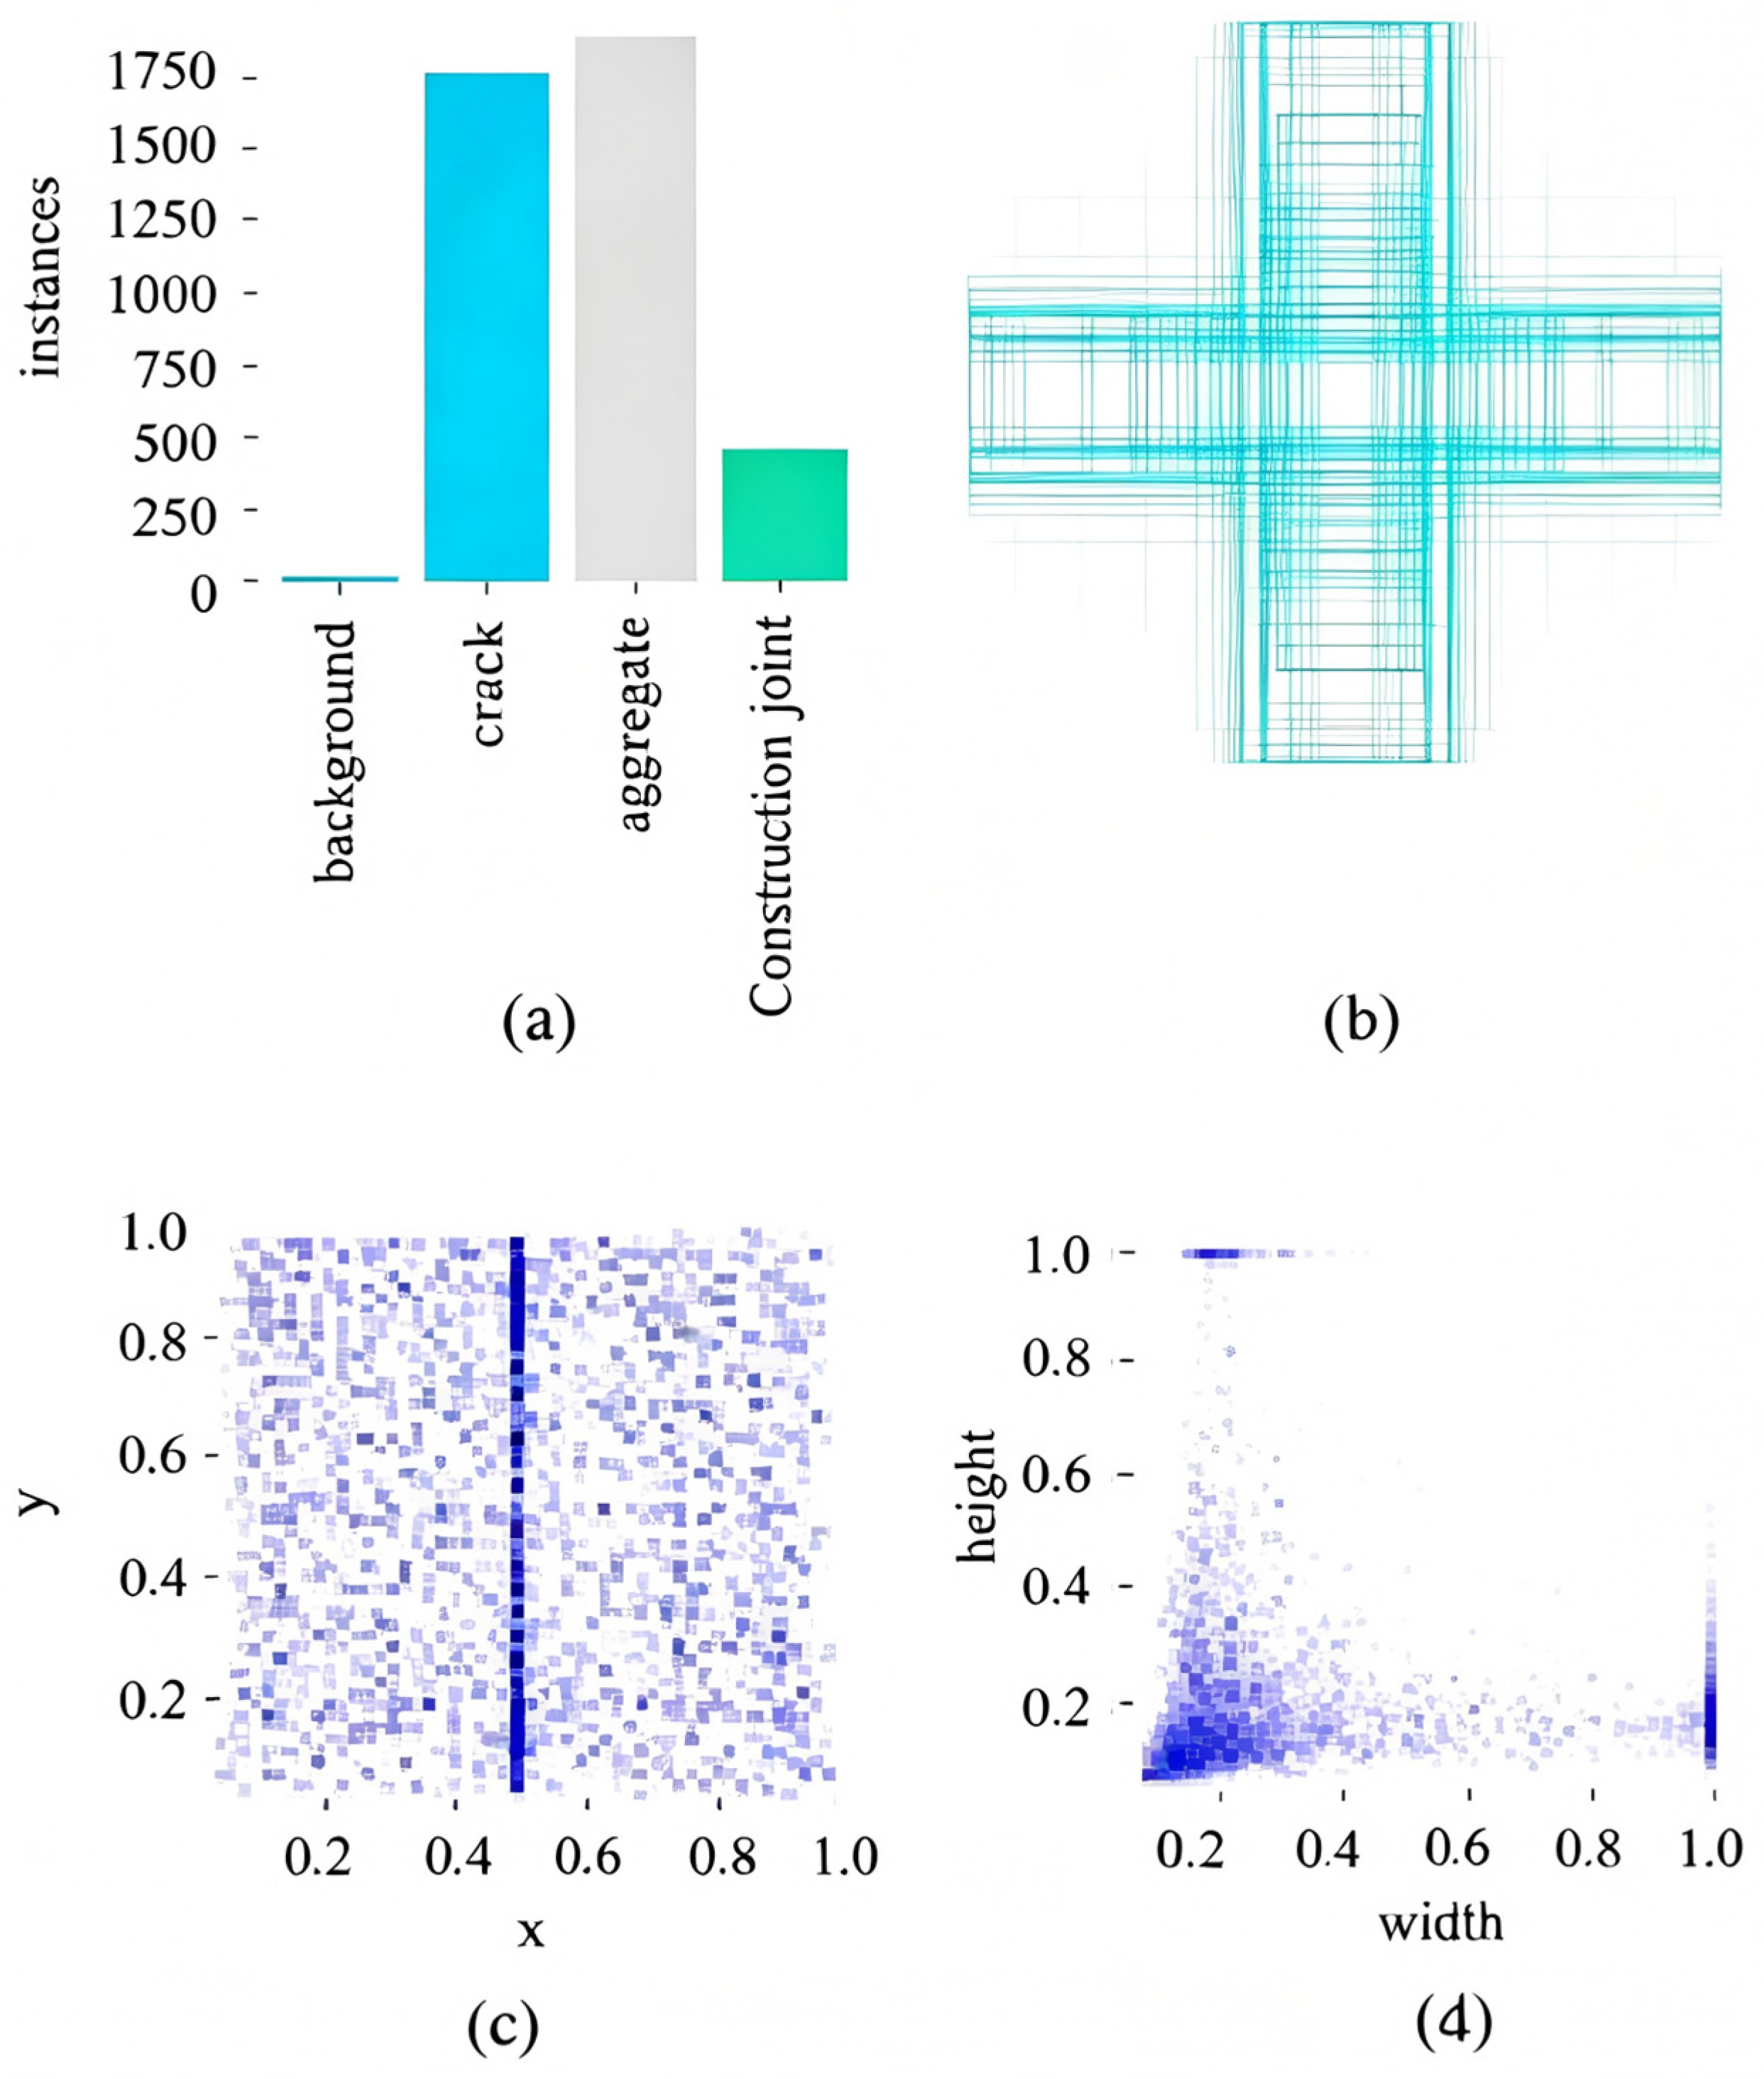
Figure 15 shows the model’s prediction results for each category, while Figure 16 presents the data, analysis, and target statistics. An analysis of Figure 15 and Figure 16 reveals that, for the self-built Multi defects dataset, due to the small number of construction joint samples, there is significant confusion between the construction joint target and the background. Consequently, construction joint defects introduce significant noise during model training, which may have a certain impact on the accuracy of crack and aggregate detection. However, Section 3.2.3 has already analyzed and validated the DCN-YOLO model’s comprehensive metrics and metrics for each damage type under conditions where three types of damage coexist. The experimental results have shown that even with a small number of “Construction joint” defect samples, the model can still achieve good performance across all metrics, thereby demonstrating its robust performance. Therefore, building on this foundation, we aim to objectively evaluate the model’s actual performance under conditions of sufficient data and to verify the impact of “Construction joint” defects on model performance. After removing construction joint targets, this paper retrained the model on the existing dataset; the prediction results are shown in Table 4.
Table 4 demonstrates that, after excluding “Construction joint” defects, the method proposed in this paper achieves the best mAP50-95 performance among all models and ranks second in terms of precision, trailing only FCOS. The FOCS model has the lowest recall value among all models, exhibiting severe false positives and is therefore not considered for practical engineering applications. In terms of recall, DCN-YOLO ranks second only to Faster R-CNN, making it the second-best model. Although the Faster R-CNN model has an advantage in recall, its mAP50-95 and precision metrics both lag behind those of DCN-YOLO. After a comprehensive analysis, it is concluded that DCN-YOLO is still superior to Faster R-CNN overall. It can therefore be concluded that DCN-YOLO possesses strong feature extraction capabilities, good stability, and high accuracy when performing multi-object detection tasks. Even when the number of training samples for a target is small or the targets are easily confused, the model can still adapt and reliably perform detection tasks. Furthermore, it achieves competitive performance for targets with few samples and is minimally affected by such limitations.
(2) Single-object detection using a self-built multi-defect dataset
The model proposed in this study achieves high-precision object detection for a variety of defects while maintaining the same high accuracy as single-object detection when each defect type appears individually. To validate this conclusion, Figure 17 presents a comparison of the performance of various models in single-object detection for different defect types.
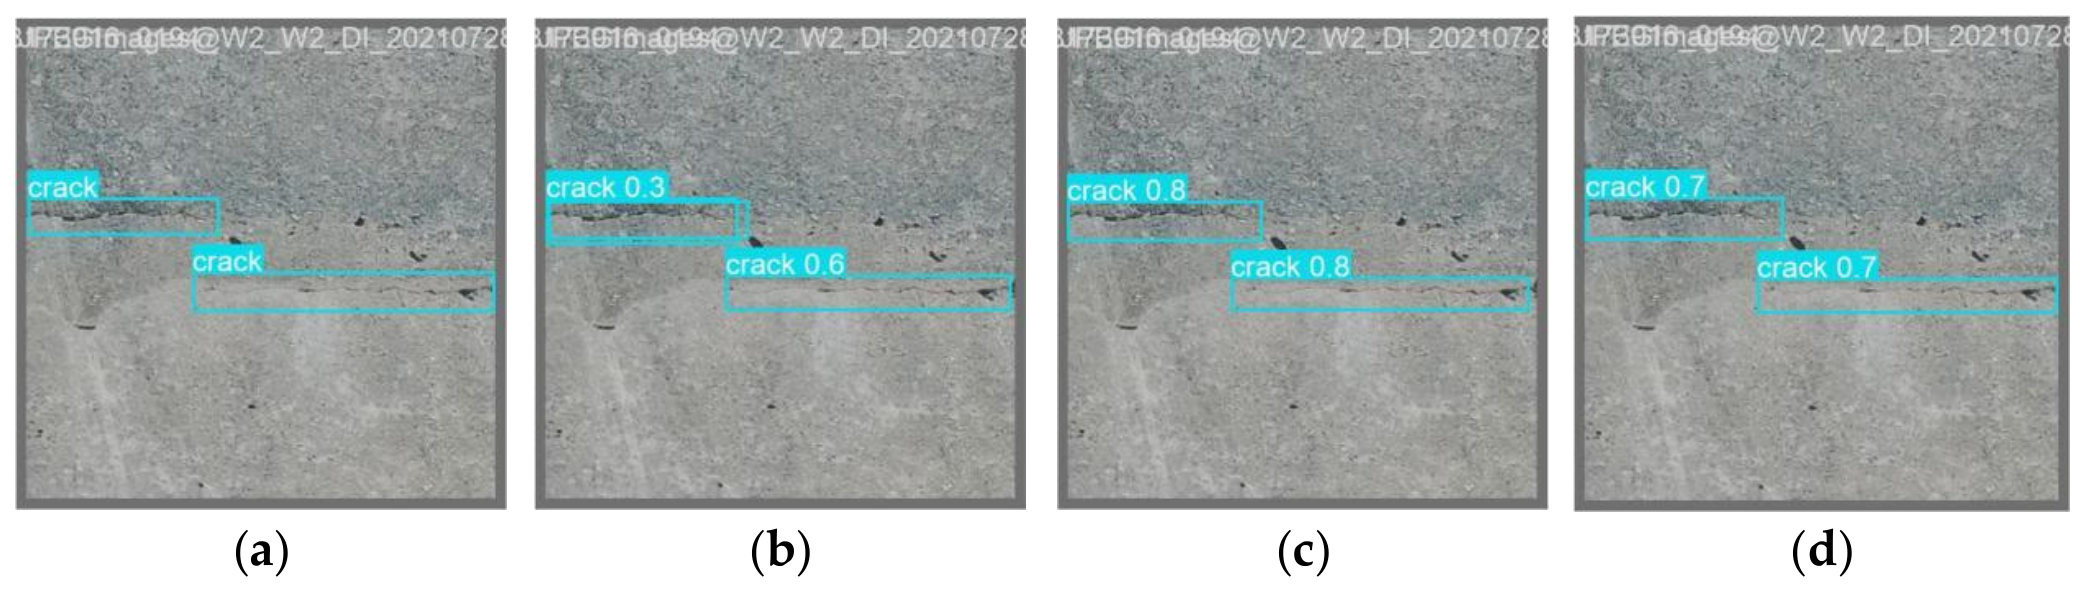
Cracks are the most dangerous type of defect among the visible defects in concrete dams. Their continued propagation significantly compromises the structural safety, stability, and durability of the dam, accelerates the aging process of the structure, and may even lead to through-cracks that cause seepage damage. Therefore, the early and accurate identification of cracks is of great engineering significance for ensuring the long-term operational safety of dams. This study covers complex scenarios such as longitudinal through-cracks, transverse wide cracks, and low-contrast microcracks, placing high demands on the feature extraction capabilities of detection algorithms. Figure 18 illustrates the prediction performance of each model when applied exclusively to the “Crack” scenario. As shown in Figure 18, in the crack scenario, YOLOv10l exhibited overlapping bounding boxes in the crack region, resulting in poor visual quality of the detected images; in contrast, the DCN-YOLO model’s bounding boxes better align with the actual crack contours compared to YOLOv12l, indicating higher localization accuracy. Experimental results show that in the single-object crack detection task, the DCN-YOLO model achieved precision, recall, mAP50, and mAP50-95 of 79.1%, 76.5%, 82.4%, and 42.0%, while both precision and recall were the second-best values among all compared models—second only to Faster R-CNN—DCN-YOLO still demonstrated relatively strong performance and delivered excellent overall results.
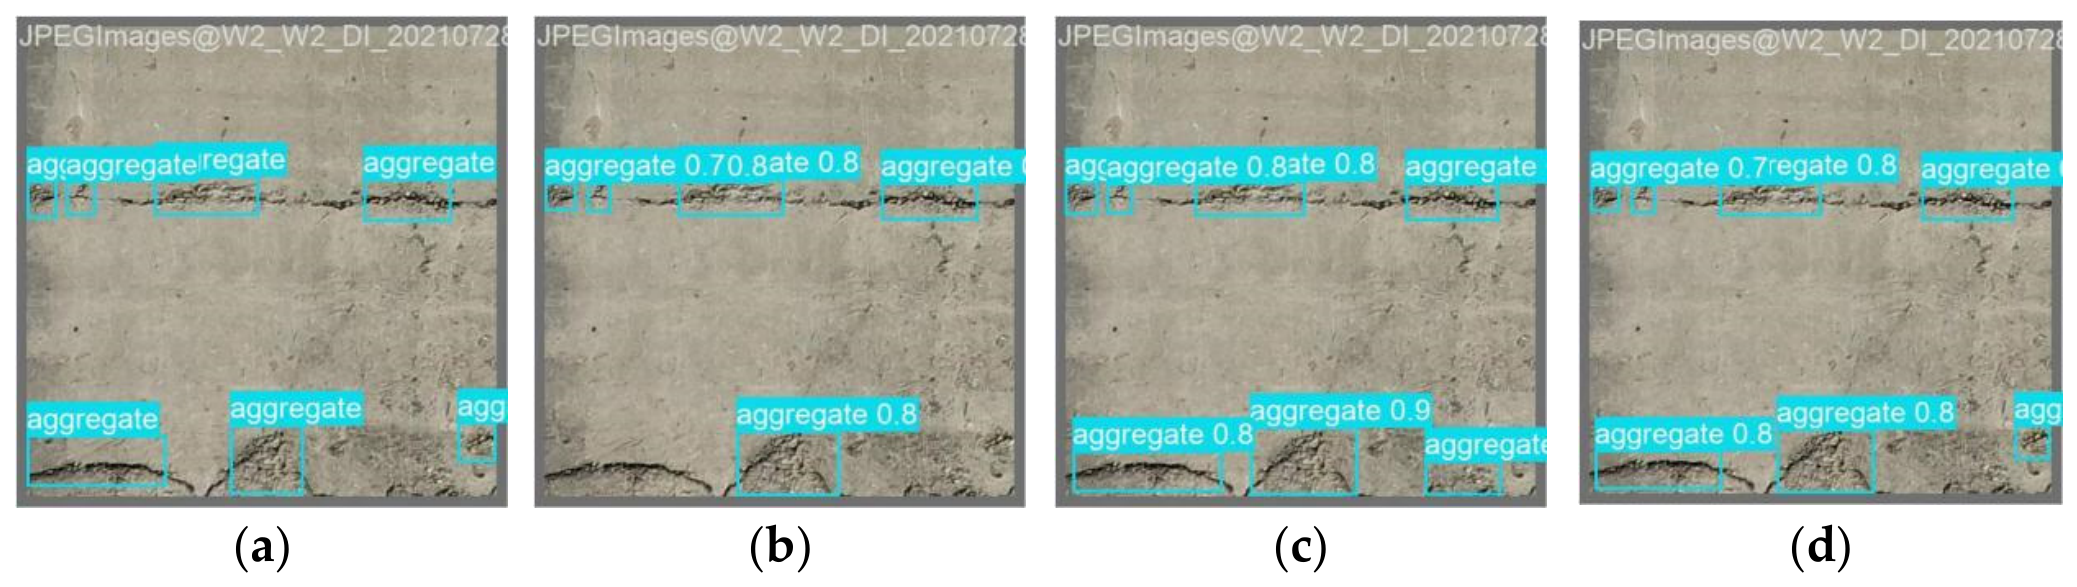
Aggregate exposure defects are primarily caused by the spalling of the surface concrete due to environmental factors such as water erosion, freeze-thaw cycles, and ultraviolet radiation, which directly expose the internal aggregate and pose a serious threat to the dam’s impermeability and mechanical properties. During detection, this type of defect poses challenges such as weak characteristic textures, extreme variations in scale (ranging from individual pixels to areas covering the entire image), and low contrast with the background. Figure 19 illustrates the prediction performance of each model specifically for the aggregate scenario. As shown in Figure 19, in the aggregate scenario, YOLOv10l failed to detect lower-region aggregate exposure, while YOLOv12l produced false positives; only the DCN-YOLO model achieved precise alignment with the original annotations. The method described in this paper achieved mAP50 and mAP50-95 scores of 69.4% and 31.7%, respectively, both of which were the best results. Its precision was 71.5%; although this was 14.5% lower than that of the best model, FCOS, FCOS’s recall was only 30.9%, significantly lower than that of DCN-YOLO. Therefore, DCN-YOLO remains among the top-performing models; In terms of recall, DCN-YOLO achieved 65.3%, ranking second only to Faster R-CNN. However, Faster R-CNN’s precision, mAP50, and mAP50-95 are all lower than those of DCN-YOLO by a significant margin. Therefore, overall, DCN-YOLO demonstrates the best performance in the aggregate scenario. The above results validate the robust feature extraction capability of the method proposed in this paper when handling multiscale objects, demonstrating its ability to effectively adapt to the diverse size characteristics of exposed aggregate defects.
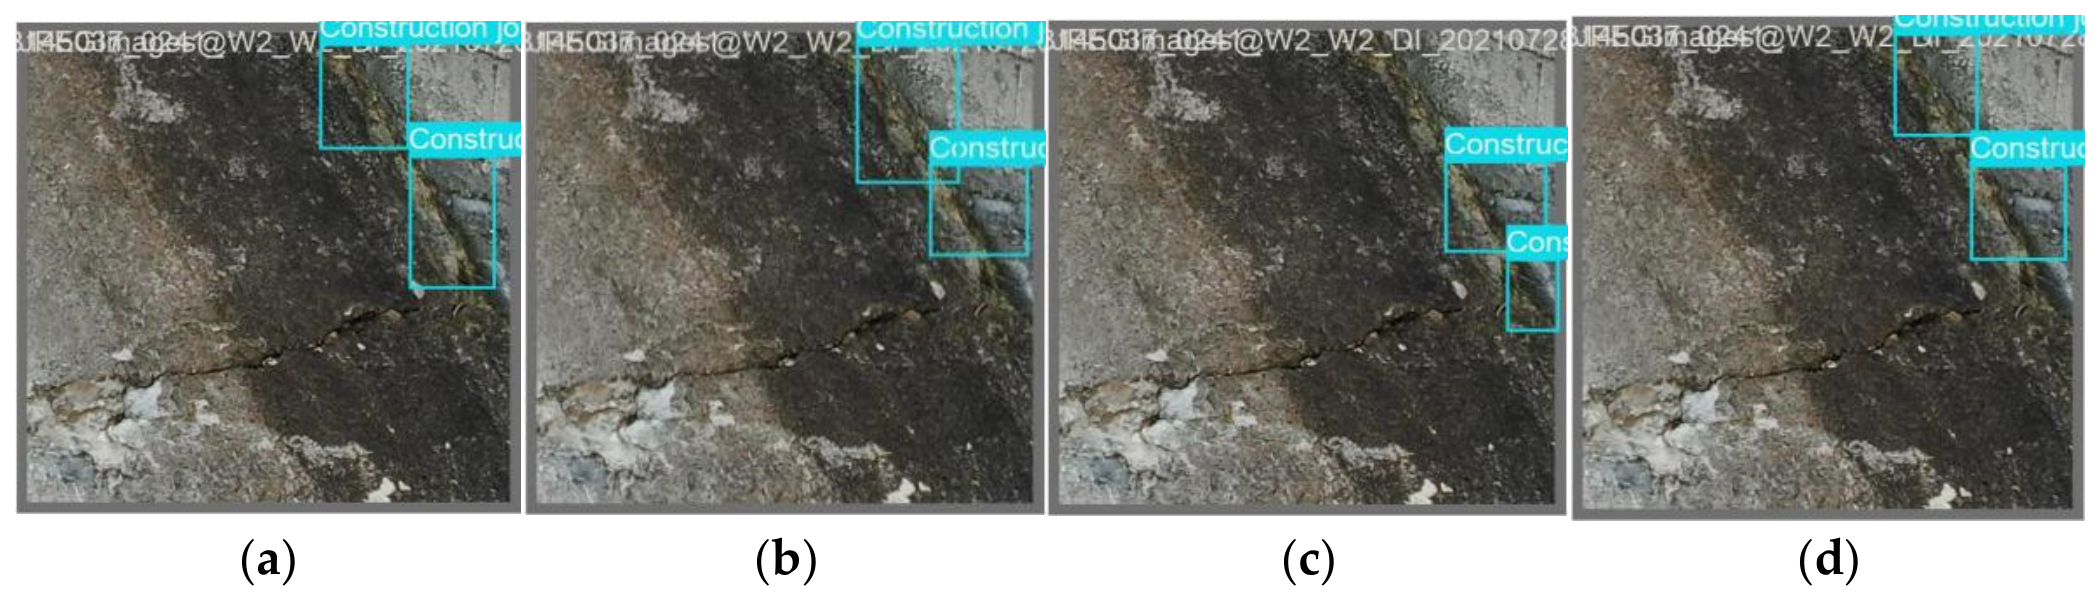
Construction joints, which form as structural interfaces resulting from the segmental pouring of concrete dams, are prone to deteriorating into cracks or causing aggregate exposure due to insufficient bond strength between new and old concrete and the development of seepage pathways. As such, they are critical areas for dam health monitoring. However, in actual engineering practice, construction joints are sparsely distributed, making sample collection difficult and resulting in a scarcity of training data. Additionally, due to their high similarity to cracks in terms of grayscale features and geometric morphology, class confusion is a significant issue, collectively constituting the core challenges of this study. Experimental results show that in the single-object detection task for construction joints, DCN-YOLO achieved mAP50, mAP50-95, and precision values of 65.1%, 25.6%, and 65.3%, respectively, all ranking first among all models. Its recall value was slightly lower than that of Faster R-CNN, making it the second-best model; its overall comprehensive performance was significantly better than that of YOLOv10l, YOLOv12-L, Faster R-CNN, and FCOS. As shown in Figure 20, YOLOv12l failed to detect blurred areas at the top of objects in the construction joint scenario, while YOLOv10l exhibited overlapping bounding boxes that deviate significantly from the original annotations, resulting in bounding box accuracy that was notably lower than that of the DCN-YOLO model.
The above results clearly demonstrate that, even under adverse conditions such as a scarcity of training samples and ambiguous class boundaries, the method proposed in this paper retains strong capabilities for learning discriminative features and capturing inter-class differences. It provides a reliable technical approach for the automated detection of construction joint defects and shows great potential for practical engineering applications.
(3) Verification of the model’s crack generalization performance using the public dataset CrackSeg
To assess the cross-domain transferability of the proposed DCN-YOLO architecture, the trained model was directly deployed on CrackSeg—a publicly available benchmark for pixel-level crack segmentation—without fine-tuning or domain adaptation. Table 5 presents the detailed information of CrackSeg dataset. Since current research on surface defects in concrete dams primarily focuses on cracks, and some studies involving multiple targets remain limited to simple image classification, we selected the CrackSeg dataset [67] after analyzing the major publicly available datasets. To ascertain the relative efficacy of DCN-YOLO for crack identification, controlled comparative trials were executed, and the derived quantitative outcomes are tabulated in Table 6 with optimal values denoted in bold.
As summarized in Table 6, the proposed DCN-YOLO attained an overall precision of 82.5% and a recall of 70.8%; concurrently, its mean average precision registered 75.3% at the 50% IoU threshold and 56.0% under the more stringent 50–95% criterion. Except for precision, which was 2.1% lower than that of YOLOv10l, the other three metrics were the best among all compared models.
Analysis suggests that the slightly lower precision score compared to YOLOv10l may be attributed to the following factors: During the conversion of the original annotation format of the CrackSeg dataset to the YOLO training format, overlapping bounding boxes in areas with dense cracks caused minor label contamination, which slightly disrupted model training and consequently introduced some bias in the precision calculation. However, quantitative reproducibility assessment across three independent seeds (42, 123, 2024) yielded standard deviations of 1.8% (precision), 0.2% (recall), 0.4% (mAP50), and 0.4% (mAP50-95) 0.1%, confirming stable performance with acceptable variance. Overall, DCN-YOLO maintained high detection accuracy and robustness across different datasets, validating its generalization capability and practical engineering value for the task of detecting surface defects in concrete structures.

4. Analysis and Discussion

The UAV-image-based model for detecting multiple types of defects in concrete dams proposed in this study enables the convenient and rapid detection and classification of defects in large-scale dam structures, thereby helping to quickly locate damage sites and identify the types of damage. However, it should be noted that this study also has some limitations.
The research on multi-object defects presented in this paper is based on a self-constructed dataset. Although this dataset contains a limited number of samples for construction joint defects, experimental results have demonstrated that the research methodology developed in this paper yields reliable performance metrics for this specific defect type. Given the current scarcity of public datasets covering both aggregate and construction joint defects in concrete dams, the research methodology presented herein lacks experimental comparisons using shared datasets for these two defect categories.
While DCN-YOLO demonstrates strong performance on the evaluated dam and the CrackSeg benchmark, deployment to substantially different hydraulic structures (e.g., dams with different concrete compositions, weathering patterns, or geometric configurations) may benefit from incremental fine-tuning with a small set of locally acquired images. Future work will explore semi-supervised learning and domain adaptation strategies to further reduce reliance on large annotated datasets.
Our method can classify various types of structural defects and locate them using image data. However, given that in the application scenarios of multi-target defect detection discussed in this paper, different types of defects often occur concurrently, the implementation of pixel-level segmentation for various defects raises challenges such as how to handle overlapping areas between different defect categories and the fact that some defects may span the entire image. Therefore, this paper does not provide further damage information, such as crack propagation depth, crack width, the extent of aggregate exposure, or concrete spalling around construction joints. Further non-destructive testing of specific structural defects in the dam can be achieved by combining other inspection technologies, such as fiber-optic sensing and ultrasonic testing.
In future research, the methods presented in this paper could be integrated with Building Information Modeling (BIM) technology. By leveraging the digital and parametric capabilities of BIM, it would be possible to achieve three-dimensional (3D) visualization of structural damage locations and dam damage information models for the quantitative analysis of various target defects, thereby enabling fully automated damage monitoring of concrete dams.

5. Conclusions

This study presents a fast and effective method for the automatic detection and classification of multiple defects based on UAV imagery and deep learning. The proposed method transforms the detection of structural damage in dams into an end-to-end process. The proposed method was validated and analyzed using a concrete gravity dam that has been in operation for a long time, leading to the following conclusions.
(1) This study proposes DCN-YOLO, a method for the automatic detection and localization of various types of damage in concrete dam structures. Based on the YOLOv12l object detection algorithm, this proposed model combines the deformable convolutional network DCNv4 with the original C3k2 operator to construct the C3k2_DCNv4 module. This approach enables both high accuracy and efficient identification and localization of various damage types. Consequently, in practical applications, engineers need only input UAV-captured images into the model, which automatically detects, classify, and output the multiple categories of structural damage present in the images. The intended operating point for DCN-YOLO in UAV deployment is as follows: input resolution 512 × 512 at 30 FPS (batch = 16), on ground-station RTX 3090. Flight parameters include 30–50 m altitude, 5–8 m/s speed, and 3–5 overlapping passes per zone.
(2) Through extensive ablation and comparative experiments, we validated the superior detection efficacy of the DCN-YOLO model and the effectiveness of the proposed improvement strategy. The ablation experiments indicated that the DCN-YOLO model, which integrates the C3k2_DCNv4 operator into layers P2 and P3, demonstrates the best overall performance. Compared to other improvement schemes—such as the introduction of GroupMamba, CGLU-DYT, and a small-object detection layer in P2—DCN-YOLO achieved the optimal balance between accuracy and efficiency.
(3) Benchmarking against four prevailing architectures: YOLOv10l, YOLOv12l, Faster R-CNN, and FCOS, reveals that DCN-YOLO attains a macro-averaged precision of 77.4%, corresponding to a 7.1 percentage-point absolute gain over the YOLOv12l baseline. At the per-class level, mAP50 scores of 86.3% (crack), 65.9% (aggregate exposure), and 66.3% (construction joint) were recorded, with each category outperforming all competing configurations. Furthermore, the model maintains reliable inference accuracy even under some adverse imaging conditions in the Multi-defect dataset—including oblique viewing angles, overexposure artifacts, and background blur suggesting that it has great potential for deployment in field structural health monitoring applications.
(4) Through single-object/multi-object separation detection, stability tests after removing construction joints, and transfer experiments on the CrackSeg public dataset, the generalization capability and engineering applicability of the DCN-YOLO model were thoroughly validated. Single-defect detection experiments demonstrate that the model maintains high accuracy even when various defects appear individually, with both precision and recall for crack detection achieving optimal values; experiments after removing construction joints show that the model retained stable feature extraction capabilities even under unfavorable conditions such as scarce training samples and high confusion. Generalization experiments on the CrackSeg dataset demonstrate that the model achieves optimal recall, mAP50, and mAP50-95 in cross-dataset evaluation, suggesting its potential robustness and practical value for visual defect detection tasks in concrete structures. Furthermore, the proposed DCN-YOLO architecture was less susceptible to environmental factors under adverse conditions such as rainy weather, water stains, and poor lighting, demonstrating strong potential for emergency condition inspections applications. In subsequent attempts to deploy this technology in actual engineering projects, through further data analysis and supplementary experimental research, it could be explored as a smart inspection solution for concrete dams in harsh environments, thereby achieving the goals of reducing labor costs and operational safety risks.

Author Contributions

W.X.: conceptualization, methodology, software, investigation, writing—original draft. W.Z.: methodology, software, experiments, writing. B.X.: resources, supervision, project administration, funding acquisition, review and editing. All authors have read and agreed to the published version of the manuscript.

Funding

This research was funded by the Open Research Fund Program of State Key Laboratory of Water Disaster Prevention (Grant No. 2024490211).

Data Availability Statement

The original contributions presented in the study are included in the article, further inquiries can be directed to the corresponding author.

Conflicts of Interest

The authors declare no conflicts of interest.

References

  1. Li, Y.; Bao, T.; Gao, Z.; Shu, X.; Zhang, K.; Xie, L.; Zhang, Z. A new dam structural response estimation paradigm powered by deep learning and transfer learning techniques. Struct. Health Monit. 2022, 21, 770–787. [Google Scholar] [CrossRef]
  2. Zhu, Y.; Niu, X.; Tian, J. A machine vision-based intelligent segmentation method for dam underwater cracks using swarm optimization algorithm and deep learning. Comput.-Aided Civ. Infrastruct. Eng. 2025, 40, 1405–1417. [Google Scholar] [CrossRef]
  3. Jia, J. A technical review of hydro-project development in China. Engineering 2016, 2, 302–312. [Google Scholar] [CrossRef]
  4. ACI Committee 207. Report on Thermal and Volume Change Effects on Cracking of Mass Concrete (ACI 207.2R-07); American Concrete Institute: Farmington Hills, MI, USA, 2007. [Google Scholar]
  5. fib. fib Model Code for Concrete Structures 2010; Ernst & Sohn: Berlin, Germany, 2013. [Google Scholar]
  6. Liang, M.; Fang, Y.; Guo, W.; He, C.; Schlangen, E.; Šavija, B.; Contera, S. Deep active sequential lea4rning of stress evolution in early-age concrete informed by thermo-chemo-mechanical modelling. Eng. Appl. Artif. Intell. 2026, 177, 114985. [Google Scholar] [CrossRef]
  7. Bazant, Z.P.; Baweja, S. Creep and shrinkage prediction model for analysis and design of concrete structures: Model B3. ACI Spec. Publ. 2000, 194, 1–84. [Google Scholar]
  8. Li, Y.; Bao, T.; Huang, X.; Wang, R.; Shu, X.; Xu, B.; Tu, J.; Zhou, Y.; Zhang, K. An integrated underwater structural multi-defects automatic identification and quantification framework for hydraulic tunnel via machine vision and deep learning. Struct. Health Monit. 2023, 22, 2360–2383. [Google Scholar] [CrossRef]
  9. Jang, K.; An, Y.; Kim, B.; Cho, S. Automated crack evaluation of a high-rise bridge pier using a ring-type climbing robot. Comput.-Aided Civ. Infrastruct. Eng. 2021, 36, 14–29. [Google Scholar] [CrossRef]
  10. Liu, Y.; Li, H.; Wang, Y.; Men, Y.; Xu, Q. Damage detection of tunnel based on the high-density cross-sectional curvature obtained using strain data from BOTDA sensors. Mech. Syst. Signal Process. 2021, 158, 107728. [Google Scholar] [CrossRef]
  11. Li, Y.; Wang, H.; Cai, W.; Li, S.; Zhang, Q. Stability monitoring of surrounding rock mass on a forked tunnel using both strain gauges and FBG sensors. Measurement 2020, 153, 107449. [Google Scholar] [CrossRef]
  12. Liang, J.; Chen, B.; Shao, C.; Li, J.; Wu, B. Time reverse modeling of damage detection in underwater concrete beams using piezoelectric intelligent modules. Sensors 2020, 20, 7318. [Google Scholar] [CrossRef] [PubMed]
  13. Li, Y.; Bao, T.; Shu, X.; Gao, Z.; Gong, J.; Zhang, K. Data-driven crack behavior anomaly identification method for concrete dams in long-term service using offline and online change point detection. J. Civ. Struct. Health Monit. 2021, 11, 1449–1460. [Google Scholar] [CrossRef]
  14. Kim, B.; Natarajan, Y.; Preethaa, K.S.; Song, S.; An, J.; Mohan, S. Real-time assessment of surface cracks in concrete structures using integrated deep neural networks with autonomous unmanned aerial vehicle. Eng. Appl. Artif. Intell. 2024, 129, 107537. [Google Scholar] [CrossRef]
  15. Hu, Y.; Chen, N.; Hou, Y.; Lin, X.; Jing, B.; Liu, P. Lightweight deep learning for real-time road distress detection on mobile devices. Nat. Commun. 2025, 16, 4212. [Google Scholar] [CrossRef] [PubMed]
  16. He, Y.; Liu, Z.; Guo, Y.; Zhu, Q.; Fang, Y.; Yin, Y.; Wang, Y.; Zhang, B.; Liu, Z. UAV based sensing and imaging technologies for power system detection, monitoring and inspection: A review. Nondestruct. Test. Eval. 2024, 49, 5681–5748. [Google Scholar] [CrossRef]
  17. Morgenthal, G.; Hallermann, N.; Kersten, J.; Taraben, J.; Debus, P.; Helmrich, M.; Rodehorst, V. Framework for automated UAS-based structural condition assessment of bridges. Autom. Constr. 2019, 97, 77–95. [Google Scholar] [CrossRef]
  18. Hallermann, N.; Morgenthal, G.; Rodehorst, V. Vision-based deformation monitoring of large scale structures using Unmanned Aerial Systems. In IABSE Symposium Report; International Association for Bridge and Structural Engineering: Zürich, Switzerland, 2014; Volume 102, pp. 2852–2859. [Google Scholar]
  19. Zhao, S.; Kang, F.; Li, J.; Gong, J.; Yang, M.; Xie, L. Precision UAV image-to-BIM registration through contour-based matching for concrete dam structural health monitoring. Autom. Constr. 2025, 180, 106536. [Google Scholar] [CrossRef]
  20. Zhao, S.; Kang, F.; Li, J.; Ma, C. Structural health monitoring and inspection of dams based on UAV photogrammetry with image 3D reconstruction. Autom. Constr. 2021, 130, 103832. [Google Scholar] [CrossRef]
  21. Huang, B.; Kang, F.; Li, X.; Zhu, S. Underwater dam crack image generation based on unsupervised image-to-image translation. Autom. Constr. 2024, 163, 105430. [Google Scholar] [CrossRef]
  22. Chen, Y.; Lin, P.; Zhu, G.; Xiang, Y.; Wang, Z.; Mou, R.; Deng, Z.; Xie, H.; Cai, M.; Wang, H. Key technologies for intelligent construction and smart operation and maintenance of large-scale hydraulic tunnels. J. Intell. Constr. 2025, 3, 1–19. [Google Scholar] [CrossRef]
  23. Villarino, A.; Valenzuela, H.; Antón, N.; Domínguez, M.; Cubillos, X.C.M. UAV applications for monitoring and management of civil infrastructures. Infrastructures 2025, 10, 106. [Google Scholar] [CrossRef]
  24. Zhang, B.; Ouyang, C.; Cui, P.; Xu, Q.; Wang, D.; Zhang, F.; Li, Z.; Fan, L.; Lovati, M.; Liu, Y.; et al. Deep learning for cross-region streamflow and flood forecasting at a global scale. Innov. 2024, 5, 100617. [Google Scholar] [CrossRef] [PubMed]
  25. Hsieh, Y.A.; Tsai, Y.J. Machine learning for crack detection: Review and model performance comparison. J. Comput. Civ. Eng. 2020, 34, 04020038. [Google Scholar] [CrossRef]
  26. Zhang, H.; Liu, J.; Hu, G. FCN attention enhancing asphalt pavement crack detection through attention mechanisms and fully convolutional networks. Sci. Rep. 2025, 15, 25257. [Google Scholar] [CrossRef] [PubMed]
  27. Fu, D.; Su, C.; Wang, W.; Yuan, R. Deep learning based lithology classification of drill core images. PLoS ONE 2022, 17, e0270826. [Google Scholar] [CrossRef] [PubMed]
  28. Bazrafshan, P.; Ebrahimkhanlou, A. Physics-based analysis and data-driven detection of artificial intelligence–generated surface crack images for civil infrastructure monitoring. J. Comput. Civ. Eng. 2026, 40, 04025120. [Google Scholar] [CrossRef]
  29. Paal, S.G.; Jeon, J.S.; Brilakis, I.; DesRoches, R. Automated damage index estimation of reinforced concrete columns for post-earthquake evaluations. J. Struct. Eng. 2014, 141, 04014228. [Google Scholar]
  30. Chen, F.C.; Jahanshahi, M.R. NB-CNN: Deep learning-based crack detection using convolutional neural network and Naïve Bayes data fusion. IEEE Trans. Ind. Electron. 2017, 65, 4392–4400. [Google Scholar]
  31. Dorafshan, S.; Thomas, R.J.; Maguire, M. Comparison of deep convolutional neural networks and edge detectors for image-based crack detection in concrete. Constr. Build. Mater. 2018, 186, 1031–1045. [Google Scholar] [CrossRef]
  32. Bhowmick, S.; Nagarajaiah, S.; Veeraraghavan, A. Vision and deep learning-based algorithms to detect and quantify cracks on concrete surfaces from UAV videos. Sensors 2020, 20, 6299. [Google Scholar] [CrossRef] [PubMed]
  33. Bazrafshan, P.; Osan, R.; Ebrahimkhanlou, A. Vision-based quantification of stiffness degradation in reinforced concrete shear walls using graph-based surface crack features and machine learning. J. Struct. Eng. 2026, 152, 04026047. [Google Scholar] [CrossRef]
  34. Li, Y.; Bao, T.; Xu, B.; Shu, X.; Zhou, Y.; Du, Y.; Wang, R.; Zhang, K. A deep residual neural network framework with transfer learning for concrete dams patch-level crack classification and weakly-supervised localization. Measurement 2022, 188, 110641. [Google Scholar] [CrossRef]
  35. Su, P.; Han, H.; Liu, M.; Yang, T.; Liu, S. MOD-YOLO: Rethinking the YOLO architecture at the level of feature information and applying it to crack detection. Expert Syst. Appl. 2024, 237, 121346. [Google Scholar] [CrossRef]
  36. Pang, D.; Zhang, H.; Cao, Y.; Jiang, Y. Lightweight and high-performance object detector and tracking model for concrete surface defect detection. Eng. Appl. Artif. Intell. 2025, 160, 111968. [Google Scholar] [CrossRef]
  37. Zhou, K.; Shi, J.-L.; Fu, J.-Y.; Zhang, S.-X.; Liao, T.; Yang, C.-Q.; Wu, J.-R.; He, Y.-C. An improved YOLOv10 algorithm for automated damage detection of glass curtain-walls in high-rise buildings. J. Build. Eng. 2025, 101, 111812. [Google Scholar] [CrossRef]
  38. Zhang, J.; Qian, S.; Tan, C. Automated bridge surface crack detection and segmentation using computer vision-based deep learning model. Eng. Appl. Artif. Intell. 2022, 115, 105225. [Google Scholar] [CrossRef]
  39. Zhao, Y.; Lv, W.; Xu, S.; Wei, J.; Wang, G.; Dang, Q.; Liu, Y.; Chen, J. DETRs beat YOLOs on real-time object detection. In Proceedings of the IEEE/CVF Conference on Computer Vision and Pattern Recognition; IEEE: New York, NY, USA, 2024; pp. 16965–16974. [Google Scholar] [CrossRef]
  40. Tian, Y.; Ye, Q.; Doermann, D. YOLOv12: Attention-centric real-time object detectors. arXiv 2025, arXiv:2502.12524. [Google Scholar]
  41. Momeni, H.; Dolatshahi, K.M. Predictive equations for drift ratio and damage assessment of RC shear walls using surface crack patterns. Eng. Struct. 2019, 190, 410–421. [Google Scholar] [CrossRef]
  42. Ren, S.; He, K.; Girshick, R.; Sun, J. Faster R-CNN: Towards real-time object detection with region proposal networks. IEEE Trans. Pattern Anal. Mach. Intell. 2016, 39, 1137–1149. [Google Scholar] [CrossRef] [PubMed]
  43. Redmon, J.; Divvala, S.; Girshick, R.; Farhadi, A. You only look once: Unified, real-time object detection. In Proceedings of the IEEE Conference on Computer Vision and Pattern Recognition; IEEE: New York, NY, USA, 2016; pp. 779–788. [Google Scholar] [CrossRef]
  44. Redmon, J.; Farhadi, A. YOLO9000: Better, faster, stronger. In Proceedings of the IEEE Conference on Computer Vision and Pattern Recognition; IEEE: New York, NY, USA, 2017; pp. 7263–7271. [Google Scholar]
  45. Wang, Z.; Men, S.; Bai, Y.; Yuan, Y.; Wang, J.; Wang, K.; Zhang, L. Improved small object detection algorithm CRL-YOLOv5. Sensors 2024, 24, 6437. [Google Scholar] [CrossRef] [PubMed]
  46. Jiang, X.; Meng, L.; Chen, X.; Xu, Y.; Wu, D. CSP-Net: Common spatial pattern empowered neural networks for EEG-based motor imagery classification. Knowl.-Based Syst. 2024, 305, 112668. [Google Scholar] [CrossRef]
  47. Cao, L.; Li, H.; Xie, R.; Zhu, J. A text detection algorithm for image of student exercises based on CTPN and enhanced YOLOv3. IEEE Access 2020, 8, 176924–176934. [Google Scholar] [CrossRef]
  48. Bukaita, W. Deep Learning-based Severity Classification of Concrete Cracks using YOLOv8 for Structural Health Analysis. Lond. J. Eng. Res. 2025, 25, 13–26. [Google Scholar] [CrossRef]
  49. Zhang, H.; Jiang, X.; Liu, Y.; Qian, J.; Ni, L. Improvement of Dam Crack Detection Algorithm for YOLOv9. IET Image Process. 2025, 19, e70124. [Google Scholar] [CrossRef]
  50. Mayya, A.M.; Alkayem, N.F. Enhance the concrete crack classification based on a novel multi-stage YOLOV10-ViT framework. Sensors 2024, 24, 8095. [Google Scholar] [CrossRef] [PubMed]
  51. He, L.; Zhou, Y.; Liu, L.; Ma, J. Research and application of YOLOv11-based object segmentation in intelligent recognition at construction sites. Buildings 2024, 14, 3777. [Google Scholar] [CrossRef]
  52. Katharopoulos, A.; Vyas, A.; Pappas, N.; Fleuret, F. Transformers are rnns: Fast autoregressive transformers with linear attention. In International Conference on Machine Learning; PMLR: New York, NY, USA, 2020; pp. 5156–5165. [Google Scholar]
  53. Xie, E.; Chen, J.; Chen, J.; Cai, H.; Tang, H.; Lin, Y.; Han, S. SANA: Efficient high-resolution text-to-image synthesis with linear diffusion transformers. In The Thirteenth International Conference on Learning Representations; Curran Associates, Inc.: Red Hook, NY, USA, 2025. [Google Scholar]
  54. Xiong, Y.; Zeng, Z.; Chakraborty, R.; Tan, M.; Fung, G.; Li, Y.; Singh, V. Nyströmformer: A nyström-based algorithm for approximating self-attention. In Proceedings of the AAAI Conference on Artificial Intelligence; AAAI Press: Washington, DC, USA, 2021; Volume 35, pp. 14138–14148. [Google Scholar]
  55. Bhojanapalli, S.; Yun, C.; Rawat, A.S.; Reddi, S.; Kumar, S. Low-rank bottleneck in multi-head attention models. In International Conference on Machine Learning; PMLR: New York, NY, USA, 2020; pp. 864–873. [Google Scholar]
  56. Wang, C.-Y.; Bochkovskiy, A.; Liao, H.-Y.M. YOLOv7: Trainable bag-of-freebies sets new state-of-the-art for real-time object detectors. In Proceedings of the IEEE/CVF Conference on Computer Vision and Pattern Recognition; IEEE: New York, NY, USA, 2023; pp. 7464–7475. [Google Scholar] [CrossRef]
  57. Shamshad, F.; Khan, S.; Zamir, S.W.; Khan, M.H.; Hayat, M.; Khan, F.S.; Fu, H. Transformers in medical imaging: A survey. Med. Image Anal. 2023, 88, 102802. [Google Scholar] [CrossRef] [PubMed]
  58. Dai, J.; Qi, H.; Xiong, Y.; Li, Y.; Zhang, G.; Hu, H.; Wei, Y. Deformable convolutional networks. In Proceedings of the IEEE International Conference on Computer Vision; IEEE: New York, NY, USA, 2017; pp. 764–773. [Google Scholar] [CrossRef]
  59. Zhu, X.; Hu, H.; Lin, S.; Dai, J. Deformable convnets v2: More deformable, better results. In Proceedings of the IEEE/CVF Conference on Computer Vision and Pattern Recognition; IEEE: New York, NY, USA, 2019; pp. 9300–9308. [Google Scholar] [CrossRef]
  60. Wang, W.; Dai, J.; Chen, Z.; Huang, Z.; Li, Z.; Zhu, X.; Hu, X.; Lu, T.; Lu, L.; Li, H.; et al. Internimage: Exploring large-scale vision foundation models with deformable convolutions. In Proceedings of the IEEE/CVF Conference on Computer Vision and Pattern Recognition; IEEE: New York, NY, USA, 2023; pp. 14408–14419. [Google Scholar] [CrossRef]
  61. Xiong, Y.; Li, Z.; Chen, Y.; Wang, F.; Zhu, X.; Luo, J.; Wang, W.; Lu, T.; Li, H.; Qiao, Y.; et al. Efficient deformable convnets: Rethinking dynamic and sparse operator for vision applications. In Proceedings of the IEEE/CVF Conference on Computer Vision and Pattern Recognition; IEEE: New York, NY, USA, 2024; pp. 5652–5661. [Google Scholar] [CrossRef]
  62. Li, X.; Wang, W.; Wu, L.; Chen, S.; Hu, X.; Li, J.; Yang, J. Generalized focal loss: Learning qualified and distributed bounding boxes for dense object detection. Adv. Neural Inf. Process. Syst. 2020, 33, 21002–21012. [Google Scholar]
  63. Bae, M.-H.; Park, S.-W.; Park, J.; Jung, S.-H.; Sim, C.-B. YOLO-RACE: Reassembly and convolutional block attention for enhanced dense object detection. Pattern Anal. Appl. 2025, 28, 90. [Google Scholar] [CrossRef]
  64. Zhao, S.; Kang, F.; Li, J.; Gong, J. Advanced registration method of UAV photogrammetry point clouds with BIM for 3D localization in concrete dams. Adv. Eng. Inform. 2025, 64, 102978. [Google Scholar] [CrossRef]
  65. Shaker, A.; Wasim, S.T.; Khan, S.; Gall, J.; Khan, F.S. GroupMamba: Efficient group-based visual state space model. In Proceedings of the Computer Vision and Pattern Recognition Conference; IEEE: New York, NY, USA, 2025; pp. 14912–14922. [Google Scholar] [CrossRef]
  66. Zhu, J.; Chen, X.; He, K.; LeCun, Y.; Liu, Z. Transformers without normalization. In Proceedings of the Computer Vision and Pattern Recognition Conference; IEEE: New York, NY, USA, 2025; pp. 14901–14911. [Google Scholar] [CrossRef]
  67. Li, Y.; Ma, R.; Liu, H.; Cheng, G. Real-time high-resolution neural network with semantic guidance for crack segmentation. Autom. Constr. 2023, 156, 105112. [Google Scholar] [CrossRef]
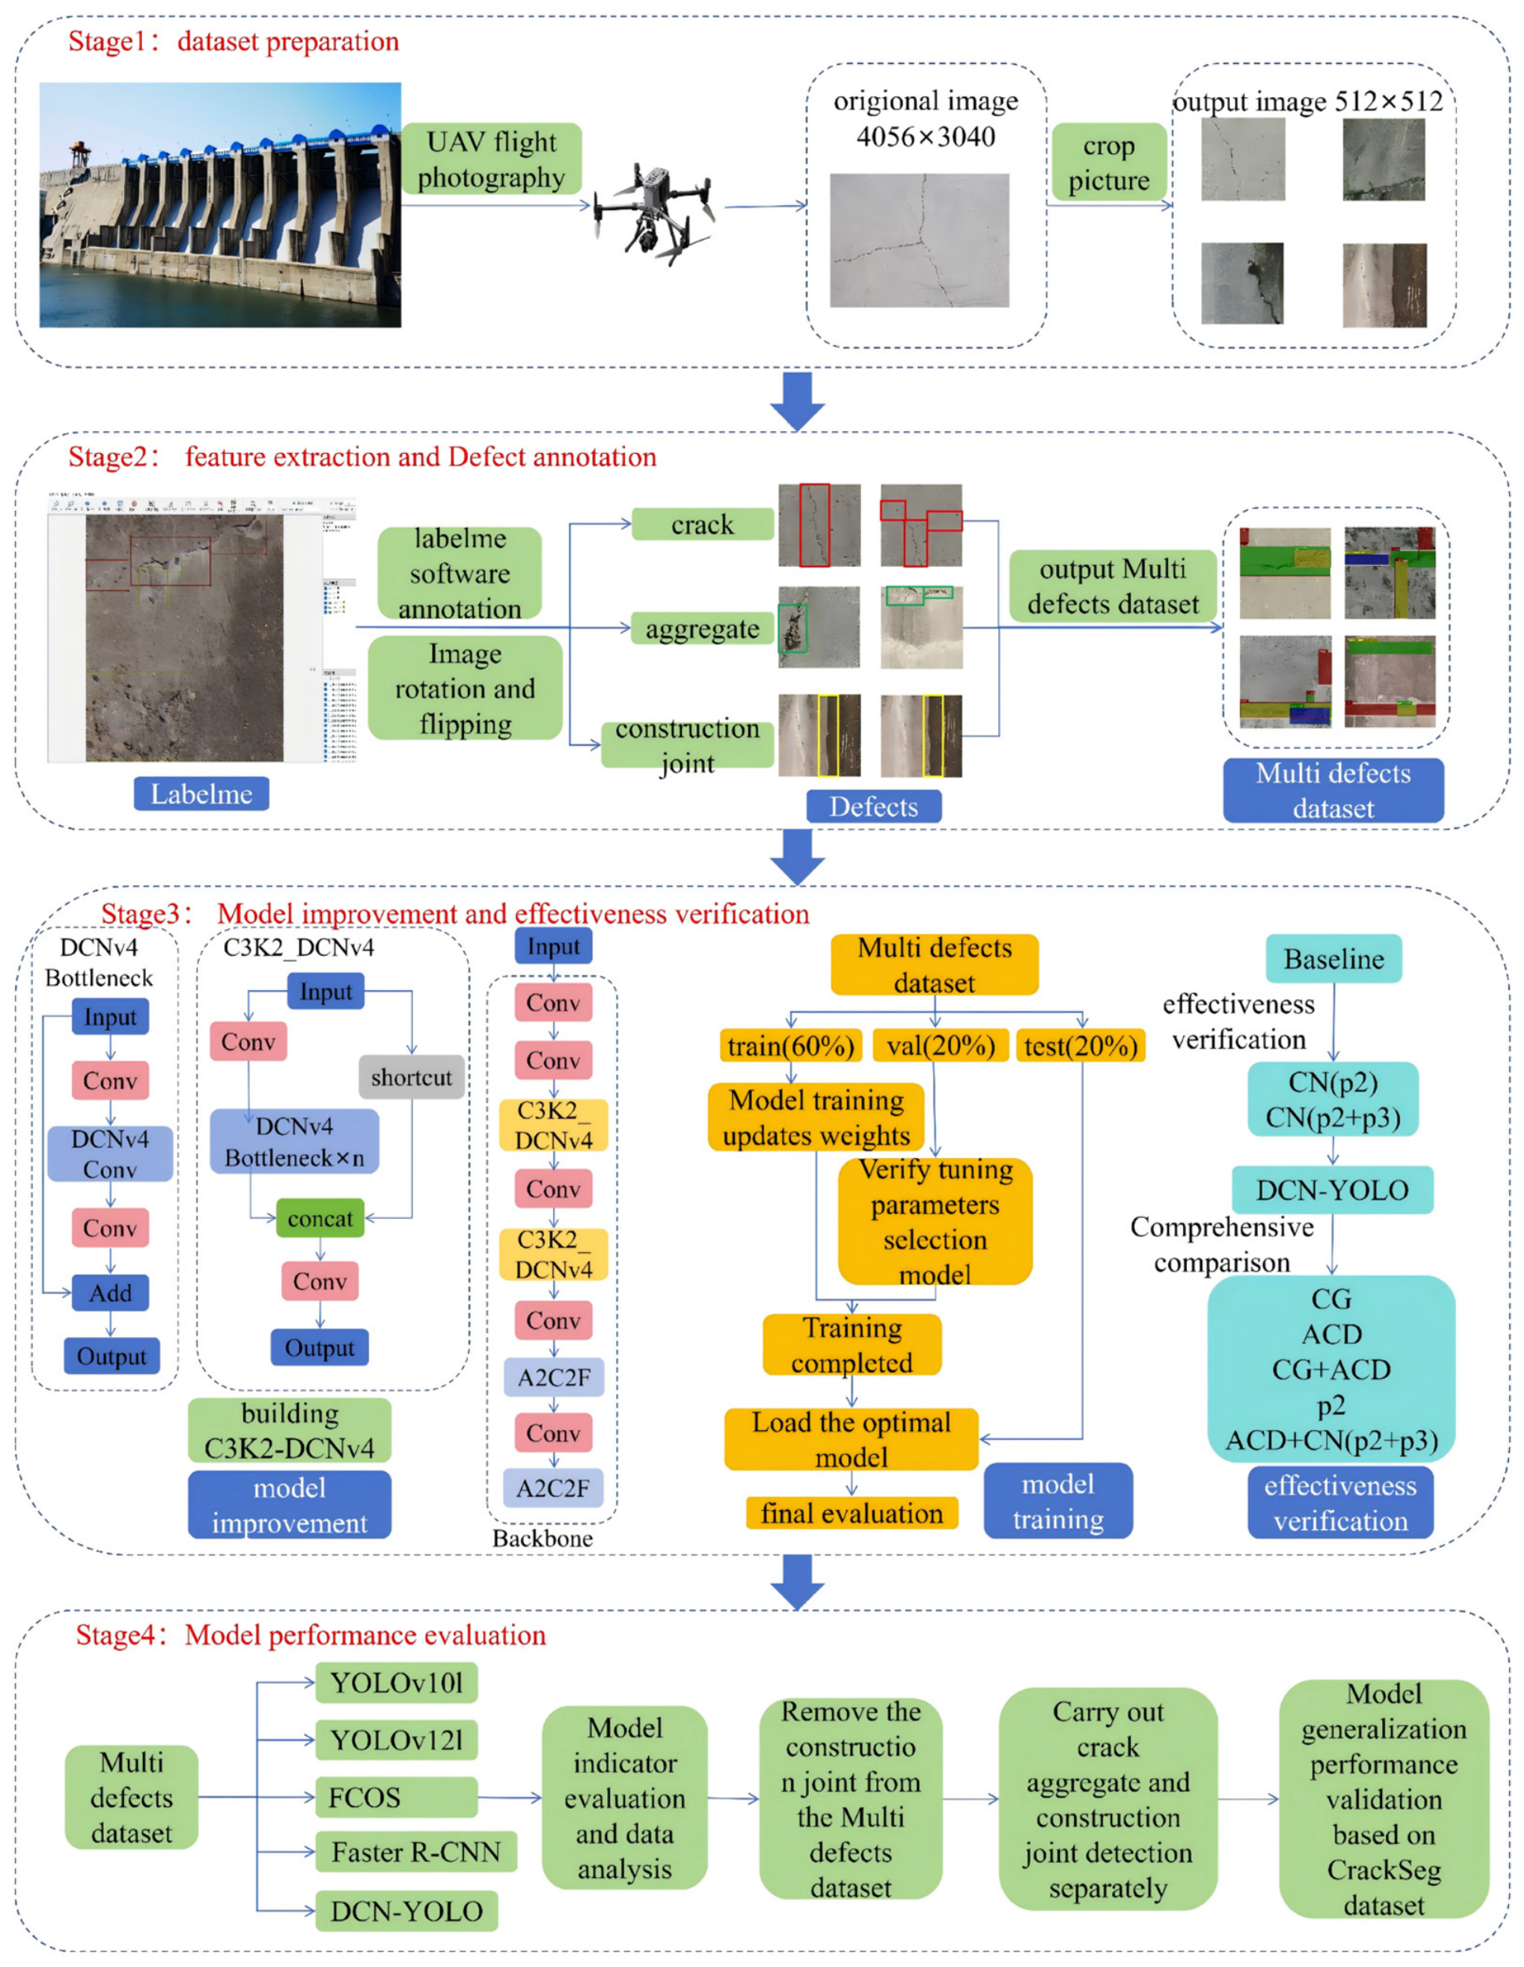
Figure 1. Modeling process for a YOLOv12-based concrete multi-defect detection model.
Applsci 16 06942 g001
Figure 2. YOLOv12 model architecture diagram.
Applsci 16 06942 g002
Figure 3. Comparison of various representative local attention mechanisms with regional attention mechanisms.
Applsci 16 06942 g003
Figure 4. Architectural comparison of R-ELAN and other popular modules.
Applsci 16 06942 g004
Figure 5. Comparison of spatial aggregation core operators for querying pixels at different positions within the same channel.
Applsci 16 06942 g005
Figure 6. Schematic diagram of DCNv4 optimization.
Applsci 16 06942 g006
Figure 7. Schematic diagram of the operator structure for the improved YOLOv12 and C3k2_DCNv4.
Applsci 16 06942 g007
Figure 8. A panoramic view of the downstream side of the dam studied in this paper.
Applsci 16 06942 g008
Figure 9. Flowchart of the UAV image acquisition process.
Applsci 16 06942 g009
Figure 10. The manually annotated Multi-defect dataset. Blue indicates cracks, white indicates aggregate, and green indicates construction joints.
Applsci 16 06942 g010
Figure 11. Model training and results analysis.
Applsci 16 06942 g011
Figure 12. Scatter plot of performance metrics for the detection of individual defects: (a) precision, (b) recall, (c) mAP50, (d) mAP50-95.
Applsci 16 06942 g012
Figure 13. Visual comparison of detection performance across models: (a) Group1, (b) Group2, (c) Group3, (d) Group4, (e) Group5, (f) Group6, (g) Group7, (h) Group8.
Applsci 16 06942 g013
Figure 14. Comparison of detection results from various models with the original annotations: (a) labels, (b) YOLOv10l, (c) YOLOv12l, (d) DCN-YOLO.
Applsci 16 06942 g014
Figure 15. Normalized confusion matrix.
Applsci 16 06942 g015
Figure 16. Statistical analysis of the dataset and visualization of the attention mechanism: (a) category distribution of the dataset, (b) bounding box spatial distribution overlay, (c) spatial distribution of bounding box centers, (d) normalized width-height distribution.
Applsci 16 06942 g016
Figure 17. Heatmap of performance metrics for the detection of individual defects: (a) precision, (b) recall, (c) mAP50, and (d) mAP50-95. The red numbers represent the optimal values for each of the highlighted indicators.
Applsci 16 06942 g017
Figure 18. Comparison of model detection results with original annotations in the “Crack” scenario: (a) labels, (b) YOLOv10l, (c) YOLOv12l, (d) DCN-YOLO.
Applsci 16 06942 g018
Figure 19. Comparison of model detection results with original annotations in an aggregate scenario: (a) labels, (b) YOLOv10l, (c) YOLOv12l, (d) DCN-YOLO.
Applsci 16 06942 g019
Figure 20. Comparison of model detection results with original annotations in the construction joint scenario: (a) labels, (b) YOLOv10l, (c) YOLOv12l, (d) DCN-YOLO.
Applsci 16 06942 g020
Table 1. Summary of datasets with Multi-defects dataset.
GroupTraining BoxVal BoxPercentageAverage Box AreaBox: Average Width Multiplied by Height
Crack176042642.728,446260 × 138
Aggregate190143046.114,046121 × 96
Construction joint46310911.218,271168 × 148
Table 2. Comprehensive performance metrics for the models addressing the three types of defects studied in this paper. The bolded text indicates the optimal values.
GroupCGACDP2CD (P2)CD (P3)mAP50mAP50-95PRParamsGFLOPsFPS
1 0.722 ± 0.0020.319 ± 0.0010.703 ± 0.0020.682 ± 0.00926.3488.6040.61
2 0.727 ± 0.0010.333 ± 0.0010.757 ± 0.0040.634 ± 0.00726.028218.23
3 0.726 ± 0.0020.363 ± 0.0020.743 ± 0.0010.644 ± 0.00125.9181.1036.80
4 0.684 ± 0.0030.348 ± 0.0010.712 ± 0.0010.639 ± 0.00326.068217.85
5 0.724 ± 0.0010.311 ± 0.0020.714 ± 0.0040.693 ± 0.00326.98110.7036.32
6 0.71 ± 0.0020.307 ± 0.0020.71 ± 0.0030.708 ± 0.00226.3287.3031.84
7 0.719 ± 0.0010.321 ± 0.0010.741 ± 0.0010.683 ± 0.00225.7878.5027.71
8 0.728 ± 0.0020.361 ± 0.0010.774 ± 0.0020.656 ± 0.00126.218629.95
Table 3. Comparison of performance metrics between the method proposed in this paper and other methods for multi-object detection. The bolded text indicates the optimal values.
ModelDefectsmAP50mAP50-95PR
YOLOv10lAll0.598 ± 0.0030.253 ± 0.0020.629 ± 0.0040.564 ± 0.002
Crack0.711 ± 0.0020.299 ± 0.0010.711 ± 0.0020.677 ± 0.006
Aggregate0.572 ± 0.0040.254 ± 0.0010.612 ± 0.0050.565 ± 0.004
Construction joint0.511 ± 0.0130.206 ± 0.0060.564 ± 0.0090.45 ± 0.008
YOLOv12lAll0.722 ± 0.0040.319 ± 0.0040.703 ± 0.0050.682 ± 0.001
Crack0.794 ± 0.0030.354 ± 0.0030.693 ± 0.0030.798 ± 0.004
Aggregate0.668 ± 0.0010.301 ± 0.0060.731 ± 0.0040.633 ± 0.003
Construction joint0.705 ± 0.0100.303 ± 0.0130.683 ± 0.0110.615 ± 0.005
FCOSAll0.699 ± 0.0110.306 ± 0.0020.853 ± 0.0030.241 ± 0.002
Crack0.846 ± 0.0030.402 ± 0.0050.924 ± 0.0010.315 ± 0.013
Aggregate0.724 ± 0.0040.29 ± 0.0030.866 ± 0.0080.316 ± 0.005
Construction joint0.527 ± 0.0060.306 ± 0.0040.769 ± 0.0120.092 ± 0.009
Faster R-CNNAll0.691 ± 0.0080.314 ± 0.0070.626 ± 0.0050.748 ± 0.002
Crack0.842 ± 0.0030.443 ± 0.0040.697 ± 0.0070.871 ± 0.003
Aggregate0.673 ± 0.0070.275 ± 0.0060.641 ± 0.0030.721 ± 0.004
Construction joint0.559 ± 0.00120.224 ± 0.0070.538 ± 0.0150.651 ± 0.006
DCN-YOLOAll0.728 ± 0.0030.361 ± 0.0020.774 ± 0.0020.656 ± 0.004
Crack0.863 ± 0.0050.481 ± 0.0010.84 ± 0.0030.793 ± 0.003
Aggregate0.659 ± 0.0040.307 ± 0.0030.74 ± 0.0010.597 ± 0.007
Construction joint0.663 ± 0.0030.295 ± 0.0040.741 ± 0.0020.577 ± 0.001
Table 4. Ablation analysis of construction joint interference. The bolded text indicates the optimal values.
ModelDefectsmAP50mAP50-95PR
YOLOv10lAll0.614 ± 0.0060.263 ± 0.0070.672 ± 0.0060.552 ± 0.005
Crack0.730 ± 0.0030.287 ± 0.0020.723 ± 0.0020.660 ± 0.004
Aggregate0.498 ± 0.0070.24 ± 0.0040.620 ± 0.0040.444 ± 0.002
YOLOv12lAll0.694 ± 0.0050.325 ± 0.0080.681 ± 0.0020.682 ± 0.003
Crack0.769 ± 0.0080.367 ± 0.0070.685 ± 0.0060.777 ± 0.007
Aggregate0.620 ± 0.0030.284 ± 0.0060.678 ± 0.0080.588 ± 0.006
FCOSAll0.721 ± 0.0130.338 ± 0.0110.879 ± 0.0070.269 ± 0.010
Crack0.845 ± 0.0040.369 ± 0.0030.915 ± 0.0020.277 ± 0.012
Aggregate0.691 ± 0.0020.279 ± 0.0040.842 ± 0.0030.261 ± 0.013
Faster R-CNNAll0.742 ± 0.0030.350 ± 0.0020.674 ± 0.0050.801 ± 0.003
Crack0.850 ± 0.0040.418 ± 0.0060.712 ± 0.0010.869 ± 0.002
Aggregate0.685 ± 0.0030.281 ± 0.0100.635 ± 0.0030.733 ± 0.005
DCN-YOLOAll0.737 ± 0.0020.392 ± 0.0050.727 ± 0.0040.725 ± 0.004
Crack0.825 ± 0.0010.476 ± 0.0030.772 ± 0.0060.798 ± 0.005
Aggregate0.649 ± 0.0030.308 ± 0.0040.682 ± 0.0020.652 ± 0.003
Table 5. Summary of the CrackSeg dataset.
GroupTraining BoxVal BoxAverage bbox Areabbox: Average Width Multiplied by Height
Crack340531232,614207 × 207
Table 6. Performance metrics of different methods on the CrackSeg Dataset. The bolded text indicates the optimal values.
ModelmAP50mAP50-95PR
YOLOv10l0.732 ± 0.0060.54 ± 0.0030.846 ± 0.0040.634 ± 0.005
FCOS0.678 ± 0.0090.453 ± 0.0020.453 ± 0.0120.606 ± 0.007
Faster R-CNN0.709 ± 0.0070.468 ± 0.0100.468 ± 0.0130.582 ± 0.003
DCN-YOLO0.753 ± 0.0040.560 ± 0.0010.825 ± 0.0020.708 ± 0.004
Disclaimer/Publisher’s Note: The statements, opinions and data contained in all publications are solely those of the individual author(s) and contributor(s) and not of MDPI and/or the editor(s). MDPI and/or the editor(s) disclaim responsibility for any injury to people or property resulting from any ideas, methods, instructions or products referred to in the content.