1. Introduction
Alkali metal species in fuel pose significant operational challenges for power plants. Fuels with high alkali content are known to promote deposit formation (fouling) on boiler heat transfer surfaces by forming low-melting point compounds such as sodium silicates and sodium sulfates [
1]. Additionally, these species contribute to the formation of submicron particulates [
2], which can both exacerbate fouling and degrade air quality via emissions.
Ash deposits originate from the mineral matter in the coal, a portion of which vaporizes during combustion. These vapors, primarily alkali species, can condense directly on heat transfer surfaces, or form submicron particulates that deposit via thermophoresis, or condense onto larger fly ash particles which stick to surfaces upon impaction [
3]. Once on the surface, these materials sinter into hardened deposits that are difficult to remove with online cleaning methods, eventually necessitating boiler shutdowns for maintenance.
Fouling in the radiant to convective heat transfer transition region of a boiler has been attributed to molten sodium silicate particles impacting and fusing to heat transfer surfaces, whereas ash deposits in the convective sections of the boiler result from the formation of sticky particles that are produced by the condensation of sodium from the vapor phase and formation of sodium sulfate [
4]. Erickson et al. found that above 1100 °C, sodium sulfate formation hardly occurs [
5]. Therefore, if the sodium vapor can be removed prior to sulfation, fouling of heat exchange surfaces can be minimized.
Steinberg and Schofield [
6] examined the behavior of sodium/sulfur flame deposition on cooled probe surfaces (<500 °C) when sulfur concentrations equaled or exceeded sodium levels. They determined that Na
2SO
4 was consistently the predominant deposit, its deposition rate was independent of the atomic or molecular state of the vapor-phase sodium reactant, and the reaction was first-order with respect to sodium concentration.
Similarly, Srinivasachar et al. [
7] and others [
8] concluded that the Na
2SO
4 responsible for boiler deposits and corrosion forms primarily via heterogeneous condensation or reaction on heat transfer tubes and ash particles. Furthermore, Benson et al. [
9] observed that organically bound sodium in coal rapidly vaporizes, forms molecular hydroxide in the gas phase, and subsequently reacts, in part, with silica or aluminosilicate ash to form sodium aluminosilicates. Any unreacted sodium vapor is subsequently converted to Na
2SO
4 at lower downstream temperatures. Because finer ash particles offer a higher surface area for heterogeneous reactions, these sulfates tend to enrich the submicron fraction.
In addition to promoting fouling, submicron particulates that are emitted from the boiler degrade air quality and pose significant challenges for amine-based carbon dioxide (CO
2) capture systems. These particulates act as seed nuclei for solvent aerosol formation, increasing both operating cost and harmful amine emissions. For instance, pilot studies at Rotterdam [
10] and Niederaussem [
11] identified amine aerosol formation, linked to submicron sulfate particles, as the primary source of amine emissions. Similar issues occurred at the Boundary Dam facility, where fine fly ash particles that bypassed the electrostatic precipitator (ESP) caused fouling in the capture system and reduced overall CO
2 capture rates [
12]. Consequently, effective mitigation strategies are essential for implementing CO
2 capture technologies at existing coal-fired power plants firing high-alkali fuels like lignite, as well as plants transitioning to biomass or coal–biomass blends.
Current strategies for mitigating high-alkali fuels often involve fuel blending [
13]. Blending high-alkali coal with low-sodium, high-ash coal introduces more silicates to capture sodium vapor while reducing overall sodium concentration [
14,
15]. This reduction in sodium vapor limits the formation of ash deposits and allows the boiler to operate effectively. While blending is an effective and preferred strategy when low-alkali fuels are economically accessible, it is not always feasible. Fuel pretreatment to remove alkali components is generally cost-prohibitive. Thus, in-furnace removal of alkali vapor remains the most viable mitigation strategy and is the primary focus of this current study.
The injection of solid sorbents into a furnace is a potentially viable method for capturing alkali vapor. Research demonstrates that aluminosilicate clays and silica act as effective sodium scavengers under furnace conditions [
16,
17], significantly reducing sodium in submicron particles [
18]. In drop-tube furnace experiments, kaolin clay has shown particular promise [
19,
20]; Vuthaluru et al. [
21] found it more effective than alumina and silica, suggesting that injecting 10–20 μm kaolin particles at a rate of 2–3 wt.% of the coal feed would substantially reduce fouling. The operational feasibility of this approach is supported by the successful deployment of furnace sorbent injection (FSI) for SO
2 removal [
22], demonstrated at utility scale in the LIMB project [
23]. Furthermore, CFD has been successfully utilized to model FSI Systems [
24,
25].
The primary purpose of this work is to comprehensively evaluate in-furnace injection of solid sorbents as a strategy to mitigate alkali (specifically sodium) aerosol emissions and the resulting heat-exchanger fouling in full-scale coal boilers. To achieve this, the study pursued the following key objectives: (i) identify optimal sorbent injection locations for a full-scale boiler; (ii) demonstrate effectiveness of sorbent injection at the full-scale; (iii) develop a diffusion-kinetic model for alkali vapor (NaOH) capture and integrate it into the CFD simulations to predict capture performance; and (iv) develop a bench-scale tool for screening/choosing sorbents for commercial application.
First, CFD models using historical plant data were developed to identify optimal sorbent injection locations based on accessibility, gas temperature, velocity patterns, and necessary residence time for alkali vapor capture. Then, several commercial and locally mined clay sorbents were identified as viable candidates for alkali capture. A commercially available milled sorbent was selected for the field demonstration. The broader set of sorbents was later evaluated in bench-scale tests to characterize their suitability in terms of grindability, alkali capture potential, processing required, and availability as a potential long-term cost-effective source.
The field demonstration was performed over multiple days, during which varying rates of sorbent injection to the boiler, at locations identified by the CFD simulations, were tested. The sorbent’s effectiveness was assessed by analysis of the particulates at the ESP inlet and in the ESP hopper catch with and without sorbent injection and by determining the sodium captured by the fly ash and the sorbent (if present). In addition to fly ash particulate sampling and analysis, a custom-built heat exchanger probe was located in the convective pass of the boiler to obtain deposit growth and structure data as an additional indicator of the effectiveness of sorbent injection on alkali vapor reduction.
To complement the field data, a diffusion-kinetic model for the alkali vapor (NaOH) capture by the sorbent was formulated and integrated into the CFD simulations. Finally, follow-up bench-scale tests were conducted in a down-fired furnace with the full suite of sorbents, as part of tool development for sorbent selection. These tests included analysis of the aerosol particle size distribution resulting from alkali injection and the corresponding change (reduction in submicron particulate) when combined with sorbent addition.
2. Materials and Methods
2.1. Coal Analysis and Sodium Measurement Method
The fuel fired in the field demonstration unit is a lignite coal. The as-fired fuel composition is shown in
Table 1. The ash composition of the fuel is shown in
Table 2.
Measurement of sodium content of collected ash samples was performed as follows. The total sodium content of the samples was determined by digestion of the samples in a mixture of hot nitric, hydrochloric, and perchloric acid in a 3-2-1 ratio by volume. The mixture was heated until complete evaporation. A mixture of equal parts by volume of hydrofluoric acid and hydrogen peroxide was then added and heated until complete digestion. The solution was diluted with 1% nitric acid, and the composition was determined by inductively coupled plasma optical emission spectroscopy (ICP-OES) performed in an Agilent 5100 ICP-OES instrument (Agilent Technologies, Santa Clara, CA, USA).
The content of water-soluble forms of sodium present in the ash samples was also determined by ICP-OES analysis of an aqueous solution obtained by sonicating a mixture of ash sample and distilled water. The water-soluble sodium content was subtracted from the total sodium content to determine the water-insoluble sodium. The water-insoluble sodium content determined by the ICP-OES method was reported to be the captured sodium during the field demonstration tests. The sodium content present in the sorbents prior to injection was subtracted from total sodium content (in the ash) measured after injection.
2.2. Field Demonstration at 250 MWe Coal Boiler
Field demonstrations were conducted at a 250 MWe power plant firing lignite coal and comprising a cyclone-fired boiler. The boiler is equipped with seven cyclone combustors. Crushed coal is fed from silos into separating cyclones that discharge the bulk of the coal into each of the combustors at a rate of 44 kg/s. A minor fraction (approximately 3–4%) of the coal bypasses these combustors, traveling with the vent air to be introduced further downstream. Each cyclone had a primary air port and a tangentially oriented secondary air port into which 75% of total combustion air was introduced in equal distribution among the seven cyclones. Proximate and ultimate analysis of the coal as it enters the boiler is provided in
Table 1, and its gross heating value is 17.4 MJ/kg. The remaining 25% of combustion air enters through 14 vent ports, six front wall ports, four side wall ports, and seven over-fire air ports located downstream of the cyclone combustors and in the main section of the boiler. The combustion air supplied to the OFA ports is heated to about 400 °C prior to introduction into the boiler.
Testing evaluated three sorbent injection rates (SIR): low, medium, and high. The dataset used in this work was collected over two days of baseline tests (no sorbent) and four days of active sorbent injection. To visually assess the sorbent’s impact on heat transfer surface fouling, cooled deposition probes simulating boiler tubes were installed in both the reheater and the convective pass. Samples of boiler slag and fly ash, collected upstream of the ESP, were analyzed for their chemical composition. The fly ash was sampled using a 4-stage cyclone, and the composition of each size fraction was analyzed using computer-controlled scanning electron microscopy (CCSEM). Ash samples were also collected from the ESP hoppers every 3–4 h to quantify sodium capture efficiency. During sorbent injection tests, the samples collected from the ESP hoppers include a mixture of coal fly ash and sorbent. The water-insoluble sodium content measured on these samples beyond the natively present sodium content of the sorbent was classified as captured sodium.
2.3. Combustion Simulations
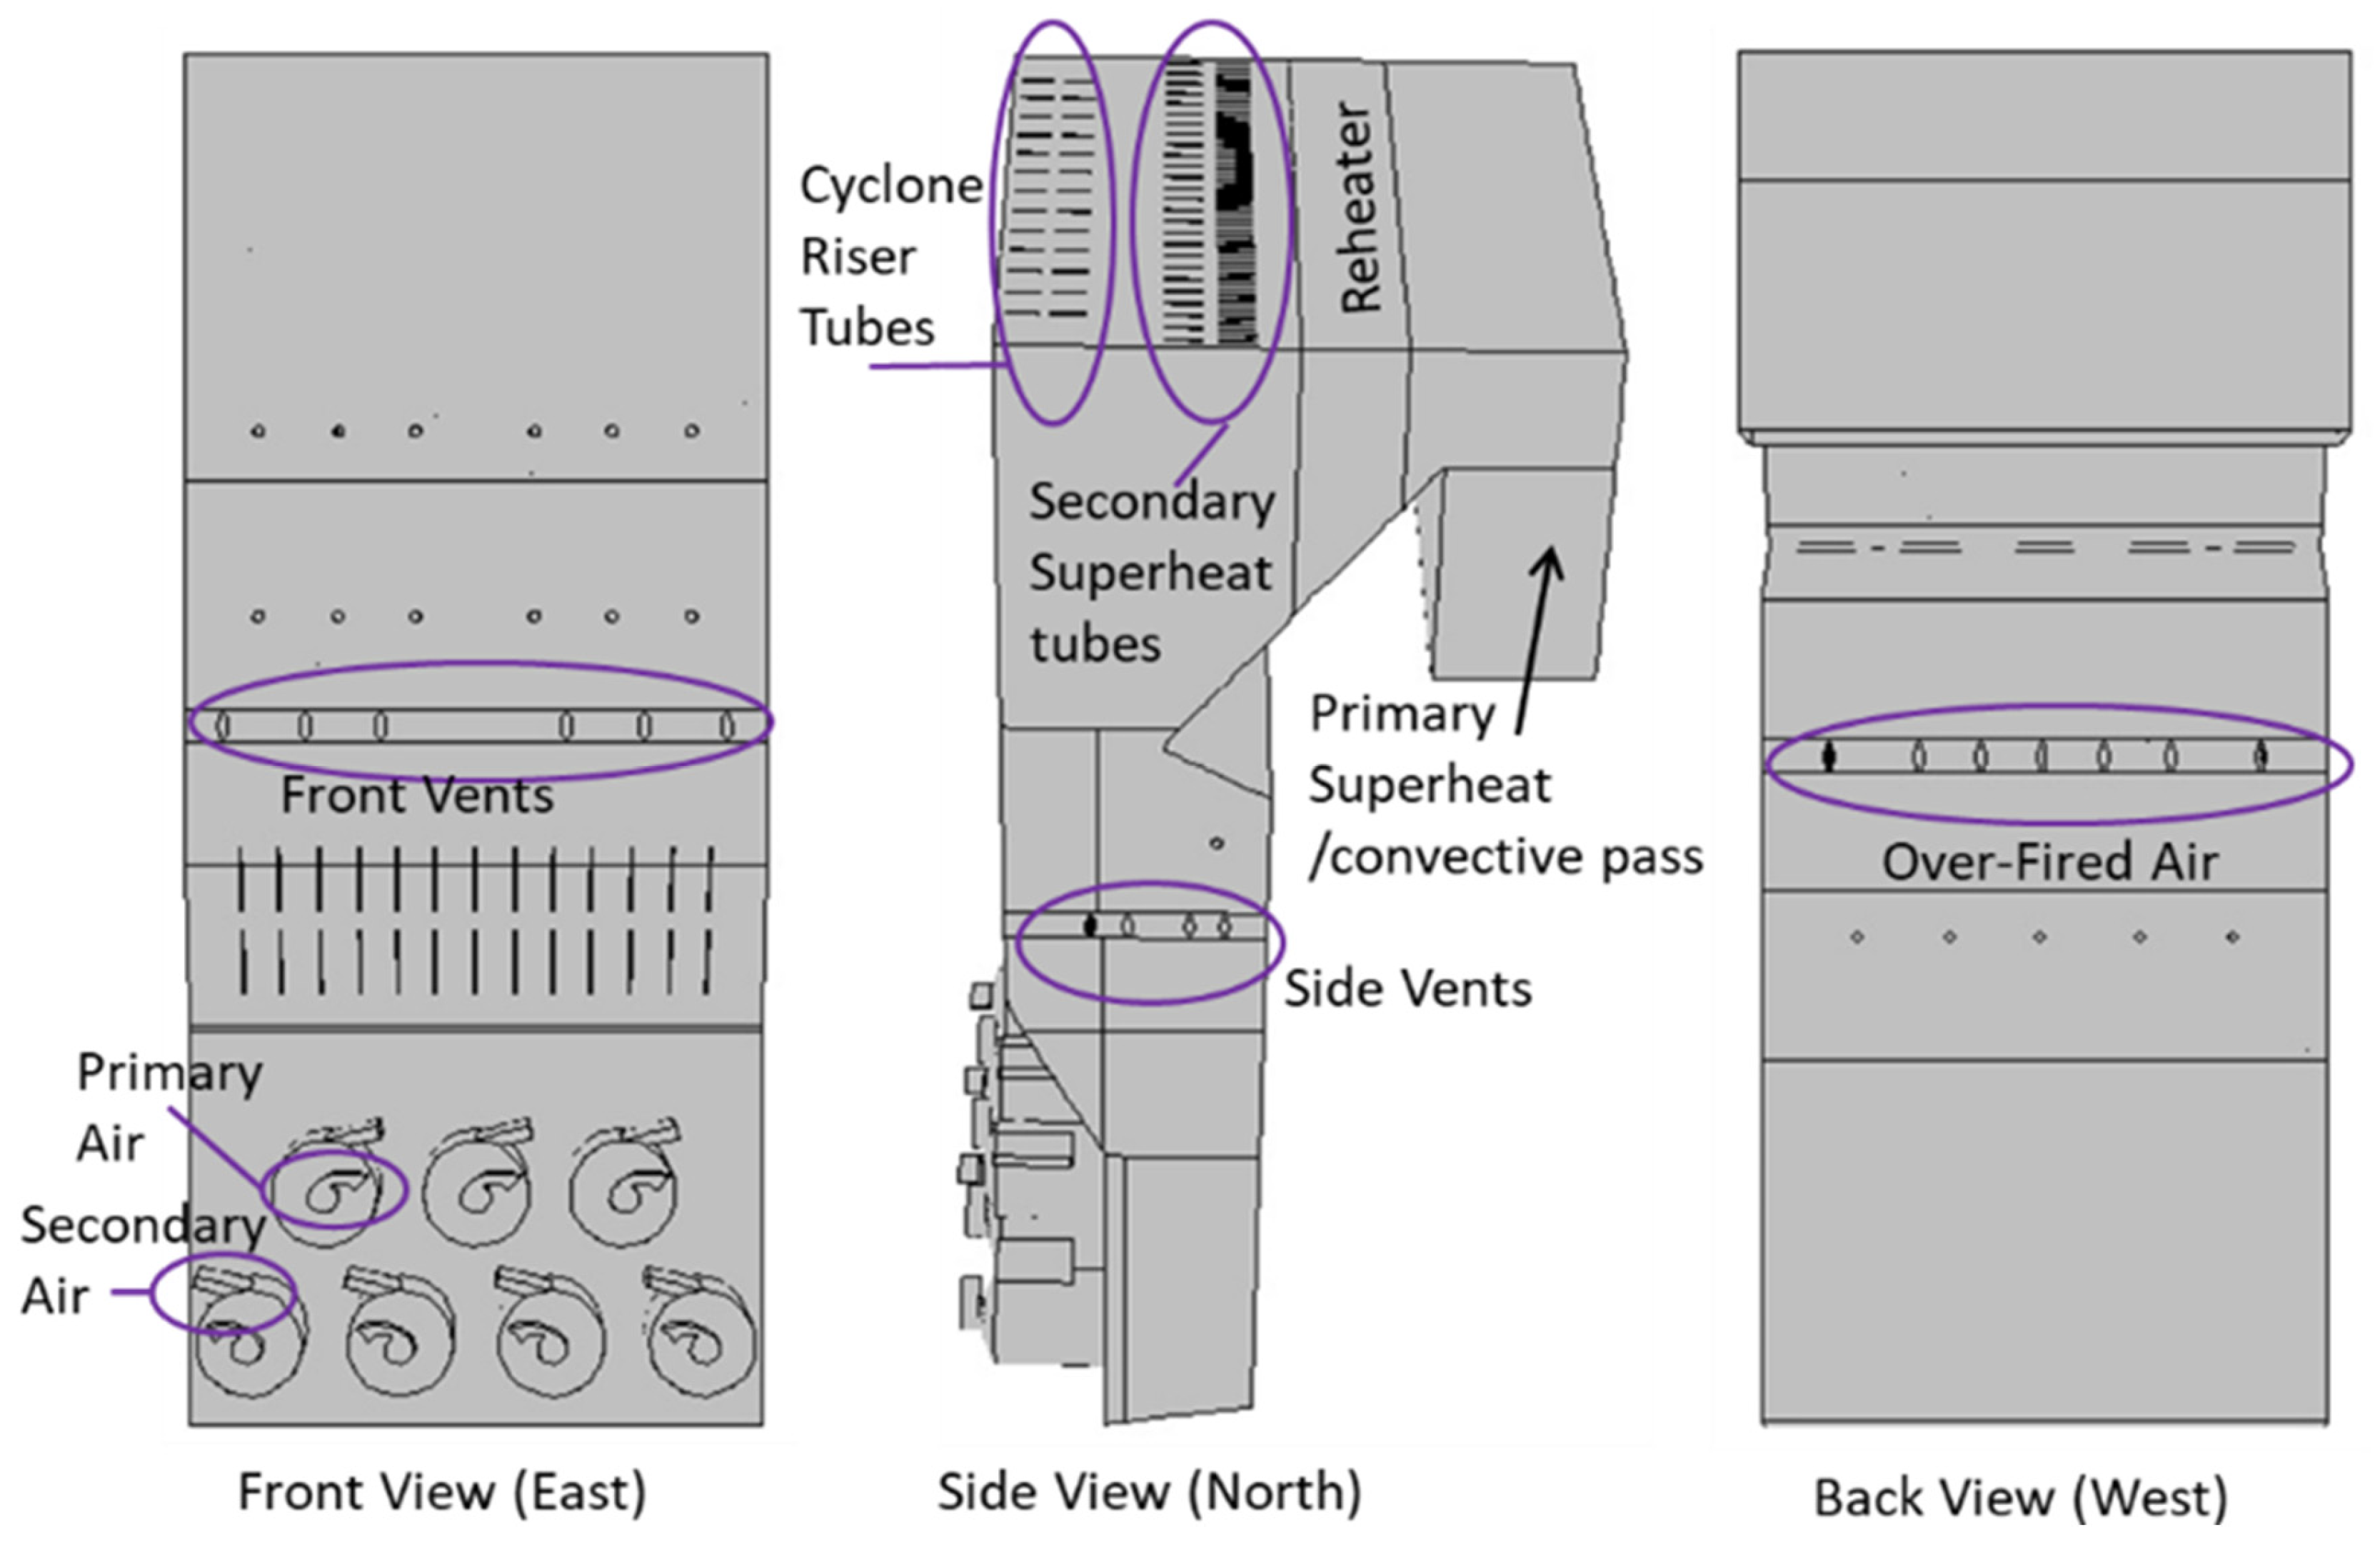
Historical operational data informed the development of a CFD model of the boiler, which was essential for identifying the most effective sorbent injection locations. A 600,000-cell mesh, comprising both polyhedral and hexahedral cells, was generated from computer-aided design drawings of the boiler (
Figure 1). The model incorporated all internal heat transfer surfaces and utilized a volumetric heat sink to represent the reheater section’s heat removal function. Because gas temperatures drop below about 500 °C past the reheater, sorbent reactions were assumed to be quenched in this section, and the boiler boundary was terminated at this location.
All simulations were executed using ANSYS FLUENT ver. 21 [
26].
Table 3 provides a complete summary of the various CFD modeling options employed in this study. The modeling options were selected based on previous experiences in simulating similar full-scale cyclone-fired boiler configurations [
27].
In cyclone-fired combustion, crushed coal introduced into a cyclone combustor is tangentially thrown to the walls covered in a molten slag layer and captured within this molten layer [
29]. Combustion of the coal proceeds within this slag layer, and more than 90 percent of combustion is completed within the cyclone combustor. Finer coal particles, not captured within the slag layer, continue into the main boiler chamber and complete their combustion. Rather than explicitly modeling complex particle capture mechanics within the slag layer, the model utilized a specific coal size distribution (50, 267, and 483 μm coal particles with a mass distribution of 60%, 32%, and 8%, respectively) to match the degree of combustion and heat release rates within the cyclone and the boiler body.
The temperature of the boiler walls and the interior surfaces was set based on their location and ranged from about 600–1050 °C. An emissivity value of 0.7 was used for all wall surfaces. Elastic collisions for all particle contacts with walls were used.
2.4. Heterogeneous Diffusion-Kinetic Model of the Sorbent with Deactivation
The kinetic model for the reaction of alkali vapor species with the sorbent used a shrinking-core representation of the reaction surface similar to the model used by Hashemi et al. [
30]. In addition, the model used a combination of competing reactions for alkali capture and sorbent deactivation with increasing conversion progress. The overall capture reaction is dictated by three sequential phenomena: (1) external diffusion of gas-phase alkali across the gas boundary layer around the sorbent particle surface; (2) internal diffusion through the outer product layer towards the particle center; and (3) the heterogeneous reaction within the sorbent at the active material surface.
The formulation for the overall reaction rate constant,
koverall (m/s), given in Equation (1), is found by setting the change in alkali species with respect to time that occurs within each of the three included phenomena equal to each other as shown in [
30]:
where
kc is the gas layer mass transfer coefficient,
Deff is effective diffusivity in the product layer,
kr is the Arrhenius kinetic rate coefficient, and r
i and r
s are the particle radius and radius at the reacting surface, respectively.
In this work, it was assumed that diffusion effects could be represented by a single binary diffusion coefficient,
Dab, between gaseous nitrogen and sodium hydroxide. Chapman–Enskog theory was used to estimate
Dab to have a value of 0.1062 cm
2/s at 25 °C, 1 atm, with a temperature dependence proportional to
T/298 to the power of 1.83 [
31]. From
Dab, and assuming a Sherwood number of 2,
kc can be calculated as
Dab/r
i. The effective diffusivity through the particle was estimated by reducing D
ab with respect to the porosity,
φ, of the particle, the constriction factor,
σ, and tortuosity,
τ, by the relation given in Equation (2). For this work, constant values of
φ = 0.5,
σ = 0.8, and
τ = 3 were used for all particles studied:
The stoichiometry of the alkali capture reaction is shown in Equation (3). Within the model, the molecular weight of the sorbent was specified to represent its capacity to react with sodium hydroxide and was calculated by Equation (4). The molecular weight was determined from the sorbent’s actual composition by assuming that silicon and aluminum atoms present in the sorbent can each react with one alkali atom. In addition, the presence of alkali atoms in the sorbent prior to injection was subtracted from its capacity to capture the alkali:
The equation for the reaction rate of alkali species on a sorbent particle, r
Na (mol/s) (Equation (5)), is proportional to the surface area of the active core and was assumed to be first order with respect to the bulk sodium vapor concentration in mol/m
3:
In addition to the reacting particle, deactivation of the sorbent can result from high temperature (sintering) and sorbent conversion [
32]. The stoichiometry of the sorbent deactivation reaction is shown in Equation (6). This reaction converts active sorbent to deactivated sorbent, which also shrinks the core of active sorbent:
The deactivation reaction (Equation (7)) is a volumetric reaction that was also assumed to be first order with respect to the active sorbent and product species concentration in the particle:
where
rd is the rate of deactivated sorbent formation in a particle: (mol/m
3·s),
kd is the Arrhenius kinetic rate coefficient: (m
3/mol·s),
Ns is the number of sorbent moles in a particle,
Np is the number of product species moles in a particle, and
V is the volume of the particle: (m
3).
Arrhenius kinetic rate coefficients (pre-exponential factor and activation energy) for the capture and deactivation reaction were determined (
Table 4) from literature experimental data of an aluminosilicate sorbent and coal fly ash reacting with alkali [
30,
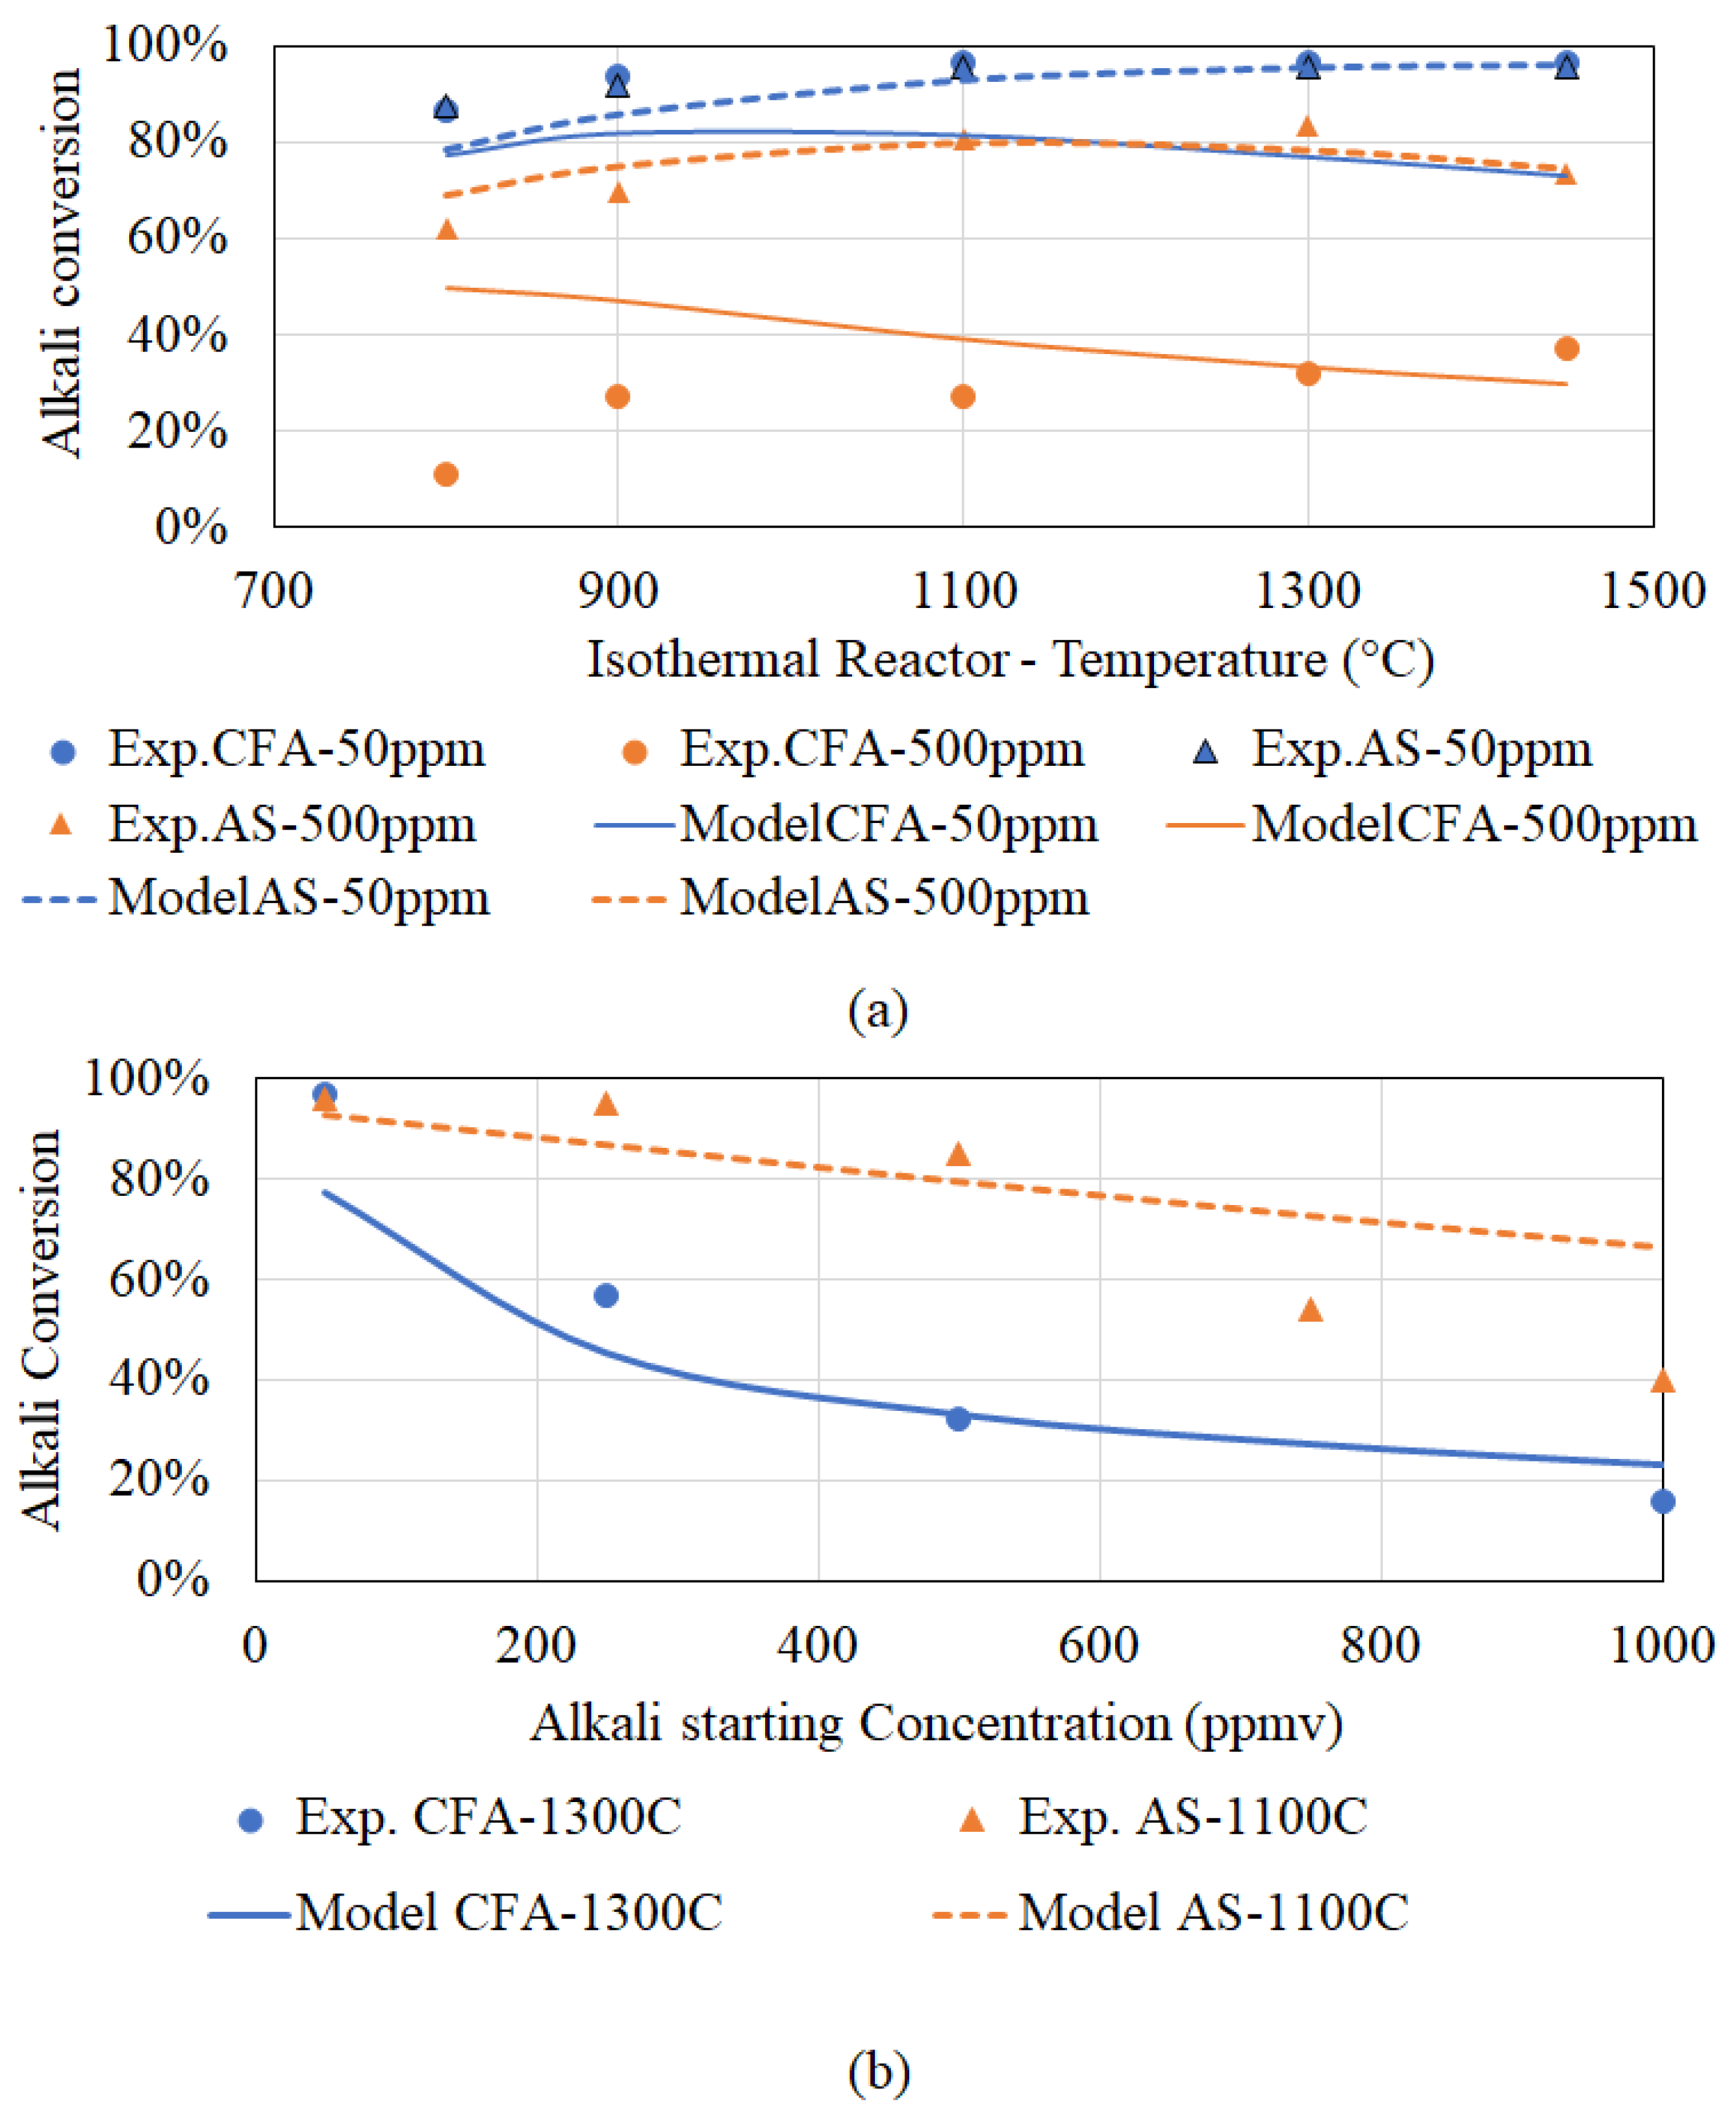
33]. Minimization of the root mean square deviation was performed to determine the values of the four parameters that provided the best fit across all available literature data. The capture rate was predicted by the proposed reaction model using the parameters in
Table 4 and the experimental conditions of the literature data to produce the curves are shown in
Figure 2.
In the experiments performed in the literature, slurry droplets of a sorbent–alkali source-ethanol mixture were injected into the furnace. Combustion/evaporation of these droplets most likely would have resulted in agglomeration of sorbent particles within these droplets, and the agglomerate size would have been larger than the primary sorbent particle size. Therefore, the effect of particle size in their analysis would be incorrect. Thus, all data was treated as one intermediate particle size for the data fitting.
Another aspect not considered in the literature study was the effect of sulfur species, in particular SO2, in combustion gases. These reactions could potentially limit the formation of alkali-aluminosilicate species. This omission is justified as sulfation reactions are expected to occur below about 900–1000 °C, whereas the silicate reaction kinetics significantly slow down at these lower temperatures. As such, competition from sulfation reactions was also not considered in this study.
The CFD model of the field boiler provides a 3-dimensional gas-phase temperature and composition. Sorbent injection tracks were calculated based on sorbent injection locations. For each track, the sorbent temperature and surrounding gas composition can therefore be obtained from the combustion field. Gas composition–temperature–time data were used as inputs to the kinetic model. Initial calculations were made with select particle trajectories to determine the degree of sorbent conversion and alkali vapor reduction.
2.5. Bench-Scale Testing for Sorbent Evaluation
Bench-scale testing was conducted with a range of sorbents as part of tool development for selecting from locally available sorbent sources. Evaluation of these sorbents was conducted in a 10 kW
th down-fired combustor unit. An ash-free simulated fuel mixture, consisting of propane, baker’s sugar, trisodium citrate (dihydrate), and elemental sulfur, was used to simulate coal combustion products without the presence of ash. The mass flow of the fuel components and combustion air is given in
Table 5. Upon combustion, the trisodium citrate formed sodium hydroxide at a concentration of about 175 ppm
v, and the sulfur produced about 540 ppm
v of sulfur dioxide. The sugar was added to act as an ash-free carrier for the lower flow rates of the trisodium citrate and sulfur.
Sorbent was mixed with the solid fuel prior to injection, yielding a residence time of about 1.4 s in the 1150 °C heated zone, matching the 2 s residence time in the full-scale boiler.
The concentrations of submicron and larger particulate in the combustor flue gas were analyzed by a 14-Stage Dekati® Low-Pressure Impactor (DLPI+) (Dekati Ltd., Kangasala, Finland), which sampled the furnace gases and measured the particulate concentrations as a function of size. The DLPI+ provides highly resolved particle size fractionation from 0.1 to 10 microns. A pre-separator cyclone with a 10-micron cut was placed upstream of the DLPI+ to remove coarser particles. Extracted sorbent samples were analyzed using both ICP-OES (Agilent Technologies, Santa Clara, CA, USA) and computer-controlled scanning electron microscopy with an energy-dispersive X-ray spectrometer (CCSEM-EDAX) to evaluate size-dependent sodium, sulfur and other elemental distribution and sodium capture efficiency.
A total of six different sorbents were tested in the combustor unit. Control tests, which included operation of the combustor unit without the addition of sorbent, were performed to set a baseline of submicron particulate formation. Control tests without the addition of trisodium citrate to the fuel but with the addition of sorbent were also performed for each sorbent tested.
3. Results and Discussion
3.1. Simulation of Combustion Within the Boiler
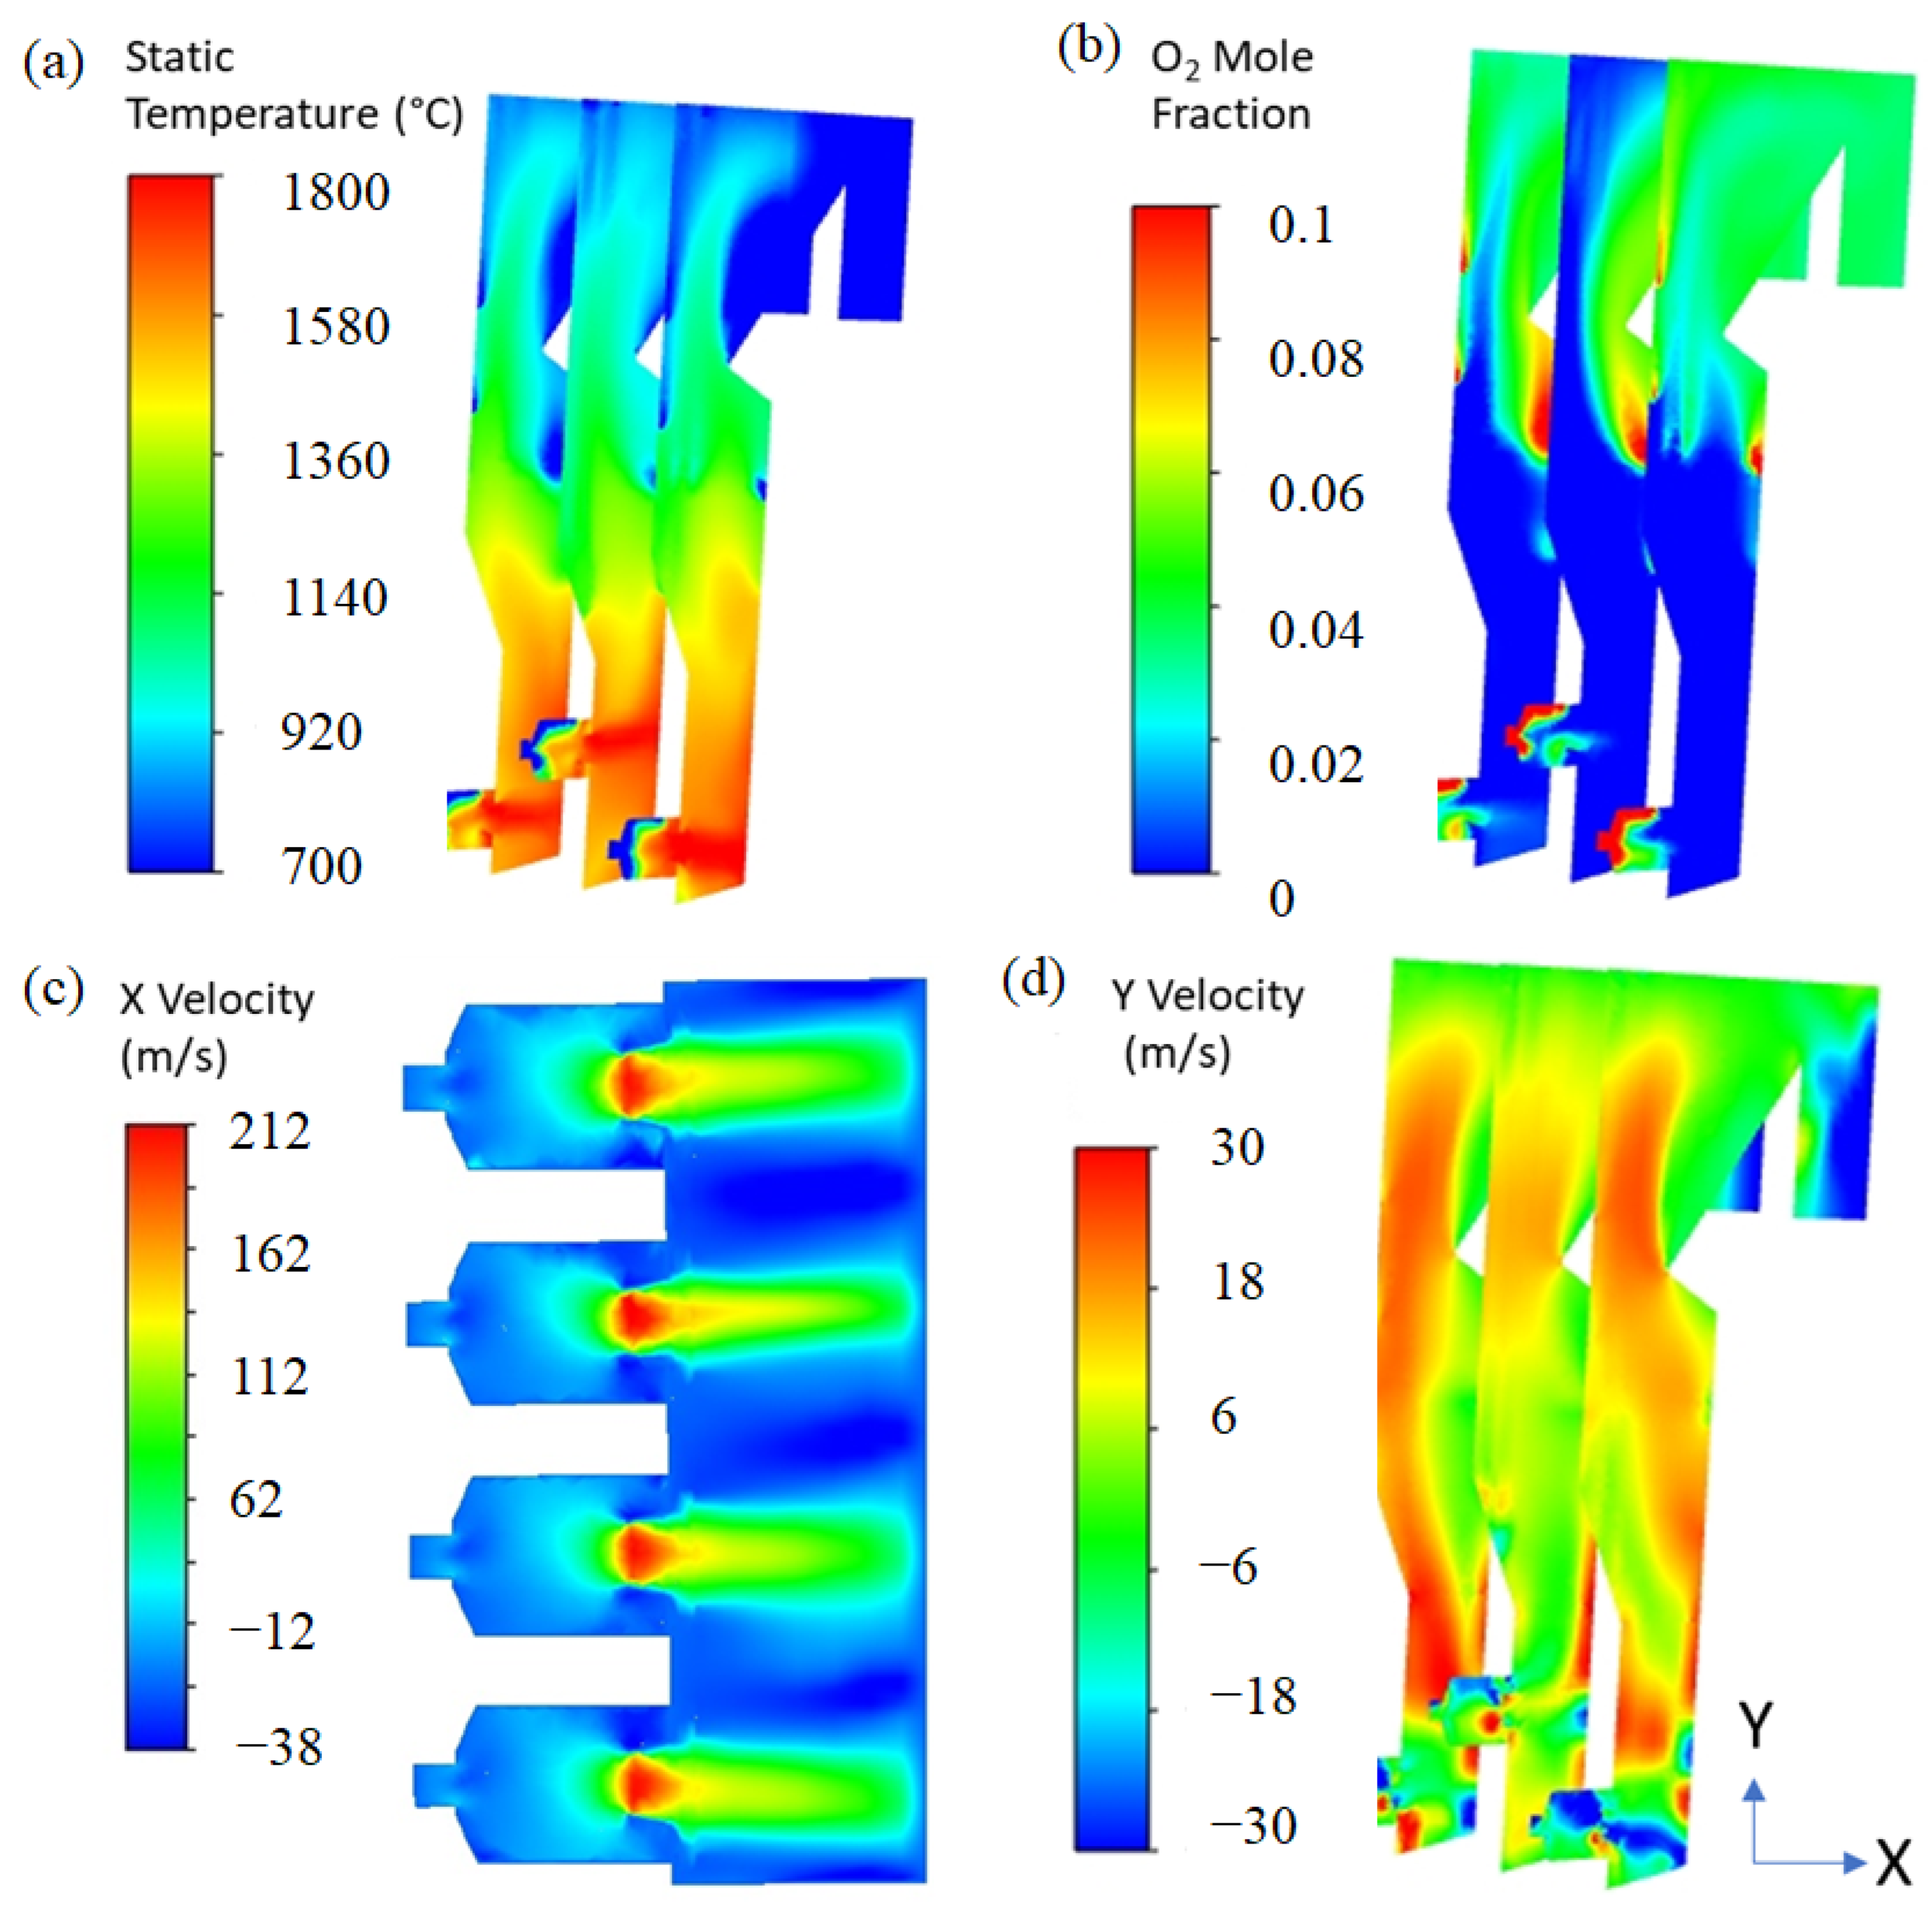
Figure 3a illustrates the modeled temperature profile within the boiler. The model predicted peak temperatures of about 1900 °C at the cyclone combustor exits, which cooled to about 1300 °C near the over-fire air (OFA) and vent air inlets. Furthermore, the model estimated a furnace exit gas temperature (FEGT) of roughly 980 °C just upstream of the secondary superheater tubes, closely matching the 1000 °C average FEGT measured by the plant.
As shown in
Figure 3b, all oxygen supplied by the primary and secondary air, accounting for 16% and 54% of the total air, respectively, is entirely consumed between the cyclones and the mid-boiler ports. The remaining air required for complete combustion enters through the vent and OFA ports, ensuring the exiting air has roughly 4 vol.% O
2.
Velocity profiles calculated by the CFD model indicate that combustion gases exit the cyclones in a swirling flow at approximately 200 m/s, striking the back wall before arcing upward toward the convective pass (
Figure 3c,d). Because four of the seven cyclones are oriented toward the north side of the boiler, the model correctly predicted a higher gas flow in that region, prompting a bias for sorbent injection on the northern side.
The planes in
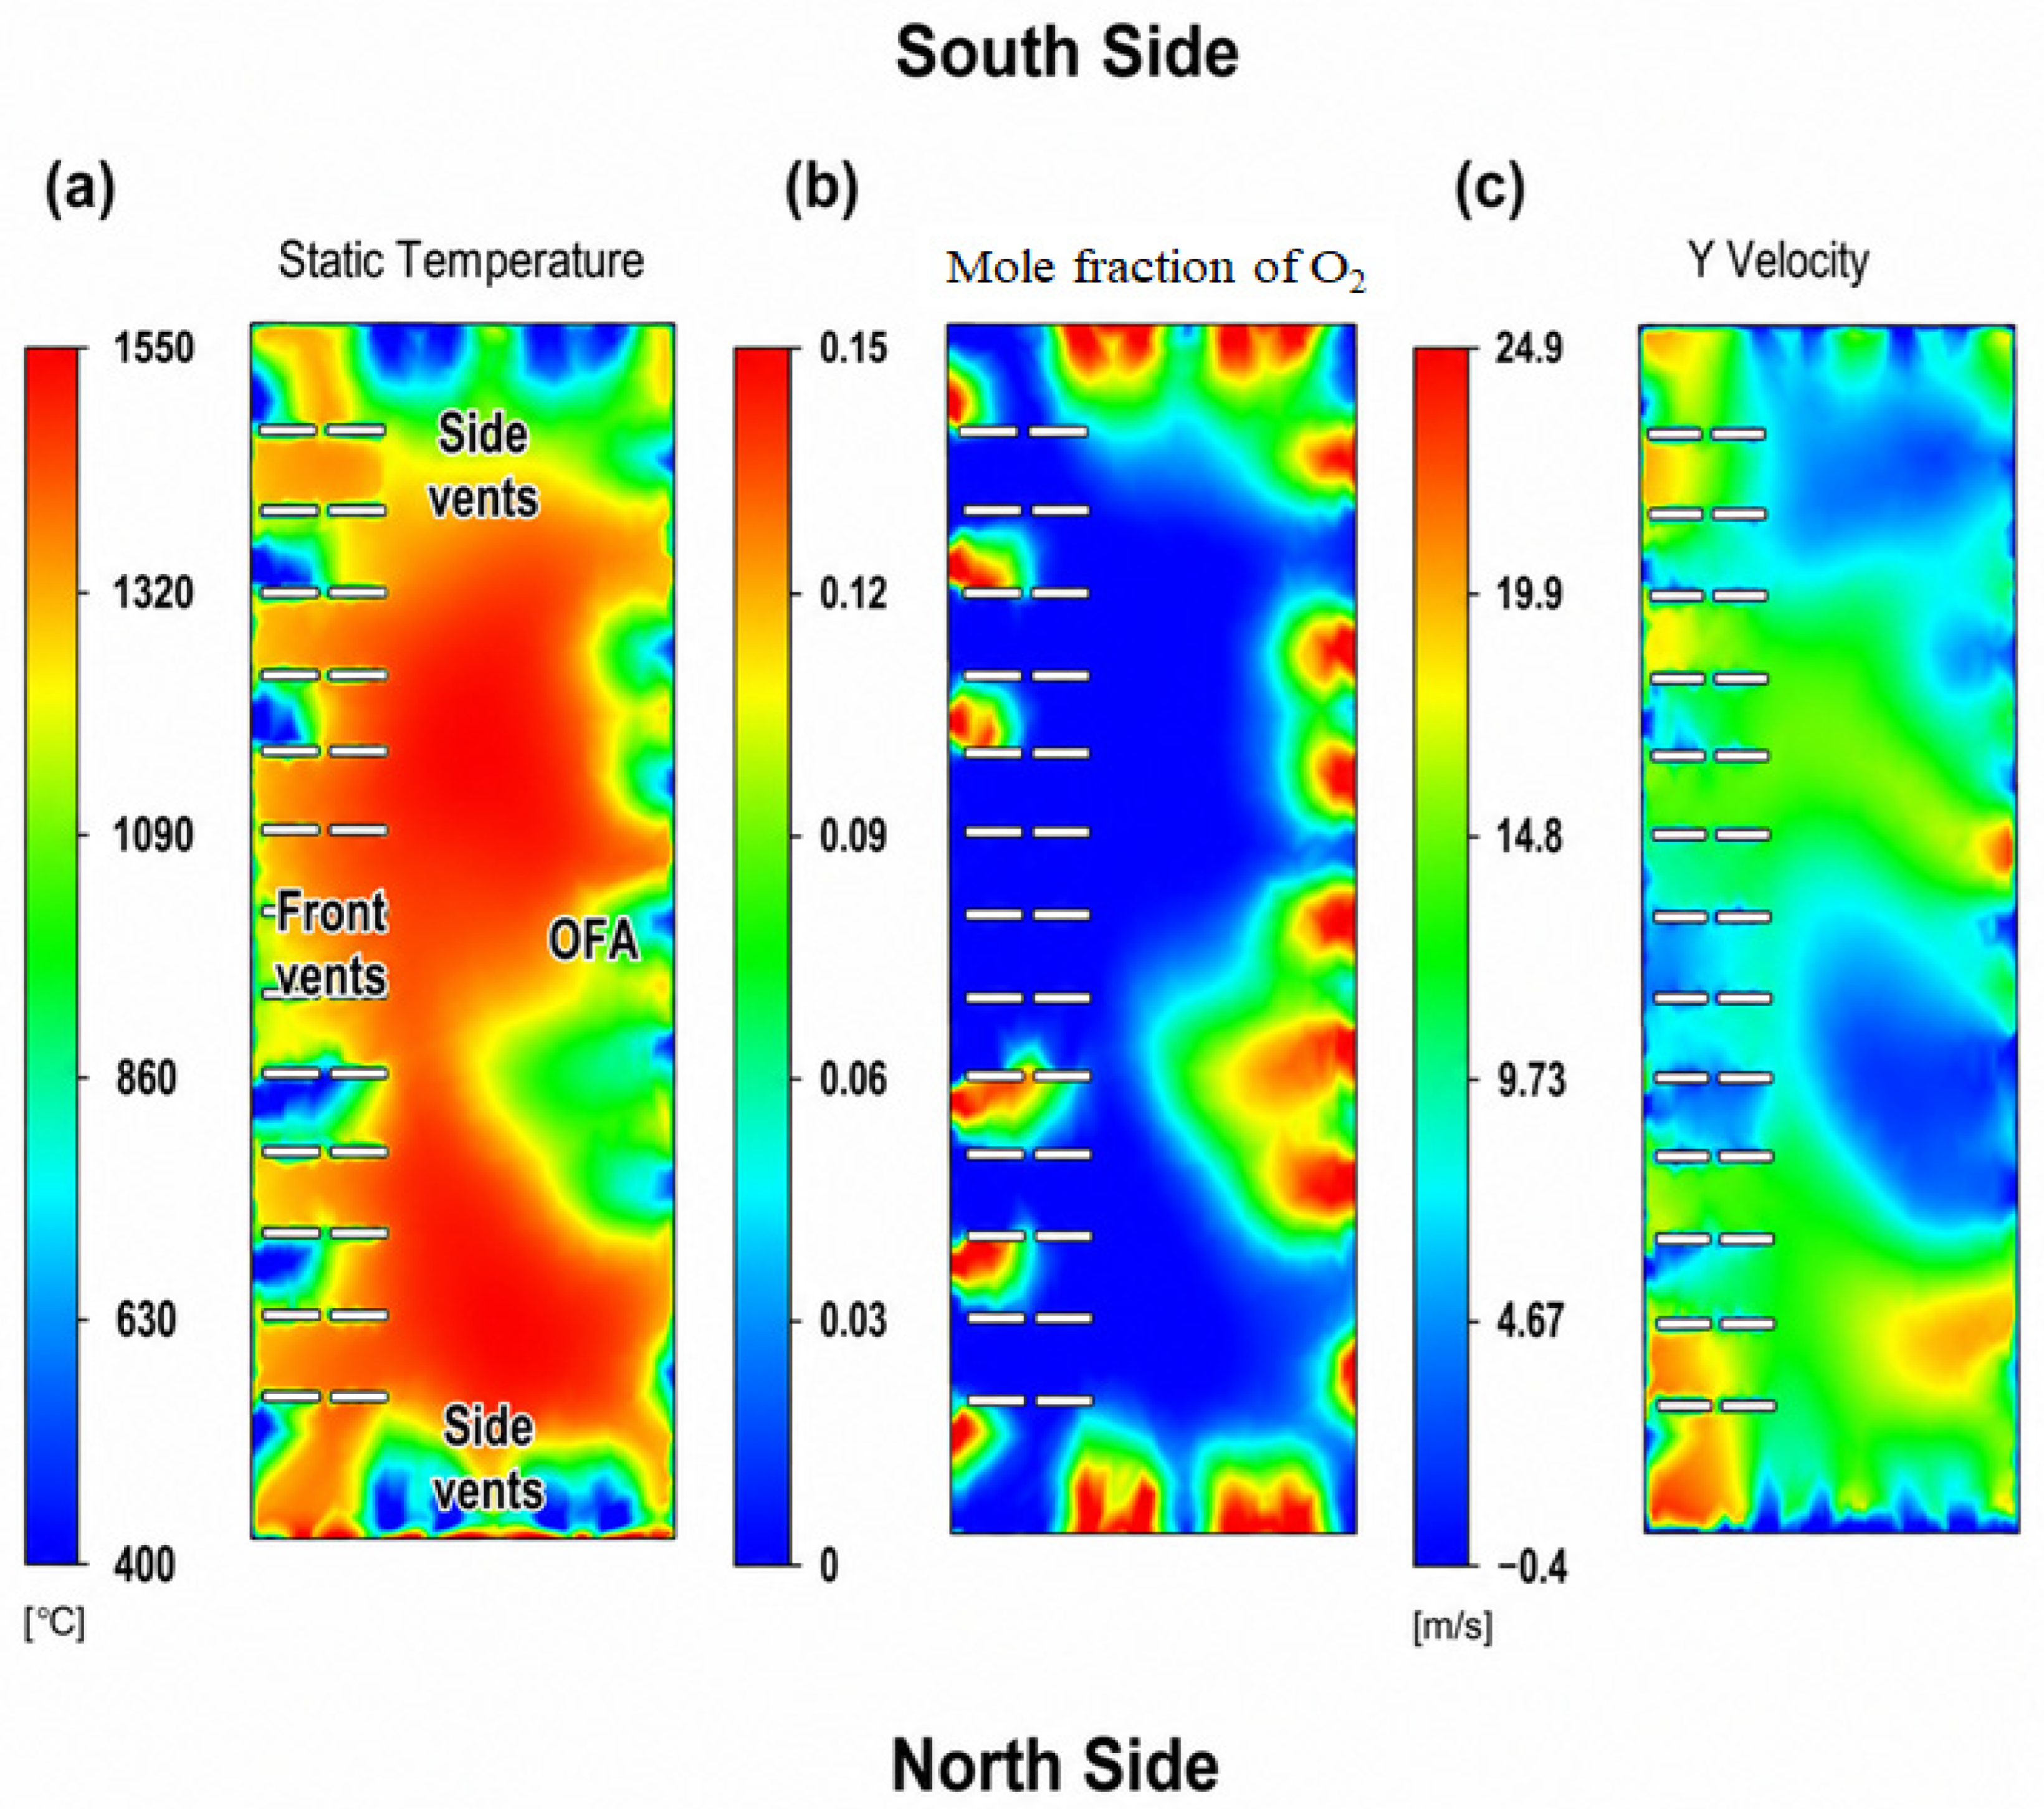
Figure 4 show a cross-sectional view of the OFA and vent ports and illustrate the mixing of OFA and vent air into the boiler. The temperature in the center of OFA/vents ports plane was 1300 °C and had rapid cooling to 1100 °C before reaching the boiler nose due to the cooler air that was introduced from the vents and OFA port (cf.
Figure 3a). Temperatures above 900 °C were maintained until the reheat section, at which point the temperature quickly dropped below the point where the alkali-sorbent reaction can occur. The temperatures at the OFA/vents ports plane are suitable for injection of sorbent, and therefore the vents and the OFA ports were the primary sorbent injection location options considered. Furthermore, because the OFA is heated, its injection velocity is roughly twice that of the vent port air, allowing the oxygen-rich OFA to penetrate deeper into the boiler body and provide superior sorbent dispersion.
3.2. Sorbent Injection Location Selection
The CFD model evaluated several sorbent injection locations for the full-scale demonstration.
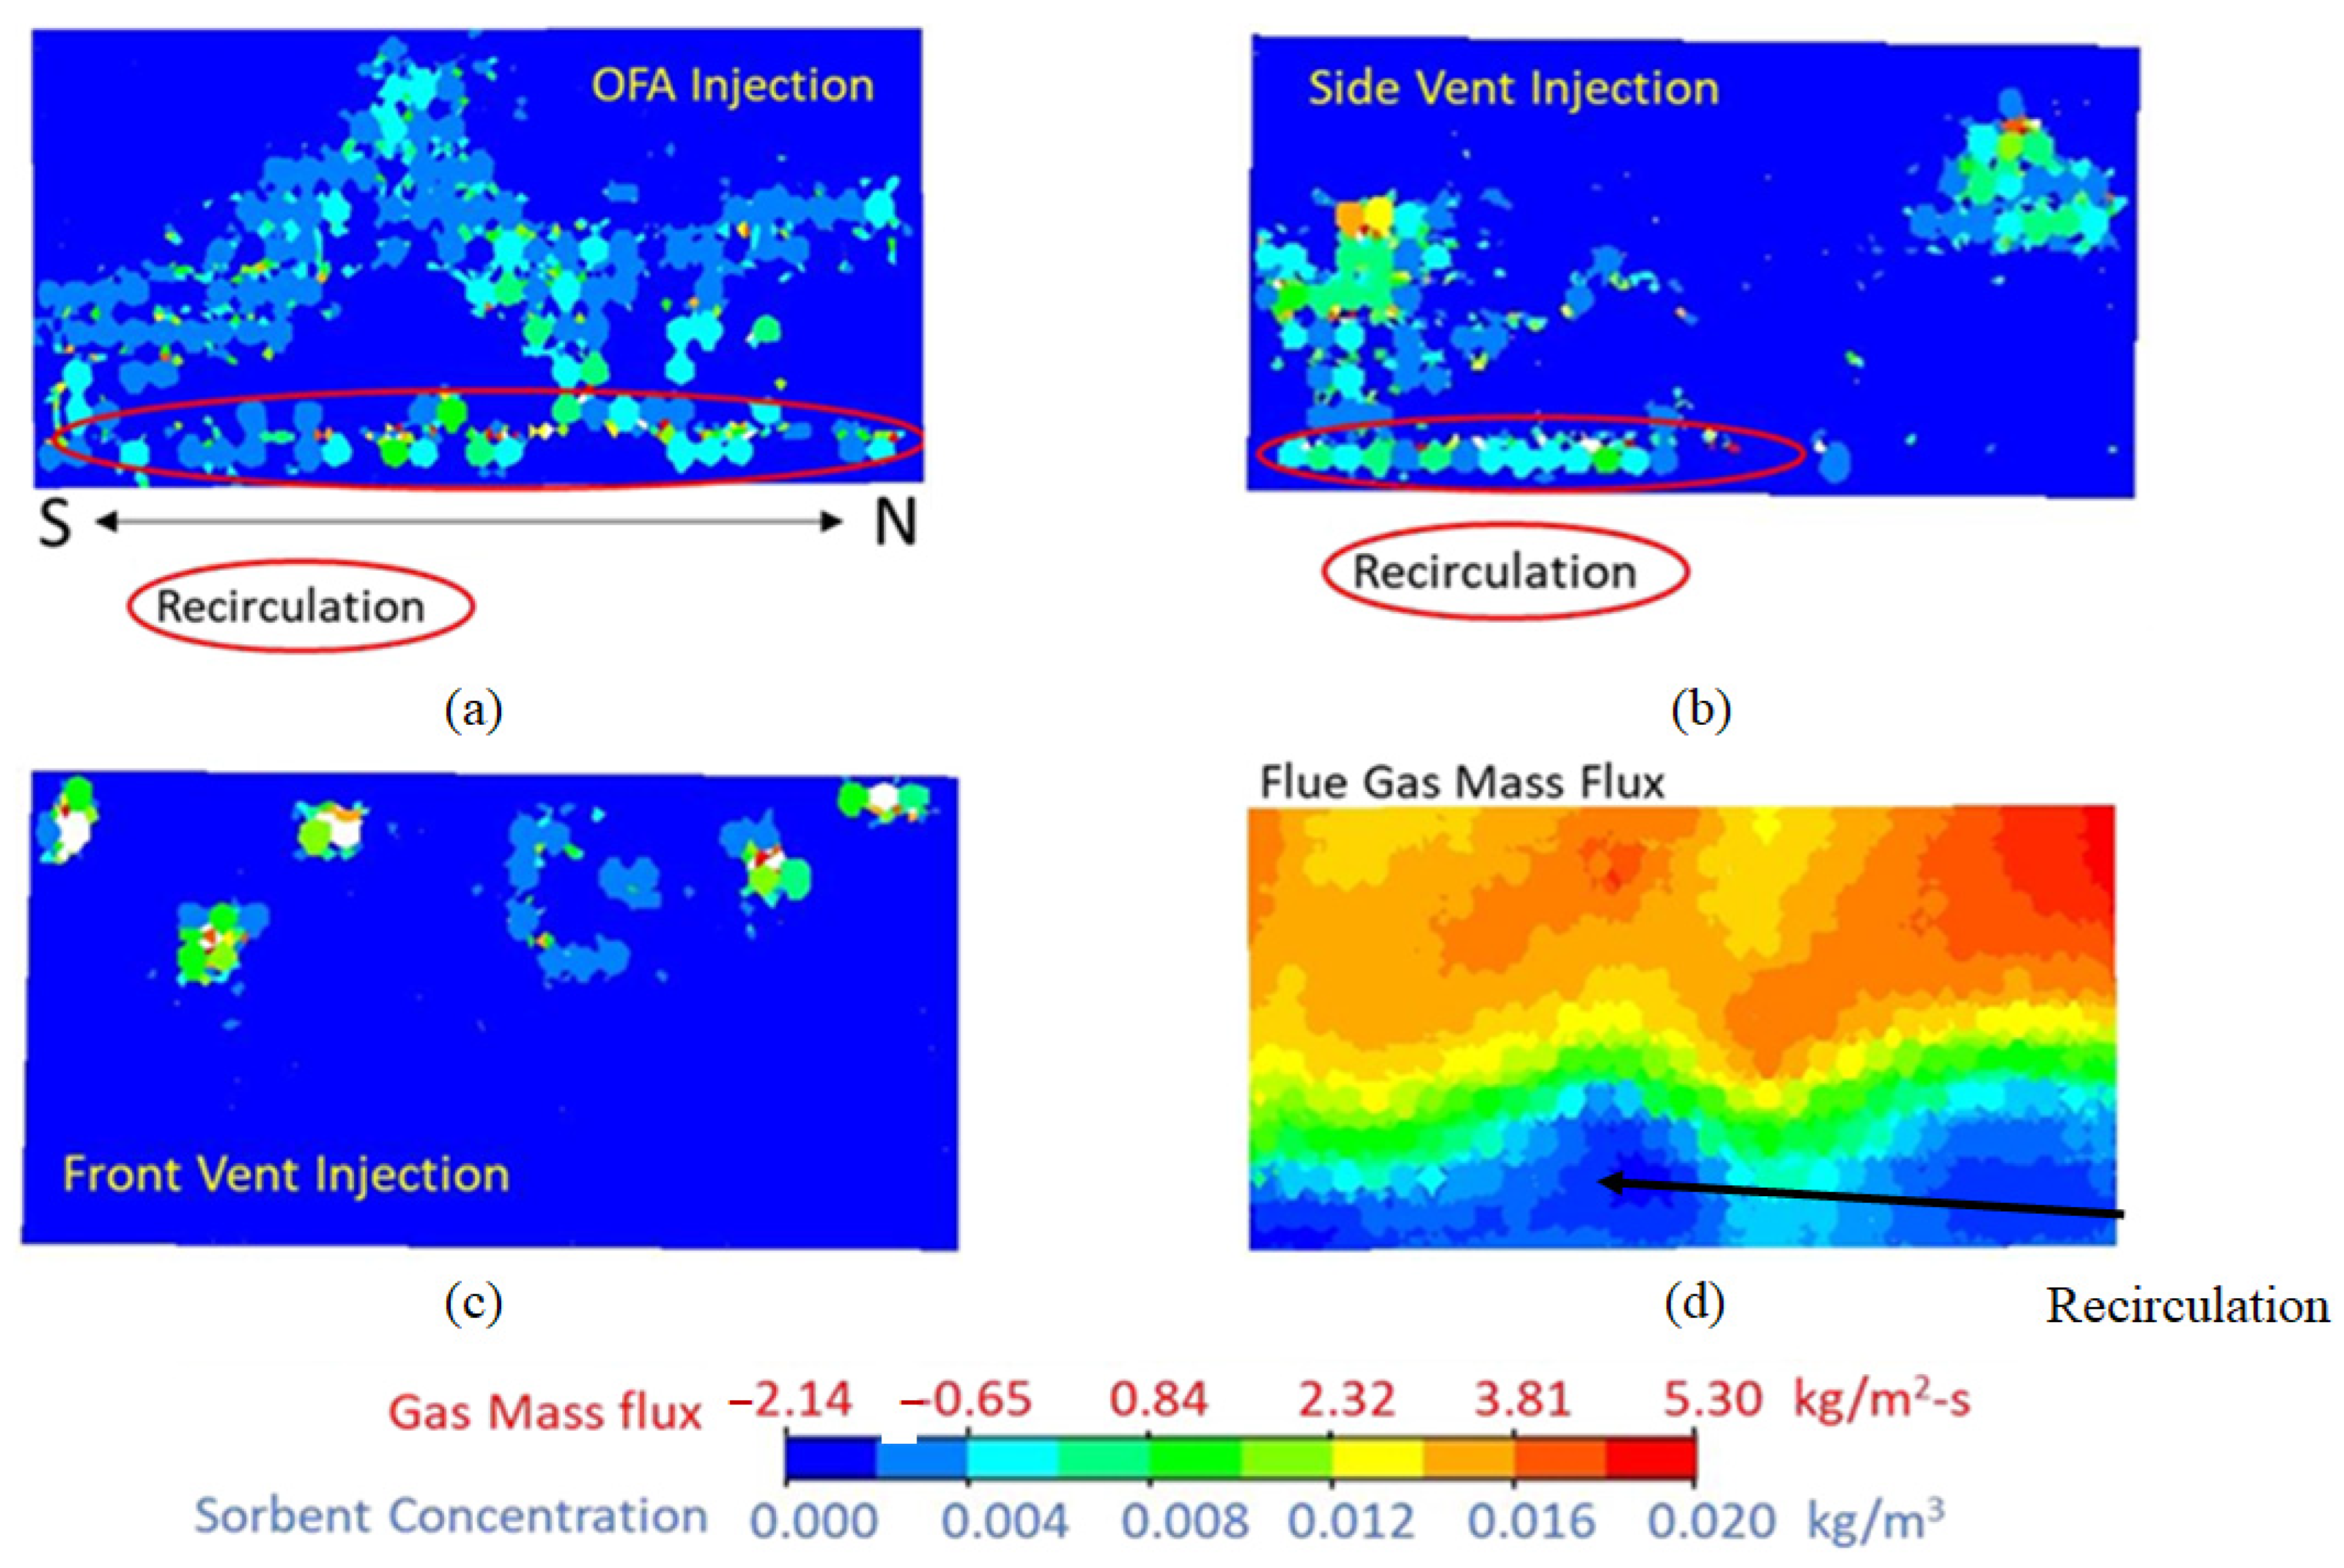
Figure 5 shows the modeled areas of coverage of sorbent injected at the OFA, front vent, and side vent ports.
Modeling revealed that sorbent injected through the OFA ports spread effectively along the back wall, whereas front wall vent (FV) port injection directed the sorbent toward the boiler roof, while the side vent injections remained localized on their respective sides. Because no single injection location provided adequate dispersion, a multi-port approach was deemed necessary to treat the entire flue gas volume.
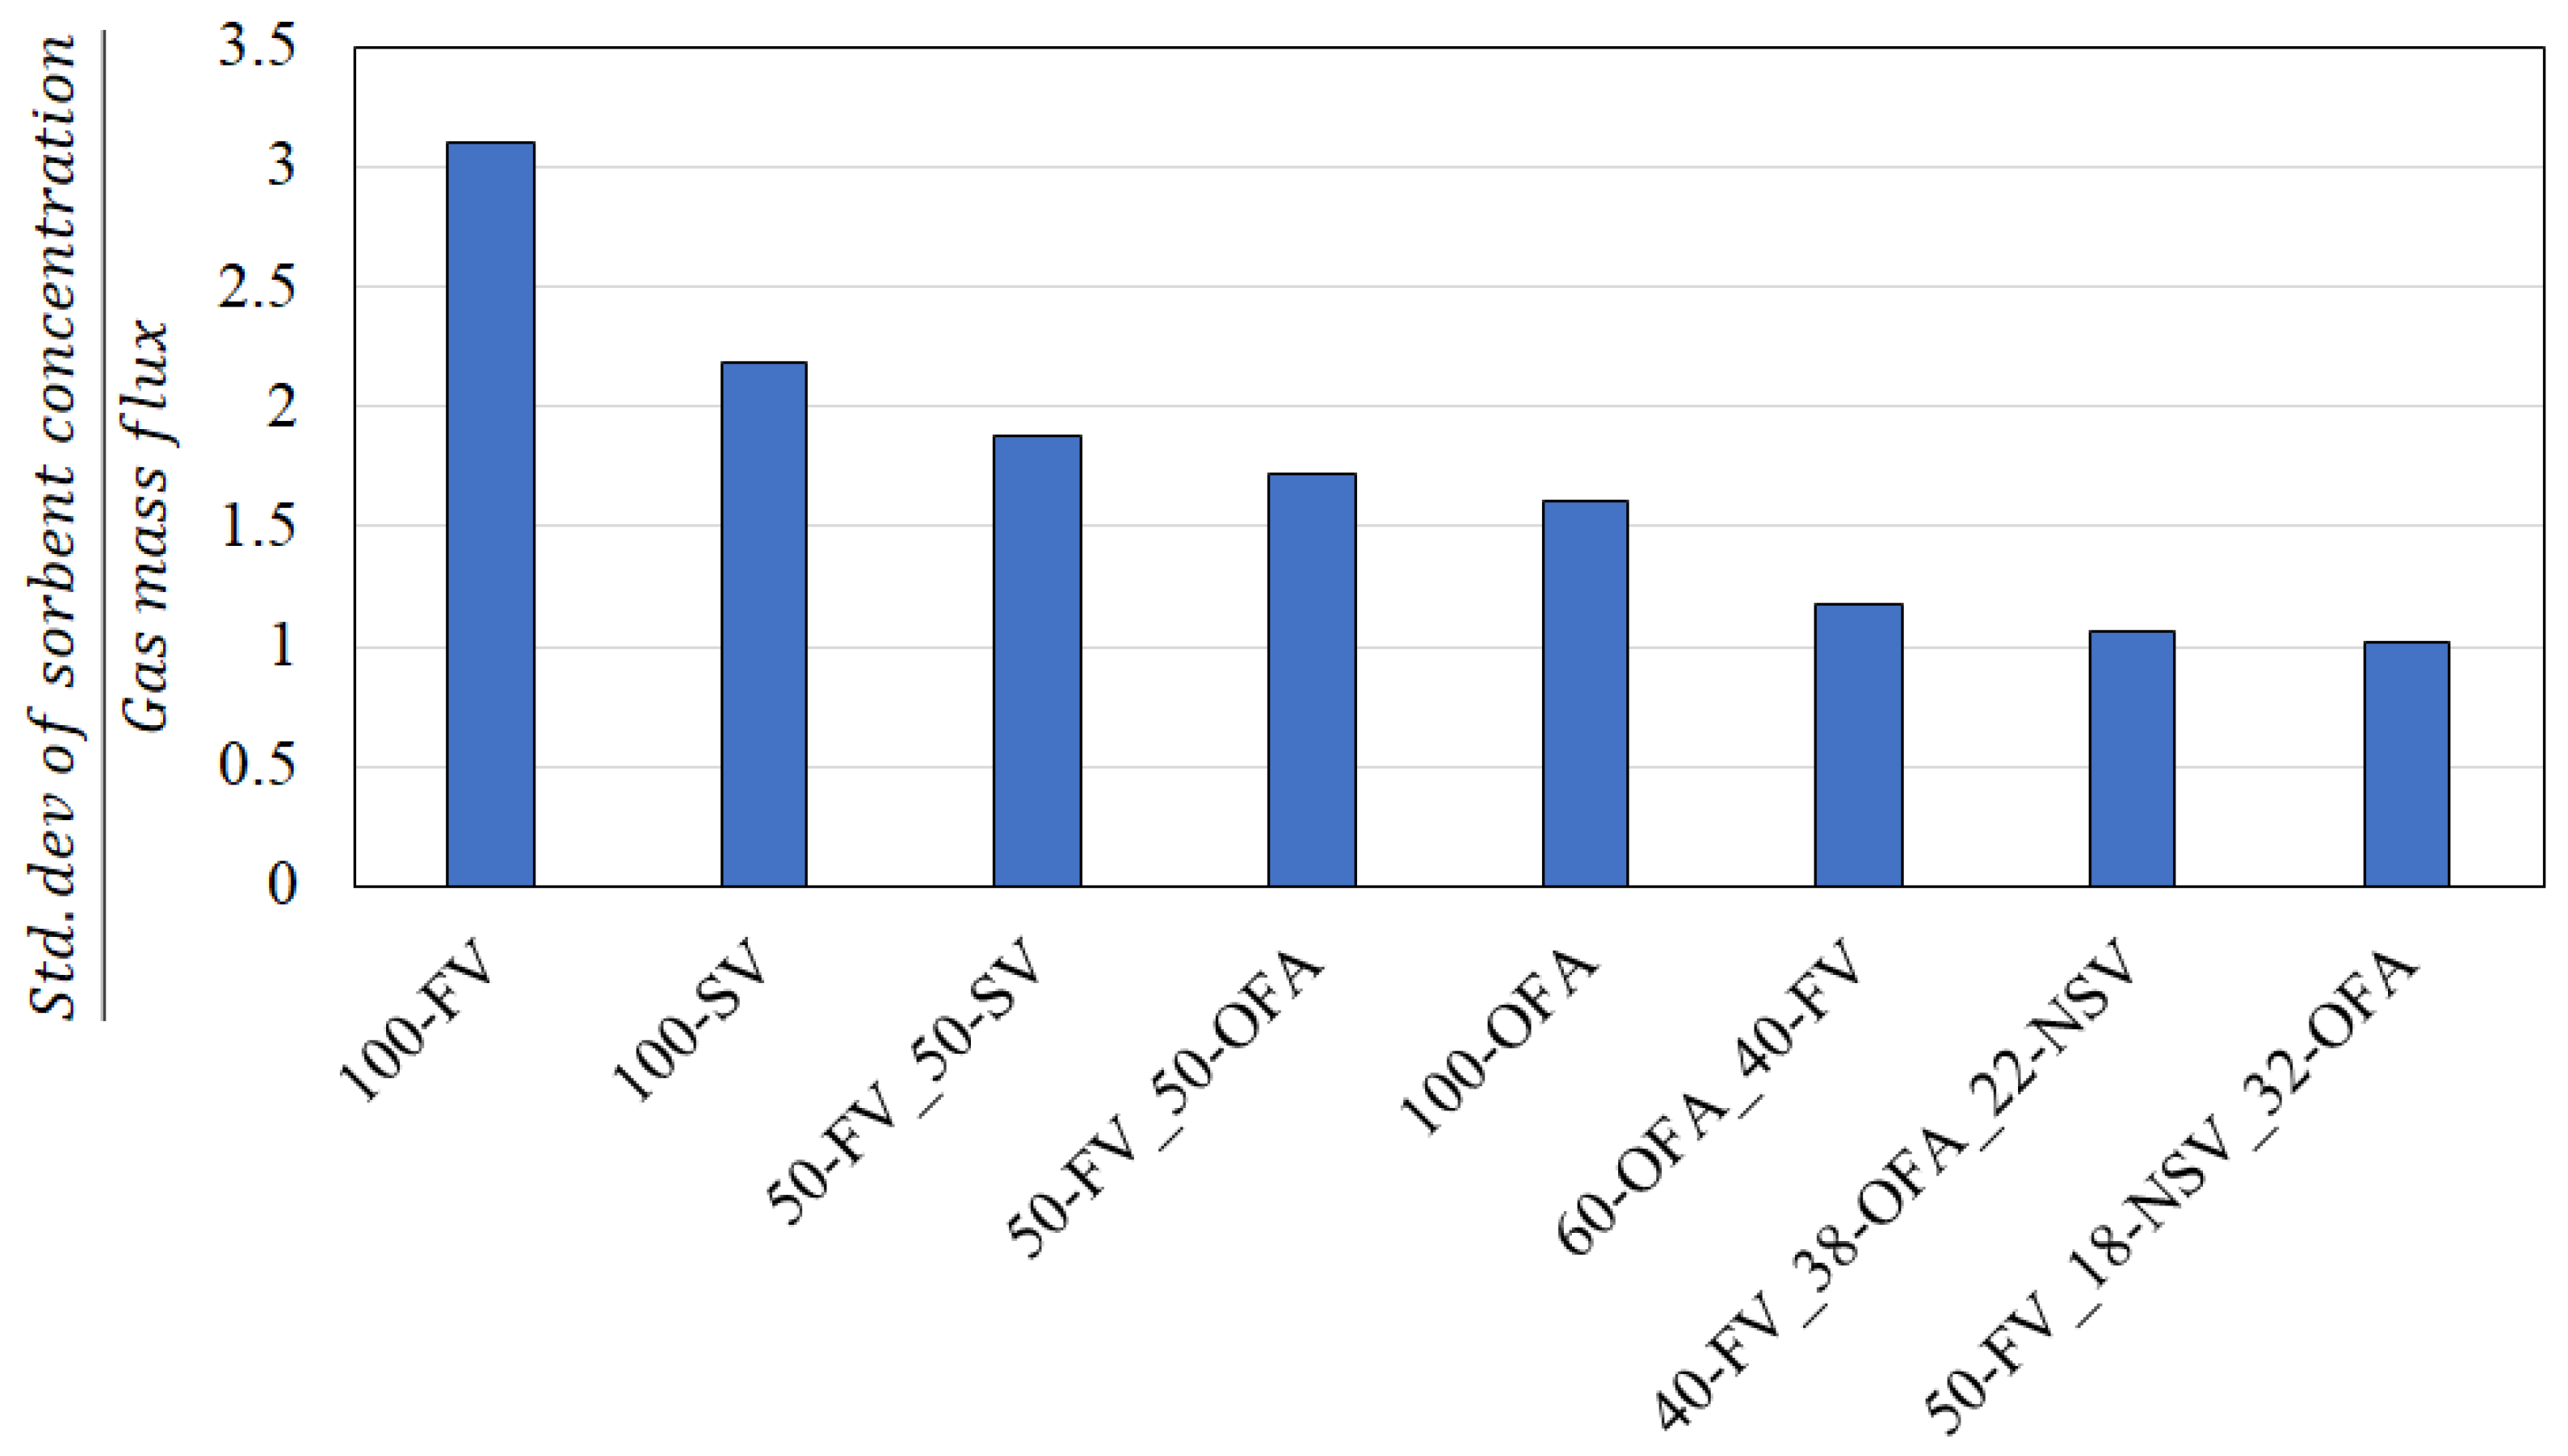
To determine the mass ratios of sorbent to each injection port, a constant total quantity of sorbent was distributed between the OFA, front vent, and side vent injection location options in varying amounts. The ratio of the relative standard deviation of sorbent concentration and gas flux of each injection combination at the reheat plane was calculated and is shown in
Figure 6. The injection with the lowest relative standard deviation ratio corresponds to the best sorbent mixing. The inlet to the reheat plane was used to evaluate mixing, as it is far enough downstream of the injections such that the sorbent spreads may be observed. These calculations lead to the recommendation to use the OFA, FV, and north-side vents (NSV) for sorbent injection.
The field tests required modifications to the optimal injection configuration described above for practical reasons. The configuration used in the field tests sent 50% of the sorbent to six OFA ports, 17% to the four NSV ports, 21% to the three northernmost FV ports, and 12% to the southernmost FV ports.
3.3. Model Predictions of Alkali Removal
Sorbent capture was modeled in a decoupled, post-processing approach. To accurately reflect observed particle size distributions, coal fly ash (CFA) was modeled across five distinct size bins (
Table 6) and injected alongside coal particles. Alkali capture reaction on the CFA particles was not activated until the CFA reached the OFA ports plane (model validated for temperatures less than 1400 °C) and the coal burnout was complete.
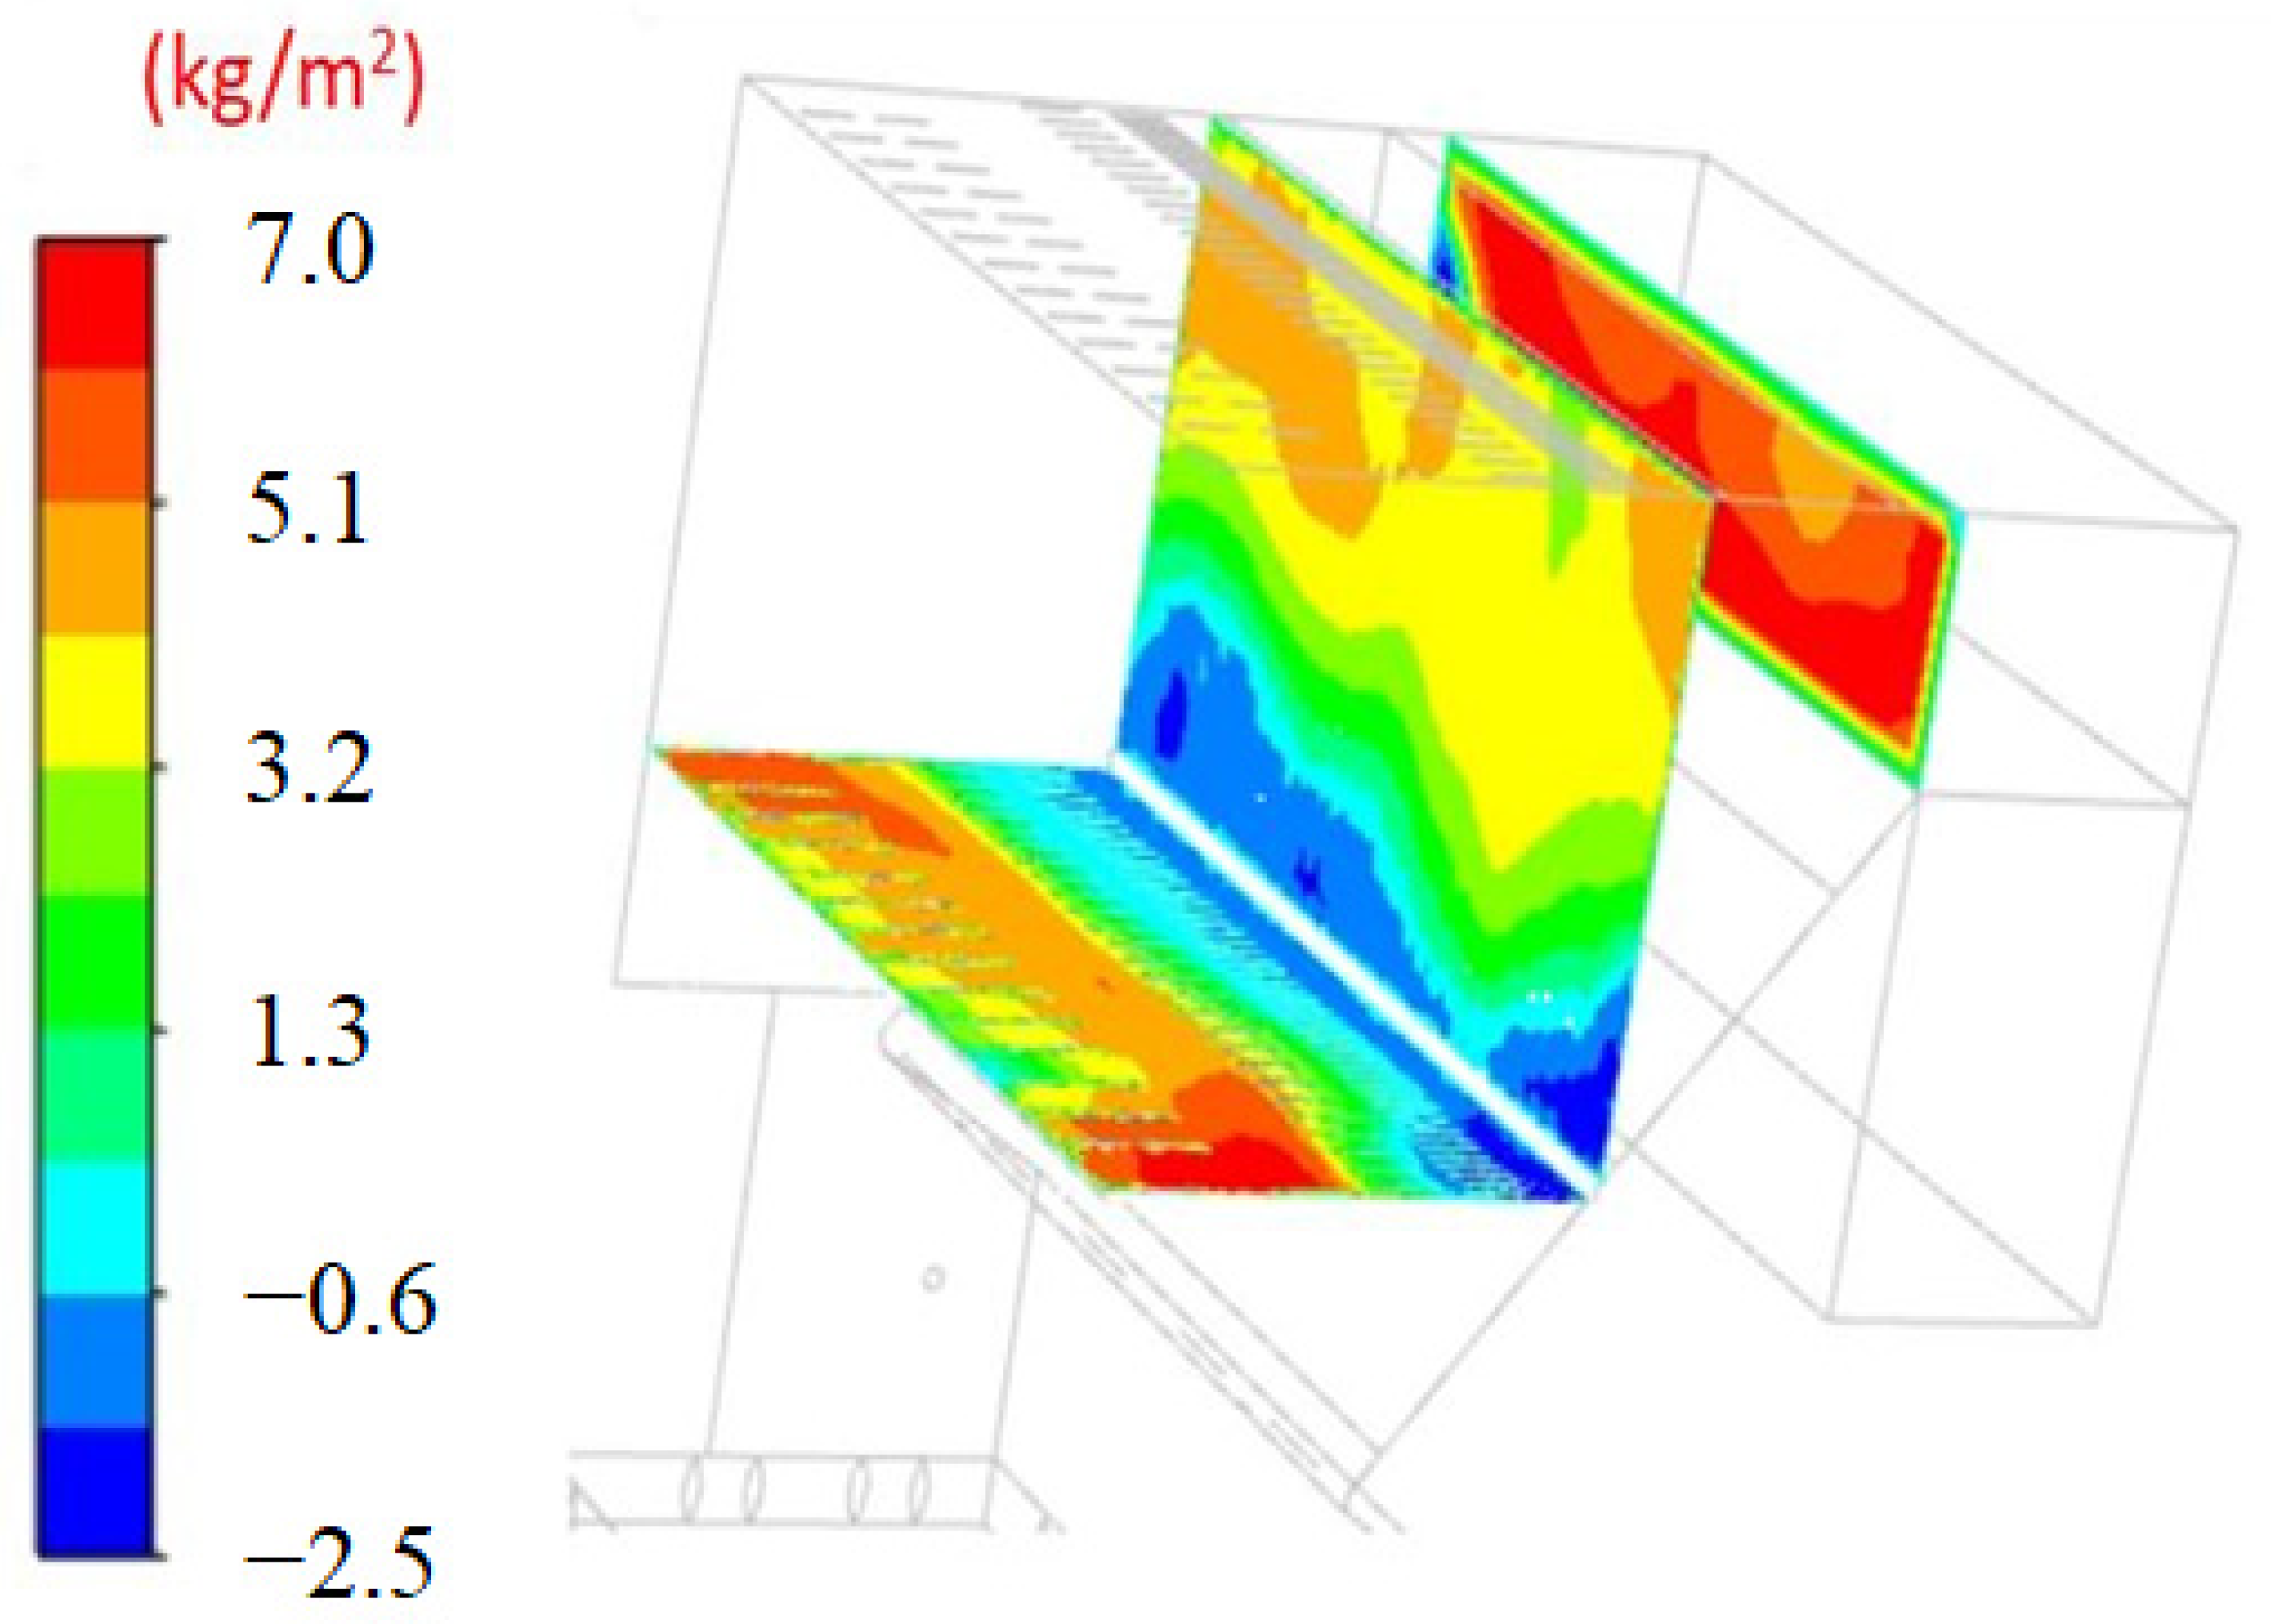
The flue gas mass flux throughout the sorbent reaction zone is shown in
Figure 7. The reaction zone starts at the OFA and vent ports inlet plane and continues through the convective pass. The model still showed higher mass flow in the corners of the front wall. This concentration of mass continues downstream to the upper corners of the reheat plane. A negative mass flux indicative of a recirculation zone was present along the sloped floor of the reheater and secondary superheater. The mass flow was much more uniformly distributed at the start of the turn into the convective pass section of the boiler due to the flow being restricted to a smaller cross-section.
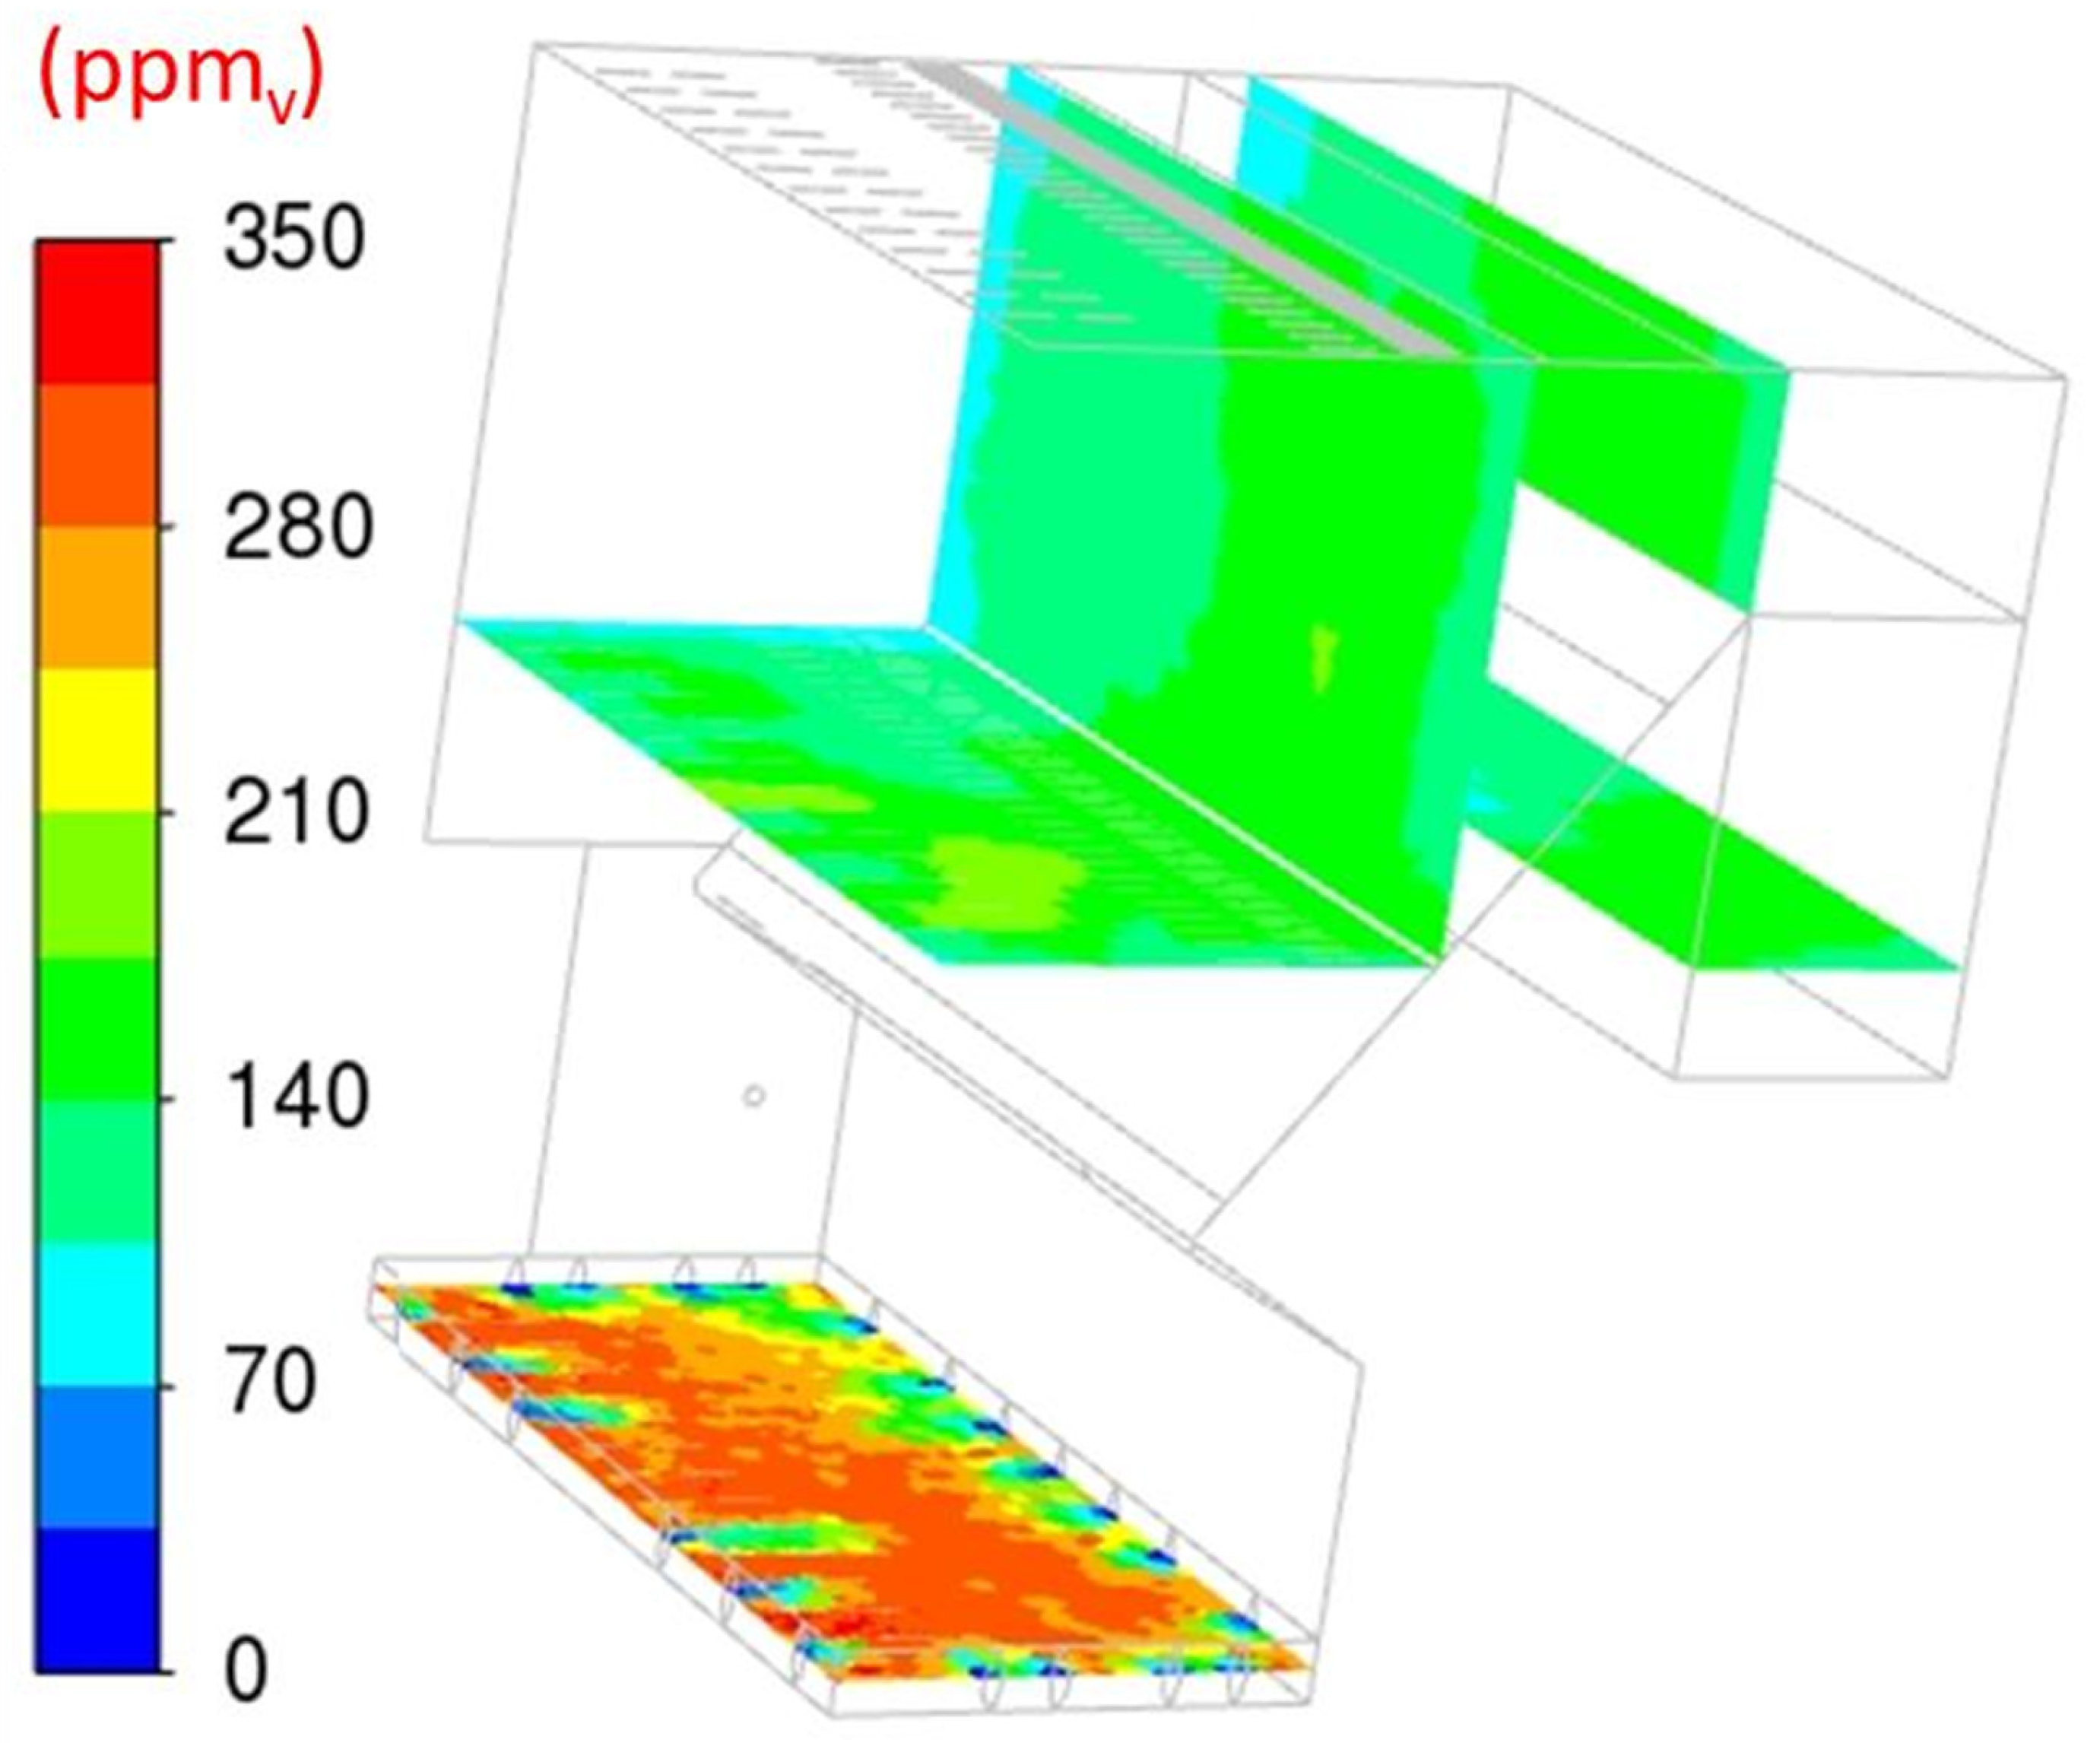
The modeled concentration profile of sodium vapor species is shown in
Figure 8. The concentration of sodium vapor species was uniform across the boiler cross-section prior to the OFA/vent port location. The air from the OFA and vents dilutes the concentration by about one-third. The mixing of the vent and OFA was not fully uniform and created a slight dilution of sodium species along the side walls compared to the center of the boiler. The concentration of sodium species varied during the field tests due to varying levels of sodium in the coal. Live data of coal sodium content was used to adjust the quantity of sodium entering the boiler for each case. During the baseline, low rate, and high rate cases, the concentration of sodium after the OFA and vent air dilution was 230, 260, and 180 ppm
v, respectively, prior to activating the capture reactions in the model.
The CFD model was then used to estimate the alkali capture that occurred during the field demonstration tests. The sorbent was injected using the same particle size bins of the CFA shown in
Table 6. Portioning of the sorbent to the size bins was done to be representative of the sorbent particle distribution. The average size distribution of the sorbent used in the field demonstrations had a d
10 of 2.6 μm, d
50 of 12 μm, and d
90 of 50 μm determined using a Malvern particle size analyzer of samples collected during injection. The composition of the sorbent was about 60% SiO
2, 24% Al
2O
3, 2% Na
2O, and 14% other by weight.
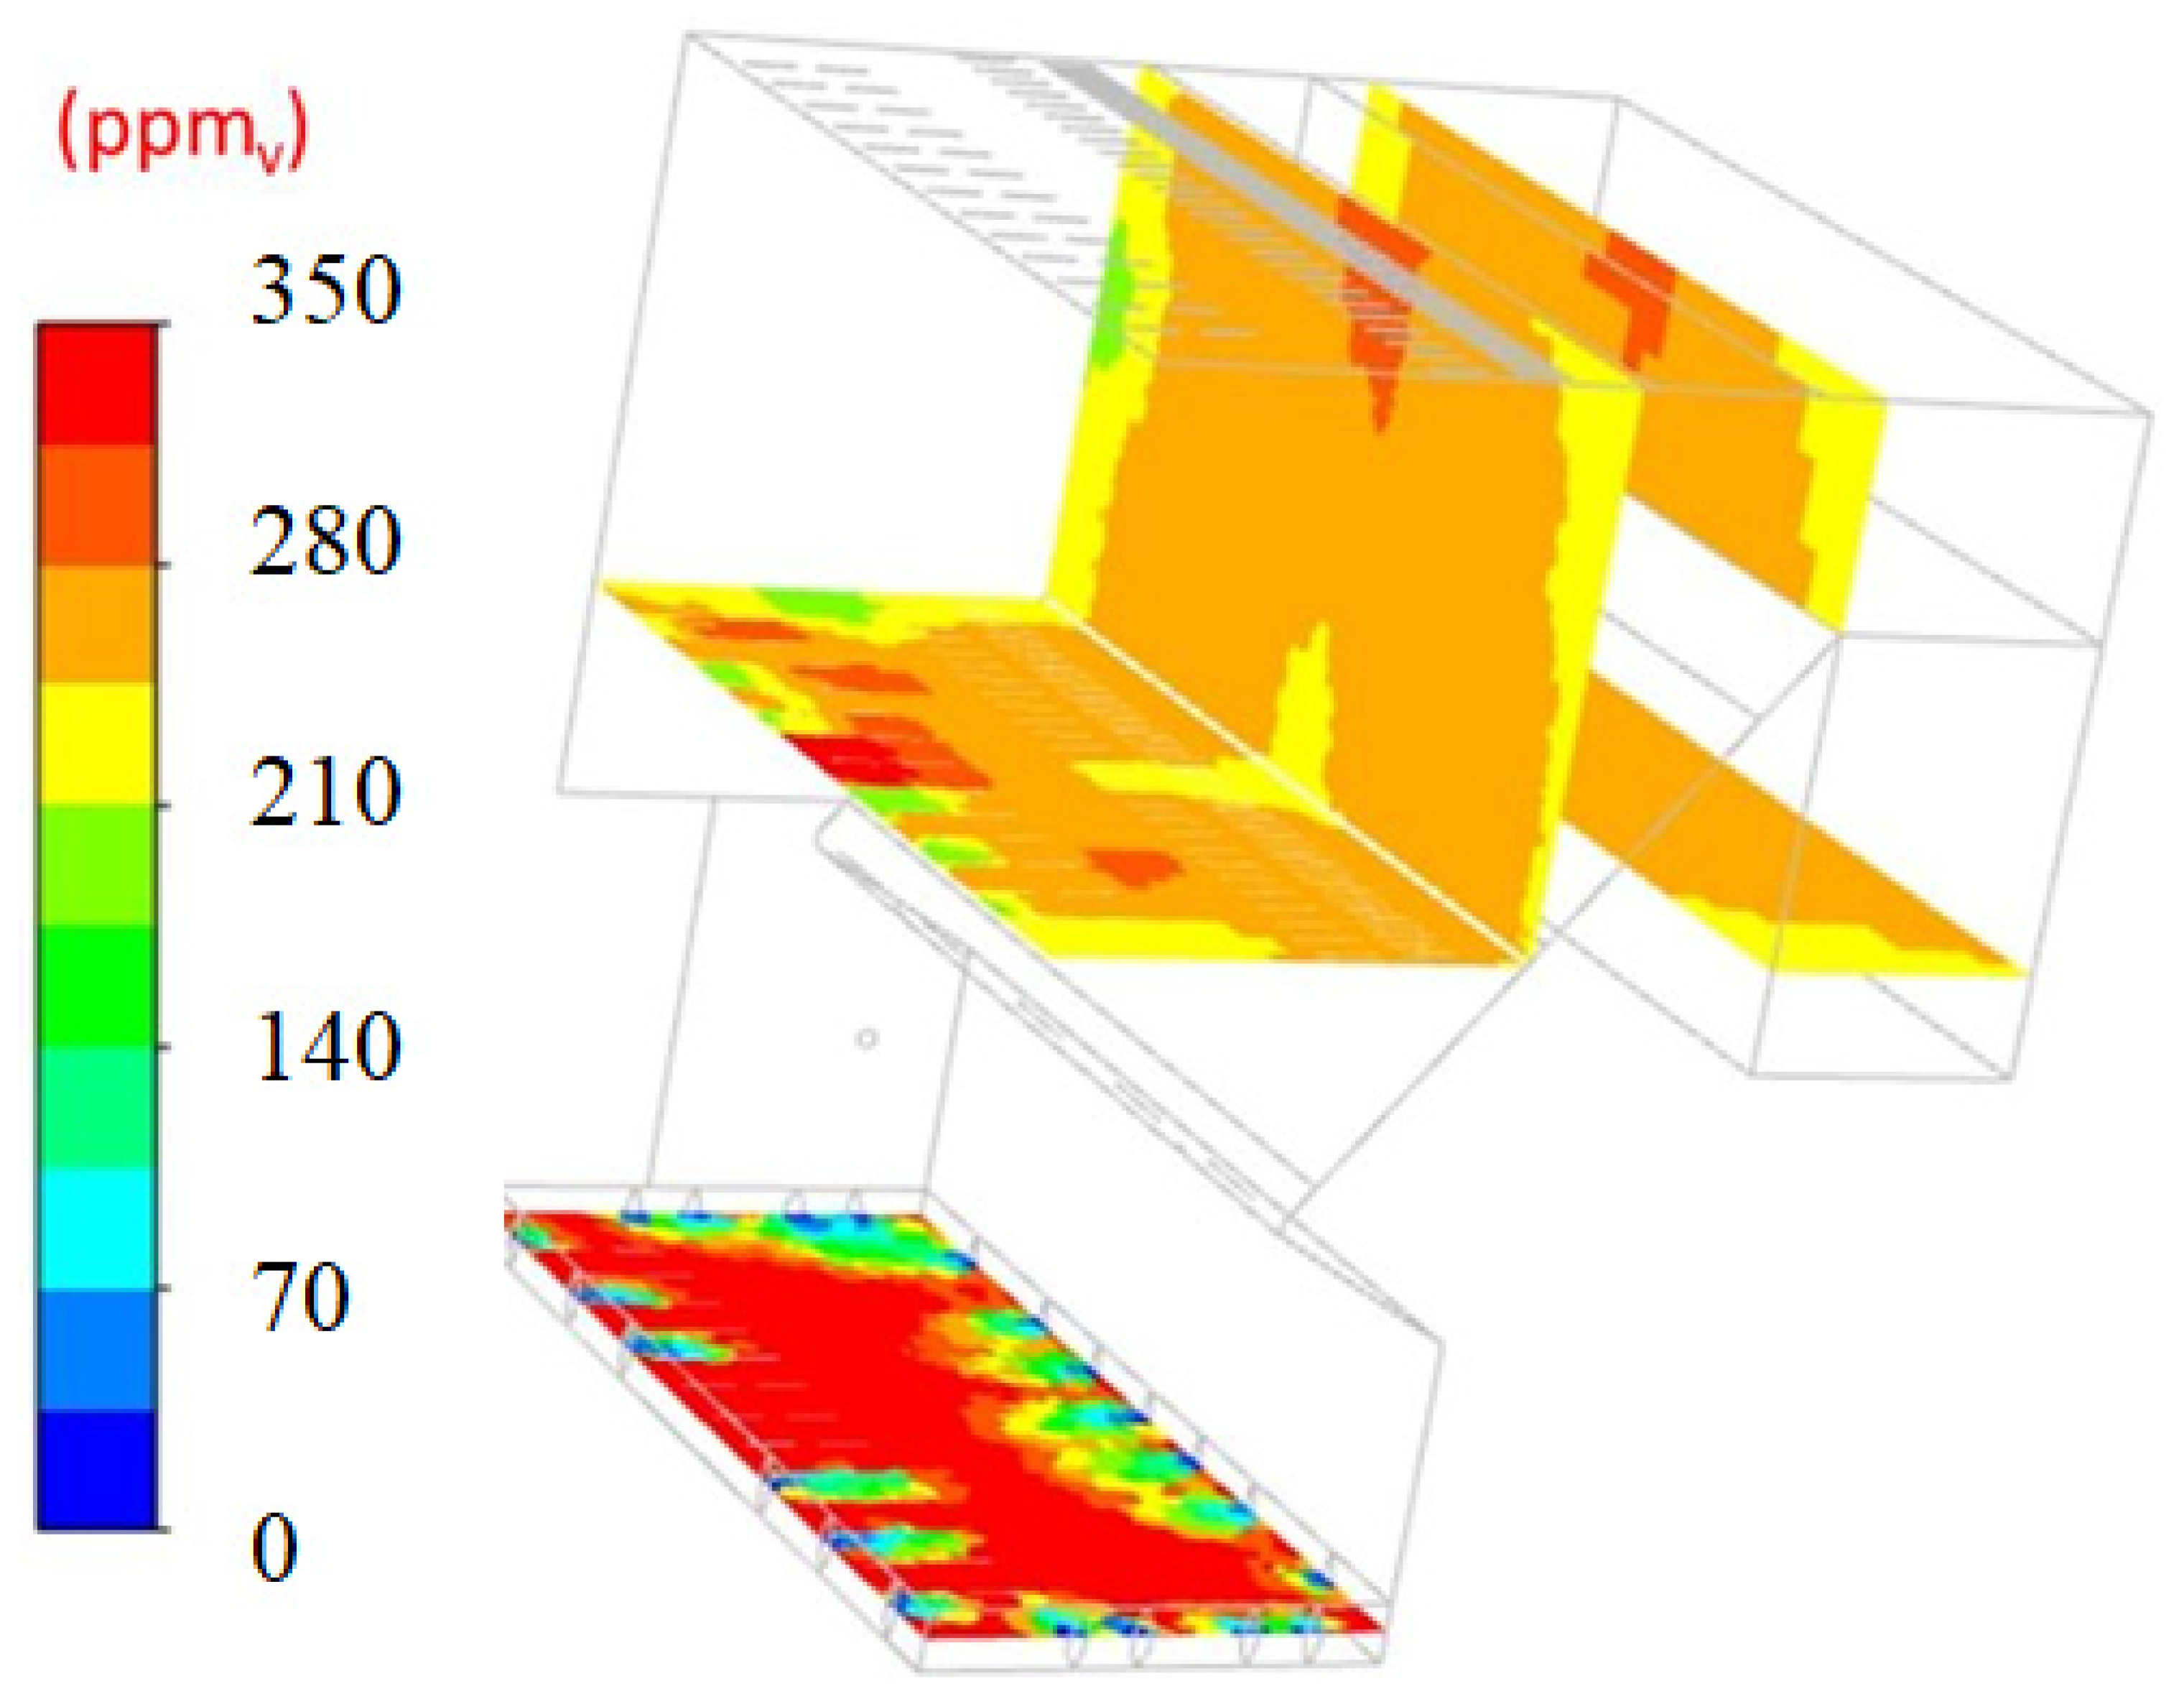
Figure 9 shows the model concentration profile of sodium vapor species after capture by the CFA during the baseline case. Uniform removal was observed. The sodium concentration was reduced by 41% from 230 to 135 ppm
v in the model, which matched well with the experimental value of 42%, as determined by ICP-OES analysis of samples collected from ESP hoppers.
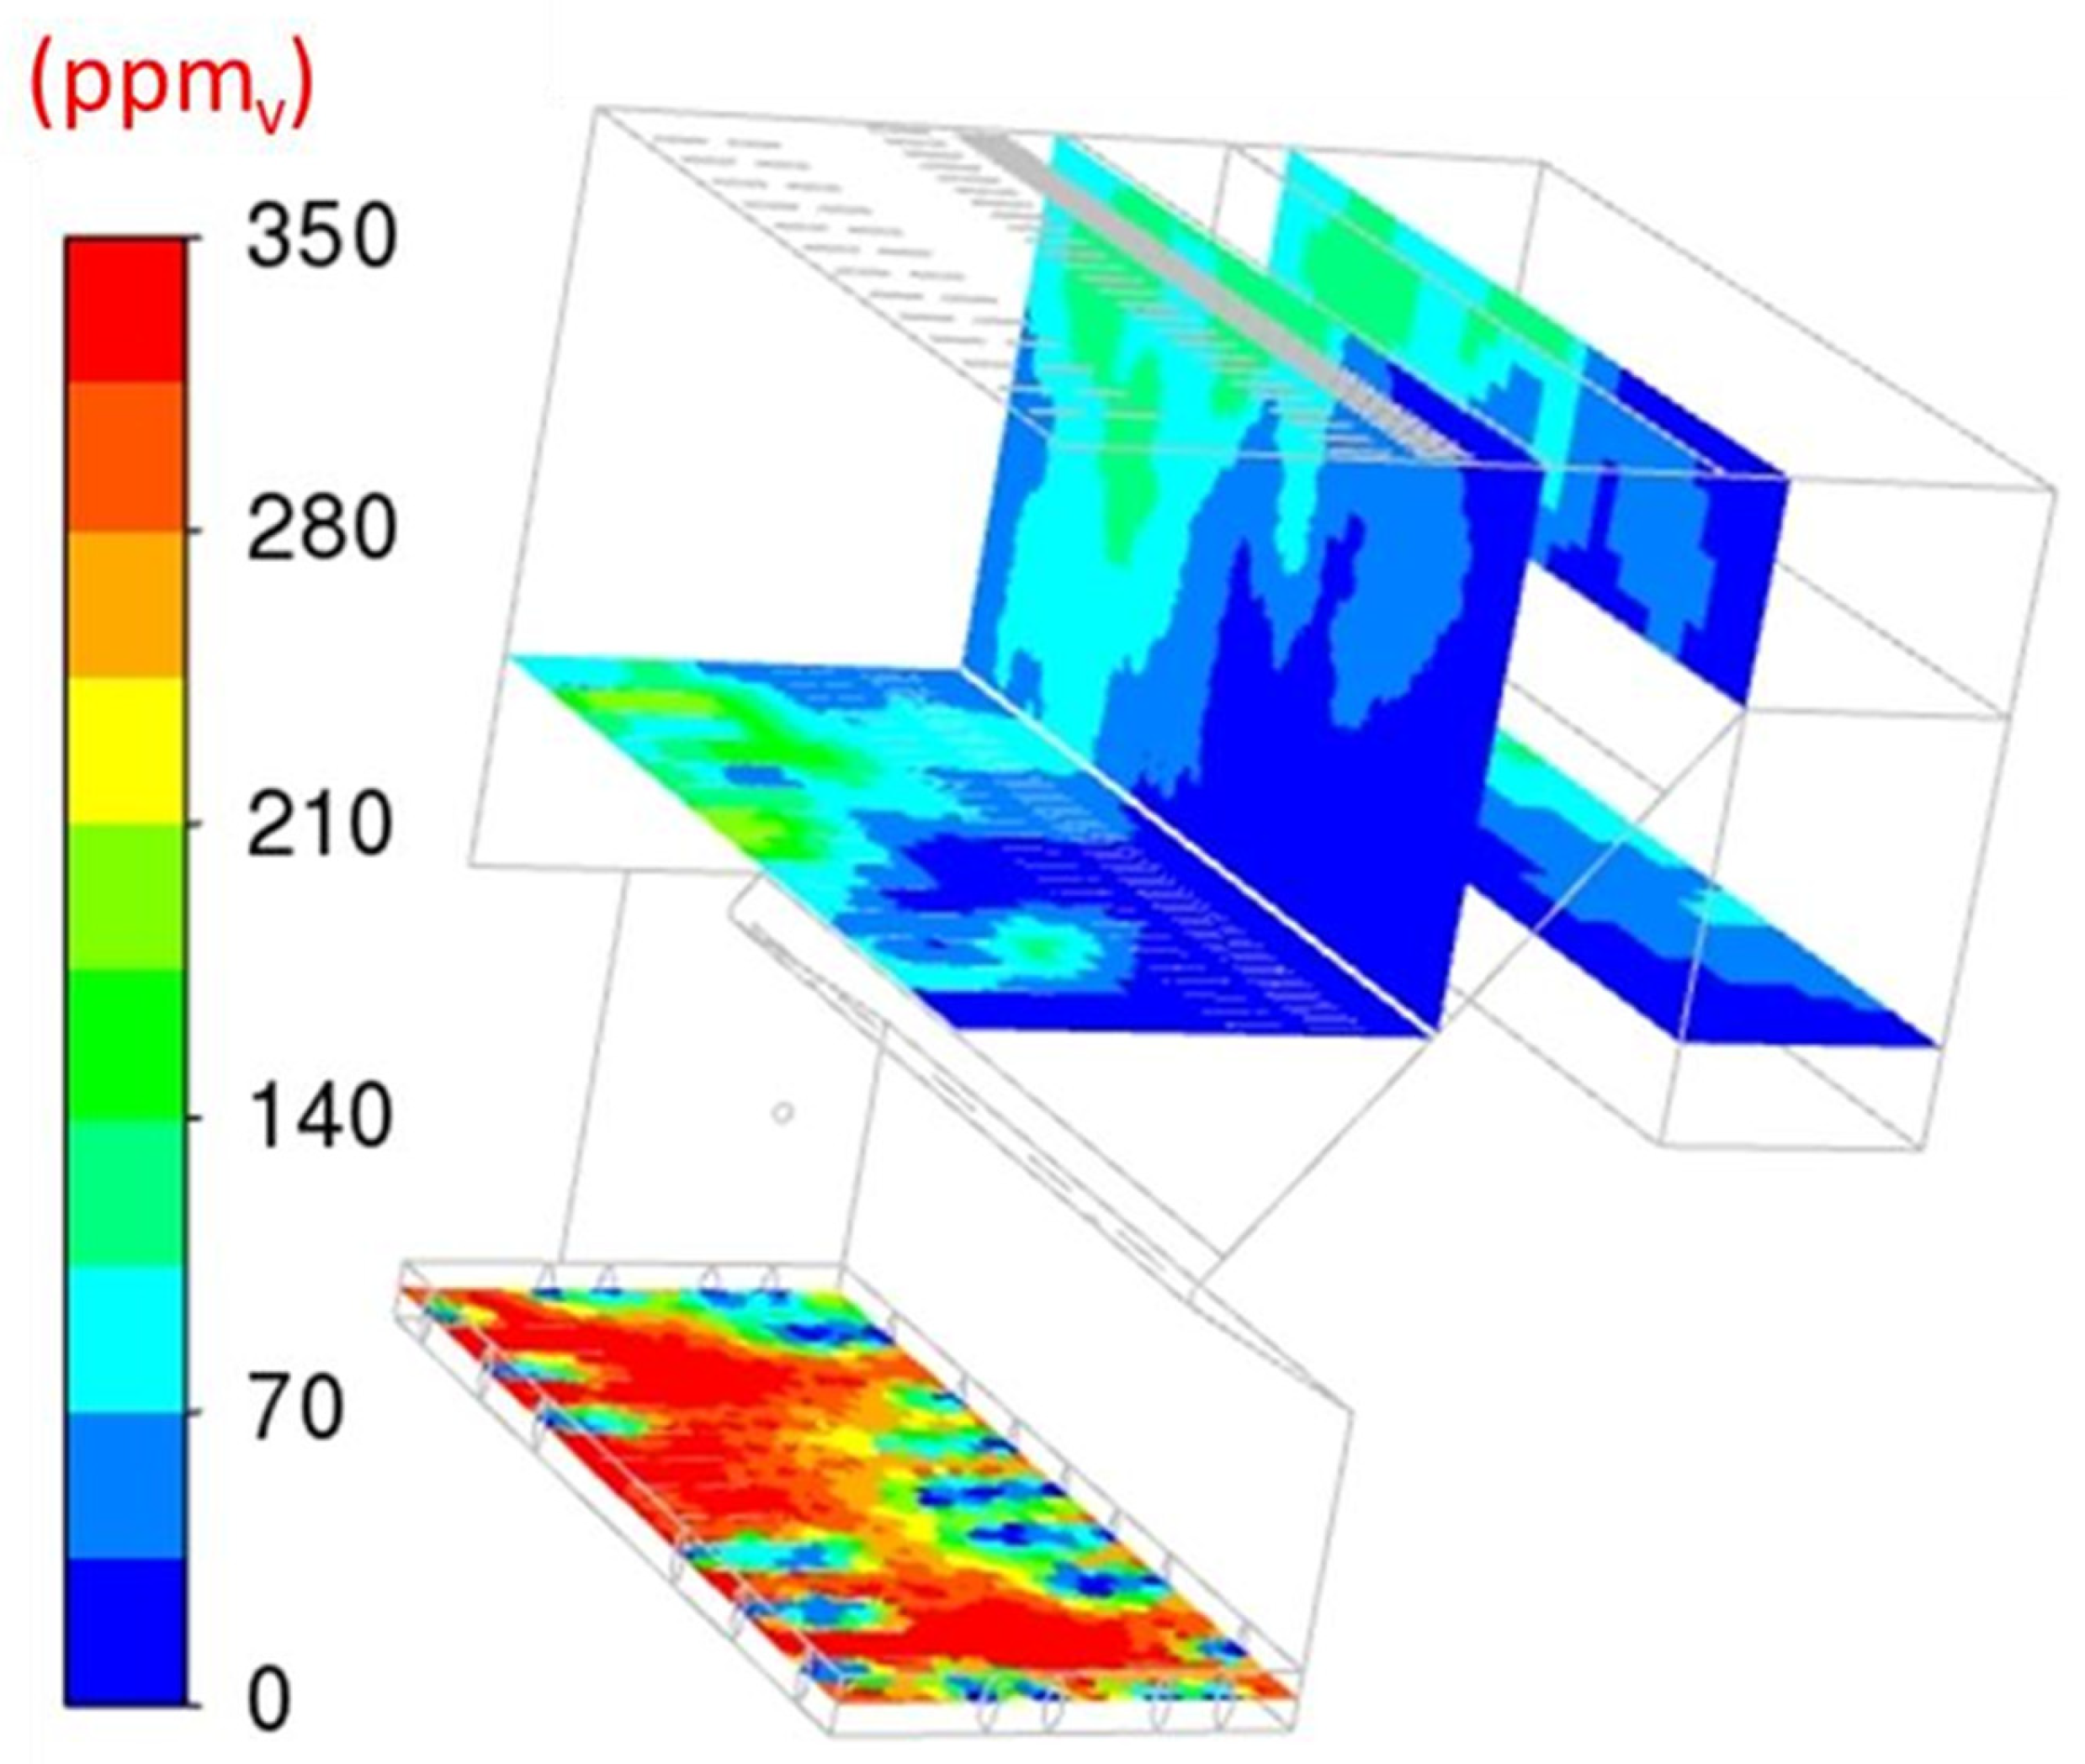
The modeled concentration profile of sodium vapor species after capture by the CFA and a low sorbent injection rate is shown in
Figure 10. Unlike in the CFA-only instance (baseline case), the reacting particles are not uniformly distributed in the boiler, which results in a nonuniform distribution of sodium. The sodium was depleted on the north side of the boiler given the bias of sorbent to the north side. This suggests that the bias of sorbent to the north side of the boiler be reduced. For this sorbent injection case, a total capture of 75% of the sodium was predicted by the model, which was greater than the experimental value of 62%.
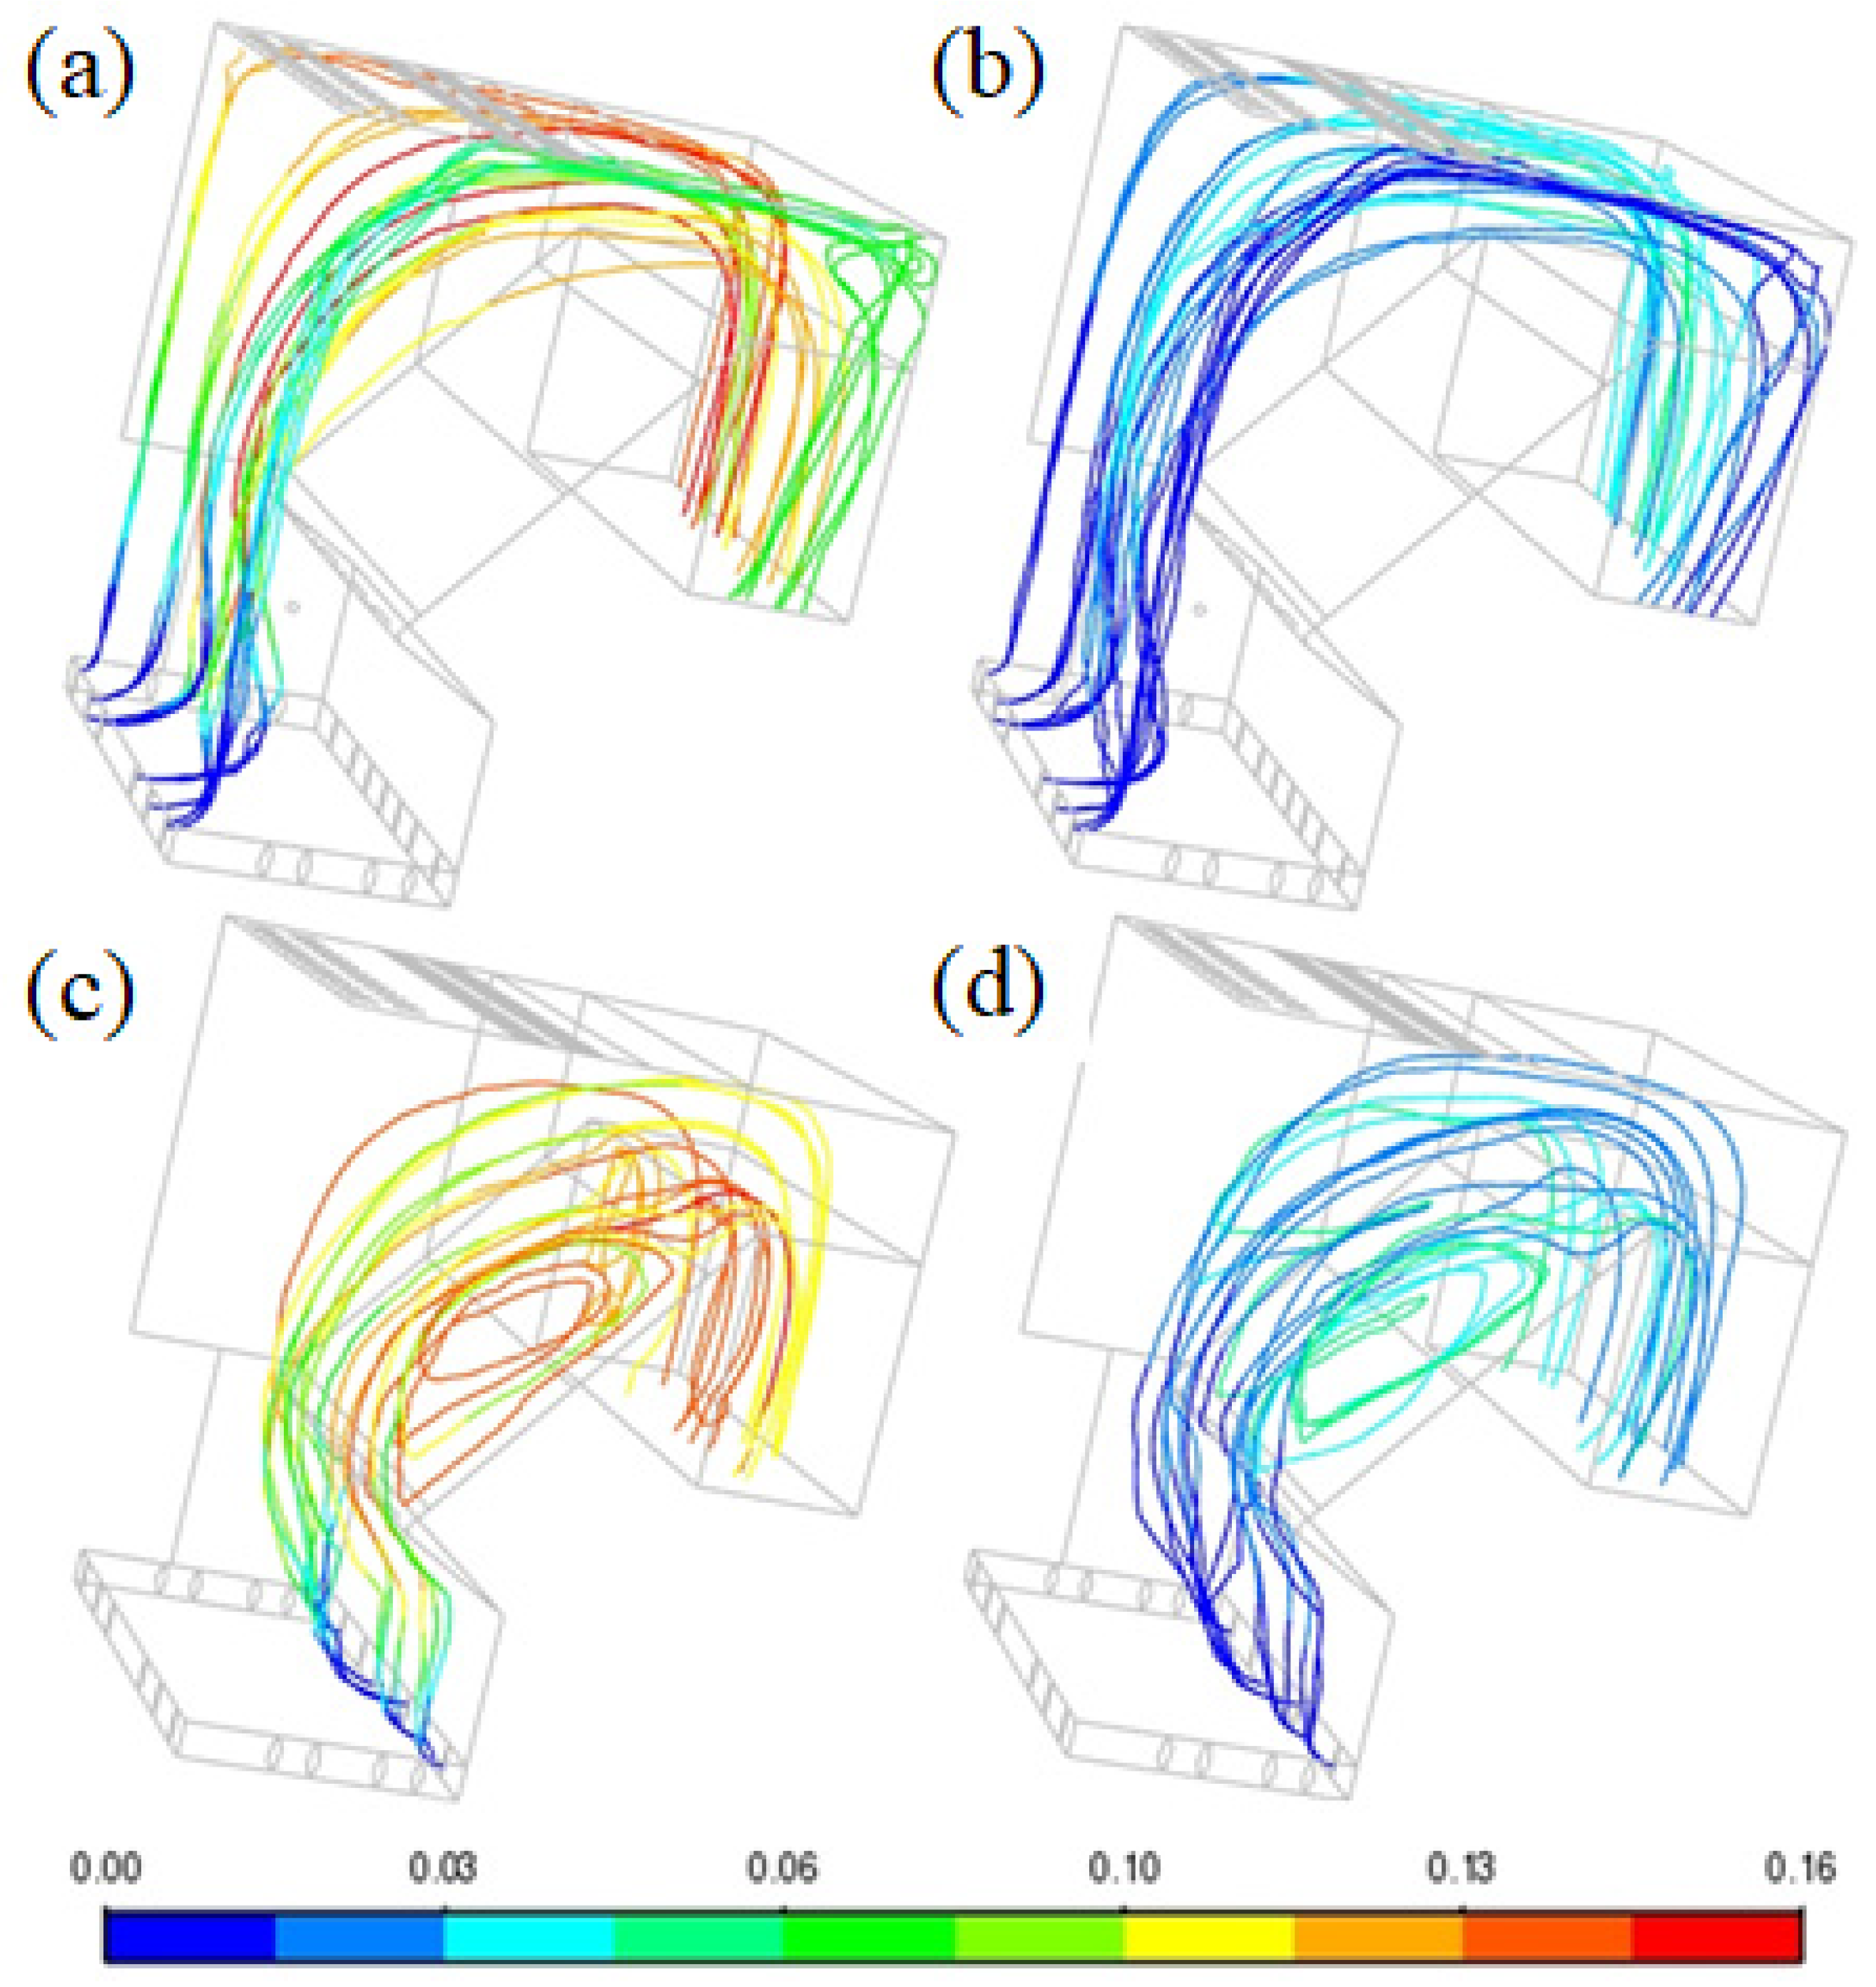
Additional views of the paths taken by the sorbent from the FV and the OFA ports in the model are shown in
Figure 11a,b and
Figure 11c,d, respectively. The colors of the sorbent path lines indicate the mass fraction of the sodium sorbent product formed. The 8 μm particles (
Figure 11a,c) ended with particles ranging from 6 to 16 wt.% product species as opposed to the 1 to 5 wt.% observed on the 32 μm particles (
Figure 11b,d). Larger particles had slower reaction rates as a result of the shrinking core and bulk diffusion resistances of the kinetic model.
The average uptake of sodium on particles by size and injection location using the model is presented in
Figure 12.
Smaller particles had greater average sodium loadings than the next largest size, regardless of injection location. Sorbent particles from the FV location had the highest loading of sodium as a result of being exposed to greater concentrations of sodium as some of the areas covered by the OFA and all of the area covered by the NSV becomes depleted of sodium.
Experimental alkali capture results were produced from the analysis of the samples collected from the ESP hoppers during the field demonstration during the baseline and the low and high SIR cases. The measured insoluble sodium contents of these samples using the ICP-OES were used to estimate an alkali capture rate by using the measured ash flow rates leaving the ESP. The measured flow rates of insoluble sodium during the injection cases were values which averaged about 250 kg/h. Of that total, about 50 kg/h was attributed to the sodium already present on the sorbent to yield a total alkali capture rate of about 200 kg/h.
The concentration of vaporized sodium present in the flue gas prior to any capture occurring was estimated using the sodium content of the incoming coal during the time of tests and an estimated vaporization rate of 60%. This was estimated by measuring the sodium concentration in the slag leaving the bottom of the boiler during baseline testing. The vaporized sodium flow rates averaged about 310 kg/h. The experimental alkali capture percentages given in
Table 7 were calculated by dividing the alkali capture mass rate by the vaporized sodium mass rate.
Results suggested that the kinetic parameters for the sorbent taken from the literature overpredicted the capture determined by ICP-OES analysis of samples collected from ESP hoppers. The model was rerun with adjusted sorbent kinetic parameters matching those for the coal fly ash (CFA). From this adjustment, the total capture for the low-injection case as predicted by the model decreased from 75% to 66%, which is closer to the experimental value of 62%. Capture performance comparisons of the model and experiments for the baseline, low-, and high-injection cases are given in
Table 7.
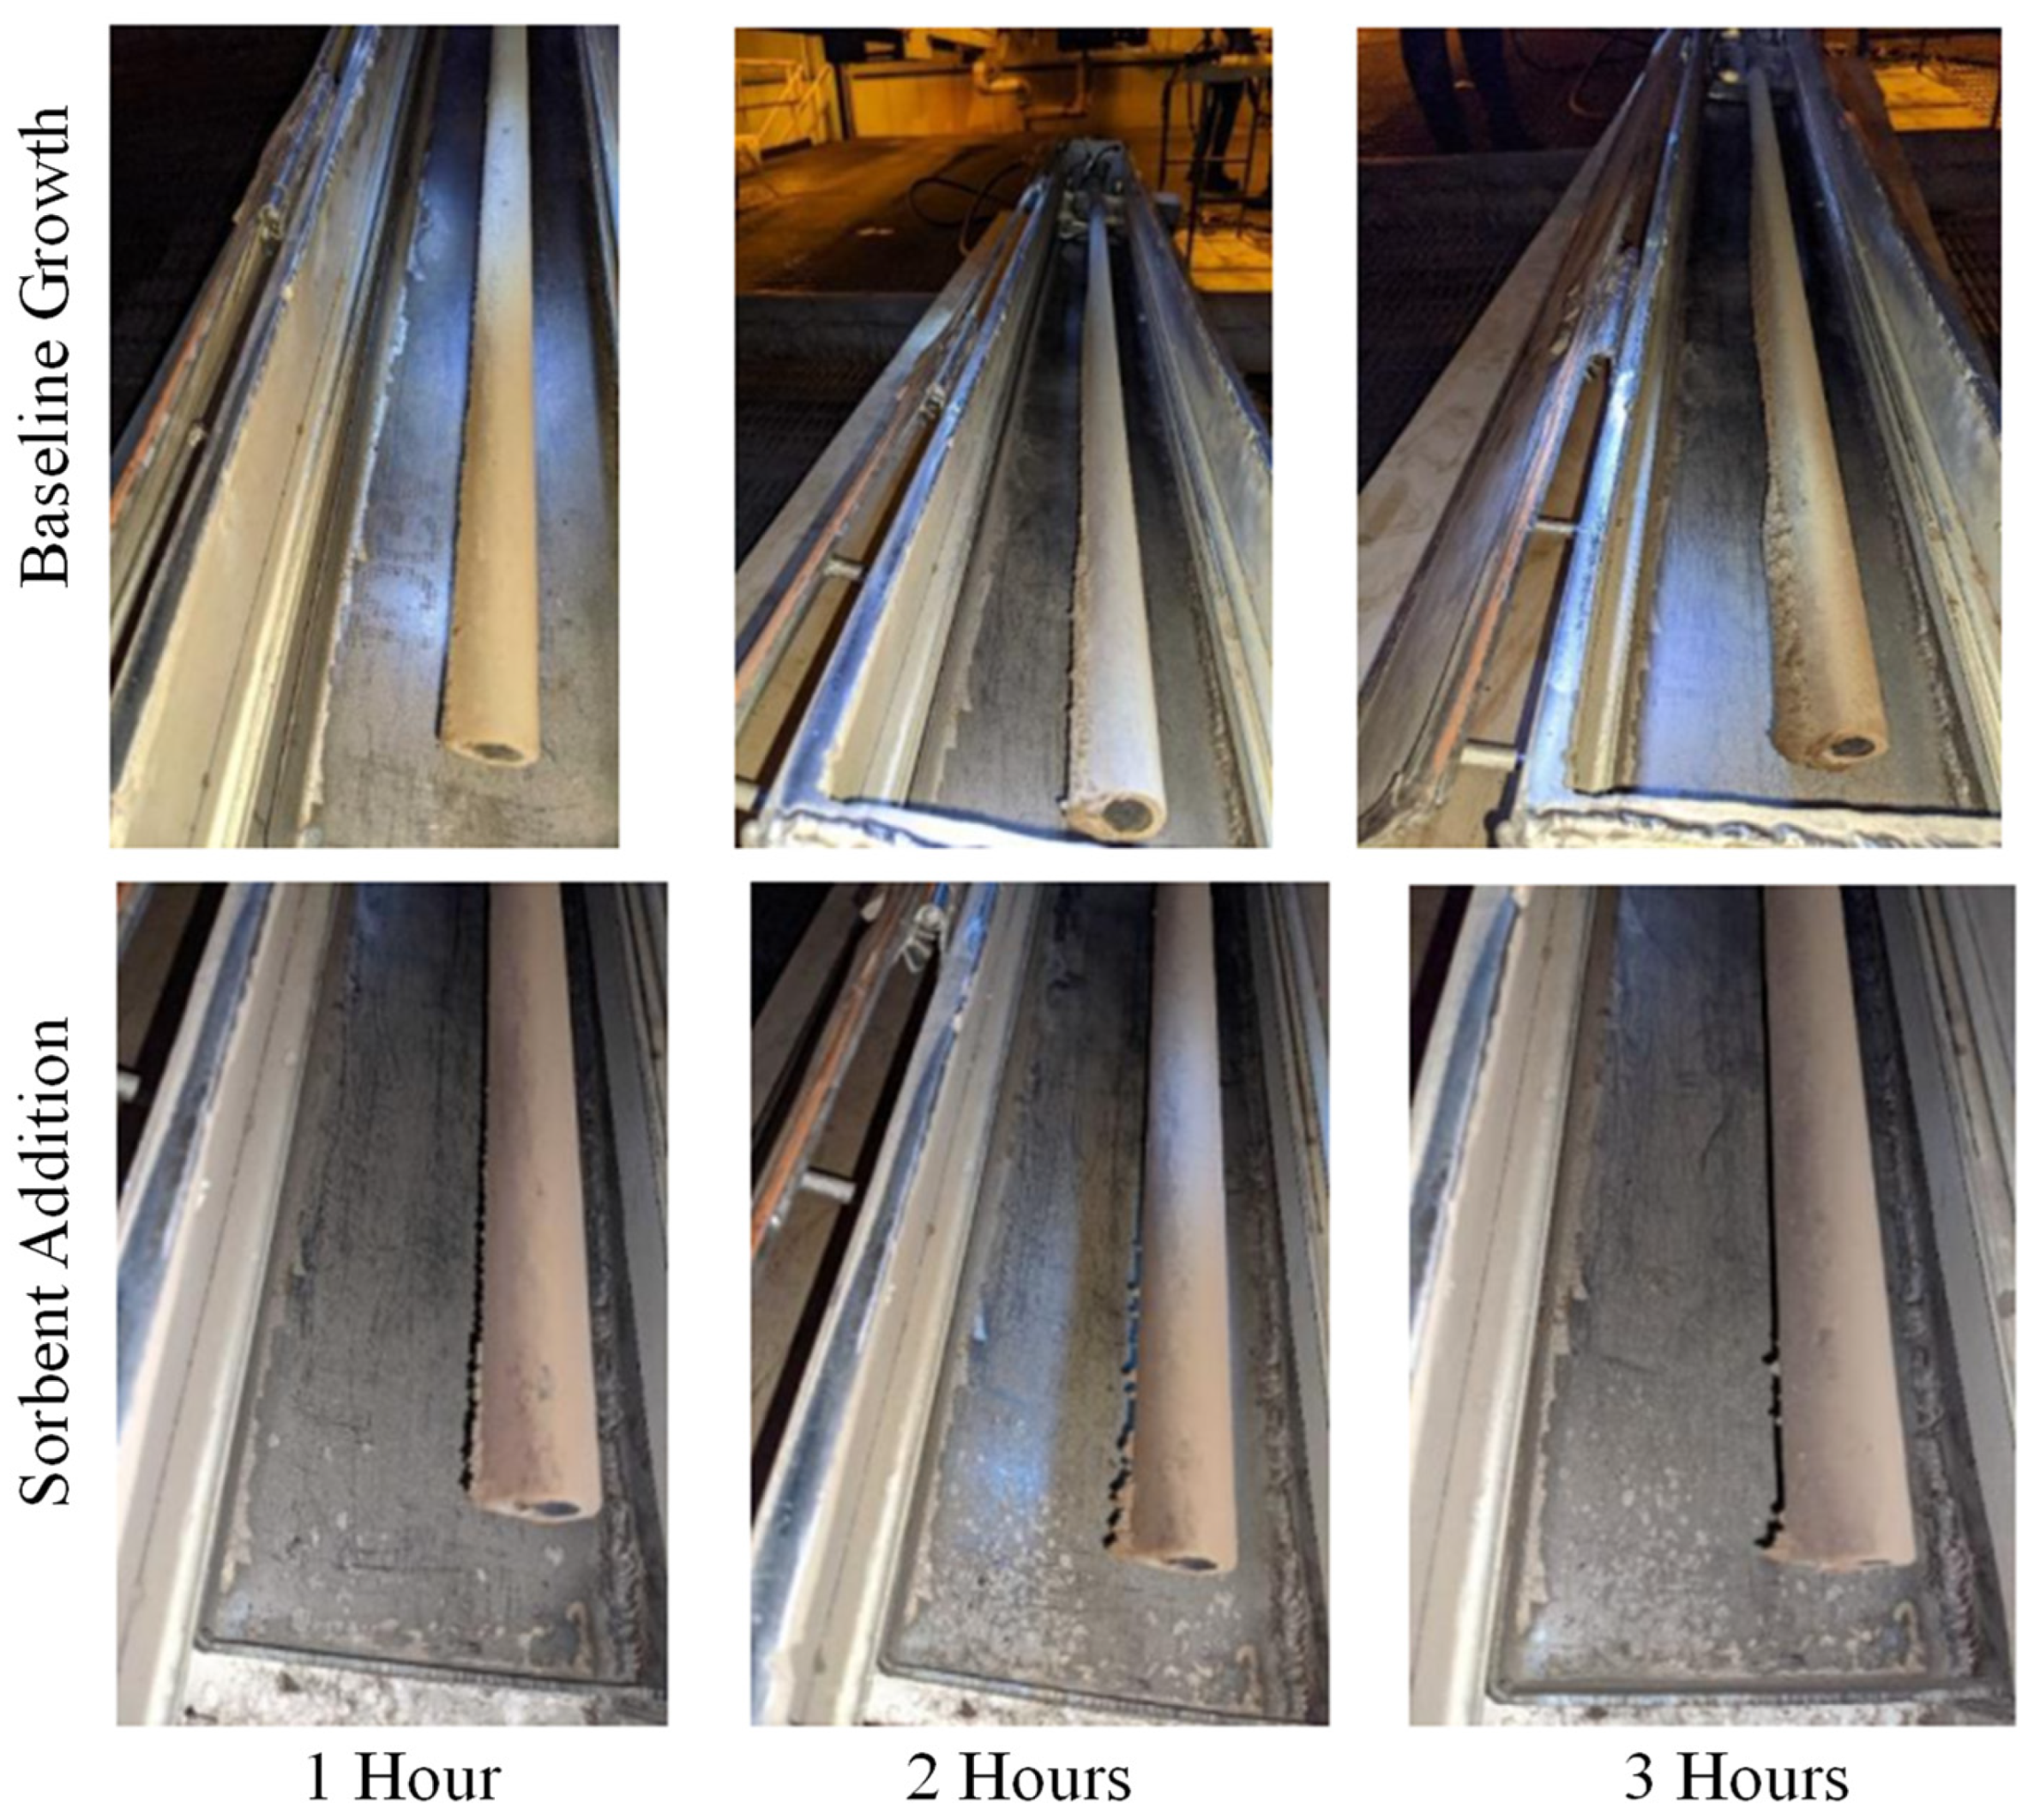
The deposition probe results performed during the field demonstration served as a visual indicator of the sorbent’s effectiveness in reducing heat exchanger fouling. Results from Probe 1 (which was in the cooler reheater zone), shown in
Figure 13, demonstrated clear evidence of reduced deposition during sorbent injection. Results from Probe 2 (located at the convective pass) were similar. It was also noted that the lesser amount of deposits on the probe during the sorbent injection tests were weaker and easier to remove from the probe compared to the baseline deposits. Such deposits forming on heat transfer surfaces would be more amenable to removal by soot blowers than those seen during the baseline test. SEM analysis of the recovered deposits determined that the deposits formed while sorbent was being injected had lower quantities of sodium sulfate, which acts as the glue for the formation of deposits, explaining why they were less strongly bonded.
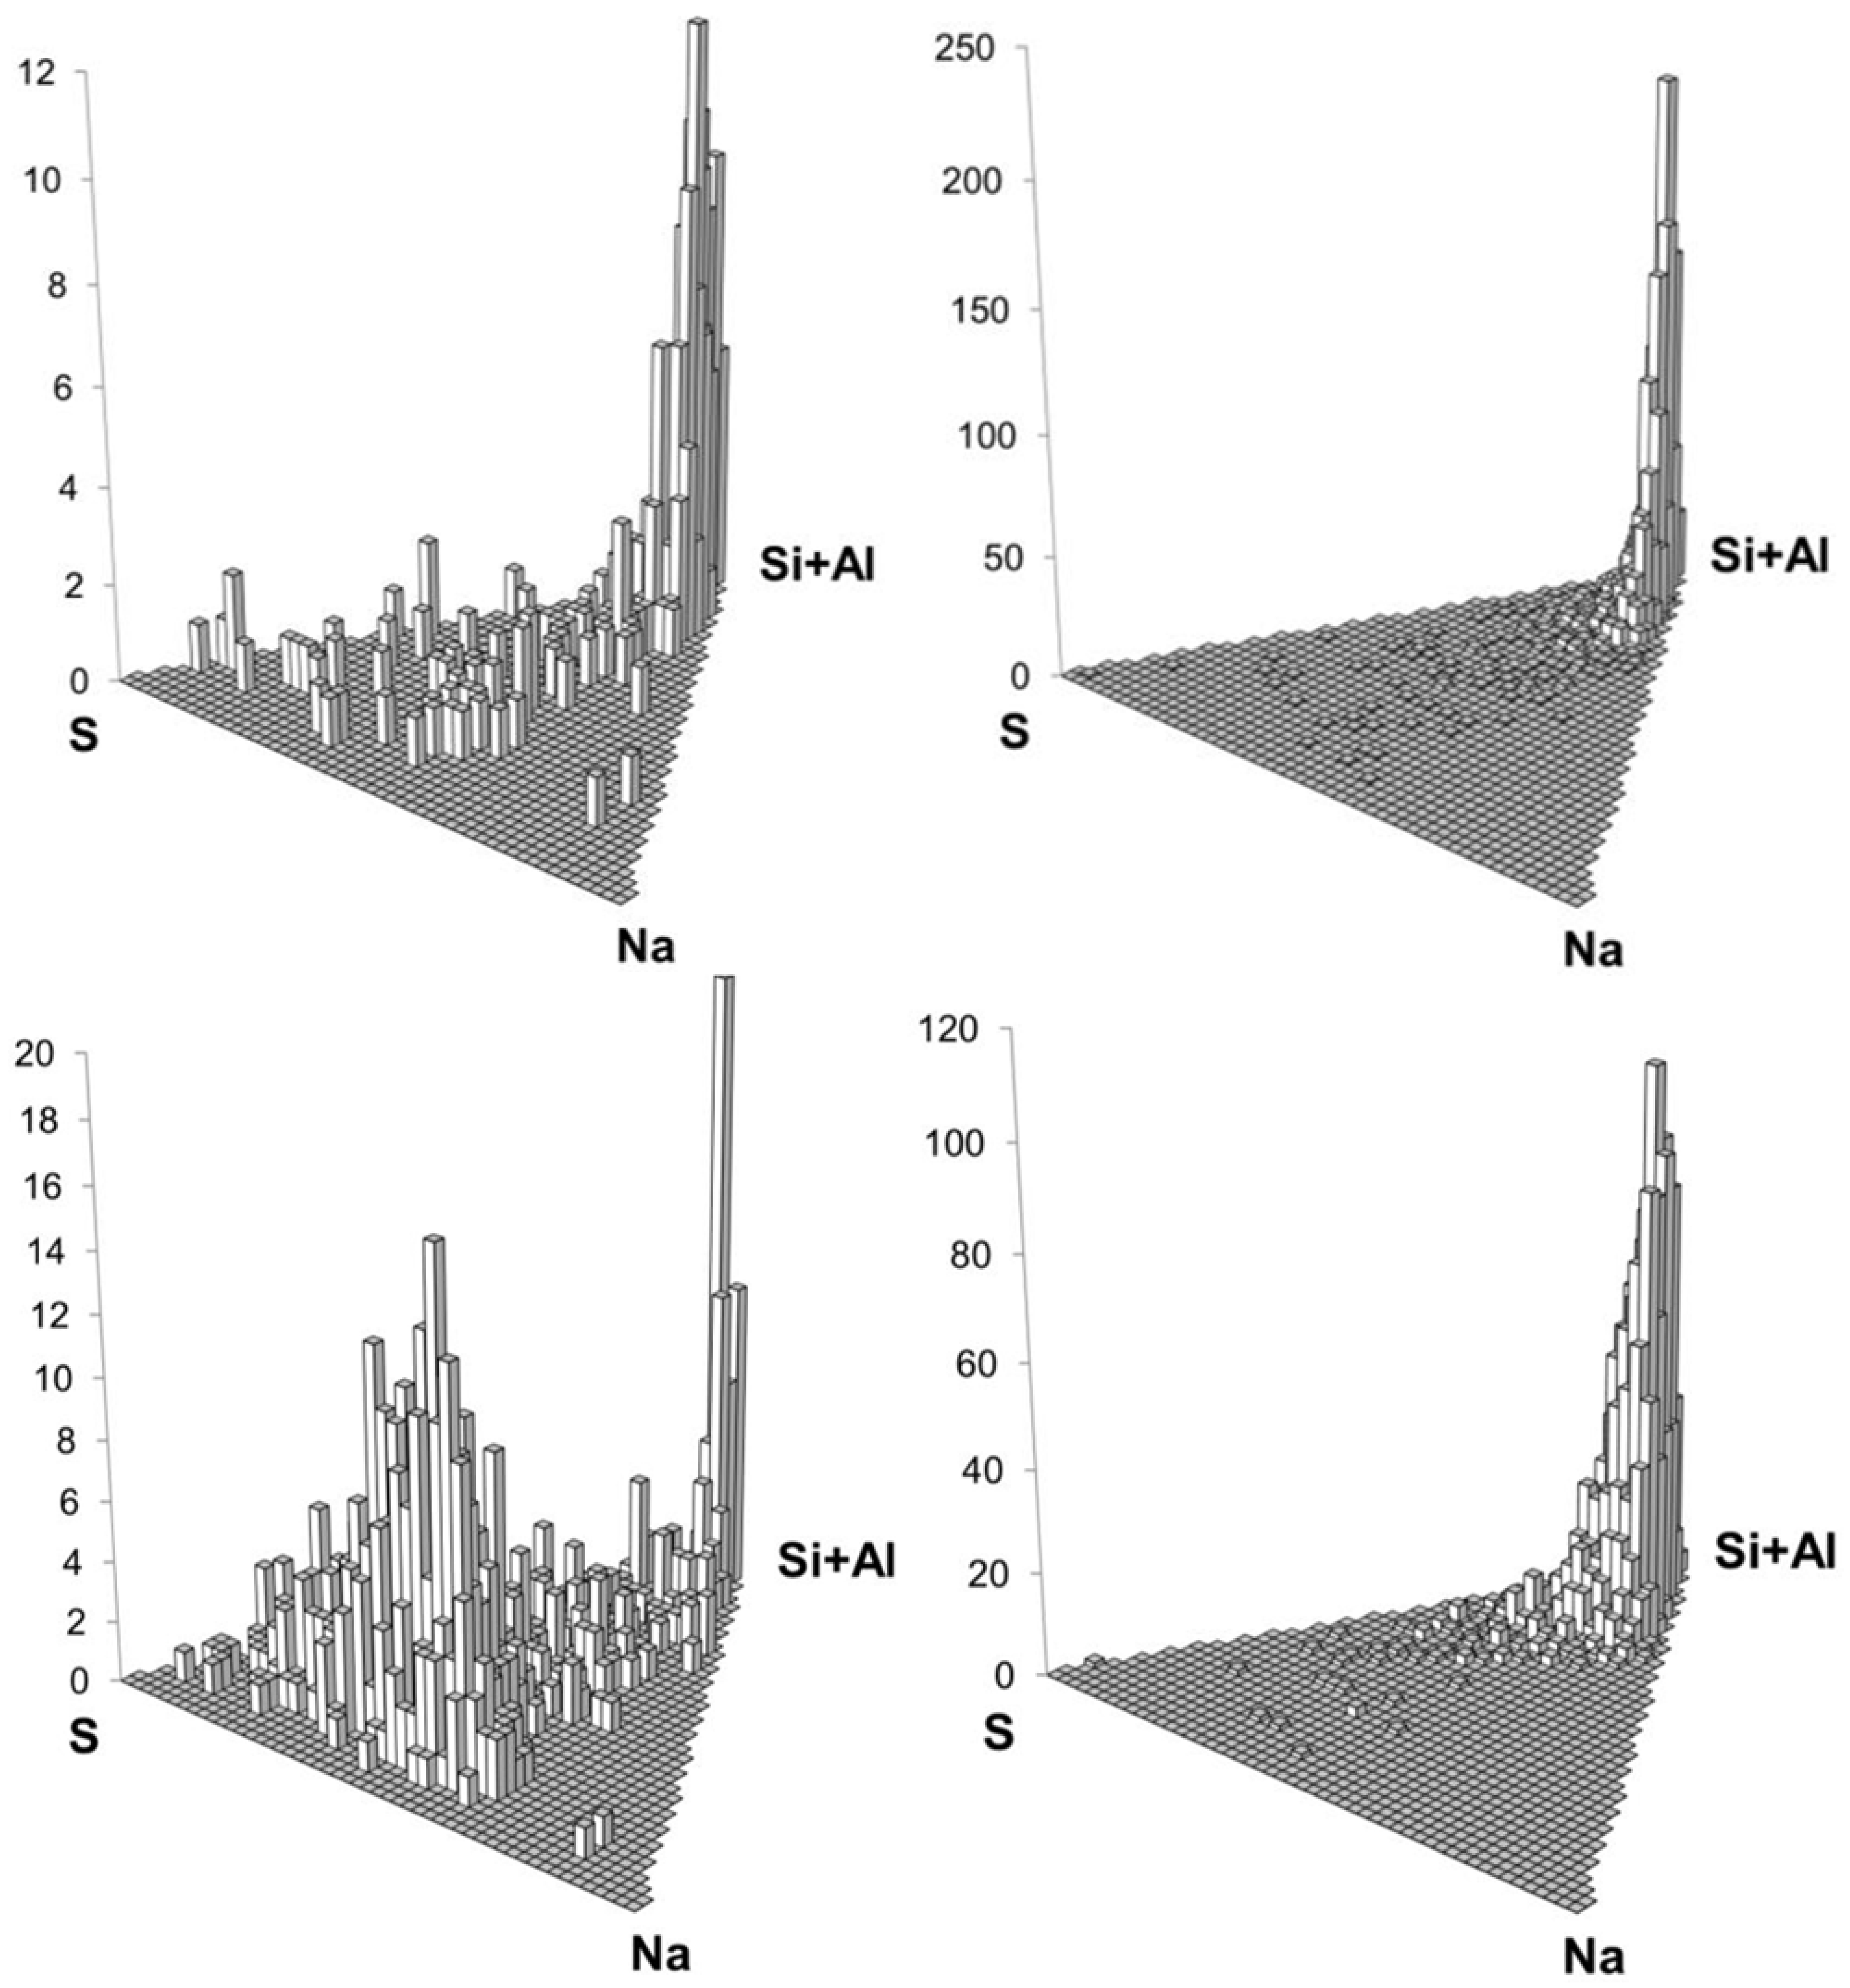
Additional details of the interaction between the alkali vapor and the sorbent were obtained by analyzing fly ash samples collected in a 4-stage multi-cyclone sampling setup at the ESP inlet. The collected particulates were analyzed for surface composition using CCSEM-EDAX and provided confirmatory evidence of sodium capture by the sorbent. Ternary diagrams showing the frequency of sulfur, sodium, and aluminosilicates present on the sampled particles are shown in
Figure 14. The larger than 10 μm particles for the baseline (no sorbent) case show a lower proportion of sodium and sulfur compared to the 2.5–10 μm size fraction, as these elements concentrate in the finer ash sizes. Comparison of the compositions of sampled particles during baseline testing and with sorbent injection shows a major decrease in sodium and sulfur species in the 2.5–10 μm fly ash with sorbent injection. From these data, it can be verified that the sorbent, and especially the finer-sized particles, reacted with the vaporized sodium before the sodium could react with sulfur at lower temperatures to form the undesirable sodium sulfate species.
3.4. Bench-Scale Test to Assess Aerosol PSD Changes
After completion of the field tests, additional bench-scale testing was conducted with a range of sorbents as part of tool development for selecting from locally available sorbent sources. These tests measured the changes to the aerosol PSD resulting from the sorbent injection and were conducted in an ash-free environment such that particles collected at the combustor outlet are known to be derived from only sorbent particles. Control tests performed without sorbent addition were conducted to evaluate the formation of submicron particulate as a result of the sulfation of alkali species. These control tests were also used as a baseline reference for submicron particulate formation. Six sorbents were tested, with varying Al to Si element ratios. The particle size distributions of the tested sorbents are given in
Table 8 along with their Al/Si composition ratios.
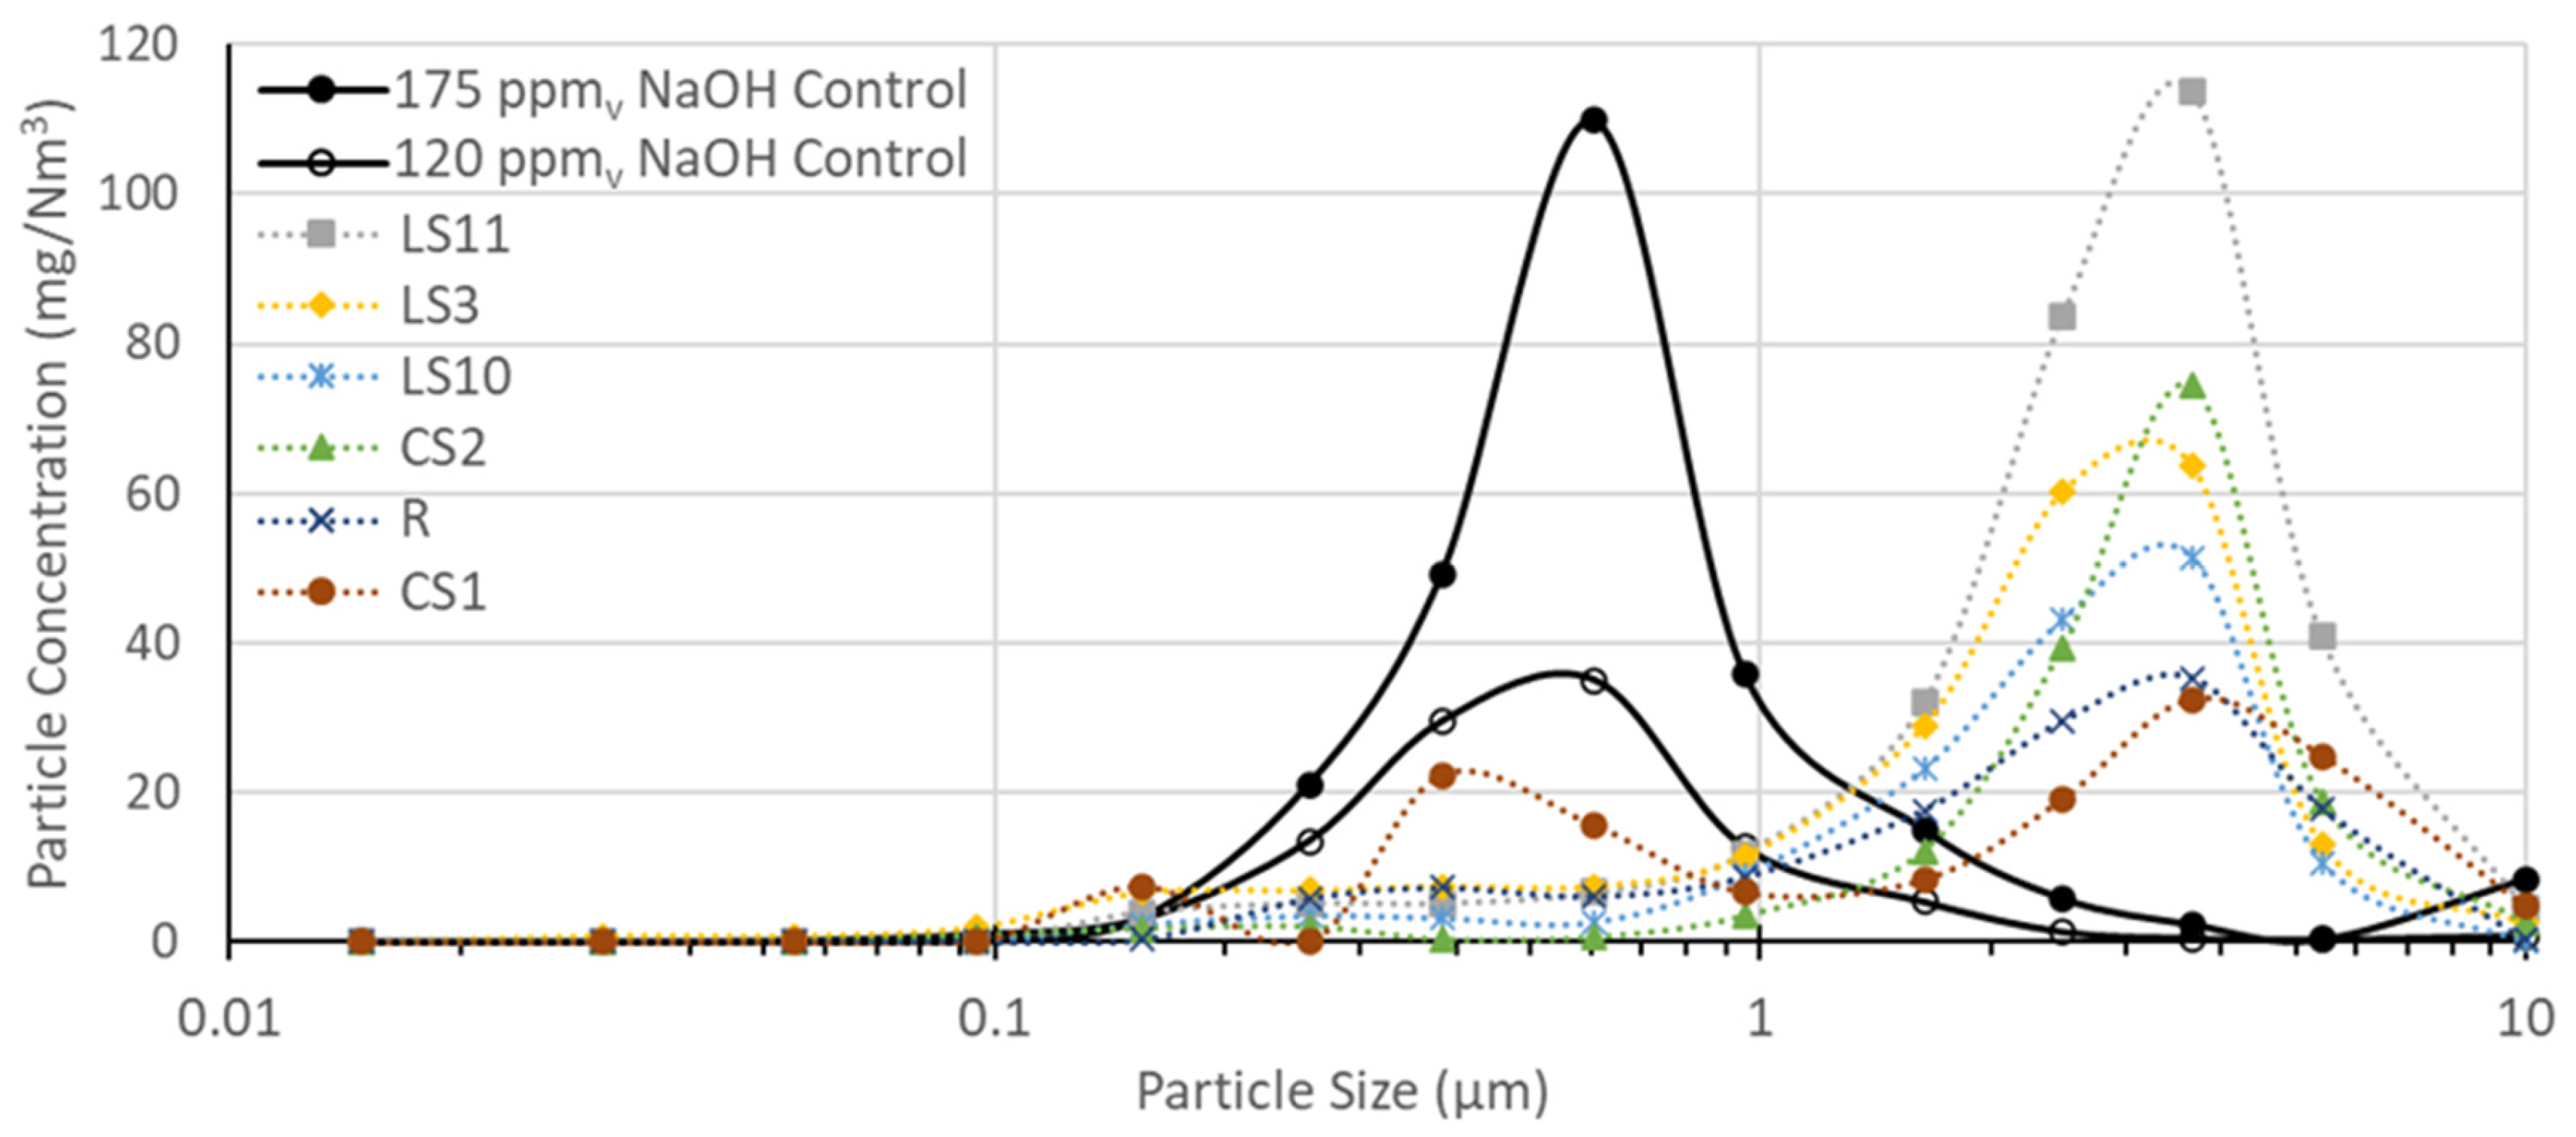
Particle concentration results collected from the DLPI+ sampling are shown in
Figure 15. Measurements at the combustor outlet made without sorbent addition showed the formation of primarily submicron particles. Further, a control test with a reduced amount of added sodium was also performed (legend 120 ppm, NaOH), which also yielded mostly submicron particles but at lower concentrations. Therefore, there was strong evidence of sodium-induced submicron particulate within the combustor test setup and a clear performance indicator to compare against the tests in which sorbent addition is performed.
The combustor tests with sorbent injection resulted in the drastic reduction in submicron particle concentrations for each of the sorbent types tested. Submicron particulate concentration was near zero (
Figure 15).
Table 8 also provides the sodium analysis of the sorbents as measured by the ICP-OES and CCSEM methods. The total pickup of sodium by the R sorbent during the combustor testing was 6% (from ICP-OES) and 10.7% (from CCSEM). The CCSEM method is expected to measure a higher sodium gain, as it only considers the composition on the particle’s surface where the sodium is enriched, as opposed to the ICP-OES method, which considers the entire particle mass. For the other sorbents, the two measurement methods gave similar or only slightly higher values using the CCSEM method, suggesting more uniform distribution of the captured sodium across the particle interior in those cases.
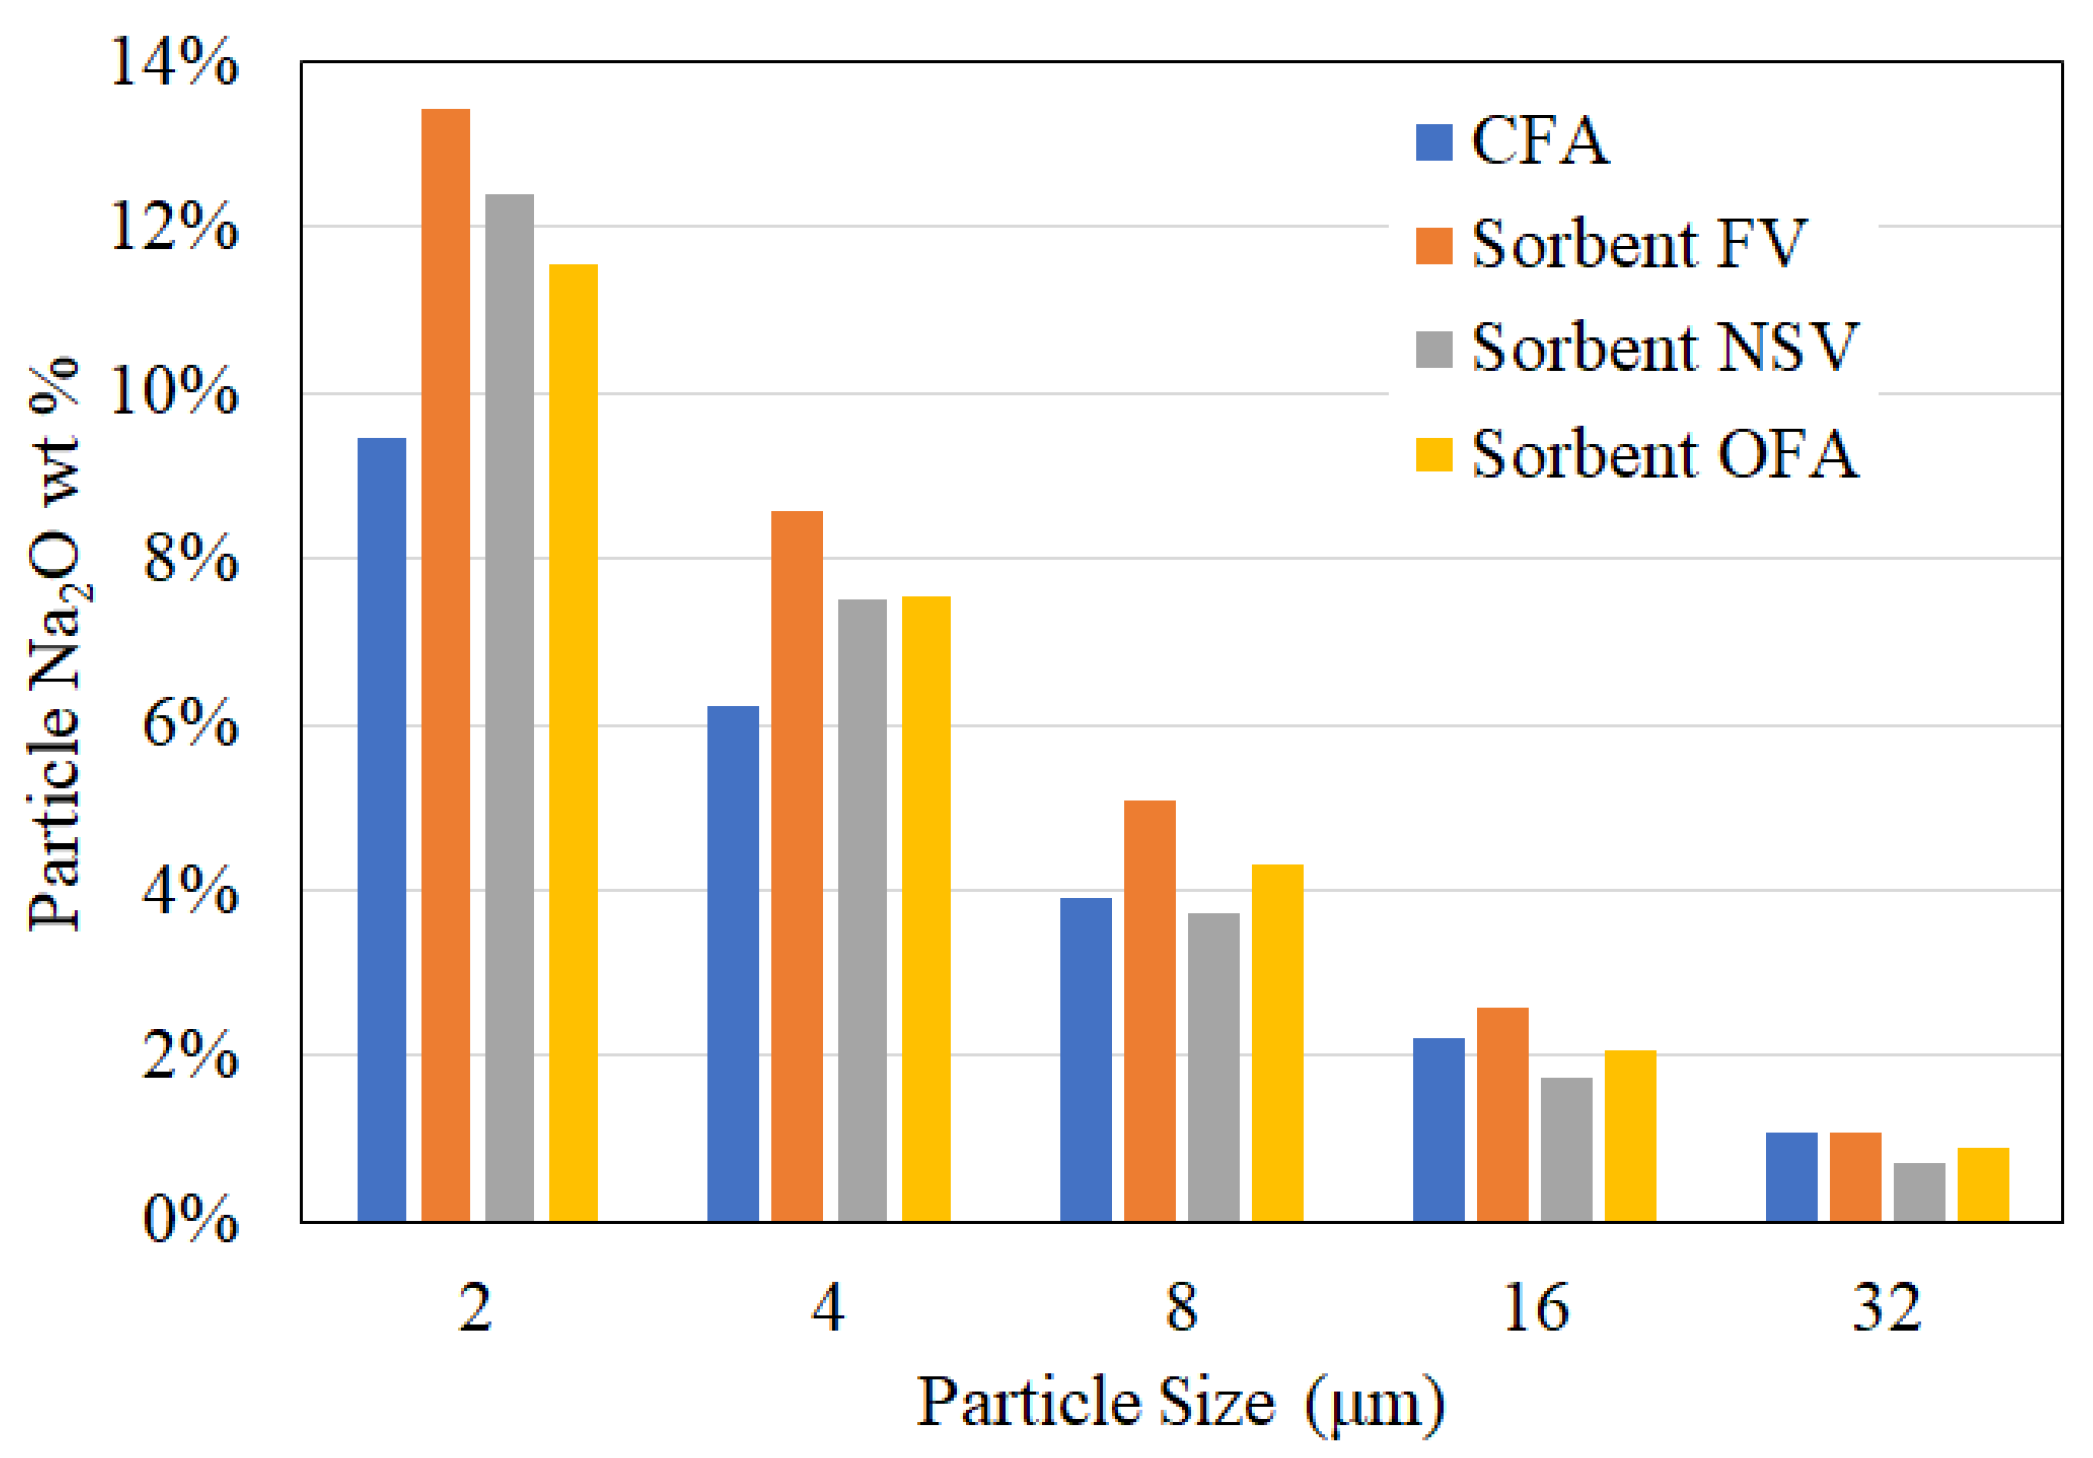
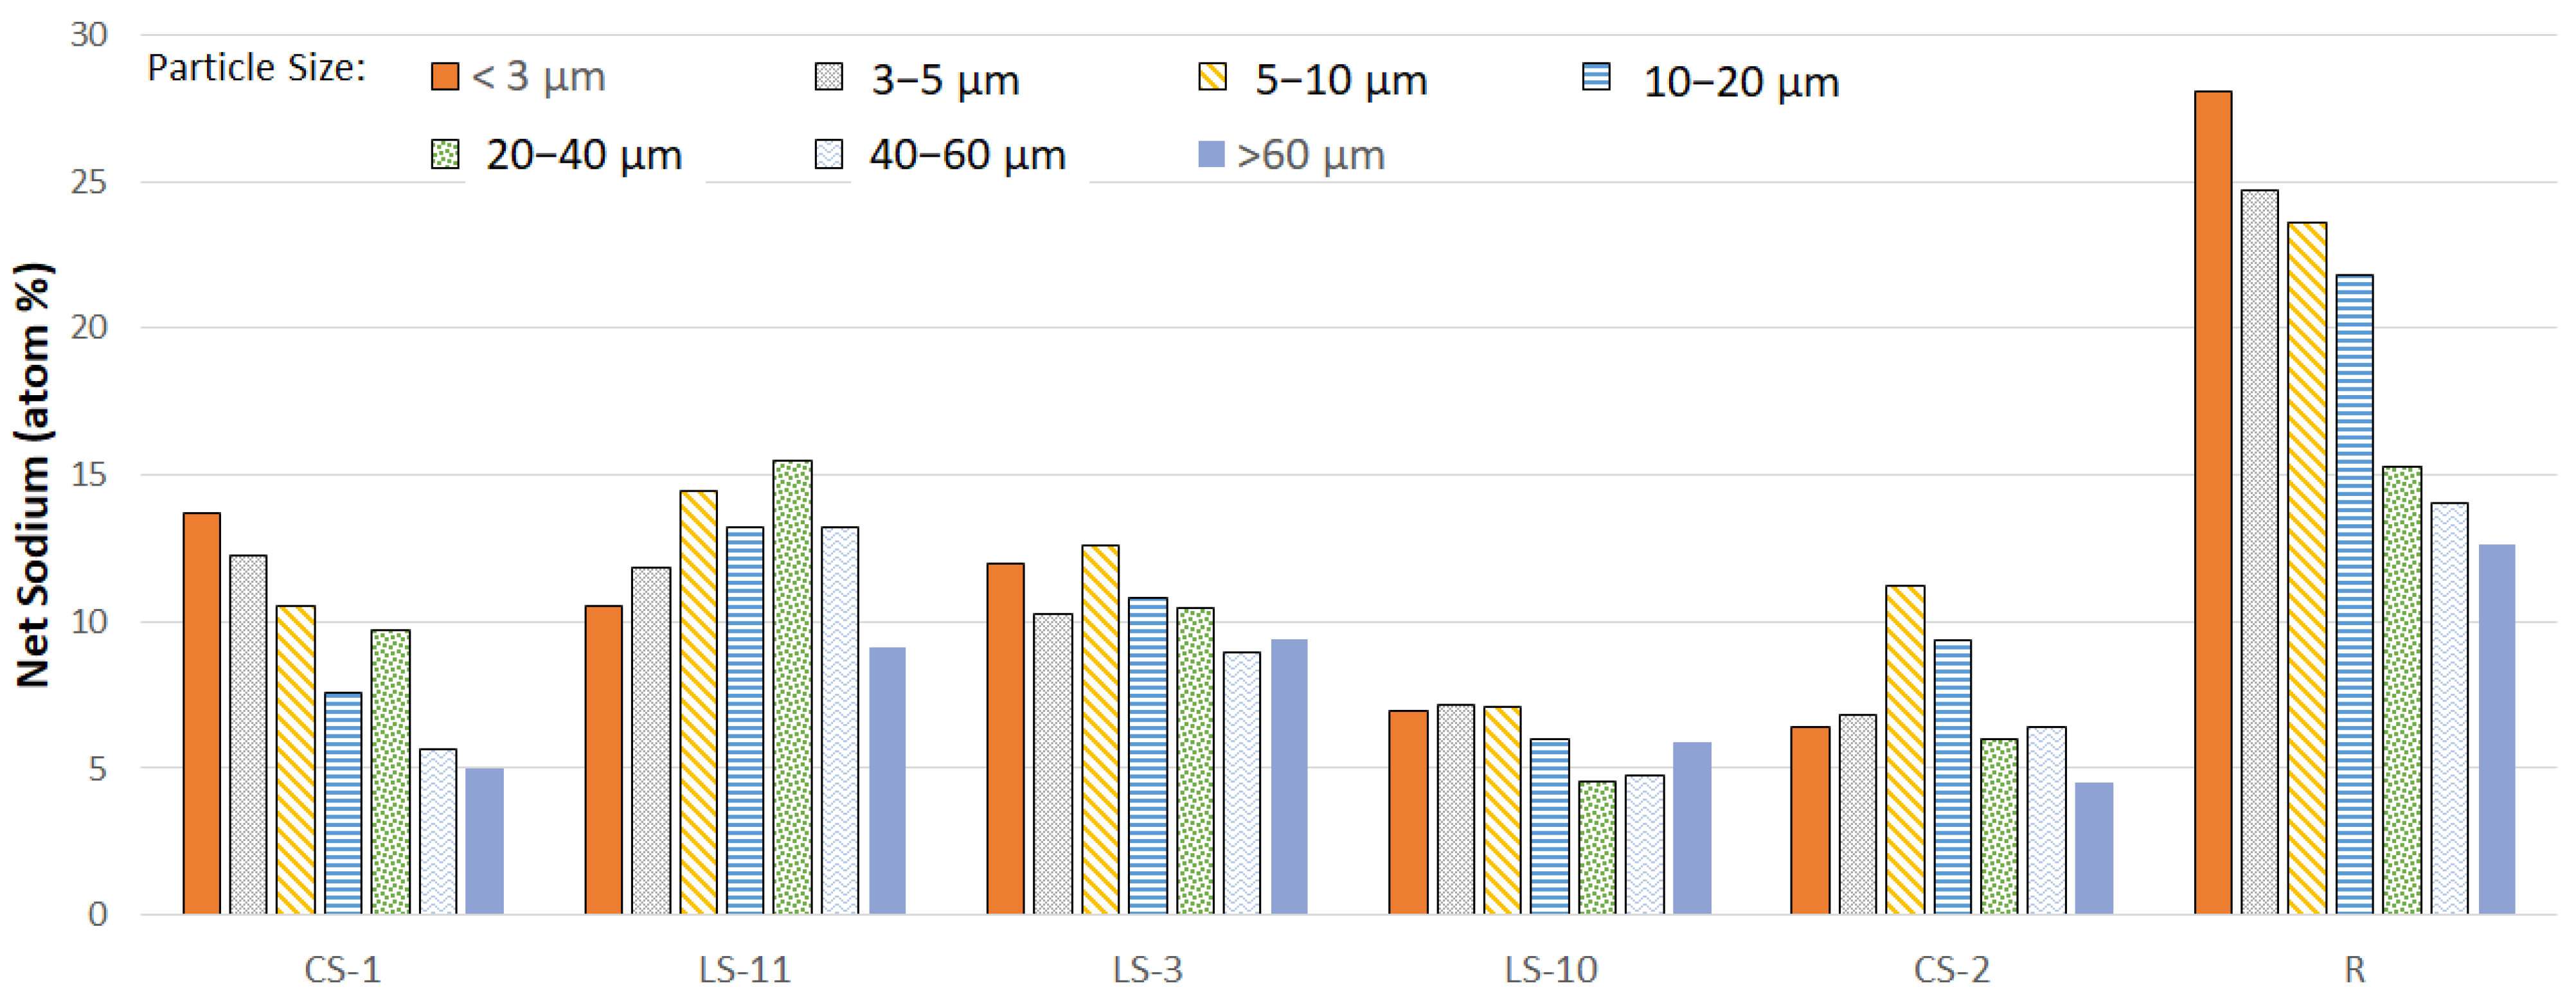
An examination of the sorbent particles’ sodium concentration as a function of size, obtained using CCSEM-EDAX, is discussed next. The atomic percentage of the net sodium after capture is shown in
Figure 16 for each of the six sorbents, where the net sodium is calculated by difference between the measured sodium content after and before traveling through the combustor. Cases with particle size dependence indicate that the kinetic rate of the sorbents is fast and the capture is diffusion-limited. Sorbents exhibiting this behavior would benefit from size reduction prior to injection into a furnace.
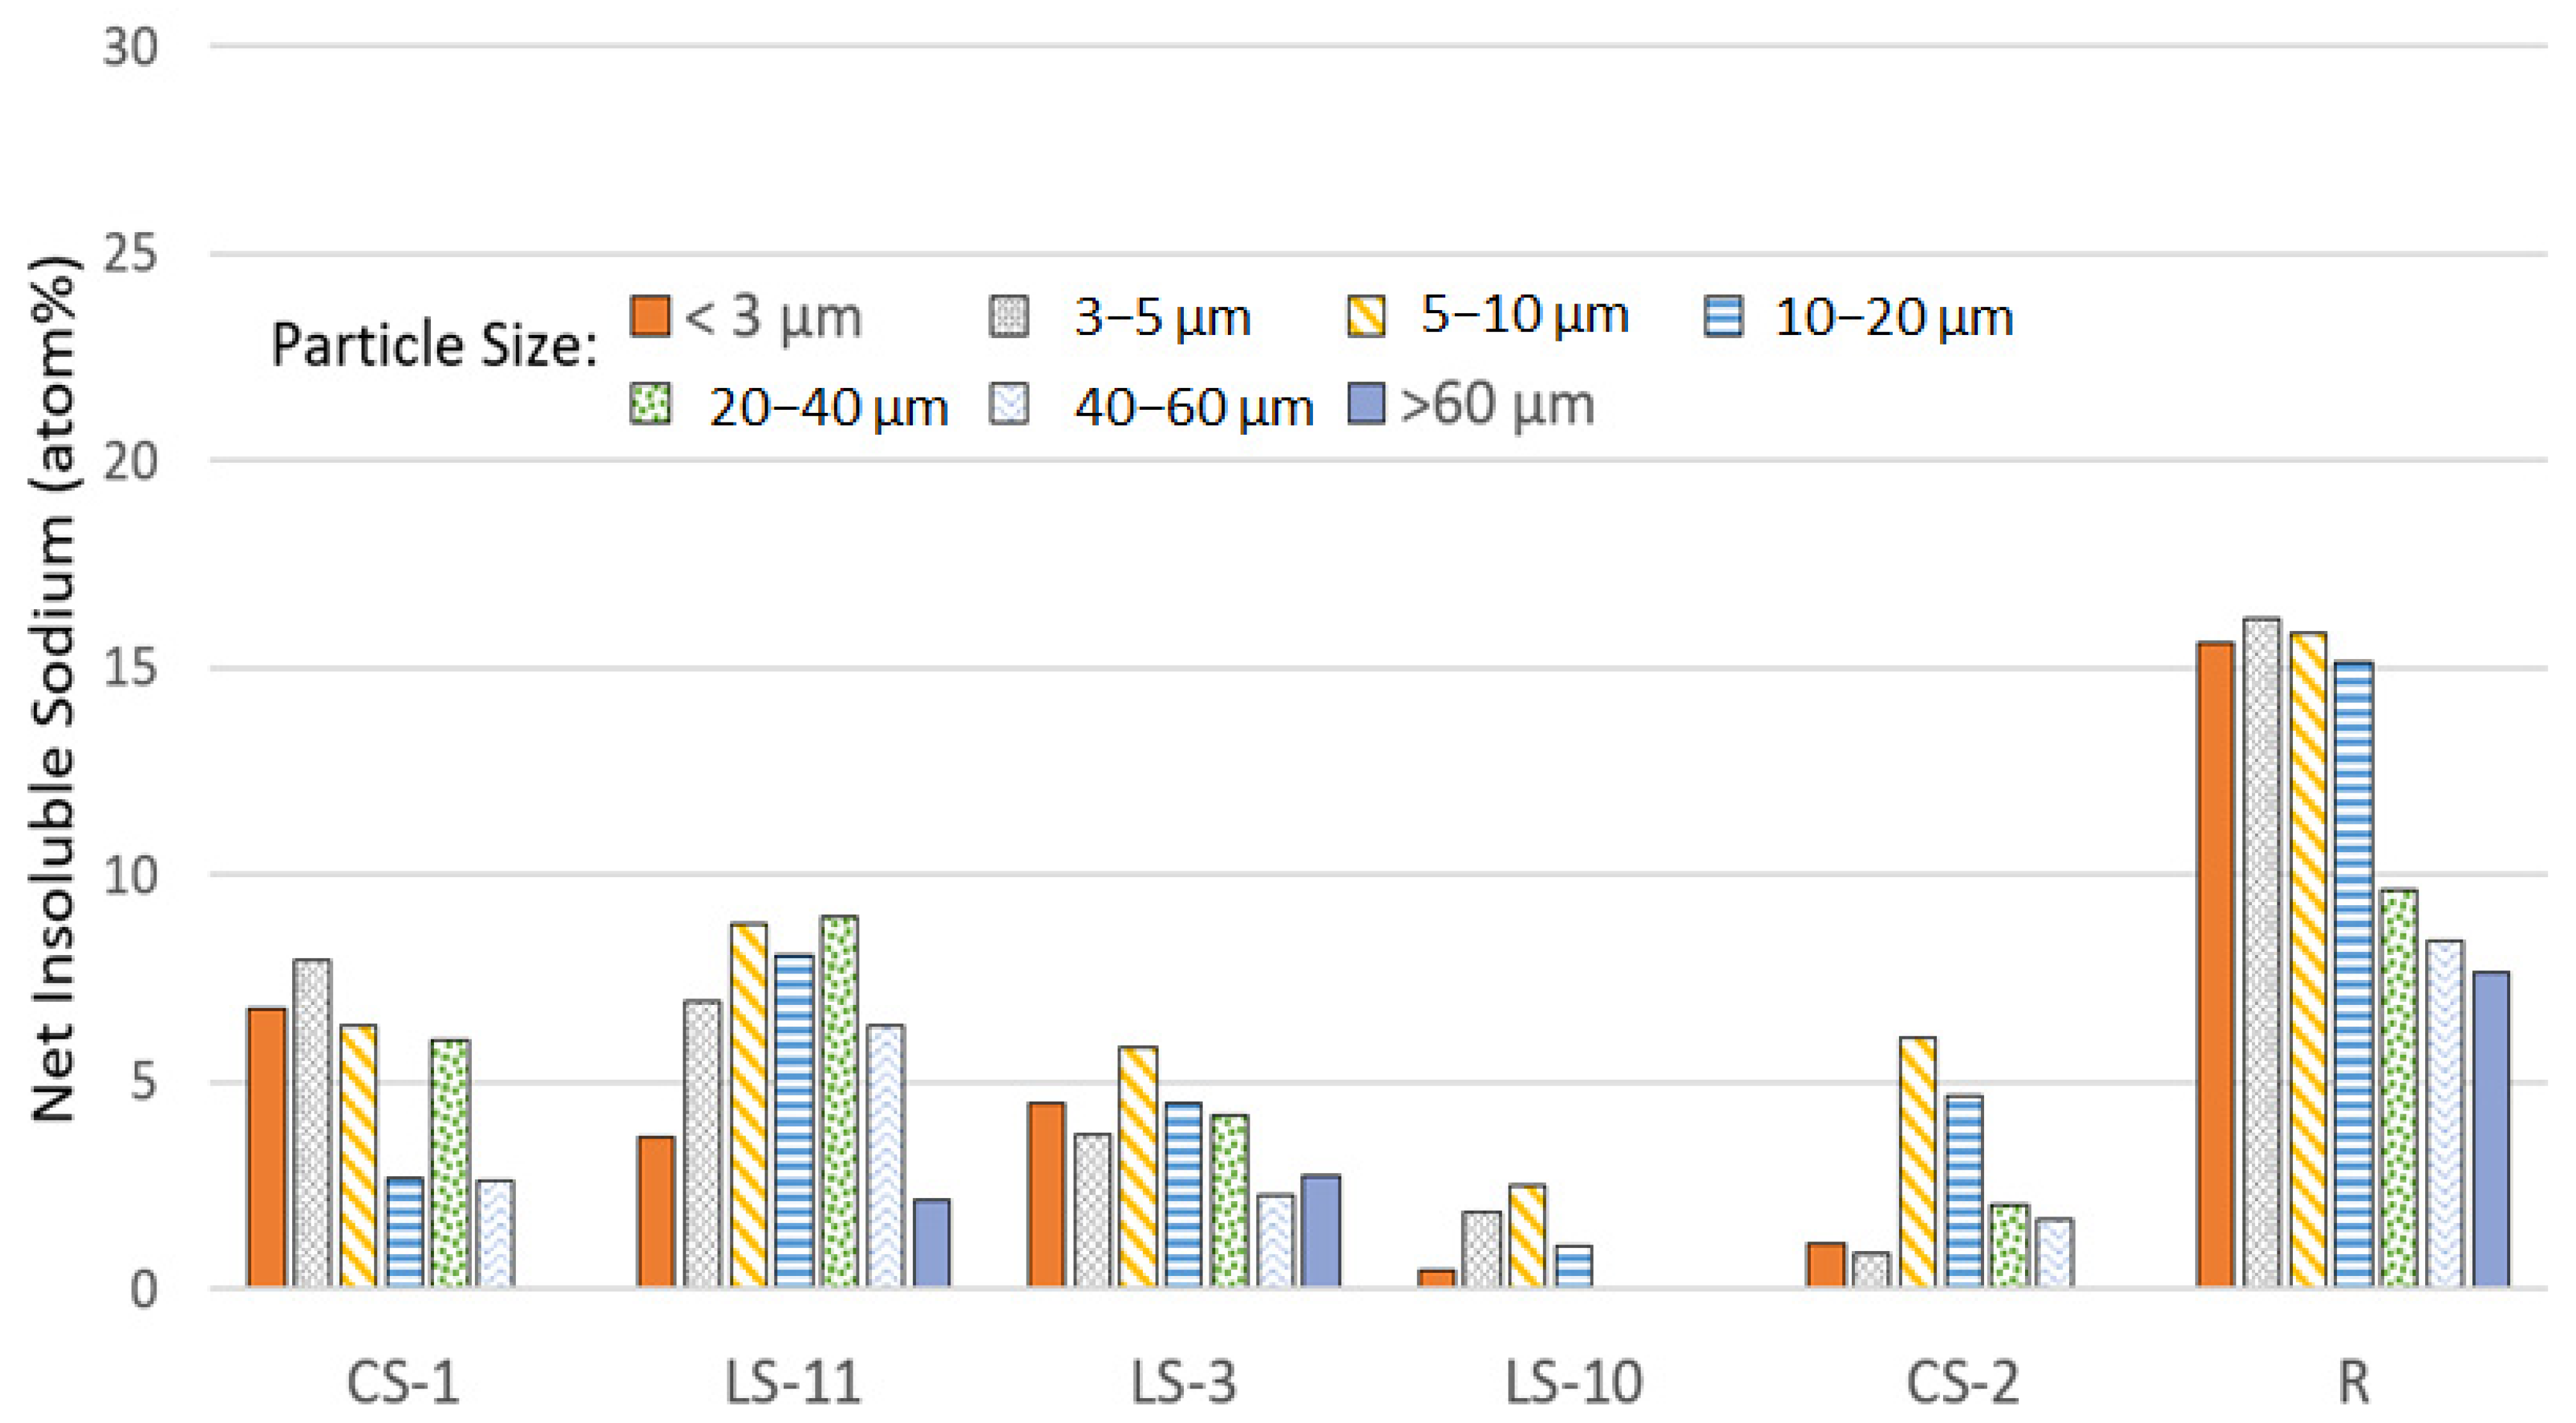
Figure 17 shows the atomic percentage of net insoluble sodium after capture for each of the six sorbents. These values were determined by assuming all sulfur gained on the sorbent particle is a result of sodium sulfate formation. As such, the net insoluble sodium values were calculated by subtracting two sodium atoms for every sulfur atom measured on the sorbent by CCSEM.
As seen in
Figure 17, the R sorbent had the greatest content of insoluble sodium (captured sodium) and thus had the best sodium capture performance of all the tested sorbents. This result may be explained by its greater Al/Si ratio compared to the other sorbents. The fraction of the total sodium present on the sorbent that was insoluble sodium was also the greatest for the R sorbent. The insoluble sodium fraction of the R sorbent was 67%, whereas the insoluble sodium fractions of the other sorbents were in the range of 11–52%.
Comparison of the captured sodium by size may indicate that sorbent R and CS2 had the fastest capture reaction kinetic rate, given that particles of the size greater than about 20 microns showed signs of mass transfer limitations compared to the other sorbents, where mass transfer limitations were only observed for particles greater than about 40 microns. These results indicate that size reduction in the R and CS2 sorbents may be beneficial down to about 20 microns, whereas for the others, reducing the particle size smaller than about 40 microns may not be worth the added grinding effort.
The results of the combustor testing demonstrate a method that may be used to effectively screen potential sorbents for use in commercial systems. The method provides an estimate of the sorbent injection rate required such that the effective cost of each sorbent may be compared. Capture performance by size also provides insight into the benefit of size reduction for a particular sorbent. This allows for a cost–benefit analysis to be performed to determine the optimal particle size of sorbent to inject into the system.
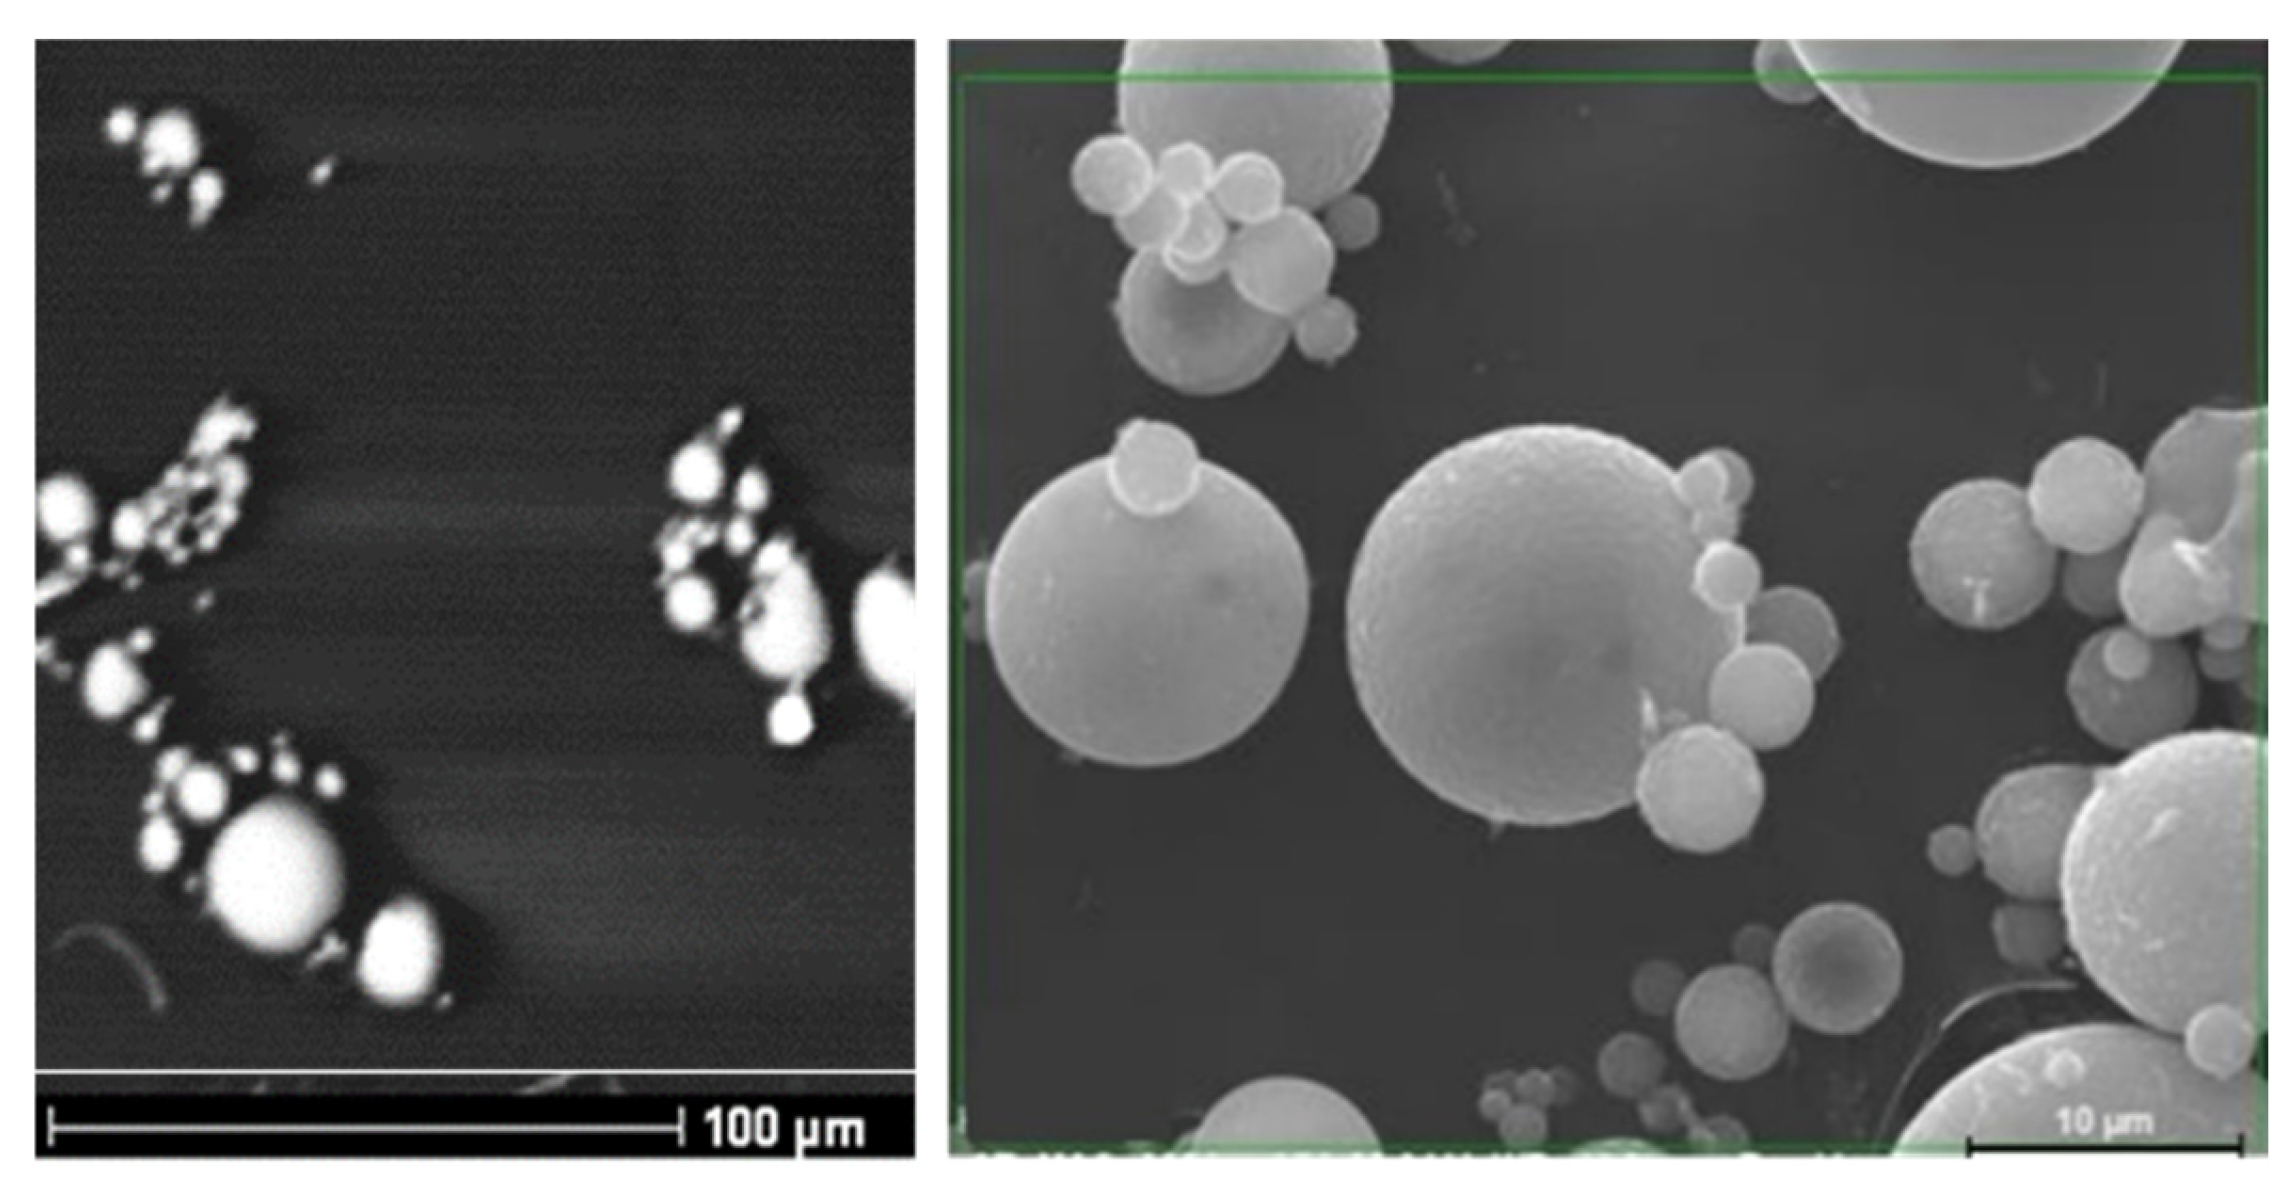
The morphology of the sorbent collected at the outlet of the bench-scale combustor was also examined by scanning electron microscopy. All of the samples collected revealed smooth spherical particles (
Figure 18), which indicates that the sorbent particles had been in a molten state within the combustor. Although the temperature in the combustor was controlled to 1150 °C, the sorbent did pass through the combustor flame, which was originally thought to be brief enough to avoid excessive heating and deactivation of the sorbent. The SEM images show otherwise, and that the sorbent particles did in fact reach melting temperatures. This is a different scenario than what occurred during the field tests, as the sorbents in those tests were injected downstream of the high-temperature combustion flame zone and therefore avoided melting point temperatures. Despite the melting that occurred in the bench-scale tests, all of the sorbents were still effective in capturing sodium and mitigating the formation of submicron particulate.
This unexpected result is contrary to the initial hypothesis that the sorbent would become ineffective due to sintering if it experienced temperatures beyond about 1300 °C. It is not certain to what degree alkali capture was complete while the sorbent was still in a molten state, or if any substantial capture occurred after the sorbent particle had solidified. It is also not known if sorbent that is exposed to melting temperature is as effective in alkali capture compared to sorbent that remains in a solid state. Further investigation is required to address this question.
3.5. Exploring Alternate Injection Strategies
The evidence provided during the bench-scale tests that the sorbents remained effective at high temperatures provides an alternative injection method for commercial application. Sorbent addition to the boiler by mixing it with the fuel, rather than further downstream, is a potentially viable strategy. By injecting with the fuel, the sorbent will be thoroughly mixed within the combustion gases and have the longest residence time possible. These benefits could lead to ease of implementation, more effective use of the sorbent, lowered flow rate requirements, and reduced costs.
A potential problem with injection of the sorbent with the coal in a cyclone-fired boiler is the loss of sorbent to the slag flow rather than remaining entrained in the combustion gases. Sorbent injection via the primary air inlet to the cyclone is likely to be the preferred strategy to avoid particle loss to the slag. An estimation of sorbent loss to the slag was performed in the CFD model. Particle tracks of sorbent particles ranging from 1 to 64 microns entering the combustion cyclone via the primary air and secondary air inlets were created. The particle tracks that made contact with the walls based on their trajectory were assumed to be trapped by the slag and removed from the CFD model. The fraction of sorbent particles that were trapped by the slag was then calculated.
The fractions of each particle size group that made contact with the walls are given in
Table 9. More particles avoided contact with the cyclone walls if they entered through the primary air rather than the secondary air. Also, finer particles were more likely to avoid wall contact. However, a significant amount of all the particles injected contacted the cyclone walls regardless of their size or injection location. While it is possible that some of these contacts would not result in capture by the slag, a reasonable assumption would be that a major portion would be captured and not participate in the alkali reactions. This would mean that more sorbent may need to be added with this option compared to the downstream injection option. A mitigating factor is more efficient sorbent use due to better mixing and longer reaction times made available with this approach.
4. Conclusions
This study provides a comprehensive evaluation of furnace sorbent injection as a strategy to mitigate alkali emissions in full-scale boilers. Using historical plant data, a validated CFD model predicted a suitable and detailed representation of the gas flow and temperature profiles within the boiler to recommend optimal sorbent injection locations for maximum sorbent coverage and exposure to the right temperature range. Initial bench-scale testing identified a preferred and commercially available sorbent candidate as well as targeted injection rates for field demonstration testing.
During multi-day field demonstrations, sorbent injection successfully reduced condensed sodium (reporting as sodium sulfate in the ash) from about 40 percent for baseline (no sorbent injection) to about 60–70 percent with sorbent injection. Visual inspections of heat transfer probes placed within the boiler confirmed that the resulting ash deposits were reduced and significantly easier to remove (by soot-blowing), demonstrating that reducing submicron alkali-rich particulate is the key to mitigating boiler fouling. To support these findings, a diffusion-kinetic model for the alkali vapor species (NaOH) reaction with the sorbent was formulated, integrated into the CFD simulations, and calibrated to match the field data. While sodium penetration into the sorbent particles was not directly measured, indirect experimental evidence in conjunction with the acceptable agreement between simulation and field data appears to suggest that the sodium capture may be diffusion-limited.
Finally, additional bench-scale testing (post field-demonstration) was carried out with a range of locally sourced and commercial sorbents, in order to develop a tool for sorbent selection. These tests demonstrated a near-complete reduction in submicron Na2SO4 particles with sorbent injection, confirming the capture of vaporized alkali and a definite shift in the aerosol PSD to a coarser, less problematic range. Surprisingly, in these tests, the sorbents were transformed into a molten state but were still effective in promoting capture. This opens up the option of alternate sorbent injection locations such as co-firing the sorbent with the fuel, which would avoid the need for equipment to entrain and distribute the sorbent across multiple locations, as well as minimize delivery piping.




 ,
,