Article

One-Dimensional Consolidation Characteristics and Mechanisms of Soft Soil Under Surcharge Preloading

1
Zhejiang Engineering Research Center of Green Mine Technology and Intelligent Equipment, Hangzhou 310014, China
2
College of Civil Engineering, Zhejiang University of Technology, Hangzhou 310014, China
3
Power China Hua Dong Engineering Corporation Limited, Hangzhou 310014, China
*
Author to whom correspondence should be addressed.
Appl. Sci. 2026, 16(13), 6815; https://doi.org/10.3390/app16136815
Submission received: 9 June 2026 / Revised: 5 July 2026 / Accepted: 6 July 2026 / Published: 7 July 2026
(This article belongs to the Section Civil Engineering)

Abstract

This study investigates staged surcharge preloading at a coastal test section by integrating field monitoring (pore-water pressure, settlement/settlement rate, and layer-by-layer deformation) with laboratory consolidation tests and field vane shear measurements. Responses at the surcharge center and slope-toe margin are compared to quantify spatial non-uniformity and pore-pressure–deformation coupling. Pronounced heterogeneity is observed (this field response represents three-dimensional deformation behavior that cannot be reproduced by 1D consolidation tests), with an empirical transition depth of ~24 m for this Wenzhou coastal soft soil site: above this depth, strains concentrate near the margin, whereas below it, compression at the center becomes dominant. The pore-pressure–settlement relationship is stage-dependent: during loading, pore pressure fluctuates markedly and settlement lags; during maintained consolidation, pore pressure dissipates, effective stress develops, and settlement is governed mainly by consolidation compression. After surcharging, water content decreases, and soil sensitivity reduces from 4.0 to 3.0 and stabilizes, indicating post-disturbance structural re-stabilization. These findings inform surcharge scheme design, monitoring layouts, and subsequent model calibration.

1. Introduction

Coastal regions have experienced increasing construction demand for industrial and residential land, driven by economic and social development. Because these areas are commonly located near rivers and shorelines, the surficial deposits are often dominated by soft clay, characterized by high compressibility, high water content, low bearing capacity, and low permeability [1]. These features pose significant challenges to geotechnical structures founded on soft clay, commonly leading to foundation instability, excessive deformation, and insufficient load-carrying capacity [2,3].
As a widely distributed special soil, soft clay—due to its high compressibility and low strength and permeability—cannot directly sustain structural loads [3]. Common ground-improvement techniques for soft subgrades include replacement methods [4], drainage consolidation methods [5], in situ inclusion of stabilizing agents [6], and vibration- or compaction-based densification methods [7], among others.
To effectively control settlement in soft ground, surcharge preloading is widely employed as a ground-improvement technique [8]. By applying a temporary surcharge exceeding the design structural load on the proposed soft foundation and subsequently removing the surcharge once the settlement meets the prescribed criteria, the method reduces long-term consolidation deformation [9,10]. However, substantial uncertainties remain regarding the consolidation behavior of soft clays under surcharge loading and its evolution over time [11], which directly affect the design efficacy and engineering application of surcharge preloading [12].
Numerous domestic and foreign scholars have conducted in-depth research on the reinforcement mechanism and deformation characteristics of surcharge preloading. In terms of preloading duration and load characteristics, Li [13] found that a longer surcharge preloading duration could make the total magnitude of deformation of soft clay larger, and the longer the surcharge preloading duration and the larger the OPR, the smaller the magnitude of secondary compression deformation of soft clay after unloading was, compared with that under permanent pressure loading. Mesri [14], through experimental studies on peat, examined secondary compression under surcharge and non-surcharge conditions and recommended the use of the effective surcharge ratio to evaluate the performance and economic efficiency of preloading.
With the wide promotion of combined foundation treatment technologies, relevant research has gradually shifted from single preloading to composite preloading methods. Zhang et al. [15] studied the effects of combined vacuum-surcharge preloading on pore water pressure and settlement of soft soil foundations through experiments, clarified the dissipation law of pore water pressure and the development characteristics of settlement under the combined preloading method, and provided an experimental basis for the optimization of soft soil foundation reinforcement schemes. Fan et al. [16] comparatively analyzed the reinforcement effects of two drainage consolidation methods, vacuum preloading and surcharge preloading, on soft soil, focused on exploring the differences in soil deformation and layered settlement under the two methods, and verified the advantages of surcharge preloading in improving the bearing capacity of soft soil.
However, most previous studies rely on macroscopic foundation deformation statistics and classical one-dimensional consolidation theory, while ignoring the spatial heterogeneity of soft clay deformation in actual preloading projects. In engineering practice, soft clay foundations under surcharge loading present obvious non-uniform deformation, with the most significant reinforcement and deformation responses occurring near the surcharge edge [17,18]. Existing experimental and numerical results show that surcharge loading induces outward lateral displacement of shallow soil, which is the main cause of foundation differential settlement. In addition, lateral deformation is highly sensitive to construction parameters such as loading rate and vacuum-surcharge combination, forming a typical shallow edge-dominated deformation pattern [17,18].
In terms of the consolidation characteristics and parameter evolution of soil, relevant studies have further revealed the variation laws of core parameters during the surcharge preloading process. Wang et al. [19] carried out research on the one-dimensional consolidation characteristics of soft soil under multi-stage loading conditions, analyzed the correlation between vertical strain, pore pressure, and settlement rate, and established a prediction model for soft soil consolidation under multi-stage loading. However, field monitoring data of vacuum-surcharge combined preloading indicate that the temporal evolution of settlement, excess pore water pressure, and lateral displacement is asynchronous [3,20]. The traditional one-dimensional consolidation theory is insufficient to explain the complex three-dimensional consolidation response of actual soft soil foundations, resulting in limited prediction accuracy of foundation deformation.
This study establishes a full-depth layered synchronous monitoring system for soft soil under staged surcharge preloading. Based on abundant field vertical strain data from multiple spatial positions, the depth-dependent asymmetric deformation characteristics of coastal soft clay are systematically summarized. Combined with laboratory consolidation test results, the internal mechanical mechanisms governing differential deformation between the surcharge center and edge are clarified from the perspective of soil compression behavior, forming a complete research path of field measurement and indoor parametric analysis [21,22,23].
Despite progress, several gaps remain. First, some engineering studies emphasize phenomenological description but lack a systematic “monitoring–theory/model validation” pathway, limiting reproducibility and transferability. Second, the empirical depth-threshold for vertical strain reversal and the coupled evolution of pore pressure–layered strain at the center versus the edge—particularly under staged surcharge construction—still lack rigorous field quantification based on layered monitoring data; no existing literature has clarified the stratigraphic control factor of this threshold depth. Third, recent analytical work on combined treatment methods often focuses on axisymmetric radial consolidation, providing limited guidance for edge–center contrasts induced by surcharge geometry.
Motivated by the above three research gaps, this paper takes Wenzhou intertidal flat soft soil seawall test section as the research object, and forms differentiated innovations compared with existing literature:
(1) Multi-index synchronous field measurement system: integrated layered settlement, full-depth pore-water pressure monitoring, and in-situ vane shear test, matched with laboratory one-dimensional consolidation test;
(2) Quantitative coupling analysis of depth-plane position: quantitatively characterize the three-dimensional asymmetric deformation difference between surcharge center and slope toe margin under staged loading, and determine an empirical strain transition depth of ~24 m for this Wenzhou coastal soft soil site;
(3) Form a complete closed-loop research framework of “field layered monitoring—laboratory consolidation test—theoretical mechanism verification” and clarify the stage-dependent coupling law of pore pressure and layered deformation under multi-stage surcharge.

2. Materials and Methods

2.1. Test Materials

The soil specimens used in this study were sourced from intertidal flats (commonly referred to as “sea shoals”) with elevations ranging from −1.00 m to 0.00 m. Following recent reclamation and hydraulic fill (soil/sand), the area has been converted to terrestrial land. Localized creek channels are present, but overall relief is minor, with ground elevations between 2.48 m and 4.86 m.
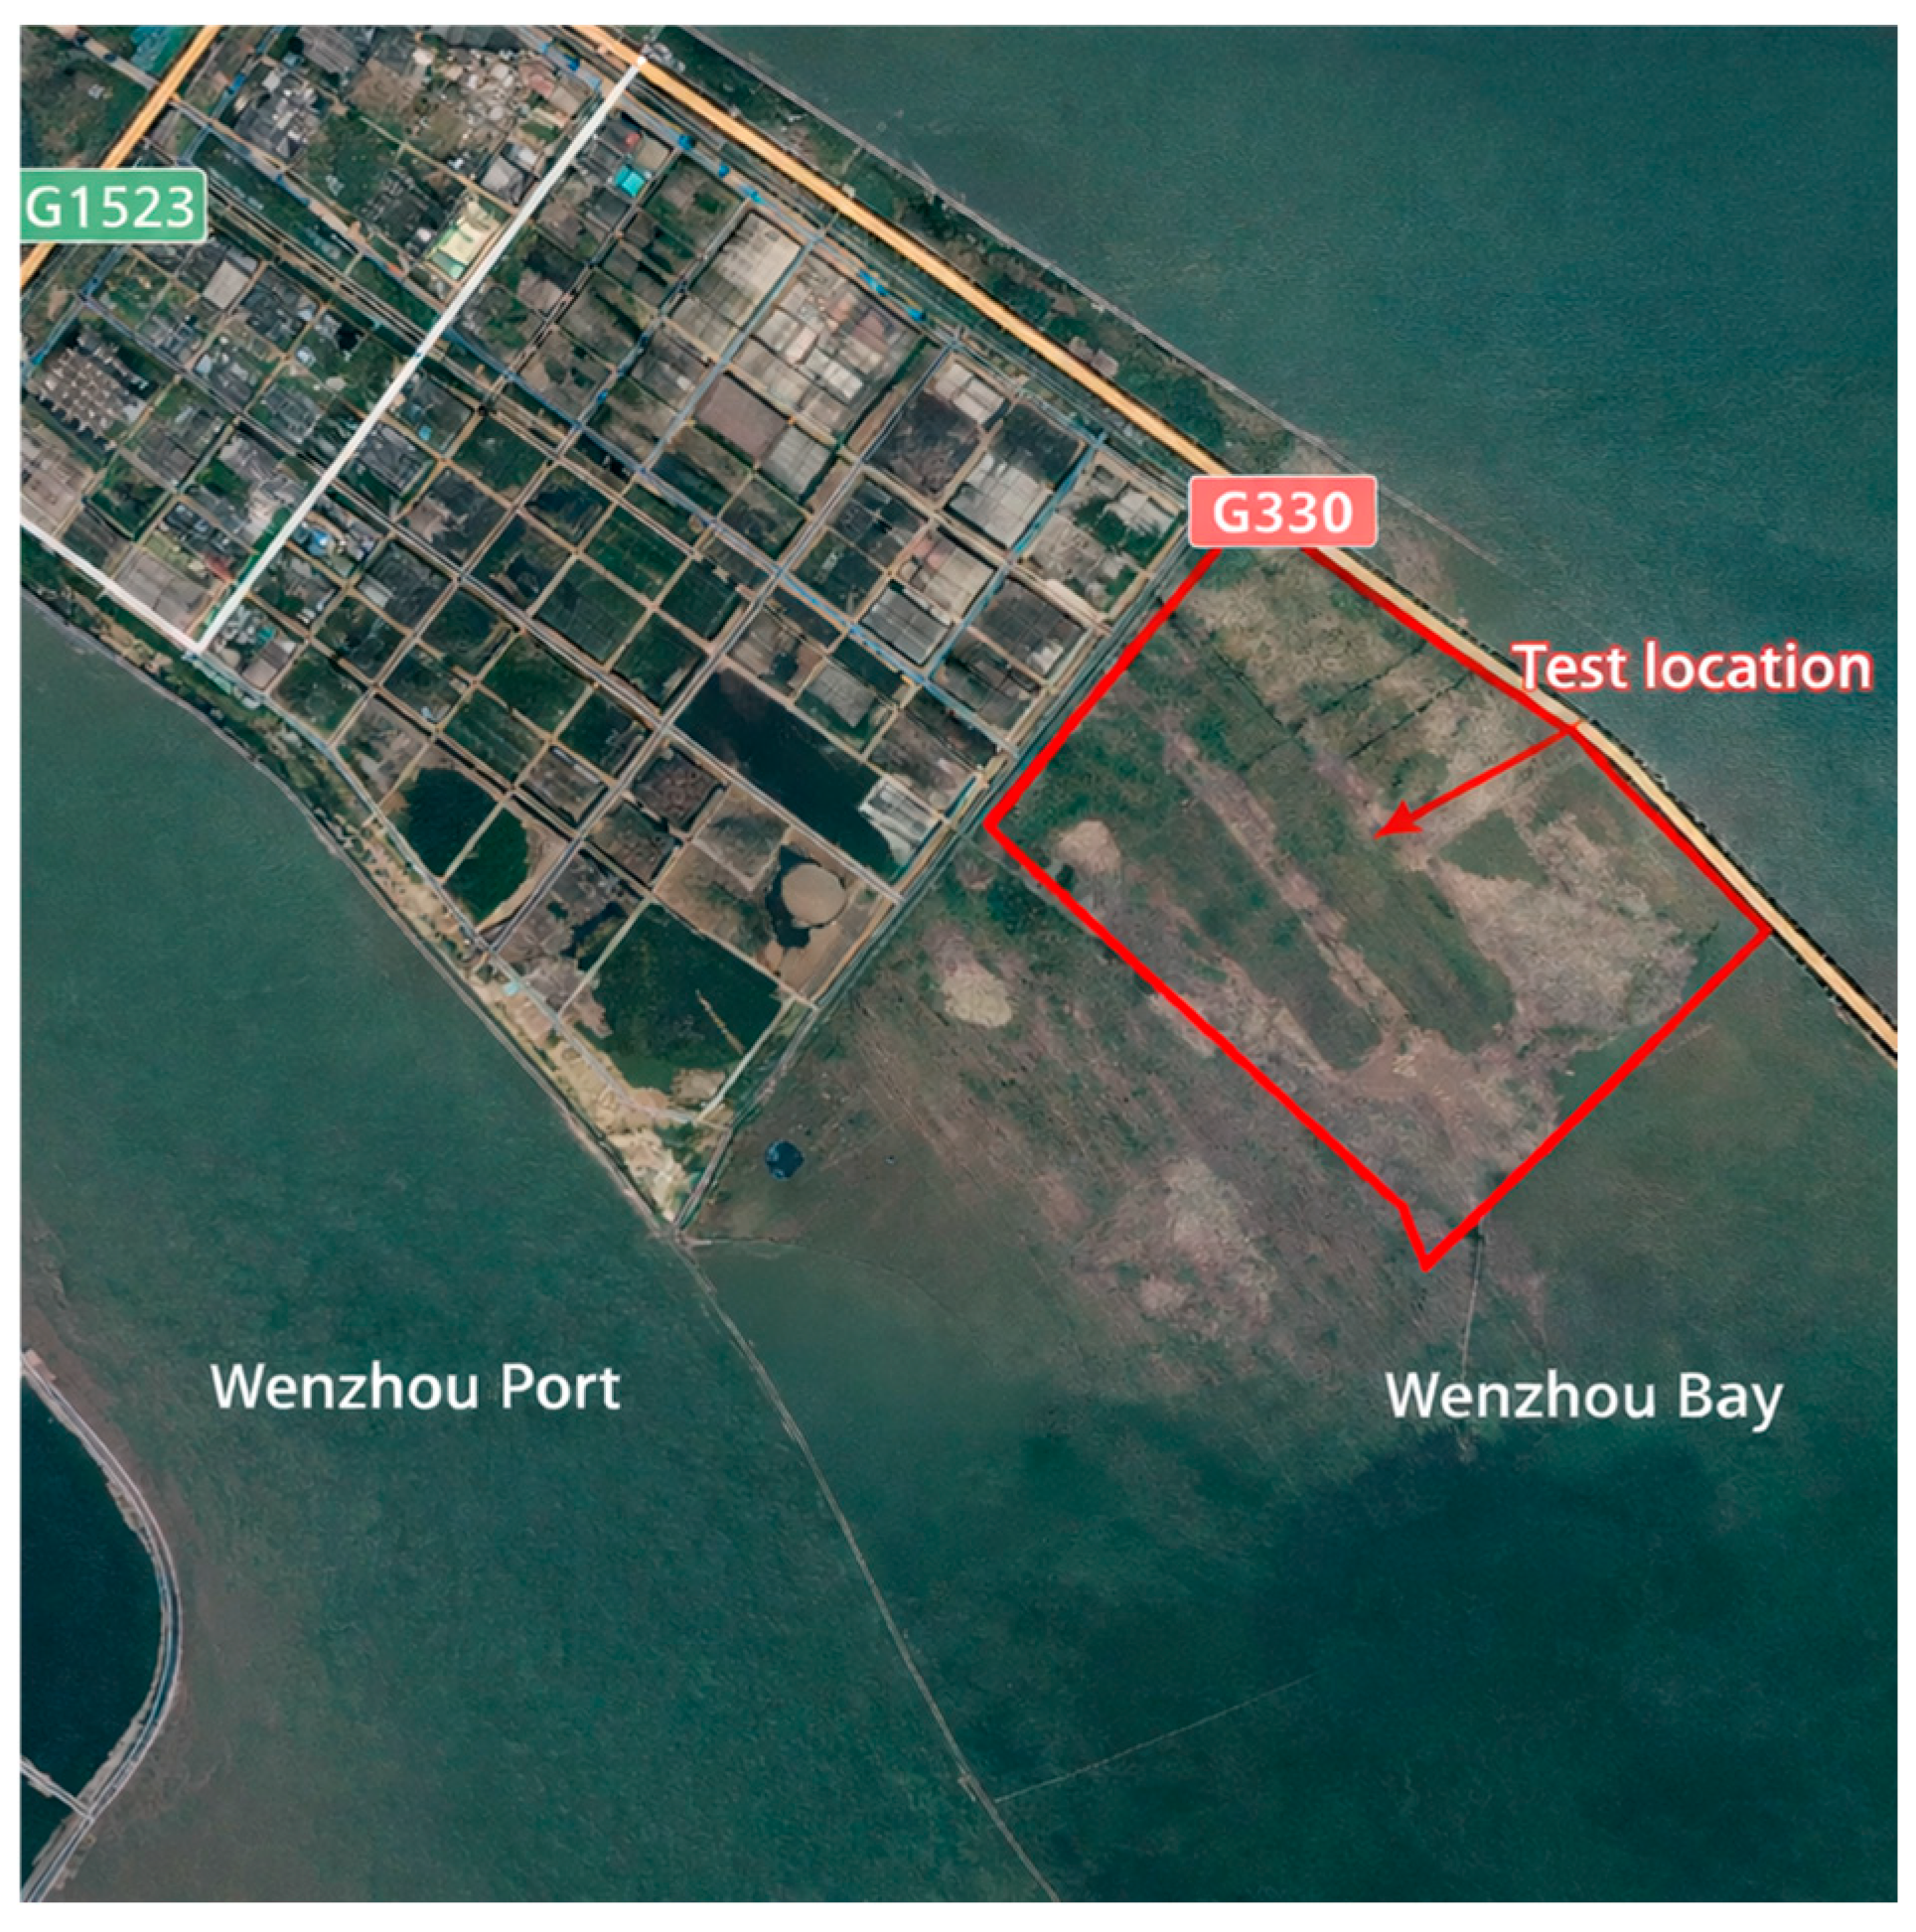
The site is primarily composed of Quaternary silt-clay deposits formed through alternating marine, fluvio-marine, and fluvio-lacustrine sedimentation, exhibiting typical coastal accretion and alluvial plain geomorphic characteristics. All test specimens were collected from the soft clay of the Ouchi seawall in Wenzhou, Zhejiang Province, as shown in Figure 1. These samples are representative and suitable for subsequent investigation of consolidation behavior.
The collected soil specimens were subjected to laboratory geotechnical testing in accordance with the Standards for Soil Testing Methods (GB/T 50213-2019 Standard for soil test method. China Architecture & Building Press: Beijing, China, 2019). The basic physical and mechanical indices of the soils are summarized in Table 1.
Analysis of Table 1 indicates that strata Nos. 1–5 exhibit the following properties:
(1) High natural water content, with liquidity index of 1.17–1.43, indicative of a highly fluid state; (2) Void ratio of 1.247–1.728, reflecting large porosity and high compressibility; (3) Cohesion of 7.4–11.4 kPa and internal friction angle of 2.5–4.2°, indicating low shear strength. The site surcharge scheme is summarized in Table 2.
The layout of field monitoring instruments is supplemented in Section 2.1. Four boreholes G1–G4 are arranged at surcharge edge, slope shoulder, and central zone, respectively, with monitoring sensors buried at vertical intervals of 2 m from 6 m to 34 m depth. Piezometers and layered settlement gauges are installed in each borehole; the horizontal distance between adjacent boreholes, drilling construction steps, sensor saturation, and embedding methods are elaborated in detail to guarantee the reproducibility of this field test.
This field test was carried out using a staged surcharge preloading scheme, with the fill height raised in multiple construction phases. The implementation dates and construction procedures for each stage are summarized in Table 2. It should be noted that the time intervals between successive surcharge stages were jointly determined by on-site construction logistics and the overall schedule, rather than following a strictly uniform loading interval. To reduce the interpretational bias introduced by non-uniform intervals, this study adopts the “staged loading phase” as the basic unit of comparison. For each stage, the pore-water pressure response, changes in settlement rate, and the distribution of layer-by-layer deformation are systematically summarized and compared. The discussion emphasizes the short-term response immediately after loading and the evolution during the holding period, while explicitly stating the extent to which this construction constraint may limit the generalizability of the conclusions.
A geogrid was used to reinforce the embankment slope during filling to enhance the overall integrity of the surcharge body and improve construction-stage stability. The pore-pressure–settlement response addressed in this paper is primarily governed by foundation consolidation. Nevertheless, the presence of the geogrid may influence the lateral-deformation boundary near the slope toe; therefore, this factor is discussed as a potential contributor to the observed differences in edge responses.
Because the field program was affected by construction organization, the loading intervals between stages were not fully identical. Although the influence is mitigated through phase-based comparisons and temporal trend analyses, different loading intervals can alter the degree of pore-pressure dissipation and the development of secondary consolidation. Accordingly, the conclusions are most applicable to coastal soft-clay surcharge preloading projects implemented under similar construction rhythms and staging schedules.
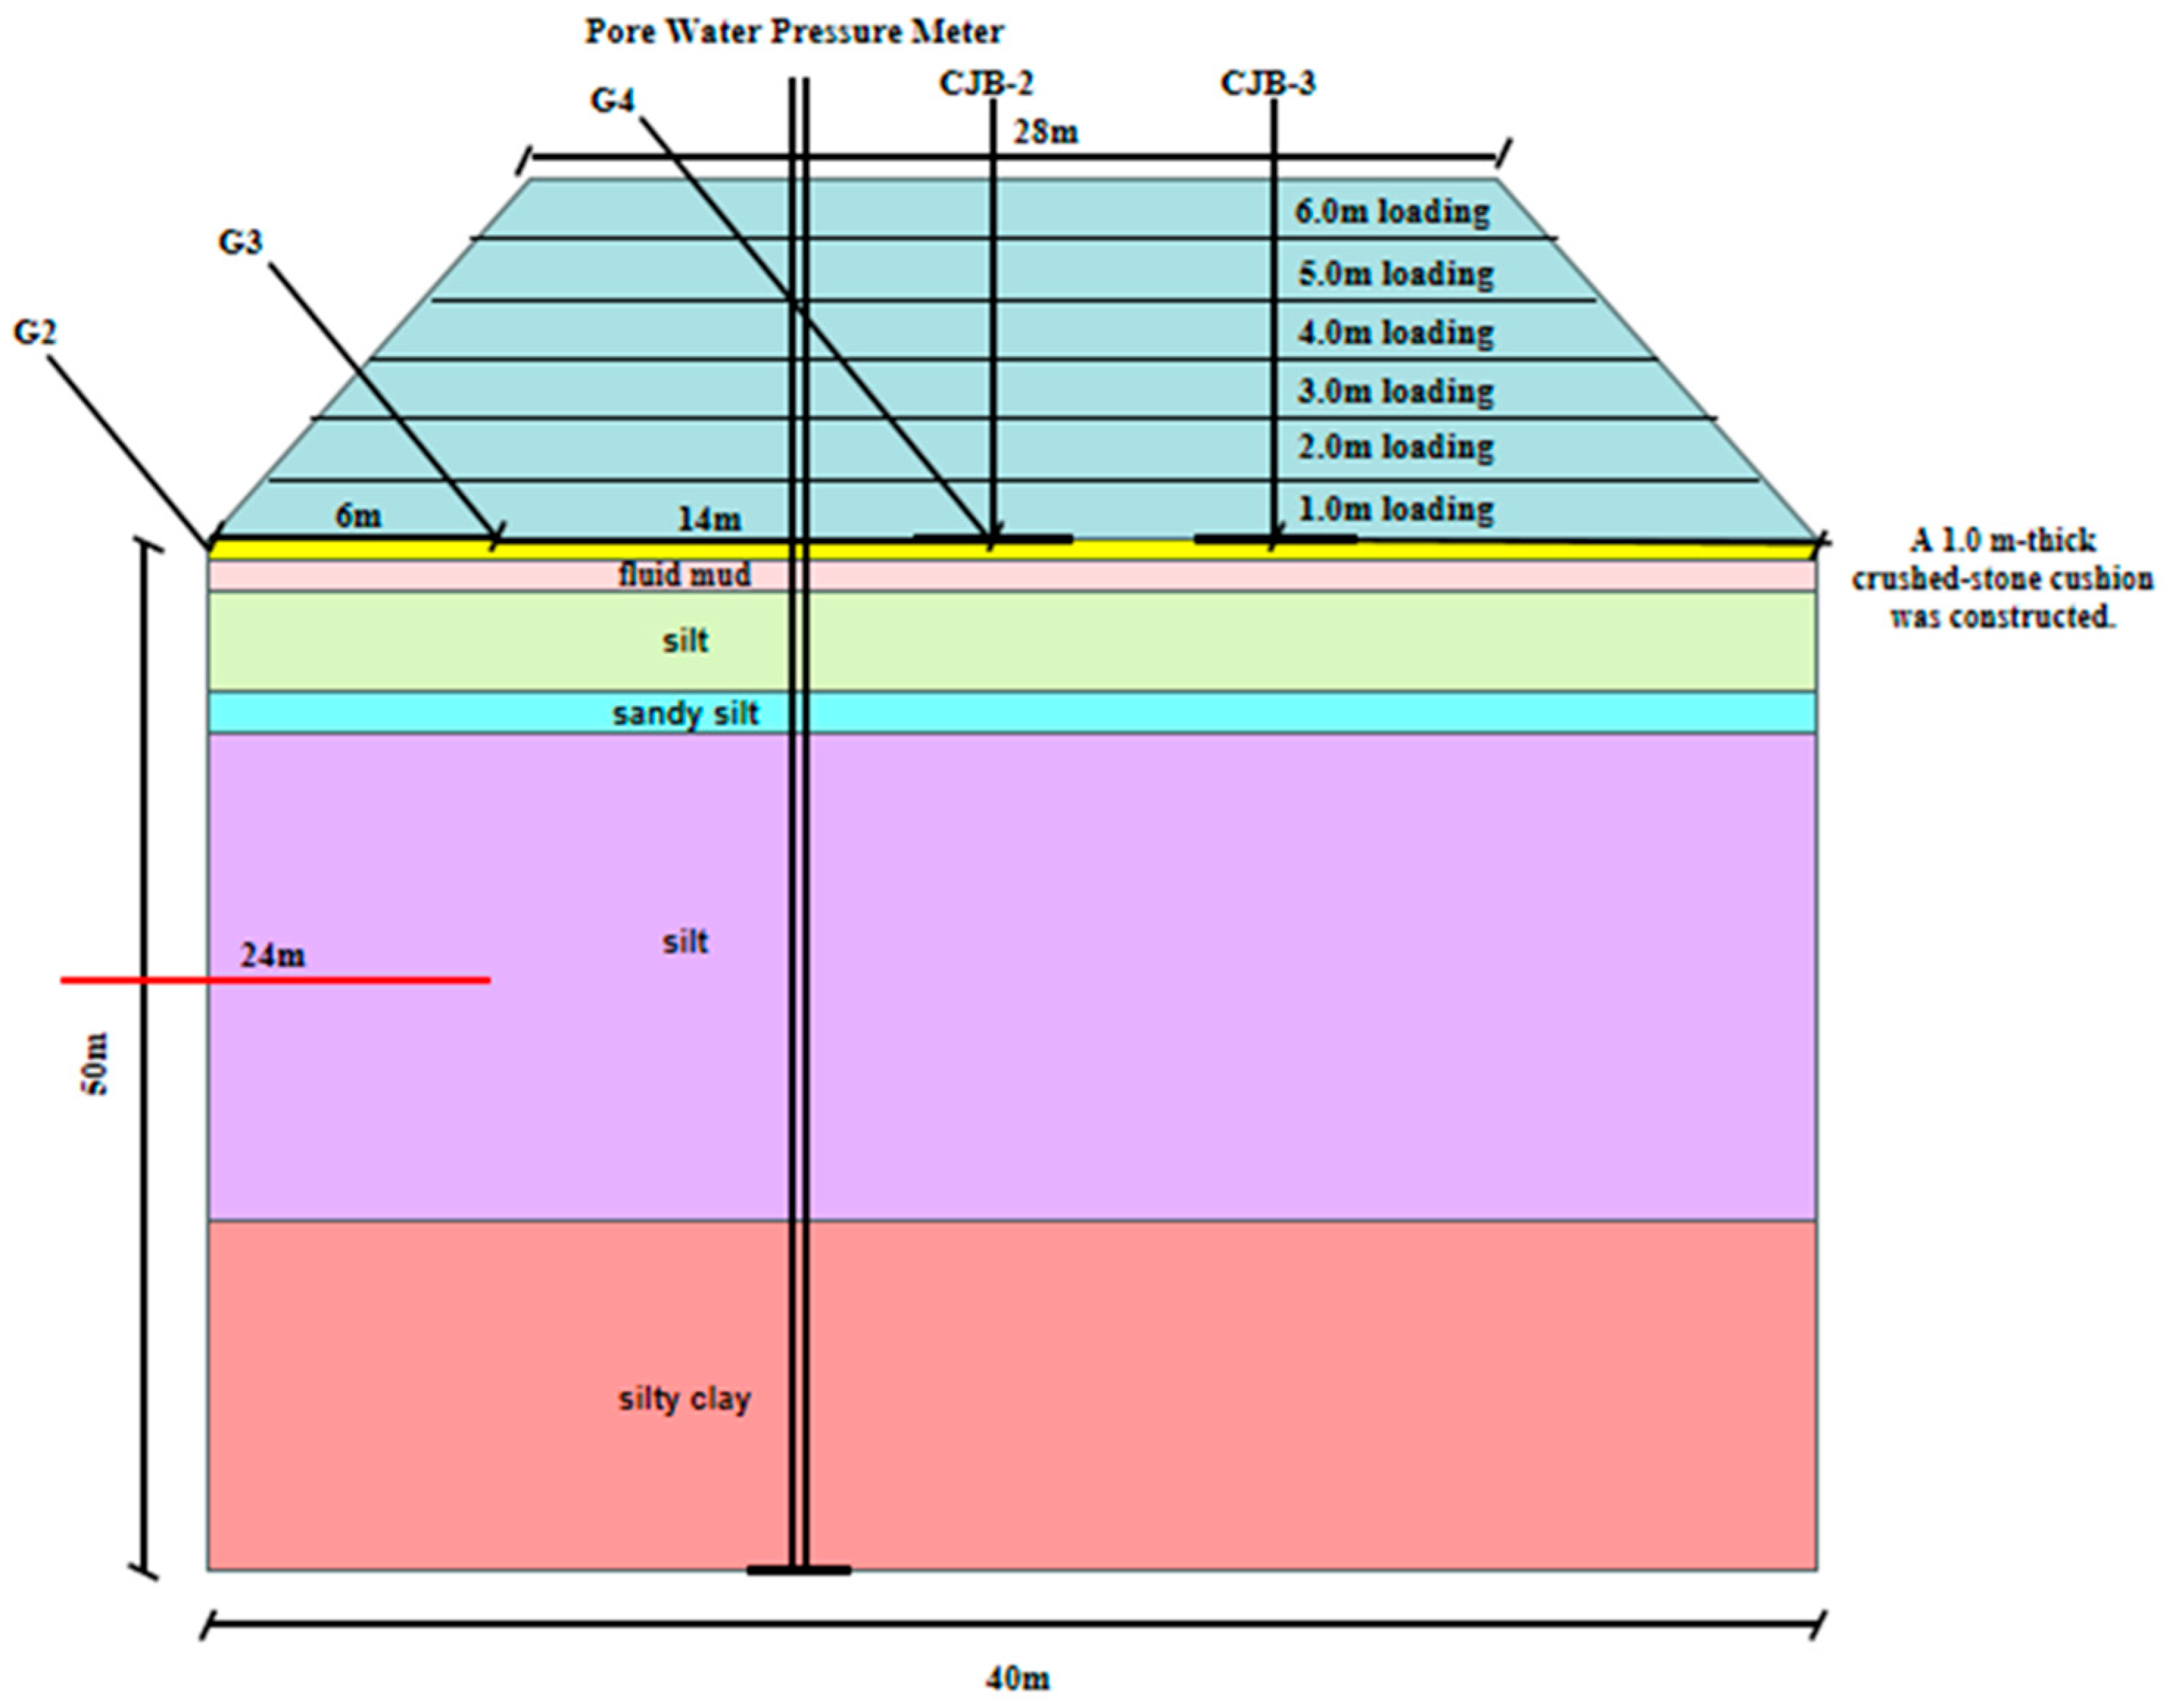
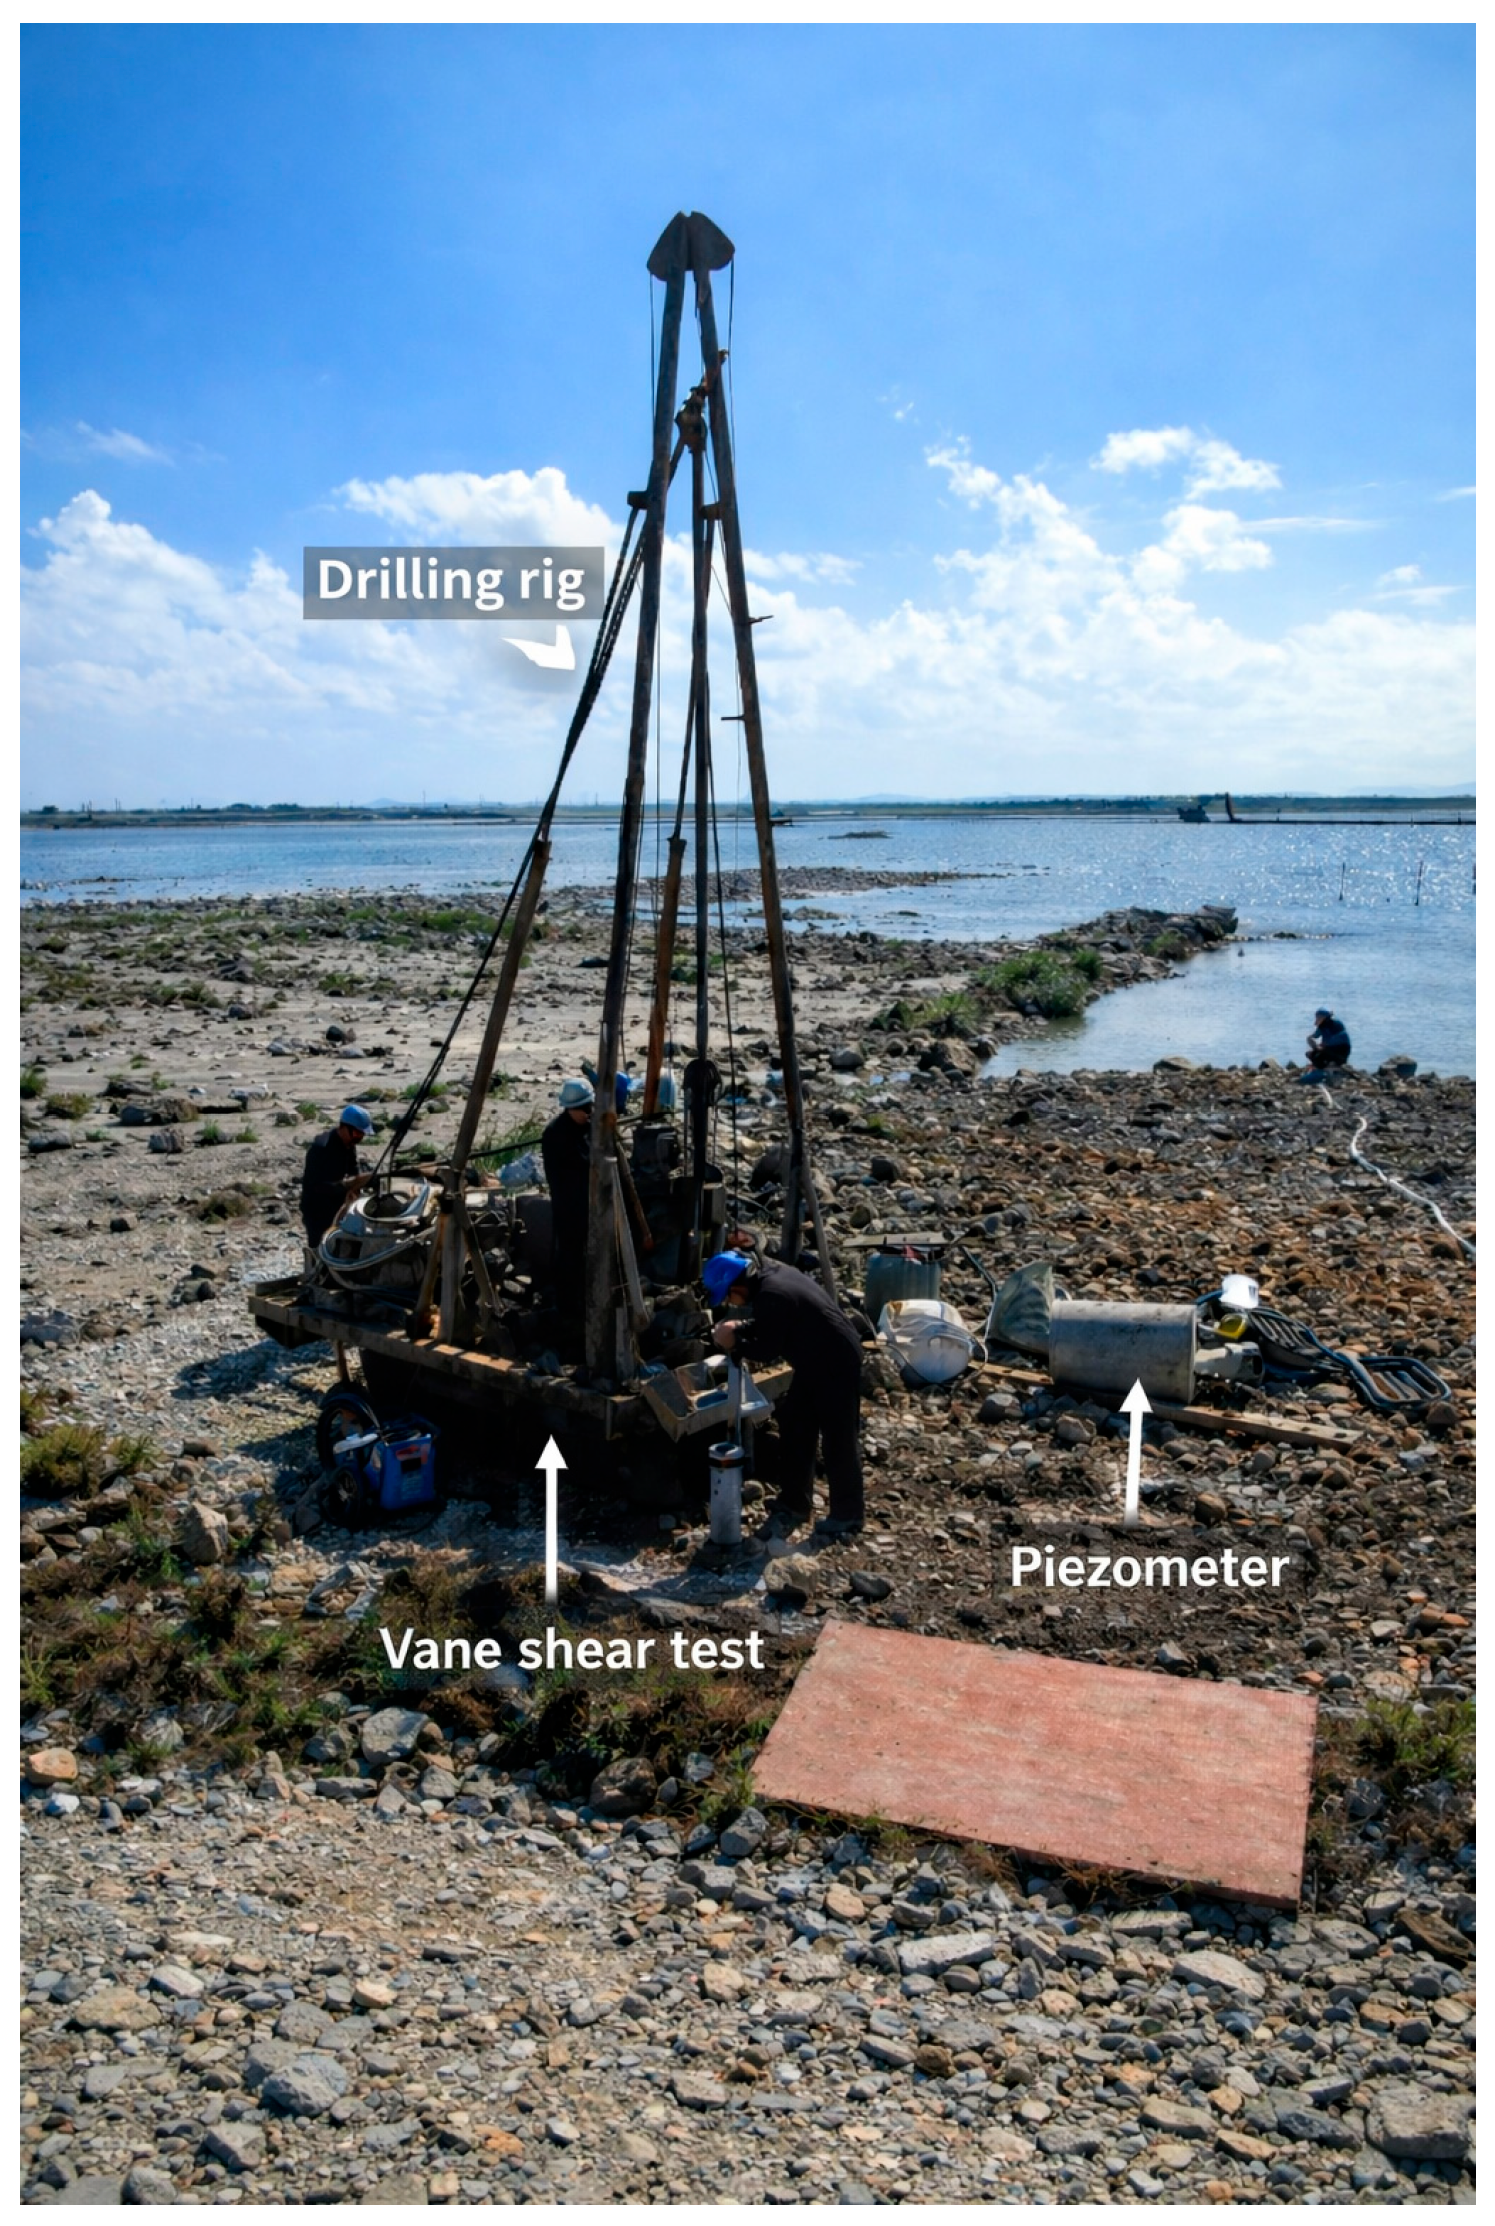
The soil samples were collected from the vertical soil column beneath the circled location shown on the monitored cross-section of the test area after surcharging, as well as from the preloading (pre-surcharge) ground. As labeled in Figure 2, samples G2, G3, and G4 were taken from the ground after surcharging, whereas the intact (original) soil sample is denoted as G1. It should be noted that the surcharge fill had already been removed at the time of sampling. Figure 3 is a schematic diagram of field boreholes showing the soil sampling site. The lower figure presents representative specimens and a schematic of the on-site drilling operation.

2.2. One-Dimensional Consolidation Test Scheme

This section elaborates on the indoor consolidation test equipment, specimen preparation, and loading procedures, which are distinguished from the site soil material introduction in Section 2.1.
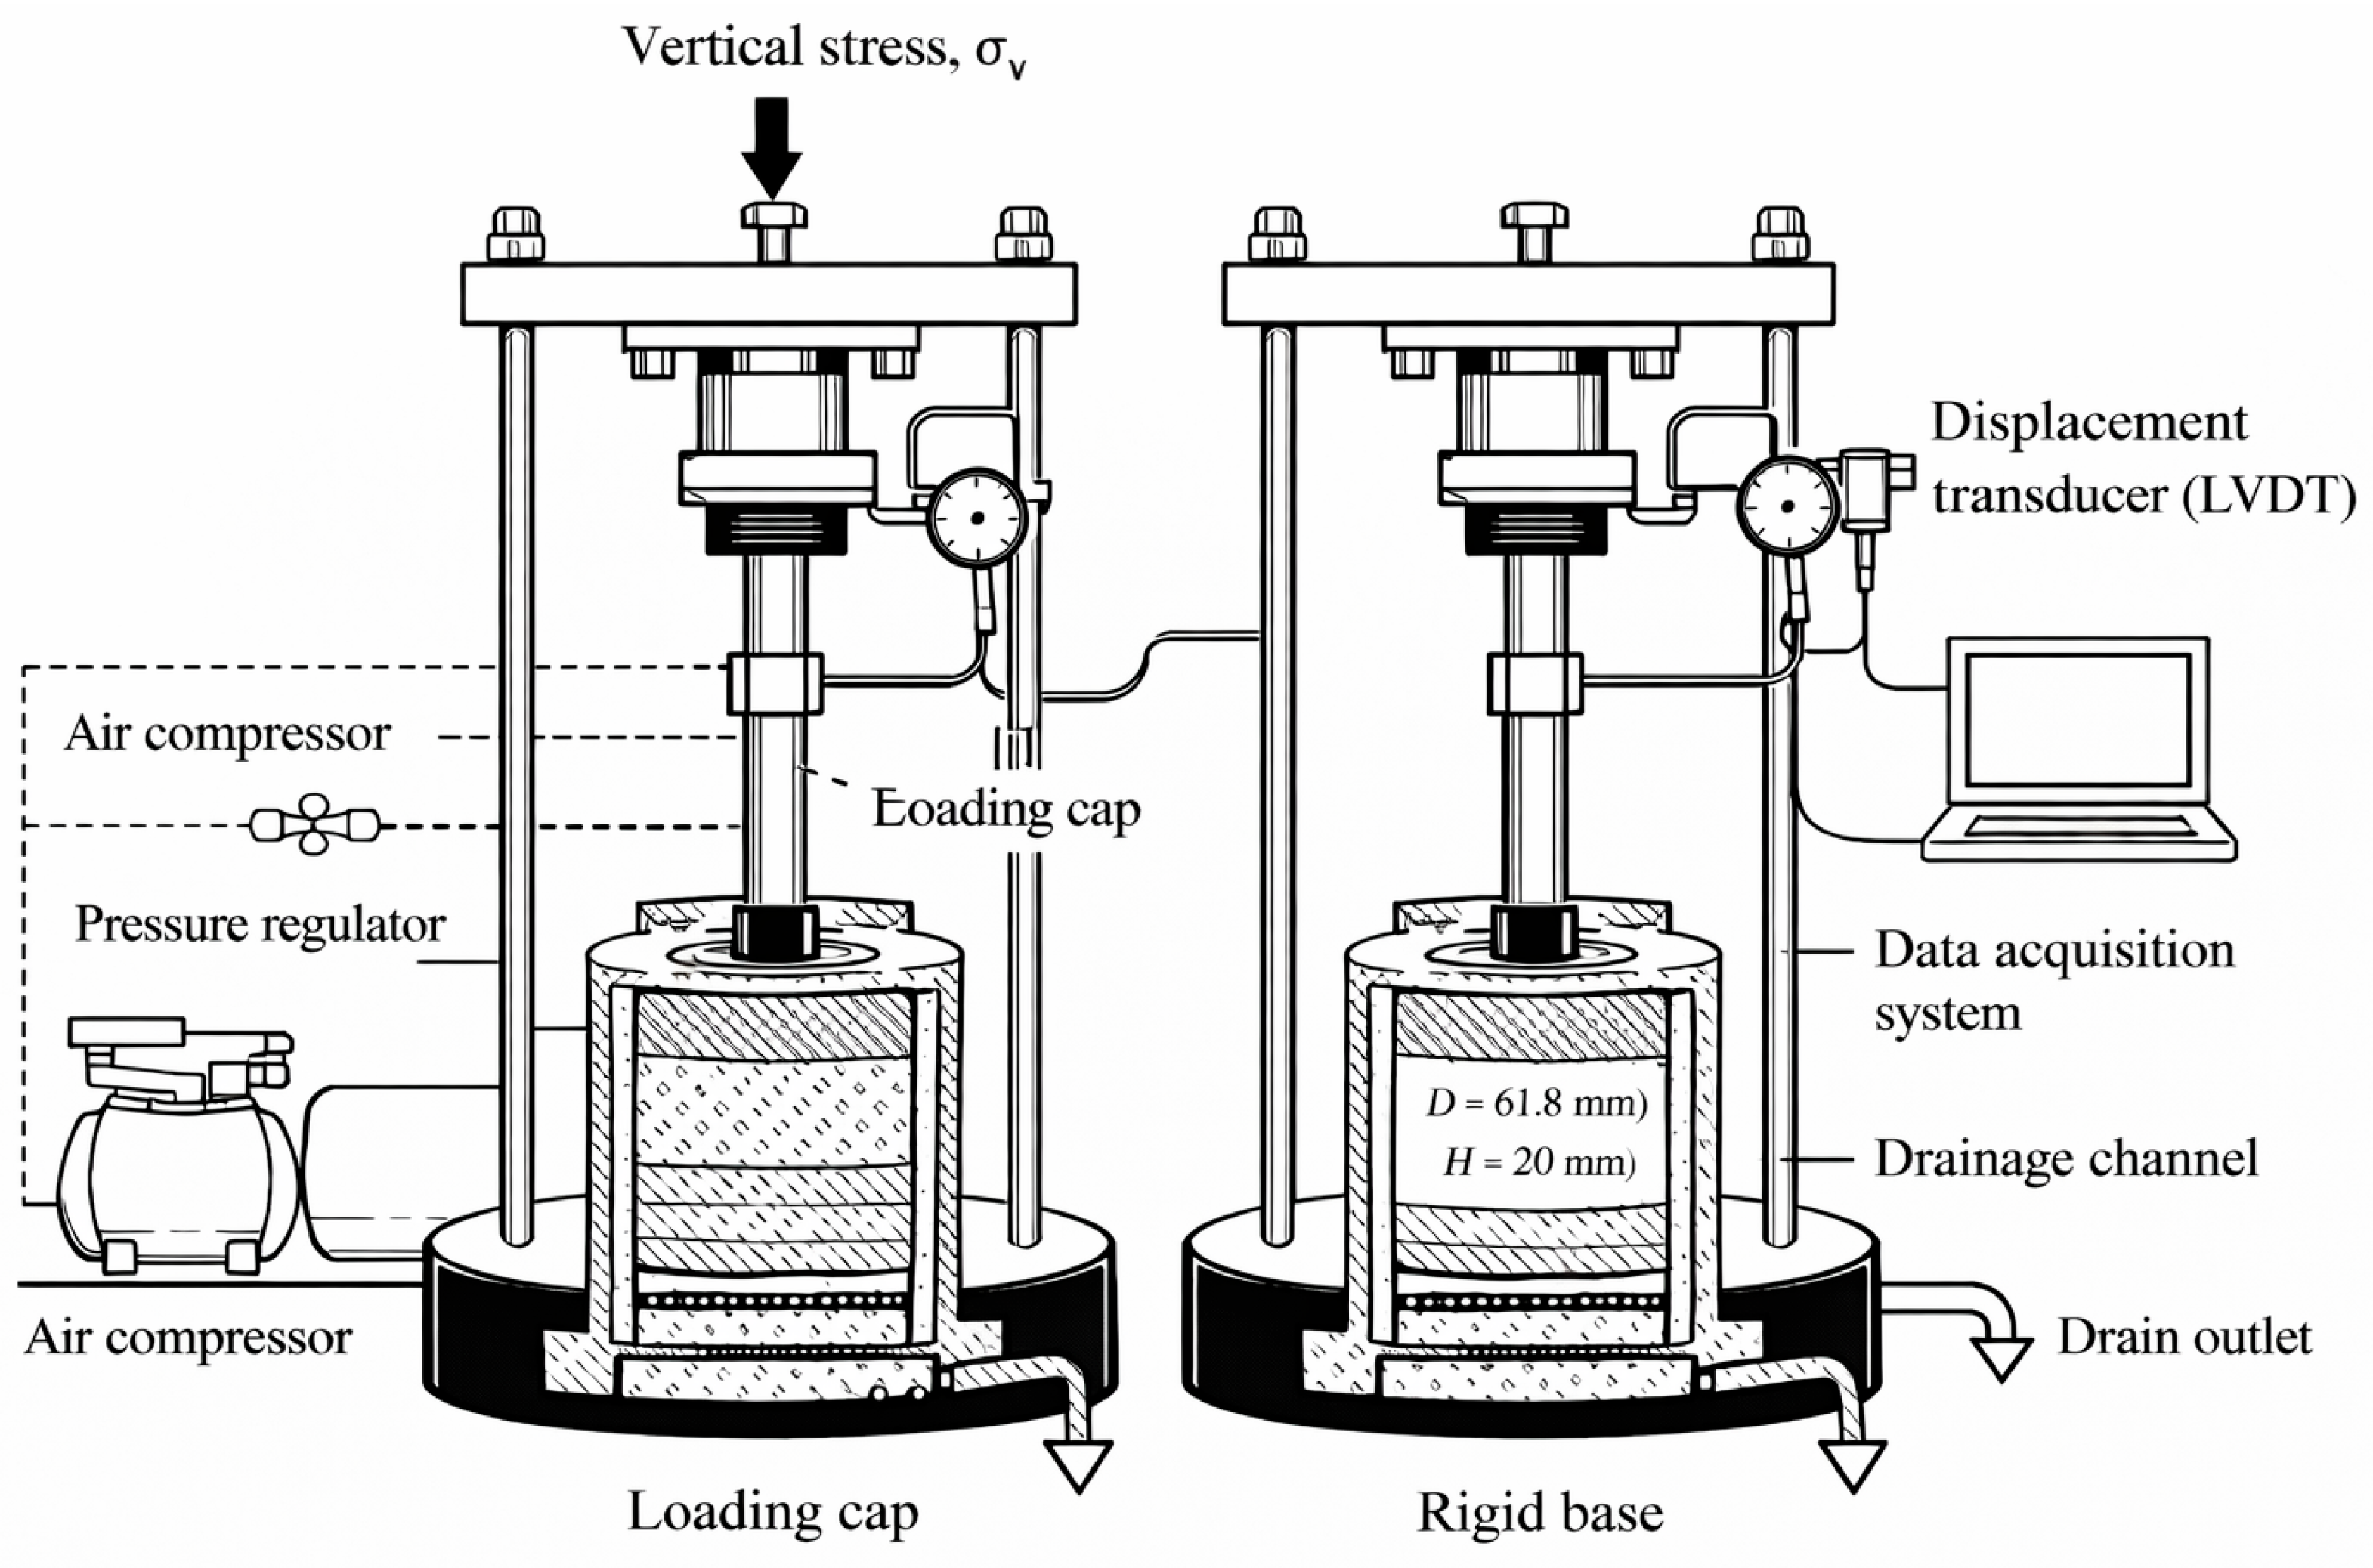
A one-dimensional consolidation test was conducted using an intelligent pneumatic medium-pressure consolidometer. All specimens were prepared with standard cutting rings, with an inner diameter of 61.8 mm and a height of 20 mm. To minimize the influence of sidewall friction on axial deformation measurements, a thin and uniform layer of petroleum jelly (Vaseline) was applied to the contact interface between the consolidation ring and the specimen for lubrication. Permeable stones and filter papers were placed at both the top and bottom ends of the specimen to provide double drainage boundary conditions. The permeable stones were the standard stones supplied with the apparatus (with a thickness depending on the device configuration), while the filter paper was used to ensure unobstructed end drainage and to prevent fine-particle migration that could clog the drainage pathways.
Consolidation loading was applied through the pneumatic pressure system of the apparatus, with a nominal loading range of 0–3200 kPa. A staged loading procedure was adopted. Under each load increment, the evolution of axial deformation with time was continuously recorded to obtain the settlement–time curves for subsequent consolidation-parameter evaluation.
Shengtaike intelligent pneumatic medium-pressure consolidometer (Zhangjiagang, Jiangsu, China) is adopted for full-depth pore-water pressure monitoring in this study, with detailed equipment parameters, installation, and calibration procedures listed as follows:
Sensor model: Shengtaike intelligent pneumatic medium-pressure consolidometer; measuring range: −50~150 kPa; measurement accuracy: ±0.5 kPa; zero temperature drift: ≤0.1 kPa/°C;
Factory calibration: graded pressure calibration is carried out by a standard pressure tank before delivery, covering the full measuring range of −0~3200 kPa, with a fitting correlation coefficient R2 > 0.999 between output frequency and pressure;
In-situ saturation treatment: The permeable stone of piezometer is vacuum-saturated for 24 h, and immersed in distilled water for another 12 h before installation; mud slurry is filled in boreholes during embedding to ensure full contact between permeable stone and soft soil without air voids;
In-situ zero correction: Hydrostatic reference zero point is collected after 7 d static placement before each surcharge stage; daily zero drift values are automatically recorded, and linear drift correction is applied in post-processing to eliminate temperature and equipment zero offset;
Plausibility check: Groundwater table depth is collected synchronously every day to calculate theoretical hydrostatic pressure; excess pore-water pressure is defined as the difference between measured pore pressure and hydrostatic pressure at the same depth. Negative excess pore pressure is identified when measured pressure is lower than hydrostatic pressure, and cross-verified with layered settlement and vane shear strength data at corresponding depth. Figure 4 shows the Shengtaike intelligent pneumatic medium-pressure consolidometer used in this study.
Undisturbed soft clay samples before and after surcharge preloading were retrieved from the seawall site using thin-walled tube sampling. Intact samples were extruded from the tubes with a pusher, trimmed into standard ring-cutter specimens, and subjected to one-dimensional consolidation testing using an automatic oedometer. Loads were applied in seven increments of 12.5, 25, 50, 100, 200, 400, and 800 kPa. The next load was automatically applied when the deformation rate fell below 0.005 mm. Time–deformation data for the seawall soft clay were thereby obtained.
Four test series covered the following sampling depths: 6.0–6.5 m, 8.0–8.5 m, 12.0–12.5 m, 16.0–16.5 m, 18.0–18.5 m, 20.0–20.5 m, 22.0–22.5 m, 24.0–24.5 m, 26.0–26.5 m, 28.0–28.5 m, 32.0–32.5 m, and 34.0–34.5 m.
The field project adopted multi-stage surcharge construction (detailed loading schedule shown in Table 2 in Section 2.1). Due to inconsistent loading intervals between construction phases, the indoor consolidation test in this study adopted seven graded pressure levels listed in Table 3 to match the field stress increment characteristics.
Complete full-process normalization covering the whole monitoring period is unavailable due to discontinuous field records; however, simplified stage-wise normalization using available stage duration and surcharge height data is conducted to eliminate the bias induced by unequal holding time. Multi-angle cross-verification of monitoring data can eliminate the interference of uneven holding periods. The asymmetric deformation distribution and depth-related strain transformation feature can be stably observed in every independent loading stage with different consolidation durations, which proves that the core spatial deformation law is not controlled by inconsistent construction intervals.

2.2.1. Specimen Quality Control, Disturbance Assessment and Replicate Arrangement

Undisturbed soft clay samples were retrieved by thin-walled stainless steel tube sampling. Disturbance degree was assessed by comparing the initial water content and void ratio of tube core samples and intact block samples taken on site. Specimens with void ratio deviation greater than 3% were discarded, and only slightly disturbed samples were used for formal tests. For each sampling depth, three standard ring-cut specimens were prepared as replicates. After testing, the 3σ criterion was used to eliminate abnormal outlier data, and the average result of three valid replicates was adopted for subsequent analysis to reduce random experimental error. The initial void ratio e0 of each specimen was calculated before loading based on measured initial water content, soil particle specific gravity, and bulk density, and recorded in the laboratory test log.

2.2.2. Specimen Saturation and Drainage Boundary

Specimen saturation and drainage boundary settings refer to the vacuum saturation standard for monitoring sensors described in Section 2.1. The intelligent pneumatic consolidometer adopted in this study has a measuring range of −50~1600 kPa with measurement accuracy of ±0.5 kPa.
Supplemented specimen saturation protocol for one-dimensional consolidation oedometer:
After trimming undisturbed soil into standard ring specimens, the samples are placed in a vacuum saturator for 48 h of vacuum saturation under negative pressure. Distilled water is slowly injected into the saturator until all specimens are fully submerged. Saturation degree is measured by the water content–void ratio method after saturation treatment; only specimens with saturation degree ≥98% are adopted for formal consolidation tests. During the whole loading process, double drainage with saturated permeable stones and filter paper is maintained to keep the specimen saturated throughout the test period.

2.2.3. Graded Loading Schedule and Holding Duration

Vertical consolidation loading was implemented in seven successive increments: 12.5, 25, 50, 100, 200, 400, and 800 kPa. Each load level was maintained continuously until the vertical deformation rate dropped below 0.005 mm within 12 h, complying with the stabilization requirement of GB/T 50123-2019 Standard for soil test method. China Architecture & Building Press: Beijing, China, 2019. The automatic data acquisition system continuously recorded axial displacement versus time for each holding stage.
(1) Pre-consolidation pressure P c . The Casagrande graphical construction method was applied to the e log p compression curve to determine the pre-consolidation pressure, corresponding to the inflection point separating recompression and virgin compression segments.
(2) Compression index C c and recompression index C r
C c = Δ e Δ l o g p
C c represents the slope of the linear virgin compression segment after P c , C r is the slope of the rebound recompression segment before reaching P c .
(3) Coefficient of consolidation C v
The square-root-of-time Taylor method was adopted for each load increment’s settlement-time curve to solve the vertical consolidation coefficient C v .
(4) Coefficient of volume compressibility a v
a v = Δ e Δ σ
where Δ e = void ratio variation, Δ σ = increment of vertical effective stress under each loading step.

2.2.4. Stratigraphic Control Analysis of the 24 m Empirical Transition Depth

To clarify the formation mechanism of the ~24 m strain transition depth obtained in this test, this paper carries out sensitivity analysis of layered physical and mechanical indices of the site stratum. The test site is composed of alternating marine and fluvio-marine silt, sandy silt, and silty clay strata:
Above 24 m depth: dominated by fluid mud and silt (void ratio 1.71~1.73, water content > 60%, cohesion 8.4~9.0 kPa), low lateral confining pressure, prone to lateral extrusion deformation at the surcharge edge;
Below 24 m depth: thick silty clay stratum (void ratio 1.28, water content 45.6%, shear strength significantly improved), vertical additional stress diffusion from surcharge center plays a dominant role, and lateral deformation is constrained by high-strength silty clay.
The alternating distribution of high-compressibility shallow mud and low-compressibility deep silty clay is the primary stratigraphic factor leading to strain reversal at 24 m. This depth is an empirical threshold exclusive to the Quaternary marine interbedded soft soil of Wenzhou Bay, rather than a universal critical depth applicable to all soft soil sites.

3. Results

3.1. Statistical Uncertainty Analysis of Measured Strain Data

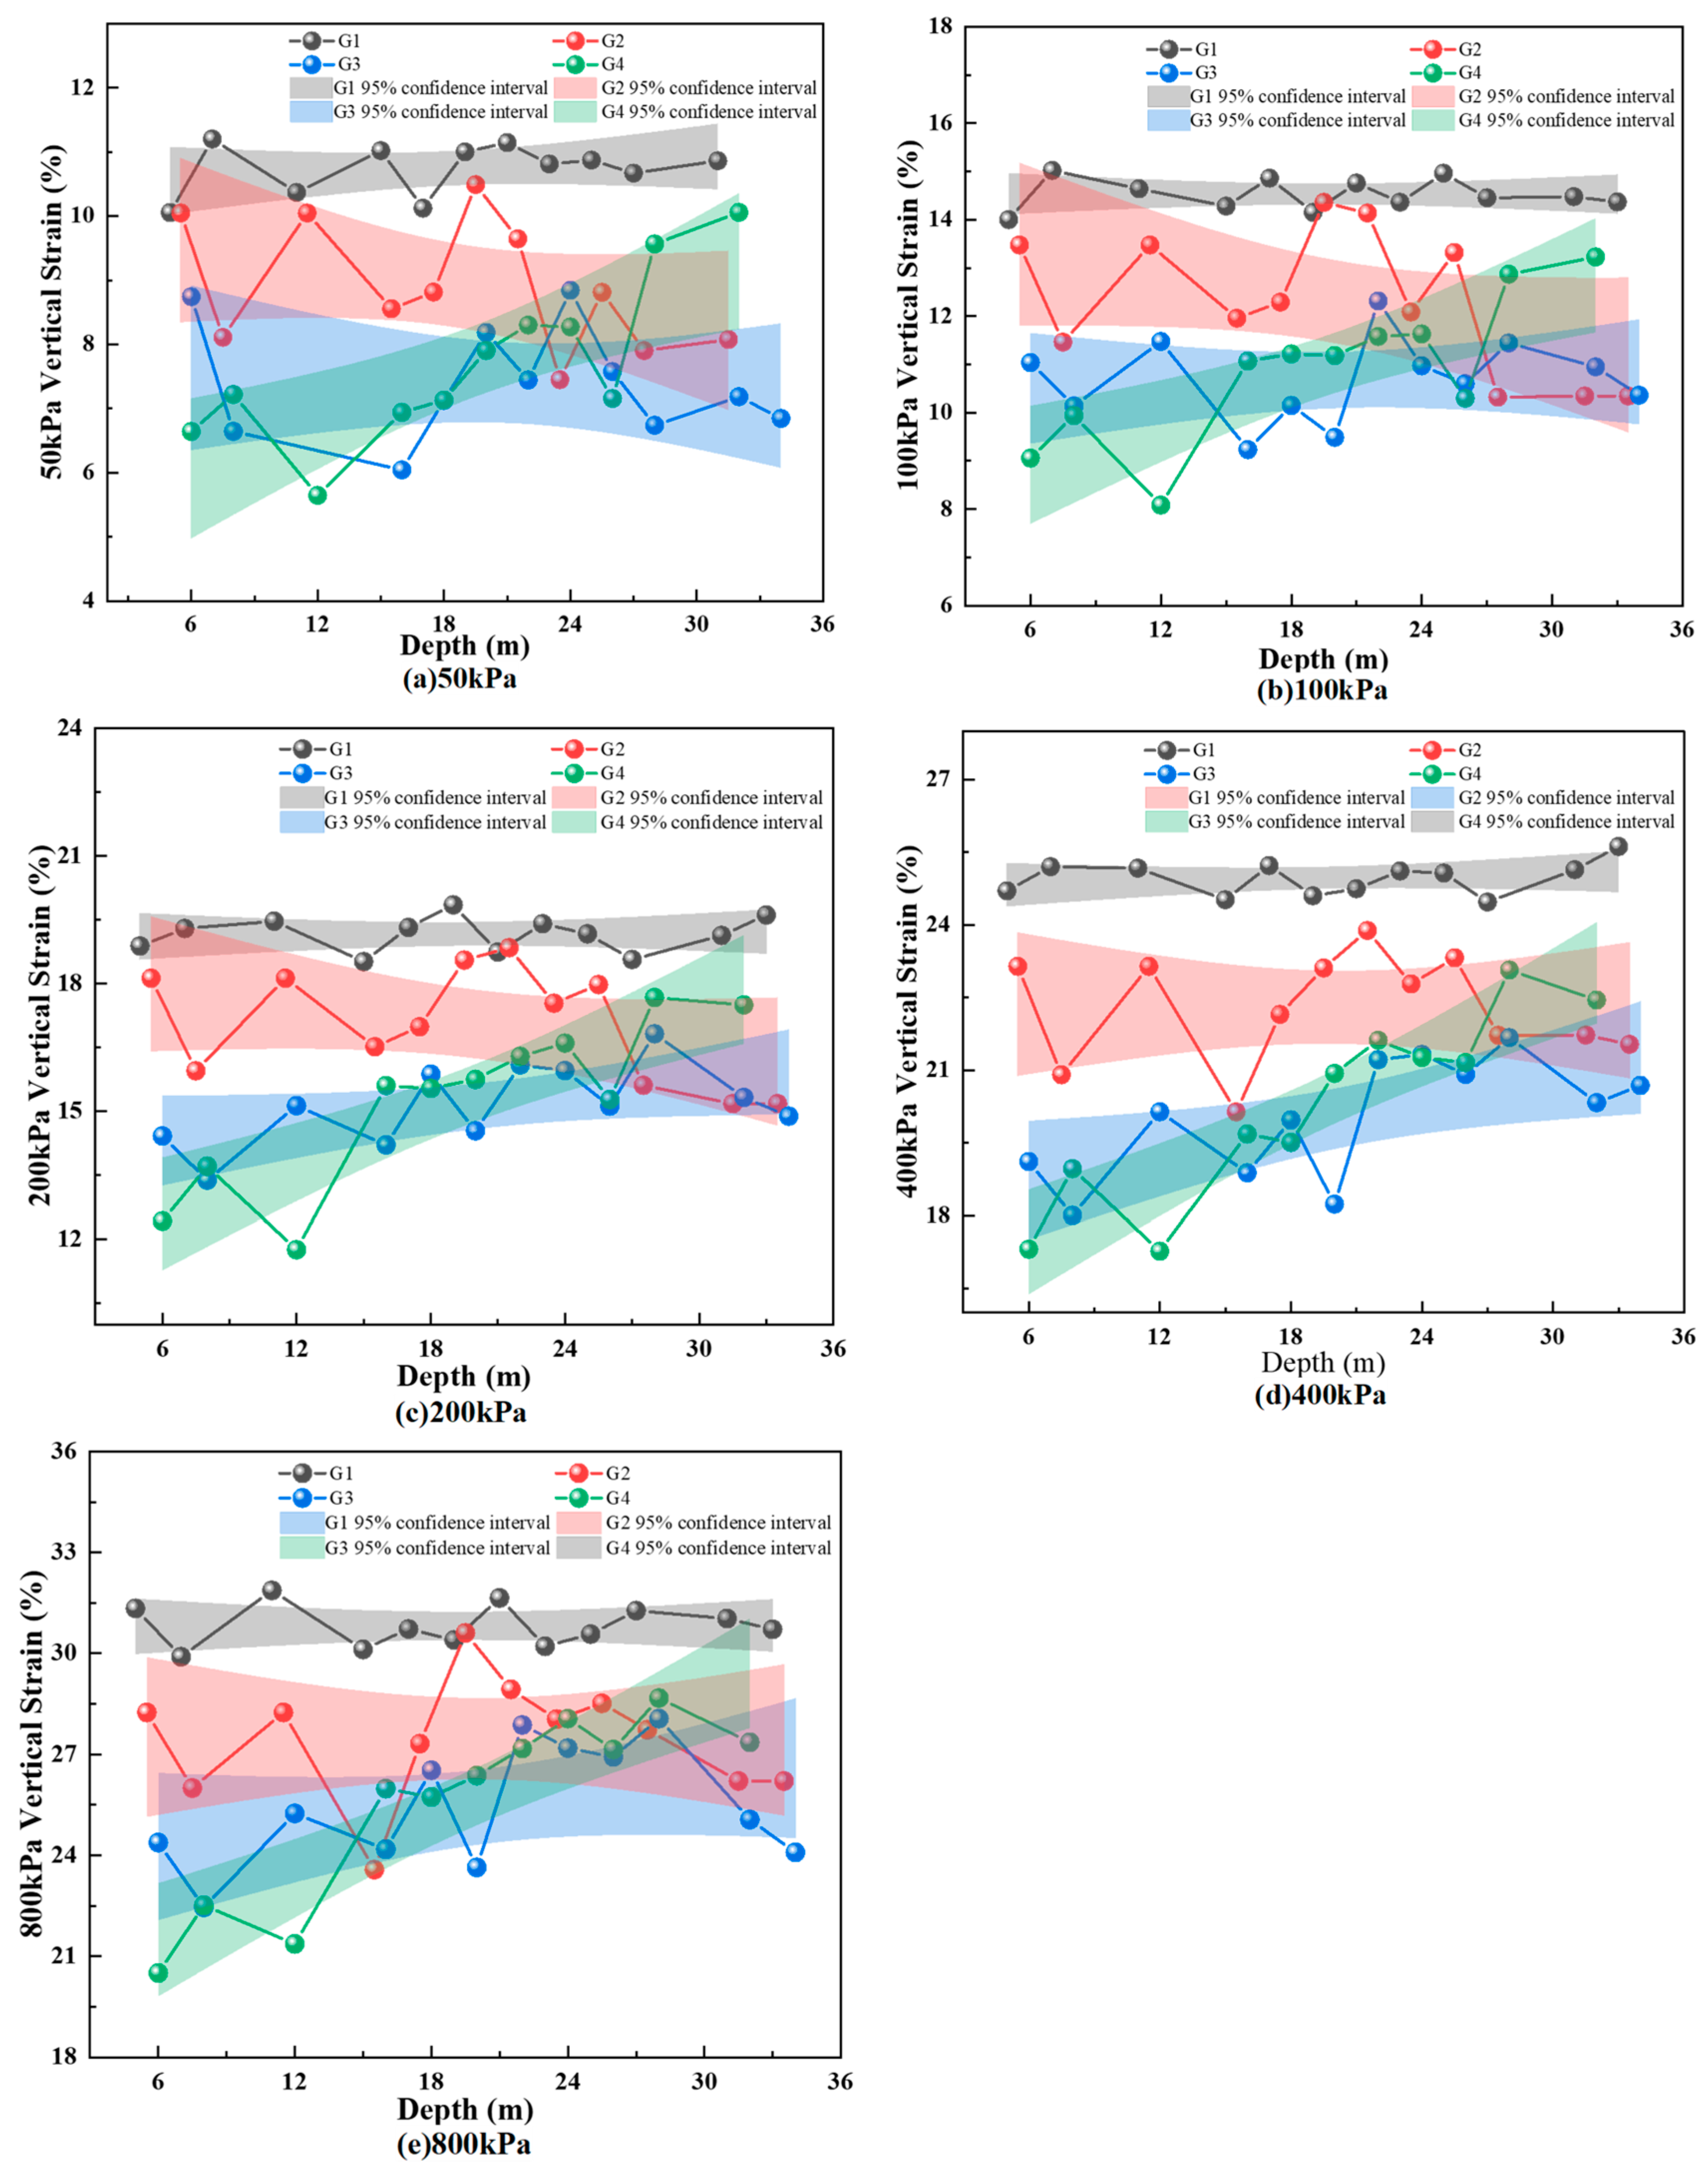
The 95% confidence bands shown in Figure 5 are derived from three parallel replicate specimens collected at each monitoring depth. For each depth, vertical strain data of three parallel samples are used to calculate sample mean and standard deviation; the 95% confidence interval is determined by the t-distribution for small sample size (n = 3), which reflects the random test variability of laboratory oedometer specimens.
The ±0.5 m uncertainty band for the 24 m strain reversal depth in Figure 2 originates from the deviation of curve intersection depths among seven different surcharge stages. The maximum difference between single-stage intersection depth and the average 24 m value is 0.5 m, representing the stage-to-stage interpolation uncertainty of field monitoring curves rather than instrument measurement error.

3.2. Evolution of Vertical Strain Under Consolidation Before and After Surcharging

All layered strain and pore-water pressure data from multi-borehole monitoring are analyzed by individual loading stage. Even though the holding duration differs across construction phases, consistent strain distribution reversal at the same depth and identical center-edge deformation discrepancy are captured under every surcharge level. Combined with indoor one-dimensional consolidation test results reflecting intrinsic soil properties, it can be confirmed that the observed deformation characteristics originate from the three-dimensional stress field formed by surcharge geometry, rather than the difference in inter-stage consolidation time.
Results in this section are divided into two categories: (1) Laboratory one-dimensional oedometer test results (graded compression strain, pre-consolidation pressure, compression indices of G1~G4 specimens), which characterize the inherent compression properties of soil elements under pure vertical drainage without lateral confinement; (2) Field layered monitoring strain data, which reflect the overall site deformation induced by surcharge load under combined effects of 3D stress diffusion, slope toe lateral extrusion and asymmetric stress field. All deformation laws summarized from field monitoring belong to three-dimensional site responses that cannot be fully reproduced by one-dimensional consolidation tests. Coupled analysis of the two datasets is conducted to distinguish intrinsic soil element properties and 3D site boundary effects.
All mechanistic conclusions regarding lateral extrusion, spatial asymmetric deformation, depth transition law and center-edge discrepancy are derived from field 3D monitoring data; conclusions about soil compressibility, water content, soil sensitivity, and evolution of consolidation parameters are obtained from laboratory one-dimensional consolidation tests and vane shear tests.
In accordance with GB/T 50123-2019 (Standards for Soil Testing Methods), interpretation of the e–log p curves indicates that the pre-consolidation pressure of G1 (undisturbed soil) falls in the range of 60–70 kPa; accordingly, the initial consolidation load was set to 50 kPa. Among the post-surcharge samples, G2 was taken from the site perimeter after completion of the surcharge works, G3 from the periphery of the surcharge crest, and G4 from the surcharge center.
As illustrated in Figure 5, the vertical strain curve of G1 lies below the curves of G2, G3, and G4 across the full investigated depth range, where the shaded band width in the figure represents the 95% confidence band, quantifying the estimation reliability of measured strain data. Distinct spatial differences in vertical strain characteristics exist above and below the critical transition depth of 24 m. The strain magnitude of the peripheral sampling position is more prominent in shallow strata, while the central position presents stronger compressive strain responses in deep strata, resulting in a complete reversal of the strain sequence with depth. This depth-dependent strain reversal is a three-dimensional field phenomenon controlled by surcharge geometry and stratum distribution, rather than a feature of one-dimensional soil compression. Meanwhile, the strain of the slope peripheral position decays more rapidly with increasing depth compared with the site perimeter position.
The 24 m depth is visually identified as the characteristic position where the vertical strain order of G2, G3, and G4 monitoring points reverses on strain-depth curves under all six surcharge levels. Limited by the field monitoring layout, parallel multi-depth measuring points with tiny spacing were not arranged, so precise regression fitting and quantitative sensitivity analysis of the transition depth could not be carried out in this paper. Nevertheless, the strain reversal feature near 24 m can be stably observed in all loading stages from 1.0 m to 6.0 m surcharge height, which proves that this depth is a typical deformation response of the stratum at the test site rather than an accidental data fluctuation. This empirical threshold is jointly controlled by the alternating distribution of silt and silty clay layers of the Wenzhou coastal site and cannot be directly applied to soft foundations with different stratigraphic structures.
For quantitative identification of the strain reversal depth under each surcharge stage, the strain–depth curves of G2, G3 and G4 are extracted at each surcharge height (1.0 m–6.0 m). The intersection depth of three strain curves under each loading stage is calculated separately, and the average value of all intersection depths across seven construction phases is 24 m, with a fluctuation range of ±0.5 m. This cross-curve intersection rule serves as the transparent operational definition for the 24 m empirical depth adopted in this study.
This phenomenon reveals a depth-dependent deformation pattern of the soft clay under surcharge loading. In the shallow layer (<24 m), the edge zone (G2) undergoes pronounced shear–plastic deformation due to weakened lateral confinement, with its strain mainly attributed to lateral extrusion.
In the deeper layer (>24 m), strain evolution is dominated by two distinct mechanical mechanisms. On one hand, stress diffusion below the surcharge center generates a more significant effective stress growth relative to the marginal zone and triggers continuous delayed compression of deep soil layers. On the other hand, the geometric shape of the surcharge embankment forms an asymmetric stress field, which causes obvious superposition of additional stress at the slope peripheral position within medium depths and brings a notable rise of the additional stress influence factor compared with the outer boundary position.
Overall, the results confirm a pronounced spatially asymmetric deformation response in surcharge preloading. Shallow deformation is dominated by boundary constraints, whereas deep deformation is closely linked to stress-transfer pathways and stratigraphic configuration. This finding provides a mechanistic basis for optimizing differential-settlement control in surcharge preloading projects.
The 24 m transition depth obtained from the strain-depth intersection curve is an empirical characteristic threshold dominated by the alternating marine silt and silty clay strata of this Wenzhou coastal test site. Subsequent stratigraphic parameter comparison and multi-stage loading verification prove that this depth maintains stable strain reversal characteristics under all six surcharge heights, but it cannot be directly extended to soft foundation projects with completely different stratigraphic combinations.

3.3. Coupled Development of Settlement and Pore-Water Pressure

To minimize interpretational bias arising from non-uniform time intervals between surcharge stages caused by construction scheduling, this study adopts a phase-based comparative framework. For each surcharge increment, the post-loading response is divided into a loading-triggered phase and a holding/evolution phase, within which the coupled evolutions of settlement and pore-water pressure are compared on a consistent basis.
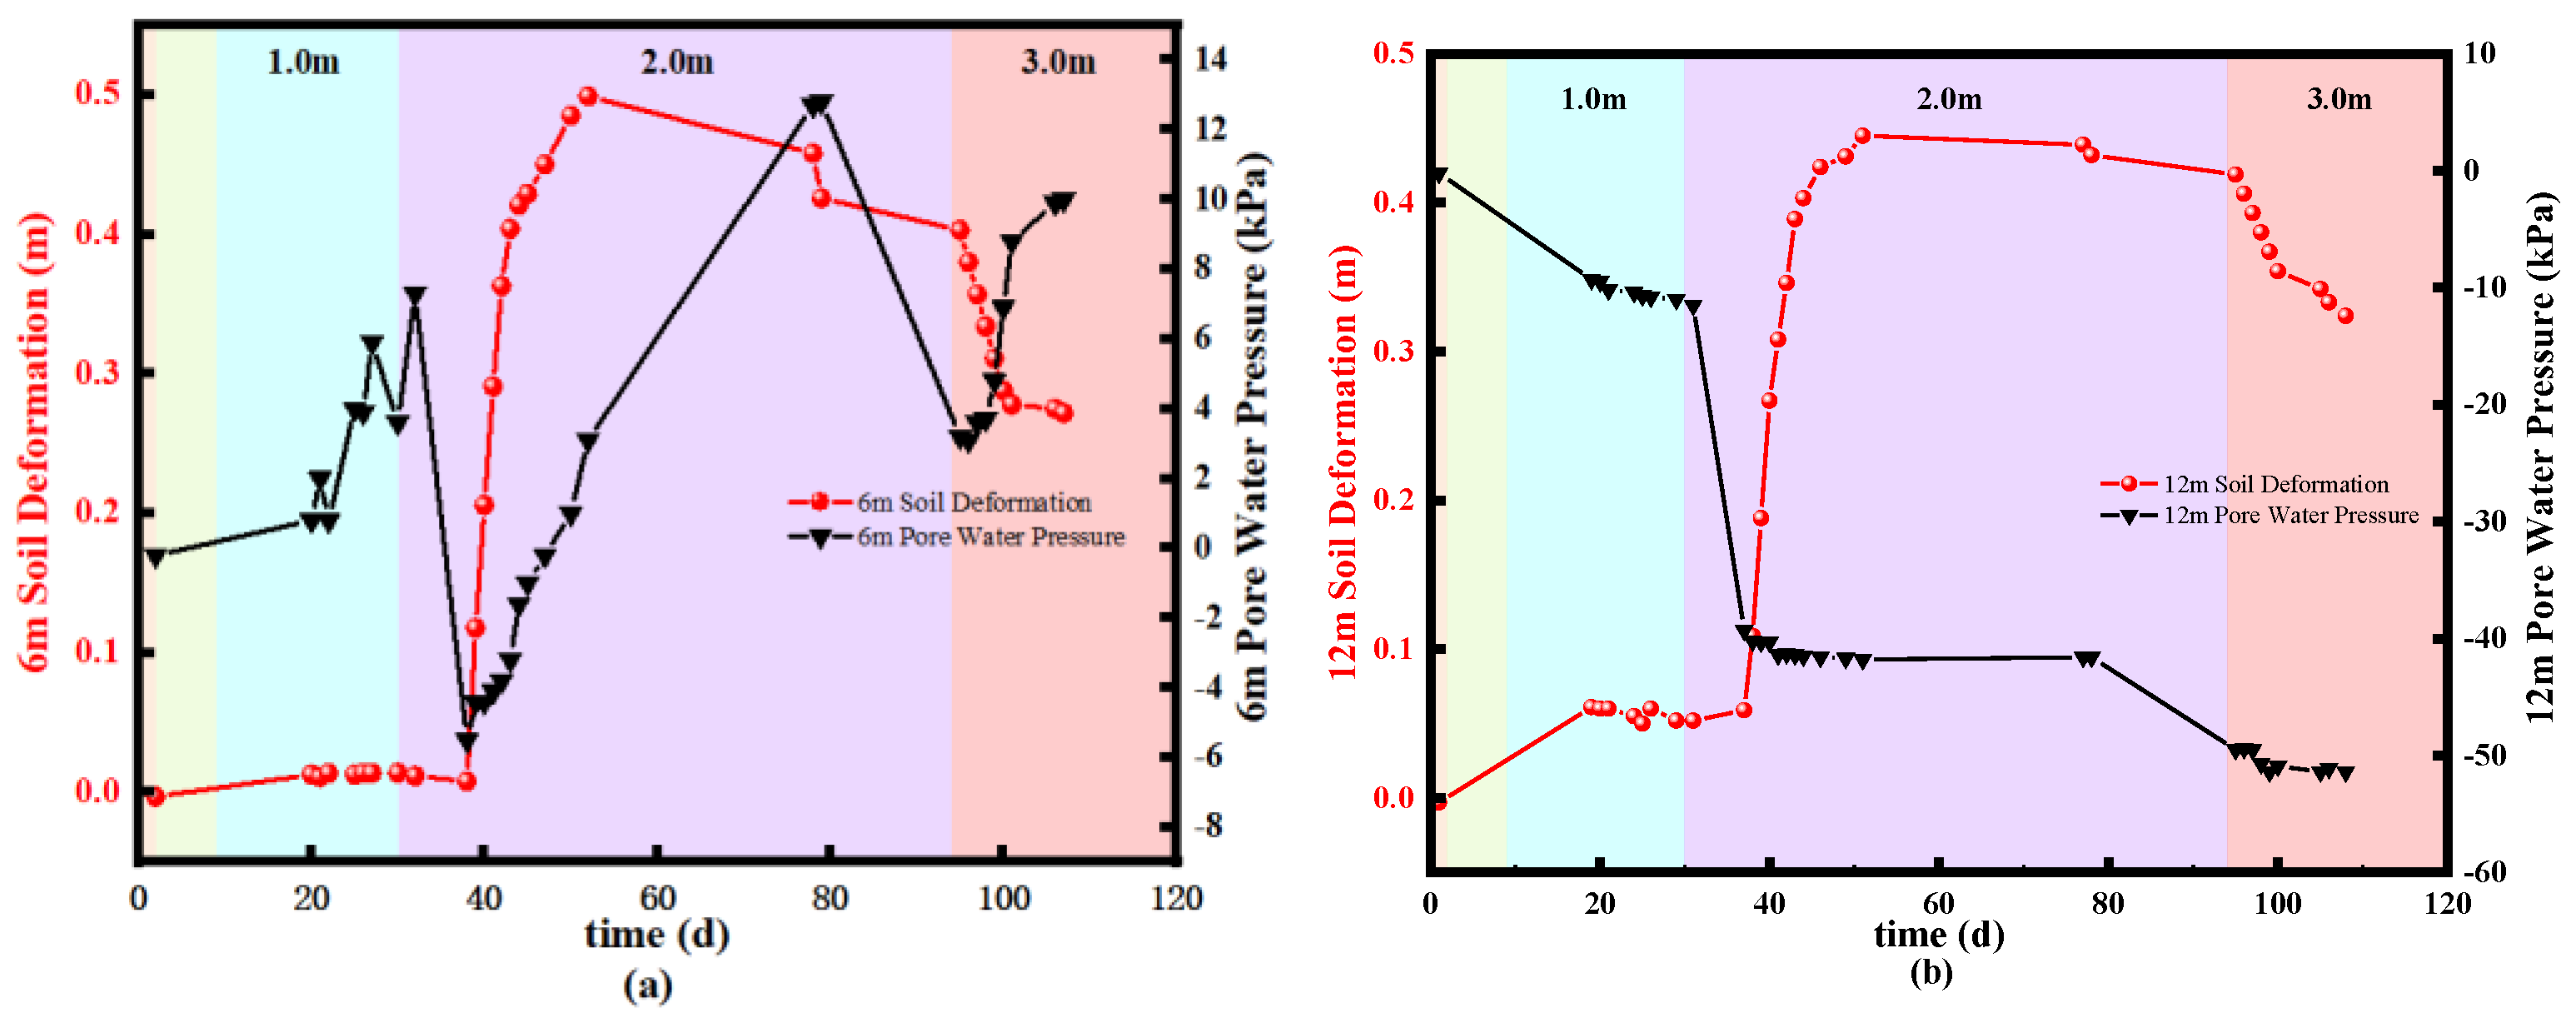
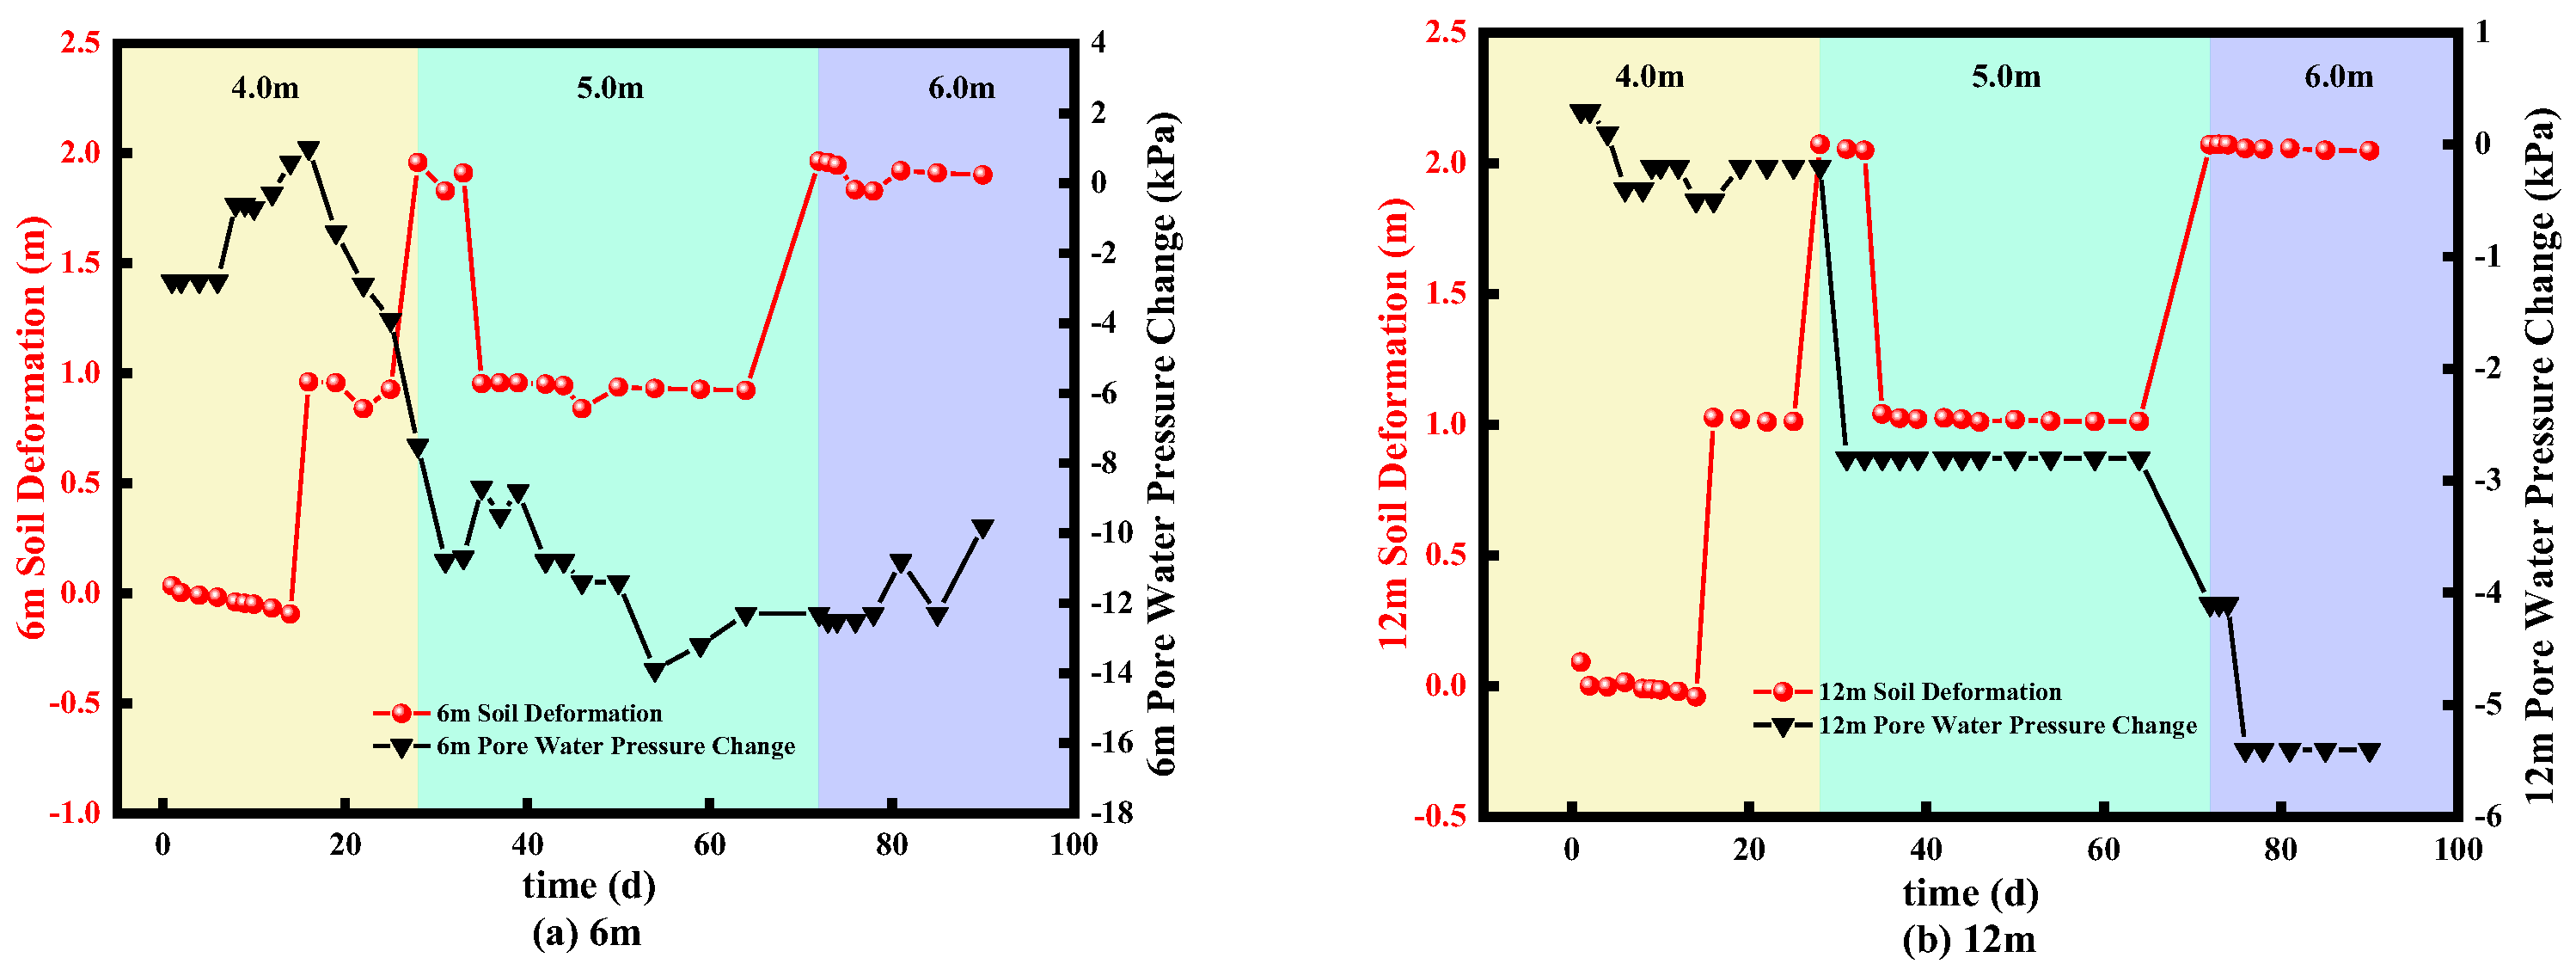
Figure 6 presents the relationship between settlement and pore-water pressure for the G4 specimens at depths of 6 m and 12 m. Focusing on the 6 m specimen (left panel), the soil deformation increases progressively, while pore-water pressure exhibits a fluctuating rising trend. According to Figure 6, during the first 40 days, the deformation is nearly zero, whereas the pore pressure rises with fluctuations and then drops abruptly at day 40. The inferred mechanism is as follows:
Transient negative pore-pressure signals are detected; plausibility check based on multi-depth identical piezometer data excludes long-term sensor drift, and Transient negative excess pore-pressure signals may arise from multiple potential factors: thixotropic structural damage of sensitive marine soft clay, transient local matric suction under rapid loading, sensor installation disturbance, and residual measurement uncertainty. Additional microstructural tests are required to quantitatively distinguish the dominant mechanism.
Under the initial 1.0 m surcharge, drainage had not yet occurred, so the surcharge was primarily carried by pore water. Consequently, excess pore-water pressure increased with fluctuations while the soil experienced only minor elastic deformation (for example, elastic compression of soil grains), rendering the observed settlement nearly zero. As time progressed, pore water began to dissipate along drainage paths around day 40; the excess pore pressure diminished, and effective stress increased. The rise in effective stress drove particle rearrangement; vertical deformation surged around day 40 and reached a maximum at approximately day 50.
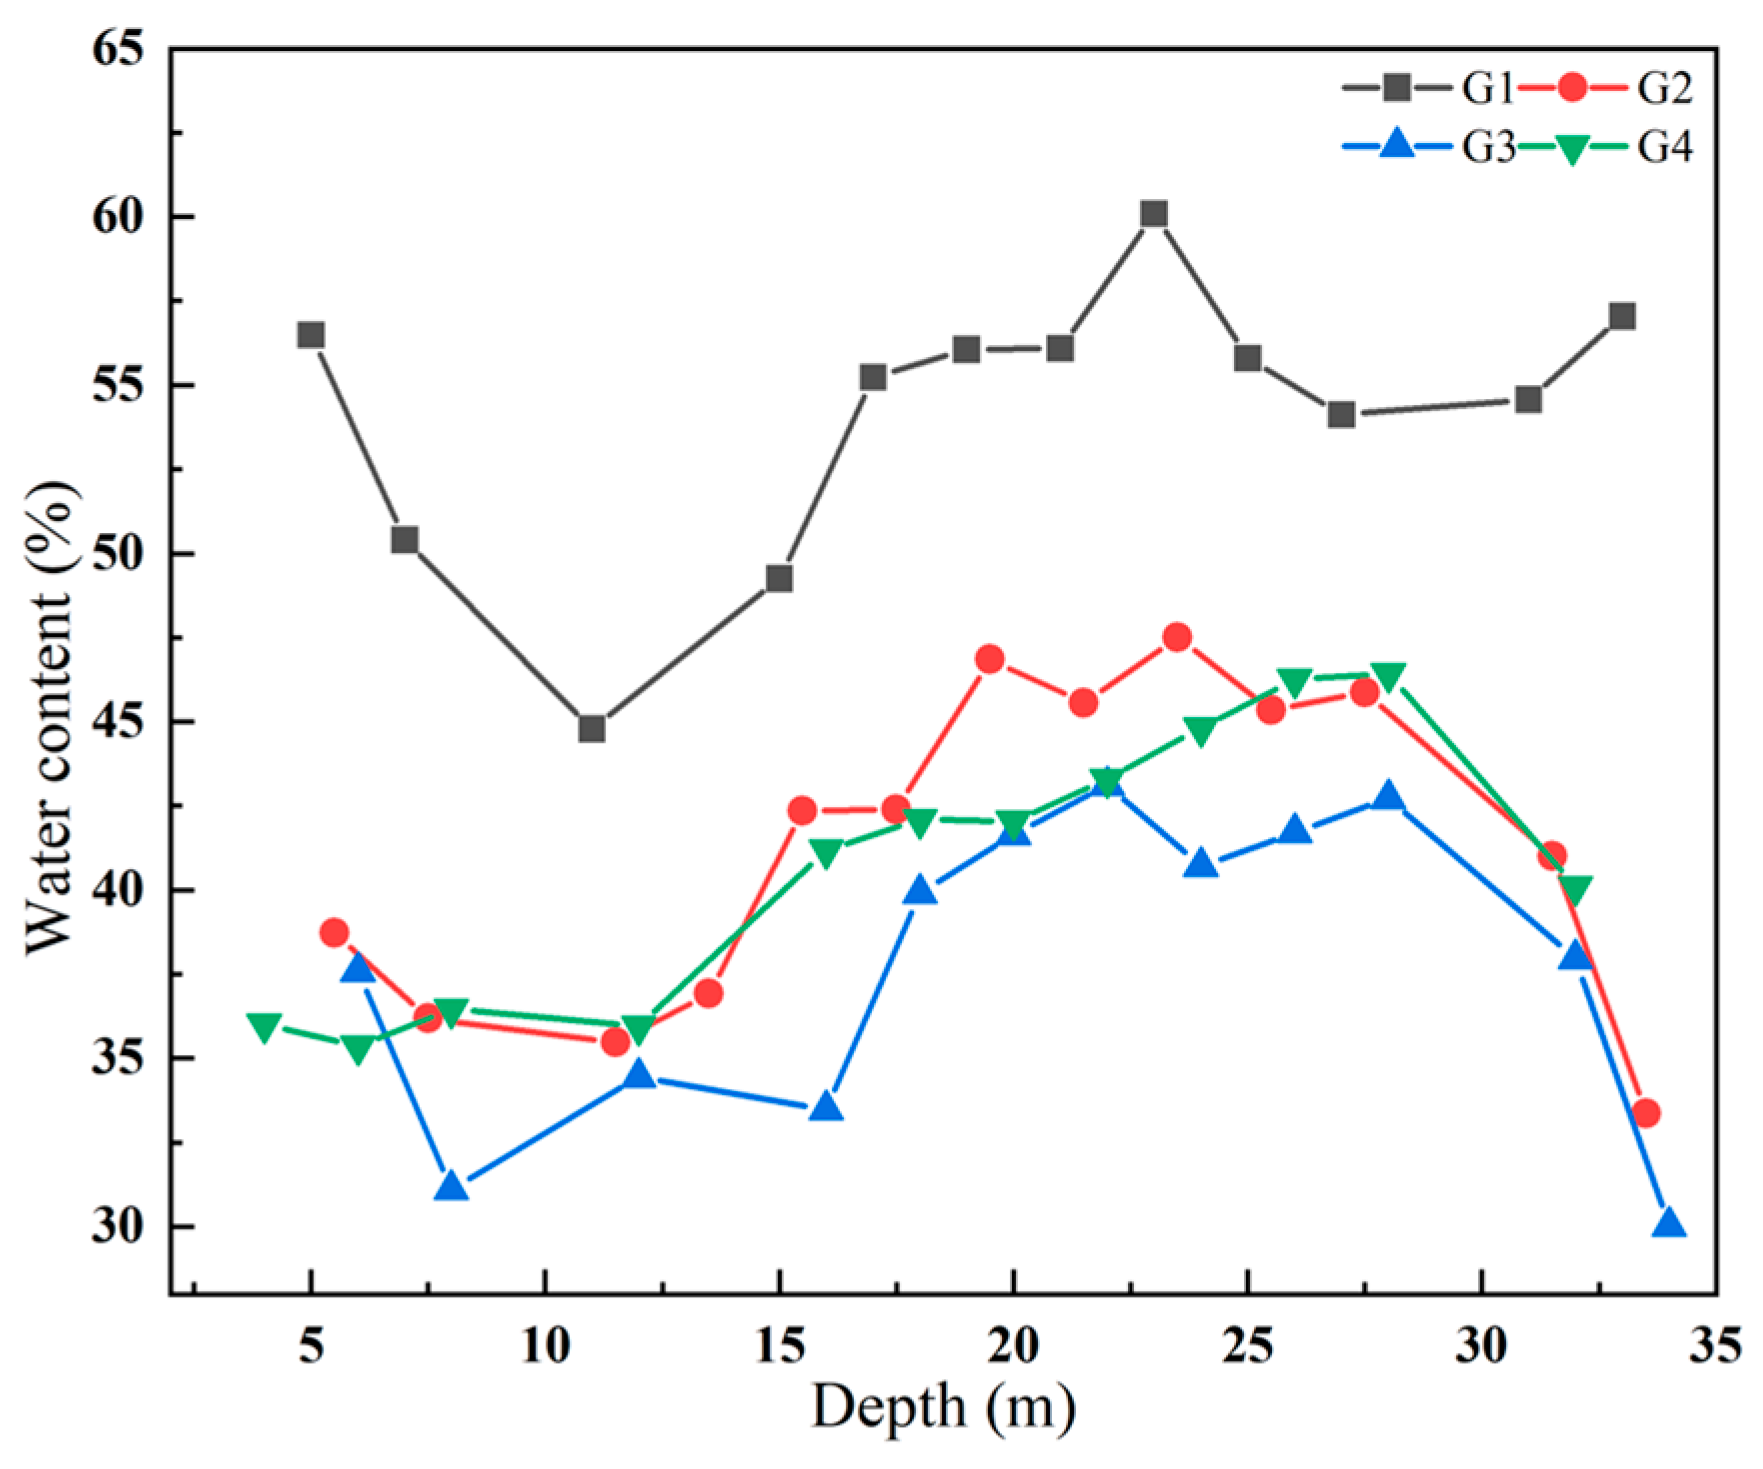
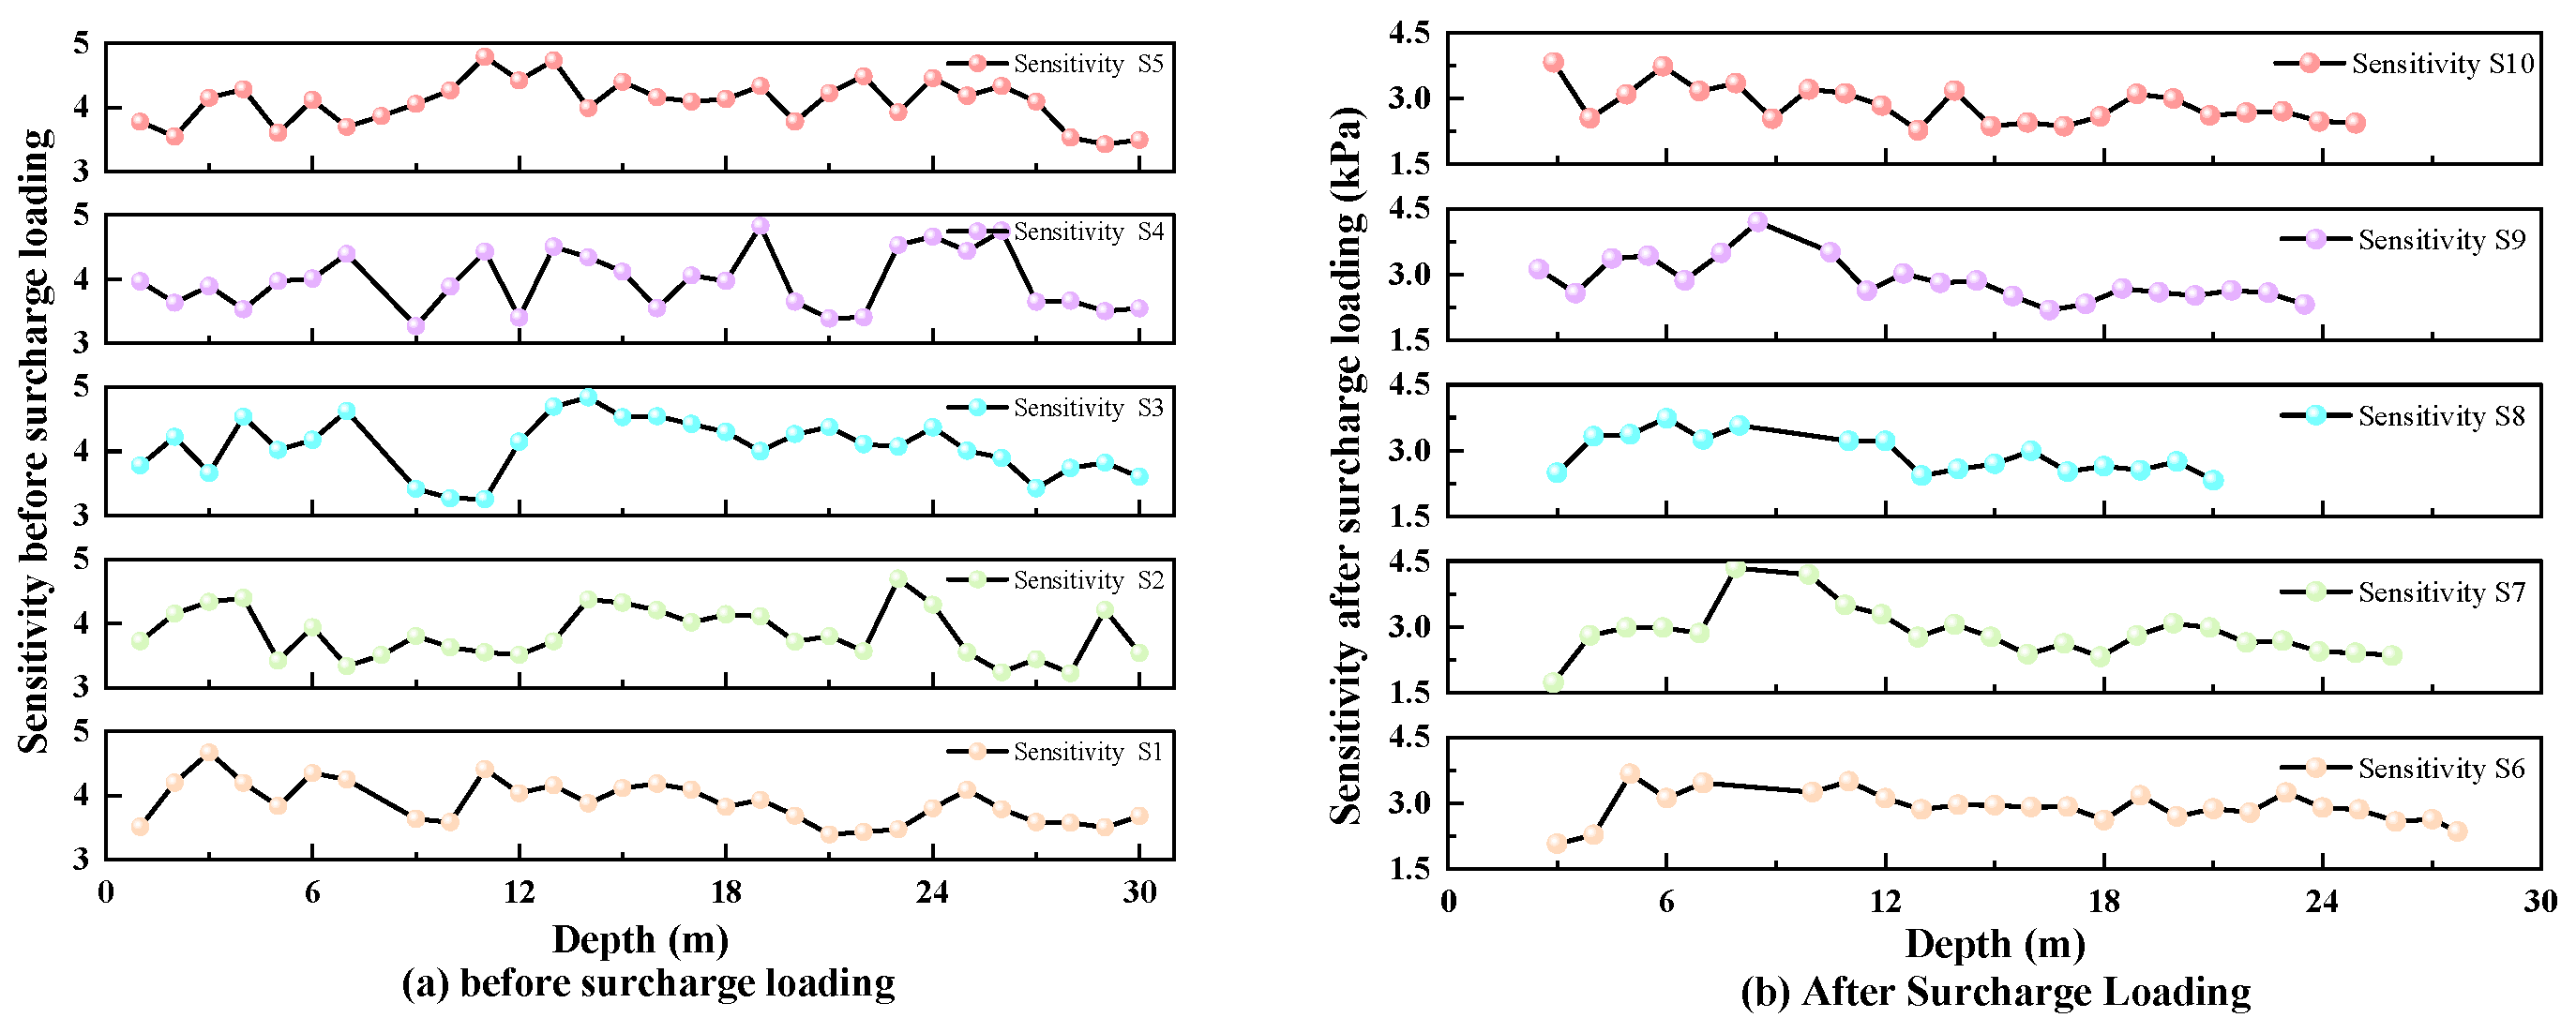
Figure 6 also shows that pore-water pressure decreases to negative values under surcharge loads lower than 2.0 m filling thickness. Figure 7 presents the difference in soil water content before and after surcharge preloading. Based on in-situ vane shear measurements implemented at ten sounding points within the 0–30 m depth range, Figure 8 reflects the variation of soil sensitivity before and after filling construction. The field test results reveal that the undisturbed soft soil belongs to highly sensitive clay with intact inter-particle cementation, accompanied by prominent structural characteristics. Under the disturbance induced by staged surcharge loading, the inherent skeleton structure of sensitive clay is damaged, and the soil transforms from a stable gel state to a dispersed sol state, thereby triggering typical thixotropic responses and producing a transient negative pore-water pressure signal during pressure dissipation.
All layered monitoring sensors were strictly calibrated before burial following GB/T 50123-2019, and regular in-situ inspection was conducted throughout the whole surcharge construction to reduce instrumental deviation. Although parallel duplicate sensors were not arranged at the same depth for quantitative statistical calculation, highly consistent variation patterns of strain and pore pressure were captured across G1–G4 boreholes at different depths and surcharge loads. The identical evolutionary characteristics at independent measuring positions confirm that the observed differences among locations, depths, and loading stages reflect the intrinsic asymmetric mechanical behavior of soft clay, instead of accidental measurement fluctuation.
Consistent with the variation law displayed in Figure 7, the in-situ water content of soft clay is generally higher before surcharge filling. The decline of water content after consolidation further modulates the basic mechanical properties of soil and indirectly affects the generation and dissipation characteristics of pore water pressure.
To further interpret the differences in pore-pressure–deformation responses from the perspective of soil state variables, Figure 7 presents the depth profiles of water content before and after surcharging, and Figure 8 compares the sensitivity profiles back-calculated from field vane shear tests. Overall, the post-surcharge water content is lower than the pre-surcharge values, and the sensitivity decreases from approximately 4.0 to approximately 3.0, with a more stable distribution along depth. These trends are consistent with the general understanding that surcharging weakens soil structure while promoting consolidation drainage, particle rearrangement, and subsequent structural re-stabilization. They therefore serve as supporting evidence for the processes of pore-pressure dissipation and settlement accumulation, although they are not treated as a single causal explanation in this study.
Figure 9 plots the settlement–pore-pressure relationship at depths of 6 m and 12 m during the 4–6 m surcharge stage. In conjunction with Figure 7 and Figure 8, it can be seen that the difference between settlement and pore pressure at 6 m fluctuates over time; ultimately, however, settlements converge to approximately 2.0 m, consistent with the continuity of deformation. Notably, pore-pressure dissipation at 6 m is about 10 kPa, whereas at 12 m it is only about 5 kPa.
According to Table 1 and the site context, the 6 m horizon consists of mud with a water content of 60.1% and a void ratio of 1.728, implying low strength and, under loading, substantial pore-pressure dissipation. By contrast, the 12 m horizon is a mud–sand mixture with a water content of 60.2% and a void ratio of 1.247, leading to slower dissipation. Moreover, surcharging has a stronger influence on shallow soils near 6 m. These factors jointly account for the marked difference in pore-pressure dissipation between the two depths.
In summary, Figure 6, Figure 7, Figure 8 and Figure 9 collectively indicate that, under staged surcharge preloading, pore-water pressure and settlement exhibit a pronounced phase-dependent coupled behavior. The shallow response is more sensitive to drainage boundaries and construction timing, whereas the deep response shows stronger lag effects and is more strongly governed by stratigraphic configuration. The stage-coupled evolution law of pore water pressure and layered deformation summarized in this section can provide direct data support for the optimization of staged surcharge schemes and stratified monitoring layout of coastal soft soil foundations.

3.4. Variation of Settlement Rate at Different Locations During Surcharging

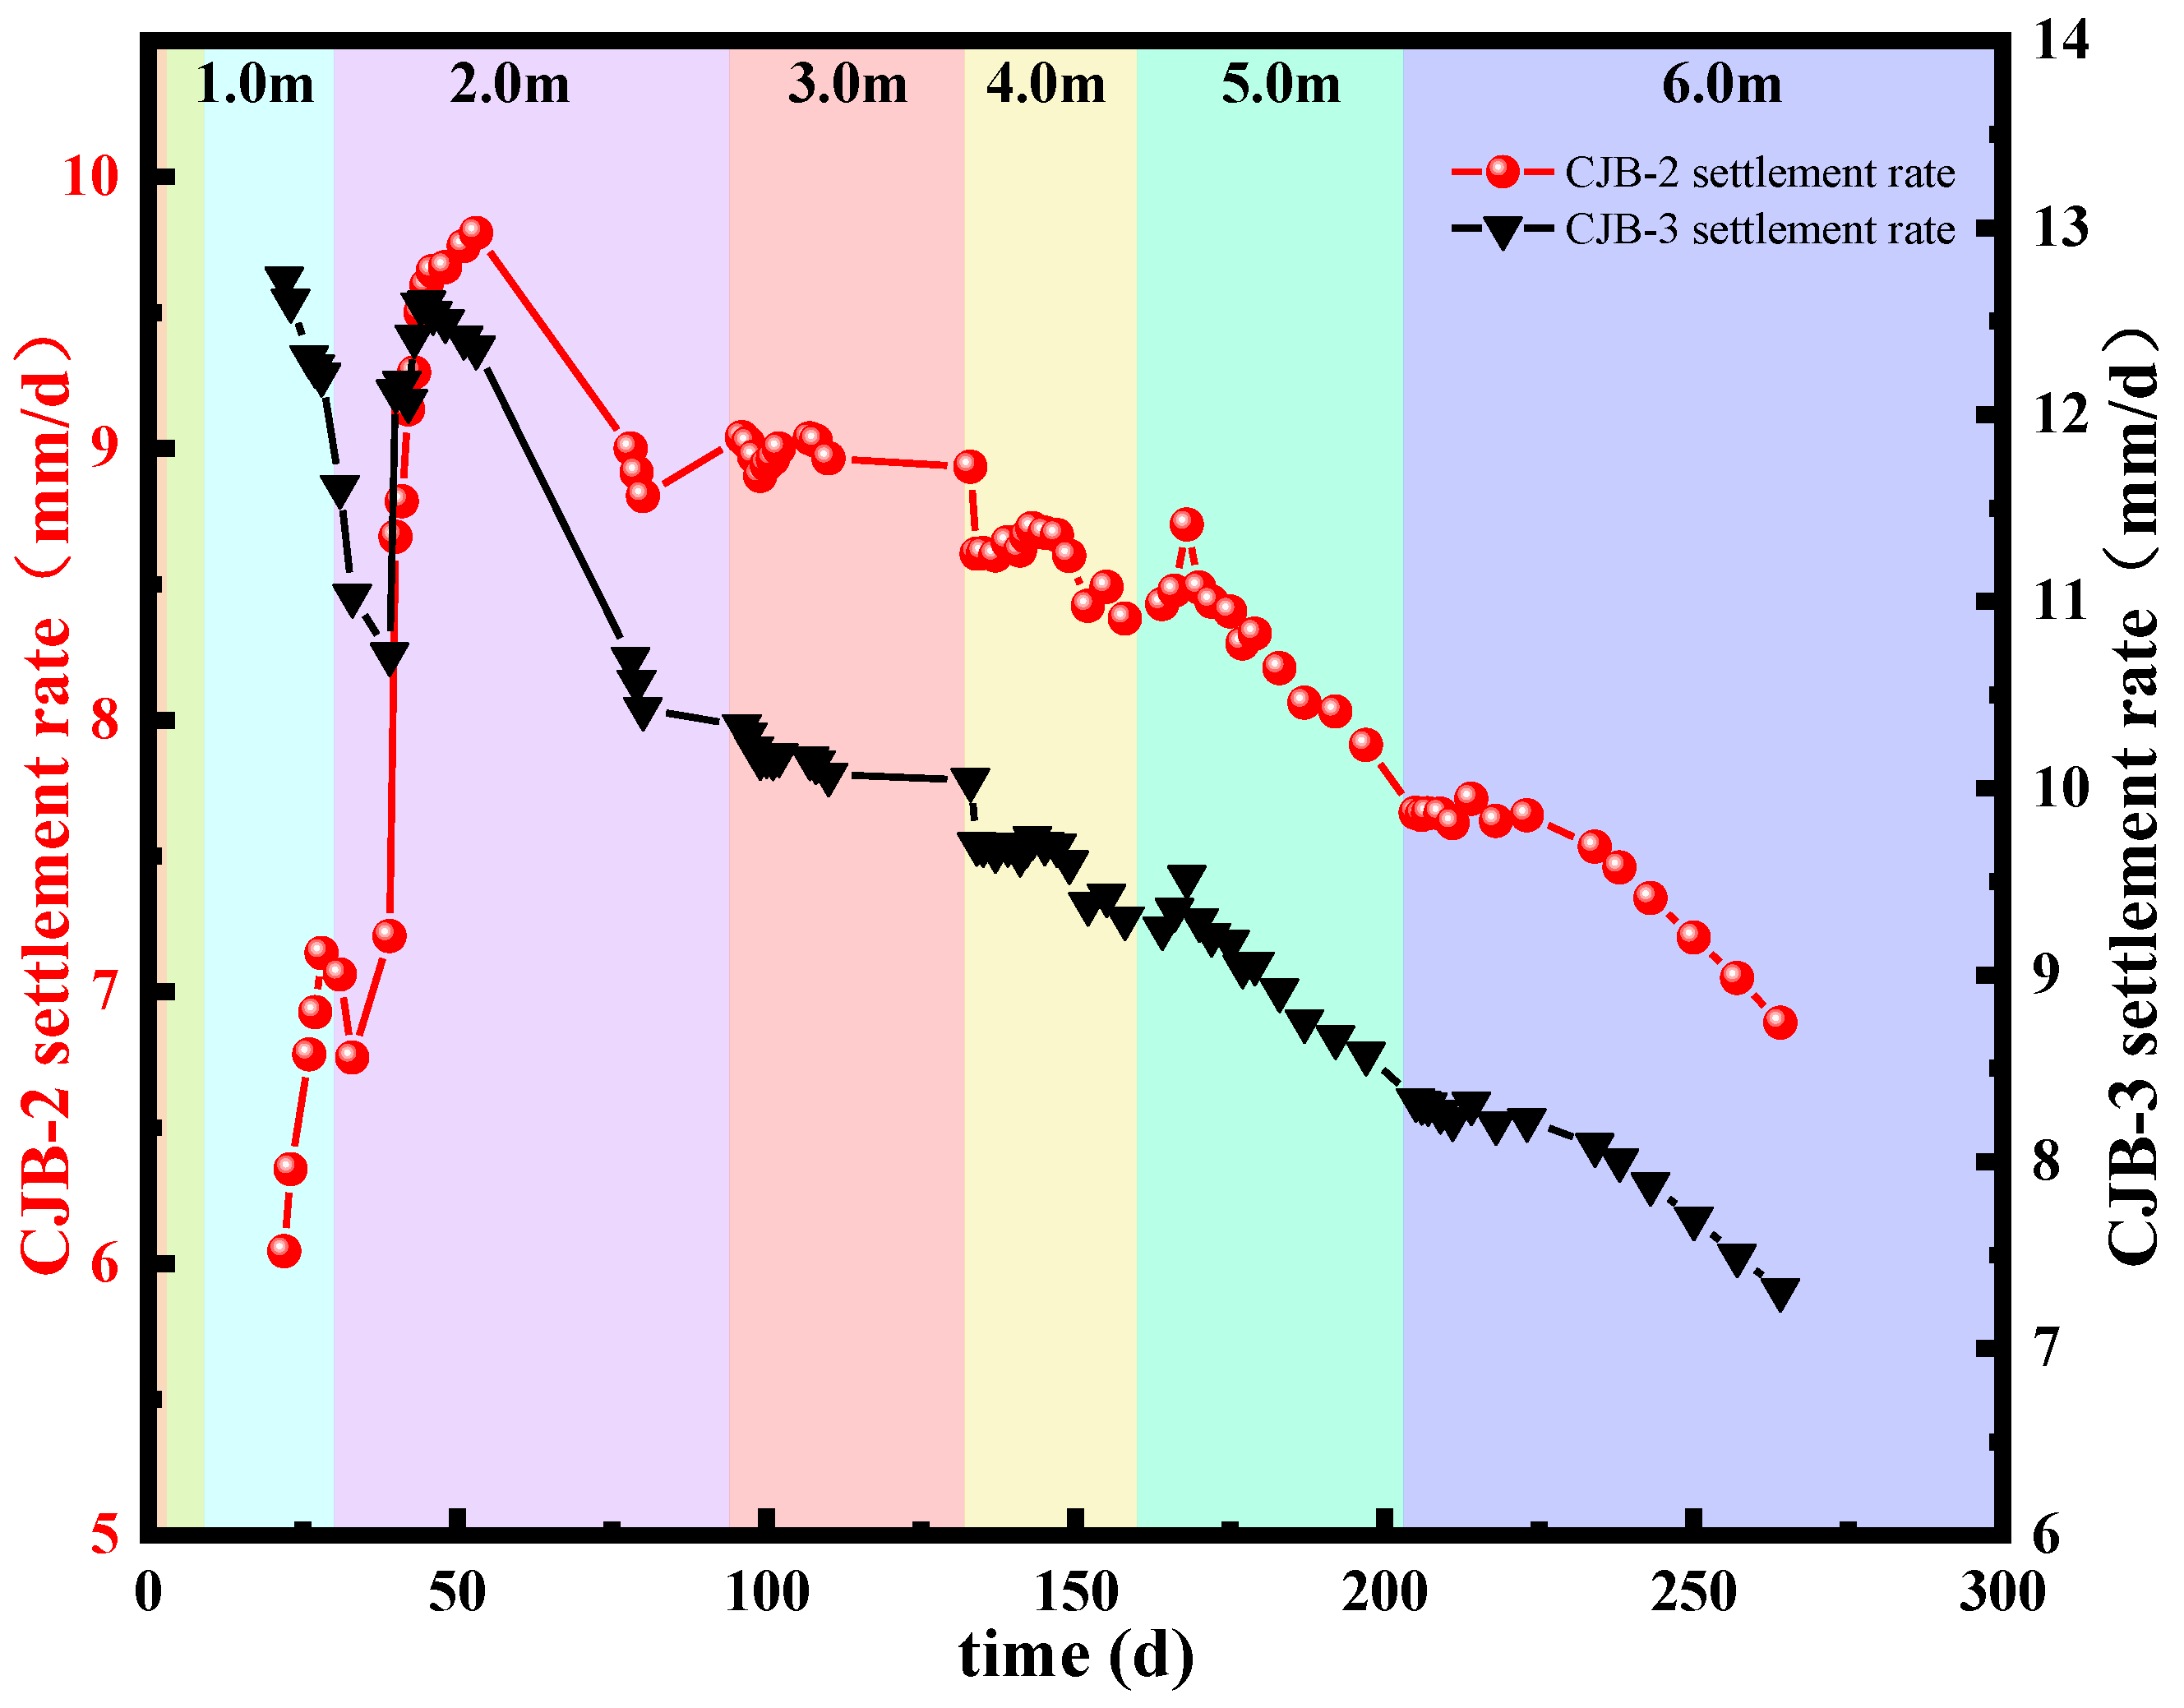
Previous analysis only qualitatively described the difference in settlement curves between the central monitoring point CJB-2 and marginal point CJB-3 based on Figure 10. To quantitatively distinguish the objective mechanical difference from subjective visual judgment, multiple characteristic settlement indices and normalized indicators are calculated from 264 days of full-process field data, as summarized in Table 1.
(1) Peak and average settlement rate
The peak instantaneous settlement rate and stage-averaged settlement rates at two monitoring points are listed in Table 2 for intuitive comparison. The peak instantaneous settlement rate reaches 66.0 mm/d at CJB-2 and 67.0 mm/d at CJB-3, both occurring on the loading day of the 2.0 m surcharge stage. After excluding the instantaneous loading peaks, the steady-state average settlement rate is 9.51 mm/d at CJB-2 and 9.36 mm/d at CJB-3, with an overall relative difference of −1.86%. Stage-by-stage comparison shows that the settlement rate difference between the two monitoring points gradually decreases with increasing surcharge height, from +3.56% under 1.0 m fill to −11.77% under 6.0 m fill.
The 66–67 mm/d values represent instantaneous settlement peaks on the loading day, reflecting immediate soil compression response rather than normal consolidation rate.
(2) Rate attenuation characteristics
Linear regression of settlement rate versus time yields an overall attenuation slope of −0.0447 mm/d2 for CJB-2 and −0.0466 mm/d2 for CJB-3. The slightly larger absolute attenuation slope at the margin indicates that settlement rate decays faster at the slope toe, which is consistent with the gradual weakening of lateral boundary extrusion effects during consolidation.
The overall attenuation slope of CJB-3 has a slightly larger absolute value than CJB-2 (−0.0466 vs. −0.0447), indicating that the settlement rate decays faster at the margin monitoring point, consistent with the gradual weakening of slope toe boundary effects over time.
To eliminate the interference of unequal loading duration and surcharge thickness and verify the reliability of deformation laws, stage-wise normalized settlement indices are further calculated. Table 4 shows cumulative settlement per unit surcharge height, and Table 5 lists the normalized daily settlement rate of each stage.
After normalization, margin settlement remains consistently larger than center settlement, and the difference gradually decreases with increasing surcharge (from 64% to 6%), confirming that boundary effects weaken with load depth and that conclusions are independent of surcharge height differences.
All three normalization methods show margin settlement larger than center settlement, with a stable difference of approximately 6%. This verifies that the center-margin settlement difference reflects a genuine mechanical response of the soil, not an artifact of unequal holding durations or surcharge heights.
(3) Convergence of settlement rates
After approximately 211 days of consolidation under staged surcharge preloading, the settlement rates of CJB-2 and CJB-3 converge to approximately 4.0 mm/d, with a rate difference of less than 0.5 mm/d. This convergence phenomenon confirms that the influence of three-dimensional boundary effects gradually diminishes with extended consolidation time, and one-dimensional consolidation compression gradually dominates the late-stage deformation behavior.
(4) Normalized verification
To eliminate the influence of unequal holding durations and surcharge heights, normalized settlement indicators are calculated. The final cumulative settlement per unit surcharge height is 303.0 mm/m at the center and 321.8 mm/m at the margin, with a stable relative difference of 6.22%. The average daily settlement per unit surcharge height is 1.148 mm/(d·m) for CJB-2 and 1.219 mm/(d·m) for CJB-3. Consistent results across multiple normalization methods verify that the center-margin settlement difference is an objective mechanical response induced by the asymmetric stress field, rather than an artifact of unequal loading schedules.
As shown in Figure 10, CJB-2 lies near the surcharge center, whereas CJB-3 is situated near the edge of the center. From Figure 9, the settlement rate at CJB-2 increases from 6 mm/d to 10 mm/d before the 2.0 m surcharge and subsequently decreases to 7 mm/d. At CJB-3, the rate drops from 12.5 mm/d to 10.5 mm/d following the 1.0 m surcharge and then gradually declines to 7 mm/d with continued loading.
The above quantitative differences derived from Table 4, Table 5, Table 6, Table 7, Table 8, Table 9 and Table 10 demonstrate that foundation settlement behavior exhibits obvious stage-dependent characteristics and significant spatial heterogeneity. At the early loading stage, the growth amplitude of settlement rate at central monitoring point CJB-2 is larger, which means the central zone bears greater vertical stress increment during surcharge application. This facilitates the rapid build-up of excess pore water pressure and produces substantial instantaneous deformation. In addition, the shallow high-water-content, highly compressible soft clay further magnifies the settlement rate response under initial loading. By contrast, CJB-3 at the embankment margin presents a higher settlement rate at the very beginning of preloading, which originates from prominent geometric boundary effects and intensive lateral deformation near the slope toe. Such spatial discrepancy belongs to a typical three-dimensional field response, which cannot be reproduced under the ideal lateral-restrained condition of laboratory one-dimensional consolidation tests. Although this interpretation agrees with the general consensus that embankment edges tend to generate outward lateral displacement and differential settlement, lateral displacement components are not quantitatively separated in this study. Therefore, the above analysis is only regarded as a trend-based inference instead of a definitive mechanical conclusion.
With the continuous rise of surcharge height and entry into long-term consolidation holding stage, the settlement rates of CJB-2 and CJB-3 decline steadily and finally converge to a close value. This phenomenon can be explained by the gradual dissipation of excess pore water pressure and the continuous growth of effective stress, where one-dimensional consolidation compression gradually becomes the dominant deformation mechanism. Meanwhile, the discrepancy of additional vertical stress and boundary interference between the central and marginal zones weakens over time, resulting in the gradual convergence of settlement rates. This stage-varying law further validates the two-stage pore pressure–deformation coupling evolution pattern proposed in this paper (loading-activated deformation stage + consolidation-dominated stage) and provides quantitative spatial and temporal characteristic indices for subsequent numerical model calibration and field monitoring comparison.
All settlement rate datasets adopted in this research are original readings from field layered settlement plates without artificial secondary computation. Combined with the quantitative indicators summarized in Table 4, Table 5, Table 6, Table 7, Table 8, Table 9 and Table 10, this study no longer relies purely on visual judgment of Figure 10 curves. The long-term divergent attenuation characteristics of settlement rates at CJB-2 and CJB-3 are cross-verified with layered vertical strain and pore water pressure data measured at the same depth and identical surcharge stages. The synchronous variation of multiple monitoring indices across all filling stages fully proves that the persistent spatial difference in settlement evolution between the two measuring points is an objective mechanical feature caused by asymmetric stress distribution of staged preloading, rather than a subjective conclusion obtained only from graphical observation.

4. Discussion

This study systematically analyzes multidimensional soil deformation under surcharge loading to reveal deformation mechanisms and spatial heterogeneity.
This study combines in-situ layered monitoring and indoor one-dimensional consolidation tests to distinguish two different mechanical responses of soft soil: the inherent compression characteristic of single soil element, and the three-dimensional asymmetric deformation induced by surcharge geometric stress field. Laboratory tests reflect vertical compression properties without lateral constraint, while field monitoring captures the comprehensive deformation, including lateral extrusion and differential settlement under actual boundary conditions.
Laboratory tests reflect vertical compression properties without lateral constraint, while field monitoring captures the comprehensive deformation, including lateral extrusion and differential settlement under actual boundary conditions. All laws derived from field monitoring are three-dimensional, site-specific responses beyond one-dimensional theoretical assumptions.
Consistent with laboratory consolidation tests and field monitoring, post-preloading soils (G2–G4) exhibit larger vertical strains than intact soil (G1) under identical consolidation conditions. This indicates that surcharge preloading significantly amplifies soil compressibility and induces stable spatial heterogeneity in compressibility across the test section.
The 24 m strain transition threshold is controlled by local alternating silt and silty clay strata, which provide clear guidance for the layout of layered monitoring points in coastal soft ground improvement. For shallow layers above 24 m, dense monitoring sensors should be arranged near the surcharge boundary to capture lateral extrusion deformation; deep monitoring focus should be placed on the central area to track long-term vertical compression. Although this 24 m critical depth cannot be generalized to other geological sites, the depth-dependent asymmetric deformation law summarized in this study can serve as a reference for similar marine soft soil preloading projects. For other sites with different soil layer distributions, the specific transition depth value will change, but the depth-dependent center-edge strain reversal pattern proposed in this research can provide a reference for monitoring layout and deformation prediction of similar soft ground improvement projects.
Above this depth, strain follows the order: edge (G2) > outer crest edge (G3) > center (G4), whereas the order reverses below 24 m. This transition depth is defined by intersections of strain-depth curves and is site-specific rather than universally applicable.
During staged surcharging up to 3.0 m, settlement at depths of 6 m and 12 m lags behind pore-water pressure evolution. In the initial loading phase, pore pressure fluctuates sharply with minor settlement increments; as excess pore pressure dissipates, settlement accelerates, marking a shift from pore-pressure-supported loading to effective-stress-dominated consolidation compression. Transient negative excess pore water pressure was observed throughout all staged loading periods. As illustrated in Section 3.2, this phenomenon is mainly induced by the thixotropic structural failure of sensitive soft clay, while instrument interference only plays a secondary role. Further microstructural tests are required to quantitatively reveal its internal microscopic mechanism.
In the initial loading stage, the slope toe area presents a larger settlement rate due to unconstrained lateral extrusion of shallow, high-compressibility soft clay. With continuous consolidation, excess pore water pressure dissipates uniformly within the foundation, and the asymmetric boundary effect is weakened. Consequently, the settlement rates of central and marginal monitoring points gradually converge, and consolidation compression becomes the dominant deformation control factor in the later maintenance stage.
After multi-stage surcharge preloading, the water content and sensitivity of marine soft clay drop significantly (sensitivity reduces from 4.0 to 3.0). The declined soil sensitivity indicates that preloading can reconstruct the soil skeleton and effectively restrain long-term creep deformation of sensitive coastal soft clay.

5. Conclusions

The key conclusions are summarized as follows:
1. Confirmed finding from laboratory one-dimensional consolidation tests: Surcharge preloading substantially increases soft-soil compressibility and generates stable spatial heterogeneity in compressibility, which is quantitatively verified by indoor oedometer test results.
2. Field-scale empirical observation (not a universal mechanical threshold, only from site monitoring): An empirical strain reversal depth of approximately 24 m is observed exclusively in this Wenzhou soft soil site, at which the ranking of vertical strain magnitudes between surcharge center and margin reverses; this depth is controlled by local interbedded strata and cannot be generalized to other soft soil sites. This three-dimensional spatial phenomenon cannot be reproduced by ideal one-dimensional consolidation tests without lateral deformation.
3. Mixed result (Stage evolution verified by field monitoring; negative pore pressure mechanism unvalidated inference): Pore-pressure-deformation coupling is stage-dependent, which is captured via field layered monitoring data; soil deformation shifts from excess-pore-pressure-bearing to effective-stress-controlled consolidation compression. The dominant physical mechanism causing transient negative pore-water pressure remains unconfirmed and requires further microstructural laboratory verification.
4. Confirmed quantitative finding from field monitoring: Boundary effects weaken with preloading duration, leading to convergence of center-edge settlement rates, and consolidation compression governs late-stage deformation. This spatial difference originates from the three-dimensional asymmetric stress field of the embankment and cannot be reflected by one-dimensional oedometer tests.
5. Confirmed finding from laboratory one-dimensional consolidation and in-situ soil tests: Surcharge preloading effectively reduces the water content of coastal soft soil and decreases soil sensitivity from approximately 4.0 to 3.0, realizing the stabilization of the soil’s internal structure. The water content and sensitivity indices are measured via indoor geotechnical tests on undisturbed soil specimens.

Author Contributions

Conceptualization, methodology, supervision, P.Z., J.T. and W.Y.; data curation, formal analysis, P.Z., Y.Z. and J.Z.; investigation, writing—original draft, J.T., P.Z. and Z.W.; writing—review and editing, P.Z., J.T. and Z.W.; project administration, M.W.; funding acquisition, M.W. and W.Y. All authors have read and agreed to the published version of the manuscript.

Funding

This study was financed and jointly supported by (1) the National Natural Science Foundation of China (Grant No. 52508418) and (2) the “Pioneer” and “Leading Goose” R&D Program of Zhejiang, funded by the Zhejiang Provincial Department of Science and Technology (Grant No. 2024C03126).

Data Availability Statement

The datasets supporting the conclusions of this study include field surcharge monitoring data (e.g., pore-water pressure, settlement rate, layered deformation) and geotechnical laboratory test data (e.g., soil moisture content, vane shear strength, consolidation parameters) of soft soil. All raw monitoring time-series data, processed plotting datasets, and laboratory test records are strictly confidential under the proprietary engineering agreement of the project owner. No subsets of anonymized or desensitized plotting data can be separately provided to external reviewers or researchers. Access to any form of project-related data is only permitted upon formal written application to the project owner, followed by authorized approval from the engineering management unit and subsequent contact with the corresponding author.

Acknowledgments

The authors appreciate the construction team of Ouchi seawall for field test support, and the laboratory technicians for their assistance in geotechnical tests.

Conflicts of Interest

Authors Yapeng Zhang and Mingyuan Wang were employed by the company Power China Hua Dong Engineering Corporation Limited. Authors Pan Zhao and Jianhui Zhao were employed by the company Zhejiang Engineering Research Center of Green Mine Technology and Intelligent Equipment. Authors Junhao Tian, Zhe Wang, and Wangjing Yao were employed by the Zhejiang University of Technology College of Civil Engineering. The authors declare no conflicts of interest. The authors declare that they have no known competing financial interests or personal relationships that could have appeared to influence the work reported in this paper.

References

  1. Li, H.; Zhou, J.; Guo, L.; Bai, Z.; Chen, F.; Sun, Y. Deformation and non-coaxial characteristics of soft marine clay subjected to wave load in a seabed of finite thickness. Ocean Eng. 2025, 323, 120650. [Google Scholar] [CrossRef]
  2. Wang, Y.; Wang, T.; Wang, J. A nonlinear rheological model of soft clay and its application to Tianjin littoral area. Rock Soil Mech. 2009, 30, 2679–2689. [Google Scholar] [CrossRef]
  3. Lu, Y.; Meng, K.; Wu, Y.; Zhou, R.; Cheng, H.; Dong, Y.; Zhang, J.; Jin, T. Deformation Behavior of River Sediment Under Vacuum–Air-Bag Preloading Toward Resource Utilization. Buildings 2025, 15, 4396. [Google Scholar] [CrossRef]
  4. Elkateb, T. Stress-dependent consolidation characteristics of marine clay in the Northern Arabian Gulf. Ain Shams Eng. J. 2018, 9, 2291–2299. [Google Scholar] [CrossRef]
  5. Wang, J.; Anda, R.; Fu, H.; Hu, X.; Li, X.; Cai, Y. Vacuum consolidation of dredged slurry improved by horizontal drainage-enhanced geotextile. Geosynth. Int. 2024, 31, 1036–1046. [Google Scholar] [CrossRef]
  6. Park, J.-M.; Jo, Y.-S.; Jang, Y.-S. Reliability Assessment of Geotechnical Structures on Soils improved by Deep Mixing Method I: Data Collection and Problem Setting. KSCE J. Civ. Eng. 2019, 23, 63–73. [Google Scholar] [CrossRef]
  7. Hatanaka, M.; Feng, L.; Matsumura, N.; Yasu, H. A Study on the Engineering Properties of Sand Improved by the Sand Compaction Pile Method. Soils Found. 2008, 48, 73–85. [Google Scholar] [CrossRef]
  8. Kitazume, M. Recent Development and Future Perspectives of Quality Control and Assurance for the Deep Mixing Method. Appl. Sci. 2021, 11, 9155. [Google Scholar] [CrossRef]
  9. Liao, J.; Xu, S.; Zhang, C.; Bai, G.; Li, T. Experimental study on the consolidation characteristics of soilbags-reinforced soft soil foundation with surcharge preloading. Case Stud. Constr. Mater. 2025, 22, e04746. [Google Scholar] [CrossRef]
  10. Liu, H.; Hu, S.; Hassan, A. Test study on creep characteristics of soft clayey soils under consolidation by vacuum-surcharge combined preloading method. Yantu Lixue/Rock Soil Mech. 2008, 29, 6–12. [Google Scholar]
  11. Zhou, S.; Shan, Y.; Wang, B.; Wang, C.; Wang, J.; Li, J. Semianalytical Model of Unloading-Induced Pore-Water Pressure and Consequent Consolidation Settlement of Surcharge Preloading Railway Subgrade. Int. J. Geomech. 2022, 22, 04022188. [Google Scholar] [CrossRef]
  12. Zhang, J.; Qian, J.; Zhang, H.; Han, L.; Cao, J.; Li, J. Numerical analysis of oversized deep soft foundation improved by plastic drainge plates combined with surcharge preloading. Chin. J. Geotech. Eng. 2013, 35, 892–896. [Google Scholar]
  13. Li, G.; Tao, Y.; Yin, Z. Study of mechanism about surcharge preloading method on the soft ground of highways. Chin. J. Geotech. Eng. 2006, 28, 896–901. [Google Scholar]
  14. Mesri, G.; Stark, T.D.; Ajlouni, M.A.; Chen, C.S. Secondary Compression of Peat with or without Surcharging. J. Geotech. Geoenviron. Eng. 1997, 123, 411–421. [Google Scholar] [CrossRef]
  15. Ong, C.; Chai, J. Lateral displacement of soft ground under vacuum pressure and surcharge load. Front. Archit. Civ. Eng. China 2011, 5, 239–248. [Google Scholar] [CrossRef]
  16. Fan, L.; Xun, Z.; Peng, S. A Comparative Case Study on Drainage Consolidation Improvement of Soft Soil under Vacuum Preloading and Surcharge Preloading. Appl. Sci. 2023, 13, 5782. [Google Scholar] [CrossRef]
  17. Chai, J.; Miura, N. Investigation of Factors Affecting Vertical Drain Behavior. J. Geotech. Geoenviron. Eng. 1999, 125, 216–226. [Google Scholar] [CrossRef]
  18. Chai, J.; Rondonuwu, S.G. Surcharge loading rate for minimizing lateral displacement of PVD improved deposit with vacuum pressure. Geotext. Geomembr. 2015, 43, 558–566. [Google Scholar] [CrossRef]
  19. Wang, J.; Yuan, W.; Yin, X.; Li, W.; Li, X. One-Dimensional Consolidation Properties of Soft Clay under Multi-Stage Loading. Appl. Sci. 2023, 13, 10340. [Google Scholar] [CrossRef]
  20. Indraratna, B.; Rujikiatkamjorn, C.; Ameratunga, J.; Boyle, P. Performance and Prediction of Vacuum Combined Surcharge Consolidation at Port of Brisbane. J. Geotech. Geoenviron. Eng. 2011, 137, 1009–1018. [Google Scholar] [CrossRef]
  21. Rujikiatkamjorn, C.; Indraratna, B.; Chu, J. 2D and 3D Numerical Modeling of Combined Surcharge and Vacuum Preloading with Vertical Drains. Int. J. Geomech. 2008, 8, 144–156. [Google Scholar] [CrossRef]
  22. Wu, J.; Xuan, Y.; Deng, Y.; Li, X.; Zha, F.; Zhou, A. Combined vacuum and surcharge preloading method to improve Lianyungang soft marine clay for embankment widening project: A case. Geotext. Geomembr. 2021, 49, 452–465. [Google Scholar] [CrossRef]
  23. Zhang, Z.; Ye, G.-B.; Xu, Y. Comparative analysis on performance of vertical drain improved clay deposit under vacuum or surcharge loading. Geotext. Geomembr. 2018, 46, 146–154. [Google Scholar] [CrossRef]
Figure 1. Schematic map of the sampling location area.
Applsci 16 06815 g001
Figure 2. Field surcharge loading construction scheme (The red dashed line marks the empirical 24 m strain reversal depth with ±0.5 m uncertainty band, which is averaged from curve intersection points under all surcharge stages and is only applicable to the local stratum.) (G1 = intact undisturbed soil before surcharge; G2 = slope toe margin; G3 = surcharge shoulder; G4 = surcharge center. Grey dashed line marks the empirical 24 m strain transition depth with ±0.5 m uncertainty band.) All deformation rules reflected in this cross-section belong to three-dimensional field responses under surcharge loading, which differ from ideal one-dimensional compression conditions.
Applsci 16 06815 g002
Figure 3. Schematic diagram of field boreholes.
Applsci 16 06815 g003
Figure 4. Intelligent pneumatic medium-pressure consolidometer apparatus.
Applsci 16 06815 g004
Figure 5. Vertical strain versus depth (Shaded regions denote 95% confidence bands calculated from triplicate laboratory specimens via t-distribution (n = 3), reflecting specimen replicate variability; the strain reversal depth of 24 m is only applicable to the intertidal flat soft soil stratum of Wenzhou Bay in this project).
Applsci 16 06815 g005
Figure 6. Soil deformation/settlement versus pore pressure (a) 6 m (b) 12 m.
Applsci 16 06815 g006
Figure 7. Water content versus depth before and after surcharge loading.
Applsci 16 06815 g007
Figure 8. Sensitivity versus depth before and after surcharge loading.
Applsci 16 06815 g008
Figure 9. Soil deformation/settlement versus pore pressure.
Applsci 16 06815 g009
Figure 10. Settlement rate of the settlement plate under incremental surcharge loading stages (The settlement rate difference between center and margin is caused by three-dimensional asymmetric stress distribution of the surcharge embankment).
Applsci 16 06815 g010
Table 1. Recommended values of main physical properties and mechanical parameters of rock and soil layers.
Stratigraphic NameMoisture ContentLiquid LimitPlastic LimitCohesionInternal Friction AngleVoid Ratio
w 0 w l w p c φ e
%%%kPa°
fluid mud91.7
silt60.150.628.68.42.51.73
sandy silt58.240.123.37.43.51.24
silt60.250.928.39.02.61.71
silty clay45.642.624.511.44.21.28
Table 2. Field surcharge loading construction scheme.
TimeApplied LoadConstruction Procedure
11 December 2023A 1.0 m-thick crushed-stone cushion was constructed.The drainage cushion consisted of clean, soil-free crushed aggregate.
First, a 0.5 m-thick fill layer was placed; a 3.5 m geogrid was then laid inward from the slope at a height of 0.5 m within the surcharge area, followed by another 0.5 m-thick fill layer.
21 December 2023A surcharge of 1.0 m was then appliedThe construction procedure for the second load stage was identical to that of the first.
13 January 2024A surcharge of 2.0 m was then applied
16 March 2024A surcharge of 3.0 m was then applied
22 April 2024A surcharge of 4.0 m was then applied
20 May 2024A surcharge of 5.0 m was then applied
2 July 2024A surcharge of 6.0 m was then applied
Table 3. One-dimensional consolidation test results of soft soil before and after surcharge preloading.
Group IDSpecimen IDLoading Scheme
G1
G2
G3
G4
1–12
13–24
25–36
37–48
Vertical one-dimensional consolidation loading was applied in the sequence of 12.5, 25, 50, 100, 200, 400, and 800 kPa.
Table 4. Basic Data Information.
IndicatorCJB-2 (Surcharge Center)CJB-3 (Slope Margin)
Number of data points7272
Monitoring duration264 days264 days
Final cumulative settlement1818.0 mm1931.0 mm
Relative difference in total settlement-+6.22% (margin > center)
Table 5. Peak Settlement Rate.
IndicatorCJB-2CJB-3Difference
Peak settlement rate66.00 mm/d67.00 mm/d+1.52%
Time of peak occurrenceDay 40 (2.0 m loading day)Day 40 (2.0 m loading day)Synchronous
Table 6. Average Settlement Rate by Surcharge Stage.
Surcharge StageCJB-2 Average Rate (mm/d)CJB-3 Average Rate (mm/d)Relative Difference (%)
1.0 m10.4310.80+3.56
2.0 m14.5314.18−2.43
3.0 m8.348.02−3.84
4.0 m10.0610.59+5.33
5.0 m8.418.01−4.76
6.0 m4.914.34−11.77
Overall average9.519.36−1.65
Table 7. Rate Attenuation Slope (Linear Regression: rate = kx + b).
Surcharge StageCJB-2 Attenuation Slope (mm/d2)CJB-3 Attenuation Slope (mm/d2)
1.0 m−0.1556−0.2228
2.0 m−0.3854−0.3914
3.0 m+0.0143+0.0818
4.0 m−0.5248−0.5365
5.0 m−0.3790−0.3480
6.0 m−0.1029−0.0949
Overall average−0.0447−0.0466
Table 8. Cumulative Settlement per Unit Surcharge Height.
Surcharge StageCJB-2 (mm)CJB-3 (mm)Relative Difference (%)
1.0 m219.0360.0+64.38
2.0 m353.0417.0+18.13
3.0 m328.7369.3+12.37
4.0 m330.8367.5+11.11
5.0 m311.6338.0+8.47
6.0 m303.0321.8+6.22
Table 9. Settlement Rate per Unit Surcharge Height.
Surcharge StageCJB-2 (mm/(d·m))CJB-3 (mm/(d·m))Relative Difference (%)
1.0 m10.4310.80+3.56
2.0 m5.435.20−4.14
3.0 m2.782.67−3.84
4.0 m2.052.16+5.15
5.0 m1.681.60−4.76
6.0 m0.820.72−11.77
Table 10. Full-Period Normalization Summary.
Normalization IndicatorCJB-2CJB-3Relative Difference (%)
Cumulative settlement per unit surcharge303.0 mm/m321.8 mm/m+6.22
Average daily settlement (full period)6.89 mm/d7.31 mm/d+6.10
Daily settlement per unit surcharge1.148 mm/(d·m)1.219 mm/(d·m)+6.19
Disclaimer/Publisher’s Note: The statements, opinions and data contained in all publications are solely those of the individual author(s) and contributor(s) and not of MDPI and/or the editor(s). MDPI and/or the editor(s) disclaim responsibility for any injury to people or property resulting from any ideas, methods, instructions or products referred to in the content.