4.1. Mechanical Driving Mechanism of Crack Deflection in Oil Shale
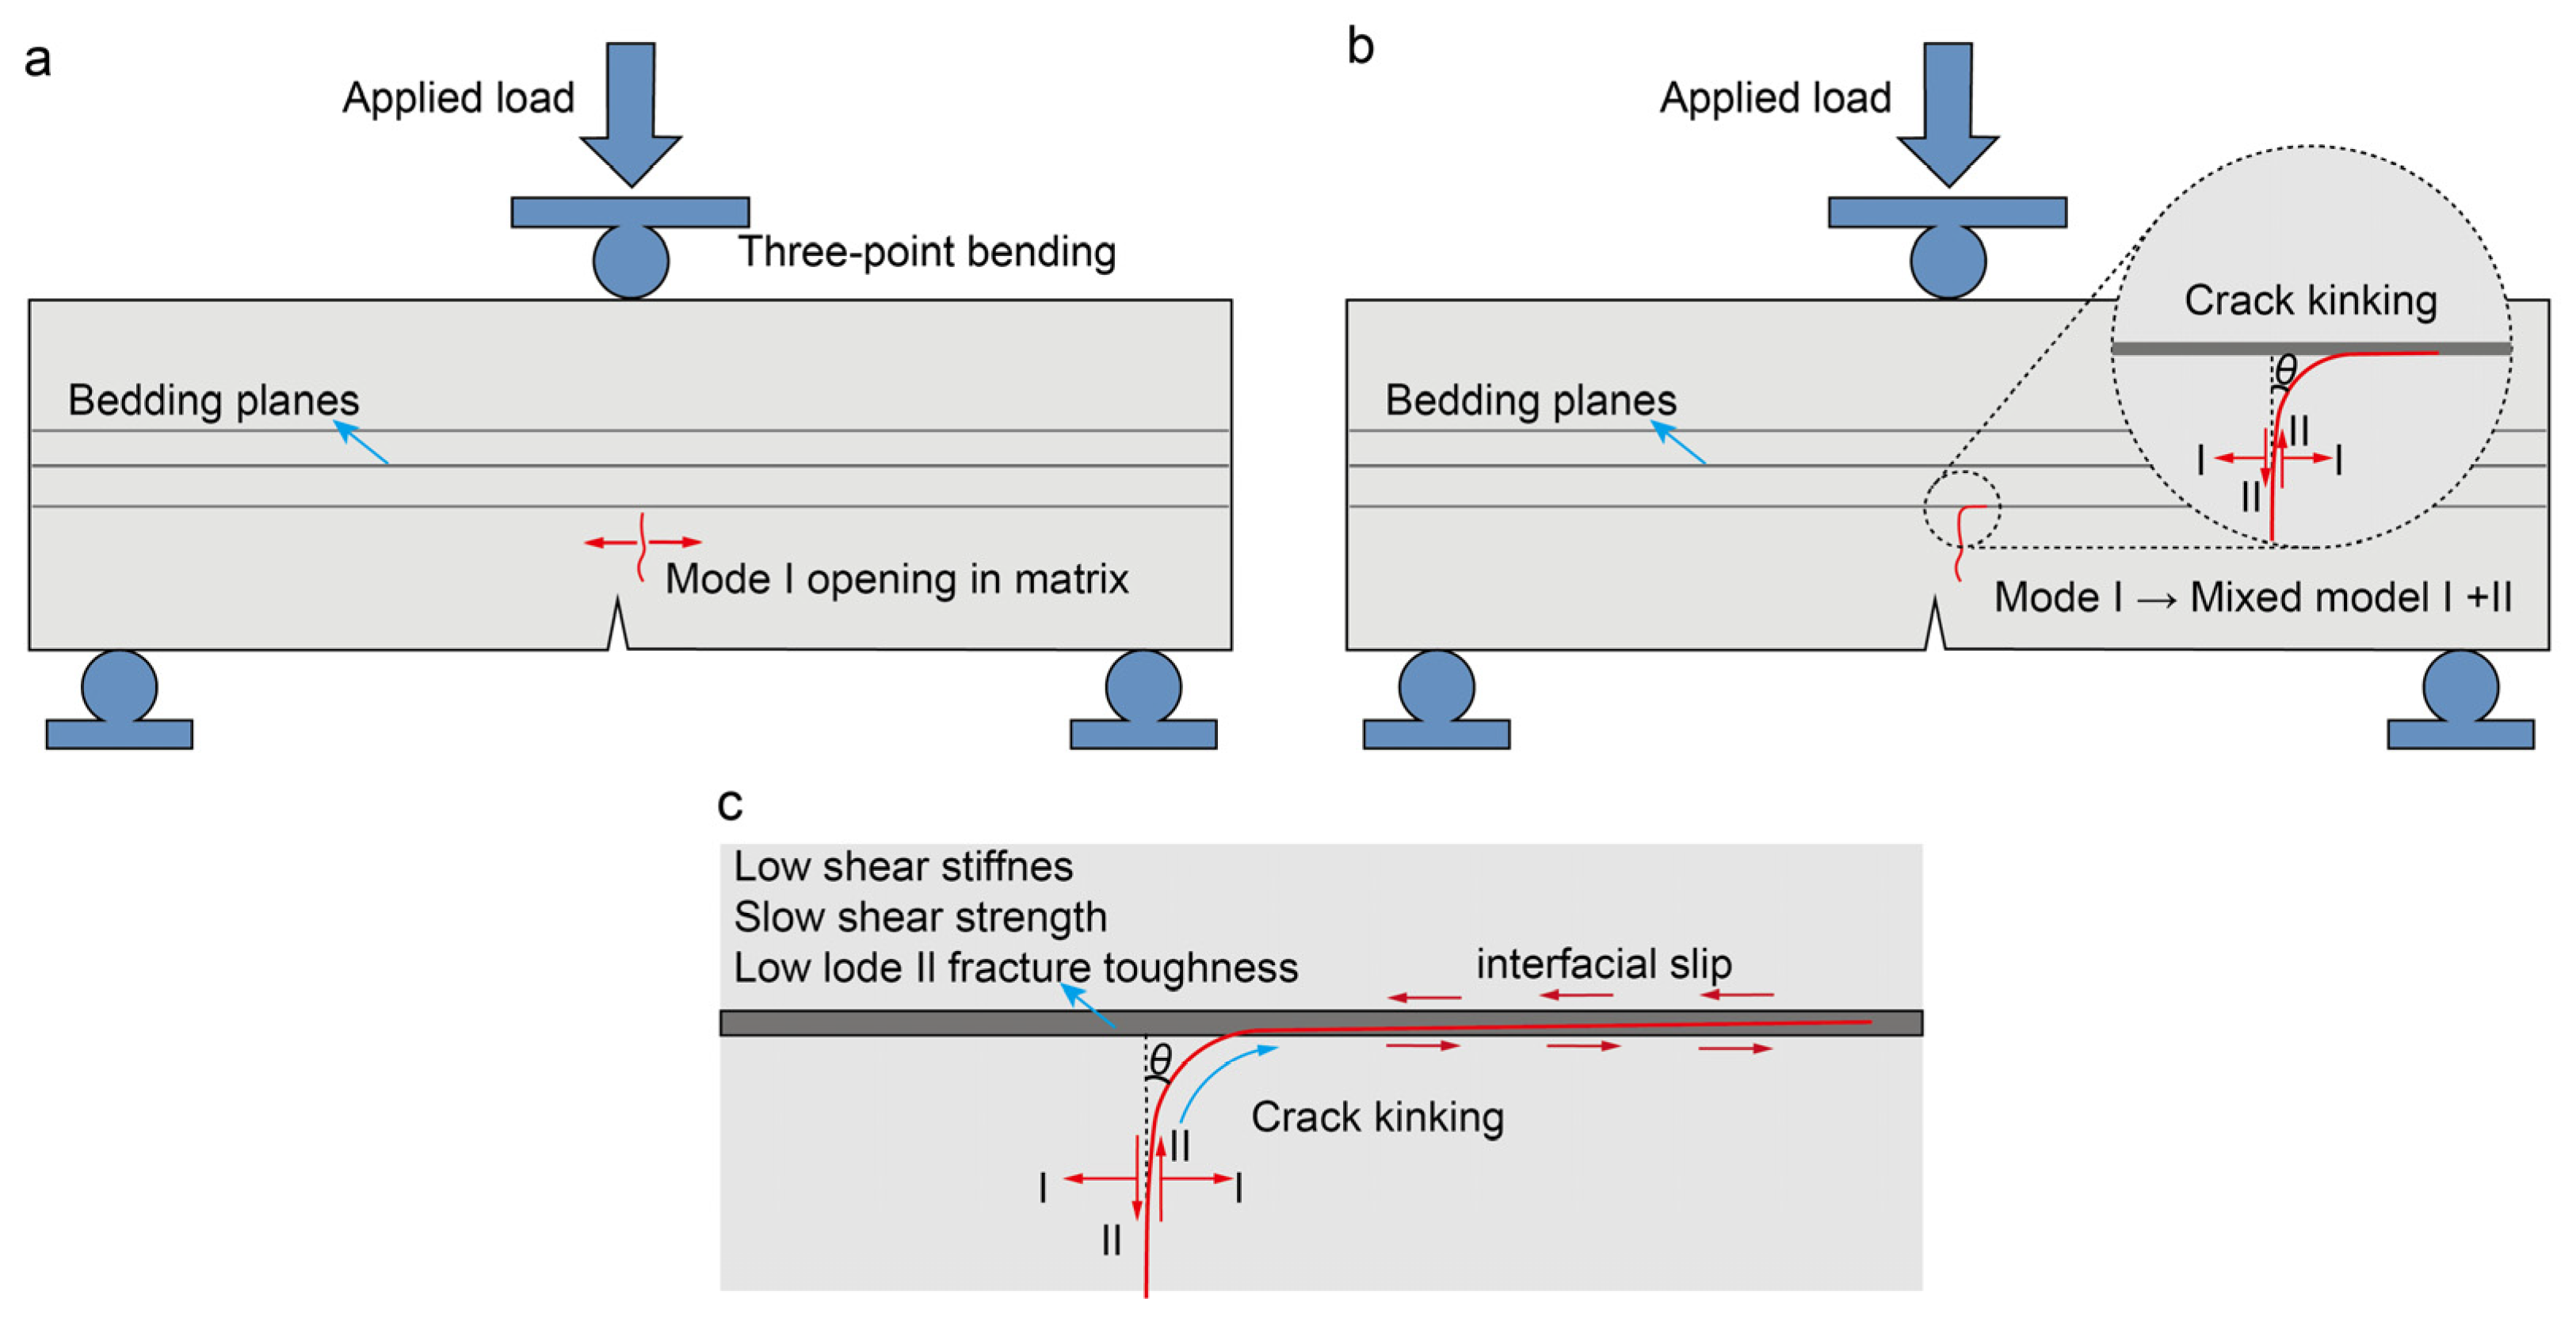
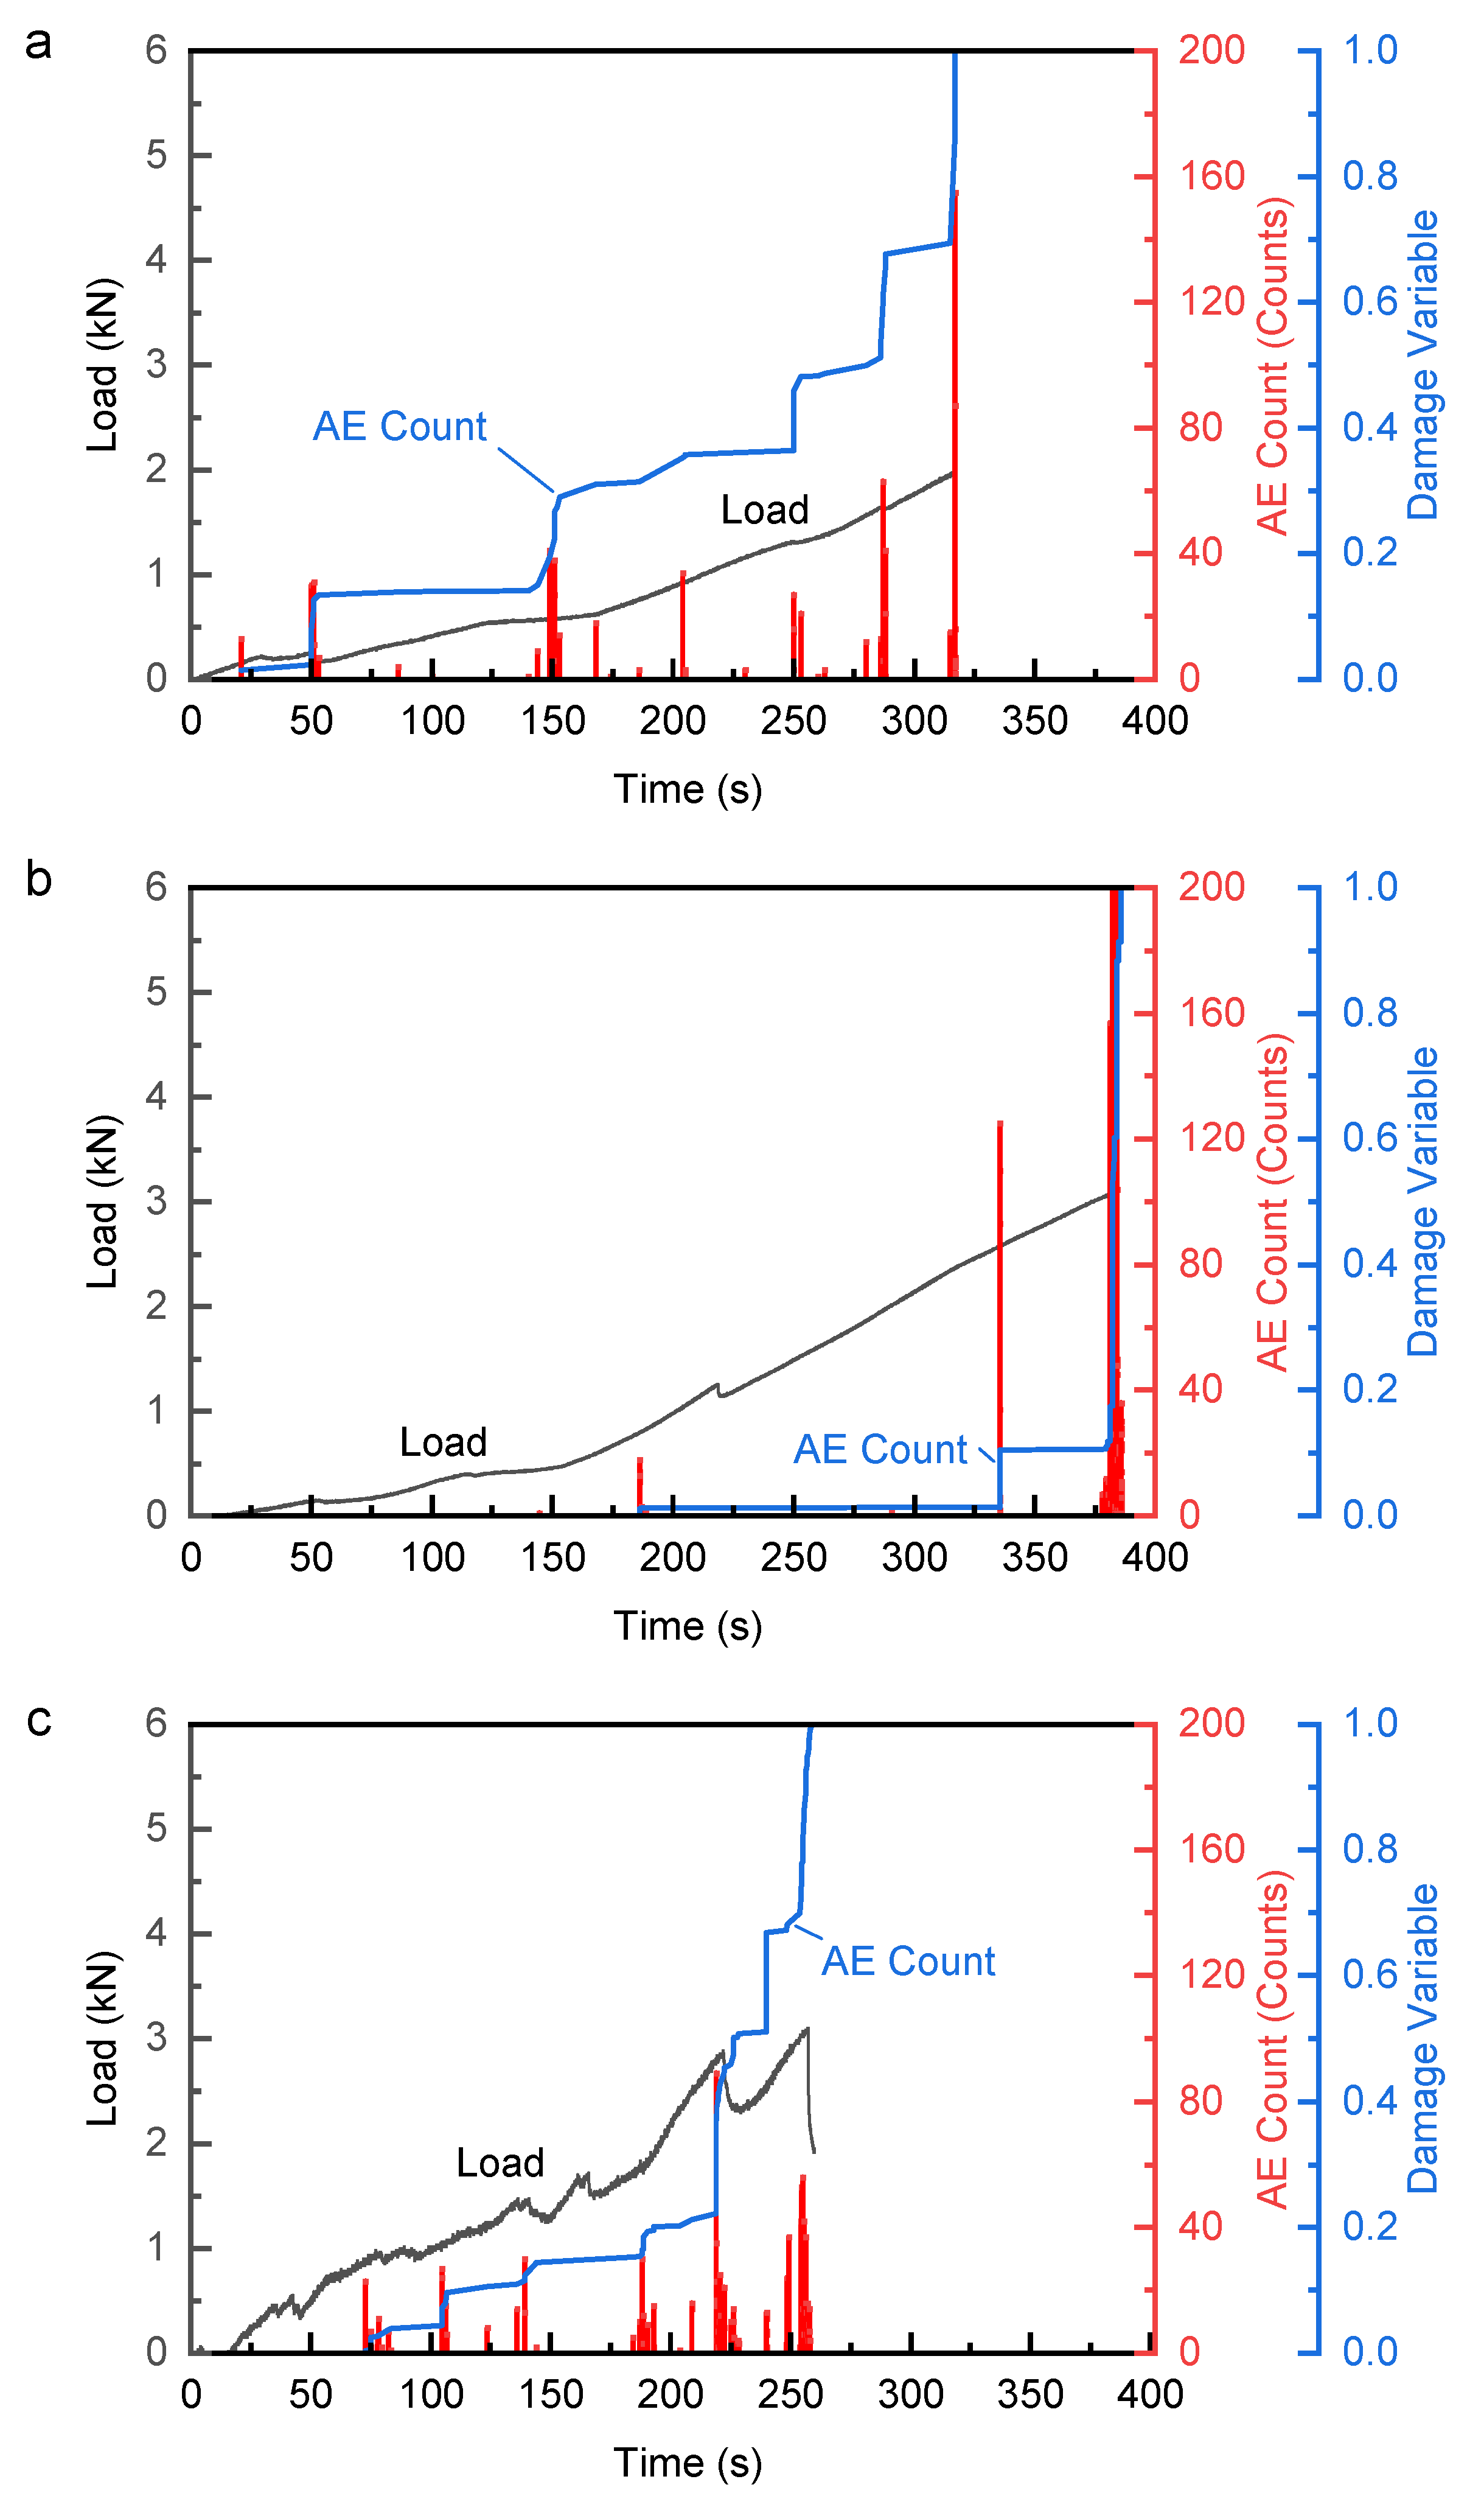
In this study, the primary findings can be described as follows. Under three-point bending, the crack propagation in oil shale is not solely controlled by the initial direction of the pre-existing notch, but it is continuously affected by the bedding structure during the unstable crack propagation process. As the cracks gradually approach the mechanical weak bedding planes, the corresponding propagation path is transited from the tensile-dominated to deflection and slip propagation along the bedding orientation, while the significant mixed-mode I-II fracture characteristics are observed. Therefore, this transition is reflected not only in the final crack geometry but also in the enhanced AE activity and the simultaneous occurrence of localized high-energy events during the failure process. This phenomenon suggests that for the layered oil shale, the unstable crack propagation is essentially regarded as a crack path selection process impacted by the combined influences of stress field evolution at the crack tip and the constraint of weak bedding planes.
In this study, to explain this phenomenon, the analysis was conducted from the perspective of fracture mechanics. For the convenience of discussion, the fundamental assumptions were made as follows. Specifically, the oil shale matrix and the region adjacent to bedding planes in the pre-peak stage can be approximately regarded as linear elastomers. The cracks mainly exhibit the mode I tensile fracture before approaching the bedding planes, while compared with the oil shale matrix, the weak bedding planes can be treated as weak interfaces with lower strength and fracture energy. Meanwhile, the bedding thickness is negligible relative to the specimen size, and the crack propagation along the weak bedding planes after deflection can be simplified to the mixed-mode I-II fracture. For the mixed-mode I-II fracture, according to the K-field additivity, the stress intensity factor can be expressed by Equation (4):
where
and
are the mode I and mode II stress intensity factors at the original crack tip, respectively;
and
are the equivalent stress intensity factors when the crack propagates along the deflection direction
θ.
Based on the mixed-mode crack theory established by Erdogan and Sih [
8,
9], the crack initiation along the direction that maximizes the circumferential stress
at the crack tip with the shear stress of 0. Accordingly, the crack deflection angle
satisfies Equation (5):
Moreover, the corresponding
can be expressed by Equation (6):
From the mechanistic perspective of Equation (6), the occurrence probability of crack tip deflection is primarily determined by
. When the main crack is far from the weak bedding planes, the stress field at the crack tip is approximately symmetrical, and the crack propagation is primarily controlled by
. As the crack approaches the weak bedding planes, the stress field at the crack tip is disturbed by the mechanical mismatch between the bedding and the matrix, and thereby a transition from mode I-dominated propagation to mixed-mode I–II propagation is induced. Similar results have been validated in previous studies of heterogeneous materials and interfacial fracture [
21,
22,
23]. Hence, the presence of weak bedding planes leads to an increase in localized
, and thereby the likelihood of crack propagation along the weak interface is enhanced.
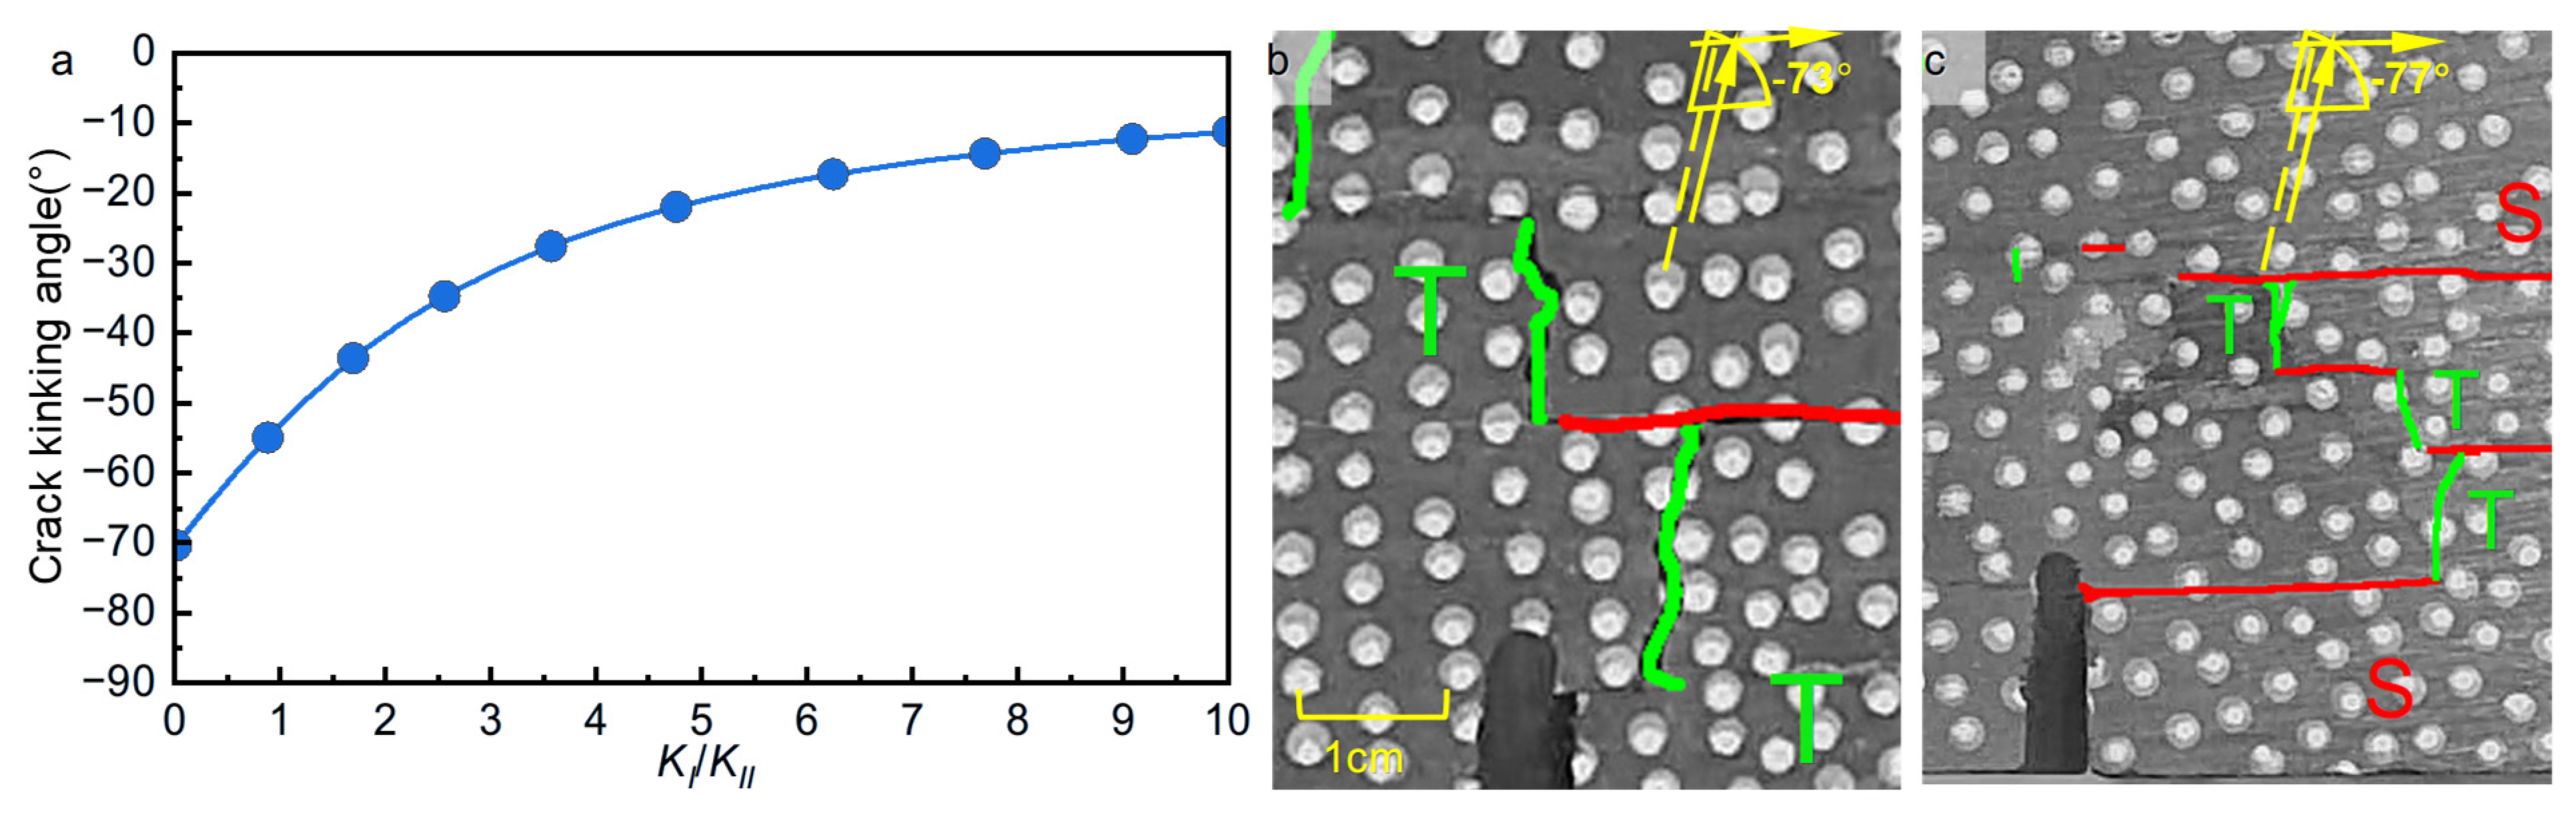
Figure 10 presents the crack deflection angles corresponding to various
ratios calculated by Equation (6). Specifically, when the crack is far from the weak bedding planes, the stress field at the crack tip is still dominated by
, whereas
is relatively small. Meanwhile,
is relatively high, and the crack propagates along the original direction without significant deflection. As the crack approaches the weak interface,
is further enhanced, while
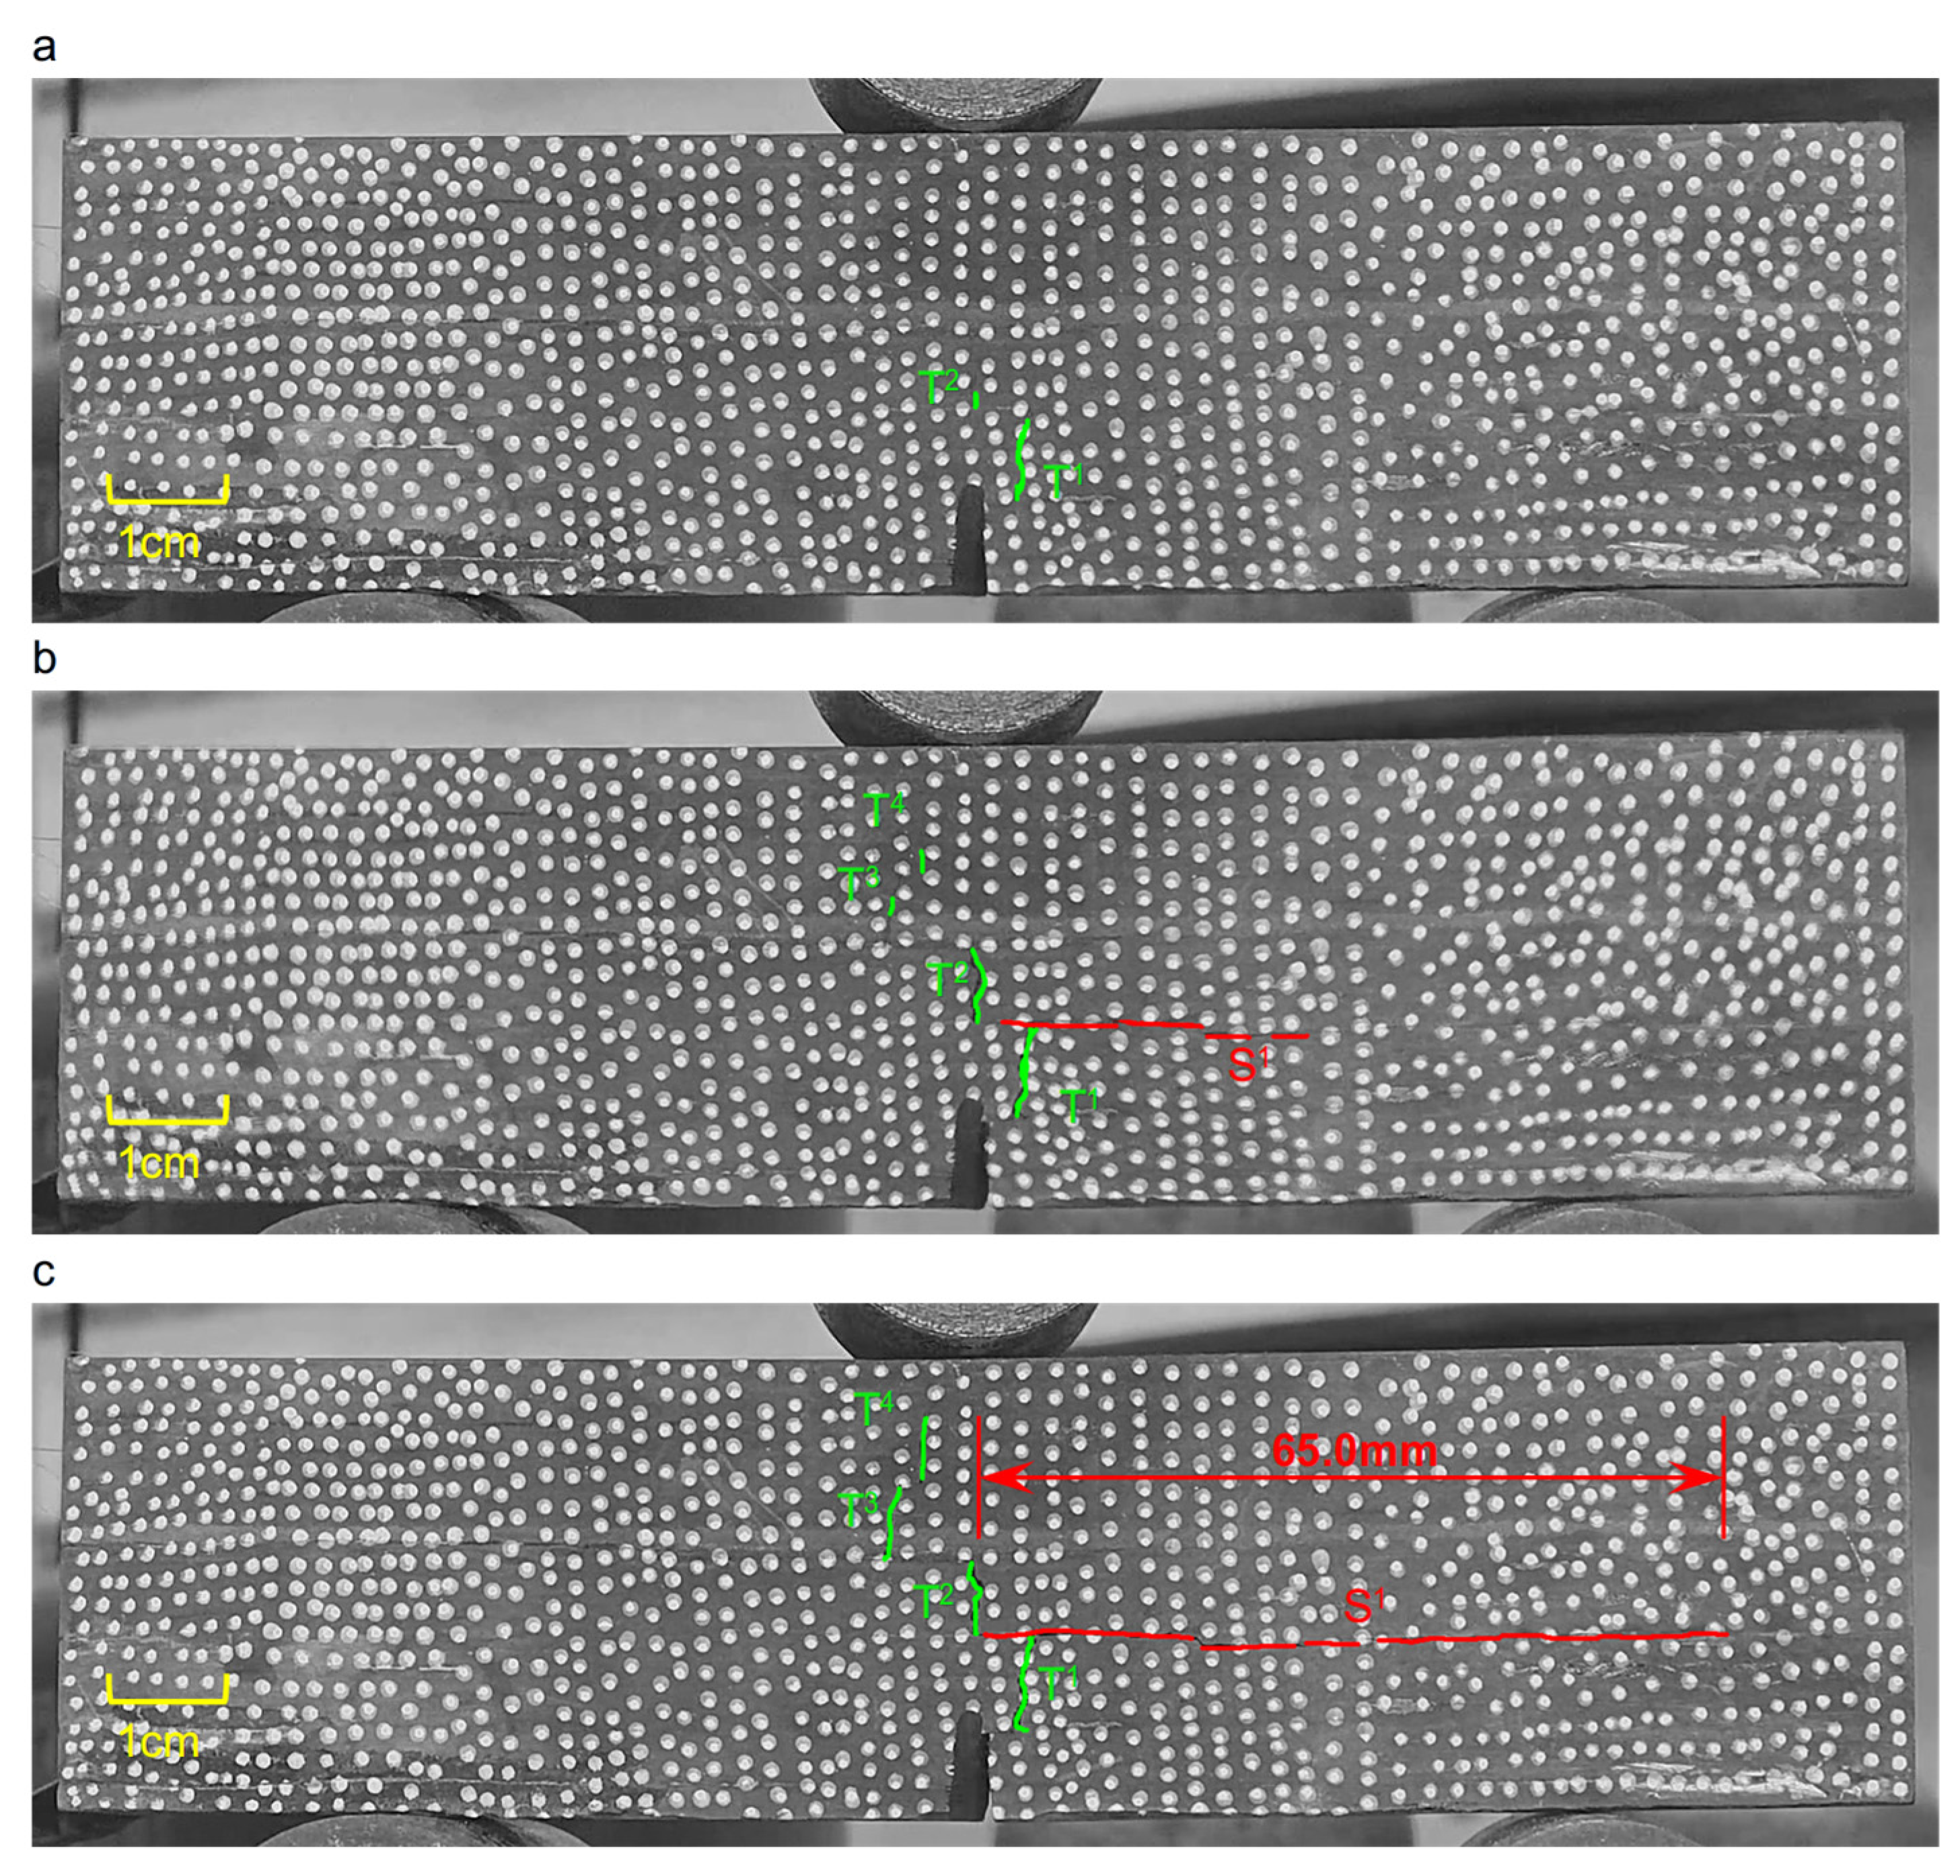
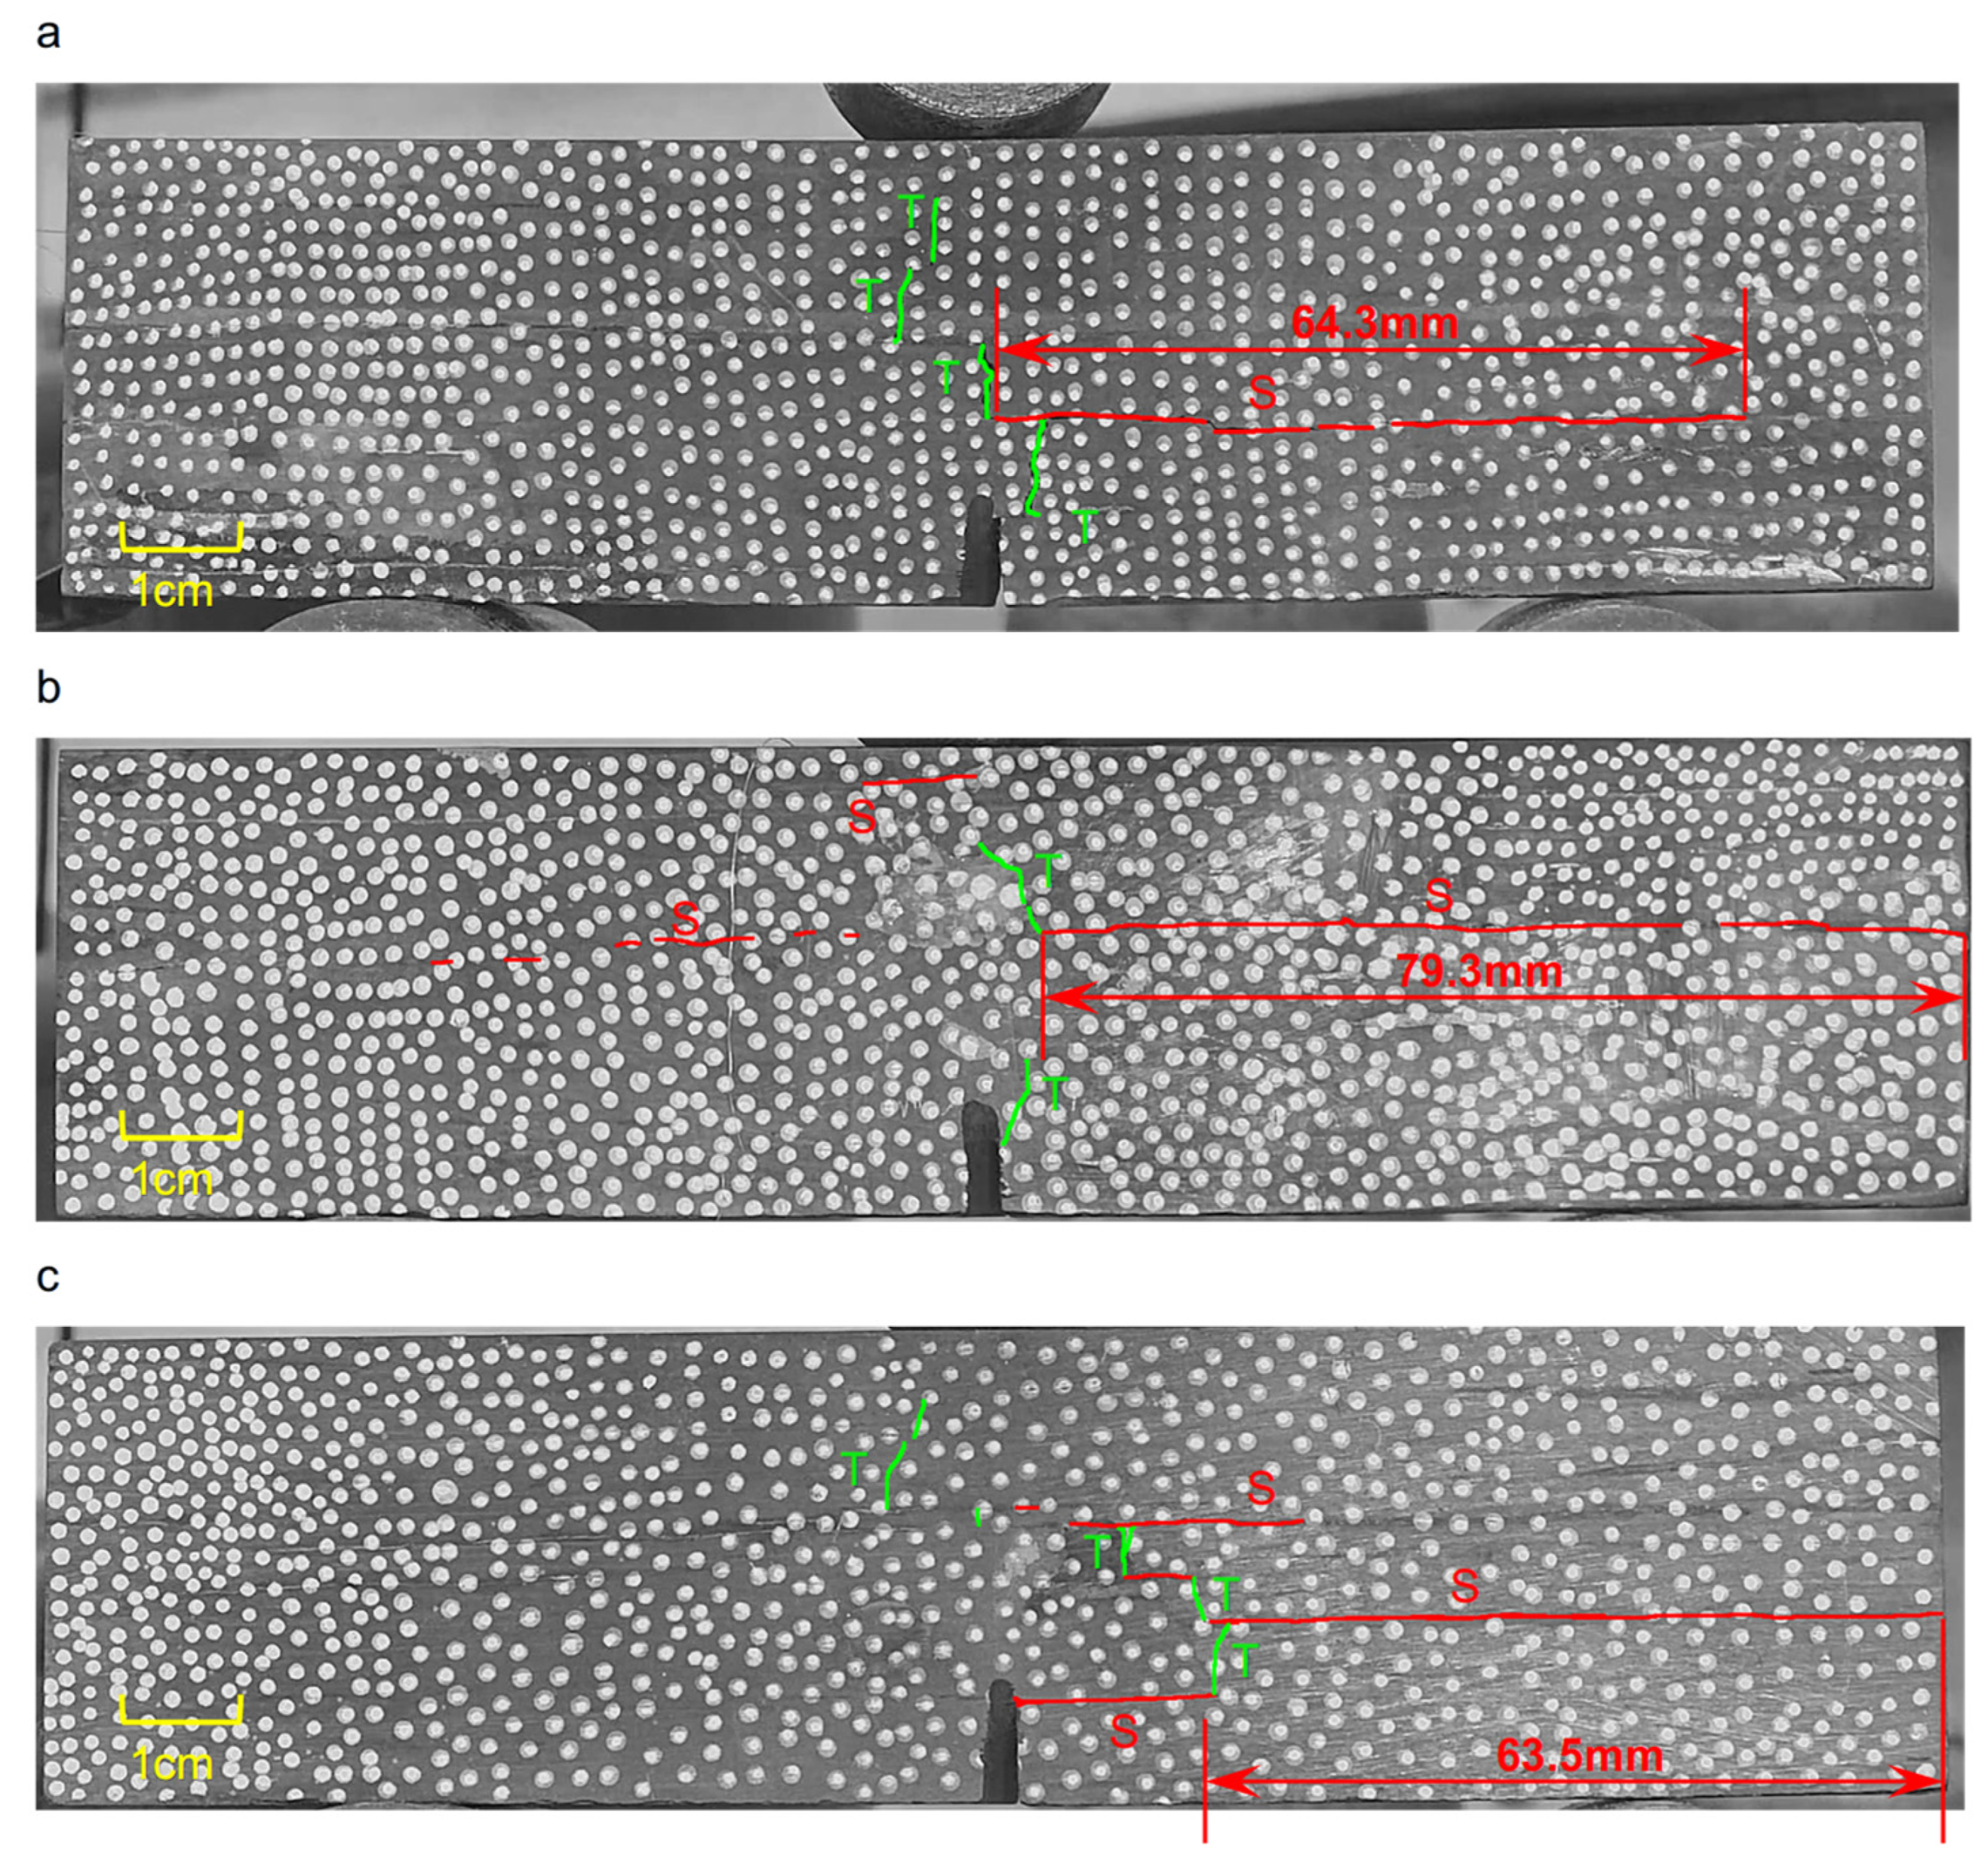
is progressively reduced, and thereby the crack deflection angle gradually approaches −70°. These prediction results show qualitative consistency with the experimental observations in this work. For example, as shown in
Figure 10b,c, the measured crack deflection angles are −73° and −77°, respectively. The agreement between the theoretical predictions and experimental measurements demonstrates that the fracture mechanics model can reasonably explain the crack propagation mechanism controlled by the bedding planes in oil shale. It should be pointed out that this theoretical model is built upon the linear elastic homogeneous approximation, whereas the actual oil shale is composed of weak bedding planes with organic matter, mineral heterogeneity, and localized defects, and thus there may still be some deviations between the theoretical predictions and the actual measurements, but both results exhibit a consistent changing trend.
In
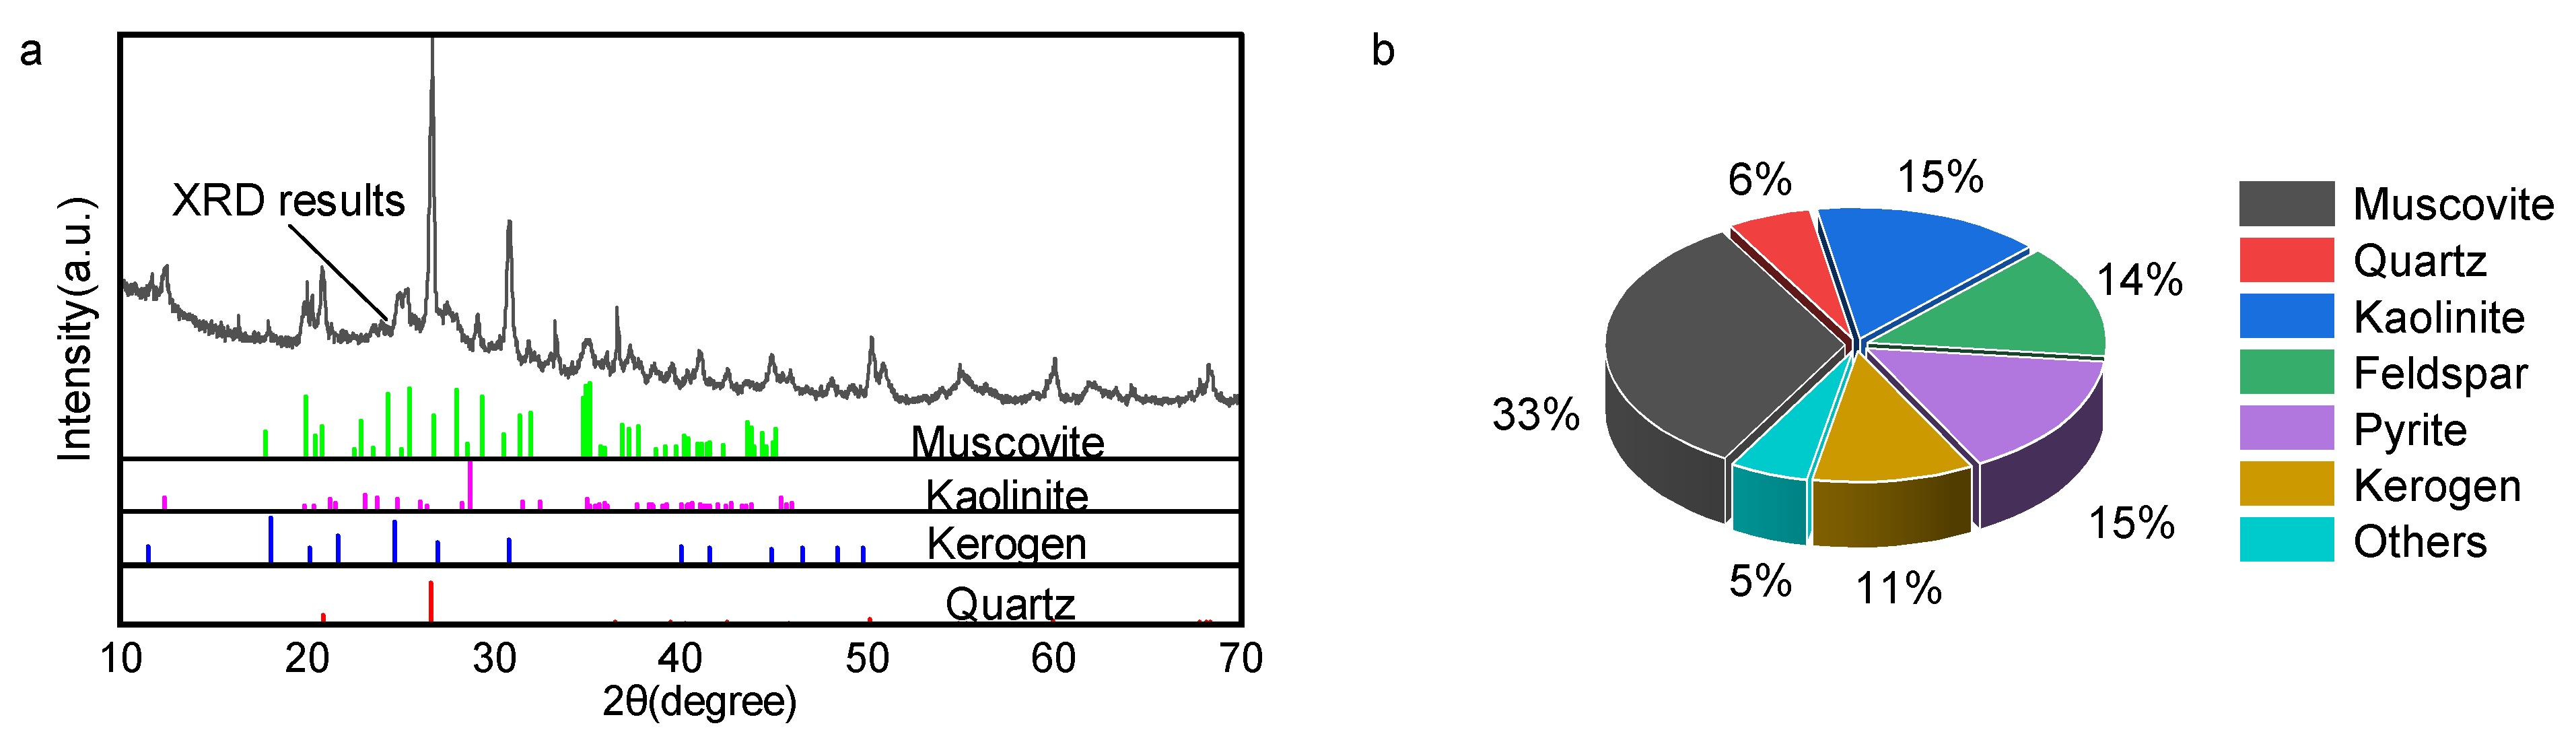
Section 2.1.2, the tested oil shale contains a remarkably high proportion of clay minerals (muscovite and kaolinite, totaling approximately 48.5 wt.%). Muscovite possesses a typical layer-silicate structure with extremely well-developed cleavage planes, while kaolinite is characterized by its weak microscopic interlayer bonding. During the sedimentary compaction process of oil shale, these flaky clay minerals tend to be directionally distributed parallel to the macroscopic bedding planes. Consequently, when the tensile crack front approaches these clay-rich interfacial zones, the intrinsically low frictional coefficient and structural weakness of the muscovite and kaolinite significantly diminish the localized shear strength and fracture energy of the interface. This mineralogical characteristic fundamentally provides the material basis for the aforementioned local stress field adjustment and the observed macroscopic phenomenon: rather than penetrating the high-brittleness matrix, the crack preferentially deflects and undergoes interfacial slip along the weak bedding planes. Therefore, the high susceptibility to slip is inherently determined by the synergistic effect of macroscopic bending stresses and microscopic clay mineral distributions.
From a micromechanical perspective, the finite thickness and relatively low stiffness of the organic matter layer significantly affect the mechanics of crack deflection. When the main tensile crack tip propagates into a relatively soft organic layer with finite thickness, a crack tip blunting effect may be induced due to the localized yielding or ductile deformation of the organic constituents, which mitigates the extreme stress concentration at the crack tip. Consequently, the actual interfacial crack propagation behavior involves not only brittle slip but also complex energy dissipation within the finite thickness of the weak region. Nevertheless, because the thickness of these organic layers is still macroscopically negligible relative to the sample dimensions and the overall crack propagation path, the linear elastic theoretical model and the simplified mixed-mode I-II assumption remain highly effective in capturing the macroscopic trend of the crack trajectory selection and the global deflection angle. The localized stress buffering by the finite-thickness organic layers merely delays the instantaneous rupture, explaining the dense, discrete localized high-energy acoustic emission events observed just before and during the macroscopic slip.
4.2. Microscopic and Macroscopic Characteristics of Fracture Toughness of Oil Shale
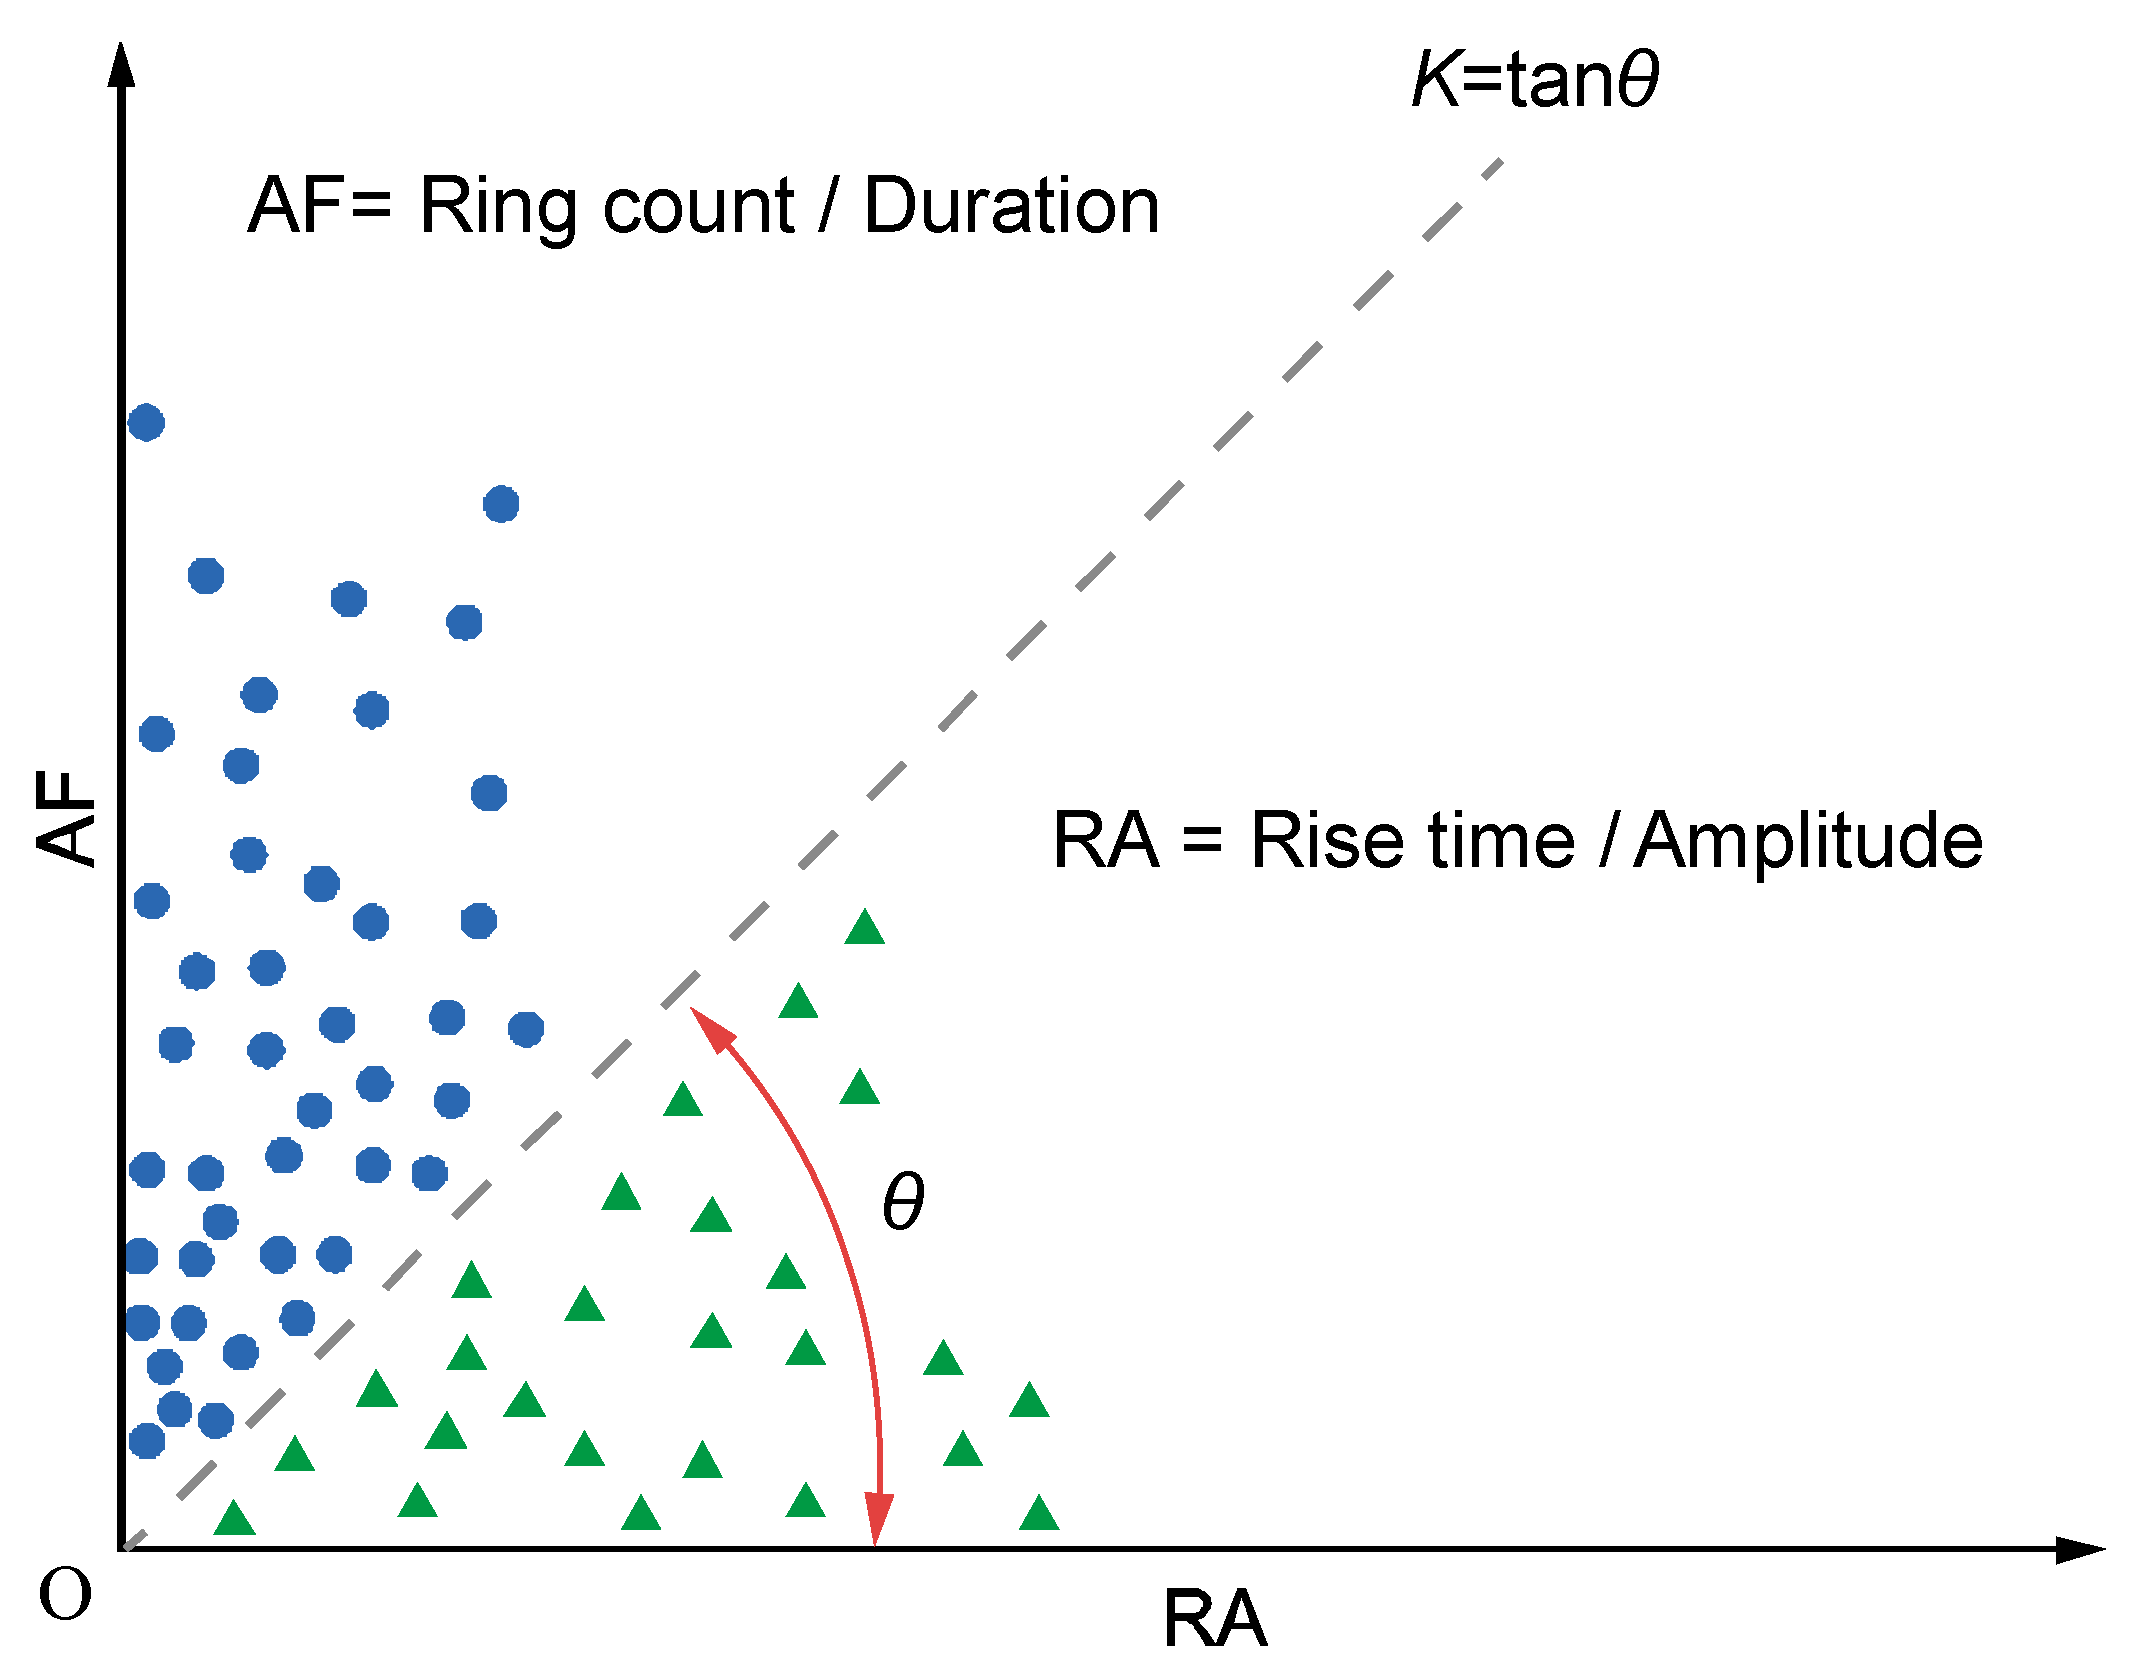
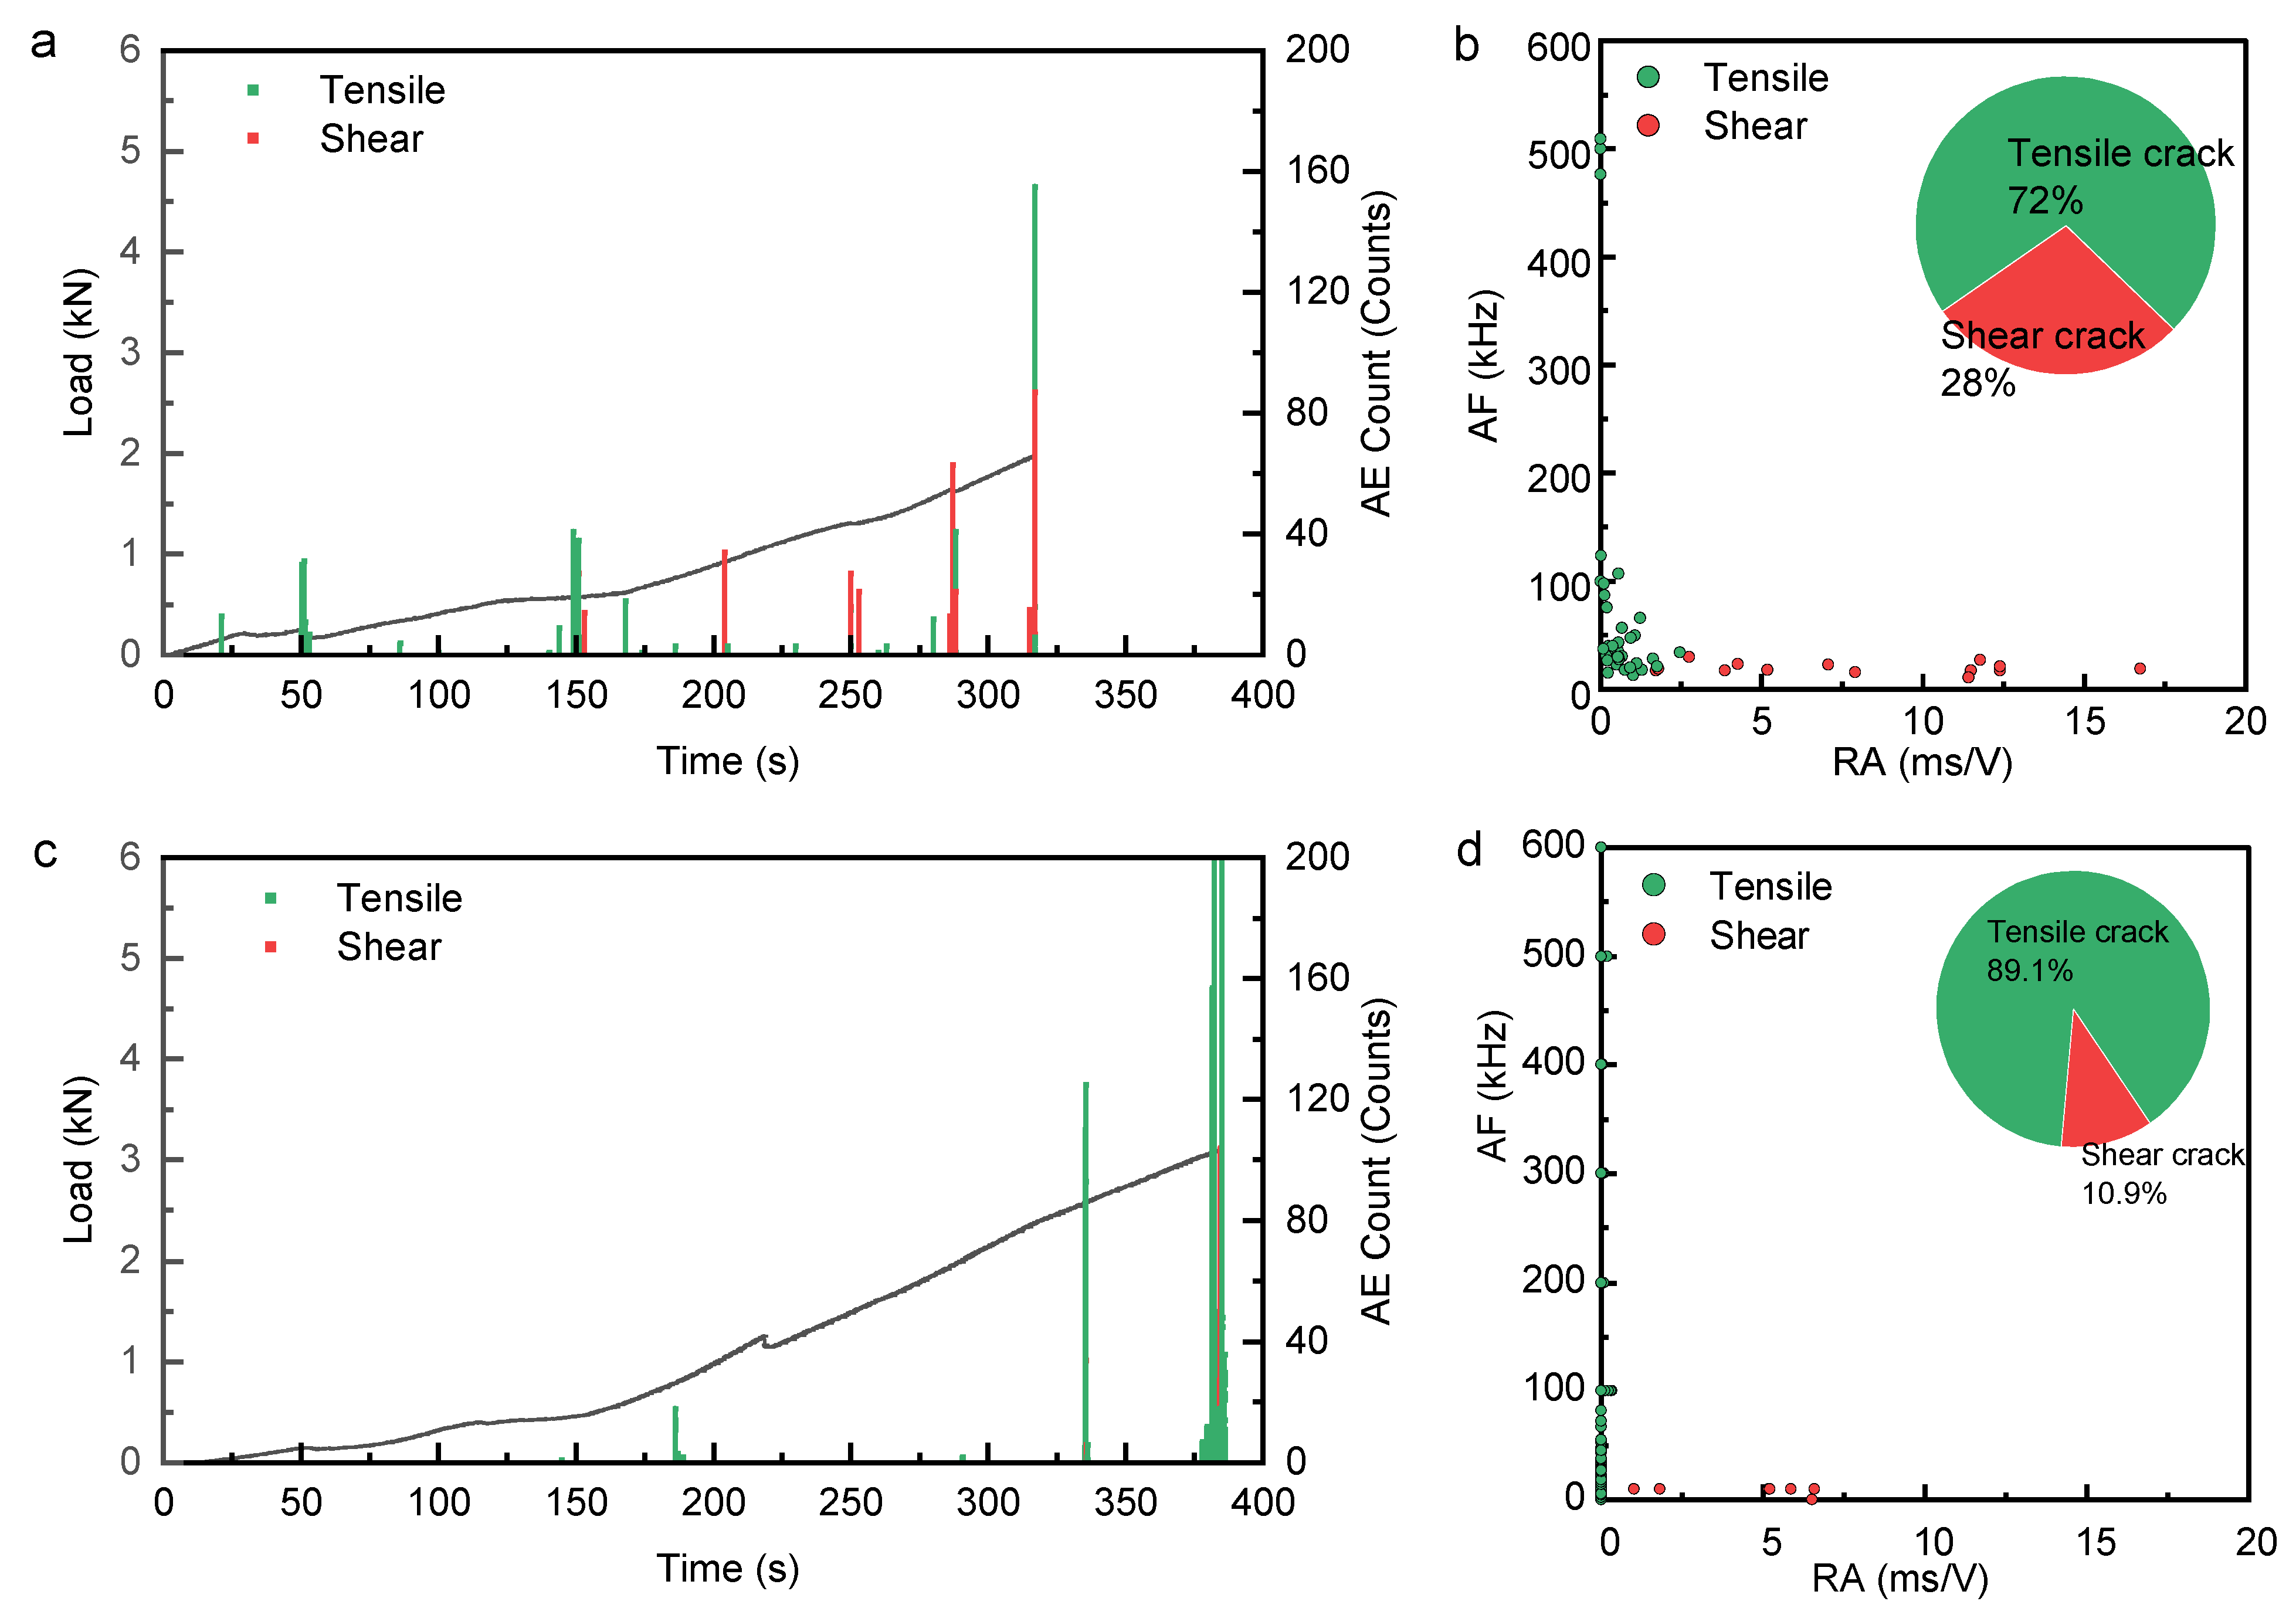
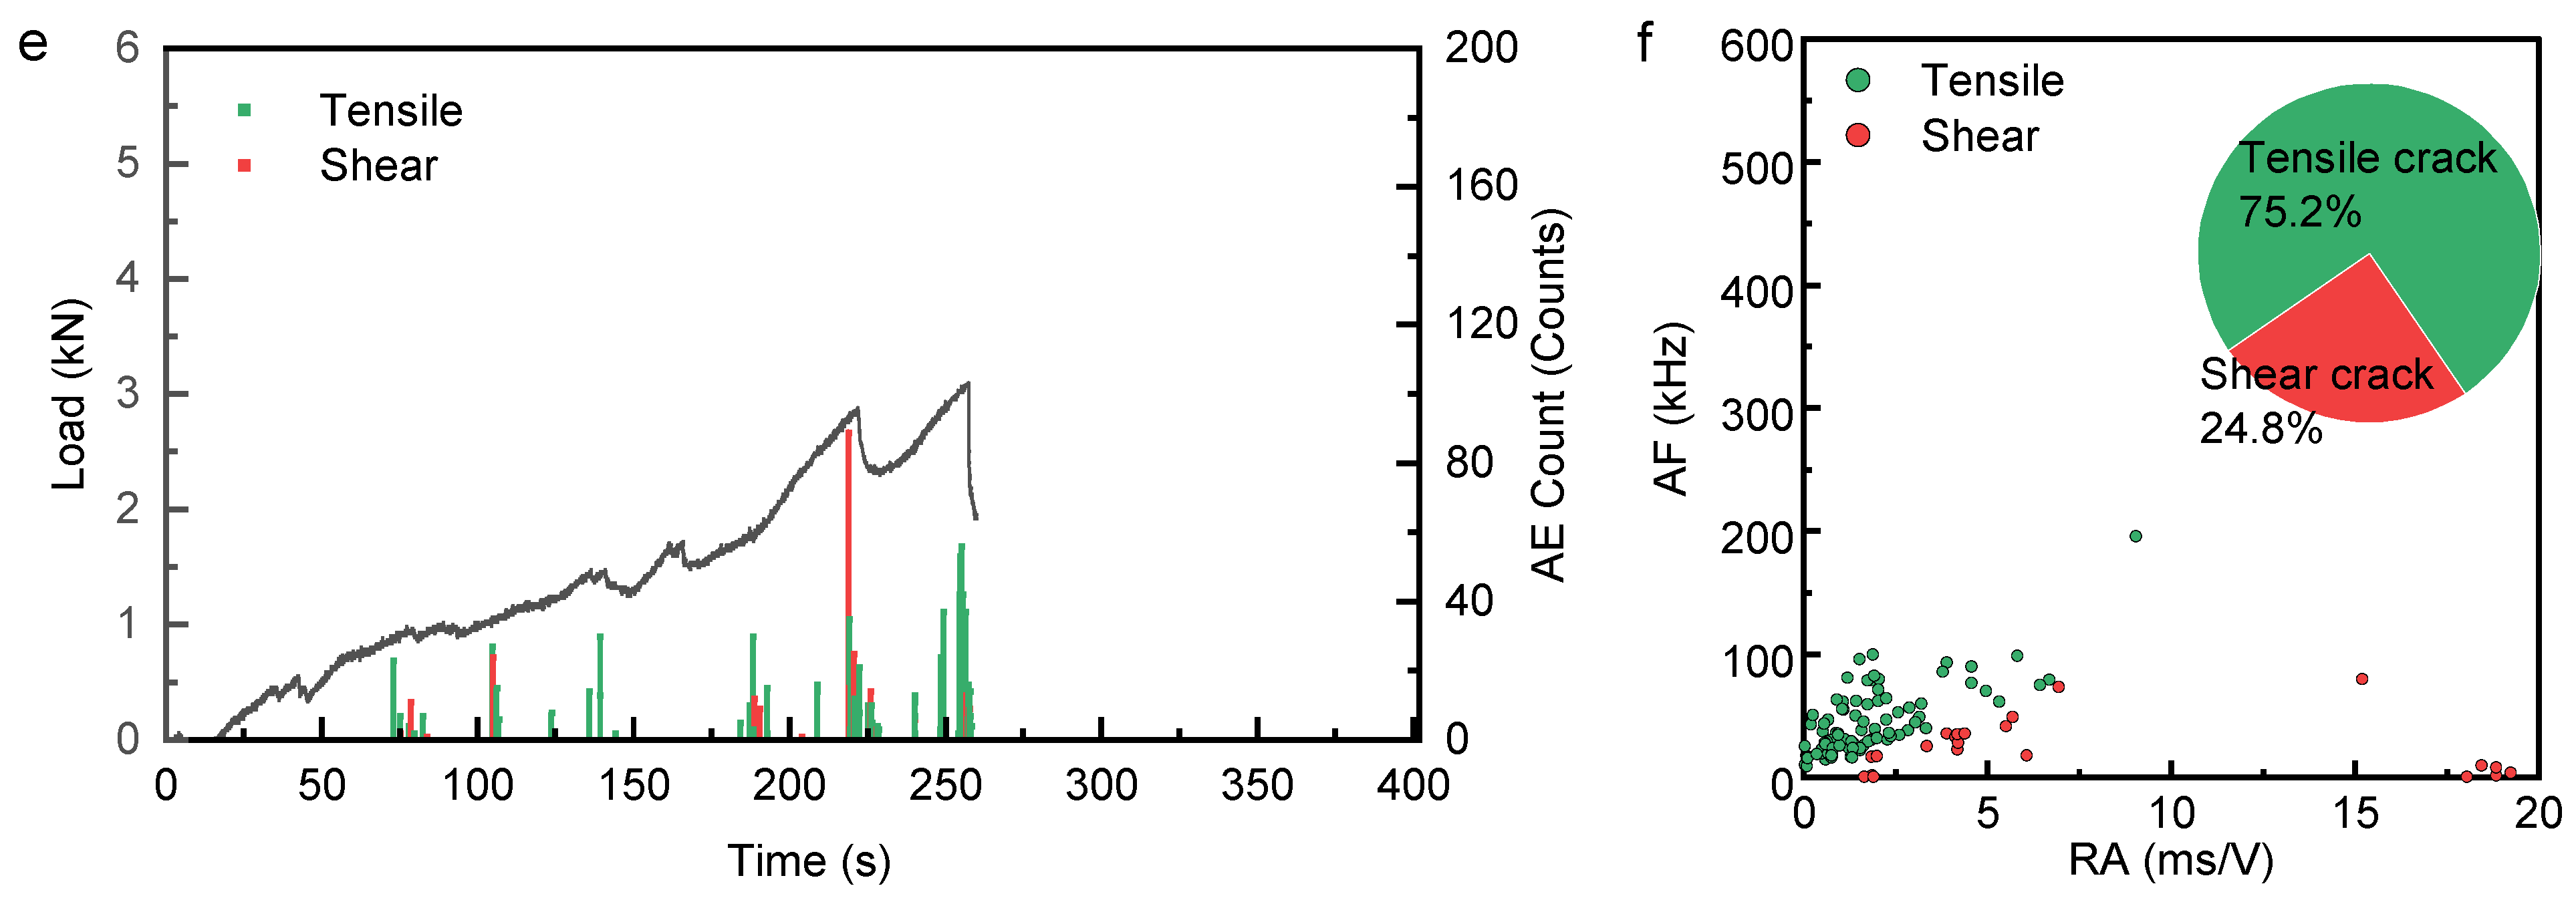
Based on the above results, the failure in oil shale under three-point bending cannot lead to the formation of a single vertically penetrating crack, but a complex crack network consisting of vertical tensile cracks and horizontal cracks along the bedding planes is generated. Meanwhile, the AE classification results demonstrate that the crack initiation and propagation in the early stage are dominated by the tensile fracture events, whereas the occurrence of shear fracture events is continuously enhanced in the vicinity of peak and in the post-peak stages. This indicates that the weak bedding planes cannot determine whether the crack initiation occurs, but they can significantly affect the path selection and failure mode during the subsequent crack propagation process. In this study, to further explore the influences of weak bedding planes on unstable crack propagation, the fracture toughness of oil shale was estimated using nanoindentation parameters and three-point bending peak loads, respectively.
4.2.1. Microscopic Fracture Toughness of Oil Shale Matrix
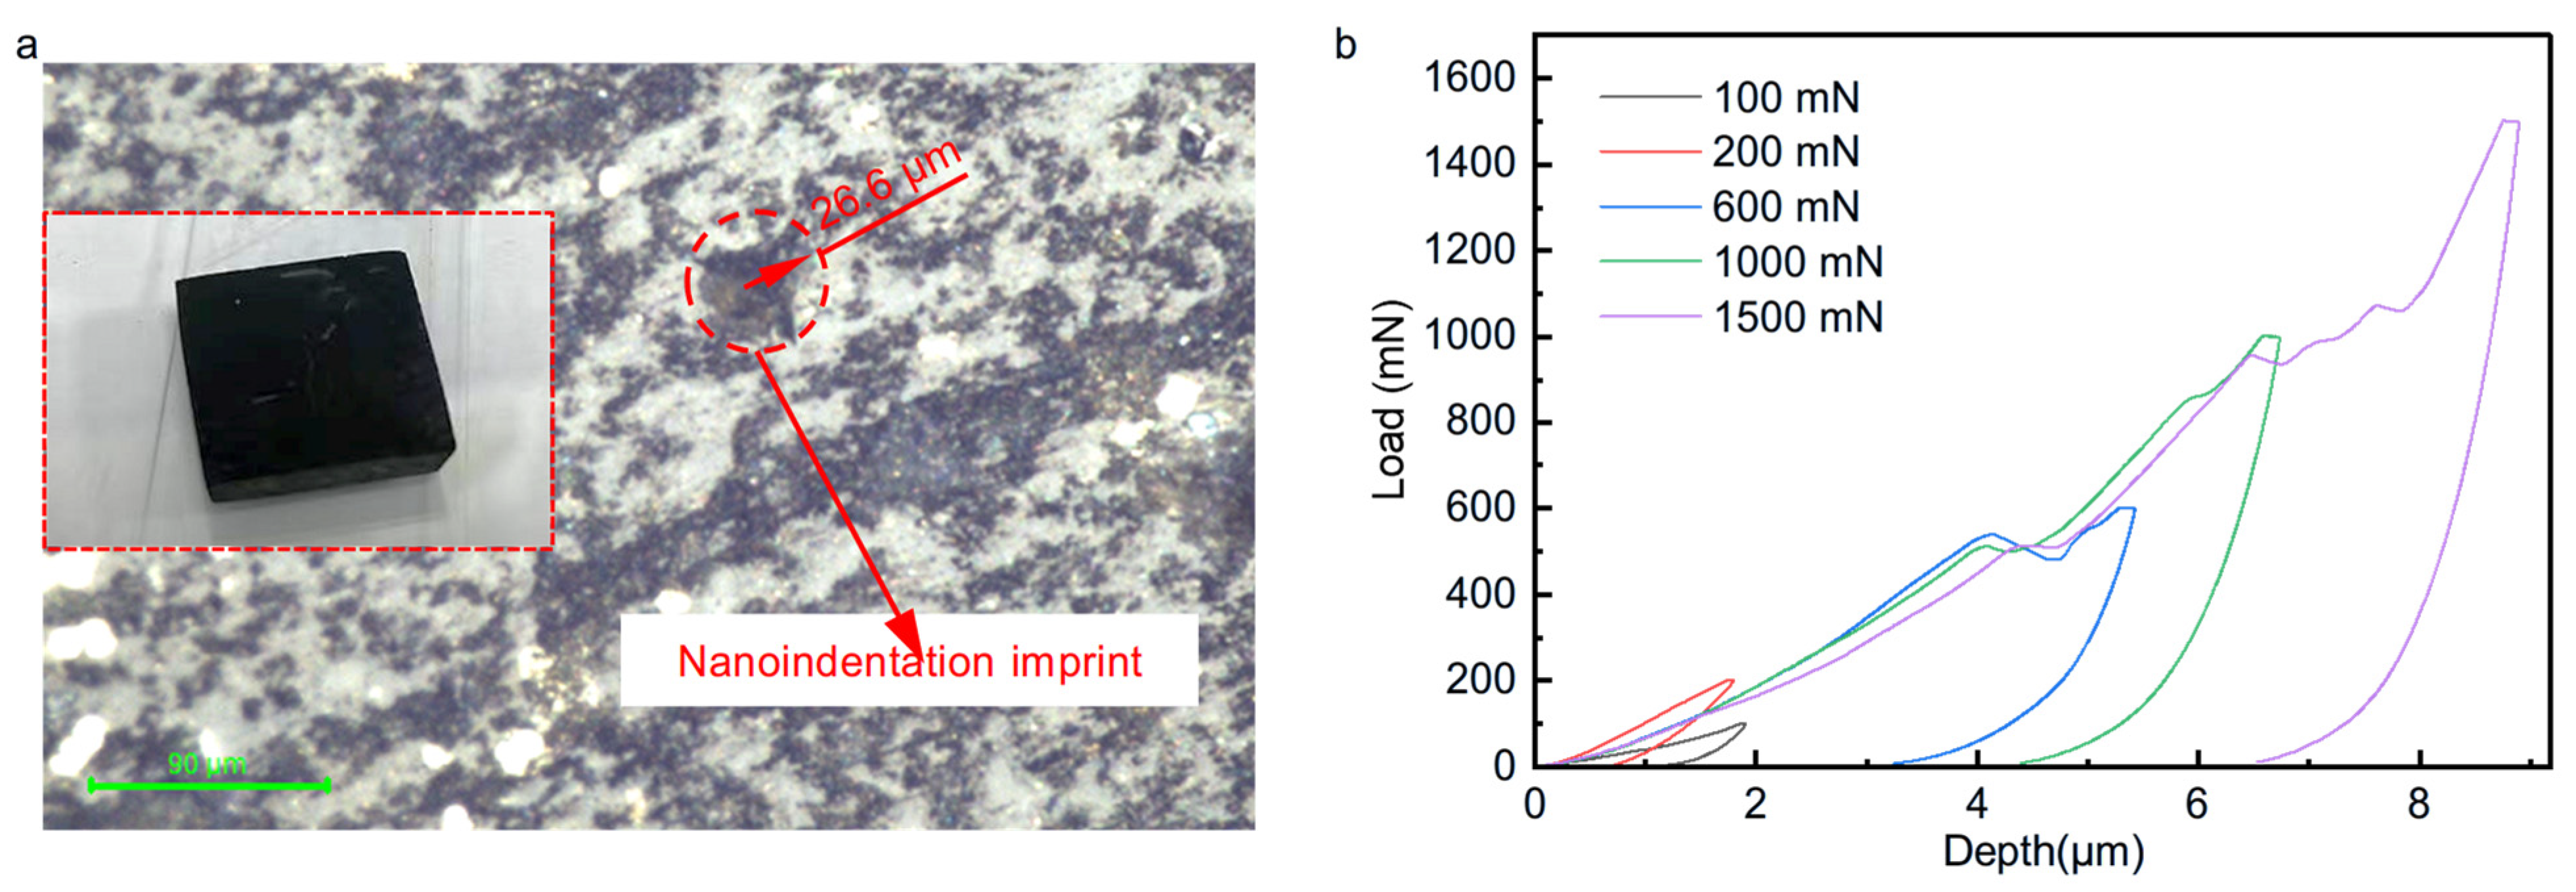
In this study, the nanoindentation measurements were carried out using a Hysitron TI980 nanoindenter (Bruker GmbH, Bremen, Germany). A Berkovich diamond indenter with a tip curvature radius of 100 nm was used. The maximum indentation load was set to 10 N with a load resolution of 1 μN and a displacement resolution of 0.01 nm. During the testing process, the loading- holding-unloading mode was adopted. The indenter approached the specimen surface at a speed of 20 nm/s. When the load reached the preset maximum load Pmax, the load was held for 5 s and then unloaded to 0. Five maximum load levels were adopted, i.e., 100 mN, 200 mN, 600 mN, 1000 mN and 1500 mN, respectively, while the corresponding results are presented in
Figure 11.
Based on the nanoindentation testing results, the apparent fracture toughness of the material can be estimated by the indentation fracture mechanics model (Equation (7)):
where
is the fracture toughness (Pa·m),
is an empirical constant taken as ~0.016 for a Berkovich indenter,
E is the elastic modulus of the material,
H is the hardness,
P is the maximum load (N) and
c is the characteristic crack size (m).
Table 1 lists the nanoindentation testing results of oil shale specimens and the calculated fracture toughness. The measurement results demonstrate that the indentation depth, contact stiffness, contact area, reduced modulus and hardness of oil shale exhibit significant variations under different indentation loads. These differences are closely associated with the intrinsic heterogeneity of oil shale, demonstrating that different indentation locations may correspond to various mineral compositions or organic matter regions, and thus noticeable differences in localized mechanical responses can be detected. The reduced modulus Er is mainly distributed within the range of 24.36–35.08 GPa, while the hardness H is mainly distributed within the range of 0.73–3.42 GPa. The mechanical parameters exhibit certain fluctuations under different loads and indentation locations, which are attributed to the uneven distributions of mineral particles, organic matter, and pore structures within the oil shale. The apparent fracture toughness
of the oil shale is relatively low within the range of 0.54–1.17
, suggesting that after eliminating the influences of macroscopic bedding structure, the oil shale matrix is a highly brittle material with inferior crack resistance.
4.2.2. Macroscopic Fracture Toughness of Oil Shale
The oil shale is no longer regarded as an ideal continuous medium at the macroscopic scale, and instead it is a complex rock mass consisting of discontinuous structures, such as bedding planes. The fracture toughness of the specimen can be calculated using the three-point bending peak load (Equation (8)):
where P is the maximum fracture load (N), S is the support span (mm), B is the specimen thickness (mm), W is the specimen height (mm),
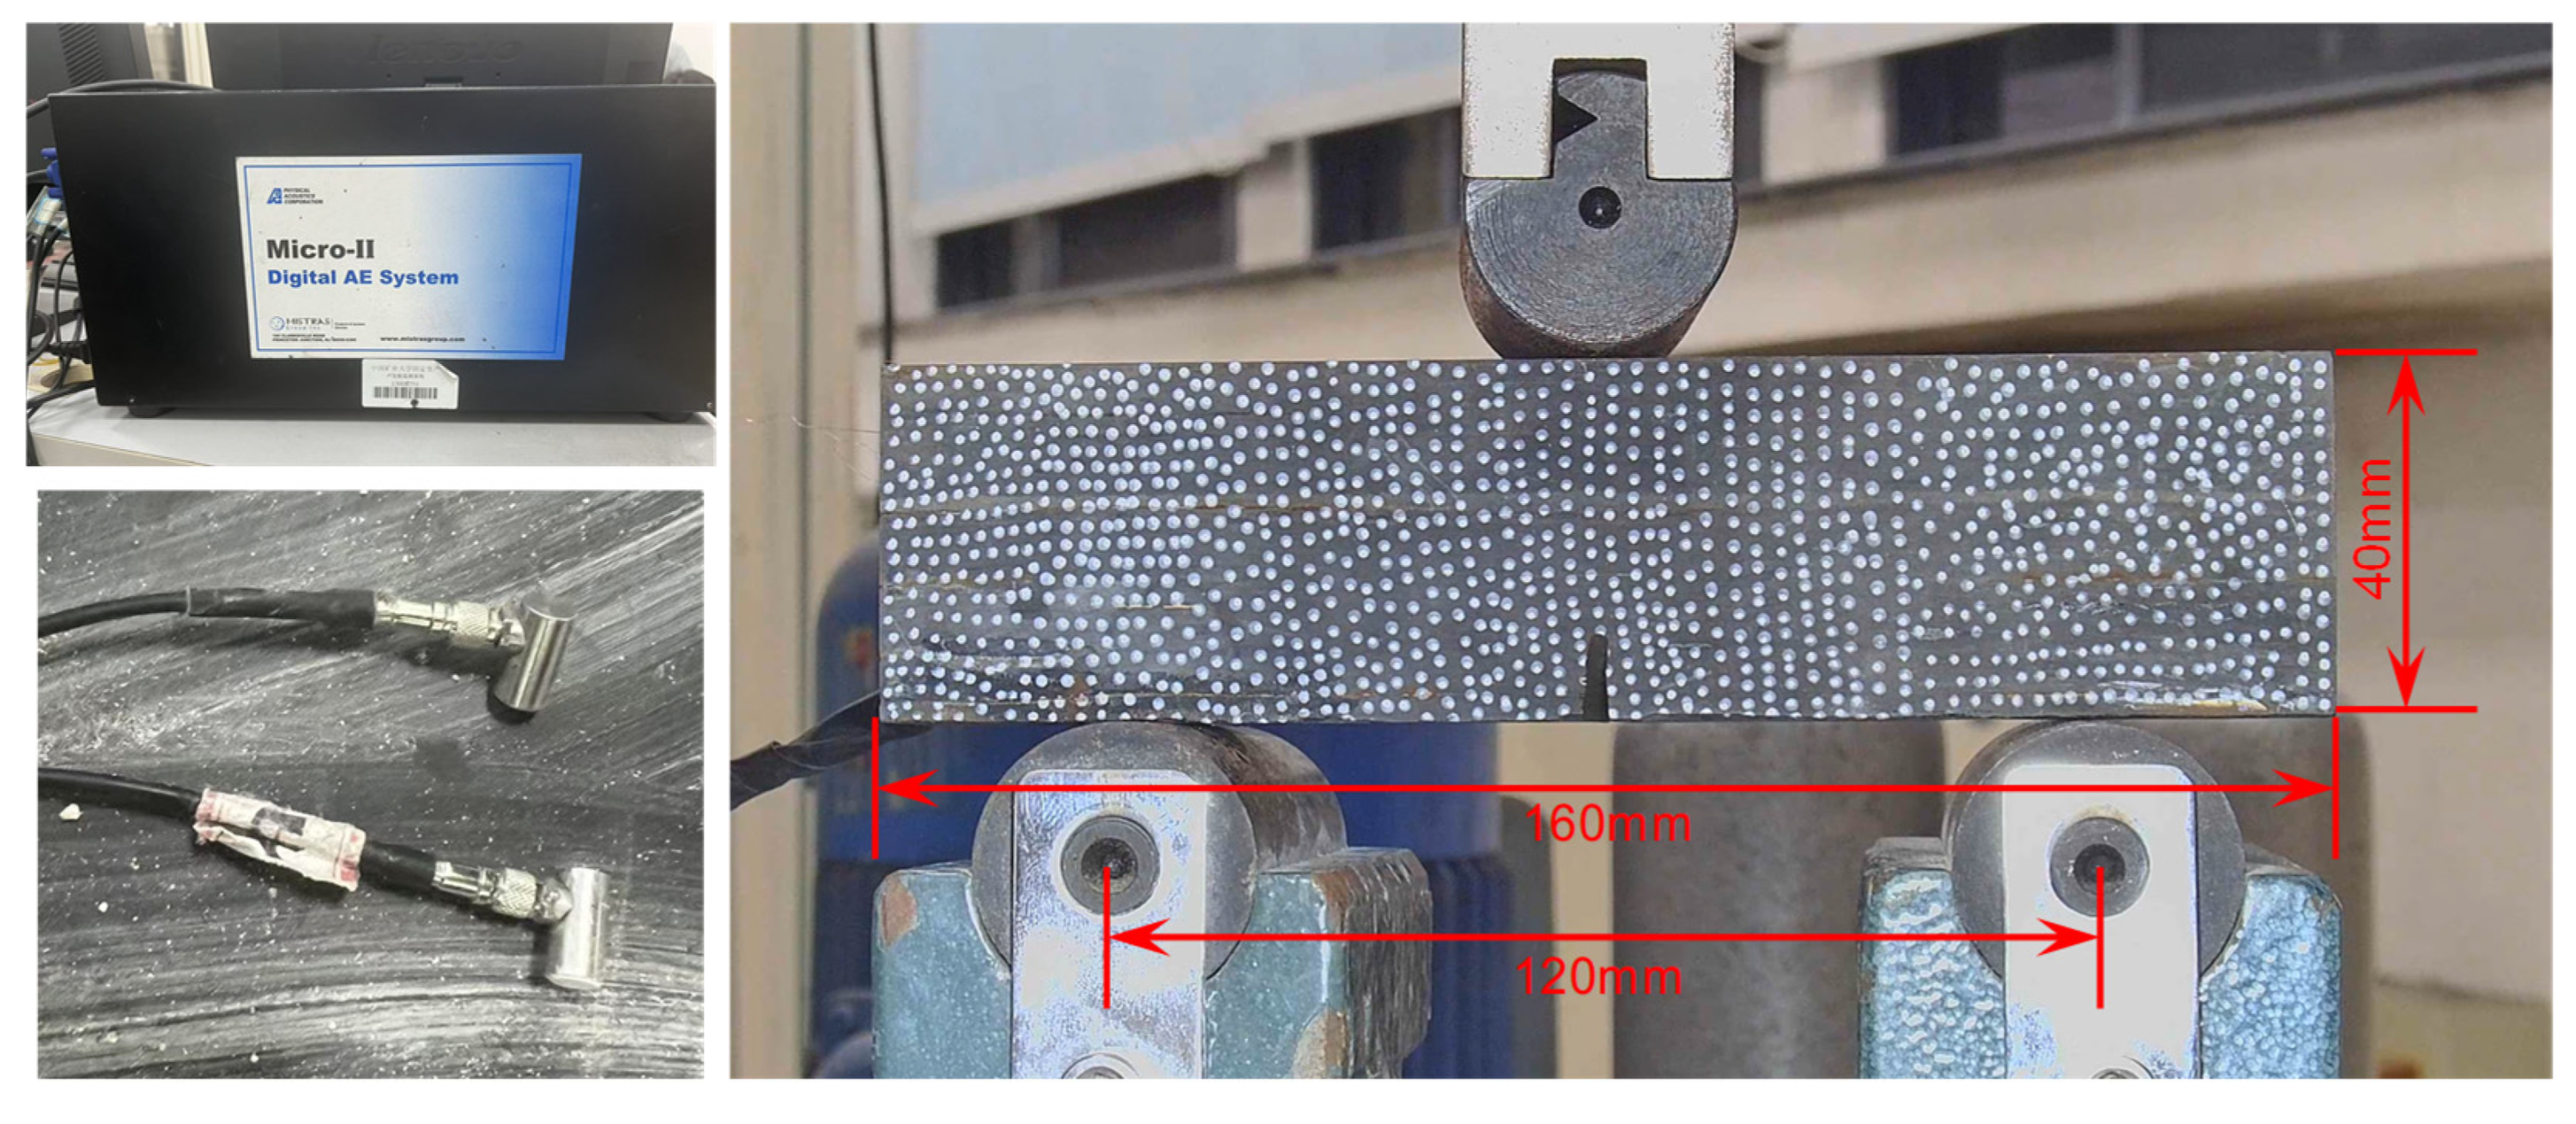
is the geometric correction function, and a is the initial notch length (mm). In this experiment, the specimen dimensions were 40 mm × 40 mm × 160 mm, and the support span was 120 mm, while the notch depth was 10 mm.
The three-point bending calculations demonstrate that the fracture toughness of the three specimens can be determined as 0.795, 2.216, and 1.244 MPa·m1/2, respectively, and an average of 1.42 MPa·m1/2 is achieved. In terms of magnitude, these results are highly consistent with the microfracture toughness of the matrix estimated by nanoindentation results, and thereby these results obtained by two approaches suggest that the oil shale is a low-toughness and brittle material. Compared with the microscale results, the overall macroscopic fracture toughness is slightly higher, indicating that the macroscopic crack initiation and instability process is not only controlled by the localized crack resistance of the matrix but also affected by the overall geometric constraints of oil shale specimens and influencing factors such as the bedding planes.
The macroscopic fracture toughness estimated from the three-point bending peak load shows a relatively large scatter among specimens (0.795–2.216 MPa·m1/2, with a mean value of 1.42 MPa·m1/2). This variability is expected for oil shale and is closely related to the heterogeneity of bedding planes and organic-rich weak interfaces. Although the specimen geometry, notch depth and bedding orientation were strictly controlled, the local bedding spacing, the continuity of weak bedding planes, and the distribution of pre-existing microcracks/laminations may differ from specimen to specimen. Such heterogeneity can shift the onset location of crack deflection and the extent of interfacial slip, thereby changing the peak load recorded in the three-point bending test and, consequently, the calculated KI. In particular, a specimen in which the propagating crack intersects a more continuous and weaker bedding plane is more prone to premature deflection and interfacial slip, leading to a lower apparent macroscopic fracture toughness, whereas a specimen with a less continuous or locally stronger bedding plane requires a higher load to trigger deflection and unstable fracture, resulting in a higher apparent value. In addition, as observed during specimen preparation, oil shale is susceptible to delamination along bedding planes; minor differences in machining-induced or stress-relief-induced interlayer separation may also contribute to the scatter in peak-load-based KI.
It should be pointed out that this phenomenon, whereby macroscopic toughness slightly exceeds microscopic toughness, does not imply that the layered structure can improve the overall crack resistance of the material. Conversely, it demonstrates that the three-point bending peak load can characterize the comprehensive response of the oil shale specimen before reaching macroscopic unstable crack propagation, rather than the localized crack initiation resistance of a single matrix unit. During the actual failure process, after the occurrence of crack initiation at the notch tip, the crack propagation first passes through a certain matrix region. When the crack propagation approaches near the weak bedding planes, the corresponding propagation direction is adjusted, while a portion of the driving force is used for crack deflection, secondary crack formation, and interfacial slip activation, and thus the macroscopic fracture toughness is essentially an equivalent fracture parameter that includes the effect of crack path evolution.
4.2.3. Synergistic Effects of Microscopic Brittle Matrix and Macroscopic Bedding Structure
The combination of microscopic and macroscopic results demonstrates that the essential characteristics of the fracture toughness of oil shale exhibit a pronounced scale effect. Specifically, at the microscopic scale, the relatively low fracture toughness of the matrix can determine that the material is highly susceptible to crack initiation under bending tensile stress, and thus, the crack initiation stage is dominated by the mode I tensile fracture. In contrast, at the macroscopic scale, the crack propagation caused by the introduction of bedding structure no longer follows the shortest penetration path in a single homogeneous medium, and instead it is governed by the competition between the matrix propagation and the weak interface deflection.
In other words, the relatively low microscopic toughness accounts for the susceptibility of crack initiation, whereas the weak bedding planes explain the deflection of crack propagation from a straight line. When the weak bedding planes with inferior mechanical properties and lower fracture energy are presented ahead of the crack, the resistance required for the crack to continue propagating through the matrix exceeds that along the weak interface, while the crack deflection occurs after the crack approaches the weak bedding planes, and thus the tensile-dominated process is gradually transited to a mixed-mode I–II fracture governed by interfacial slip. Based on the above discussion, this elucidation is highly consistent with the macroscopic crack morphology, the temporal sequence evolution of AE tensile/shear events, and the crack deflection mechanism obtained from the stress intensity factor analysis in
Section 4.1.
In addition to the stress-intensity-factor perspective discussed in
Section 4.1, the competition between crack penetration through the oil shale matrix and deflection into the weak bedding planes can be interpreted in an energy-based manner. In fracture mechanics, a candidate crack path becomes favorable when the available driving force, quantified by the energy release rate G, exceeds the corresponding resistance, quantified by the critical energy release rate Gc. Because the bedding planes in oil shale often contain organic-matter-rich weak interfaces and clay minerals, their effective resistance is expected to be lower than that of the intact matrix. Therefore, when the crack tip approaches a weak bedding plane, and the local crack tip field becomes mixed-mode I–II, the interfacial slip route can become energetically preferred, promoting crack deflection and the observed mixed tensile–shear failure.
Hence, from the perspective of fracture resistance, the three-point bending failure of oil shale can be recognized as a staged failure process controlled by the combination of low toughness-induced matrix crack initiation and low strength bedding-induced crack propagation. The former can determine the crack initiation under relatively low external loads, whereas the latter can determine that crack deflection from the original path during the propagation process, and eventually, the complex crack network is formed, which is characterized by the interleaved distribution of vertical tensile cracks and horizontal interface cracks.
4.4. Limitations
In addition, a practical limitation of this study is related to the observability and the AE instrumentation configuration. The crack paths discussed here are primarily identified from surface crack traces and the post-failure macroscopic morphologies (
Figure 6 and
Figure 7). Given the three-dimensional nature of fracture in laminated rocks, internal cracking and out-of-plane branching may occur without being fully represented by surface observations. Moreover, AE monitoring was conducted using a single sensor, which does not allow reliable event localization or correction for wave-velocity anisotropy associated with bedding. Consequently, the AF–RA-based classification should be interpreted as a qualitative indicator of the dominant fracture mechanism (tensile-dominated versus shear-involved activity) rather than a one-to-one spatial mapping between individual AE events and specific segments of the deflected crack. Future work will employ multi-sensor AE source location and complementary full-field/3D characterization techniques to better constrain the spatial correspondence among crack deflection, interfacial slip, and AE responses.
Furthermore, the current study leans primarily on parameter-based AE analysis and lacks comparisons with alternative AE analytical methods, such as waveform analysis and acoustic source location. As these advanced techniques could provide additional spatial information to directly map the damage zone and verify the crack deflection process, future research should expand the sample size, calibrate the classification threshold for specific shale types, and incorporate these complementary spatial and spectral analysis methods to further validate the mixed-mode fracture mechanism revealed in this work.