Article

Depositional Stage Subdivision and Quantitative Characterization of Gravity-Flow Deposits Using Wavelet Synchrosqueezed Transform

1
School of Geosciences, China University of Petroleum (East China), Qingdao 266580, China
2
State Key Laboratory of Deep Oil and Gas, China University of Petroleum (East China), Qingdao 266580, China
3
Oil and Gas Exploration Project Department of Western Shengli Oil Field, Dongying 257001, China
*
Author to whom correspondence should be addressed.
Appl. Sci. 2026, 16(13), 6526; https://doi.org/10.3390/app16136526
Submission received: 18 March 2026 / Revised: 20 June 2026 / Accepted: 26 June 2026 / Published: 30 June 2026

Abstract

The stage subdivision of gravity-flow deposits is crucial for identifying deep-water reservoirs. Traditional methods relying on visual core observation or macroscopic well log correlation are often subjective and lack the resolution to decipher dynamic fluid evolution. In this study, we introduced the Wavelet Synchrosqueezed Transform (WSST) to process a multi-log reconstructed curve from the Daluhu Area in the Dongying Depression. Compared to the traditional Continuous Wavelet Transform (CWT), WSST effectively eliminates spectral smearing, reassigning energy into highly focused energy ridges within the 0.5–2.5 m scale window to provide objective mathematical boundaries for depositional stages. Four quantitative parameters—Time-Frequency Concentration (TFC), Instantaneous Bandwidth (IBW), Energy Evolution Gradient (EEG), and Ridge Center Offset (RCO)—were extracted from the WSST matrix. Results show that each parameter serves a distinct geological purpose: EEG spikes accurately locate basal erosional scour surfaces; TFC characterizes the rhythmic amalgamation of gravity flow pulses; IBW captures the high-frequency algorithmic noise unique to massive homogeneous sandstones; and RCO tracks the macroscopic energy decay trajectory of individual flow events. This method offers a highly automated and objective tool for characterizing the hydrodynamic evolution of gravity flows, provided it is properly calibrated with core data to avoid algorithmic ambiguity.

1. Introduction

Gravity-flow deposits have increasingly become significant targets for unconventional hydrocarbon exploration in deep-lacustrine basins [1,2,3]. Gravity flows are characterized by subtle lithological variations, frequent sedimentary pulsations, and rapid vertical stacking patterns [4,5,6]. Accurately subdividing these high-frequency depositional stages is essential for predicting reservoir connectivity and understanding deep-water hydrodynamic mechanisms [7,8,9,10,11]. Conventionally, sequence stratigraphic subdivision and reservoir characterization heavily rely on core descriptions and visual interpretations of macroscopic well log morphologies [12,13,14]. However, due to the similar petrophysical properties of fine sands, silts, and mudstones, natural gamma-ray (GR) and other conventional logs often exhibit complex, high-frequency oscillations. Relying solely on visual identification to delineate sub-meter scale stage boundaries under such conditions is highly subjective and heavily dependent on the interpreter’s experience, often leading to ambiguous or inconsistent results [15,16,17].
To reduce human subjectivity, advanced spectral analysis, Machine Learning (ML), geology-informed deep learning, and time-frequency transformation techniques have been introduced into cyclostratigraphy and sequence stratigraphy [18,19,20].
While ML models (such as Random Forests or Convolutional Neural Networks) can automate static lithology classification with high accuracy, they face objective limitations. They often function as ‘black boxes’ lacking physical transparency, heavily rely on massive, precisely labeled training datasets [21]. Furthermore, ML typically outputs discrete lithofacies, making it difficult to characterize continuous depositional variations [22]. In contrast, time-frequency analysis methods like CWT and WSST provide a continuous, geologically meaningful representation of sedimentary rhythms without the prerequisite of large training sets.
The Continuous Wavelet Transform (CWT) has been widely utilized to extract cyclic geological signals from well logs because of its multi-resolution analysis capabilities [23,24,25,26]. Nevertheless, the traditional CWT is fundamentally limited by the Heisenberg uncertainty principle. In the high-frequency (small-scale) range corresponding to episodic gravity flow events, CWT suffers from severe spectral smearing, causing the energy of adjacent geological events to overlap into blurred blobs.
To overcome the resolution barrier of CWT, Daubechies et al. (2011) introduced the Wavelet Synchrosqueezed Transform (WSST) [27]. Through a post-processing time-frequency reassignment mechanism, WSST effectively “squeezes” divergent wavelet coefficients toward their true instantaneous frequencies. Recently, WSST has shown immense potential in modern well log evaluation and complex signal processing fields [28,29,30,31].
This study aims to apply WSST to a multi-log reconstructed curve from the Daluhu Area in the Dongying Depression to establish an objective, high-resolution framework for subdividing gravity flow stages. Instead of merely using the algorithm for static line-drawing, we creatively extract four dynamic quantitative parameters from the WSST matrix to digitally characterize the complex hydrodynamic processes (e.g., basal scouring, internal homogeneity, and waning flow sequences). By directly comparing the mathematically derived boundaries with core-calibrated lithological columns, we objectively analyze the physical significance of the algorithmic responses and discuss their practical advantages and limitations in petroleum engineering applications.

2. Geological Background

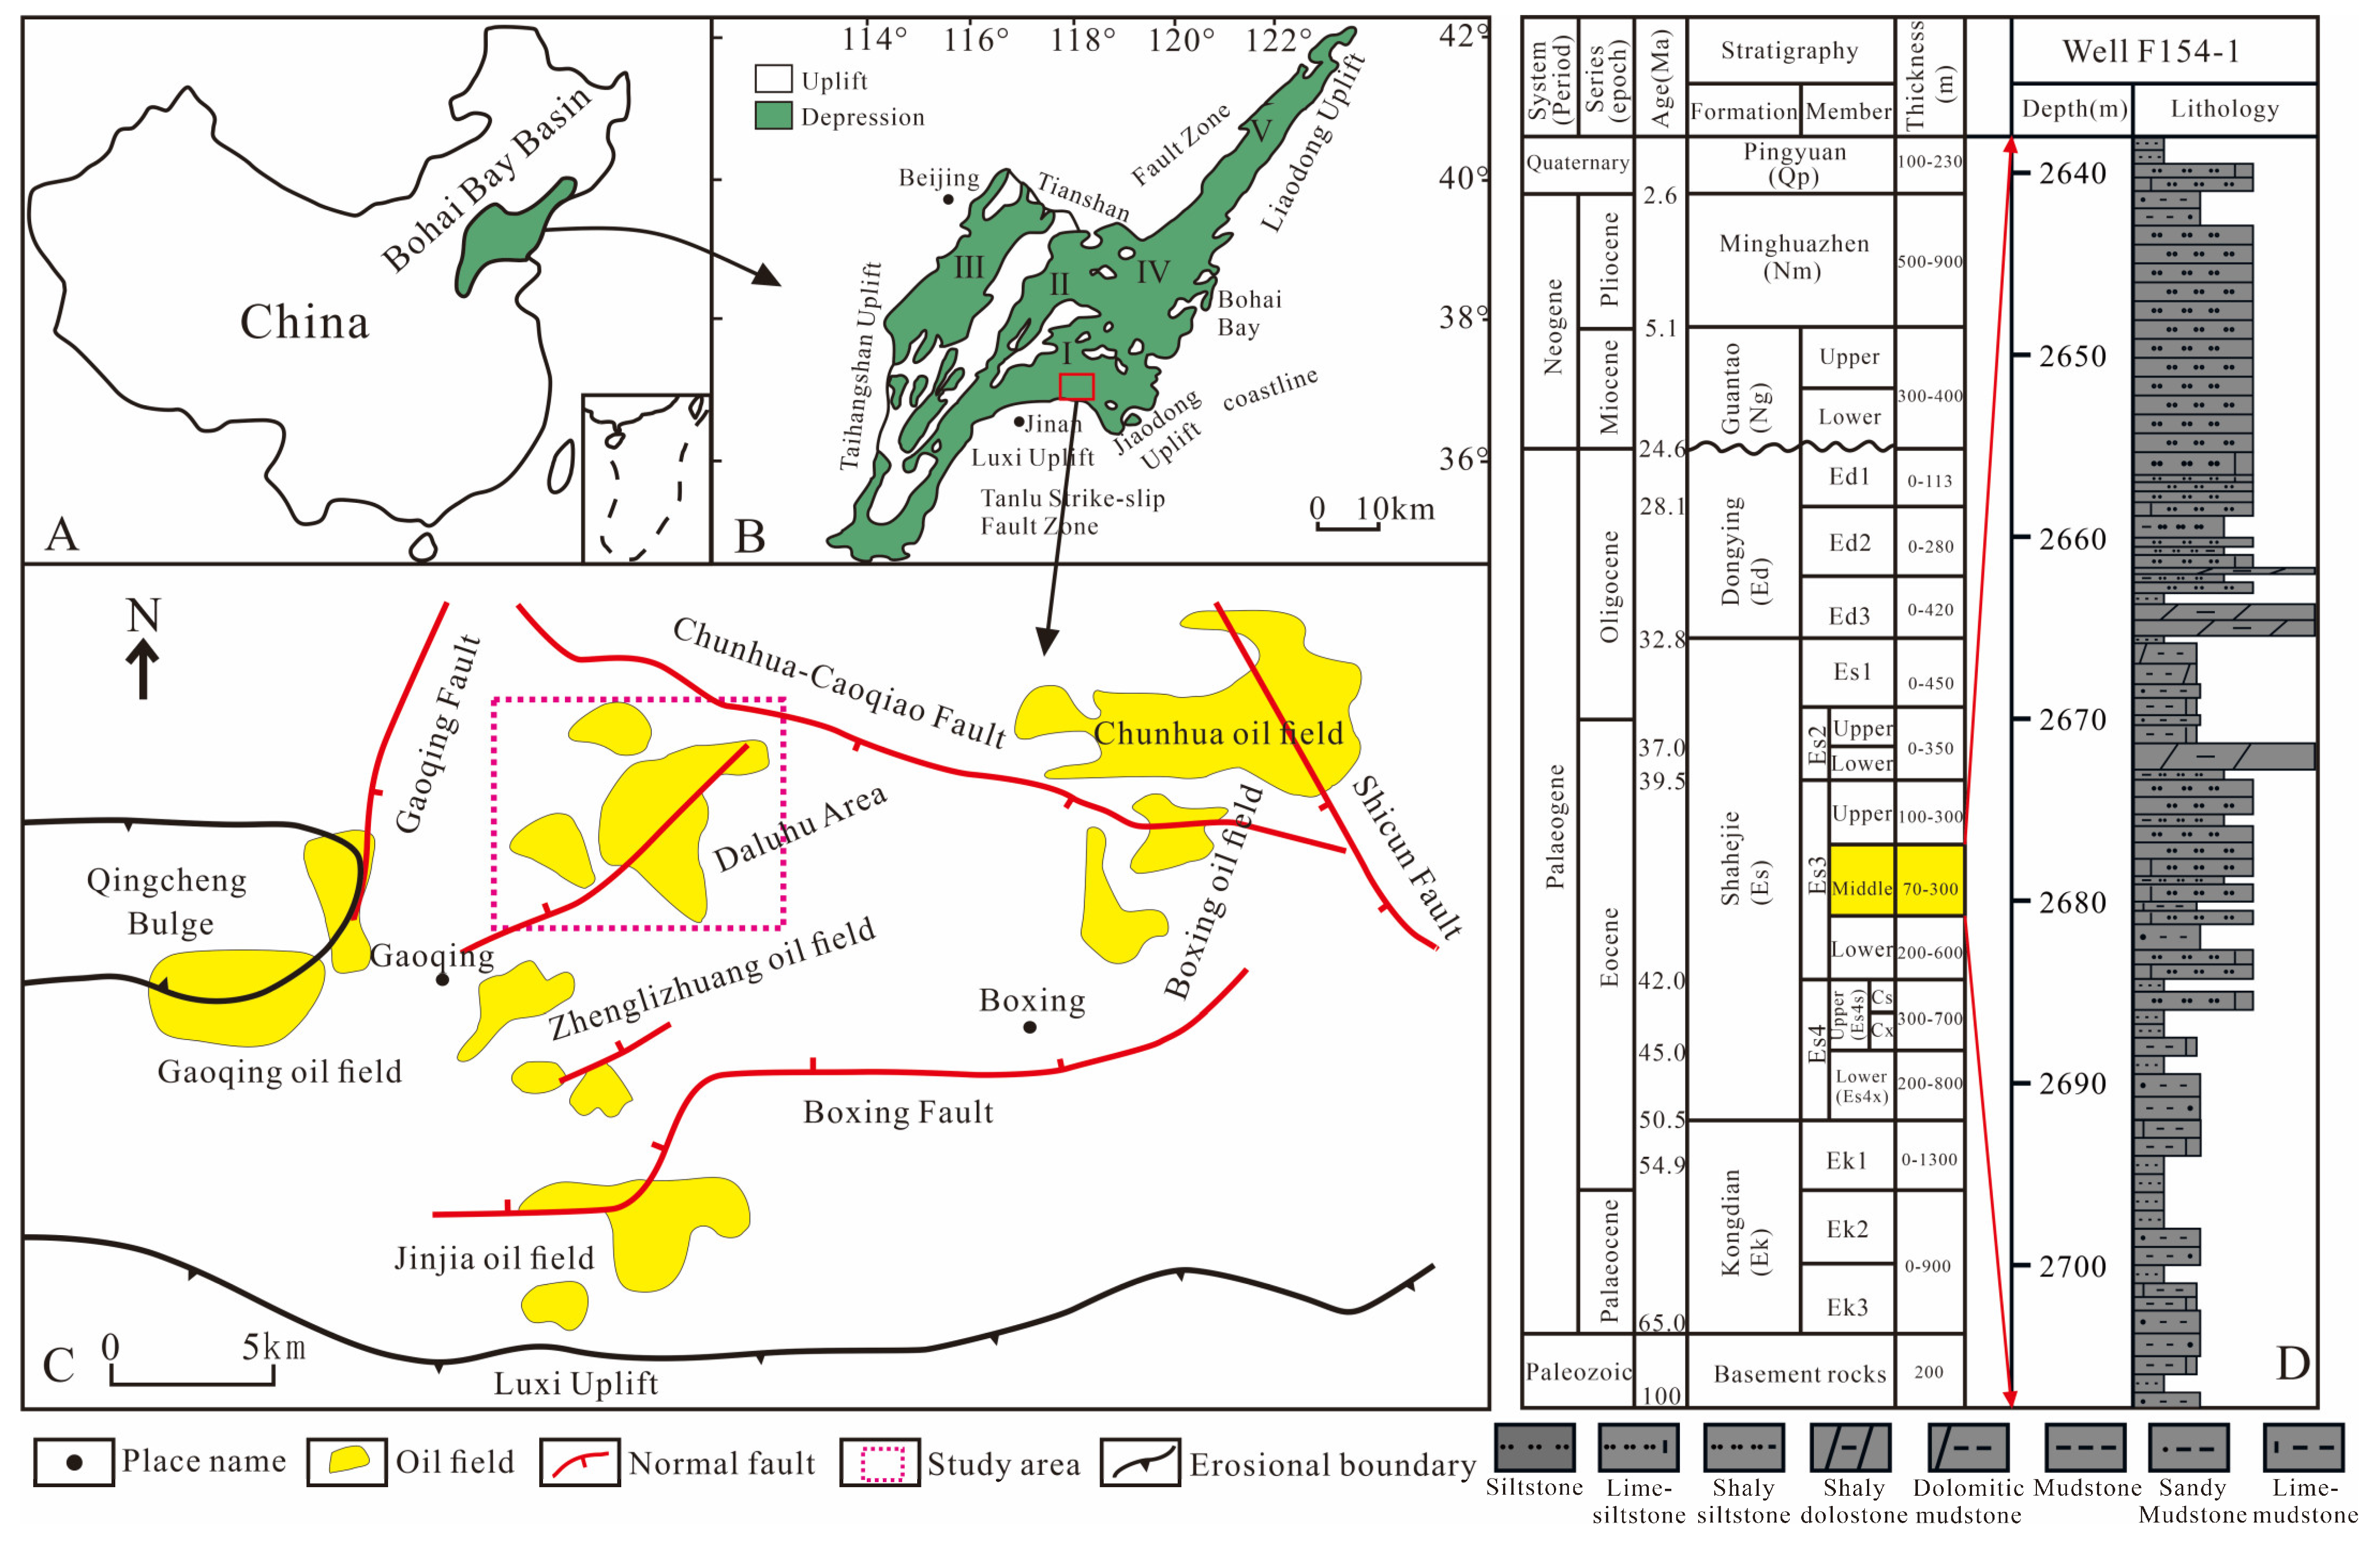
The Bohai Bay Basin, a prolific hydrocarbon-bearing province in Eastern China, spans approximately 200,000 km2 and possesses significant strategic energy value (Figure 1A). Within the Jiyang Sub-basin of this framework, the Boxing Sag developed as a north-dipping faulted block situated in the Dongying Depression (Figure 1B). Structurally, the sag is delineated by the Chunhua-Caoqiao Fault to the north, the Luxi Uplift to the south, and the Gaoqing and Shicun Faults to the west and east, respectively (Figure 1C) [32].
This study specifically focuses on the Daluhu Area, which occupies the northwestern sector of the Boxing Sag, adjacent to the western Qingcheng Uplift (Figure 1C). Comprehensive drilling investigations indicate a Cenozoic to Quaternary stratigraphic succession in the Daluhu Area, comprising the Paleogene (Kongdian, Shahejie, and Dongying Formations), Neogene (Guantao and Minghuazhen Formations), and Quaternary (Pingyuan Formation) from base to top. The Shahejie Formation (Es) is categorized into four members (Es4–Es1), with the third member (Es3) further partitioned into lower (Es3x), middle (Es3z), and upper (Es3sd) sub-members (Figure 1D).
The middle Es3 sub-member (Es3z), the primary focus of this investigation, is encountered at burial depths of 2600–2800 m. Lithologically, the Es3z is characterized by a complex suite of conglomerates, fine-grained sandstones, siltstones, and mudstones, which constitute typical gravity-flow reservoirs, exhibiting intense internal heterogeneity requiring high-resolution characterization [33]. These units constitute typical gravity flow reservoirs, exhibiting moderate porosity (6–20%) and low permeability (0.1–10 mD). Despite its inherent low-permeability nature, the reservoir is characterized by significant oil and gas enrichment, necessitating high-resolution stratigraphic characterization to resolve its intense internal heterogeneity.

3. Data and Methodology

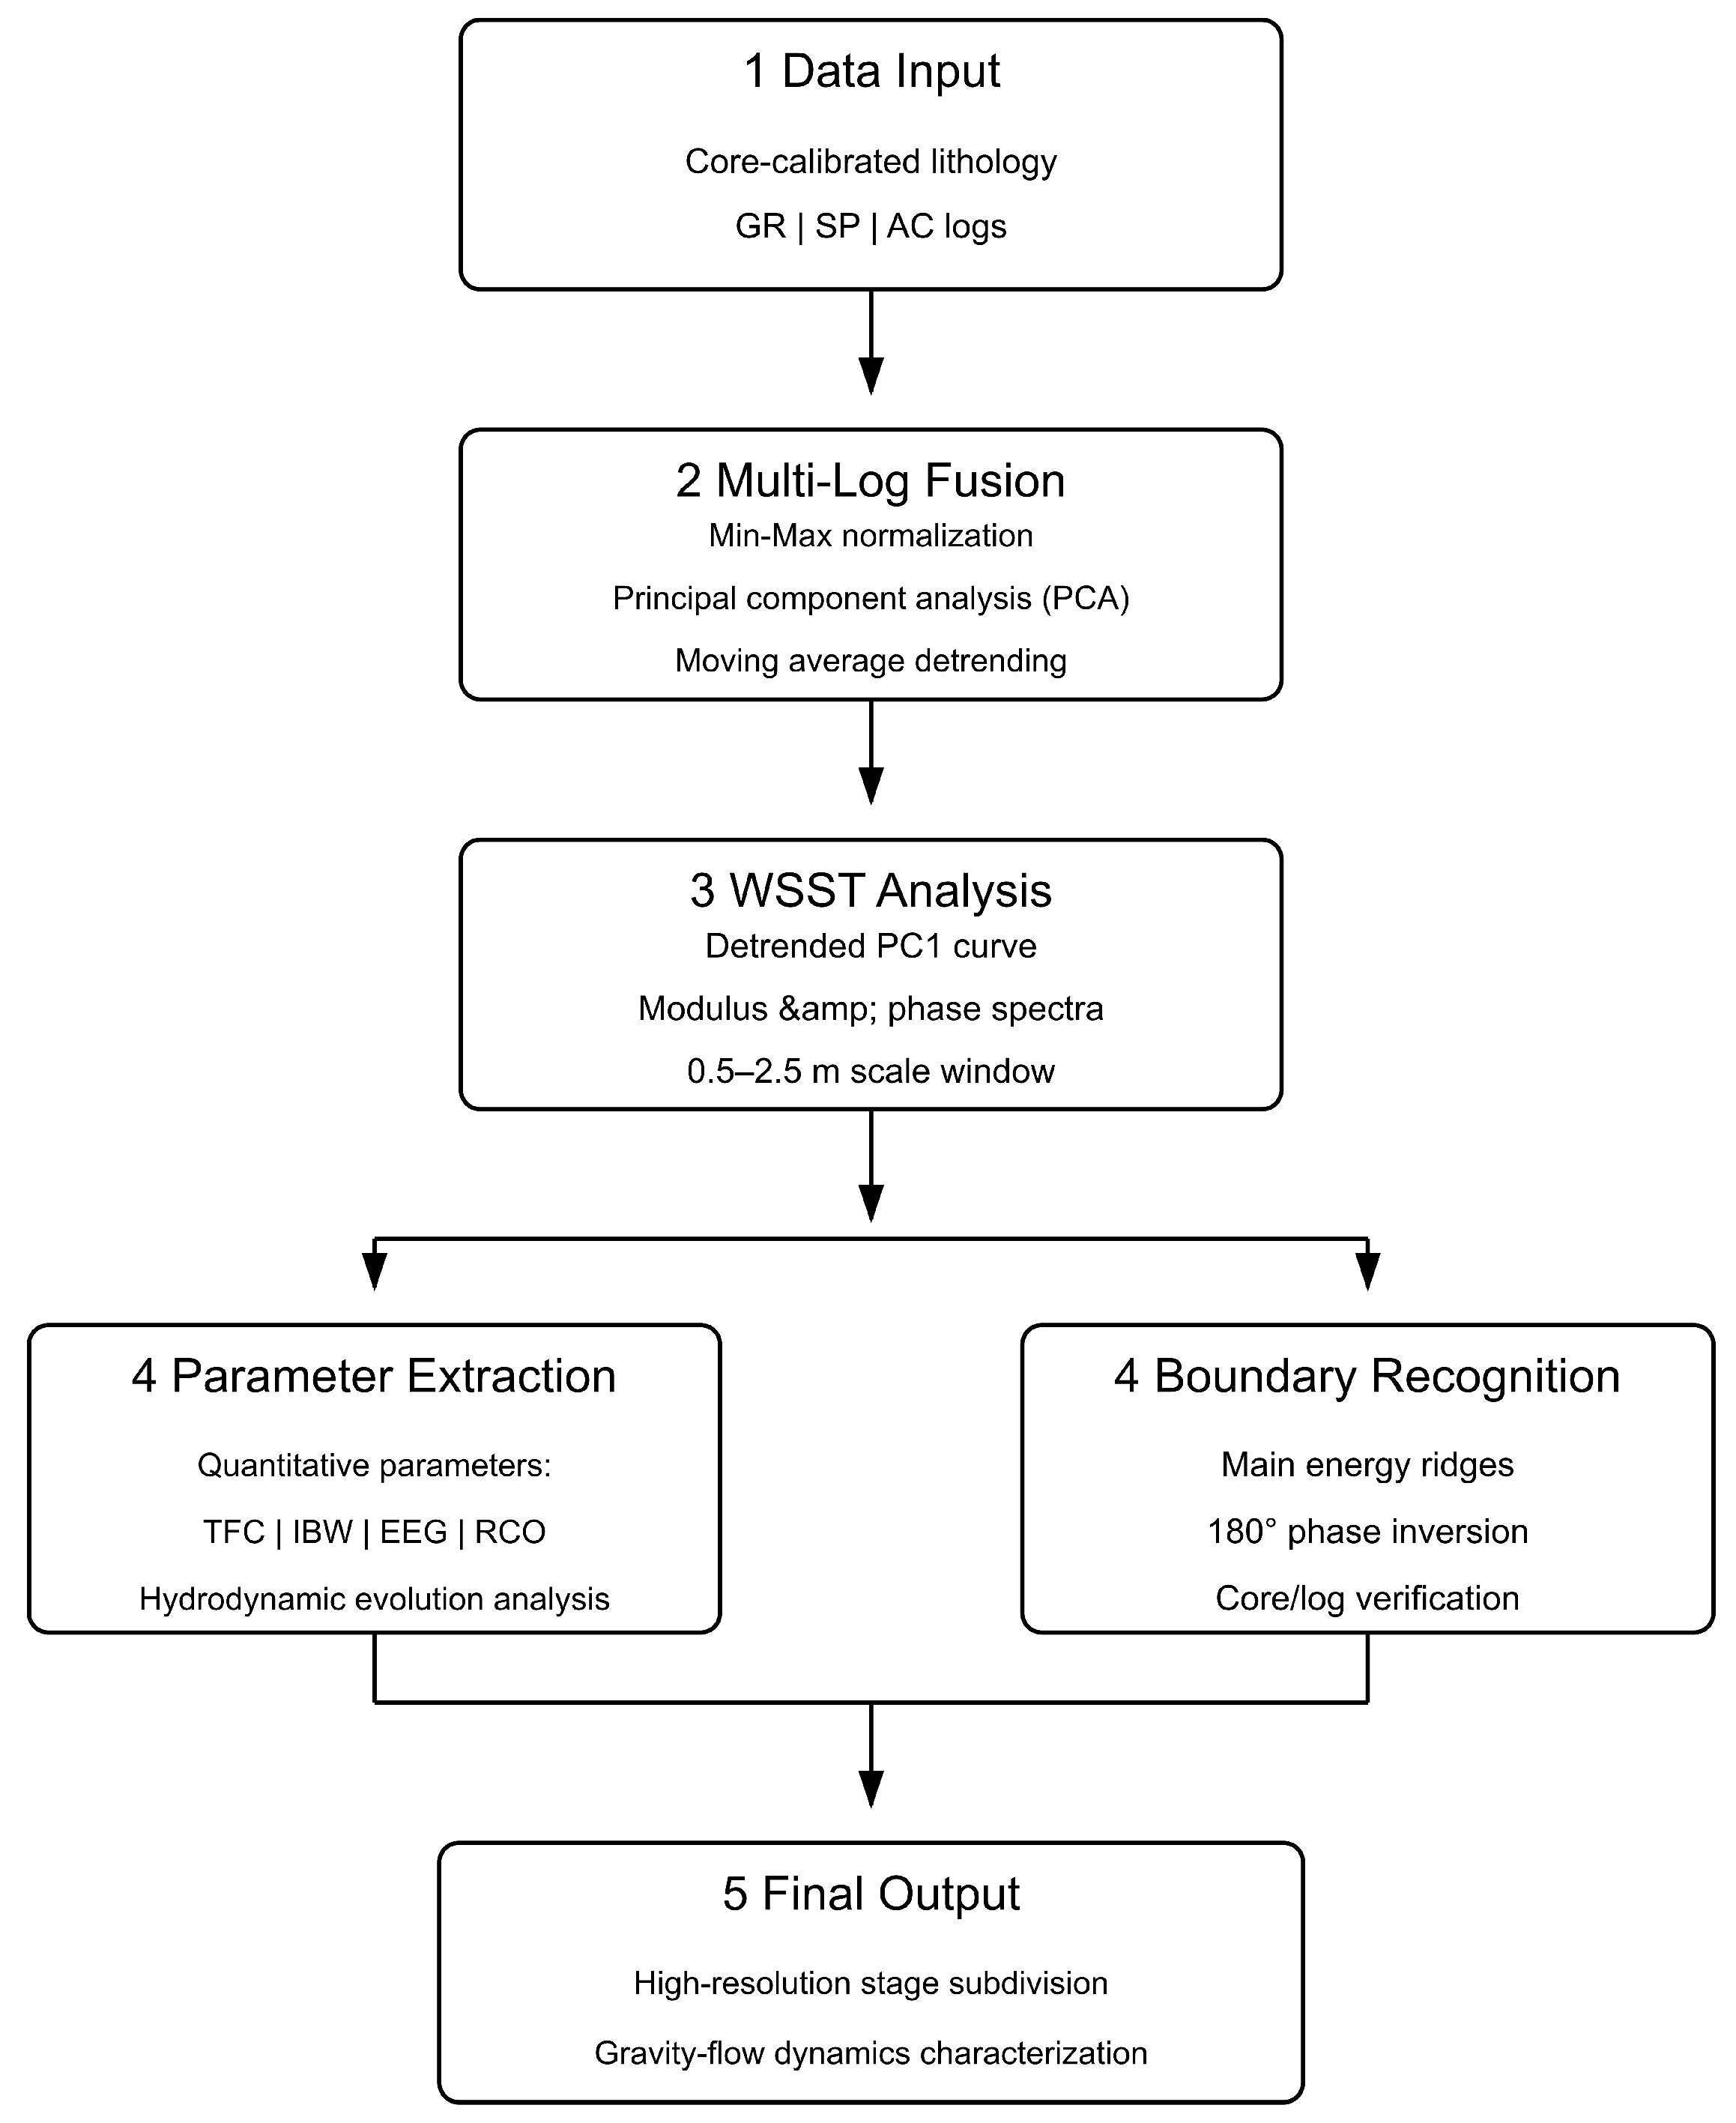
To systematically construct the high-resolution sequence framework and quantitatively characterize the depositional dynamics of fine-grained gravity flows, a comprehensive technical workflow was established (Figure 2). The workflow consists of four consecutive stages. Initially, well log data preparation and multi-log fusion are conducted, wherein GR, AC, and SP logs are normalized, subjected to Principal Component Analysis (PCA), and detrended to extract the robust, high-frequency PC1 pseudo-log. Subsequently, the detrended PC1 signal undergoes Wavelet Synchrosqueezed Transform (WSST) analysis to generate highly focused modulus and phase spectra within the optimal 0.5–2.5 m geological scale window. Following this, a mathematical interpretation is performed: static sequence boundaries are objectively identified using continuous main energy ridges and phase inversions, while the dynamic evolution of the gravity flow is continuously tracked by extracting four quantitative parameters (TFC, IBW, EEG, and RCO). Ultimately, these algorithm-derived physical constraints are integrated with core-calibrated lithology to achieve an objective, high-resolution stage subdivision and hydrodynamic interpretation of the target reservoir.

3.1. Multi-Log Feature Fusion and Data Preprocessing

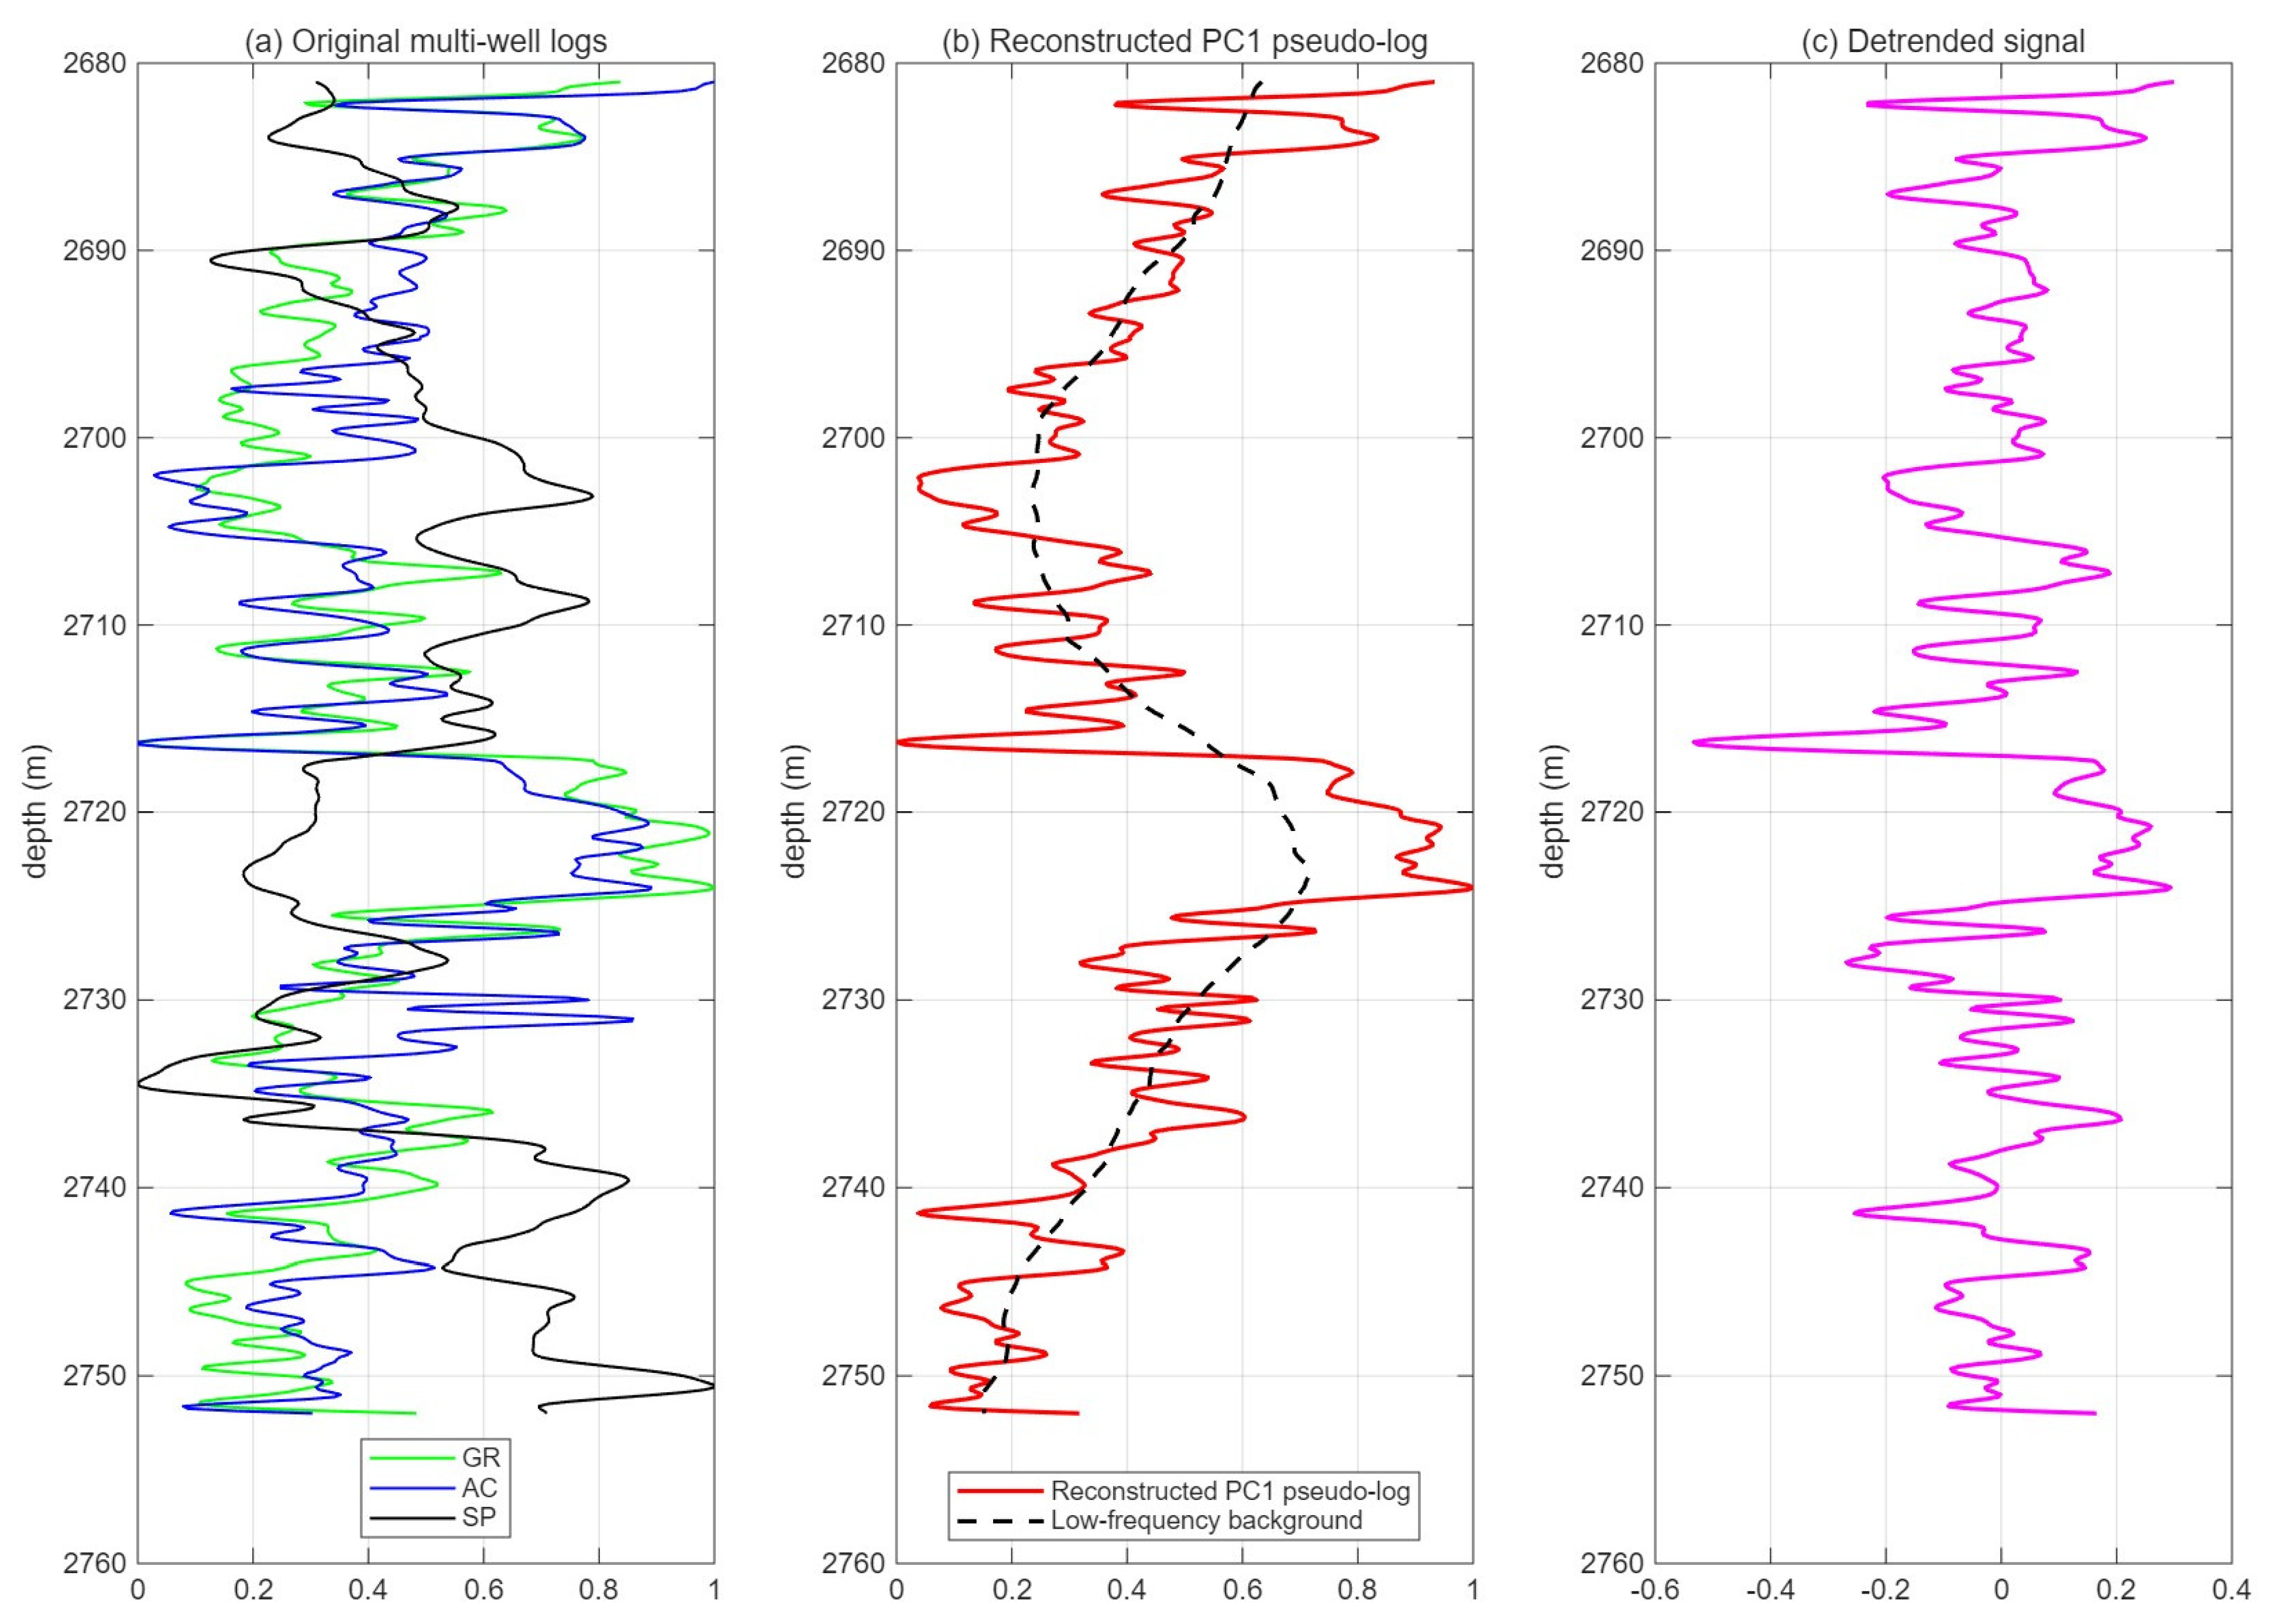
To accurately capture the physical and sedimentological aspects of the fine-grained gravity flow system, this study integrated three distinct well logs: Natural Gamma-Ray (GR) reflecting clay content and lithology, Acoustic Transit Time (AC) indicating rock porosity and mechanical compaction, and Spontaneous Potential (SP) responding to formation permeability and fluid mobility. Relying solely on a single GR log can sometimes lead to ambiguity due to localized radioactive anomalies (e.g., specific clay minerals). Integrating these three logs ensures that the subsequent time-frequency analysis is driven by comprehensive petrophysical variations rather than isolated noise. The multi-step preprocessing and fusion workflow was conducted as follows (Figure 3):
(1) Min–Max Normalization
Due to differences in logging instruments, borehole environments, and physical dimensions, the GR, AC, and SP logs exhibit vastly different numerical ranges. Direct linear combination would cause the curve with the largest absolute values to unreasonably dominate the model. Therefore, min–max normalization was applied to map all participating raw logs into a unified, dimensionless interval of [0, 1]. This process eliminates dimensional discrepancies and converts the signals into dimensionless relative amplitudes for quantitative comparison:
X norm = X − X min X max − X min
where X is the value of the raw log at a specific depth sampling point; X max and X min are the maximum and minimum values of the raw log within the target interval, respectively; and X norm is the normalized relative amplitude.
(2) Principal Component Analysis (PCA) and Feature Fusion
PCA is a multivariate statistical dimensionality reduction technique that transforms a set of correlated variables into linearly uncorrelated principal components via orthogonal transformation. Assuming the normalized log dataset forms a matrix X, its covariance matrix C is given by:
C = 1 n − 1 X T X
The eigenvalues λ and the corresponding eigenvectors V of the covariance matrix satisfy CV   =   λ V . The magnitude of the eigenvalue λ i represents the data variance (i.e., the amount of shared geological information) explained by the i-th principal component. In this study, the First Principal Component (PC1) was extracted as the reconstructed comprehensive pseudo-log. PC1 exhibits the maximum variance contribution rate (80.3%), enabling it to retain the predominant geological features shared by the original multi-logs while suppressing random environmental noise. PC1 is calculated as a linear weighted sum of the normalized logs.
(3) Background Detrending
The reconstructed PC1 curve inherently contains a low-frequency background trend caused by increasing burial depth and mechanical compaction. To facilitate the subsequent high-resolution time-frequency analysis (i.e., extracting WSST energy ridges), this macroscopic compaction trend must be removed. A moving average method was employed to fit the low-frequency baseline, which was then subtracted from the original PC1 signal. The resulting detrended high-frequency signal is stationary with a mean approaching zero, making it mathematically optimal for wavelet transformation.
(4) Depth Alignment and Resampling Resolution
Throughout the data preprocessing phase, the raw well logs were acquired with a standard sampling interval of 0.125 m. This inherent instrument resolution was strictly preserved rather than mathematically interpolated. Retaining the 0.125 m step size not only prevents the introduction of artificial interpolation artifacts but also satisfies the Nyquist–Shannon sampling theorem, enabling the accurate algorithmic detection of high-frequency depositional pulses and sedimentary beds thicker than 0.25 m without spectral aliasing.

3.2. Continuous Wavelet Transform (CWT)

The Continuous Wavelet Transform (CWT) serves as the mathematical foundation for analyzing non-stationary geological signals by mapping the 1D depth-domain well log into a 2D scale-depth plane. In this study, the Analytic Morse Wavelet was selected as the mother wavelet over traditional options (e.g., Mexican Hat or Morlet) due to fundamental mathematical constraints. Because our sequence boundary identification strictly requires the precise extraction of a 180° instantaneous phase jump, real-valued wavelets like the Mexican Hat are inherently disqualified, as they cannot separate amplitude from phase information. Furthermore, as established in signal processing literature [34], the traditional Morlet wavelet is only approximately analytic, whereas the Morse wavelet is exactly analytic with strictly parameterized symmetry. This exact analyticity minimizes numerical artifacts during the WSST time-frequency reassignment process and provides superior time-frequency localization. Consequently, the Morse wavelet enables the simultaneous and highly accurate extraction of both modulus and phase information, making it theoretically optimal for resolving the complex, high-frequency sedimentary pulses inherent in gravity flows.
The CWT is defined as:
W x a , b = 1 a ∫ x z ψ ∗ z − b a d z
where W x a , b is the wavelet coefficient; x(z) represents the Detrended comprehensive log; ψ ∗ denotes the complex conjugate of the Morse mother wavelet; a is the scale parameter, which is geologically proportional to the thickness (spatial frequency) of the depositional cycle; b is the translation parameter corresponding to the depth z; and z is the depth variable.

3.3. Wavelet Synchrosqueezed Transform

Traditional CWT is strictly limited by the Heisenberg uncertainty principle, often suffering from severe spectral smearing in the small-scale (high-frequency) range. To overcome this resolution barrier, the Wavelet Synchrosqueezed Transform (WSST) was introduced. The core mathematical logic of WSST is “time-frequency reassignment”. It first calculates the instantaneous spatial frequency ω x a , b for every point on the time-frequency plane:
ω x a , b = − i W x a , b − 1 ∂ ∂ b W x a , b
where ω x a , b represents the instantaneous frequency; i is the imaginary unit; and ∂ ∂ b denotes the partial derivative with respect to depth. By forcibly “squeezing” the divergent energy coefficients along the scale axis toward their true instantaneous frequency centers, WSST reconstructs the blurred energy blobs into extremely sharp and highly concentrated “Energy Ridges”. Mathematically, these ridges represent the intrinsic oscillatory components of the signal; geologically, they precisely pinpoint abrupt lithological boundaries or instantaneous peaks of hydrodynamic energy.

3.4. Multi-Criteria Constraint for Sequence Boundary Identification

Leveraging the ultra-high resolution provided by WSST, this study discards traditional subjective visual delineation and establishes an objective, three-pronged criteria system for stage identification:
(1)
Energy Ridge Discrimination: Within the optimal geological scale window of 0.5–2.5 m, the brightest and laterally continuous “main energy ridges” in the WSST modulus spectrum are selected as the primary indicators of physical stage boundaries.
(2)
Instantaneous Phase Inversion: By integrating the WSST phase spectrum, horizontal sections exhibiting a 180° (π rad) polarity inversion (phase jump) strictly co-located with the main ridges are identified. This phase discontinuity provides a mathematical verification for the uniqueness of the boundary.
(3)
Geological Calibration: The mathematically identified depth coordinates are cross-validated against raw well logs and core-calibrated lithological columns to ensure that every sequence boundary corresponds to a genuine depositional hiatus or hydrodynamic transition.

3.5. Quantitative Characterization of Depositional Dynamics Based on WSST

To advance from static stratigraphic correlation to dynamic fluid evolution analysis, this study creatively extracts four 1D quantitative dynamic parameters from the 2D WSST matrix. These parameters constitute a mathematical dictionary for deciphering the evolution of gravity flows:
(1) Time-Frequency Concentration (TFC)
TFC measures the sparsity and focusing level of signal energy on the time-frequency plane, defined as the ratio of the higher-order moments of the total energy:
T F C z = ∫ W w s s t a , z 4 d a ∫ W w s s t a , z 2 d a 2
where W w s s t a , z represents the reassigned WSST coefficient at scale a and depth z. Geologically, higher TFC values indicate extreme energy focusing. Continuous high TFC fluctuations signify relatively pure, thick-bedded sandstones formed by the frequent amalgamation of high-energy turbidite pulses. Conversely, a sharp drop in TFC indicates a transition to mud-rich thin interbeds.
(2) Instantaneous Bandwidth (IBW)
IBW characterizes the dispersion range (standard deviation) of energy around the dominant scale, defined as:
I B W z = ∫ a − a m e a n 2 W w s s t a , z 2 d a ∫ W w s s t a , z 2 d a
where a m e a n is the energy-weighted mean scale at depth z. Geologically, IBW captures the abruptness and frequency of environmental fluctuations. A narrow and stable IBW corresponds to steady, high-density fluid transport, whereas intense, “burr-like” high-frequency IBW oscillations quantitatively reveal a highly chaotic environment.
(3) Energy Evolution Gradient (EEG)
EEG is defined as the first-order spatial derivative of the instantaneous total energy with respect to depth, used to determine the physical nature of the contact boundaries:
E E G z = d d z ∫ W w s s t a , z 2 d a
where d d z denotes the derivative with respect to depth z. Geologically, when EEG reaches a local maximum (i.e., presenting a sharp spike), it represents an instantaneous energy outburst. Mathematically, this captures the “scour surface”, proving the presence of strong basal erosion and downcutting during the initial stage of the gravity flow event.
(4) Ridge Center Offset (RCO)
RCO is defined as the deviation of the dominant scale S c of the energy ridge within a specific stage from its initial basal reference scale:
R C O z = S c z − S c z b a s e
where S c z is the scale corresponding to the maximum energy at depth z, and S c z b a s e is the dominant scale at the bottom boundary of the current stage. Geologically, RCO quantitatively characterizes the macroscopic evolution trajectory of hydrodynamic energy within a single sequence. A shift towards smaller scales (RCO < 0) reflects a progradational sequence with increasing energy, while drifting towards larger scales or returning to zero indicates energy decay and steady-state deposition.

4. Results

4.1. High-Resolution Time-Frequency Decomposition and Algorithm Performance Comparison

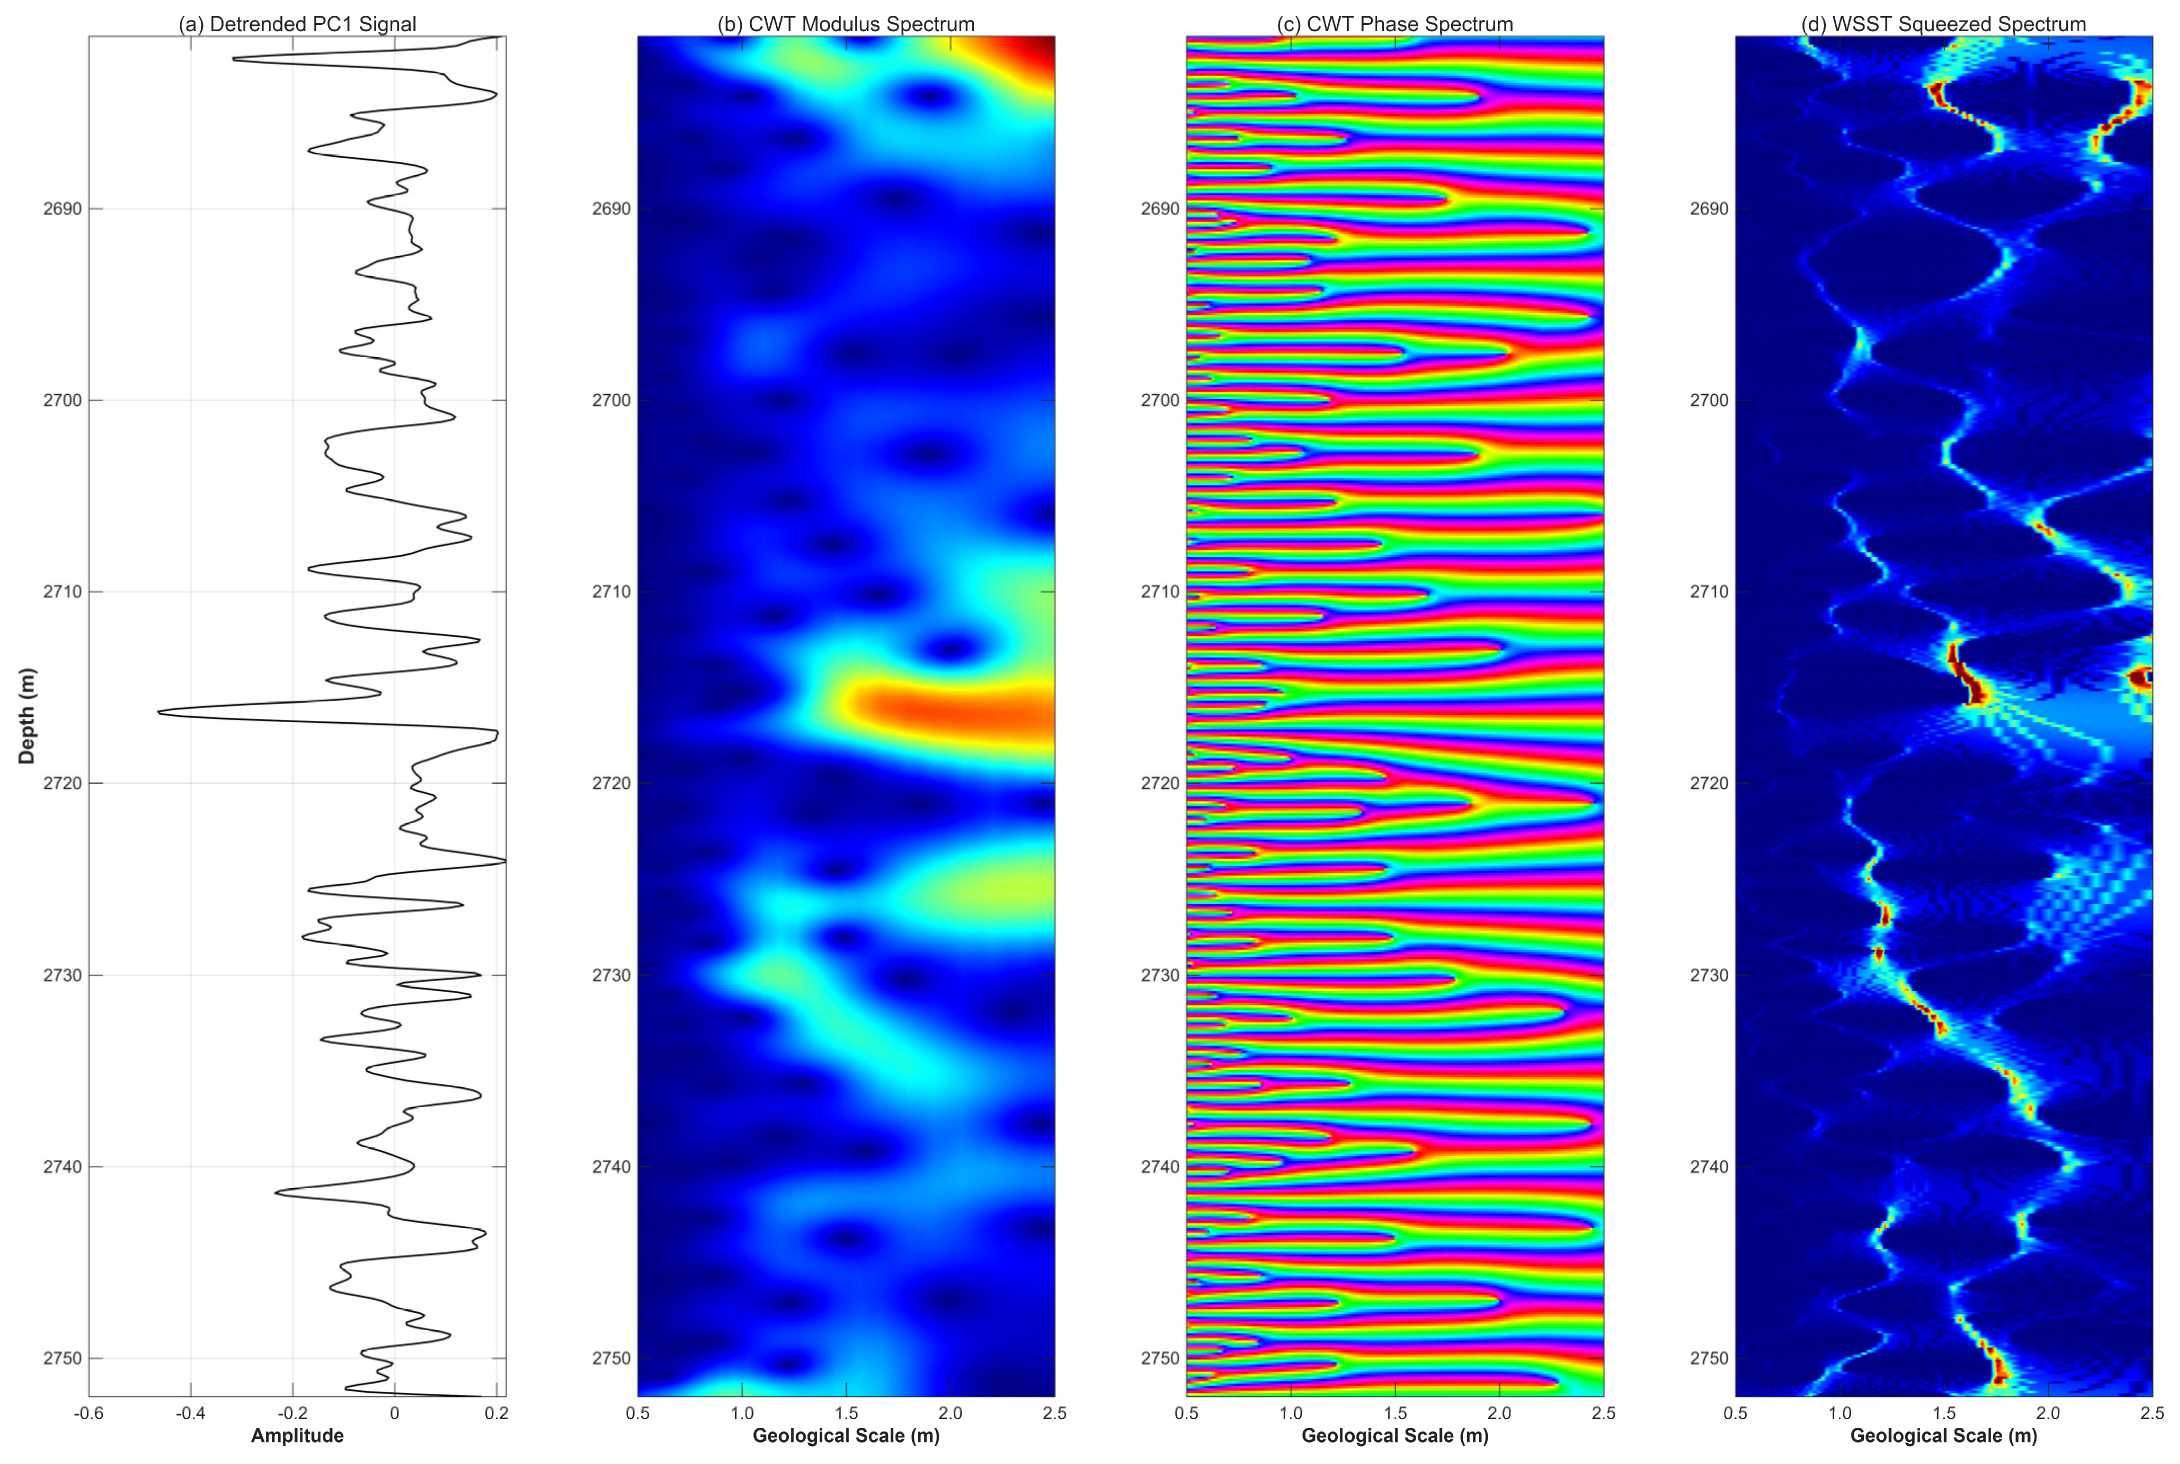
To accurately identify the sedimentary cycles of gravity flows, this study compared the processing performance of the Continuous Wavelet Transform (CWT) and the Wavelet Synchrosqueezed Transform (WSST) using actual well log signals. Figure 4 illustrates the modulus and phase spectra of both algorithms within the high-frequency scale window of 0–2.5 m.

4.1.1. Modulus Distribution and Energy Focusing Analysis

The traditional CWT modulus spectrum (Figure 4b) effectively captures the macroscopic fluctuations in signal energy with depth. However, due to the inherent spectral smearing effect of the wavelet time-frequency window, the energy manifests as divergent, cloud-like blobs. Particularly at micro-scales around 0.5 m, the energy responses of adjacent high-frequency geological events severely overlap, rendering it mathematically impossible to precisely delineate the physical boundaries of individual depositional pulses. In stark contrast, the WSST modulus spectrum (Figure 4d) achieves extreme energy convergence through its unique instantaneous frequency reassignment mechanism. The previously blurred and overlapping CWT energy blobs are forcibly “squeezed” and reconstructed into a series of highly luminous and narrow energy ridges.
The superior energy-focusing capability of WSST over CWT is not merely visual but has been rigorously quantified in signal processing literature. Quantitative comparative studies utilizing metrics such as Shannon/Rényi entropy and Energy Concentration Ratios (ECR) have mathematically demonstrated that WSST significantly reduces the time-frequency spread inherent in CWT [35]. Specifically, in geophysical applications, WSST has been quantitatively proven to narrow the instantaneous bandwidth of overlapping signals by up to 30–50% compared to traditional CWT, dramatically lowering the spectral entropy [36]. Consistent with these established quantitative findings, our well log analysis (Figure 4) corroborates this extreme energy convergence, transforming blurred CWT blobs into definitive, high-resolution boundary lines suitable for objective stage subdivision.

4.1.2. Geological Significance of Energy Ridges

The highly focused energy ridges generated by WSST exhibit a remarkably high signal-to-noise ratio. Mathematically, these sharp horizontal ridges represent the localized energy extrema of non-stationary log fluctuations. Geologically, they precisely pinpoint instantaneous transitions in the hydrodynamic environment or abrupt physical lithological interfaces (e.g., scour surfaces or sudden shifts in grain size). By transforming diffuse energy zones into definitive boundary lines, WSST provides a robust, objective mathematical basis for the high-resolution subdivision of gravity-flow stages.

4.1.3. Rationale for Scale Window Selection

As observed along the vertical axis of Figure 4, the analytical scale in this study is strictly confined to 2.5 m and below. This selection is constrained not only by the geological thickness of individual gravity-flow events, but also by an objective assessment of the spectra: below the 2.5 m threshold, WSST ridge morphologies are most discrete and independent, effectively resolving high-frequency depositional pulsations within a single stage. If the scale is excessively large, the signal becomes dominated by background geological cycles (e.g., long-term base-level changes), thereby masking the intricate details of high-frequency gravity flow events.

4.2. High-Resolution Stage Subdivision of Fine-Grained Gravity Flows Based on WSST Energy Ridges

4.2.1. Identification Characteristics of Main Stage Boundaries

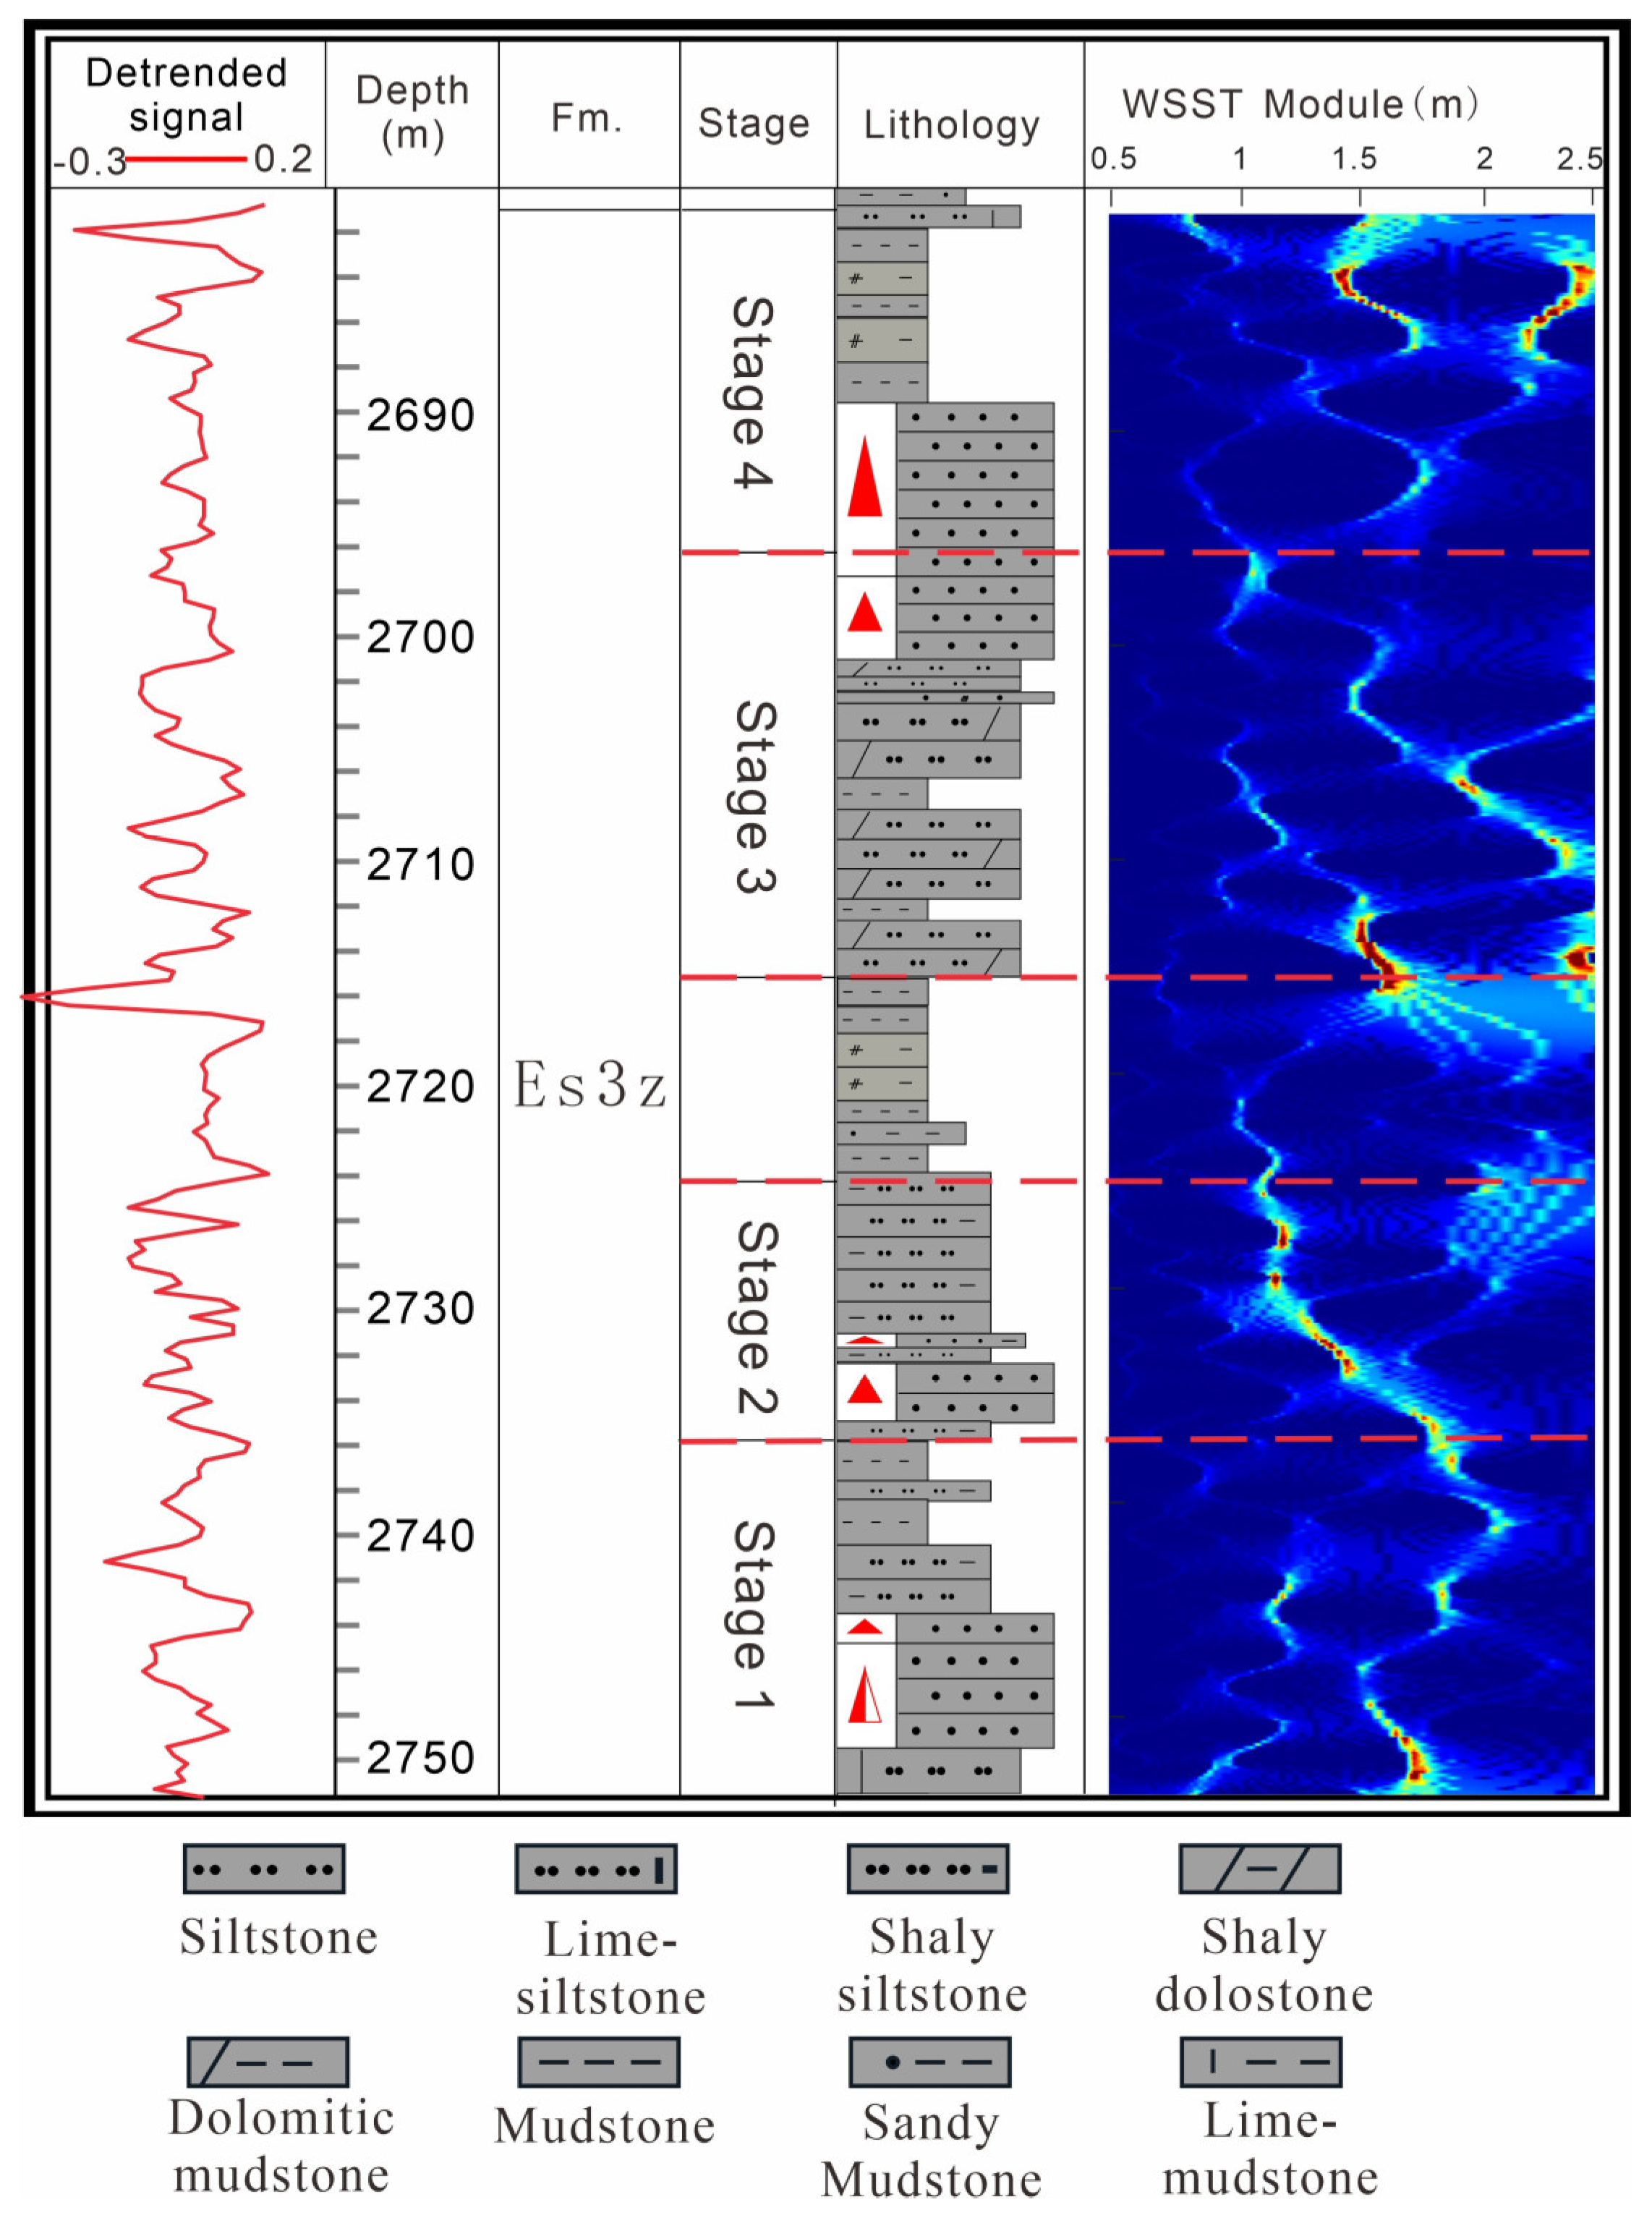
Having established the advantageous frequency band of 0.5–2.5 m, this study integrated the geological characteristics of the detrended signal with WSST energy ridges to perform a high-resolution stage subdivision of the fine-grained gravity flow reservoir in the Es3z submember. Taking Well F162-X7 as an example (Figure 5), the target interval (2681.0–2752.0 m) can be clearly subdivided into four complete depositional stages (Stage 1 to Stage 4).

4.2.2. Geological Interpretation of Internal “Secondary Bright Spots”

It is noteworthy that localized, high-luminosity energy ridges also appear within the individual stages (e.g., the internal sections of Stage 1 and Stage 2 in Figure 5). This study did not designate these internal bright spots as stage boundaries, primarily based on the mathematical constraint of scale continuity. Observations reveal that these internal secondary ridges are mainly concentrated in the ultra-high-frequency scale range (less than 1.0 m) and exhibit poor lateral continuity, often decaying or vanishing at scales above 1.5 m. In contrast, the main ridges acting as stage boundaries possess sufficient energy to stably penetrate to the 2.0 m or even 2.5 m scale. Geologically, these secondary ridges represent the actual record of high-frequency hydrodynamic pulsations or individual surges within a single gravity flow event, rather than a macroscopic sequence-bounding hiatus.

4.3. Quantitative Characterization and Lithological Response of Gravity Flow Dynamics

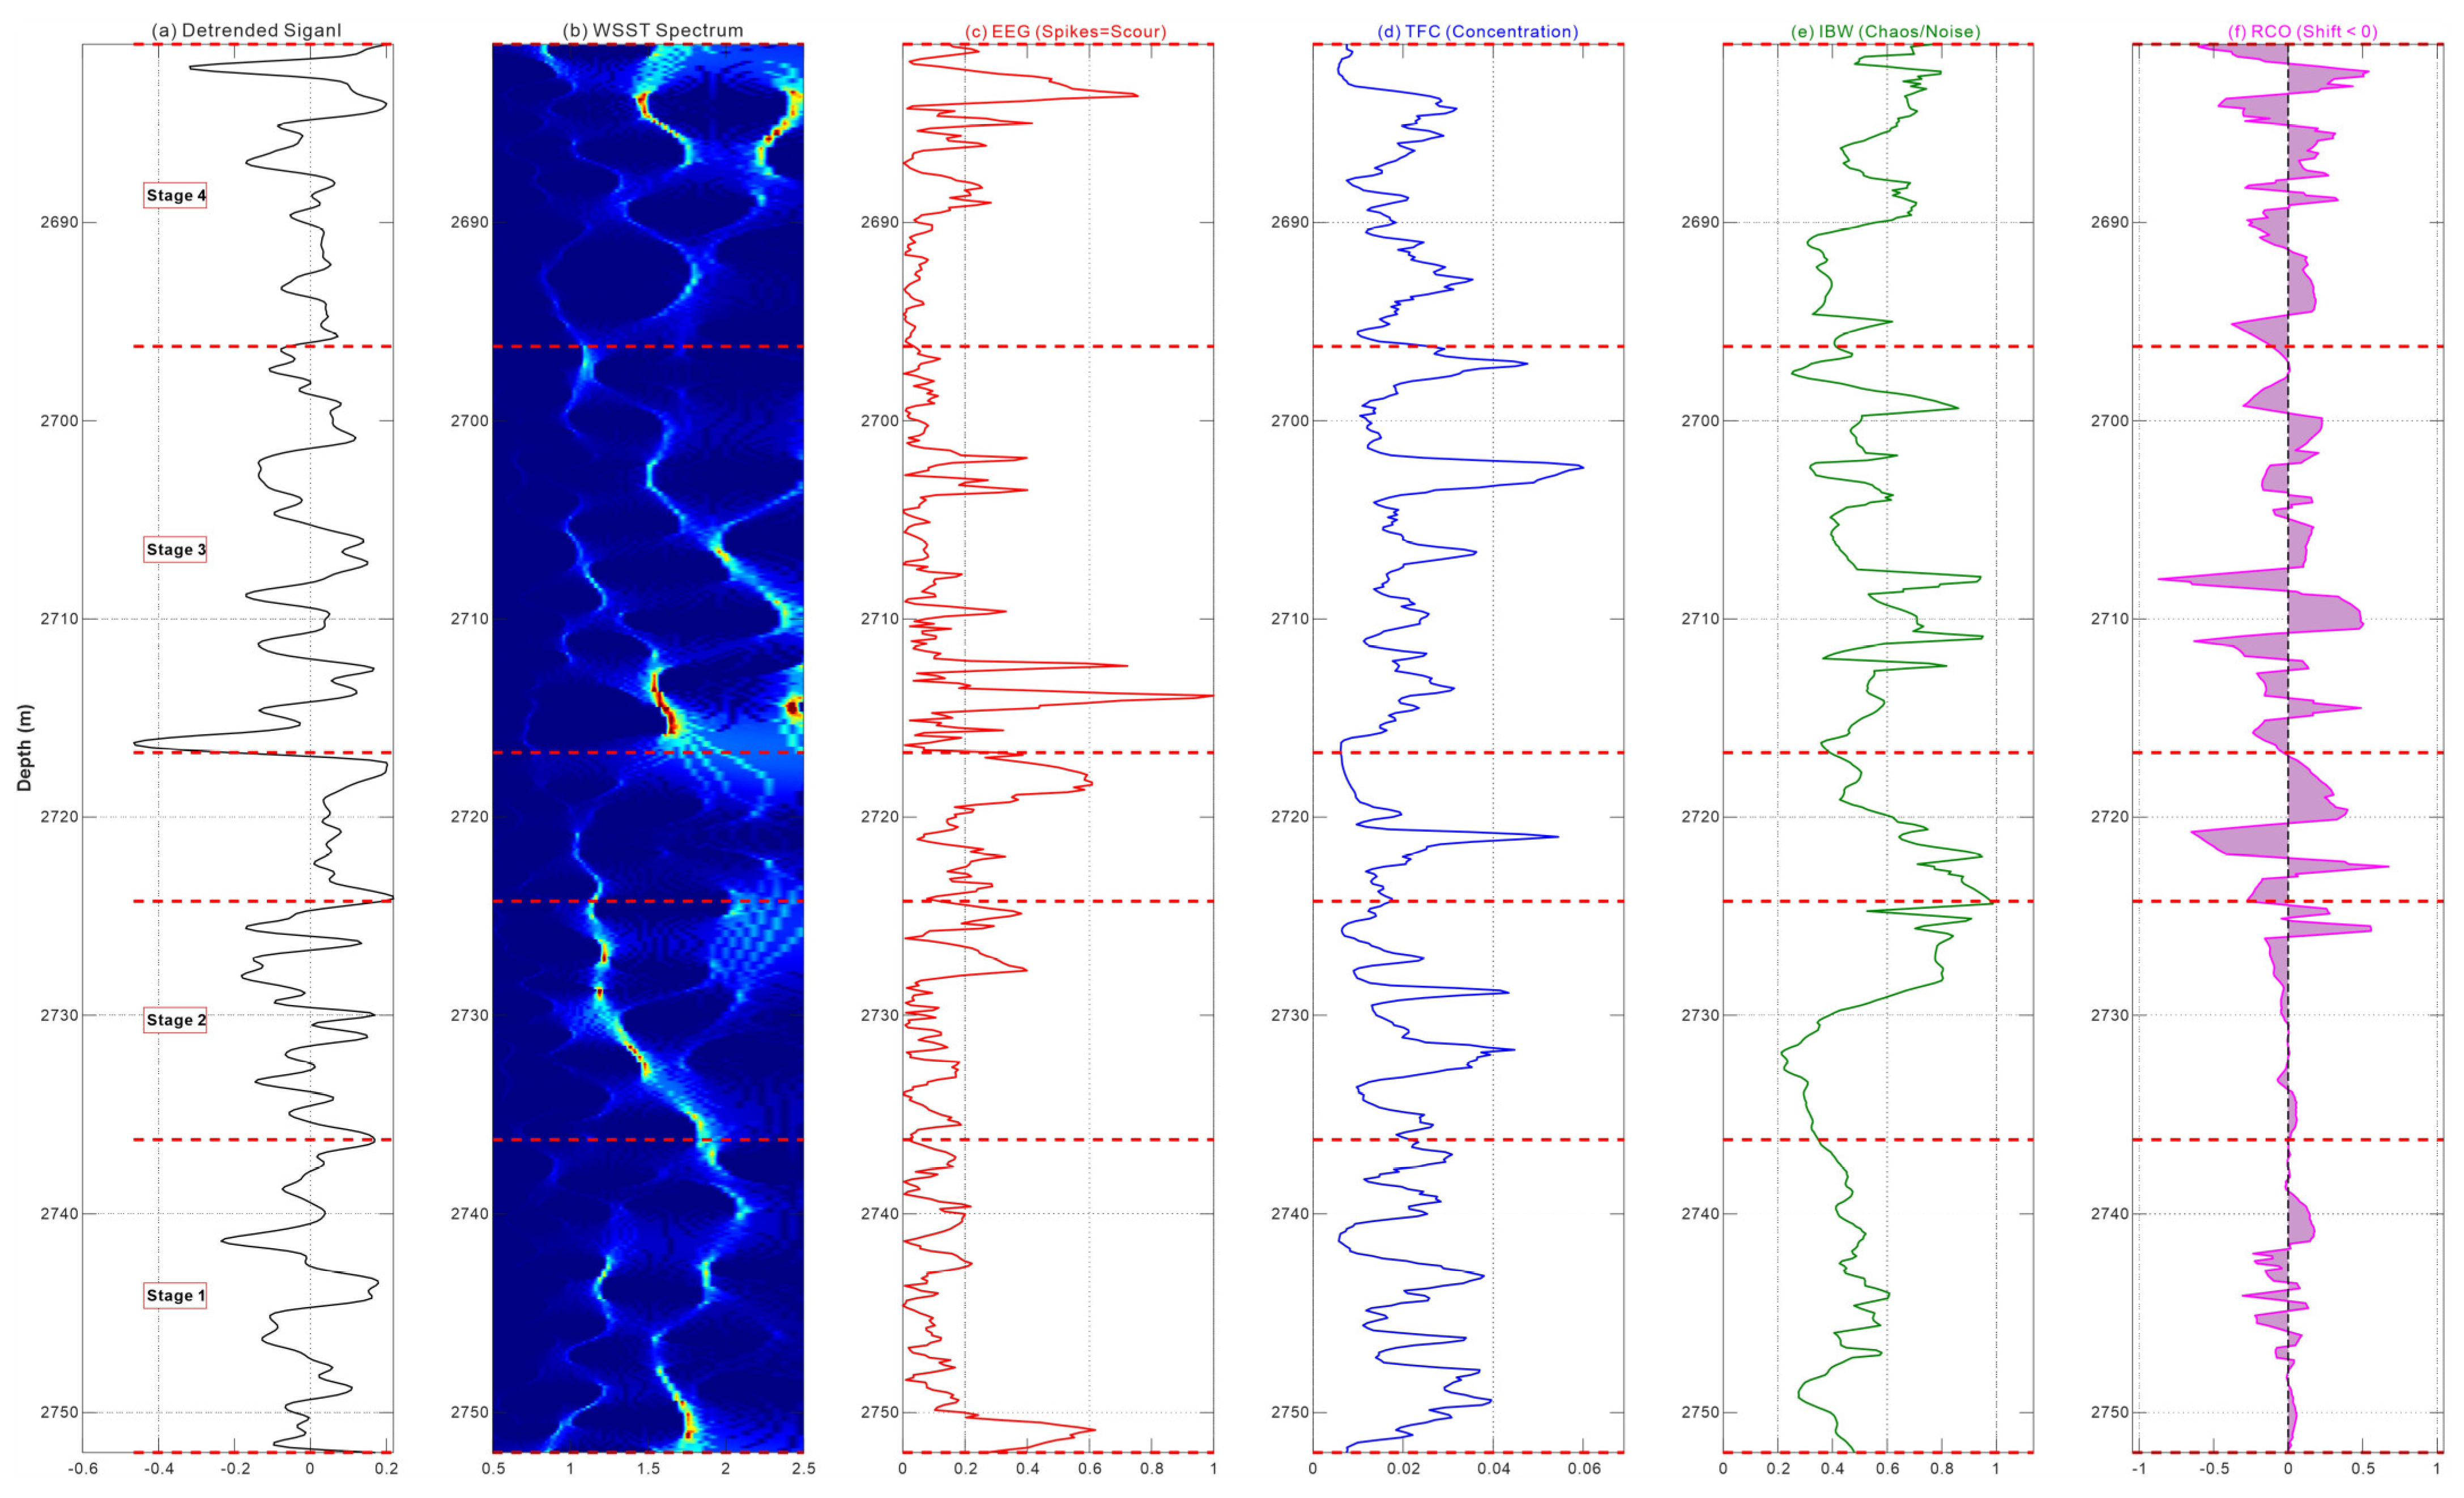
Building upon the high-resolution stage framework established in Figure 5, this study applied the WSST algorithm to the multi-log reconstructed curve (Detrended Signal). The curve comprehensively fuses lithological, petrophysical, and textural variations, maximizing the retention of continuous geological information while mitigating single-log ambiguities. By correlating the four extracted quantitative dynamic parameters (EEG, TFC, IBW, and RCO) with the actual lithological column and the divided stages of Well F162-X7, the depositional evolution process is revealed with unprecedented objectivity and resolution (Figure 6).

4.3.1. Quantitative Corroboration of Erosional Bases and Amalgamated Sandbodies

In the lower sections of the target interval (e.g., Stage 1 and Stage 2), the lithology is dominated by relatively thick fine sandstones and siltstones, representing high-energy gravity flow deposits. At the basal boundaries of these stages (e.g., 2752.00 m and 2736.25 m), the EEG (Energy Evolution Gradient) curve exhibits extremely sharp, impulse-like spikes. These mathematical extrema precisely highlight the abrupt “mud-to-sand” transitions, quantitatively proving the strong erosional and downcutting nature of the initial gravity flow surges. Furthermore, within these massive sandstone intervals, the TFC and IBW curves do not maintain constant high values but display high-frequency, discrete oscillations. This mathematical signature reflects the complex internal architecture of amalgamated sandbodies formed by multiple, high-frequency energetic pulses—features that are often indistinguishable in visual core descriptions but are successfully captured by the dynamic parameters.

4.3.2. Differentiating Gravity Flow Events from Quiescent Suspension Settling

The parameters effectively differentiate high-energy instantaneous deposits from slow background sedimentation. Notably, in the pure mudstone depth interval of 2716.75–2724.25 m (between Stage 2 and Stage 3), the hydrodynamic energy of gravity flows completely dissipates, replaced by stable suspension settling. Consequently, parameters indicating energy focus, such as TFC, drop to extremely low levels. Interestingly, the RCO (Ridge Center Offset) curve in this mudstone interval exhibits abnormally large and chaotic fluctuations compared to the sandstone stages. Physically, this is because the extremely low sedimentation rate in the pelagic environment lacks a strong, unifying hydrodynamic force; thus, the extracted spatial scales are dominated by compressed background noise and highly variable micro-rhythms. This drastic contrast—low energy concentration (low TFC) coupled with chaotic scale shifts (large-amplitude RCO)—serves as a highly reliable mathematical feature for starved, quiescent mudstone deposition.

4.3.3. Objective Validation of Sequence Boundaries

A critical challenge in sequence stratigraphy is the subjective nature of manual boundary delineation based on cores or conventional logs. As shown in Figure 5, the manually defined stage boundaries (indicated by red dashed lines) align flawlessly with the mathematically derived parameter abruptions. For instance, the exact onset of the EEG spikes and the sudden phase transitions in the RCO curve strictly coincide with the top and bottom interfaces of the stages (e.g., the top of Stage 3 at 2696.25 m and its base at 2716.75 m). The multi-log reconstructed PC1 curve suppresses the localized anomalies of individual logs, while the WSST-derived dynamic parameters provide a strictly continuous numerical evaluation. This alignment convincingly demonstrates that the stage division framework proposed in this study is not empirically subjective, but is deeply rooted in objective, physical hydrodynamic changes, thereby providing a robust methodology for high-resolution stratigraphic subdivision in fine-grained sedimentary systems.

5. Discussion and Conclusions

5.1. Effectiveness and Ambiguity of Log-Derived Parameters in Depositional Analysis

Previous stage subdivisions of reservoirs primarily relied on visual observation of cores or macroscopic well log morphologies, focusing on identifying abrupt changes in lithofacies. The introduction of WSST and the four quantitative parameters (TFC, IBW, EEG, and RCO) translates this empirical visual observation into objective numerical values.
This method captures internal structural information that conventional methods often overlook. For instance, in the extremely thick and pure sandstone of Stage 4, the lack of argillaceous interbeds results in a flat, blocky well log response. Consequently, TFC decreases significantly, while IBW exhibits intense, high-frequency oscillations due to extreme sensitivity to minor background noise. This specific mathematical response provides a novel perspective for inversely identifying highly homogeneous, thick sand bodies.
Relying entirely on mathematical features for geological interpretation carries inherent risks. Parameter fluctuations may sometimes merely reflect algorithmic responses to local data distributions. Without actual core calibration, the TFC and IBW signatures of “homogeneous thick sandstone” could easily be confused with missing strata or logging interference. Therefore, this numerical approach cannot be applied independently of basic geological context.

5.2. Discrepancies Between Algorithmic Boundaries and Lithofacies Interfaces

In the actual subdivision results of this study, it can be observed that the mathematically defined stage boundaries do not perfectly align with the visually interpreted “mud-to-sand” interfaces on the core or logs at certain depths (e.g., near 2716.00 m in Figure 5), exhibiting depth discrepancies of several tens of centimeters.
Before the main sandy source of a gravity flow arrives, it is often preceded by low-density precursor flows that weakly scour the underlying muddy substrate. The WSST algorithm is highly sensitive to these initial fluctuations in hydrodynamic energy. Consequently, the mathematical boundaries often slightly “lead” (precede) the macroscopic lithological boundaries, demonstrating that the algorithm possesses a higher resolution in capturing early fluid dynamic changes than the naked eye. It must be objectively noted that quantifying the exact sub-meter depth displacement between these mathematical boundaries and core interfaces remains challenging. In practical operations, inherent discrepancies such as wireline cable stretch, core expansion, and incomplete core recovery routinely introduce operational depth-matching errors of several tens of centimeters. Consequently, blindly attributing a mathematically calculated sub-meter offset entirely to precursor hydrodynamic flows is physically risky. The algorithm’s extreme sensitivity provides theoretical potential for early fluid detection, but definitive quantitative confirmation requires future integration with independent, high-resolution hydrodynamic flux measurements.
In practical oilfield engineering applications, geologists and log analysts are accustomed to using abrupt lithological changes directly as horizon boundaries to facilitate perforation and reservoir correlation. If unadjusted algorithmic boundaries are utilized directly, these sub-meter discrepancies may introduce minor depth prediction deviations in engineering operations.

5.3. Limitations of the Current Study and Future Directions

Although the integration of Principal Component Analysis (PCA) for multi-log fusion significantly enhances the physical robustness and reliability of the WSST-based stage subdivision, several objective limitations remain in its current practical application:
Limitations in Quantitative Statistical Validation: In this study, the dynamic parameters (e.g., IBW, TFC) were correlated with specific lithofacies using representative core segments. However, fine-grained gravity flows are highly heterogeneous. Due to the inherent scarcity of continuous, fully recovered core datasets across the basin, conducting a limited, localized statistical analysis (such as generating specific probability distributions or ROC curves) carries a high risk of statistical overfitting. These localized numerical thresholds could be misleading if universally applied. Therefore, establishing a statistically robust and generalizable quantitative classification model is flagged as a crucial future direction, which will strictly require the integration of a massive, basin-wide core-log matched database.
Lack of Direct Hydrodynamic Flux Measurements: The sub-meter depth discrepancies observed between the WSST-derived mathematical boundaries and macroscopic lithofacies interfaces have been theoretically interpreted as the signature of early precursor hydrodynamic perturbations. While this highlights the extreme sensitivity of the algorithm, it currently lacks direct, quantitative flux measurements for confirmation. Therefore, these mathematical boundaries should currently be interpreted as potential indicators of fluid shifts rather than absolute physical flux measurements.
1D Spatial Limitations and Advanced Signal Diagnostics: While the multi-log approach successfully resolves vertical heterogeneity, gravity flows exhibit complex three-dimensional distributions in the subsurface. High-resolution vertical subdivision in a single well cannot directly resolve the lateral connectivity and spatial extent of these fine-grained sand bodies. Future research must focus on upscaling these well-based 1D dynamic parameters to match 3D seismic data. Furthermore, to continually extract weaker geological features from noisy backgrounds, future methodologies should consider combining our time-frequency approach with iterative adaptive signal filtering and deep learning algorithms, a trend increasingly adopted in modern complex signal diagnostics [37,38,39].

5.4. Conclusions

This study applied WSST for the high-frequency stage subdivision and quantitative characterization of gravity flows. The main conclusions are summarized as follows:
Objective Boundary Subdivision: WSST effectively eliminates the spectral smearing inherent in traditional wavelet transforms. The continuous energy ridges extracted within the 0.5–2.5 m frequency band provide a highly objective mathematical basis for defining gravity flow stage boundaries, thereby reducing empirical visual subjectivity.
Numerical Characterization of Depositional Dynamics: The four derived parameters accurately quantify specific hydrodynamic processes. EEG spikes precisely locate basal scour surfaces; the counter-intuitive combination of a TFC drop and IBW high-frequency oscillations successfully identifies highly homogeneous, massive thick sandstones; and RCO effectively tracks the energy decay trajectory of individual gravity flow events.
Hydrodynamic Interfaces and Advanced Applicability: The mathematically derived boundaries essentially reflect hydrodynamic shifts, capturing early precursor fluid perturbations. Consequently, they exhibit objective sub-meter depth discrepancies when compared to macroscopic lithological interfaces. By integrating Principal Component Analysis (PCA) for multi-log fusion (GR, SP, AC), this updated method significantly mitigates the mathematical ambiguity inherent in single-log approaches. While it provides a highly automated evaluation tool, future large-scale field applications must still be statistically calibrated with massive core datasets, and development should expand toward integrating 3D seismic spatial prediction and advanced deep learning signal diagnostics.

Author Contributions

Conceptualization, Y.Z. and S.Y.; methodology, Y.Z.; validation, Y.Z.; formal analysis, Y.Z.; investigation, Y.Z., S.M., D.H. and Y.W.; data curation, Y.Z.; writing—original draft preparation, Y.Z.; writing—review and editing, Y.Z. and S.Y.; visualization, Y.Z.; supervision, S.Y.; project administration, S.Y.; funding acquisition, S.Y. All authors have read and agreed to the published version of the manuscript.

Funding

This research was funded by China National Science and Technology Major Project (grant number: 2017ZX05009001).

Institutional Review Board Statement

Not applicable.

Informed Consent Statement

Not applicable.

Data Availability Statement

Data presented in this study are available upon reasonable request to the corresponding author.

Acknowledgments

This study is sponsored by China National Science and Technology Major Project (grant number: 2017ZX05009001). The authors would like to thank the editors and reviewers for their help regarding this research.

Conflicts of Interest

The authors declare no conflict of interest.

References

  1. Zou, C.; Zhang, G.; Yang, Z.; Tao, S.; Hou, L.; Zhu, R.; Yuan, X.; Ran, Q.; Li, D.; Wang, Z. Concepts, Characteristics, Potential and Technology of Unconventional Hydrocarbons: On Unconventional Petroleum Geology. Pet. Explor. Dev. 2013, 40, 413–428. [Google Scholar] [CrossRef] [Scilit]
  2. Talling, P.J.; Masson, D.G.; Sumner, E.J.; Malgesini, G. Subaqueous Sediment Density Flows: Depositional Processes and Deposit Types. Sedimentology 2012, 59, 1937–2003. [Google Scholar] [CrossRef] [Scilit]
  3. Shanmugam, G. 50 Years of the Turbidite Paradigm (1950s—1990s): Deep-Water Processes and Facies Models—A Critical Perspective. Mar. Pet. Geol. 2000, 17, 285–342. [Google Scholar] [CrossRef] [Scilit]
  4. Lowe, D.R. Sediment Gravity Flows: II Depositional Models with Special Reference to the Deposits of High-Density Turbidity Currents. J. Sediment. Res. 1982, 52, 279–297. [Google Scholar] [CrossRef] [Scilit]
  5. Mutti, E.; Normark, W.R. Comparing Examples of Modern and Ancient Turbidite Systems: Problems and Concepts. In Marine Clastic Sedimentology; Leggett, J.K., Zuffa, G.G., Eds.; Springer: Dordrecht, The Netherlands, 1987; pp. 1–38. [Google Scholar] [CrossRef] [Scilit]
  6. Zhang, Y.; Li, C.; Zhang, X.; Fang, X.; Wang, Y.; Zhang, J.; Xie, J.; Wang, J. Sedimentary Characteristics of Lacustrine Deep-Water Gravity Flow in the Third Member of Paleogene Shahejie Formation in Dongying Sag, Bohai Bay Basin, China. Front. Earth Sci. 2023, 17, 487–504. [Google Scholar] [CrossRef] [Scilit]
  7. Catuneanu, O.; Abreu, V.; Bhattacharya, J.P.; Blum, M.D.; Dalrymple, R.W.; Eriksson, P.G.; Fielding, C.R.; Fisher, W.L.; Galloway, W.E.; Gibling, M.R.; et al. Towards the Standardization of Sequence Stratigraphy. Earth-Sci. Rev. 2009, 92, 1–33. [Google Scholar] [CrossRef] [Scilit]
  8. Posamentier, H.W.; Walker, R.G. (Eds.) Facies Models Revisited; SEPM (Society for Sedimentary Geology): Tulsa, OK, USA, 2006. [Google Scholar] [CrossRef] [Scilit]
  9. Wu, Q.; Xian, B.; Gao, X.; Tian, R.; Zhang, H.; Liu, J.; Gao, Y.; Wang, P. Diversity of Depositional Architecture and Sandbody Distribution of Sublacustrine Fans during Forced Regression: A Case Study of Paleogene Middle Sha 3 Member in Dongying Sag, Bohai Bay Basin, East China. Pet. Explor. Dev. 2023, 50, 894–908. [Google Scholar] [CrossRef] [Scilit]
  10. Wu, Q.; Xian, B.; Gao, X.; Bai, Q.; Wang, Z.; Liu, J.; Chen, P.; Li, Y.; Rahman, N.U.; Tian, R.; et al. Differences of Sedimentary Triggers and Depositional Architecture of Lacustrine Turbidites from Normal Regression to Forced Regression: Eocene Dongying Depression, Bohai Bay Basin, East China. Sediment. Geol. 2022, 439, 106222. [Google Scholar] [CrossRef] [Scilit]
  11. Tian, R.-H.; Xian, B.-Z.; Chen, P.; Zhao, L.; Rahman, N.U.; Umar, M.U.; Wu, Q.-R.; Li, Q.; Zhang, W.-M.; Liu, J.-P.; et al. Rift Marginal Coarse-Grained Sediment Gravity Flow Deposits in the Eocene Dongying Depression, Bohai Bay Basin, China: Balancing Tectonic and Climatic Controls. Pet. Sci. 2025, 22, 3168–3188. [Google Scholar] [CrossRef] [Scilit]
  12. Zhang, Y.; Xie, J.; Gu, K.; Zhao, H.; Li, C.; Hao, X. Sedimentary Characteristics and Model of Lacustrine Deep Water Gravity Flow in the Third Member of Paleogene Shahejie Formation in Niuzhuang Sag, Bohai Bay Basin, China. J. Mar. Sci. Eng. 2023, 11, 1598. [Google Scholar] [CrossRef] [Scilit]
  13. Yang, R.; Li, Y.; Fan, A.; Lenhardt, N.; De, S.; Chen, J. Syndepositional Fault Control on Sandbody Distribution at Two Eocene Confluence Deltas in the Dongying Depression, Bohai Bay Basin (Eastern China). J. Earth Sci. 2023, 34, 1095–1111. [Google Scholar] [CrossRef] [Scilit]
  14. Tian, R.; Xian, B.; Liu, J.; Wu, Q.; Rahman, N.U.; Chen, P.; Li, Q.; Wang, Z.; Chen, S.; Yu, J.; et al. Variability of Sequence Architecture in a Rift Margin Controlled by Tectonic Activity: The Eocene Dongying Depression, Bohai Bay Basin, China. Basin Res. 2024, 36, e12876. [Google Scholar] [CrossRef] [Scilit]
  15. Chen, P.; Xian, B.; Li, M.; Wang, J.; Peng, Y.; Zhang, G.; Tian, R.; Wu, Q.; Liu, J.; Xiang, P.; et al. Distinct Grain-Size Patterns in Sandy Turbidites: Implications for Identifying the Triggers of Ancient Turbidity Currents in Lacustrine Settings. Sediment. Geol. 2025, 476, 106806. [Google Scholar] [CrossRef] [Scilit]
  16. Chen, L.; Wang, X.; Liu, Z. Geological Information-Driven Deep Learning for Lithology Identification from Well Logs. Front. Earth Sci. 2025, 13, 1662760. [Google Scholar] [CrossRef] [Scilit]
  17. Yu, W.; Yang, G.; Liu, J.; Yeliewubai, S.; Yu, J. Astronomical Cycle Identification and High-Frequency Sequence Stratigraphy of the Middle Permian Lower Wuerhe Formation in the Mahu Sag, Junggar Basin. Front. Earth Sci. 2026, 13, 1640183. [Google Scholar] [CrossRef] [Scilit]
  18. Li, W.; Zhang, J.; Xie, J.; Xia, Y.; He, Y. Application of the Wavelet Transform and INPEFA in Sequence Stratigraphy. ACS Omega 2023, 8, 3441–3451. [Google Scholar] [CrossRef] [Scilit] [PubMed]
  19. Xu, Z.; Zheng, B.; Liu, B.; Song, W. Stratigraphic Correlation of Well Logs Using Geology-Informed Deep Learning Networks. Processes 2025, 13, 1288. [Google Scholar] [CrossRef] [Scilit]
  20. Lai, J.; Su, Y.; Xiao, L.; Zhao, F.; Bai, T.; Li, Y.; Li, H.; Huang, Y.; Wang, G.; Qin, Z. Application of Geophysical Well Logs in Solving Geologic Issues: Past, Present and Future Prospect. Geosci. Front. 2024, 15, 101779. [Google Scholar] [CrossRef] [Scilit]
  21. Bergen, K.J.; Johnson, P.A.; de Hoop, M.V.; Beroza, G.C. Machine learning for data-driven discovery in solid Earth geoscience. Science 2019, 363, eaau0323. [Google Scholar] [CrossRef] [Scilit] [PubMed]
  22. Merembayev, T.; Kurmangaliyev, D.; Bekmakhanova, B.; Akhmed-Zaki, D. A comparison of machine learning algorithms in predicting lithofacies: Case studies from Norway and Kazakhstan. Energies 2021, 14, 1896. [Google Scholar] [CrossRef] [Scilit]
  23. Torrence, C.; Compo, G.P. A Practical Guide to Wavelet Analysis. Bull. Am. Meteorol. Soc. 1998, 79, 61–78. [Google Scholar] [CrossRef] [Scilit]
  24. Mallat, S. A Wavelet Tour of Signal Processing, 2nd ed.; Academic Press: San Diego, CA, USA, 1999. [Google Scholar] [CrossRef] [Scilit]
  25. Kadkhodaie, A.; Rezaee, R. Intelligent Sequence Stratigraphy through a Wavelet-Based Decomposition of Well Log Data. J. Nat. Gas Sci. Eng. 2017, 40, 38–50. [Google Scholar] [CrossRef] [Scilit]
  26. Li, L.; Wang, Z.-Z.; Yin, S.-D.; Wang, W.-F.; Yu, Z.-C.; Fan, W.-T.; Zhang, Z.-H. Selection and Application of Wavelet Transform in High-Frequency Sequence Stratigraphy Analysis of Coarse-Grained Sediment in Rift Basin. Pet. Sci. 2024, 21, 3016–3028. [Google Scholar] [CrossRef] [Scilit]
  27. Daubechies, I.; Lu, J.; Wu, H.-T. Synchrosqueezed Wavelet Transforms: An Empirical Mode Decomposition-like Tool. Appl. Comput. Harmon. Anal. 2011, 30, 243–261. [Google Scholar] [CrossRef] [Scilit]
  28. Abdollahian, A.; Wang, H.; Wu, W.; Hou, Y.; Zhang, Z.; Hou, D.; Jing, Y. High-Accuracy Cement Bond Evaluation via Transfer Learning: An Integrated Framework for Microannulus Detection. SPE J. 2025, 30, 7225–7240. [Google Scholar] [CrossRef] [Scilit]
  29. Saleh Nezhad, M.; Akbarizadeh, G.; Seifi Kavian, Y.; Salehi-Moorkani, R. Automatic Interpretation of Oil and Gas Well Cement Evaluation Logs Using Fuzzy Convolutional Neural Networks. SPE Drill. Complet. 2023, 38, 535–545. [Google Scholar] [CrossRef] [Scilit]
  30. Skoric, J.; D’Mello, Y.; Plant, D.V. A Wavelet-Based Approach for Motion Artifact Reduction in Ambulatory Seismocardiography. IEEE J. Transl. Eng. Health Med. 2024, 12, 348–358. [Google Scholar] [CrossRef] [Scilit] [PubMed]
  31. Cicone, A.; Li, W.S.; Zhou, H. New Theoretical Insights in the Decomposition and Time-Frequency Representation of Nonstationary Signals: The IMFogram Algorithm. Appl. Comput. Harmon. Anal. 2024, 71, 101634. [Google Scholar] [CrossRef] [Scilit]
  32. Zhang, Y.; Yang, S.; Wang, Y.; Ma, S.; Huang, D. Pore Structure Characterization of Low-Permeability Gravity-Flow Reservoirs: A Case Study of the Middle Es3 Member in Daluhu Area, the Dongying Depression, China. Processes 2025, 13, 1346. [Google Scholar] [CrossRef] [Scilit]
  33. Tian, R.-H.; Xian, B.-Z.; Wu, Q.-R.; Chen, P.; Rahman, N.U.; Zhao, L.; Wang, P.-Y.; Zhang, W.-M. Control of Deep-Water Sedimentation on Rift Margin by Non-Coaxial Fault Linkage System: A Case Study from the Steep Slope of the Dongying Depression, Bohai Bay Basin, China. J. Palaeogeogr. 2026, 15, 100318. [Google Scholar] [CrossRef] [Scilit]
  34. Lilly, J.M.; Olhede, S.C. Generalized Morse wavelets as a superfamily of analytic wavelets. IEEE Trans. Signal Process. 2012, 60, 6036–6041. [Google Scholar] [CrossRef] [Scilit]
  35. Thakur, G.; Brevdo, E.; Fučkar, N.S.; Wu, H.-T. The Synchrosqueezing algorithm for time-varying spectral analysis: Robustness properties and new paleoclimate applications. Signal Process. 2013, 93, 1079–1094. [Google Scholar] [CrossRef] [Scilit]
  36. Herrera, R.H.; Han, J.; van der Baan, M. Applications of the synchrosqueezing transform in seismic time-frequency analysis. Geophysics 2014, 79, V55–V64. [Google Scholar] [CrossRef] [Scilit]
  37. Varanis, M.; Balthazar, J.M.; Tusset, A.M.; Ribeiro, M.A.; Oliveira, C.D. Signal Analysis in Chaotic Systems: A Comprehensive Assessment through Time-Frequency Analysis. In New Insights on Oscillators and Their Applications to Engineering and Science; Balthazar, J.M., Tusset, A.M., Eds.; IntechOpen: London, UK, 2024. [Google Scholar] [CrossRef] [Scilit]
  38. Barbarino, G.; Cavassi, R.; Cicone, A. Extension and Convergence Analysis of Iterative Filtering to Spherical Data. Linear Algebra Its Appl. 2025, 721, 542–576. [Google Scholar] [CrossRef] [Scilit]
  39. Yang, Q.; Tang, B.; Deng, L.; Li, Z. Adaptive Early Initial Degradation Point Detection and Outlier Correction for Bearings. Comput. Ind. 2025, 164, 104166. [Google Scholar] [CrossRef] [Scilit]
Figure 1. (A) China; (B) Location map representing the subtectonic units of the Bohai Bay Basin: (I) Jiyang Depression, (II) Huanghua Depression, (III) Bozhong Depression, (IV) Zhezhong Depression, and (V) Liaohe Depression; (C) Location of the main oilfields and faults in the Boxing Sag. The Daluhu area is the study area, which is located in the northwestern part of the Boxing Sag; (D) Generalized Cenozoic-Quaternary sequence framework and stratigraphy of the Dongying Depression, Bohai Bay Basin, East China. The yellow dashed box represents the target layer. Adapted from Zhang et al. [32].
Applsci 16 06526 g001
Figure 2. Technical workflow for depositional-stage subdivision based on GR-SP-AC multi-log reconstruction and WSST.
Applsci 16 06526 g002
Figure 3. Multi-step preprocessing and fusion workflow for well log signals: (a) Original multi-well logs; (b) Reconstructed PC1 pseudo-log; (c) Detrended comprehensive log ready for WSST analysis.
Applsci 16 06526 g003
Figure 4. Comparison of time-frequency decomposition performance between CWT and WSST. (a) Detrended comprehensive log. (b) CWT modulus spectrum exhibiting severe spectral smearing. (c) CWT phase spectrum showing broad and distorted transition zones. (d) WSST modulus spectrum, where energy is reassigned into highly focused and sharp energy ridges. In the time-frequency spectra (b–d), the color scale from blue to red represents low to high energy magnitude (or phase angle variations), respectively.
Applsci 16 06526 g004
Figure 5. Stage subdivision of gravity-flow deposits in Well F162-X7 based on WSST.
Applsci 16 06526 g005
Figure 6. Quantitative characterization of fine-grained gravity flow dynamics based on the multi-log reconstructed curve (Detrended PC1) in Well F162-X7. From left to right: (a) Detrended signal; (b) WSST energy spectrum within the 0.5–2.5 m geological scale; (c) Energy Evolution Gradient (EEG); (d) Time-Frequency Concentration (TFC); (e) Instantaneous Bandwidth (IBW); (f) Normalized Ridge Center Offset (RCO).
Applsci 16 06526 g006
Disclaimer/Publisher’s Note: The statements, opinions and data contained in all publications are solely those of the individual author(s) and contributor(s) and not of MDPI and/or the editor(s). MDPI and/or the editor(s) disclaim responsibility for any injury to people or property resulting from any ideas, methods, instructions or products referred to in the content.