1. Introduction
Plant diseases remain a major constraint on crop productivity, product quality, and food security. According to the Food and Agriculture Organization of the United Nations (FAO), up to 40% of global crop production is lost annually due to plant pests and diseases, highlighting the importance of timely disease monitoring and effective plant health management [
1]. Leaves are among the most informative organs for visual diagnosis because many foliar diseases first appear as visible changes in leaf color, lesion morphology, spot distribution, and texture patterns [
2]. Conventional diagnosis mainly relies on expert visual inspection, which is labor-intensive, subjective, and difficult to scale for large production areas or real-time field monitoring [
3]. Therefore, image-based leaf disease recognition using low-cost mobile devices has become an important direction for intelligent crop health monitoring.
Early image-based approaches for plant disease recognition generally relied on digital image processing and traditional machine learning techniques. These methods usually extracted handcrafted color, shape, and texture descriptors from leaf images, and then used classifiers such as Support Vector Machines (SVMs) [
4], genetic-algorithm-based segmentation and soft-computing approaches [
5], and discriminant analysis [
6] for disease classification. Although handcrafted features are interpretable, their performance strongly depends on feature design, image quality, and acquisition conditions. With the rapid development of artificial intelligence and computer vision, deep learning has become a mainstream approach for plant disease recognition [
7].
Convolutional neural networks (CNNs) can automatically learn hierarchical feature representations from raw images, reducing the dependence on handcrafted feature engineering [
8,
9]. CNN-based methods have been widely used in image classification, object detection, semantic segmentation, and plant disease diagnosis [
10]. Substantial progress has been achieved in CNN-based plant disease recognition. For example, Mohanty et al. applied AlexNet and GoogLeNet to the PlantVillage dataset and achieved high classification accuracy across multiple crop-disease categories [
11]. Sladojevic et al. developed a CNN-based model for plant disease recognition using leaf images collected from the Internet [
12]. Ferentinos evaluated several deep learning architectures on a large-scale plant disease dataset and reported strong classification performance [
13]. Too et al. compared several fine-tuned deep models, including VGG, Inception, ResNet, and DenseNet, and demonstrated the importance of backbone selection for plant disease identification [
14]. These studies confirm the effectiveness of deep learning for plant disease recognition, but many reported high-accuracy results were obtained from relatively clean or controlled datasets, where leaves are usually centered, backgrounds are simple, and disease symptoms are visually clear. Such image conditions differ substantially from practical natural-scene environments.
Natural-scene plant disease classification remains more difficult than classification under controlled imaging conditions. Field or web-collected images often contain cluttered backgrounds, non-uniform illumination, shadows, occlusions, multiple leaves, varying shooting angles, and large-scale variations [
15]. These factors may cause a model to rely on background context, leaf morphology, or imaging artifacts rather than pathological symptoms. PlantVillage is one of the most widely used datasets for plant disease recognition, but most of its images were collected under controlled or semi-controlled conditions [
16]. To reduce the gap between controlled datasets and practical agricultural scenarios, Singh et al. released PlantDoc, a natural-scene plant disease dataset containing 2598 web-collected images from 27 healthy and diseased plant categories [
17]. Compared with controlled datasets, PlantDoc contains more complex backgrounds, larger intra-class variation, stronger inter-class similarity, and more severe sample imbalance. Therefore, classification on PlantDoc requires representations that can capture disease-relevant cues under complex and weakly controlled imaging conditions.
For such a setting, the backbone network should provide sufficient representation capacity while avoiding unnecessary computational complexity. The EfficientNet family balances network depth, width, and input resolution through compound scaling, achieving a favorable trade-off between accuracy and computational cost [
18]. EfficientNet-B3 provides strong ImageNet performance with moderate model complexity, making it a suitable backbone.
However, backbone selection alone does not fully address the difficulty of learning subtle disease cues from natural-scene images. A standard RGB-based CNN mainly learns spatial-domain representations, which are effective for capturing global semantics, leaf shape, color distribution, and visible lesion appearance. These features may be less sufficient when disease symptoms are small, blurred, partially occluded, or mixed with complex background textures. Frequency-domain information provides a complementary perspective for representing local texture variations and fine-grained visual details. Neural networks have been reported to exhibit a spectral bias toward low-frequency patterns during training, which means that lower-frequency components are often learned more easily than high-frequency components [
19]. However, disease-related cues such as lesion boundaries, spot edges, powdery regions, and texture disruptions may be partly reflected in high-frequency image components [
20]. If these fine-grained cues are not sufficiently captured, models may fail to distinguish visually similar disease categories.
Recent agricultural vision studies have explored this issue through frequency-domain or frequency-spatial representations. DWTFormer introduced a frequency-spatial fusion framework for tomato leaf disease identification, showing that wavelet-based frequency information can complement spatial features [
21]. FA-Unet further combined Fourier transform with attention mechanisms to enhance disease-related frequency-domain features in fruit leaf disease images under complex backgrounds [
22]. WaveLiteNet integrated a discrete wavelet transform with MobileNetV3 for lightweight tea leaf disease recognition [
23]. WGA-YOLO further used wavelet-based frequency recalibration to preserve high-frequency edge and texture details for crop disease detection under field-like conditions [
24]. These studies support the usefulness of frequency-domain information for representing lesion boundaries and local pathological textures. Nevertheless, many existing frequency-aware models are designed around relatively complex attention structures, or are developed for specific crop-disease scenarios. For public natural-scene classification benchmarks such as PlantDoc, image quality, background complexity, sample imbalance, and limited annotations jointly affect recognition performance. Therefore, this study introduces an FFT-based frequency branch as a lightweight complementary feature extractor rather than an additional large backbone. This branch extracts frequency-domain features from the Fourier magnitude spectrum and fuses them with EfficientNet-B3 spatial features, thereby incorporating lesion-related texture cues with limited additional architectural overhead.
Another difficulty is that image-level category labels provide limited guidance for learning disease-relevant regions. Many plant diseases share similar visual symptoms, and these symptoms may occupy only a small region of the image. Under such conditions, the model may benefit from an additional learning signal that emphasizes whether the leaf shows disease-related changes while distinguishing among specific disease categories. Auxiliary supervision introduces additional learning signals during training and can encourage the network to learn more discriminative representations beyond the primary classification objective [
25]. Previous studies have used multi-label learning, plant-type information, disease severity labels, or multi-task prediction to improve disease-relevant representation learning [
26,
27]. For example, multi-label frameworks can jointly model plant type, disease category, and severity, while multi-task systems can learn species-related and disease-related features simultaneously. However, these strategies often require additional annotations, such as plant type, disease severity, species labels, or lesion-level information. In contrast, a healthy/diseased auxiliary task can be generated directly from the original class labels and can provide coarse disease-status guidance without extra manual annotation.
To clarify the position of FAF-Net relative to recent related studies,
Table 1 summarizes representative works from four perspectives: natural-scene recognition, frequency-domain feature learning, lightweight modeling, and auxiliary or multi-task supervision.
As summarized in
Table 1, many recent studies tend to emphasize one of these directions, whereas natural-scene image-level classification involves a coupled representation-learning problem.
Based on the above considerations, this study proposes FAF-Net, a frequency-aware auxiliary fusion network for natural-scene plant disease classification. FAF-Net organizes three strategies around the same representation-learning bottleneck. CutMix regularizes the model at the data level and reduces dependence on complete leaf appearance or background context. The FFT-based branch complements RGB spatial features with frequency-domain texture cues related to lesion boundaries and local visual disruptions. The healthy/diseased auxiliary task provides coarse-grained disease-status guidance using labels derived from the original categories, without requiring lesion-level, severity-level, or species-level annotations. The expected practical implication is to provide a lightweight image-level recognition framework that may support low-cost preliminary screening of plant health status in field or mobile-device scenarios, without requiring lesion-level annotations. The main contributions of this study are as follows:
We propose a frequency-aware auxiliary fusion framework for natural-scene leaf disease classification. Rather than treating frequency learning, data augmentation, and auxiliary supervision as isolated components, FAF-Net integrates them into a unified framework to improve the robustness of disease-related representation learning under complex imaging conditions.
We design a lightweight FFT-based frequency branch to complement RGB spatial features extracted by EfficientNet-B3. This branch converts the input image into a log-normalized Fourier magnitude spectrum and learns compact frequency-domain representations, which are expected to capture lesion boundaries, spot textures, and local visual disruptions that may be weakened in purely spatial CNN features.
We introduce a healthy/diseased auxiliary supervision task to guide the shared representation toward disease-status-aware features during training. This coarse-grained supervision provides an additional constraint for fine-grained category classification, especially when different disease classes show similar symptoms or when lesion regions are small in natural-scene images.
We evaluate FAF-Net on the public natural-scene PlantDoc dataset and analyze its effectiveness through ablation experiments, comparative evaluation, confusion-matrix analysis, and mixed PlantDoc/PlantVillage analysis. The results provide evidence that frequency-domain complementary features and coarse-grained auxiliary supervision can improve plant disease classification under challenging natural-scene conditions.
2. Methodology
2.1. Datasets
This study used the publicly available PlantDoc dataset [
17] as the primary benchmark for natural-scene plant disease classification. PlantDoc contains 2598 images covering 27 healthy and diseased plant categories, including 17 diseased classes and 10 healthy classes. Unlike controlled leaf-image datasets, PlantDoc images were collected from natural or web-based scenes and contain complex backgrounds, non-uniform illumination, scale variations, multiple leaves, and diverse shooting angles. These characteristics make PlantDoc suitable for evaluating the robustness of plant disease classification models under natural-scene conditions. Its public availability also facilitates reproducible evaluation and comparison under consistent data sources and experimental protocols.
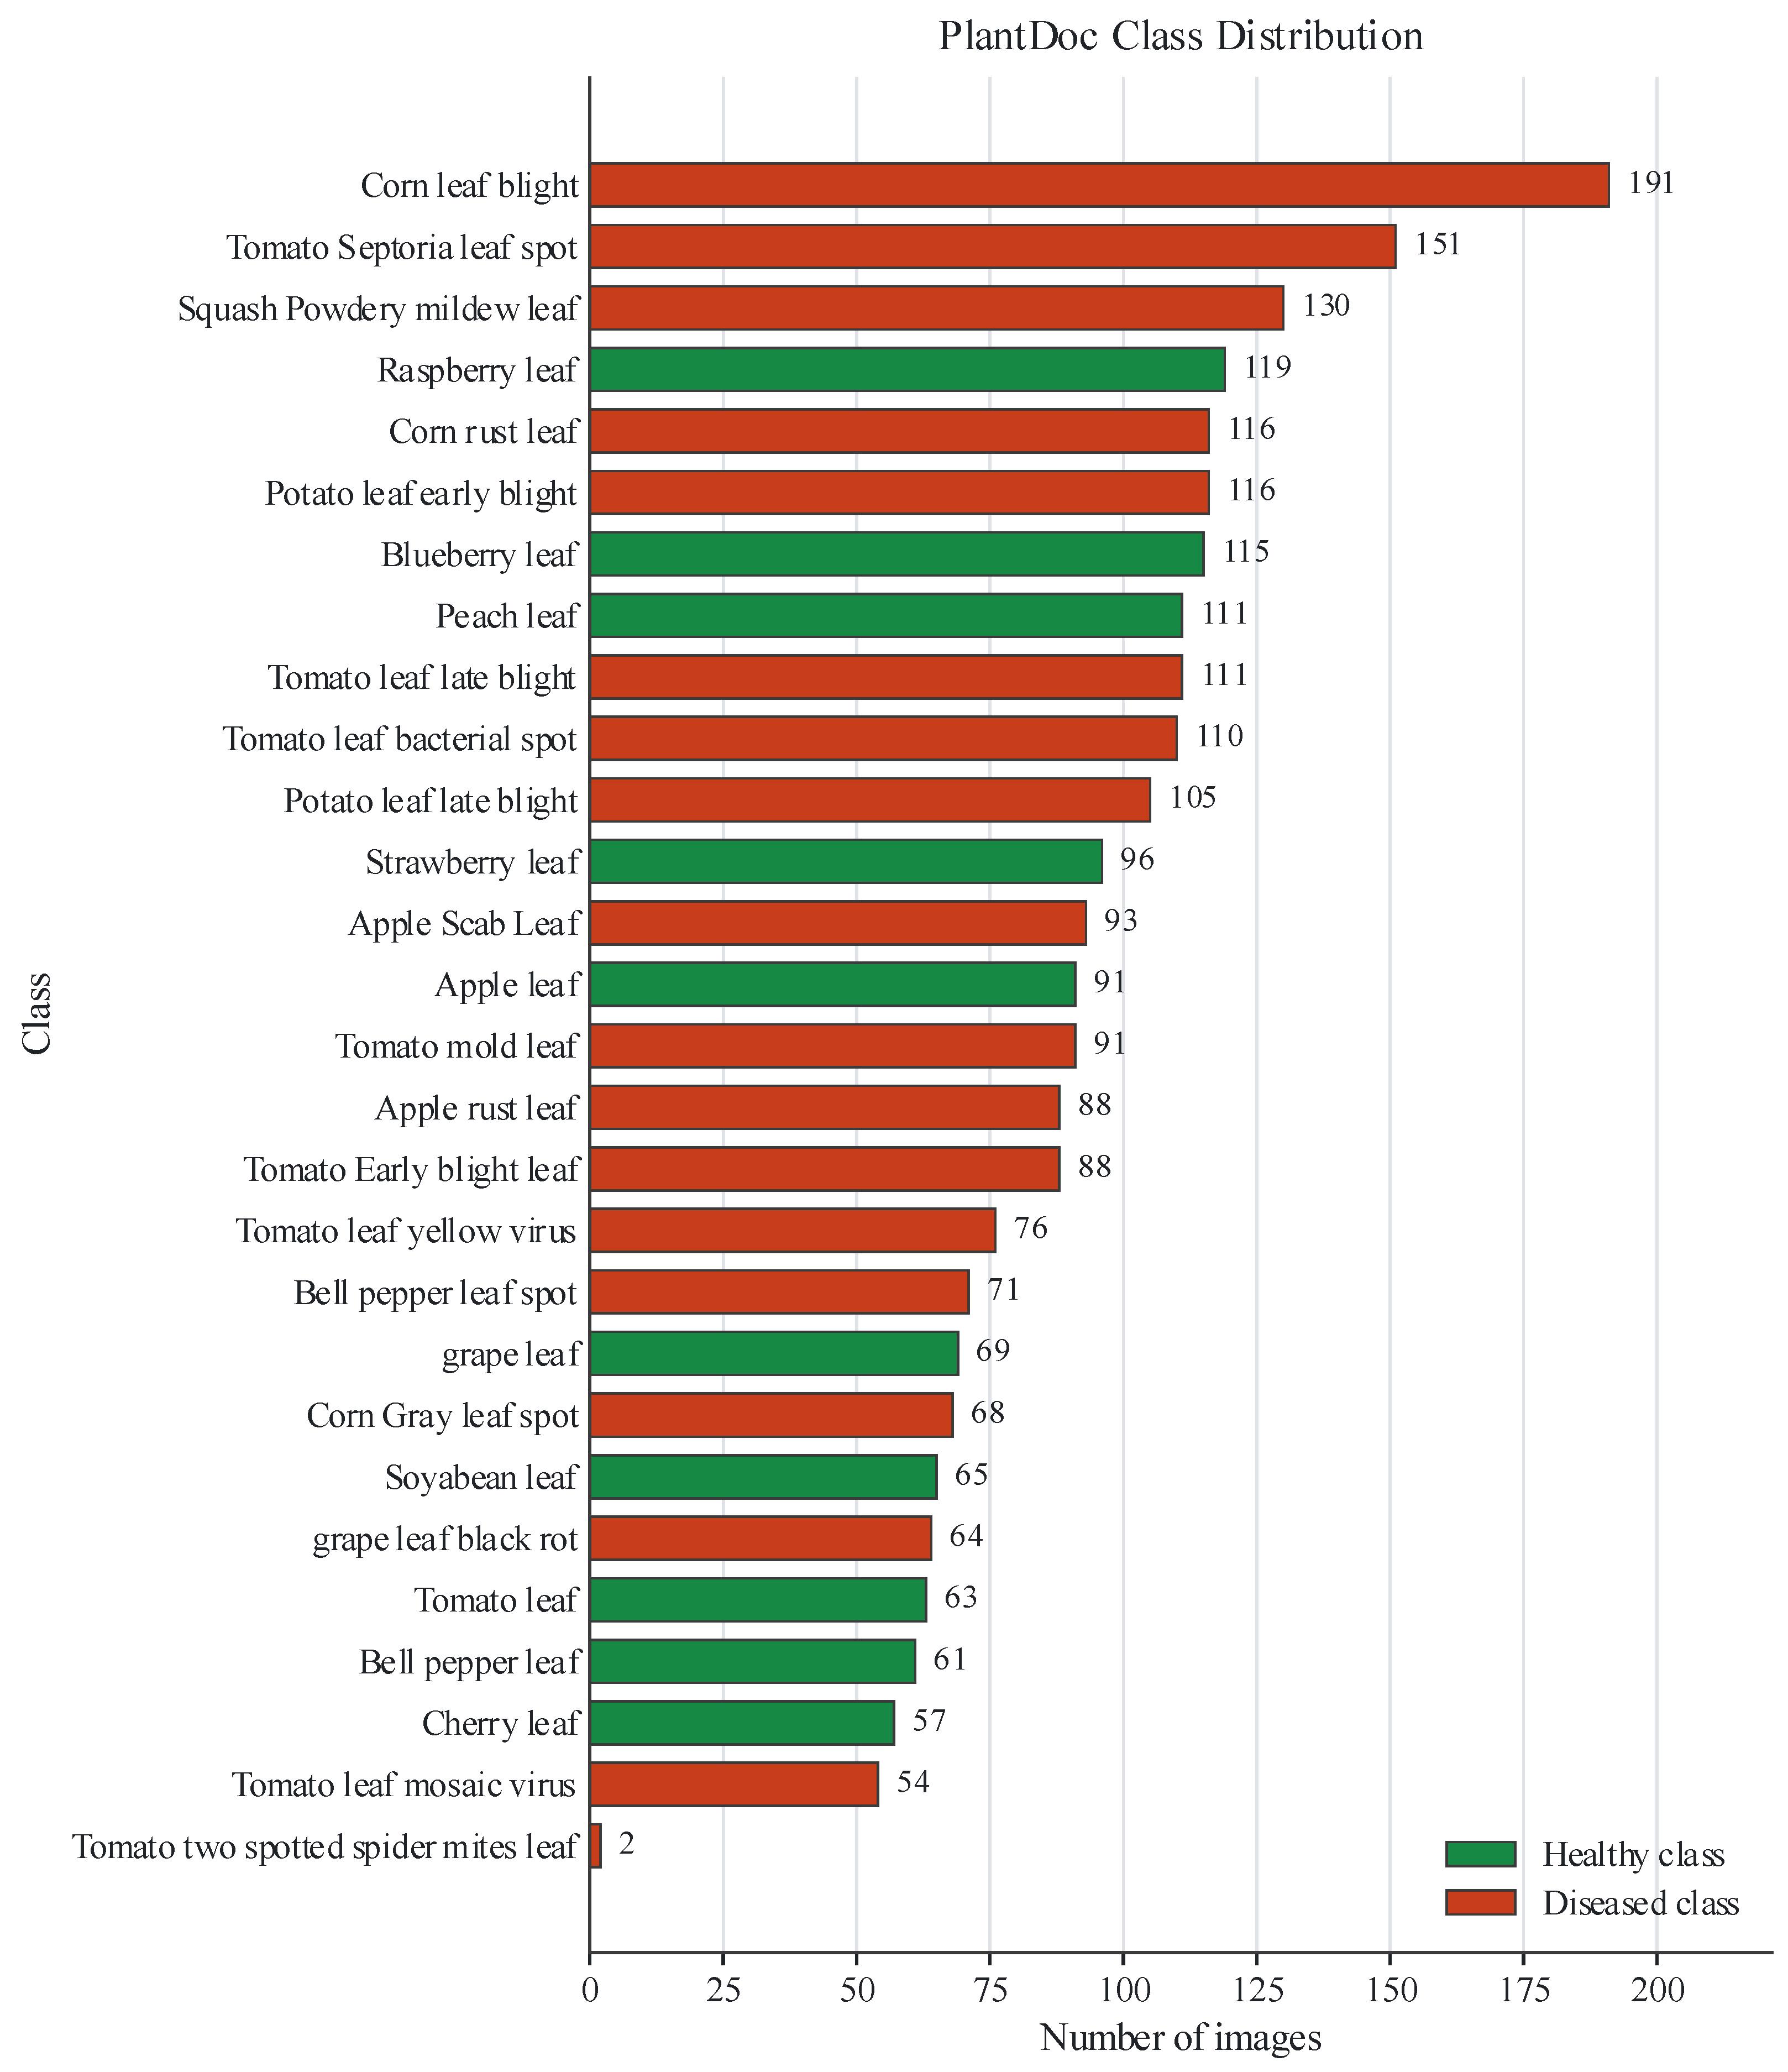
The class distribution of PlantDoc is shown in
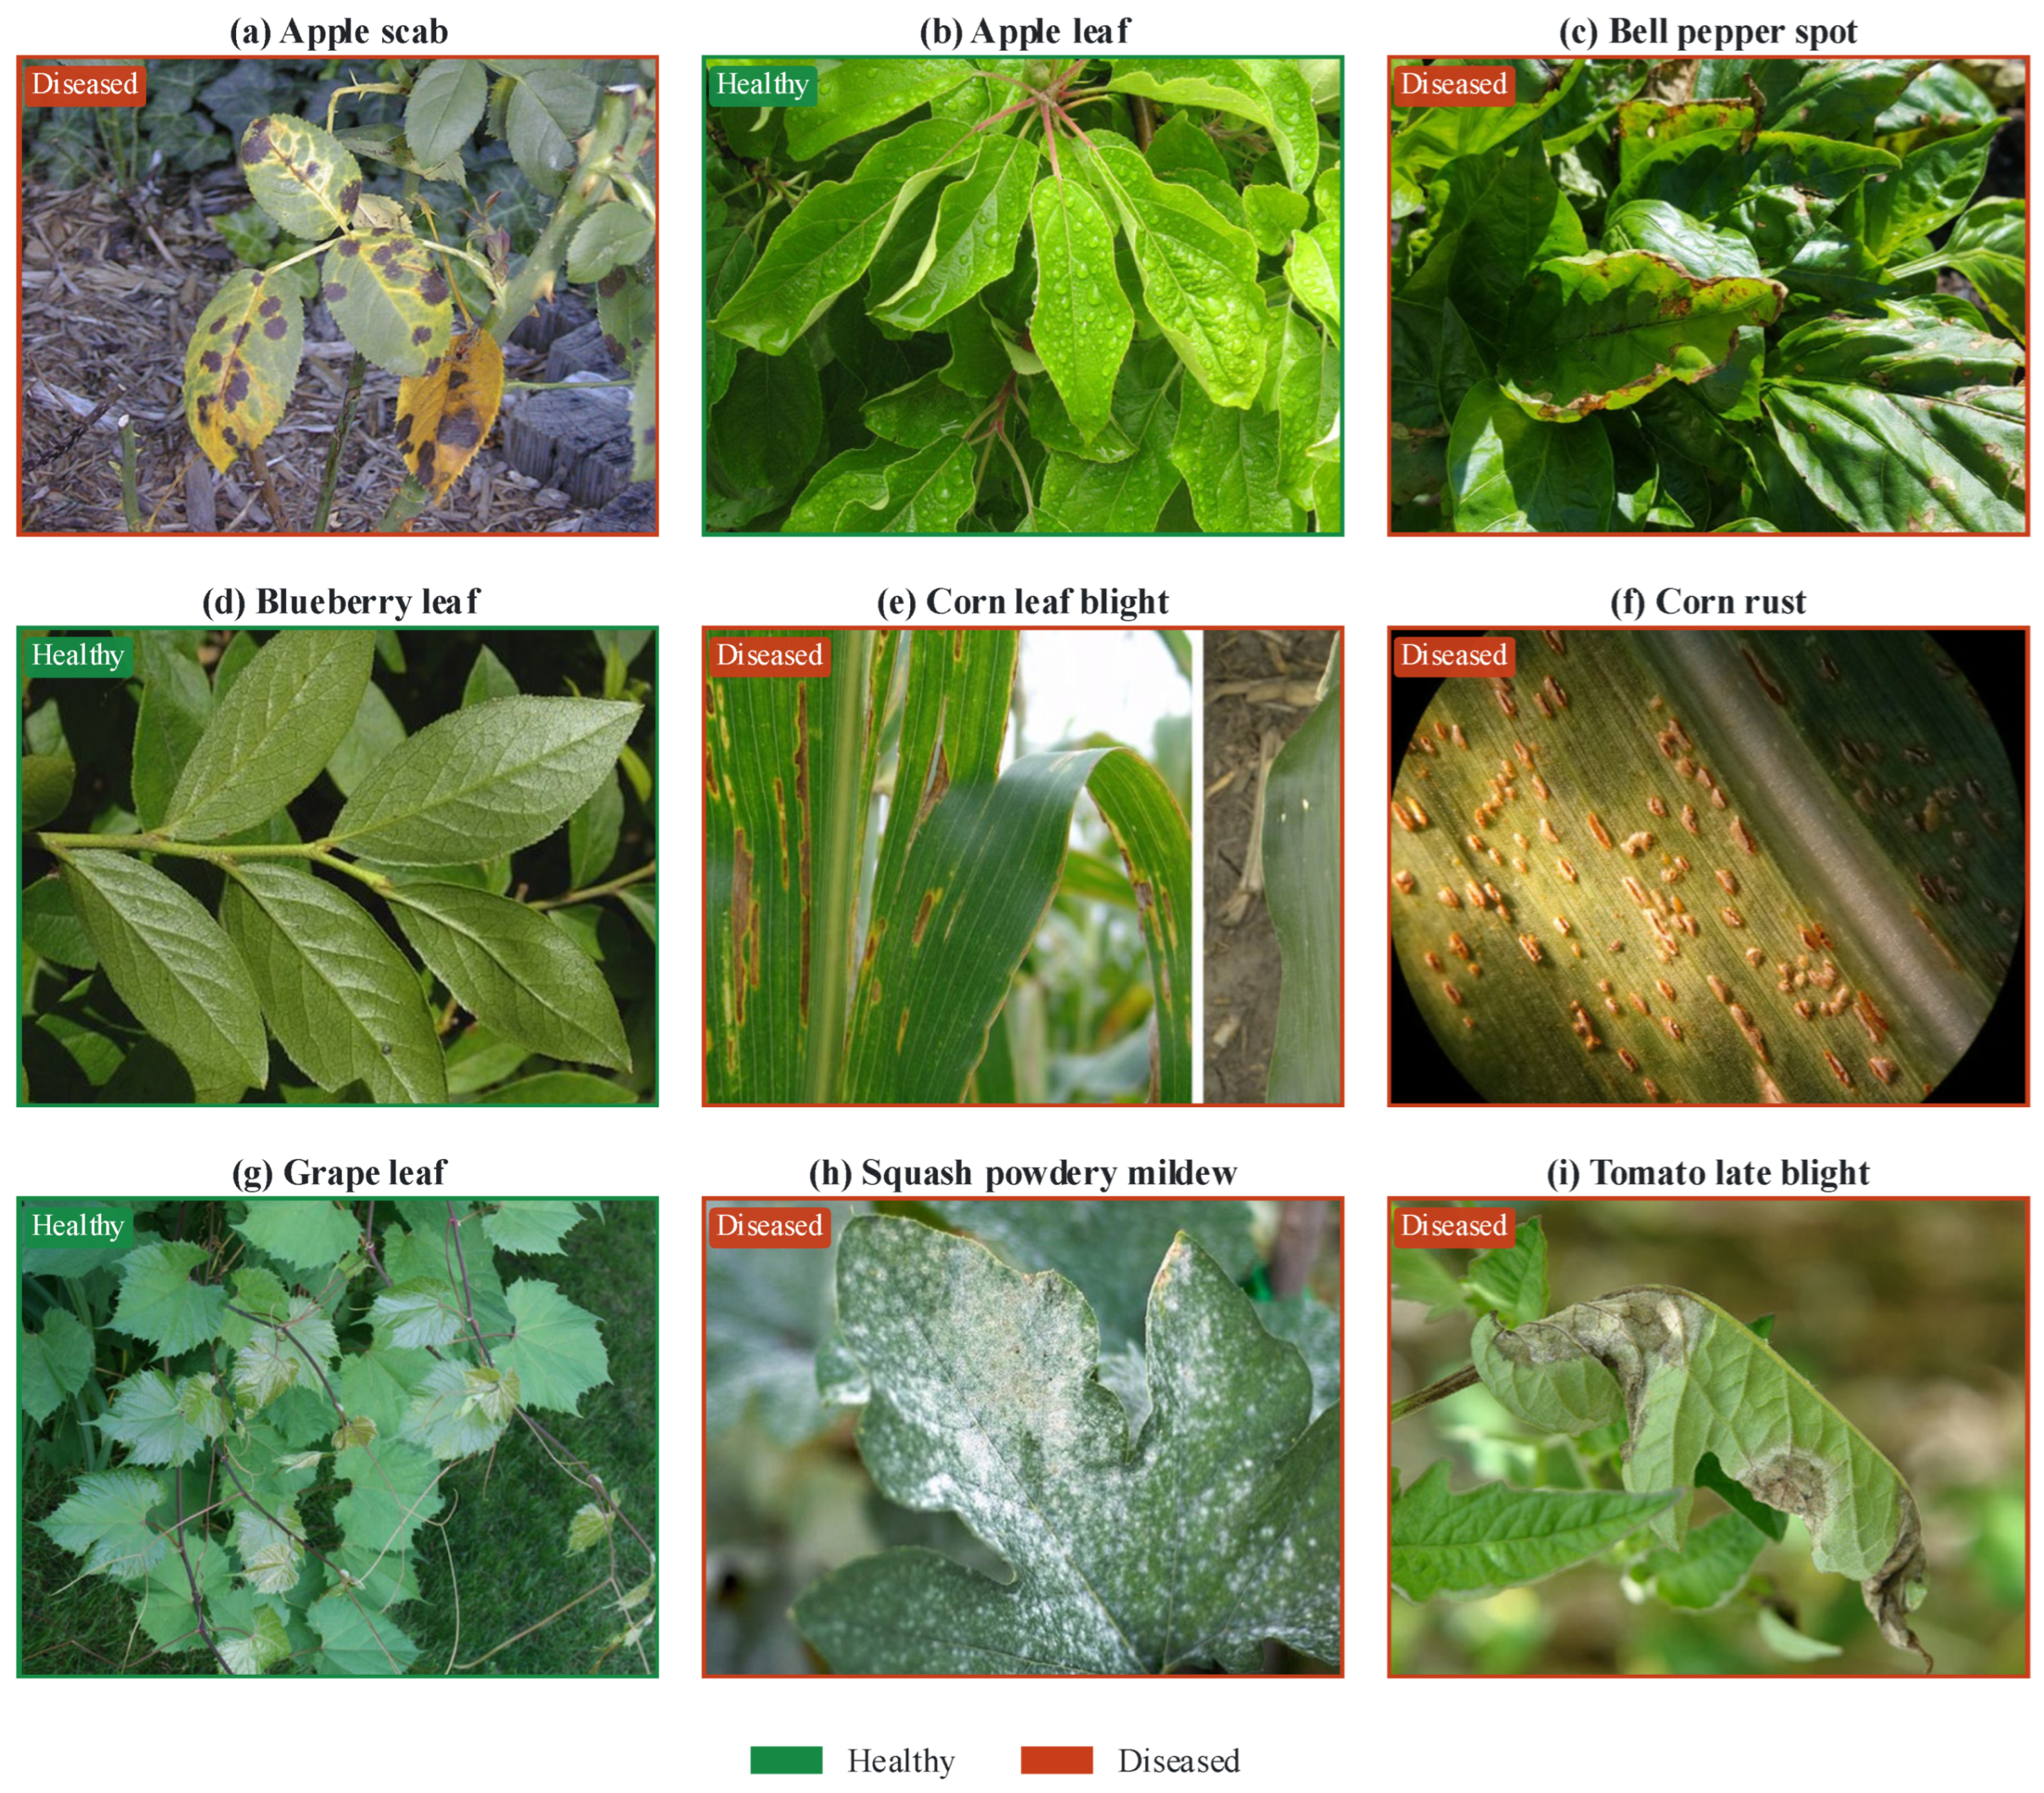
Figure 1. The categories are clearly imbalanced, which may bias the model toward classes with larger sample sizes. Representative examples from PlantDoc are shown in
Figure 2, showing the visual complexity and intra-class variability of natural-scene plant disease images.
2.2. Overview of FAF-Net
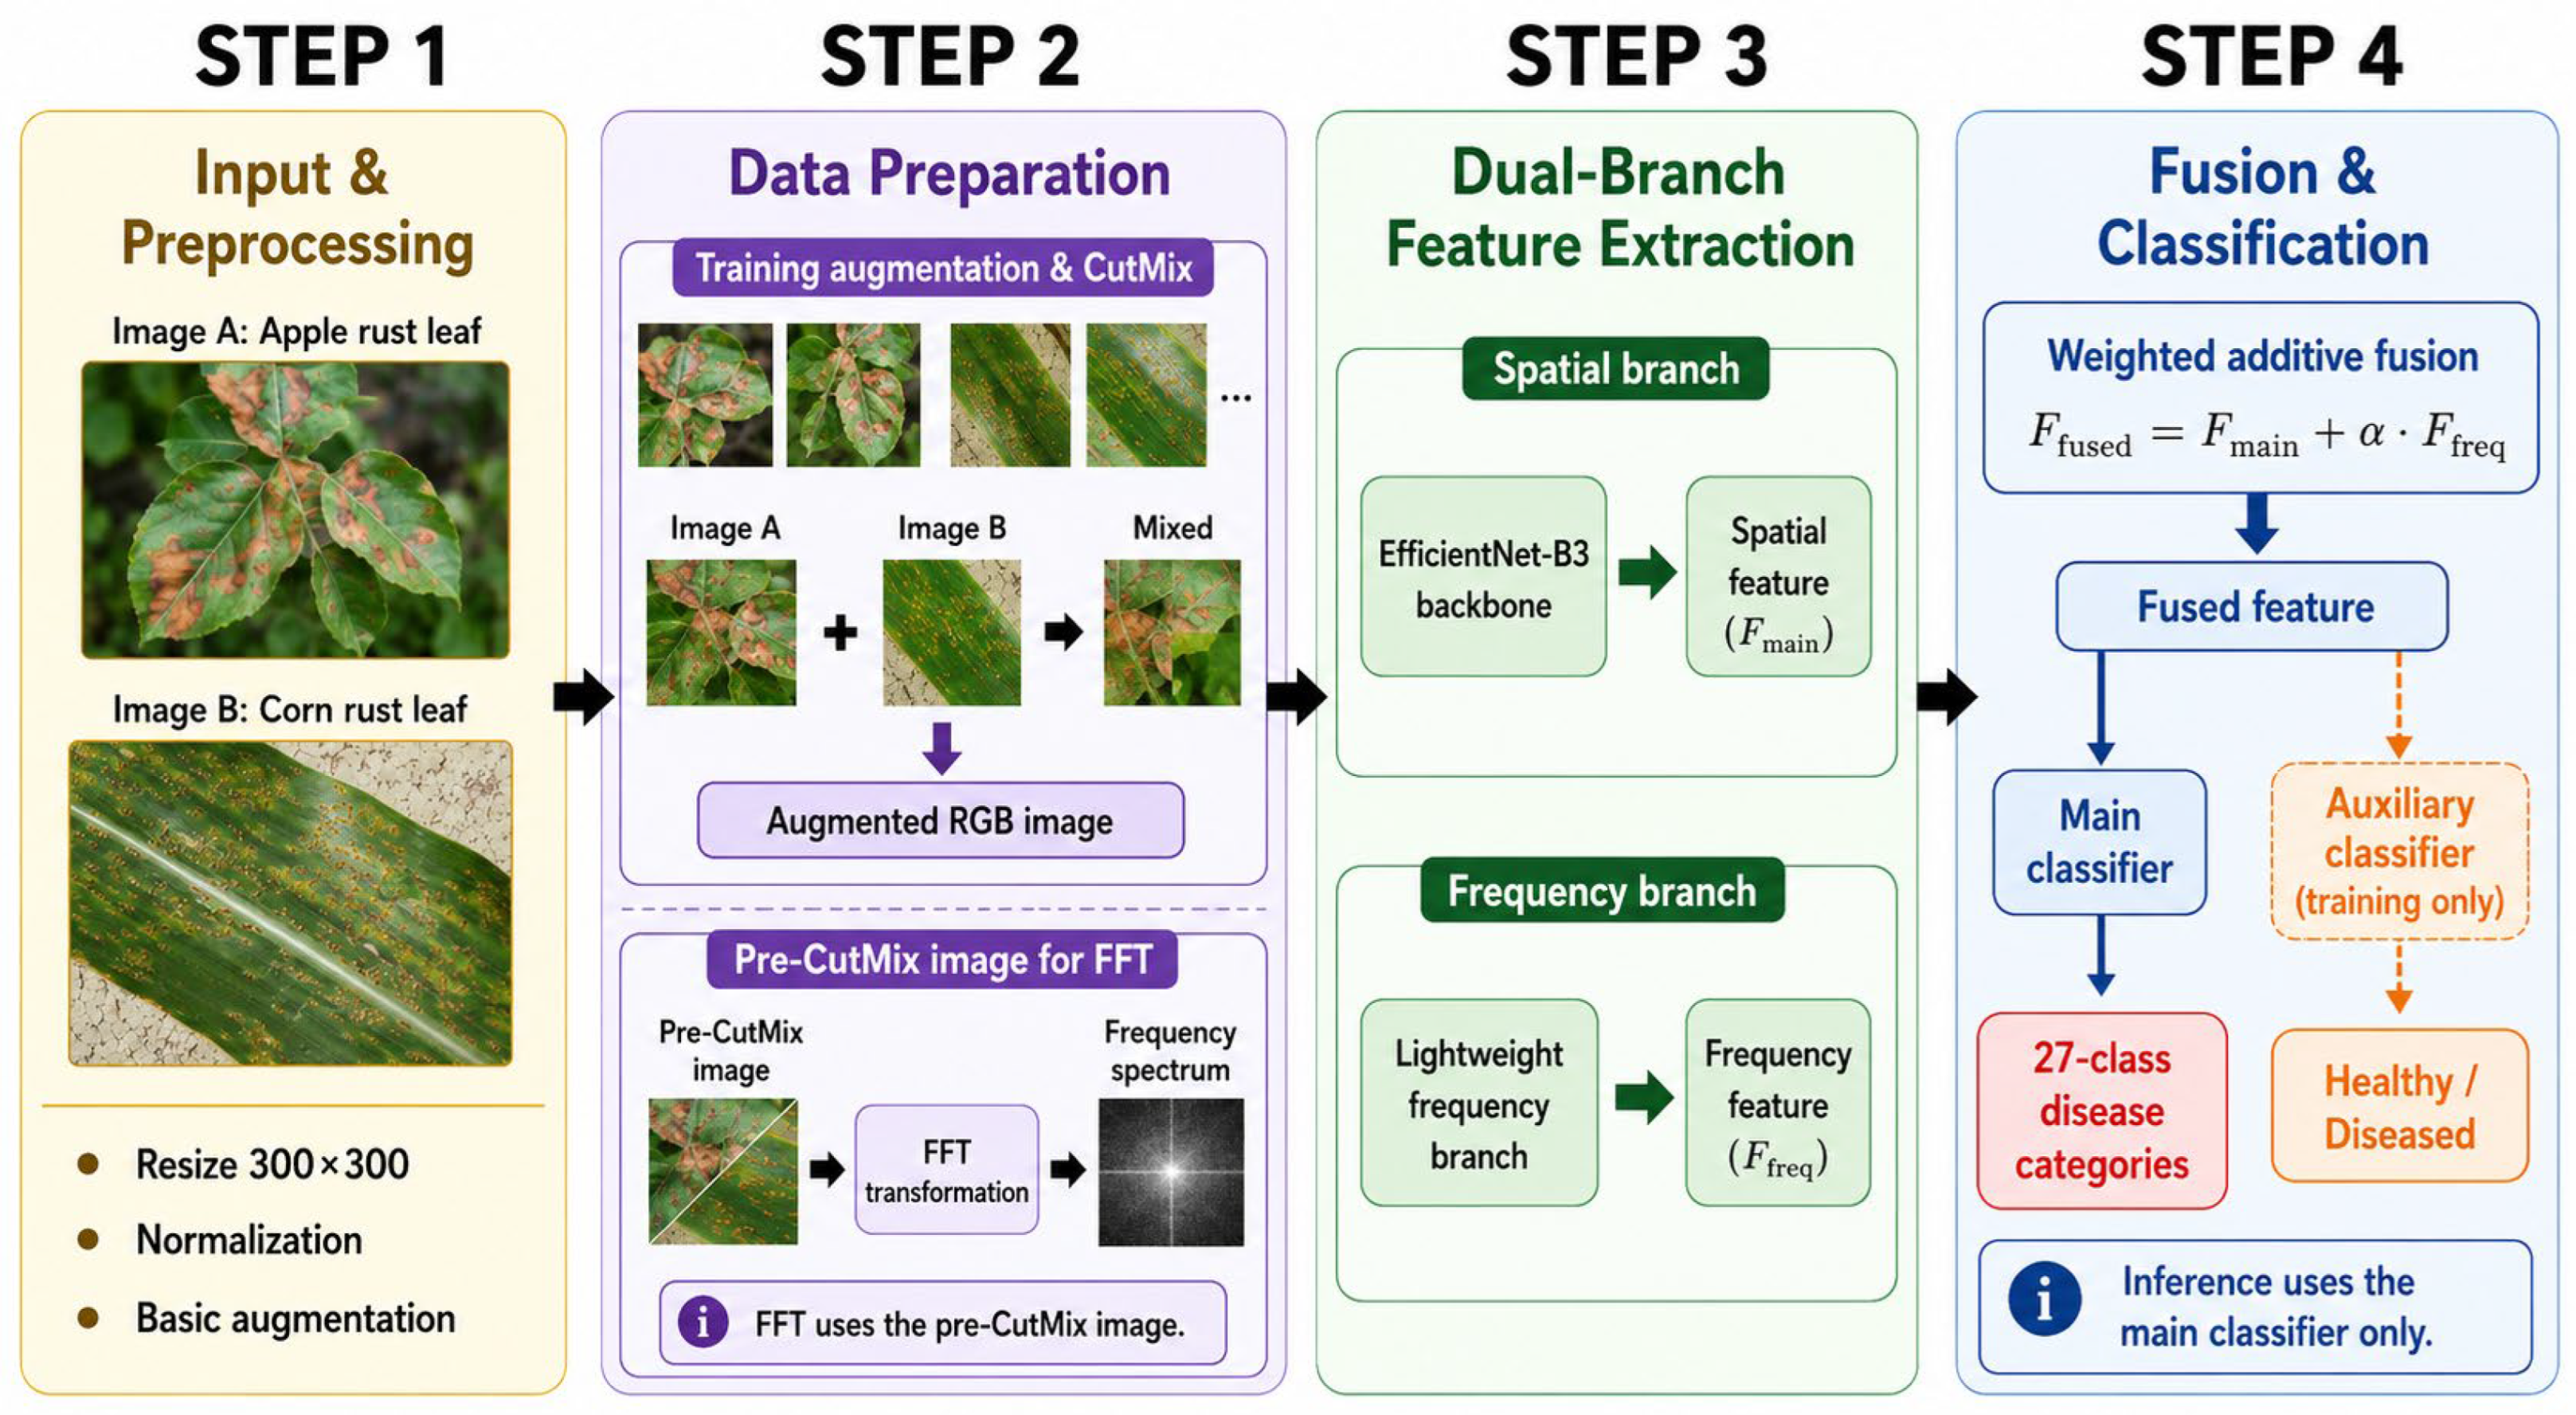
Figure 3 illustrates the overall architecture of the proposed FAF-Net. The model consists of four main components: an RGB spatial branch, an FFT-based frequency branch, a feature fusion module, and two classification heads. The RGB branch uses EfficientNet-B3 as the backbone to extract spatial semantic features from natural-scene images. In parallel, the frequency branch converts the input image into a Fourier magnitude spectrum and extracts complementary texture-related representations. The spatial and frequency-domain features are then fused and used for multi-class plant disease classification.
During training, CutMix [
29] augmentation is applied to improve the robustness of the model to localized occlusion, lesion variability, and background interference.
Let
denote the input image, and basic preprocessing procedures are first applied to obtain a preprocessed image
. The RGB spatial branch receives the CutMix-augmented image
during training and extracts spatial semantic features using EfficientNet-B3. During inference, CutMix is not applied, and the RGB branch receives the preprocessed image
. The RGB branch extracts a spatial feature vector
using EfficientNet-B3:
where
denotes the EfficientNet-B3 backbone. Here,
is set to
during training, whereas
corresponds to
during inference. In parallel, the FFT-based frequency branch extracts a compact frequency feature vector
:
where
denotes the frequency feature extraction branch. The frequency feature is projected to the same dimensionality as the spatial feature:
where
denotes the linear projection layer. The final fused representation is obtained by learnable weighted fusion:
where
is a learnable coefficient initialized to 0.1. The fused feature
is then fed into two classification heads. The main classifier predicts the 27 PlantDoc categories, including both healthy and diseased plant classes. In addition, a healthy/diseased auxiliary classifier is introduced during training to provide coarse-grained disease-status supervision. This auxiliary task regularizes the shared representation and encourages the model to focus on disease-relevant visual cues. During inference, the final plant disease category is determined only by the main classifier, while the auxiliary classifier is not used for final decision-making.
2.3. Data Preprocessing
All images were resized to 300 × 300 pixels. Several data augmentation methods were introduced in the training set. The main operations used in the preprocessing stage are as follows:
Color Jittering: Randomly adjusts brightness, contrast, saturation and hue. The adjustment ranges for brightness, contrast, and saturation were set to 0.2, and the hue adjustment range was set to 0.1.
Random Horizontal Flipping: Generates mirrored images by horizontally flipping the input images, introducing variations in leaf orientation and spatial position.
Random Cropping and Resizing: Randomly crops local regions of the image and resizes them back to 300 × 300 pixels, enabling the model to learn disease features at different scales. The cropping scale was set to 0.75–1.0, meaning that the cropped region occupied 75% to 100% of the original image area.
It should be noted that no leaf segmentation or background removal was performed during preprocessing. Instead, the complete natural-scene images were preserved as the model input.
2.4. CutMix-Based Augmentation
In addition to the conventional augmentation operations described in
Section 2.3, CutMix was further adopted during training. CutMix is a data augmentation strategy proposed by Yun et al. [
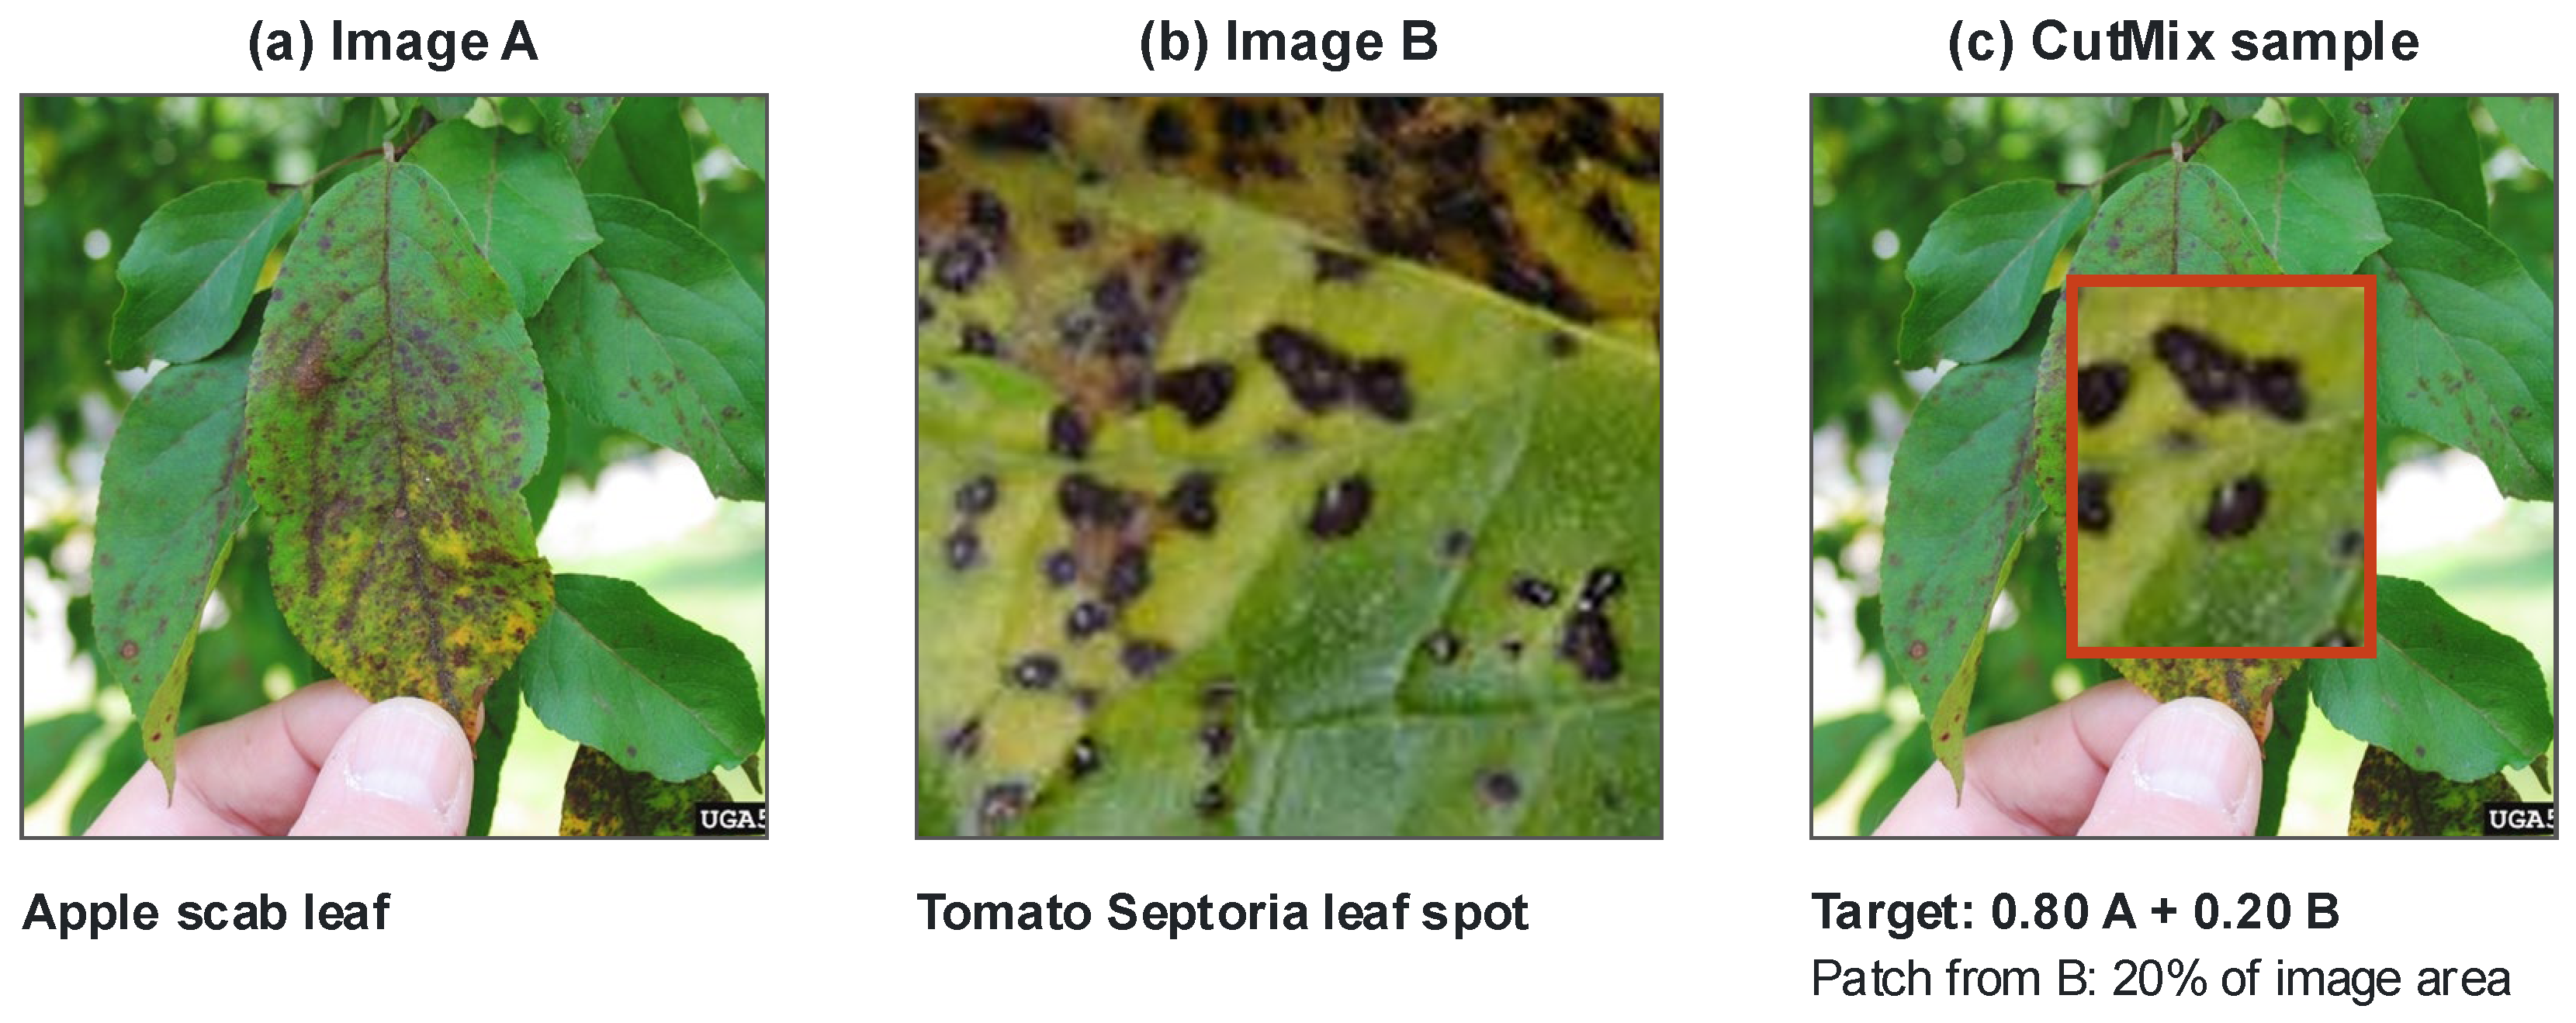
29], in which a rectangular region of one training image is replaced with the corresponding region cropped from another image. This strategy increases sample diversity and encourages the model to learn discriminative features from partial disease symptoms rather than relying only on a single global appearance pattern.
Given two training samples
and
, where
and
are input images and
and
are their one-hot class labels, CutMix generates a mixed image
and a mixed label
as follows:
where
is a binary mask indicating the retained and replaced image regions,
denotes element-wise multiplication, and
is the adjusted mixing ratio calculated according to the actual pasted area. The initial mixing ratio
is sampled from a Beta distribution:
where
is the CutMix hyperparameter, which is set to 1. If the pasted region has width
and height
, the adjusted mixing ratio is calculated as:
The mixed image
is then used as the input to the RGB spatial branch during training, whereas the FFT-based frequency branch receives the corresponding pre-CutMix preprocessed image to avoid artificial spectral artifacts introduced by CutMix boundaries. During inference, CutMix is not applied, and the preprocessed image is used directly as the input. An example of the CutMix operation used in this study is shown in
Figure 4.
2.5. FFT-Based Frequency Branch
The FFT-based frequency branch is designed to extract complementary frequency-domain information from the input image. Disease symptoms such as lesion boundaries, spot edges, powdery regions, and local texture disruptions may introduce frequency-domain variations that are not fully captured by spatial RGB features alone. Therefore, an additional frequency branch is introduced to enhance the representation of fine-grained texture cues.
To construct the frequency branch, the preprocessed RGB image
is first converted into a grayscale image
. A two-dimensional Fast Fourier Transform (FFT) is then applied to
to obtain the complex frequency representation
where
denotes the 2D FFT operation. Since the FFT output is complex-valued, its magnitude spectrum is utilized to capture the frequency characteristics. To align the zero-frequency component with the center of the spectrum, a frequency shift operation
is executed. The centered magnitude spectrum
is defined as follows:
To reduce the large dynamic range of the spectral amplitudes, we apply a logarithmic scaling transformation
Finally, is normalized to the range of [0, 1] using Min-Max normalization, and used as the input to the frequency branch.
The frequency branch is designed with a lightweight convolutional architecture, comprising three successive Convolution-Batch Normalization-ReLU (Conv-BN-ReLU) blocks followed by a Global Average Pooling (GAP) layer. This pipeline extracts a 64-dimensional frequency feature, which is subsequently projected by a linear layer to match the dimensionality of the spatial feature extracted by the EfficientNet-B3 backbone.
2.6. Auxiliary Supervision Branch
A healthy/diseased auxiliary supervision branch is introduced to provide coarse-grained disease-status guidance during training [
25]. The main classification task predicts the 27 PlantDoc categories, whereas the auxiliary task predicts whether the input image belongs to a healthy or diseased class. This auxiliary task is expected to regularize the shared feature representation and encourage the model to focus on disease-relevant visual cues.
The binary auxiliary labels were generated from the original PlantDoc category labels. Categories corresponding to pathological symptoms, including scab, rust, spot, blight, mildew, rot, virus, mold, and mite-related symptoms, were assigned to the diseased class. Categories describing normal crop leaves were assigned to the healthy class.
The auxiliary classifier uses the fused feature as its input. While the main classifier predicts plant leaf category, the auxiliary classifier is implemented as a fully connected layer that predicts healthy/diseased status. During training, the model is optimized using a weighted combination of two classification losses.
Let
denote the main classification loss, and
denote the auxiliary binary classification loss, the total loss is defined as:
where
is the weight of the auxiliary loss. In this study,
is set to 0.2. This encourages the model to learn both fine-grained and coarse-grained information. During inference, the final plant disease category is determined only by the main classifier.
3. Experimental Setup
3.1. Implementation Details
The experiments were conducted on a high-performance computing platform equipped with an NVIDIA A100 GPU (80 GB), an 8-core Intel Xeon CPU, and 32 GB RAM, using Ubuntu 20.04, PyTorch 1.10.0, CUDA 11.4.0, and Python 3.8.
All input images were resized to 300 × 300 pixels before being fed into the network. During training, the basic augmentation operations described in
Section 2.3 were applied to all models, including color jittering, random horizontal flipping, and random resized cropping. CutMix augmentation was further applied only to the corresponding model variants, as described in
Section 2.4.
The models were optimized using the Adam optimizer. The initial learning rate was set to 6 × 10⁻⁴, the batch size was set to 96, and all models were trained for 100 epochs. The CutMix parameter was set to 1. For FAF-Net, the auxiliary loss weight was set to 0.2. The learnable frequency fusion coefficient was initialized to 0.1 and updated jointly with the network parameters during training.
For a fair comparison, all ablation models and comparative baseline models were trained using the same data split, input resolution, basic augmentation strategy, optimizer type, and evaluation metrics. The final classification results were obtained from the main 27-class classification branch. The auxiliary healthy/diseased branch was used to provide additional supervision during training and was not used to determine the final plant disease category during inference.
The checkpoint with the highest validation macro-F1 score was selected for final testing. If two checkpoints produced the same validation macro-F1 score, the checkpoint with the higher validation accuracy was selected. The final evaluation was conducted on the official PlantDoc test set.
3.2. Evaluation Metrics
Accuracy, precision, recall and F1-score were used to evaluate the performance of the model. During evaluation, the predicted class was determined by selecting the class with the highest logit from the main classification branch.
Accuracy measures the overall proportion of correctly classified samples in the test set, and is defined as:
where
denotes the number of correctly predicted samples, and
denotes the total number of test samples.
Since the PlantDoc dataset contains imbalanced class distributions, we further calculated precision, recall and F1-score for each class. For the i-th class, these metrics are defined as:
where
,
and
represent the true positives, false positives, and false negatives of the
i-th class, respectively.
The final precision, recall, and F1-score were reported using macro averaging:
where
is the total number of classes. Therefore, macro-averaged metrics provide a balanced evaluation of model performance on imbalanced datasets.
3.3. Computational Efficiency Evaluation
To evaluate the computational efficiency of FAF-Net, an additional benchmark was conducted under a unified testing protocol. The benchmark was performed on an NVIDIA GeForce RTX 3060 Laptop GPU with a batch size of 1. The external RGB input size was fixed at 1 × 3 × 300 × 300 for all models. The evaluated metrics included the number of parameters, multiply–accumulate operations (MACs), estimated floating-point operations (FLOPs), model size, inference latency, throughput, and peak GPU memory consumption.
The number of parameters was counted directly from the model parameters, while MACs were measured using THOP under the same 300 × 300 input resolution. FLOPs were estimated as two times the number of MACs. For latency measurement, each model was switched to evaluation mode and tested without gradient calculation. After 30 warm-up iterations, the average latency was calculated from 200 repeated forward passes. Throughput was reported as frames per second based on the average latency.
For all compared methods, the reported model latency refers to the neural network forward pass. For frequency-branch models, the model-forward benchmark used an additional precomputed 1 × 1 × 300 × 300 frequency input. In addition, the complete FAF-Net inference pipeline was also tested by including GPU-based FFT magnitude preprocessing before the network forward pass. Image reading, decoding, and resizing were not included in the latency measurement.
4. Results
4.1. Overall Experimental Results
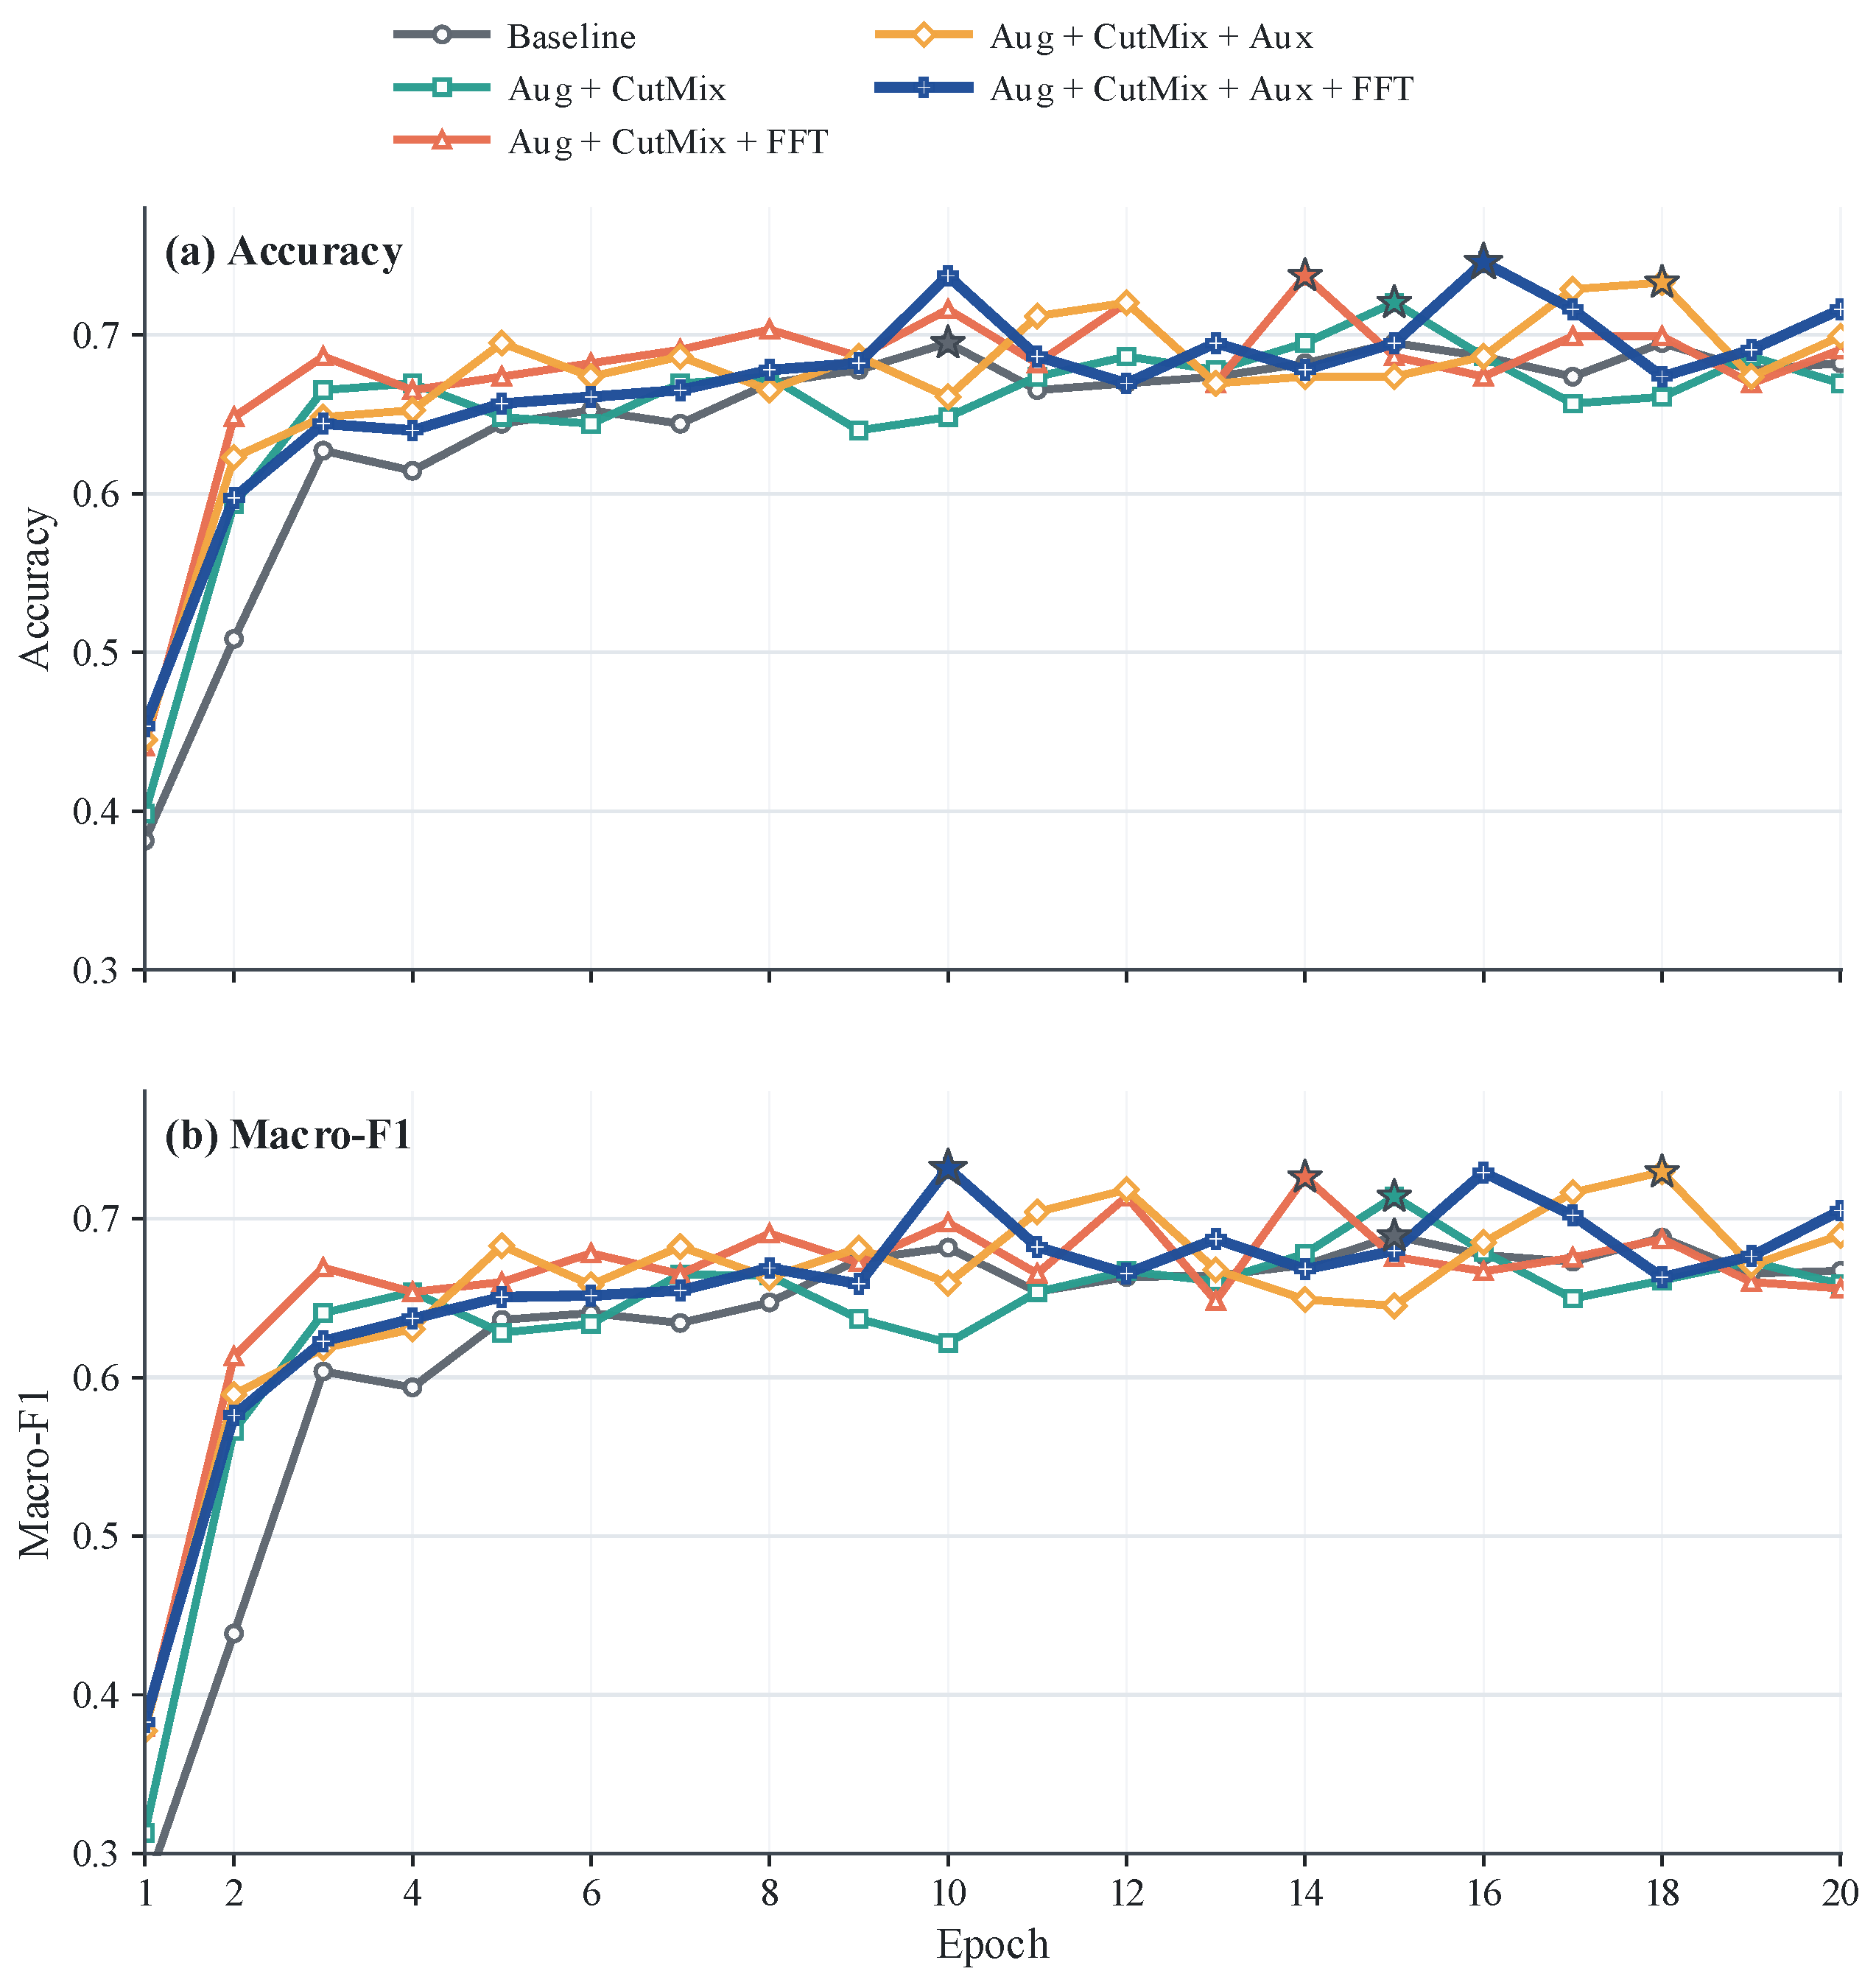
Figure 5 shows the validation accuracy and macro-F1 curves of the EfficientNet-B3 baseline and the proposed model variants during training. The curves were used to monitor the training process and select the best checkpoint, whereas the final performance was evaluated on the official PlantDoc test set. Compared with the baseline, the models incorporating the proposed strategies generally maintained higher accuracy and macro-F1 values during training, indicating that the additional modules improved the stability of feature learning under natural-scene conditions.
The EfficientNet-B3 baseline achieved an accuracy of 69.49%. After introducing CutMix, FFT branch and auxiliary supervision branch, the overall performance improved substantially. The final model achieved 74.58% accuracy. Compared with the baseline model, the proposed methods improved accuracy by 5.09 percentage points. Our proposed methods can effectively improve the recognition ability of models on natural-scene images.
4.2. Ablation Study
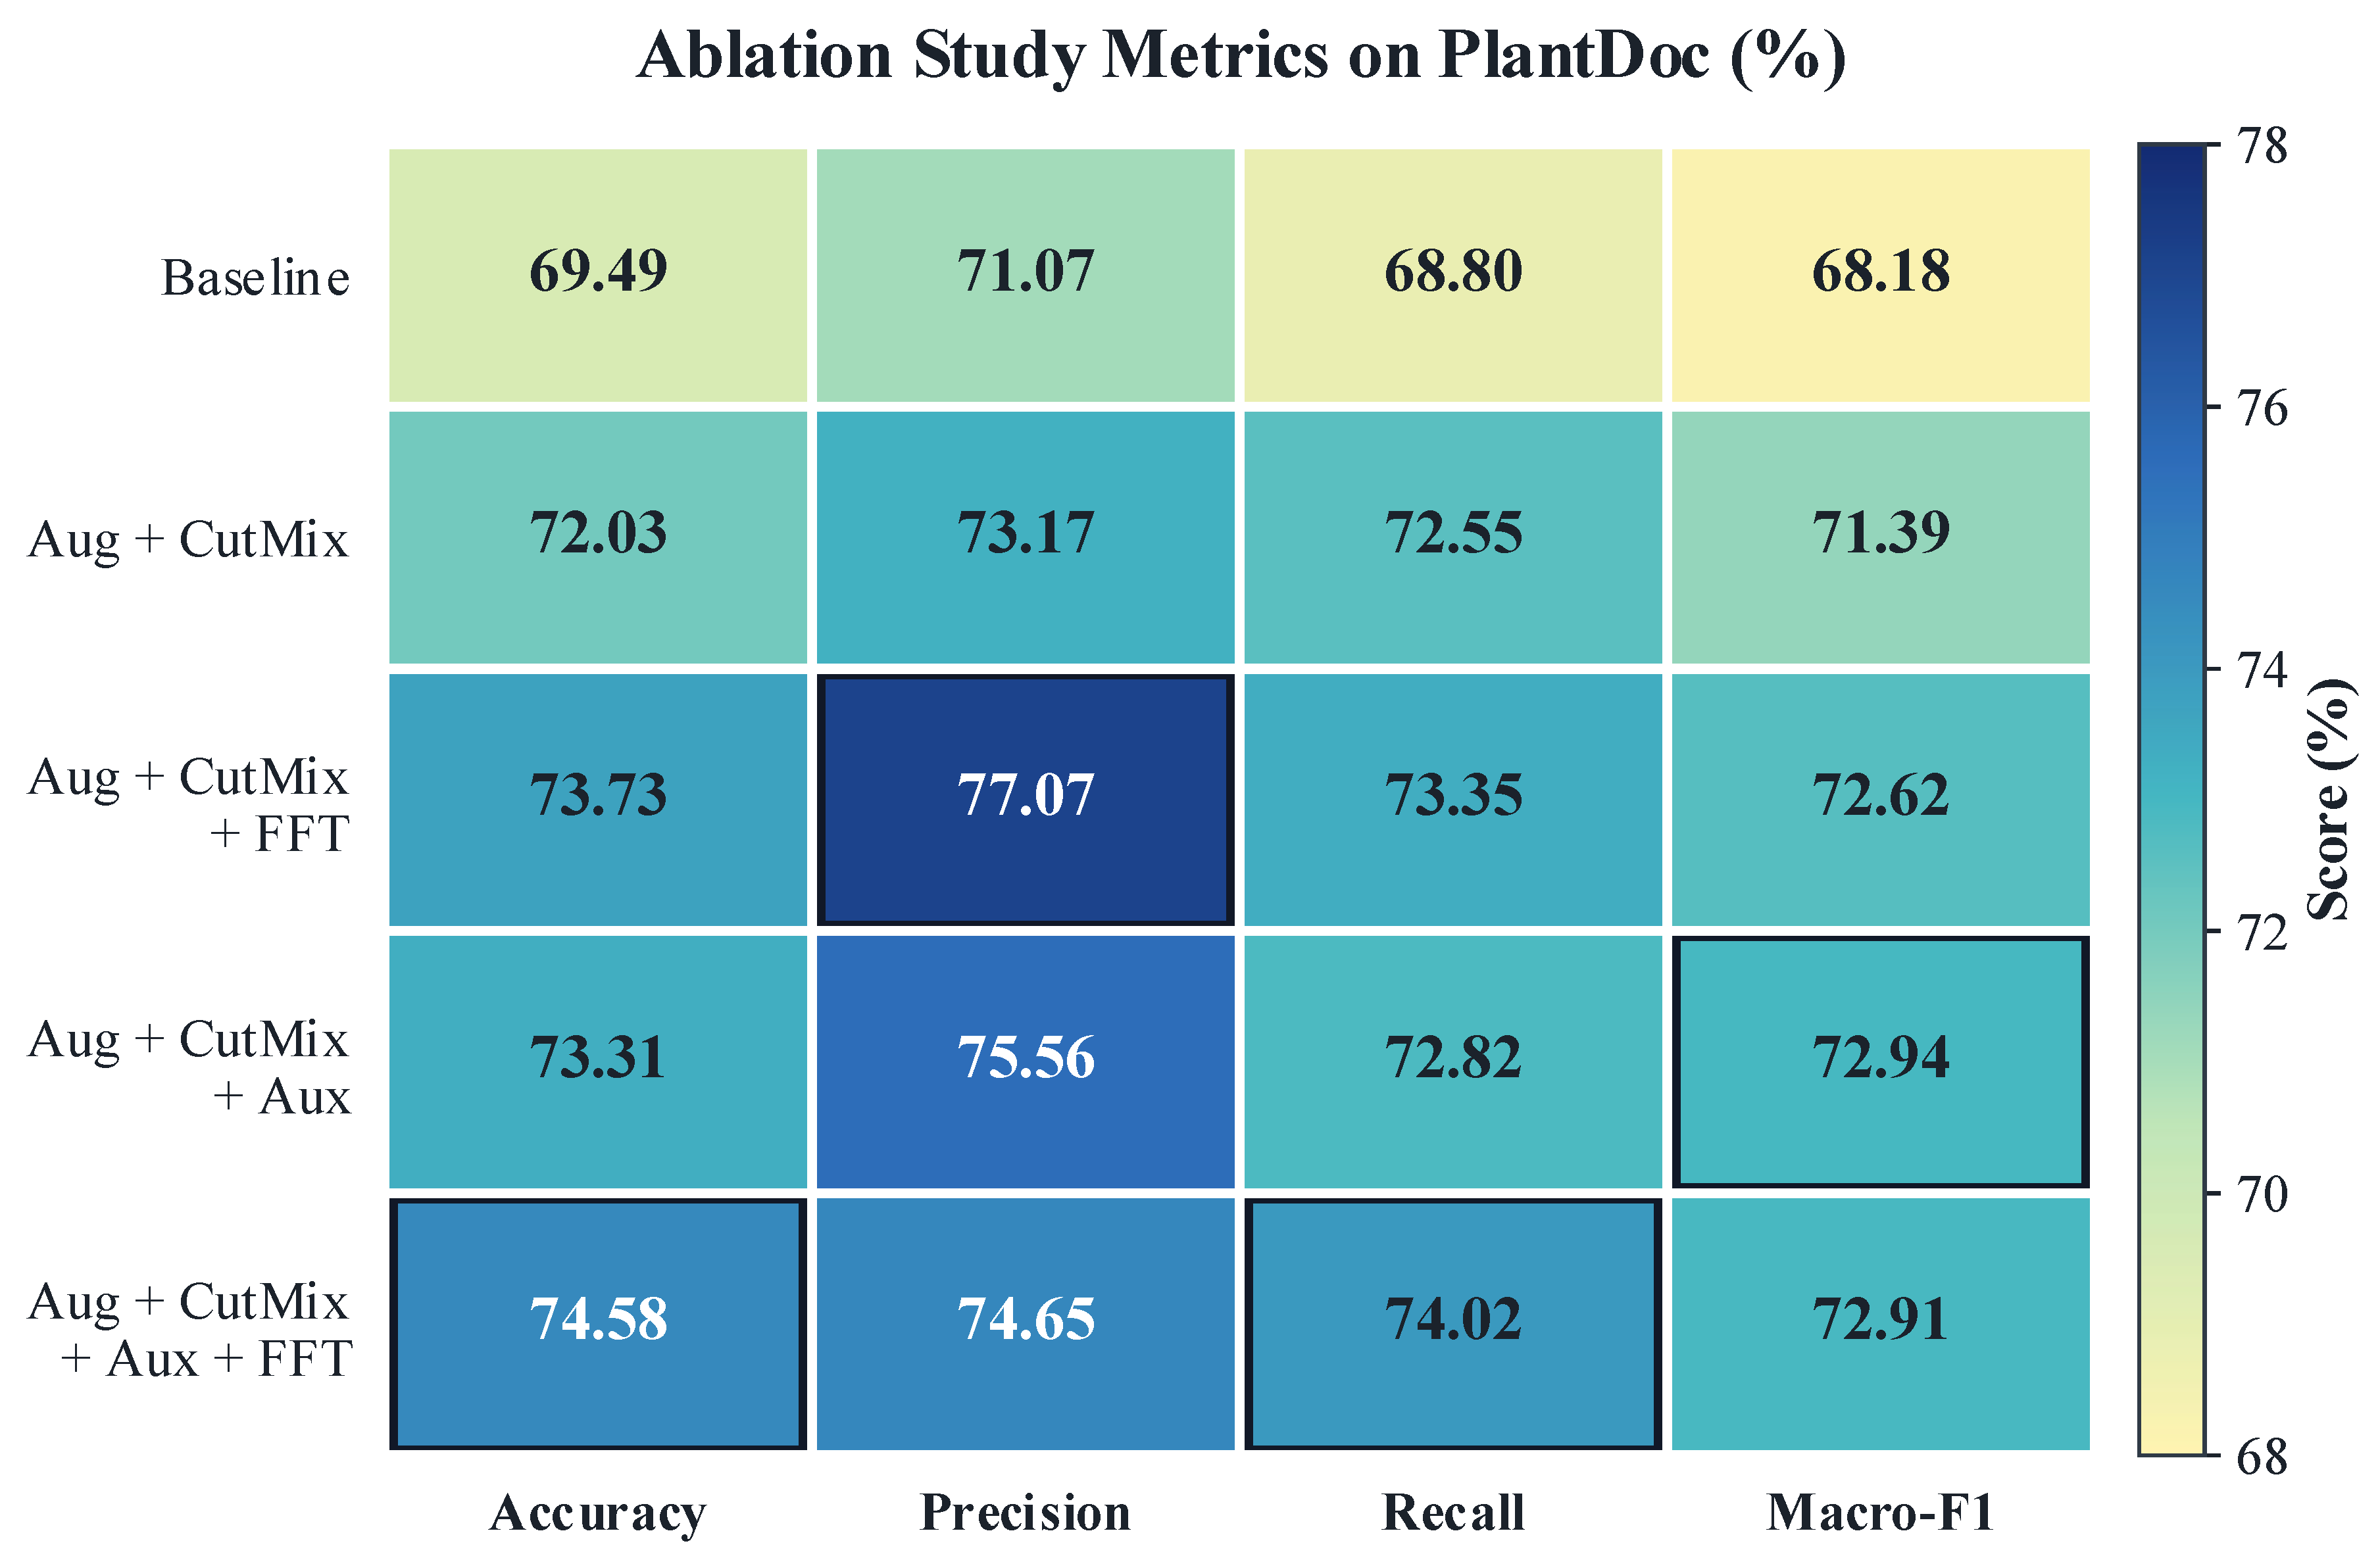
To evaluate the contribution of each component, we gradually added CutMix, FFT branch and auxiliary classification supervision. The ablation results are shown in
Table 2 and
Figure 6.
After adding CutMix as an extra data augmentation method, accuracy increased from 69.49% to 72.03%, and F1-score increased from 68.18% to 71.39%. CutMix increases sample diversity and improves model robustness to complex backgrounds and localized lesions.
When the FFT frequency branch was added on top of CutMix, accuracy further increased to 73.73%. After adding the FFT branch, the CutMix + FFT variant achieved the highest macro-precision, suggesting that frequency-domain features may have helped reduce false-positive predictions in some classes. In this context, a false positive means that a sample not belonging to a certain class is incorrectly predicted as that class. A higher macro-precision indicates that when the model predicts a certain class, the prediction is generally more reliable, meaning that the model makes fewer incorrect positive predictions for that class.
With auxiliary classification supervision added on top of CutMix, the model achieved the highest F1-score of 72.94%. Healthy/Diseased auxiliary supervision provides an additional constraint for shared feature learning and improves overall discriminative ability. This task encourages the model to first learn whether disease-related visual cues are present and then further distinguish the specific 27 fine-grained categories. Therefore, after adding auxiliary supervision, the model became more capable of retrieving disease samples that might otherwise be missed. In other words, auxiliary supervision made the model more sensitive to potential disease-related features, rather than being overly conservative and predicting only the easiest samples.
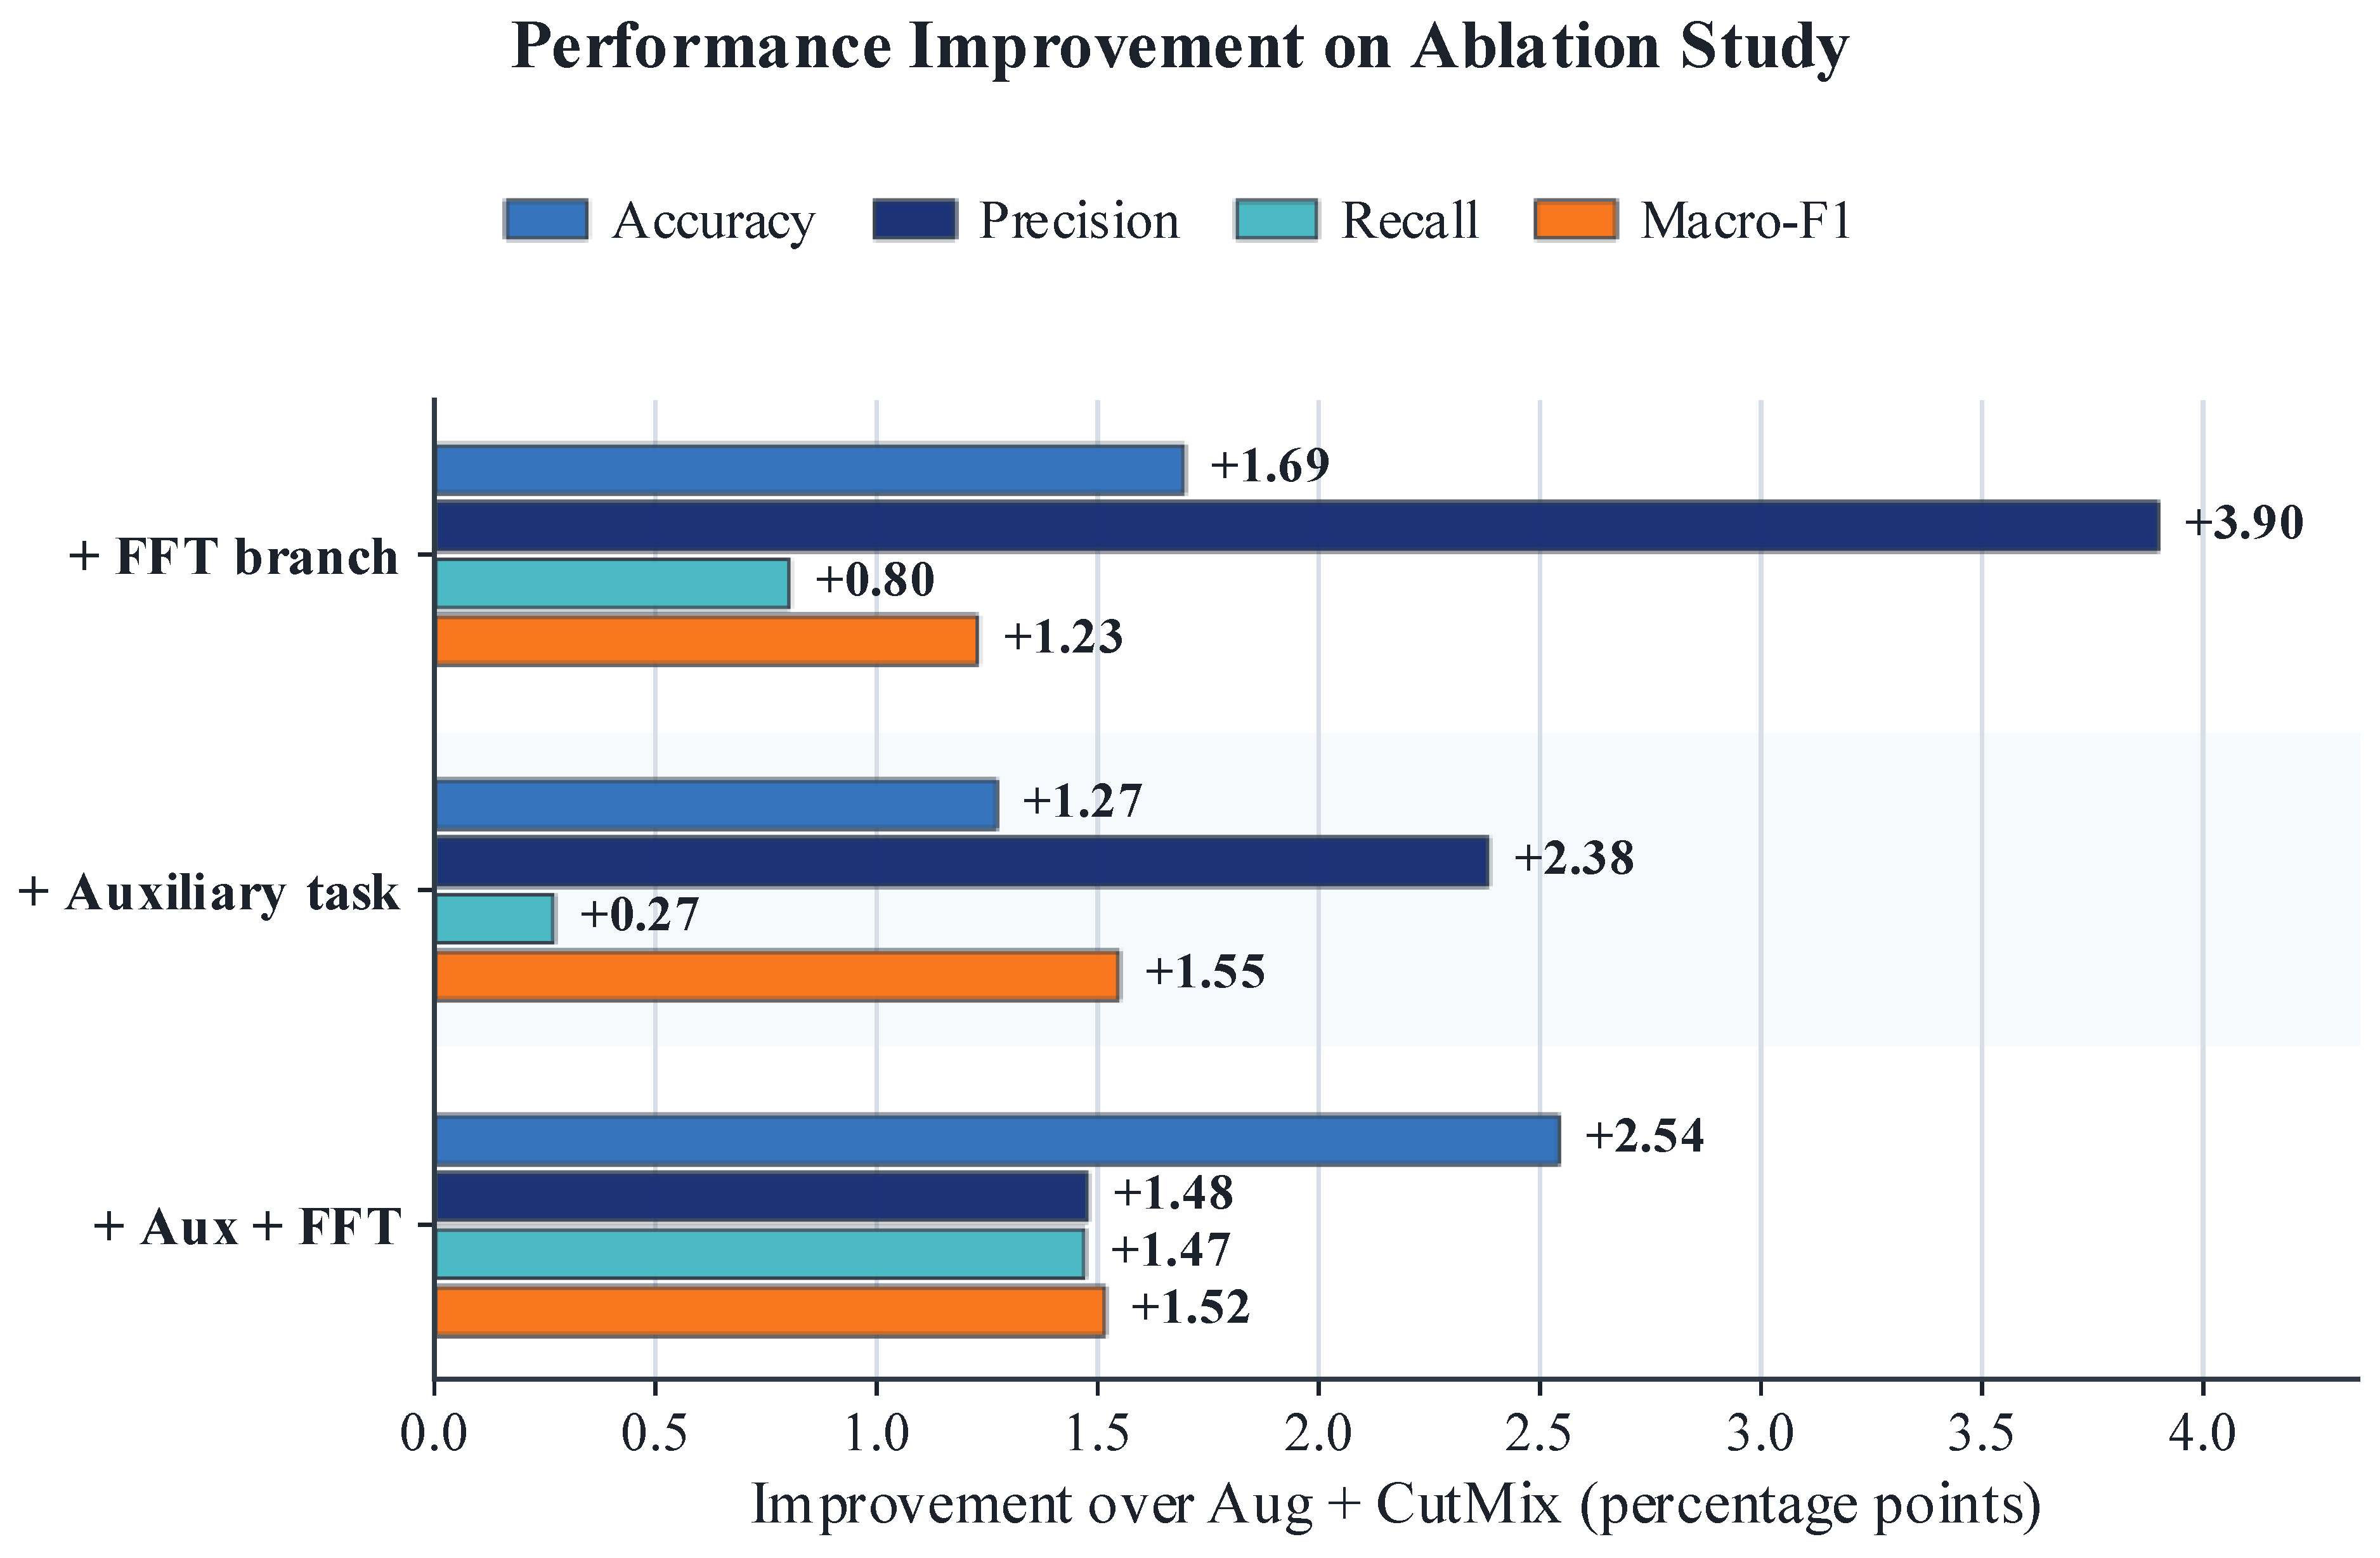
Figure 7 shows the performance improvement of each module compared with Baseline + CutMix. The final model combined CutMix, the FFT branch, and auxiliary classification supervision, achieving the highest accuracy of 74.58% and recall of 74.02%. Three strategies are complementary in terms of data augmentation, frequency feature supplementation, and training supervision.
As
Figure 7 displays, the CutMix + FFT variant produced the highest macro-precision. Macro-precision reflects the reliability of positive predictions for each class. In other words, it measures how many samples predicted as a given class are actually from that class, and then averages this value across all classes. After adding healthy/diseased auxiliary supervision, the complete FAF-Net achieved the highest accuracy and macro-recall, but its macro-precision slightly decreased compared with its variant. This decrease can be explained by the change in prediction behavior introduced by auxiliary supervision. The auxiliary task encourages the shared representation to become more sensitive to general disease-related cues. As a result, the model can retrieve more difficult or ambiguous diseased samples, which improves recall and overall accuracy. However, this increased sensitivity may also cause the model to assign some visually similar samples to disease categories more actively.
For example, samples with similar spots, necrotic regions, or edge discoloration may be more easily predicted as a related disease class even when they belong to another class. These additional incorrect positive assignments increase false positives for certain categories, which can reduce macro-precision. Therefore, the slight decrease in macro-precision does not indicate that the complete model is less effective; rather, it reflects a precision–recall trade-off, showing that FAF-Net improves class coverage and overall correctness.
4.3. Comparative Experiment and Analysis
To verify the effectiveness of the proposed method, VGG16, ResNet50, DenseNet121, and InceptionV3 were selected as comparison models. All models were evaluated under the same PlantDoc split and trained under the same basic settings. ImageNet-pretrained weights and basic data augmentation strategies were applied to all models.
As shown in
Table 3, compared to other models, DenseNet121 achieved an accuracy of 69.07%, establishing a stable performance. The selected EfficientNet-B3 baseline performed slightly better than DenseNet121. FAF-Net’s accuracy is higher by 5.09 percentage points compared with EfficientNet-B3. FAF-Net achieved the highest accuracy, Macro-Recall, and Macro-F1 among all models. Overall, FAF-Net achieved the best accuracy, macro-recall, and macro-F1 among the compared backbone models, while maintaining a compact model size.
4.4. Computational Efficiency Analysis
The computational efficiency results are shown in
Table 4. Compared with the EfficientNet-B3 baseline, adding the FFT-based frequency branch increased the parameter count from 10.739 M to 10.863 M, and the MACs from 1.930 G to 2.161 G. Adding the auxiliary branch introduced only a very small increase in parameters, from 10.739 M to 10.742 M, without increasing MACs. The complete FAF-Net contained 10.866 M parameters and 2.161 G MACs, indicating that the proposed modules introduced only moderate additional computational overhead.
In the network-forward benchmark, FAF-Net achieved a latency of 16.493 ms/image and a throughput of 60.63 FPS. This result measures the computational cost of the neural network itself when both RGB and frequency-domain input tensors are already prepared. To further evaluate the practical cost introduced by frequency preprocessing, we additionally measured the complete FAF-Net inference pipeline by including GPU-based FFT magnitude preprocessing before the network forward pass. Under this setting, the latency increased to 18.926 ms/image, corresponding to 52.84 FPS. This indicates that FFT preprocessing introduces an additional cost of approximately 2.433 ms/image, but the complete inference pipeline still maintains real-time processing capability.
The model size increased only from 41.51 MB for the EfficientNet-B3 baseline to 42.00 MB for FAF-Net, and the peak GPU memory increased from 79.05 MB to 80.59 MB. These results suggest that the FFT-based frequency branch and auxiliary supervision improve classification performance while largely preserving the lightweight property of the EfficientNet-B3 backbone.
4.5. Confusion Matrix
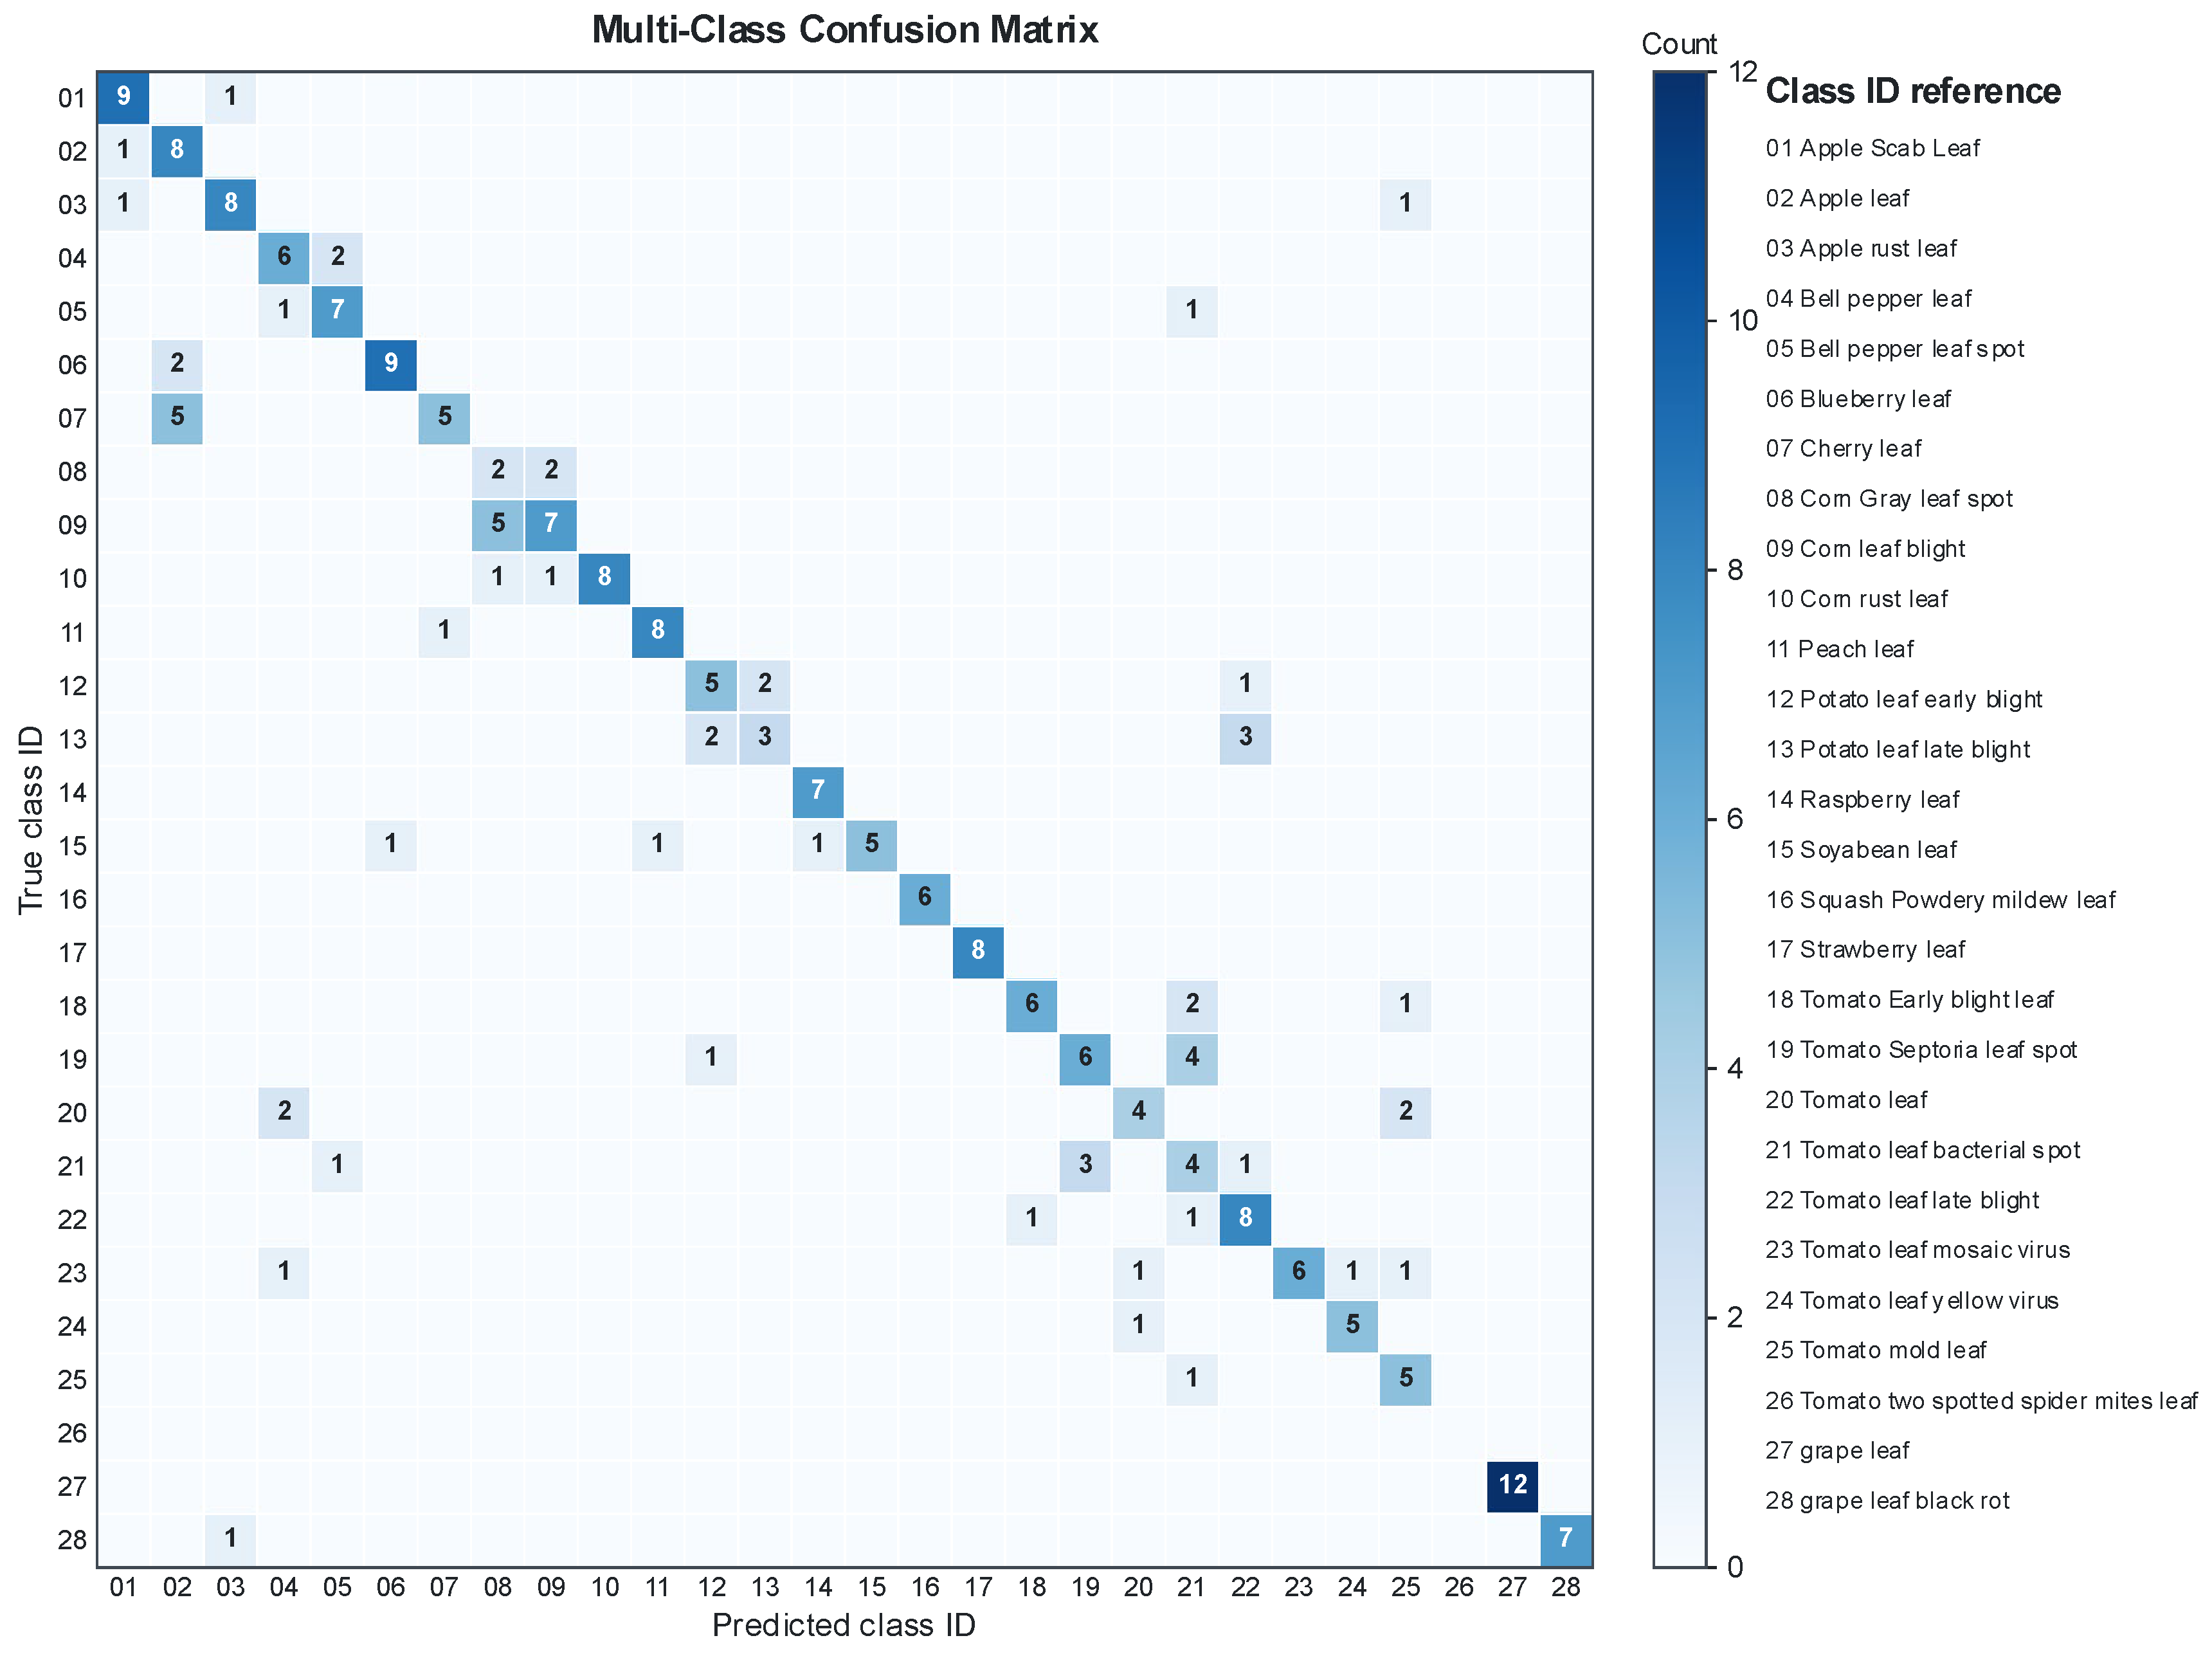
Figure 8 presents the confusion matrix of FAF-Net on the PlantDoc test set. The rows represent the ground-truth labels, and the columns represent the predicted labels. Most predictions are distributed along the main diagonal, showing that the model can correctly identify most plant leaf categories.
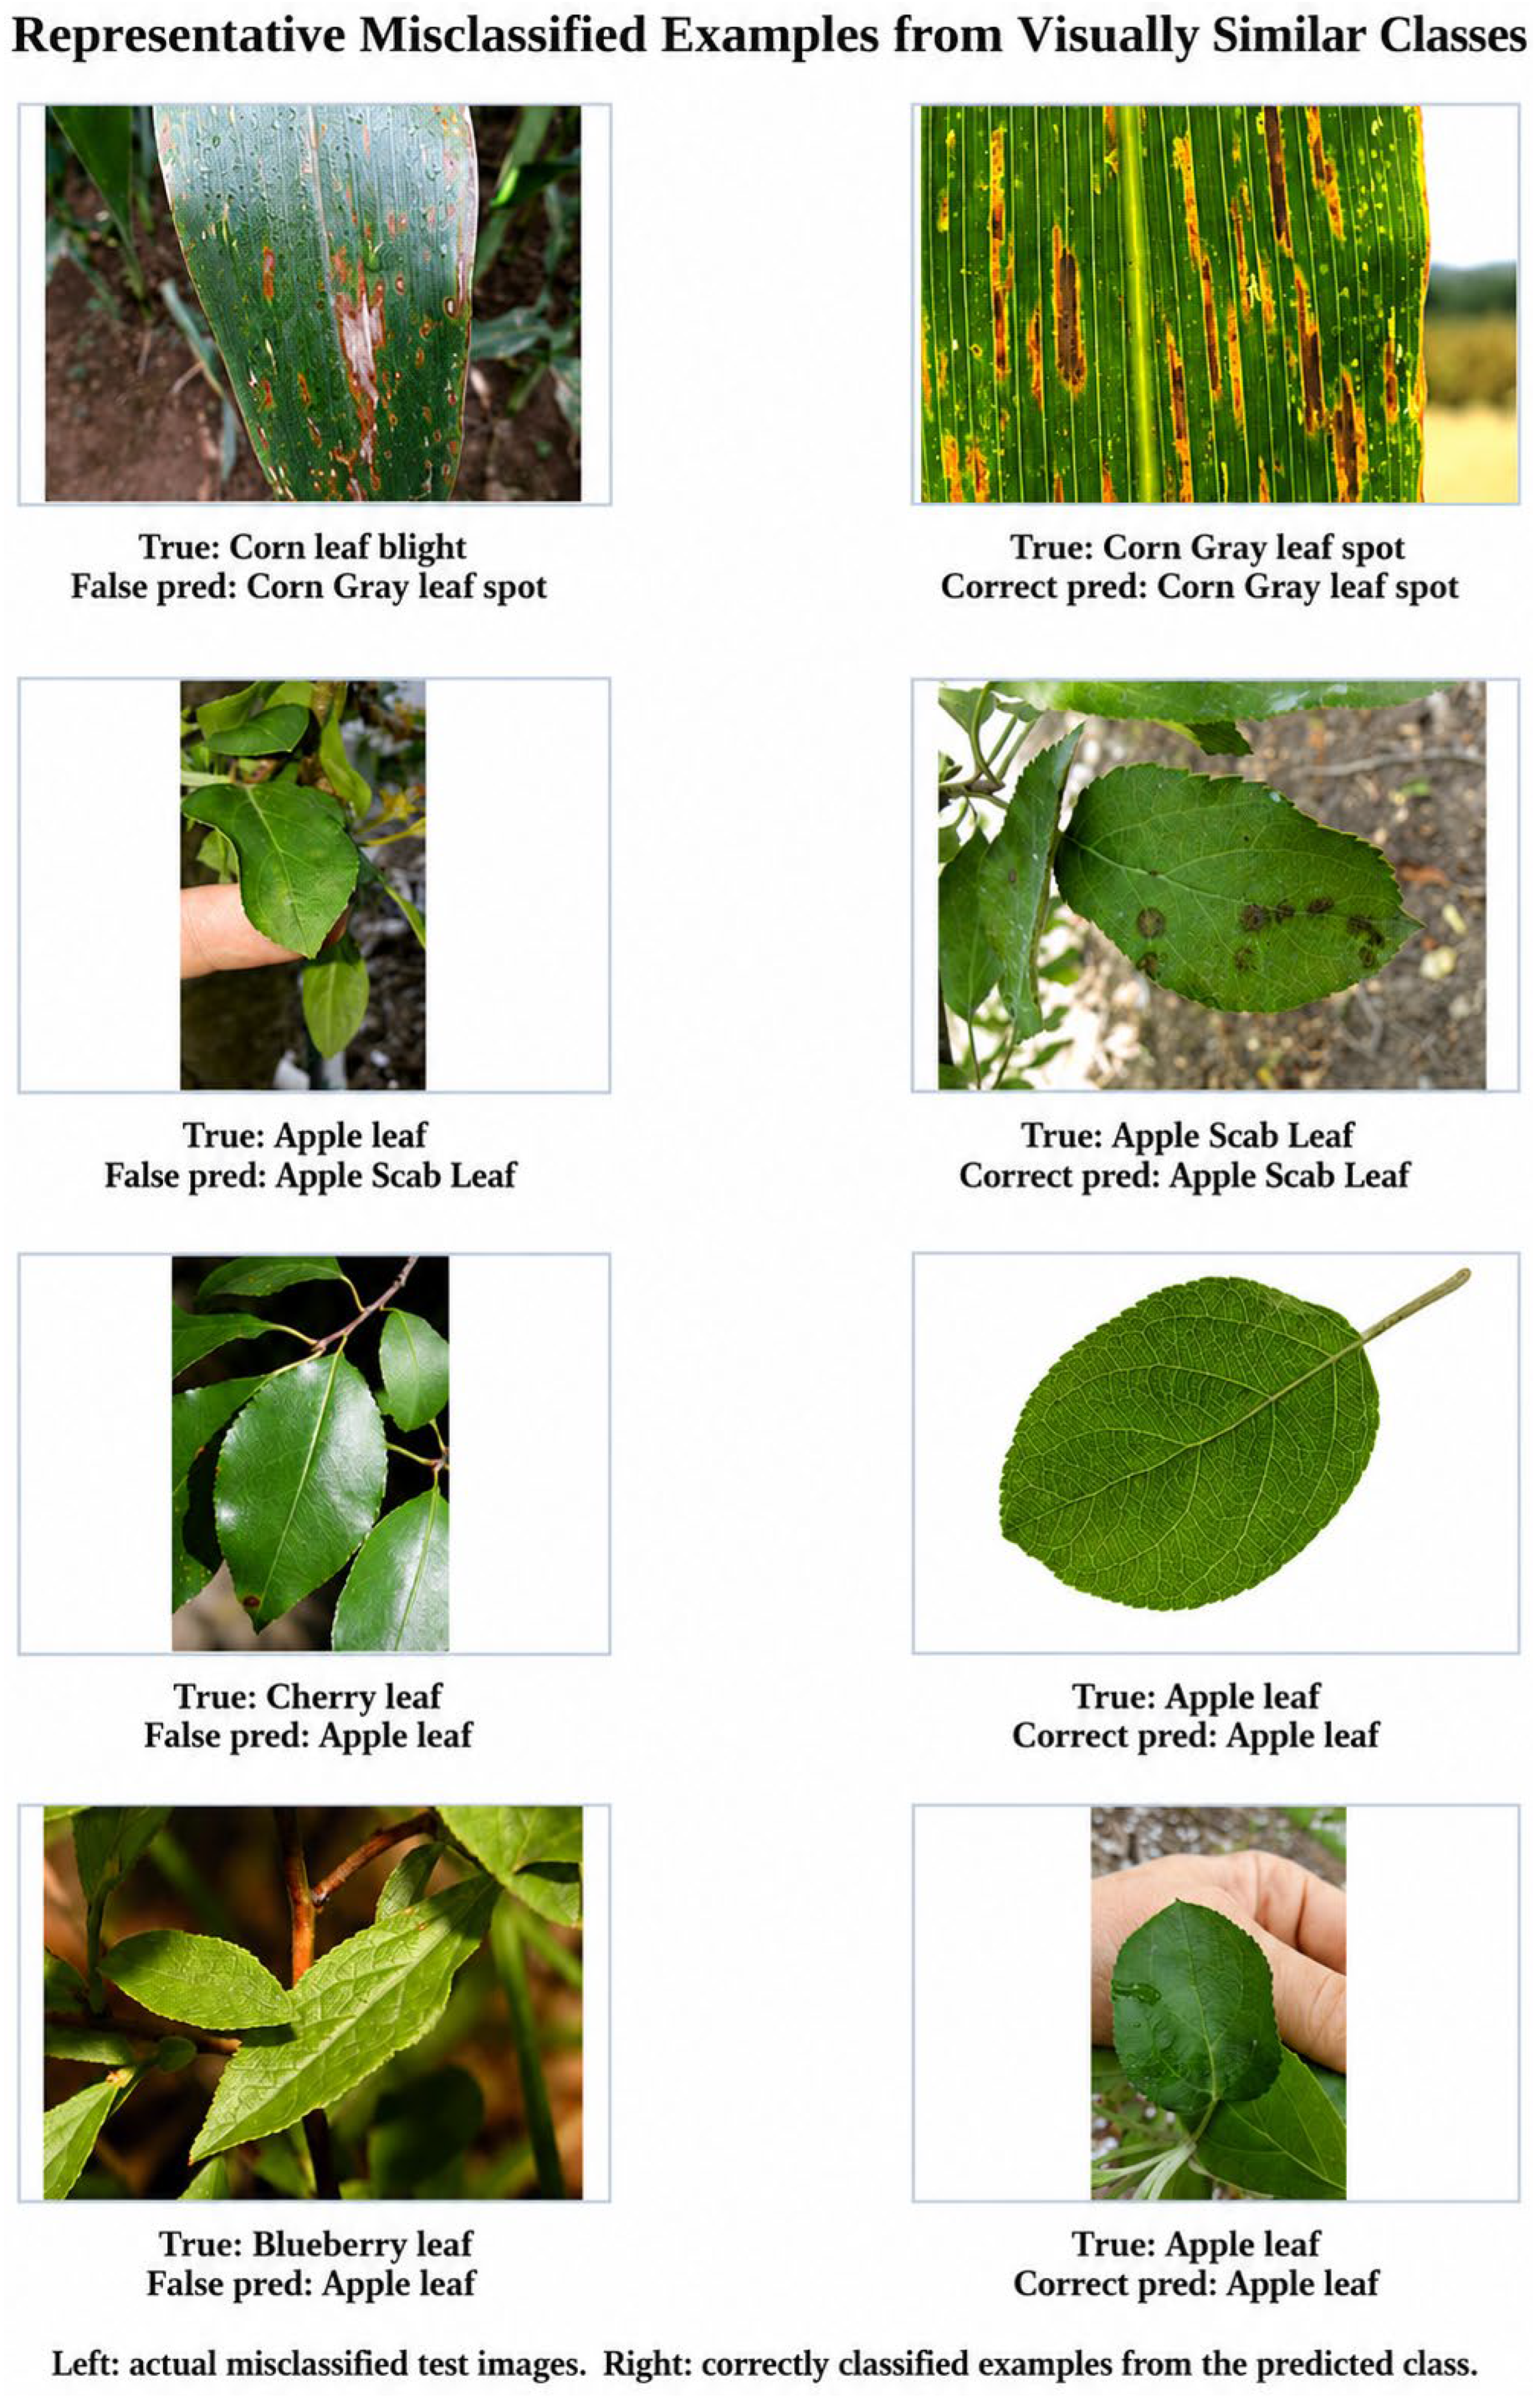
Several representative misclassified samples are presented and compared with correctly classified samples from the corresponding predicted classes. As shown in
Figure 9, a clear confusion pattern appears among visually similar disease categories. For example, corn leaf blight is often misclassified as corn gray leaf spot. These categories usually share similar symptoms, such as spots and edge discoloration, which makes discrimination difficult, especially under natural-scene images.
Another type of error occurs among visually similar healthy leaf categories. Some cherry leaf samples are predicted as apple leaf. When disease symptoms are absent, the model may rely more on the morphological pattern of leaves.
These representative examples suggest that the main errors of FAF-Net are not caused by a general failure of recognition, but are mainly associated with visual similarity among fine-grained categories in natural-scene images. The model can distinguish the overall healthy/diseased status relatively well, but the discrimination of specific disease types or healthy crop categories remains limited by inter-class similarity, background interference, and image-level supervision. This finding also explains why the binary healthy/diseased confusion matrix showed much better performance than the 27-class classification result. It further suggests that lesion localization, weakly supervised attention, or segmentation-assisted information may be useful for improving fine-grained disease classification in future work.
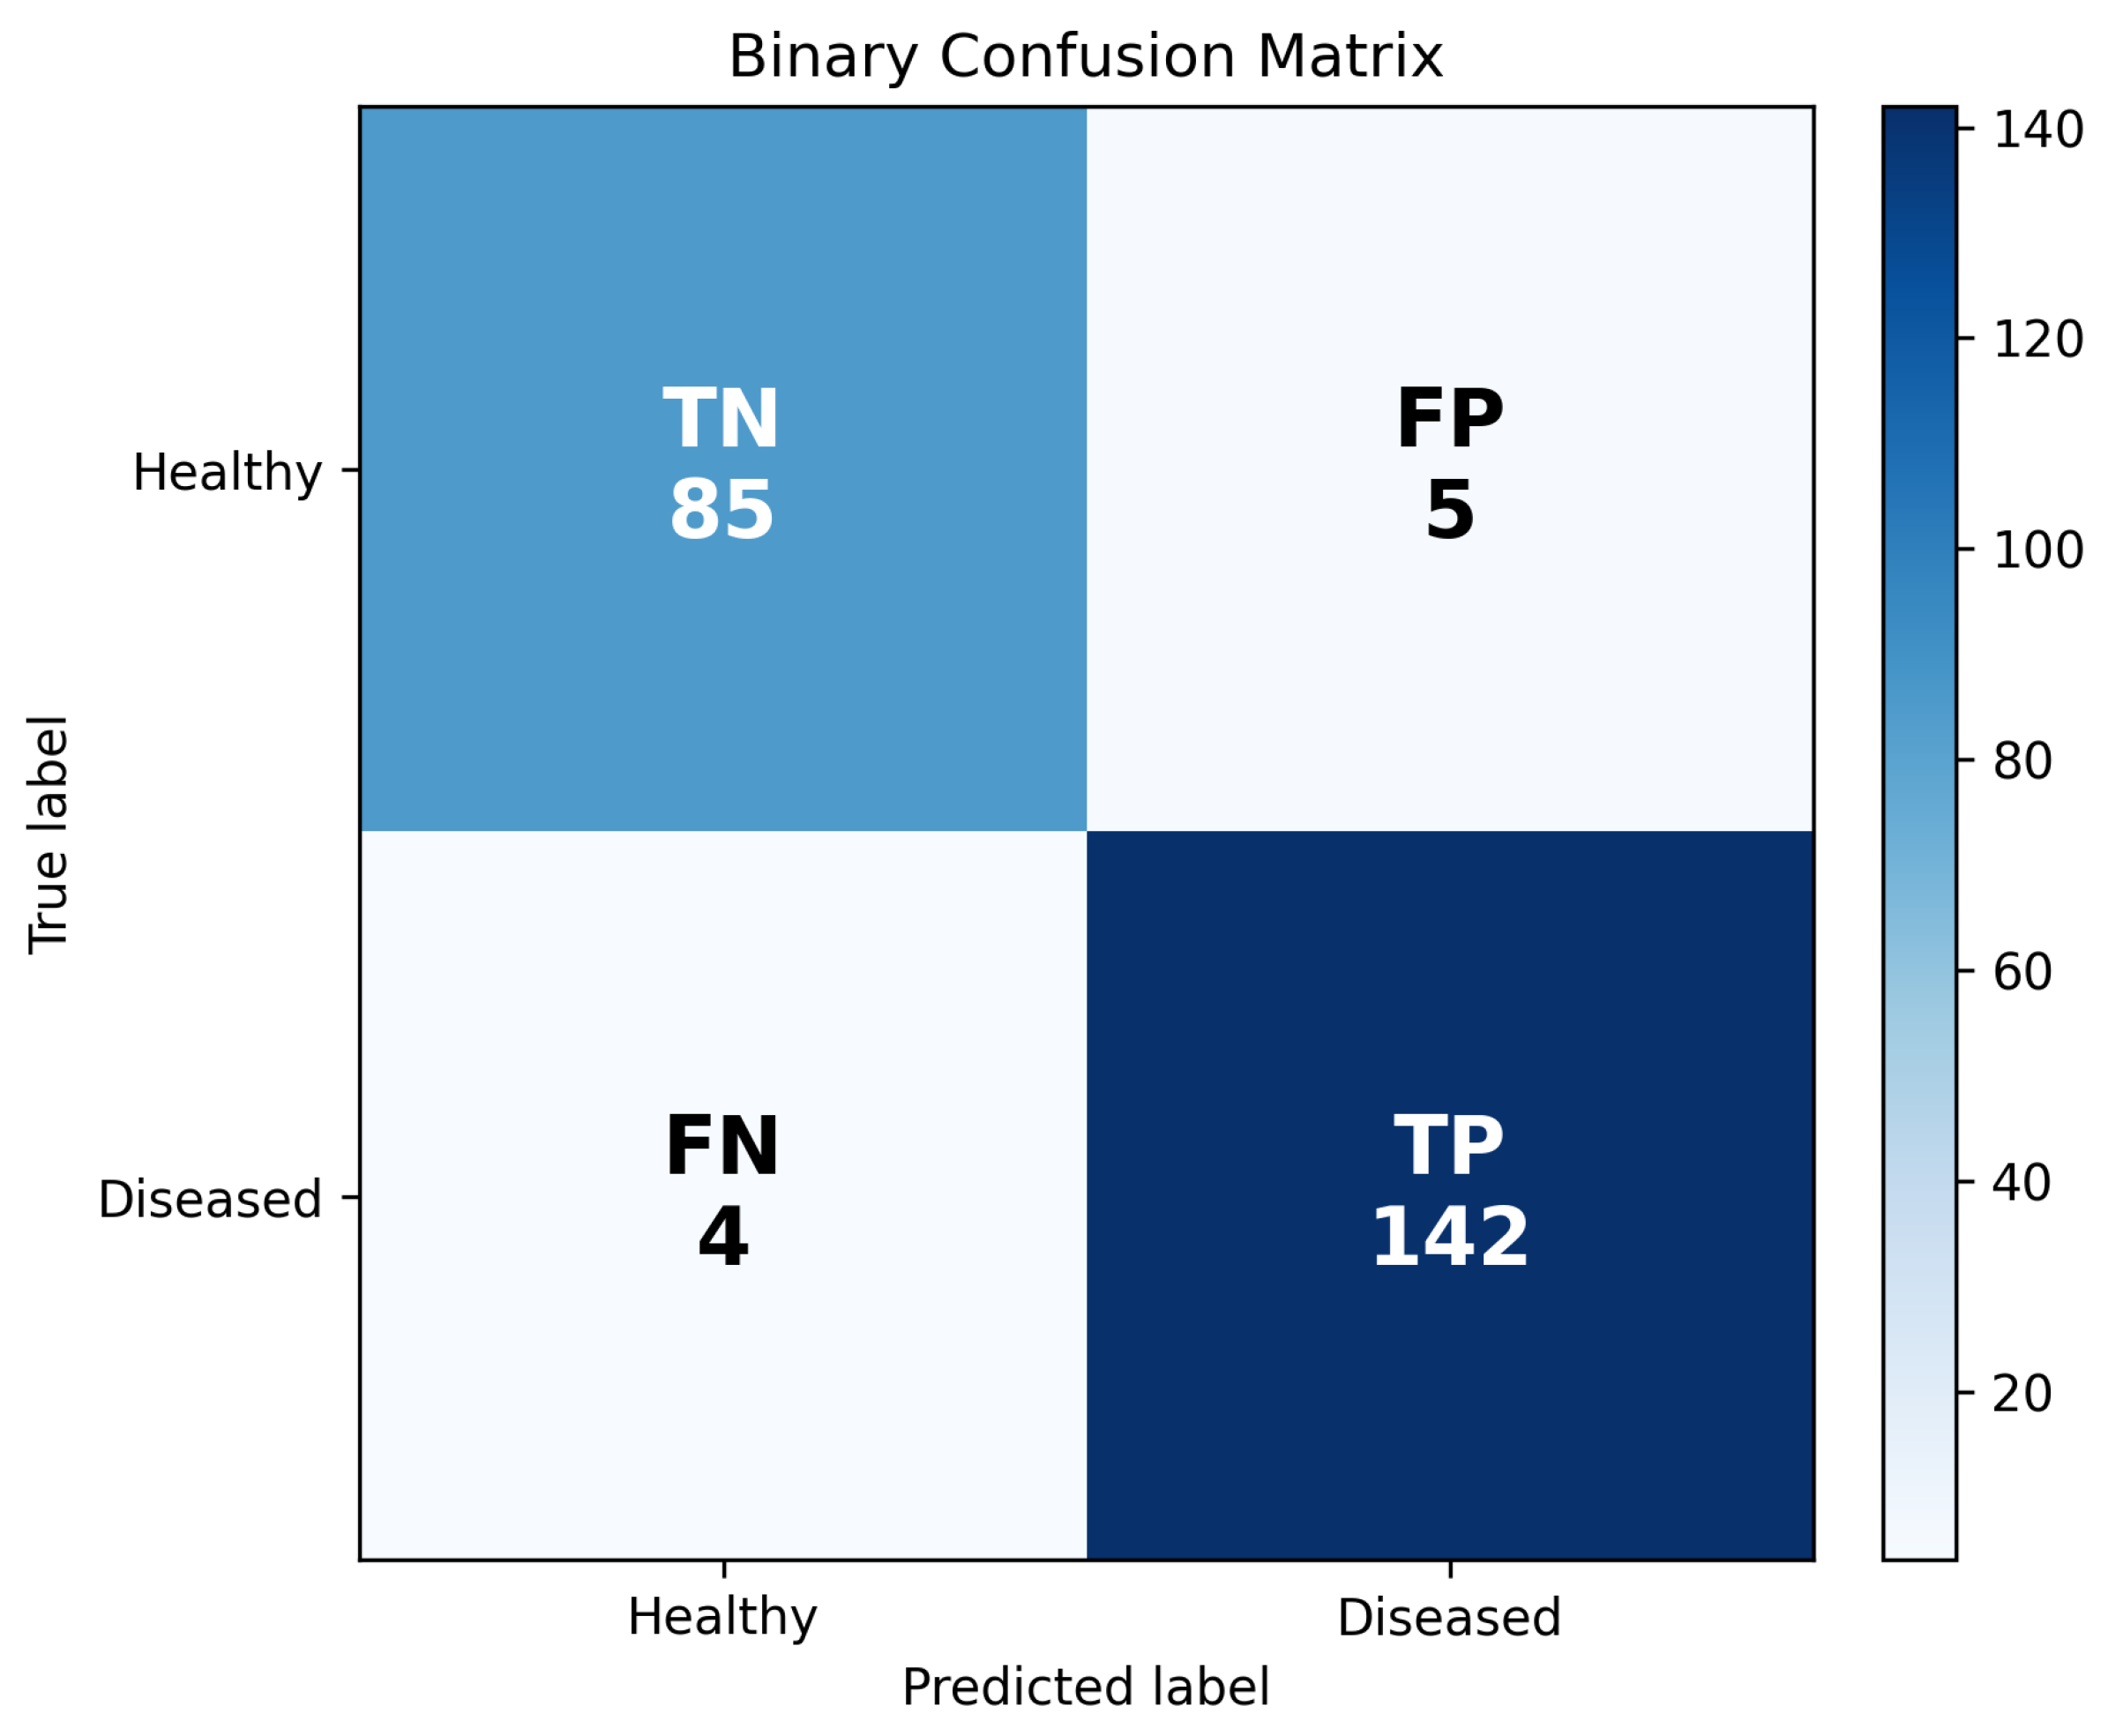
In addition, we construct a binary confusion matrix, shown in
Figure 10, by grouping all categories into healthy and diseased leaves. The binary confusion matrix further illustrates that the model is more reliable at the healthy/diseased level than at the category level. Based on the binary confusion matrix, the model achieved an accuracy of 96.19%, a precision of 96.60%, a recall of 97.26%, and an F1-score of 96.93% for healthy/diseased classification. These results indicate that FAF-Net has a strong ability to distinguish the overall health status of leaves. The result supports the motivation for introducing the auxiliary binary supervision branch.
5. Discussion
The experimental results show that FAF-Net improves plant disease classification on the natural-scene PlantDoc dataset. On the PlantDoc test set, FAF-Net achieved an accuracy of 74.58%, outperforming the EfficientNet-B3 baseline by 5.09 percentage points. More importantly, the ablation results indicate that the performance gain was not produced by a single component, but by the complementary effects of data augmentation, frequency-domain feature learning, and auxiliary supervision.
Compared with lesion-level localization and segmentation-assisted approaches, FAF-Net works under a lower-annotation setting. Methods such as PlantSeg [
30], PDSNets [
31], and lesion segmentation and recognition networks [
32] use pixel-level masks, disease-spot segmentation, or severity-related annotations to guide the model toward diseased regions. This supervision is effective for lesion localization and severity estimation, but it requires additional manual annotation. FAF-Net uses complete natural-scene images and image-level category labels only. Under this setting, the accuracy increased from 69.49% with EfficientNet-B3 to 74.58% with FAF-Net, indicating that useful disease-related cues can still be strengthened without lesion-level labels. The remaining errors in the confusion matrix also reflect the limitations of this setting. Small lesions, complex background textures, and visually similar symptoms remain difficult to separate without explicit lesion-region supervision.
The frequency branch provides another explanation for the observed improvement. Recent frequency-aware models, including DWTFormer [
21], FA-Unet [
22], WaveLiteNet [
23], and WGA-YOLO [
24], have shown that frequency information is useful for representing lesion boundaries and texture details. In FAF-Net, this idea is implemented as a compact FFT-based branch rather than a large additional backbone. The branch extracts frequency-domain texture information from the Fourier magnitude spectrum and fuses it with EfficientNet-B3 spatial features. The ablation results show that adding the FFT branch after CutMix further improved the classification accuracy, suggesting that frequency-domain cues can complement spatial features when symptoms are small, blurred, or mixed with background patterns. This result supports the use of lightweight frequency complementation for natural-scene image-level disease classification.
The auxiliary supervision branch provides an additional explanation for the improvement from the perspective of training supervision. Existing multi-label or multi-task methods, such as the framework proposed by Yang et al. [
26] and the multi-task system developed by Keceli et al. [
27], often introduce parallel targets such as plant type, species identity, disease category, or disease severity. These targets enrich the diagnostic output, but they usually require additional labels or a more complex prediction structure. In FAF-Net, the auxiliary task is generated from the original PlantDoc category labels by grouping the classes into healthy and diseased leaves. The main classifier learns the 27-category classification task, while the auxiliary classifier provides coarse-grained disease-status supervision during training. The binary confusion matrix shows much higher performance at the healthy/diseased level than at the 27-category level, suggesting that disease-status information is a stable supervisory signal for this dataset. This label-derived auxiliary task helps guide the shared representation toward disease-relevant features without increasing the annotation burden.
Our confusion matrix provides a more detailed view of where the model succeeds and where it still fails. Most predictions are concentrated along the diagonal, indicating that FAF-Net can correctly classify a large proportion of PlantDoc images. However, the remaining errors are mainly concentrated among visually similar disease categories and morphologically similar healthy categories.
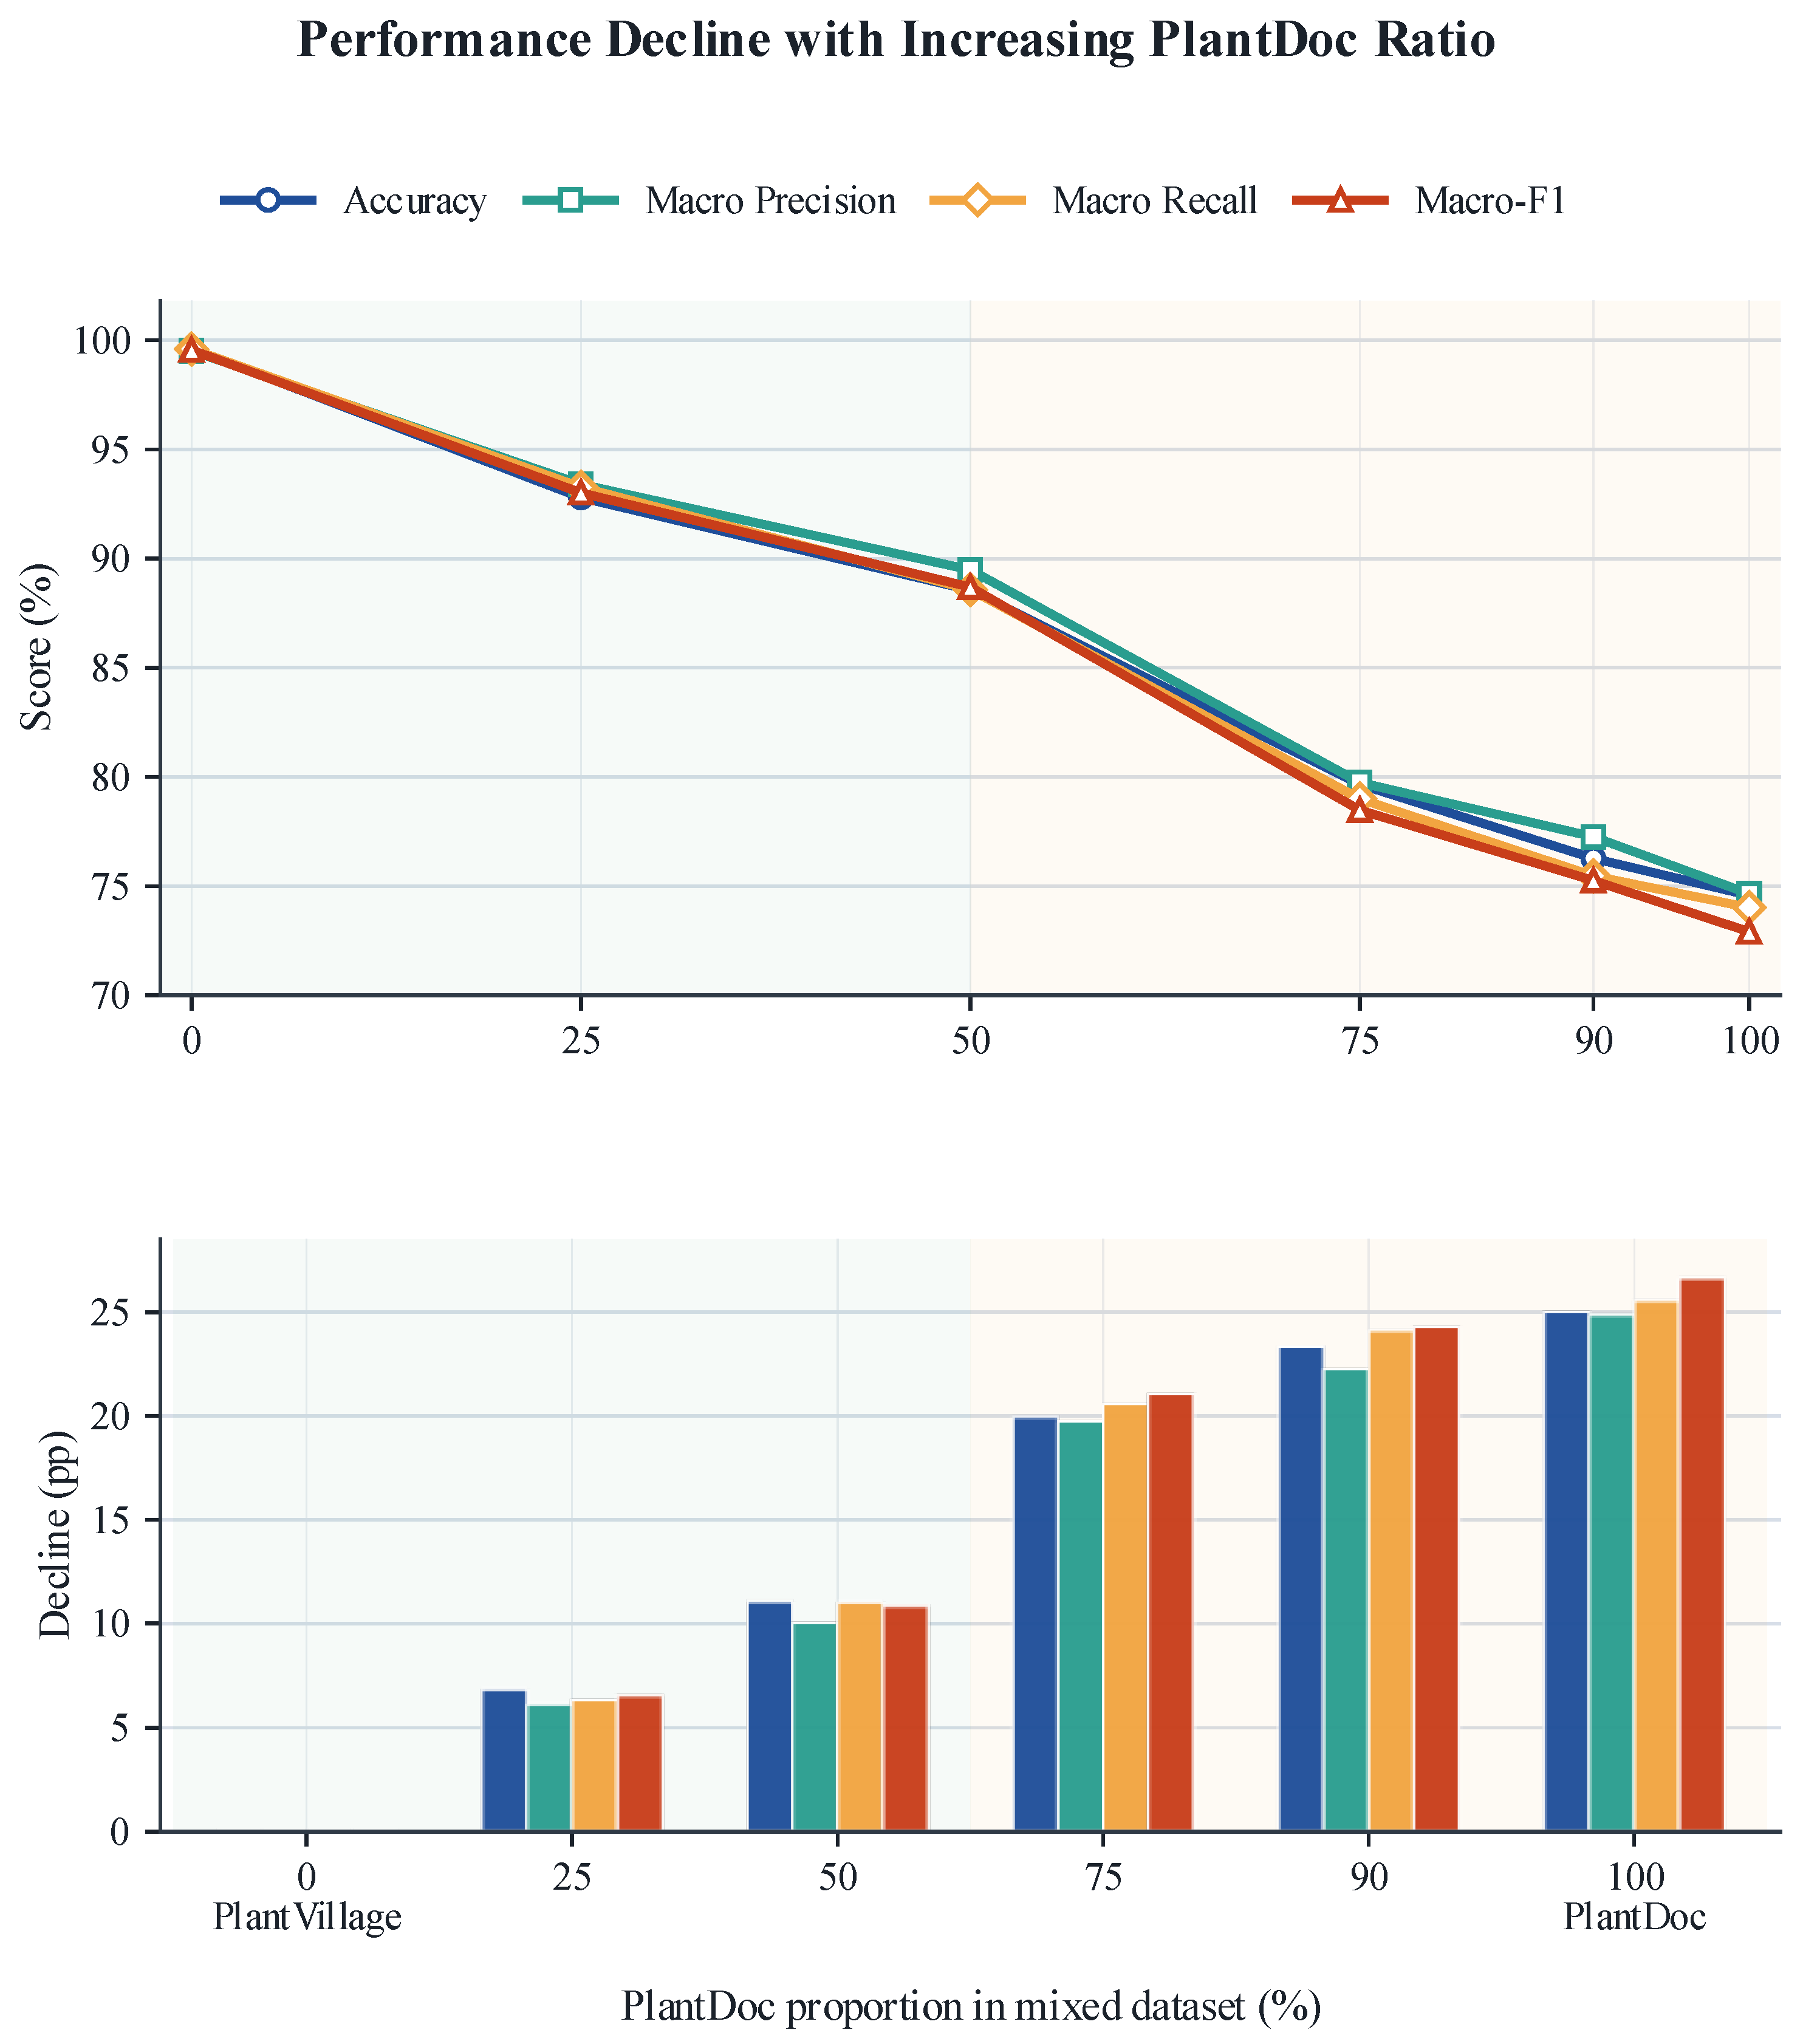
The mixed-dataset experiment further extends the analysis from class-level errors to dataset-level effects. To further analyze the influence caused by datasets, we mixed the PlantDoc and PlantVillage datasets with certain ratios, since PlantDoc and PlantVillage contain partially overlapping crop and disease categories, but they differ substantially in image acquisition conditions and scene complexity. We applied the proposed FAF-Net to train models on datasets with different PlantDoc/PlantVillage ratios, comparing their performance. As shown in
Figure 11, as the proportion of PlantDoc increases, the model performance continuously drops.
Specifically, when the PlantDoc dataset proportion is 25%, the model achieved an accuracy of 92.80%. When the ratio of PlantDoc increased to 90%, the accuracy decreased to 76.27%. The lower panel further shows that the absolute performance decline becomes larger when the dataset shifts from a PlantVillage-dominant setting to a PlantDoc-dominant setting. Because all four metrics follow the same downward trend, the decline is unlikely to be a random fluctuation of a single evaluation index.
PlantDoc mainly consists of natural-scene or web-collected images with complex backgrounds, non-uniform illumination, multiple-leaf occlusion, scale variations, different shooting angles, and unstable image quality. PlantDoc also has a relatively small sample size and an imbalanced class distribution, with some categories containing very limited numbers of samples. Under this condition, it is difficult for the model to learn stable fine-grained disease representations for small-sample categories.
In addition, manual inspection shows that some PlantDoc images contain unclear leaf regions, small lesion areas, ambiguous class boundaries, or visually similar symptoms. These issues further increase confusion among fine-grained disease categories, especially among classes with similar symptoms, such as blight, spot, rust, and scab. Therefore, the results in
Figure 11 indicate that FAF-Net can alleviate the difficulty of natural-scene classification to some extent, but it cannot completely solve the performance degradation caused by domain shift, background interference, and inter-class similarity.
Several limitations remain in this study. First, the experiments are mainly based on the public PlantDoc dataset, which has a limited sample size and an imbalanced class distribution; therefore, the current results are not sufficient to support strong claims about broad generalization across diverse field environments. Second, the current model uses only image-level labels and does not explicitly localize lesion regions, so background textures, leaf morphology, and imaging conditions may still interfere with classification results. Third, although the FFT-based branch enhances texture representation, it operates on the frequency spectrum of the whole image. As a result, high-frequency responses may also be produced by background elements such as branches, soil, shadow edges, or weed textures. These observations explain why FAF-Net improves PlantDoc classification performance but cannot completely overcome the degradation caused by domain shift, background interference, class imbalance, and inter-class similarity.
Future work can be conducted from both the data and model perspectives. From the data perspective, more field-collected and carefully annotated natural-scene disease images are needed to evaluate the model under realistic agricultural conditions. Diseased leaves from PlantVillage can be pasted onto natural backgrounds to build a larger, more balanced and realistic extended dataset. From the model perspective, leaf segmentation, weakly supervised lesion localization, or lesion-aware attention mechanisms could be introduced to reduce background interference and enhance lesion-region representation. Future studies should evaluate FAF-Net on additional field-collected datasets and independent test sets to more comprehensively assess its stability and generalization ability under diverse natural-scene conditions.
Overall, the mixed-dataset experiment and confusion matrix analysis indicate that the natural-scene complexity and data-quality issues of PlantDoc are important factors limiting further performance improvement. FAF-Net improves classification performance on PlantDoc without relying on lesion-level annotations, but higher-quality datasets and stronger modeling methods are still needed to further improve the reliability of natural-scene plant disease recognition.
6. Conclusions
This study proposed FAF-Net, a frequency-aware fusion network with auxiliary supervision for plant disease classification in natural scenes. The proposed framework uses EfficientNet-B3 as the RGB spatial backbone, integrates an FFT-based frequency branch through learnable weighted fusion, and introduces a healthy/diseased auxiliary supervision task during training. CutMix augmentation was further adopted to improve the robustness of the model against localized symptoms and background interference.
Experiments on the PlantDoc dataset demonstrated that FAF-Net improved the classification performance compared with the EfficientNet-B3 baseline. The classification accuracy increased from 69.49% to 74.58%, and the macro-F1 score increased from 68.18% to 72.91%. Ablation experiments showed that CutMix augmentation, frequency-domain feature fusion, and auxiliary supervision provided complementary improvements. In addition, the healthy/diseased analysis indicated that the model could capture coarse-grained disease-status information more reliably than fine-grained disease categories.
These results suggest that frequency-aware feature fusion and coarse-grained auxiliary supervision are useful for improving classification on the PlantDoc natural-scene benchmark. Nevertheless, fine-grained recognition on PlantDoc remains challenging because of limited sample size, class imbalance, complex backgrounds, and visual similarity among disease categories. Future work will focus on larger field-collected datasets, lesion-aware localization or segmentation, and cross-dataset validation to further improve the robustness and generalization ability of natural-scene plant disease recognition models.