1. Introduction
Fungal systematics is a holistic taxonomic process that goes beyond merely naming macrofungi based on their external appearance; rather, it necessitates the combined evaluation of field observations, macroscopic morphology, micromorphological characteristics, ecological relationships, host/substrate information, herbarium material, and, when necessary, molecular data [
1,
2]. In macrofungi, macroscopic characteristics such as the cap, gills, stem, surface structure, colour variations and ecological habitats are important for initial differentiation. However, these characteristics often overlap or vary depending on environmental conditions within closely related genera and species groups [
1,
3]. In the field of Basidiomycota systematics, micromorphological characters such as spore size, spore shape, wall thickness, pigmentation, surface ornamentation, apical structure, germ pore, perispore presence/absence, and chemical reactions are recognised as fundamental diagnostic data sources [
2,
4,
5]. In agaricoid macrofungi, basidiospores are among the most frequently observed and relatively stable micromorphological structures in genus-level differentiation. However, it should be noted that the presence of spore characters alone does not guarantee the resolution of all taxonomic problems. In the differentiation of species and species complexes, additional micromorphological characters, chemical reactions, and molecular verification are often required [
6,
7].
The genera
Inocybe,
Hebeloma,
Amanita,
Agaricus, and
Russula are groups of macrofungi that require careful taxonomic evaluation due to their high species diversity and partially overlapping micromorphological characteristics [
2,
8,
9]. In these genera, the shape, colour tone, wall structure and ornamentation characteristics of basidiospores provide important clues for genus-level differentiation. For instance, some
Hebeloma spores with weak warts and indistinct perispores may superficially resemble
Inocybe spores under a light microscope;
Amanita and
Russula spores may show similar optical colour tones under certain preparation conditions. Consequently, the evaluation of spores should be based on the interpretation of multiple micromorphological indicators in conjunction [
4,
5].
In conventional fungal identification, Melzer’s reagent, Congo Red, and analogous stains or reagents can provide important Supplementary Information in particular taxonomic groups [
4,
5]. However, the interpretation of these methods depends on expert experience, and in some cases, micromorphological characters alone are known to be insufficient for definitive identification. Consequently, in contemporary fungal systematics, morphological assessments are frequently corroborated by molecular verification methods.
In recent years, molecular approaches such as ITS-based DNA barcoding have led to significant advances in the accuracy of fungal identification. The ITS region is widely accepted as a standard barcode marker for fungi and provides robust support, particularly in the context of species-level identifications [
6,
10]. However, molecular methods require specialised laboratory infrastructure, appropriate reference databases, and additional costs. Consequently, morphological and image-based approaches continue to be of significant importance in numerous applications.
Advancements in imaging technologies have facilitated the capture of microscopic characters, including spores, cystidial structures, and hyphal elements, with sub-millimetre resolution. Complementary techniques, including Raman spectroscopy, have further demonstrated the presence of biochemical components in fungal spores that possess diagnostic value, such as lipids, proteins, and polysaccharides [
11,
12]. Nevertheless, these techniques are not yet a standard component of routine taxonomic workflows.
Although microscopic imaging, chemical reactions and molecular validation methods [
13] are important in the study of fungal systematics, the interpretation of the obtained data still relies heavily on expert experience. This has given rise to an increased interest in image-based automated decision support systems. Concurrent with these advancements, artificial intelligence, and more specifically, deep learning methodologies, have emerged as powerful tools within the domain of biological image analysis and automated classification. Convolutional neural networks and transformer-based models have been shown to be capable of learning complex texture, contour and colour patterns in images without the need for manual feature extraction. Several studies have shown that microscopic spore or hyphal images, as well as macroscopic fungal photographs, can be classified using deep learning models. However, the number of studies that compare multiple macrofungal genera in a controlled manner via basidiospore micrographs remains limited.
The objective of this study is not to develop a system to replace species-level definitive identification or molecular taxonomy, but rather to investigate whether basidiospores, one of the fundamental micromorphological characters in macrofungal classification, can be automatically recognised from standard light microscopy images. In this context, deep learning-based models were evaluated on basidiospore micrographs of different macrofungal genera, and the potential for automatic pre-classification at the genus level from controlled microscopic images was examined.
This study evaluates the performance of deep learning-based genus-level classification on basidiospore micrographs of five selected macrofungal genera. It does not aim to propose a species identification system to replace the classical taxonomic identification process. Rather, it is designed as an experimental preliminary study investigating the extent to which spore characters carry distinctive information for automatic image classification under controlled microscopy conditions.
The primary contributions of this study can be outlined as follows:
A curated image dataset was created, consisting of basidiospore micrographs of five selected macrofungal genera. This dataset has been added to the existing literature, with the aim of facilitating its use in the context of deep learning-based classification studies.
A comprehensive comparison of various CNN and Transformer-based deep learning architectures, including ResNet18, DenseNet121, InceptionV3, MobileNetV2, EfficientNetB0, VGG16, ViT-B/16, and ViT-Tiny, was conducted under a specimen-based 3-fold Stratified Group K-Fold validation strategy.
A data splitting approach founded upon biological specimens was applied with a view to preventing data leakage at the image level. Furthermore, models were evaluated on a series of biological specimens that had not been previously encountered.
A hybrid architecture was developed, combining CNN-based local feature learning with Vision Transformer-based global context learning. This architecture, designated as InceptionV3 + ViT-B16, was investigated for its effectiveness in classifying microscopic fungal spores.
A novel bottleneck-based feature fusion mechanism was proposed to integrate features generated by InceptionV3 and ViT-B16. This enables the combination of hybrid representations into a more compact and distinctive feature space.
A comprehensive ablation study was conducted to compare the basic InceptionV3 model and the InceptionV3 + ViT-B16, InceptionV3 + ViT-B16 + Fusion, InceptionV3 + ViT-B16 + Attention, and InceptionV3 + ViT-B16 + Fusion + Attention architectures.
The findings of the ablation analyses demonstrated that the primary source of enhanced performance was not attributable to the incorporation of the Vision Transformer component. Instead, the integration of CNN and Transformer features through the implementation of a suitable fusion strategy emerged as the predominant factor contributing to the observed improvements in performance.
The proposed InceptionV3 + ViT-B16 + Bottleneck Fusion model was subjected to a comprehensive evaluation, using a range of performance metrics. These metrics encompassed accuracy, precision, recall, F1-score, Matthews Correlation Coefficient (MCC), ROC-AUC, and PR-AUC. The evaluation process also involved the analysis of confusion matrices, ROC curves, precision–recall curves, and a range of statistical analyses.
The results showed that local morphological features learned by InceptionV3 and global contextual representations learned by Vision Transformer could be effectively integrated through a bottleneck-based fusion mechanism, and that this approach could provide high classification performance on the evaluated dataset.
3. Materials and Methods
3.1. Methodology
The present study proposes a stepwise deep learning approach for classifying fungal spores from microscopic images. The dataset consists of basidiospore micrographs from five different macrofungal genera:
Agaricus,
Amanita,
Hebeloma,
Inocybe, and
Russula. Each image has been assigned a label indicating its fungal genus. The study was conducted using a three-stage, ablation-based experimental design to systematically demonstrate the contribution of the proposed model (
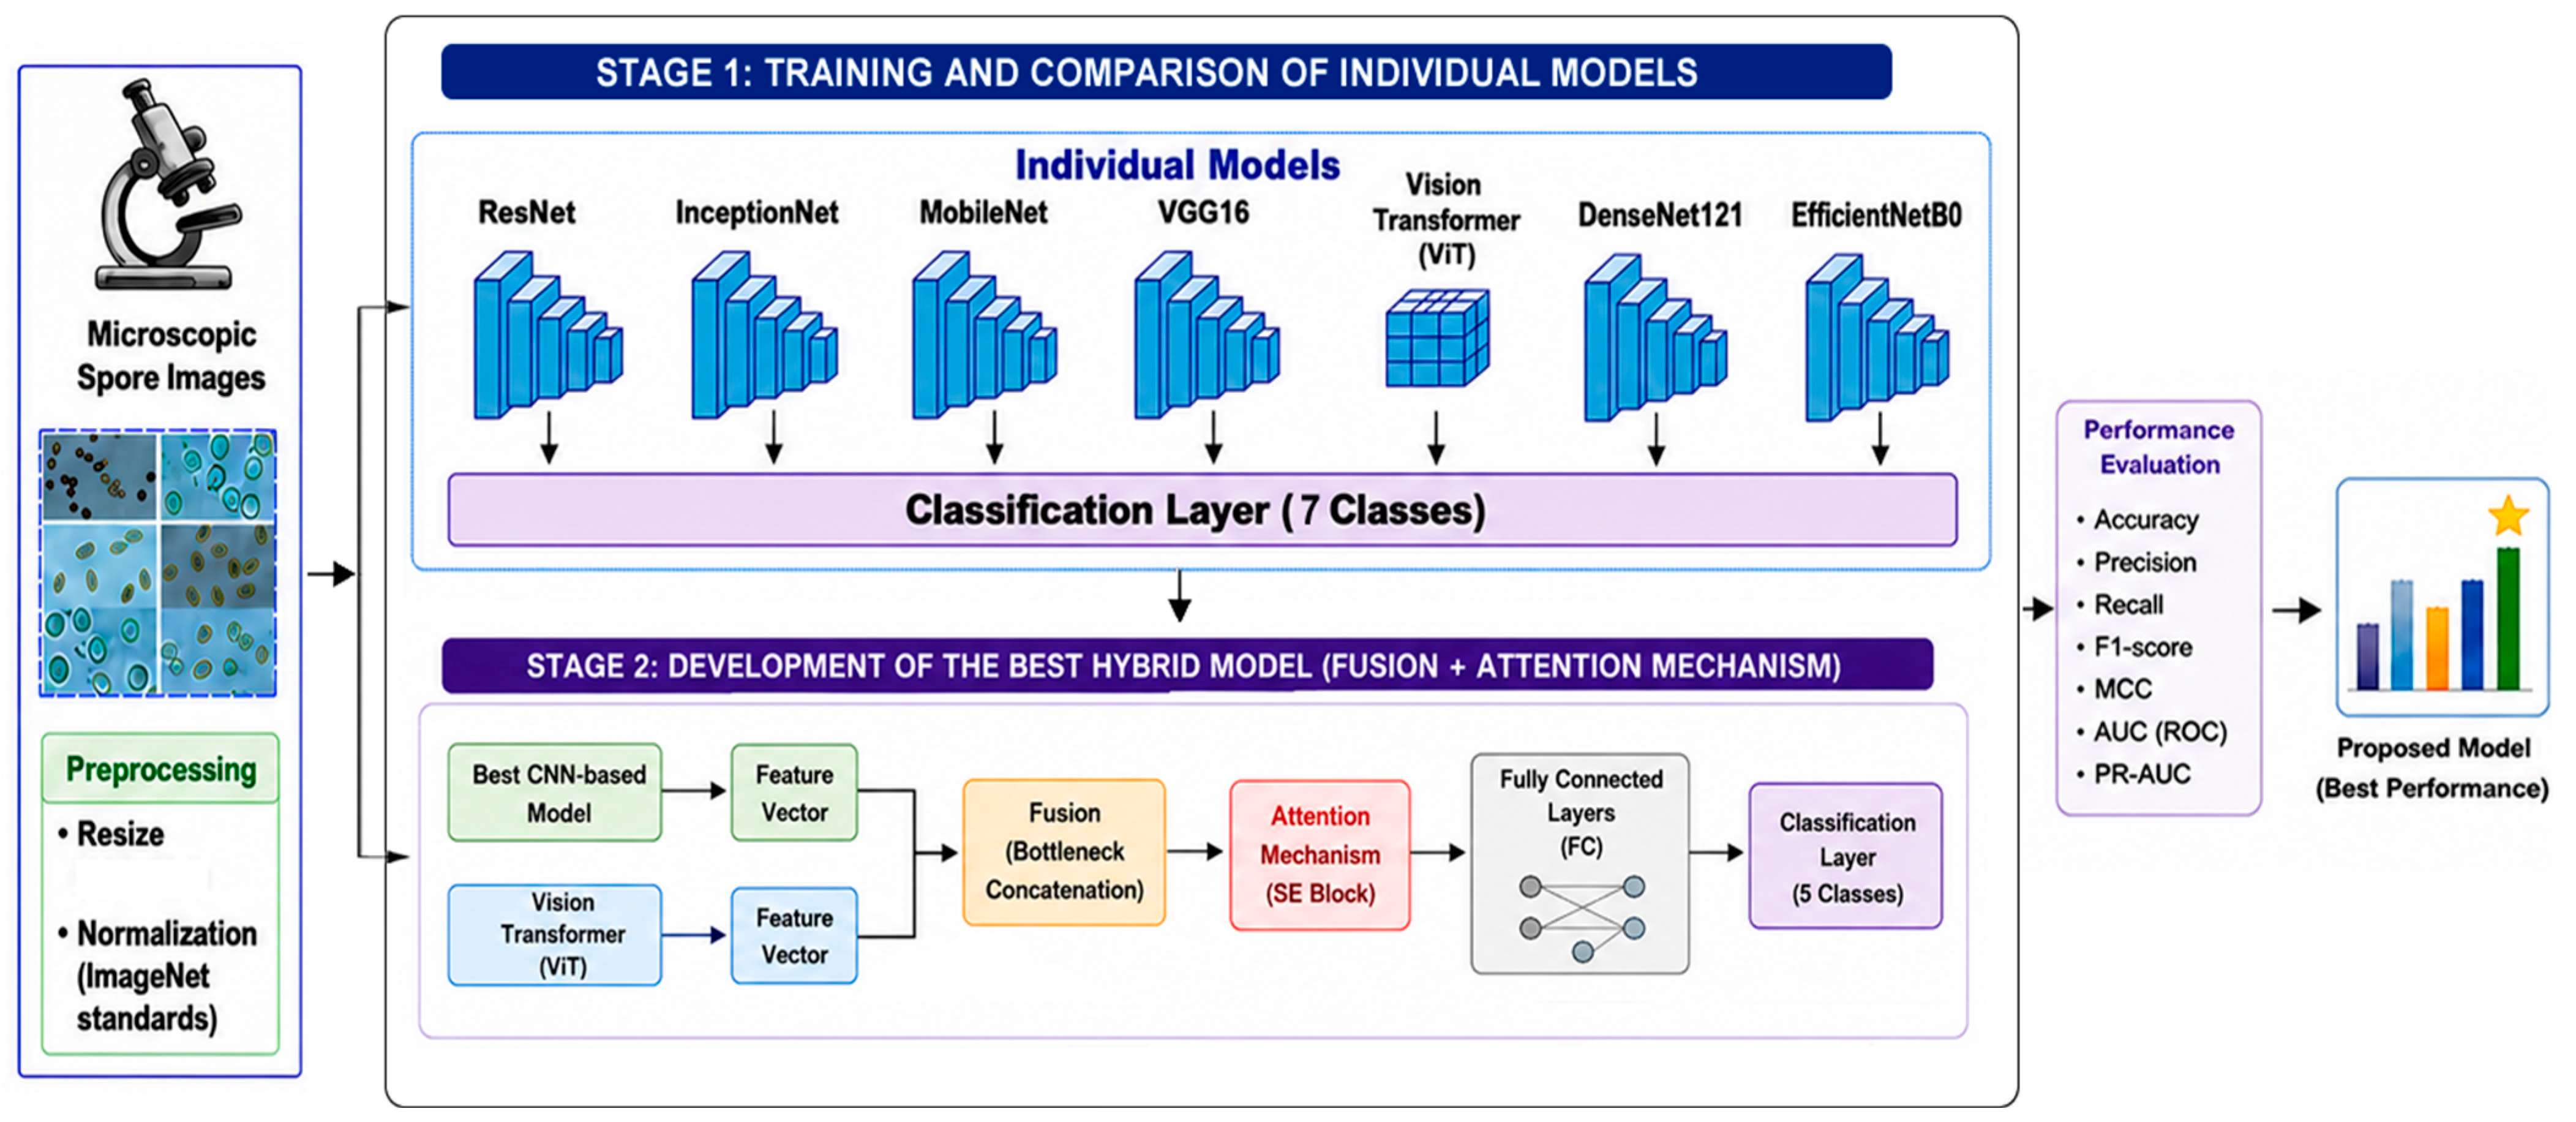
Figure 1). The architectural framework comprises three complementary main stages: data preprocessing and basic model evaluation, hybrid model development, and final validation. This structure enabled the hybrid model to be developed stepwise rather than directly. First, the performance of different deep learning architectures was compared; then, the hybrid architecture was developed using the most successful components. Finally, comprehensive performance analyses were conducted.
In the initial phase, a range of deep learning architectures were independently trained and evaluated. In this context, ResNet18, InceptionV3, MobileNetV2, VGG16, DenseNet121, EfficientNetB0, Vision Transformer (ViT-B/16), and ViT-Tiny models were used. The objective of the selection process was to evaluate the performance of both convolutional neural networks and Transformer-based approaches for classifying macrofungal spores under controlled experimental conditions. While CNN-based models are effective at learning local morphological patterns, Transformer-based models are advantageous for modelling global contextual relationships. Comparing different architectural paradigms is important for determining the most suitable structures for the hybrid model development phase.
As demonstrated in
Figure 1, all images were initially subjected to data preprocessing. At this stage of the process, the images were resized and the pixel values were normalised in accordance with the standards established by ImageNet. This produced a standardised input structure for diverse models, thereby enhancing the stability of the training process. In order to prevent leakage of images from the same sample between the training and validation sets during model evaluations, a specimen-based Stratified Group K-Fold cross-validation (k = 3) strategy was applied. This approach prevented the distribution of images of the same biological sample across different folds, thus enabling the evaluation of the models’ true generalisation performance on previously unseen biological samples.
All models were trained for a maximum of 30 epochs, but an early stopping mechanism was used to prevent overfitting and maintain optimal validation performance. The training process was automatically terminated if no improvement in validation performance was observed within the specified time. Consequently, none of the models reached 30 epochs in all experiments, and the training processes were completed earlier depending on the validation performance. Furthermore, all models were trained under the same data splitting strategy, the same preprocessing steps, and the same evaluation metrics to ensure fair and consistent comparison. The performance results obtained at the conclusion of the initial phase were evaluated using a range of metrics, including accuracy, precision, sensitivity, F1 score, MCC, ROC-AUC, and PR-AUC. This process enabled the identification of the most successful CNN-based model to be used in the hybrid architecture.
In the subsequent phase, the CNN-based model that had achieved the highest performance in the initial stage was selected, and a hybrid structure was developed by integrating a Vision Transformer. In this study, the InceptionV3 model was determined to be the most successful CNN backbone and was used as the core component of the hybrid structure. The ViT-B/16 model was selected for the Transformer arm. ViT-B/16 is a Transformer architecture that has been extensively used and has demonstrated notable efficacy in the evaluation of global self-attention representations in microscopic image classification tasks. Furthermore, the ViT-Tiny model was included in baseline comparisons in order to determine the impact of model size and Transformer capacity on performance. In the hybrid architecture, the CNN and Transformer arms operate in parallel. The InceptionV3 arm is capable of learning fine morphological features, including spore contour, spore wall structure, surface ornamentation, and local texture patterns. Conversely, the ViT-B/16 arm models broader spatial relationships and global structural patterns by considering the entire image. While CNN-based models have been shown to be successful in learning local morphological details, they are limited in their ability to represent long-range spatial relationships across the entire image. In contrast, Vision Transformer architectures have been demonstrated to be capable of effectively modelling global structural patterns and relationships between distant regions. However, it has been observed that these architectures may not always demonstrate the same level of accuracy in representing fine local details. The proposed hybrid structure aims to leverage the complementary advantages of both CNN and ViT architectures by using both representations together. Thus, the local information acquired by the CNN and the global information obtained by the Transformer are evaluated within a unified decision-making mechanism. This process generates a more distinctive feature representation.
The feature vectors from both models were transformed into a common representation space before direct combination. These features were then combined using a bottleneck-based fusion mechanism. The primary objective of this approach is to transform high-dimensional features from multiple sources into a more compact and informative representation. The fusion layer also assists in preserving distinctive features used in the classification process by reducing redundant information.
The Squeeze-and-Excitation (SE) attention mechanism was applied to the combined feature representation obtained after fusion. The SE module has been shown to create channel-based attention weights, thereby increasing the influence of features that are more important for classification and decreasing the contribution of less informative features [
24]. The objective of the model is to emphasise more distinctive morphological patterns in the decision-making process. The attention-weighted features were transferred to fully connected layers, and the final classification process was performed.
The third stage of the research process involves the comprehensive validation and interpretation of the developed hybrid model. At this stage of the research, the performance of the model was evaluated on an independent holdout test set. This was followed by a detailed examination of the model’s performance using various experimental analyses. The performance of the system was evaluated using a range of metrics, including accuracy, precision, recall, F1 score, Matthews correlation coefficient (MCC), area under the ROC curve (AUC), and area under the precision-recall curve (PR-AUC). Furthermore, a confusion matrix, a normalised confusion matrix, ROC curves, precision-recall curves, and training-validation accuracy/loss graphs were created. Concurrently, the contributions of the components of the proposed architecture were systematically analysed in the third stage. In order to investigate this, ablation experiments were performed, comparing the basic CNN model, the CNN+ViT structure, the CNN+ViT+Attention structure, and different fusion strategies. Consequently, the architectural components responsible for performance enhancements were examined in detail. In addition, Friedman and Wilcoxon tests were applied as exploratory analyses, and the results were interpreted taking into account the limited statistical power of the specimen-based 3-fold design.
Finally, Grad-CAM-based explainability analyses were performed to make the model’s decision-making process more transparent. These analyses visualised which image regions the model focused on in correctly and incorrectly classified samples, and evaluated the possible morphological reasons for misclassifications. Thus, the proposed architecture was comprehensively analysed not only in terms of performance but also in terms of interpretability and its focus on biologically significant features.
The experimental setup, training parameters, model architectures, and hardware specifications used in this study are outlined in
Table 2. The dataset consists of a total of 1601 microscopic basidiospore images from five different macrofungal genera, and 50 specimens in total, with 10 biological samples for each genus. All images were rescaled to a standard input size and evaluated under the same preprocessing protocol. In order to evaluate the performance of the model in a realistic manner and to prevent data leakage, a 3-fold Stratified Group K-Fold cross-validation strategy was employed at the specimen level. A final performance analysis was then conducted with an independent holdout test set consisting of previously unseen biological samples.
During the training process, all models were subjected to the same optimisation and evaluation conditions. The Adam optimisation algorithm was employed, with an initial learning rate of 1 × 10⁻⁴ and a ReduceLROnPlateau scheduler that dynamically reduces the learning rate depending on validation performance. In order to reduce the problem of overconfidence and increase generalisation ability, a cross-entropy loss function with a label-smoothing coefficient of 0.1 was preferred. Furthermore, a dropout rate of 0.5 was implemented to reduce overfitting.
The proposed hybrid architecture is constructed by combining the InceptionV3 backbone, which learns local morphological patterns, with the ViT-B/16 backbone, which models global contextual relationships. Features from both models are integrated via a feature fusion mechanism and then reweighted using a Squeeze-and-Excitation-based attention mechanism. The InceptionV3 and ViT-B/16 components contain approximately 23.8 million and 86.57 million parameters, respectively, resulting in a total of approximately 110.37 million parameters for the proposed hybrid architecture.
All experiments were performed on a workstation running Windows 11 Pro (Microsoft Corporation, Redmond, WA, USA), equipped with an Intel® Core™ i7-12650H processor (Intel Corporation, Santa Clara, CA, USA), 64 GB DDR4 RAM, and 8 GB GPU memory, using the PyTorch 2.7.1 framework.
In addition to the training configuration summarized in
Table 2, the InceptionV3 and ViT-B/16 backbones used in the hybrid model were initialized with pre-trained weights on ImageNet. The ViT-B/16 model was implemented using the timm library. In the hybrid architecture, the features extracted by InceptionV3 and ViT-B/16 were combined and transferred to the fusion layer and processed before final classification. Dropout was applied in the fusion and classification layers to reduce overfitting. The label smoothing parameter (0.1) was used to reduce overconfident predictions and increase the generalisation ability of the model. A fixed random seed (seed = 42) was used to ensure reproducibility in all experiments. The model that achieved the highest validation accuracy within each fold was selected as the final model and evaluated on an independent holdout test set.
The present study did not involve the application of data augmentation methods. The primary rationale for this approach was to assess the efficacy of the proposed hybrid architecture exclusively on original microscopic basidiospore images, thereby isolating the impact of synthetic transformations on model behaviour. Furthermore, it has been demonstrated that certain data augmentation techniques, such as flipping, intense contrast alterations, and the incorporation of artificial noise, can result in biologically insignificant modifications to spore ornamentation, surface structure, and microscopic characteristics. Nevertheless, the absence of data augmentation methods may have contributed to the overlearning tendency observed during the training process. Consequently, the effects of biologically appropriate data augmentation strategies on generalization performance are planned to be evaluated separately in future studies.
3.2. Dataset
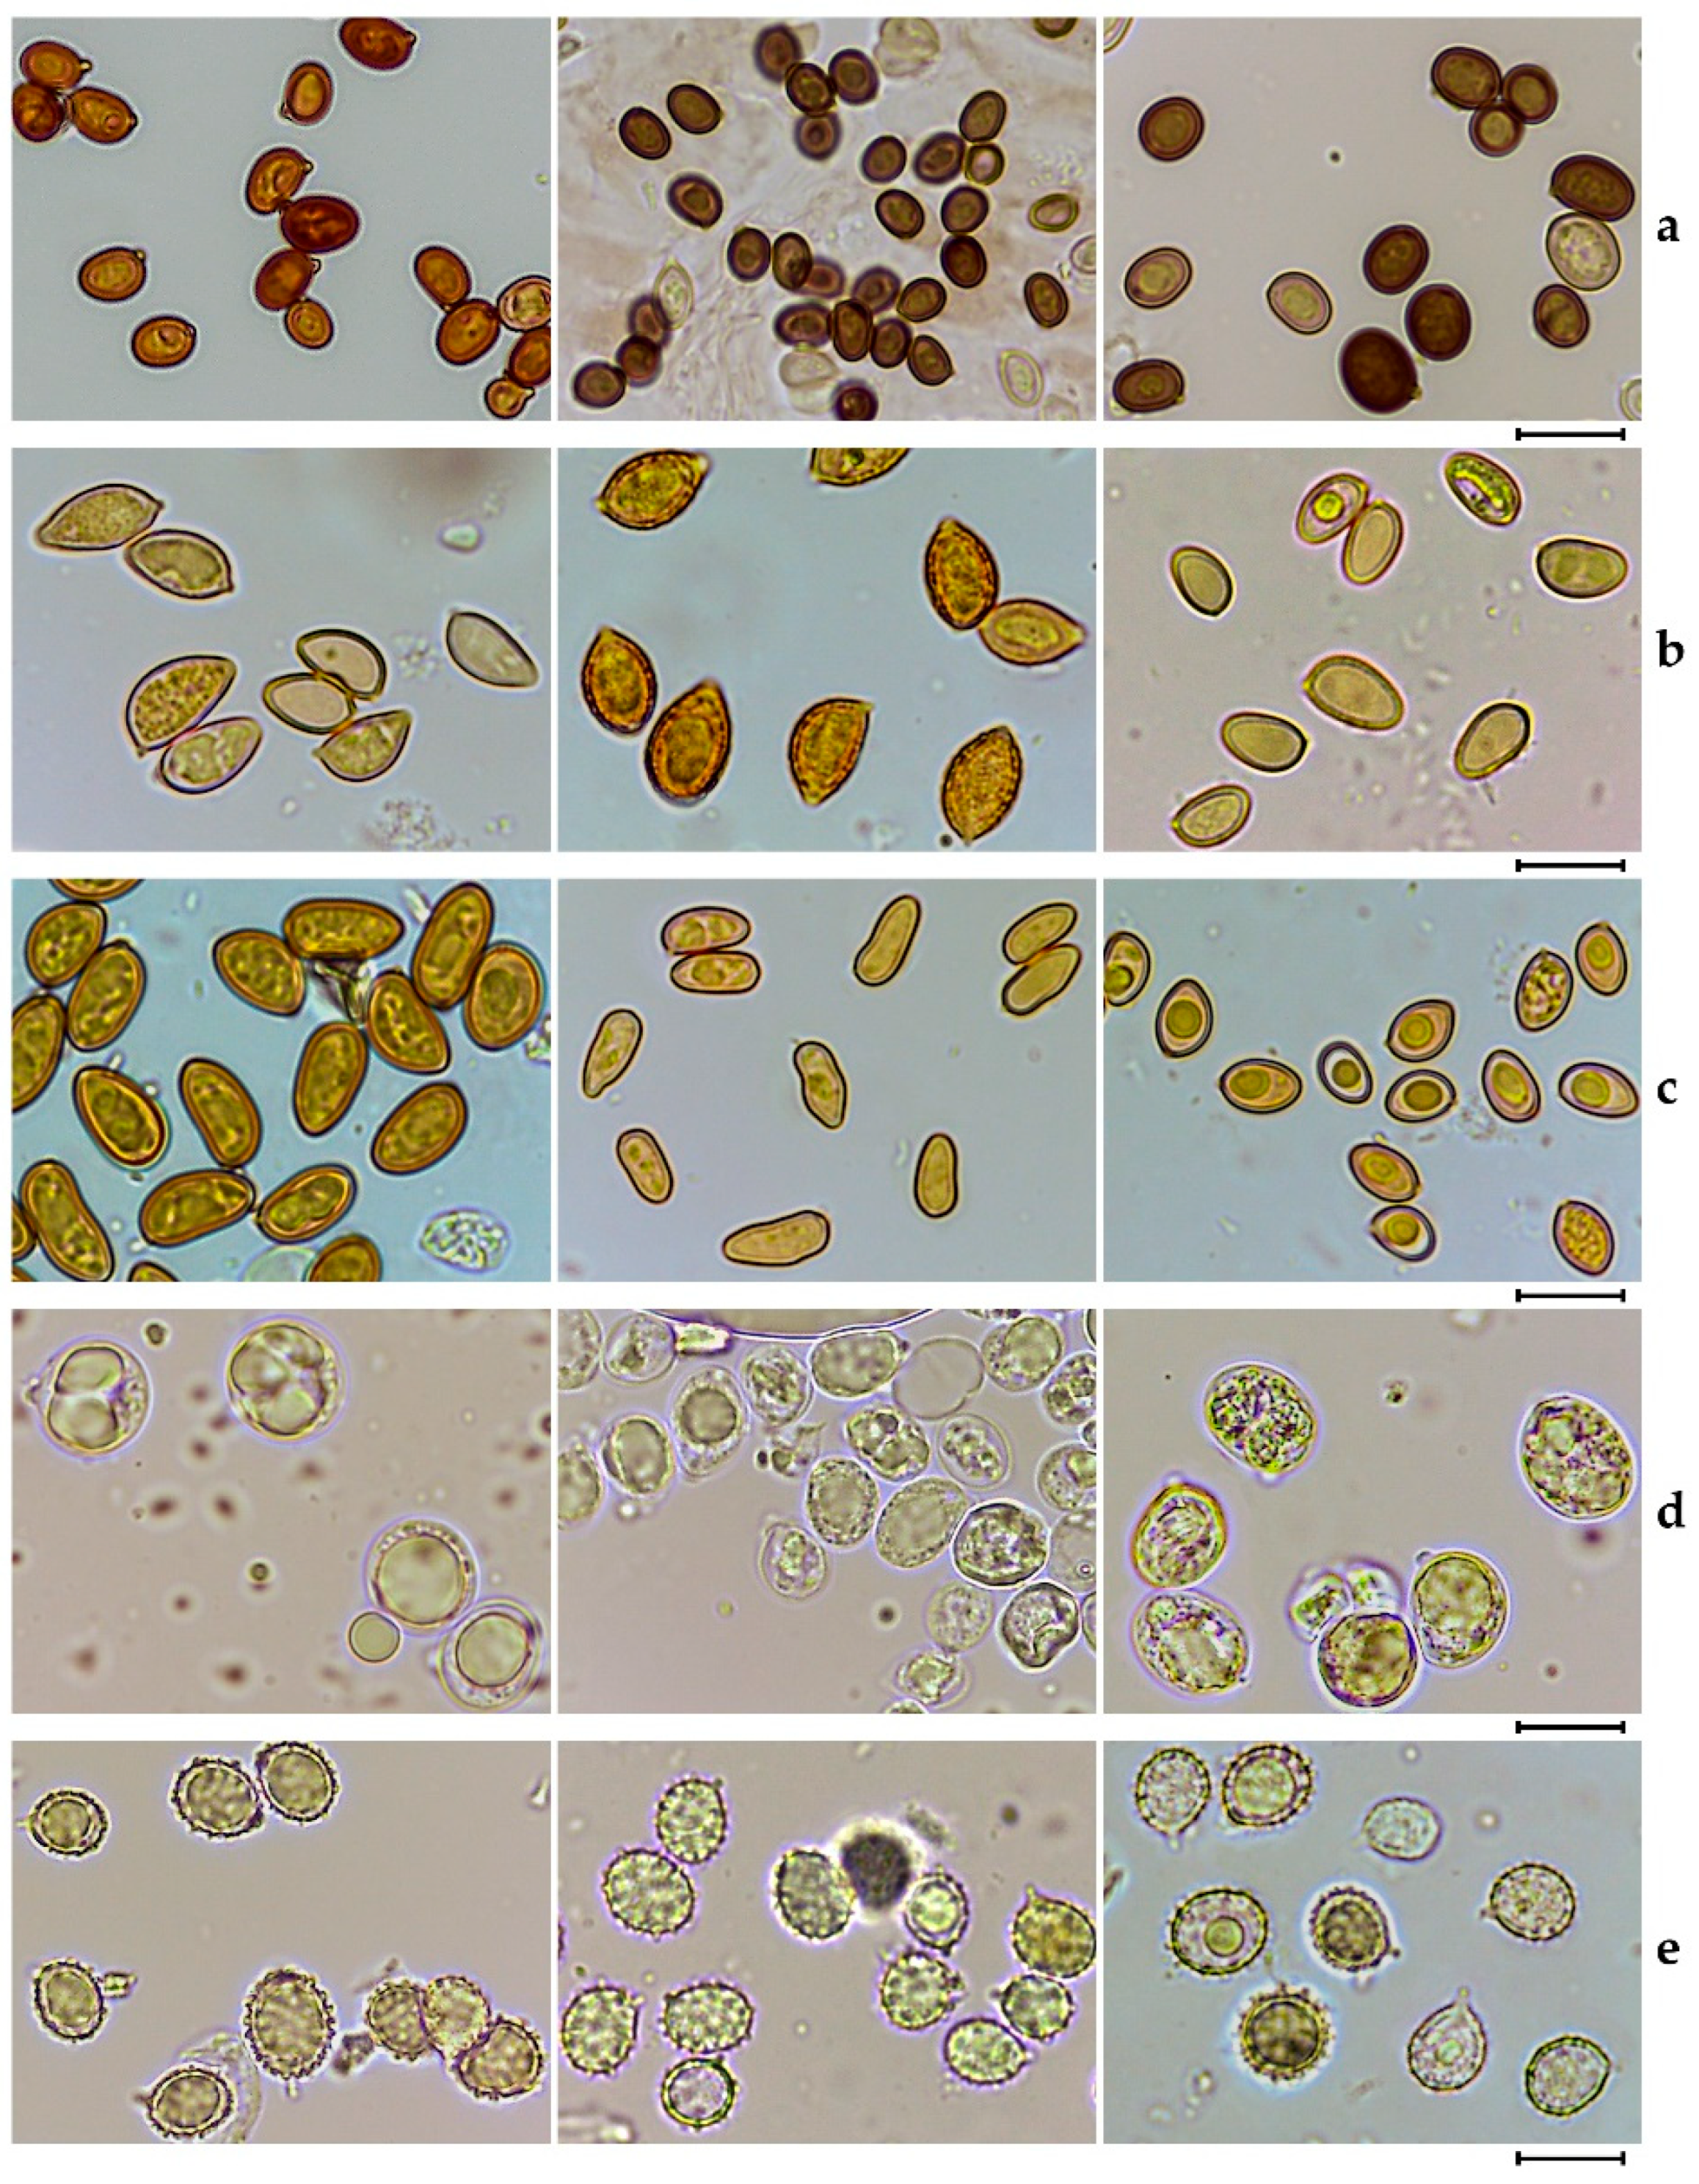
Basidiospore imaging was performed on 50 macrofungus specimens from five different genera, with 10 specimens selected from each genus. Multiple microscopic basidiospore images were obtained from each specimen, and a balanced image dataset was created by genus for subsequent evaluation (see
Figure 2). The distribution of specimens and images by genus is given in
Table 3. Microscopic preparations were made using a 5% potassium hydroxide (KOH; Merck KGaA, Darmstadt, Germany) solution prepared in distilled water as the mounting medium. All microscopic observations and image acquisitions were performed using a Leica DM500 light microscope (Leica Microsystems, Wetzlar, Germany) integrated with a Leica ICC50 HD digital camera (Leica Microsystems, Wetzlar, Germany). The acquisition and management of digital images were facilitated by Leica Application Suite X software (Leica Microsystems, Wetzlar, Germany), version 3.11.1.30653. In order to minimise methodological differences and ensure consistency across the dataset, the same preparation and imaging protocol were applied to all specimens.
The specimens were evaluated at the genus level by two expert mycologists with extensive field and laboratory experience in the field of macrofungal systematics. The genus-level identification was based on the combined interpretation of macroscopic morphology, habitat/substrate information, and basic micromorphological characters such as basidiospore shape, colour tone, wall structure, and ornamentation evaluated under light microscopy. The objective of the study was not to make definitive taxonomic distinctions at the species or species complex level. For this reason, advanced chemical reagents and dyes such as Melzer’s reagent or Congo Red were not included in the experimental protocol. Conversely, the 5% KOH preparation protocol, a staple of routine microscopic examinations, was selected to standardise imaging conditions across diverse genera and to assess the automatic recognisability of basidiospores from basic light microscopy images. Therefore, the results should be interpreted in the context of genus-level image classification performance, as molecular validation was not part of the study. They should not be interpreted as species-level identification results.
3.3. Deep Learning Architectures
3.3.1. ResNet
ResNet is a CNN architecture that uses residual connections to mitigate the gradient loss problem that occurs in deep neural networks. This structure is expressed as y = F(x) + x and allows the model to learn the residual function instead of the output directly [
25]. This makes it possible to train deeper networks stably. Due to its strong feature extraction capabilities, the ResNet architecture is widely used in general image classification problems. Various studies have shown that ResNet-based models yield successful results on various image datasets [
26,
27].
3.3.2. DenseNet
DenseNet is a densely coupled CNN architecture where each layer uses features from all previous layers as input. This structure is expressed as x_l = H_1 ([x_0, x_1, …, x_(l − 1)]) [
28]. This approach increases feature reuse and strengthens gradient flow. DenseNet provides more efficient learning with fewer parameters, yielding successful results, especially in limited datasets. High accuracy rates have been reported for DenseNet-based models in various image classification problems [
29,
30].
3.3.3. InceptionV3
InceptionV3 is a CNN architecture that performs multi-scale feature extraction by using convolution filters of different sizes in parallel within the same layer. In the InceptionV3 model, filters such as 1 × 1 and 3 × 3 are used together to learn both local and larger-scale features [
31]. This structure allows for the simultaneous analysis of patterns of different sizes. InceptionV3 provides effective results, especially in datasets with complex visual structures [
27].
3.3.4. MobileNet
MobileNet is a lightweight CNN architecture that operates with low computational cost and a low number of parameters. This model uses depthwise separable convolution instead of standard convolution [
32]. This process is performed by first applying separate convolution for each channel, followed by 1 × 1 convolution. Performance has been improved in the MobileNetV2 model by using inverted residual and linear bottleneck structures [
33]. Thanks to these features, MobileNet is preferred, especially in real-time and resource-constrained systems. Various image classification studies have shown that MobileNet-based models yield successful results with high efficiency [
34].
3.3.5. VGG16
VGG16 is a classical CNN architecture based on successive 3 × 3 convolution layers and pooling operations [
35]. Its simple and organized structure makes it easy to learn and implement. VGG16 is particularly used as a powerful feature extractor in transfer learning applications. However, due to the high number of parameters, its computational cost is higher than some other models. VGG-based models are among the fundamental models frequently used for comparison purposes in different image classification problems [
27].
3.3.6. EfficientNet
EfficientNet is a CNN architecture that scales model depth, width, and input resolution in a balanced way. This approach is called compound scaling and is expressed as d = α^φ,w = β^φ,r = γ^φ [
36]. EfficientNet aims to achieve high accuracy with fewer parameters. Therefore, it stands out as a balanced model in terms of both performance and computational efficiency. EfficientNet-based models have been reported to exhibit strong performance in image classification studies [
27,
37,
38].
3.3.7. Vision Transformer (ViT)
ViT is a model that processes images using a Transformer architecture instead of convolution. The input image is divided into small pieces (patches), each piece is converted into a vector and transferred to the Transformer encoder structure [
39]. The basic mechanism of the model is self-attention, expressed by Equation (1):
This structure allows the model to learn the relationships between distant regions within an image. ViT models demonstrate strong performance, especially in large datasets. Furthermore, hybrid CNN and ViT approaches have been shown to yield successful results in various datasets [
40,
41].
3.4. Performance Metrics
In this study, the performance of the models was evaluated using the metrics Accuracy (ACC), Precision (Macro), Recall (Macro), F1-Score (Macro), Matthews Correlation Coefficient (MCC), AUC, and PR-AUC. Accuracy represents the ratio of correctly classified samples to the total number of samples. Precision indicates the accuracy of the model’s positive predictions; Recall shows the rate at which true positive samples are detected. The F1 score is the harmonic mean of the Precision and Recall values. The macro average evaluates each class’s metric with equal weight. MCC is a more reliable overall performance measure, especially in imbalanced datasets. AUC represents the area under the ROC curve; PR-AUC represents the area under the precision-recall curve.
The metrics in Equations (2)–(6) are widely used to comprehensively evaluate model performance in image classification problems [
27,
34].
3.5. Data Splitting Strategy
This study used specimen-level, three-fold Stratified Group K-Fold cross-validation to provide a realistic assessment of model performance while preventing data leakage. The dataset comprised microscopic basidiospore images obtained from 50 biological specimens representing the genera Agaricus, Amanita, Hebeloma, Inocybe, and Russula. Each genus was represented by 10 biological specimens, with a variable number of spore images obtained from each specimen.
Before cross-validation, two biological specimens from each fungal genus were reserved for the independent holdout test set. This produced an independent evaluation set comprising 10 biological specimens and 322 images. The holdout set was not used during training, validation, model selection, or hyperparameter optimisation, and was retained solely for final performance evaluation. The specimen and image distribution of the independent holdout test set is summarised in
Table 4.
The biological specimens assigned to the holdout test set were randomly selected from the 10 available specimens for each fungal genus. This strategy was used to reduce potential selection bias arising from the deliberate choice of particular specimens. The selected holdout specimens were kept fixed throughout the study, and the same independent test set was used in all experiments.
In microscopic image classification studies, placing images from the same biological specimen in both the training and validation sets may cause the model to memorise specimen-specific visual features rather than learn biologically meaningful differences. This form of data leakage can inflate performance metrics. To minimise this risk, this study adopted a specimen-level rather than image-level partitioning strategy.
In this particular context, the definition of a biological specimen was established as a group. All images of the same biological specimen were retained within a single group, and no image was permitted to be distributed across different folds. Consequently, no image of a biological specimen in the training set was included in the validation set. Consequently, the model was subjected to testing on biological specimens with which it had no prior experience during the validation phase.
In this study, the 3-fold Stratified Group K-Fold method was selected as the primary approach. The number of folds was determined by statistical evaluation criteria and by considering the biological sample structure of the dataset. The dataset under consideration contains 10 biological samples for each fungal genus. It should be noted that, due to the group-based data partitioning approach, all images belonging to the same biological sample must be kept within a single fold.
When higher fold numbers (e.g., k = 5 or k = 10) were tested, it was observed that some folds either completely lacked or insufficiently represented biological samples belonging to certain fungal genera. This predicament is primarily attributable to the Stratified Group K-Fold algorithm’s stipulations for preserving group integrity and ensuring equitable class distribution. Consequently, the training process exhibited instability and difficulties in calculating evaluation metrics arose due to the inability to represent certain classes in the validation or training sets in some folds. Conversely, when k = 3 was selected, it was observed that all fungal genera were adequately represented in each fold, group integrity was preserved, and the class distribution remained balanced. Furthermore, the utilisation of approximately two-thirds (66.7%) of the dataset for training and one-third (33.3%) for validation in each iteration ensured the stable training of the models. Consequently, a 3-fold stratified group K-fold cross-validation strategy was employed in all experiments throughout the study.
3.6. Pseudocode of the Proposed Framework
The overall training and evaluation procedure of the proposed InceptionV3–ViT-B16-based hybrid fusion framework is summarized in Algorithm 1. The workflow includes data preprocessing, specimen-level data splitting, hybrid feature extraction, bottleneck fusion, model optimization, and performance evaluation.
In the initial phase, microscopic basidiospore images are loaded, and each image is assigned a class label and biological specimen information. Subsequently, the images are subjected to resizing and normalisation in accordance with the standards established by ImageNet. In order to prevent data leakage, pre-defined biological subgroups are separated as independent holdout test sets, while the remaining data is used in a 3-fold class-balanced group-based cross-validation process.
Within each fold, the InceptionV3 and ViT-B16 architectures are run in parallel. The InceptionV3 arm extracts local morphological and textural features from the images, while the ViT-B16 arm learns global contextual relationships. The resulting feature vectors are then combined and transferred to a bottleneck-based fusion block. This block has the effect of transforming the high-dimensional hybrid representation into a more compact and distinctive feature space.
During model training, the Adam optimisation algorithm is employed, with the learning rate being dynamically updated based on the success of the validation process. An early stopping mechanism is employed to prevent overfitting, and the model weights that demonstrate the highest validation success are stored. In the final stage, the model is evaluated on an independent holdout test set, and performance metrics such as Accuracy (ACC), F1-Macro, Matthews Correlation Coefficient (MCC), ROC-AUC, and PR-AUC are calculated.
This algorithmic structure aims to achieve high accuracy and strong generalisation performance in the classification of microscopic fungal spores by combining CNN-based local representation learning and Transformer-based global representation learning within a single hybrid framework.
| Algorithm 1. Proposed InceptionV3–ViT-B16 Bottleneck Concatenation Fusion Framework |
Input: Microscopic basidiospore image dataset (D), class labels (Y), specimen group labels (G);
Output: Trained hybrid classifier and performance metrics |
Initialize target classes: Agaricus, Amanita, Hebeloma, Inocybe, Russula.
Load all microscopic images from class folders.
Assign each image:
a class label,
a specimen-level group ID,
a biological subgroup name.
Resize each image to 299 × 299.
Normalize pixel values using ImageNet mean and standard deviation.
Separate predefined biological subgroups as the independent holdout test set.
Use the remaining data as the train/validation set.
Verify that no specimen group overlaps between train/validation and holdout test sets.
Construct 3-fold class-balanced group splits:
keep all images from the same specimen in the same fold,
preserve class balance across folds as much as possible.
For each fold (k = 1, 2, 3):
Use two folds for training and one fold for validation.
Initialize the hybrid model:
InceptionV3 feature extractor,
ViT-B16 feature extractor,
bottleneck concatenation fusion block,
final classification layer.
Extract CNN features using InceptionV3.
Resize the same input image to 224 × 224 for ViT-B16.
Extract transformer features using ViT-B16.
Concatenate InceptionV3 and ViT-B16 feature vectors.
Apply bottleneck fusion:
Batch Normalization,
Dropout,
Linear projection to 512 dimensions,
ReLU activation,
Dropout.
Feed the fused representation into the final classifier.
Train the model using Adam optimizer and cross-entropy loss.
Monitor validation accuracy after each epoch.
Apply ReduceLROnPlateau based on validation accuracy.
Save the model weights with the best validation accuracy.
Stop training early if validation accuracy does not improve within the patience limit.
Reload the best model weights.
Evaluate the model on:
validation set,
independent holdout test set.
Compute performance metrics:
Accuracy,
Precision,
Recall,
F1-score,
Matthews Correlation Coefficient,
Cohen’s Kappa,
ROC-AUC,
PR-AUC.
Save classification report and confusion matrix.
Compute mean and standard deviation of all metrics across three folds.
Report final model performance as mean ± standard deviation. |
4. Results
4.1. Performance of Individual Models (Baseline Analysis)
In this stage, the independent performance of different deep learning architectures for the classification of microscopic fungal spores was compared. The objective of this study was twofold: firstly, to ascertain the fundamental classification capacity of each model prior to hybrid modelling; and secondly, to identify the most suitable candidates for subsequent stages. In this context, six different CNN-based architectures—ResNet18, InceptionV3, MobileNetV2, VGG16, DenseNet121, and EfficientNetB0—and two different Vision Transformer models—ViT-B/16 and ViT-Tiny—were evaluated. It is imperative to note that all models were trained under the same dataset, preprocessing steps, and evaluation metrics to ensure a fair comparison.
First, to directly evaluate the dataset-specific learning capabilities of the architectures, all models were trained from scratch (without transfer learning), and the results are presented in
Table 5. Subsequently, transfer learning was employed, using pre-trained weights from ImageNet, and the models were retrained. The findings of these experiments, which incorporated transfer learning, are presented in
Table 6. In both experimental groups, evaluation procedures were performed using a specimen-based, 3-fold Stratified Group K-Fold cross-validation strategy to prevent images of the same biological sample from appearing in different folds. This enabled the comparison of model performance under more realistic conditions of generalisation, independent of data leakage.
As illustrated in
Table 5, the 3-fold stratified group k-fold validation results of CNN and Vision Transformer-based models trained without transfer learning are presented. An analysis of the outcomes reveals that Vision Transformer-based models tended to outperform CNN architectures in training settings without transfer learning.
The ViT-B/16 model demonstrated the highest level of accuracy, with a rate of 63.34%. This model also achieved the highest values in the F1-macro (0.5953), MCC (0.5739), and AUC-macro (0.8947) metrics, making it the most successful single model. The ViT-Tiny model also produced similarly strong results and ranked second. This finding suggests that transformer-based architectures have the potential to facilitate the learning of long-range structural relationships in microscopic spore images.
Among CNN-based models, the most successful result was obtained by the DenseNet121 model. The DenseNet121 model demonstrated a performance that was almost equivalent to that of the ViT-B/16 model, with an accuracy rate of 62.42%, thus establishing itself as the most successful architecture among CNN models. However, the relatively high standard deviation values (±0.3118 for ACC) indicate that model performance varies significantly between folds. This may be attributable to the constrained sample size of the dataset, and the associated challenge of learning in contexts involving sample-based group separation.
ResNet18 demonstrated moderate performance. In contrast, the InceptionV3 and VGG16 models performed significantly below expectations. Specifically, VGG16′s accuracy rate of only 24.53% and its low F1-macro value (0.1146) indicate that deep but high-parameter classical CNN architectures cannot learn effectively on this dataset. The lowest performances were observed in the MobileNetV2 and EfficientNetB0 models. The fact that the MCC value is zero in both models shows that the models failed to learn a meaningful distinction by predicting the dominant class in some folds. In particular, accuracy levels of approximately 20% reveal that the results produced are quite close to random prediction performance in a five-class problem.
As illustrated in
Table 6, the 3-fold stratified group k-fold validation results of models trained with transfer learning using pre-trained weights on ImageNet are presented. A comparison with the findings presented in
Table 6 indicates that transfer learning substantially improved performance across all models. This finding suggests that pre-learned general visual representations play a substantial role in microscopic spore datasets comprising a limited number of biological samples.
The results indicate that the InceptionV3 model achieved the highest accuracy levels, with F1-macro and MCC values of 0.8647 and 0.8429, respectively. The findings demonstrate the efficacy of the InceptionV3 architecture in adapting to the dataset following transfer learning, thereby attaining balanced separation between classes. The low standard deviation values demonstrate that the model produces consistent results across different folds.
The DenseNet121 model demonstrated a performance that was almost equivalent to that of the InceptionV3 model, with an accuracy rate of 86.03%. Furthermore, it attained the highest PR-AUC value (0.9410), thereby evidencing an exceptionally elevated degree of discrimination capability between classes. Although DenseNet121 was ranked second in terms of accuracy, its success in terms of PR-AUC indicates that it can model the probability distributions between classes with greater reliability.
Despite the ResNet18 model ranking third in terms of accuracy, it attained the highest AUC-macro value (0.9828). This finding suggests that the model possesses a robust capacity for class discrimination; however, its performance metrics do not attain the level of effectiveness observed in InceptionV3 and DenseNet121 with regard to decision thresholds. The MobileNetV2 and VGG16 models also demonstrated notable enhancement following the implementation of transfer learning. The finding that these models, which demonstrated suboptimal performance in experiments devoid of transfer learning, attained accuracy rates exceeding 80%, underscores the pivotal function of pre-trained weights in microscopic image classification.
When examining Vision Transformer-based models, the ViT-B/16 model, which yielded the most successful results in experiments conducted without transfer learning, attained an accuracy of 81.47% following transfer learning. However, the CNN-based InceptionV3 and DenseNet121 models outperformed the ViT-based architectures. This phenomenon can be attributed to the relatively modest size of the dataset, and the fact that fine texture features in microscopic images can be more effectively learned by CNN-based architectures.
4.2. Proposed Hybrid Fusion and Attention-Based Classification Architecture
In the final stage of the proposed framework, a hybrid classification model was developed by combining the InceptionV3 model, which was identified as the most successful CNN architecture as a result of the individual model comparisons performed in the previous stage, with the Vision Transformer (ViT-B/16) architecture. The main aim of this approach is to bring together the powerful local feature extraction capabilities of CNN architectures with the global contextual representation power of the Vision Transformer architecture within a single network.
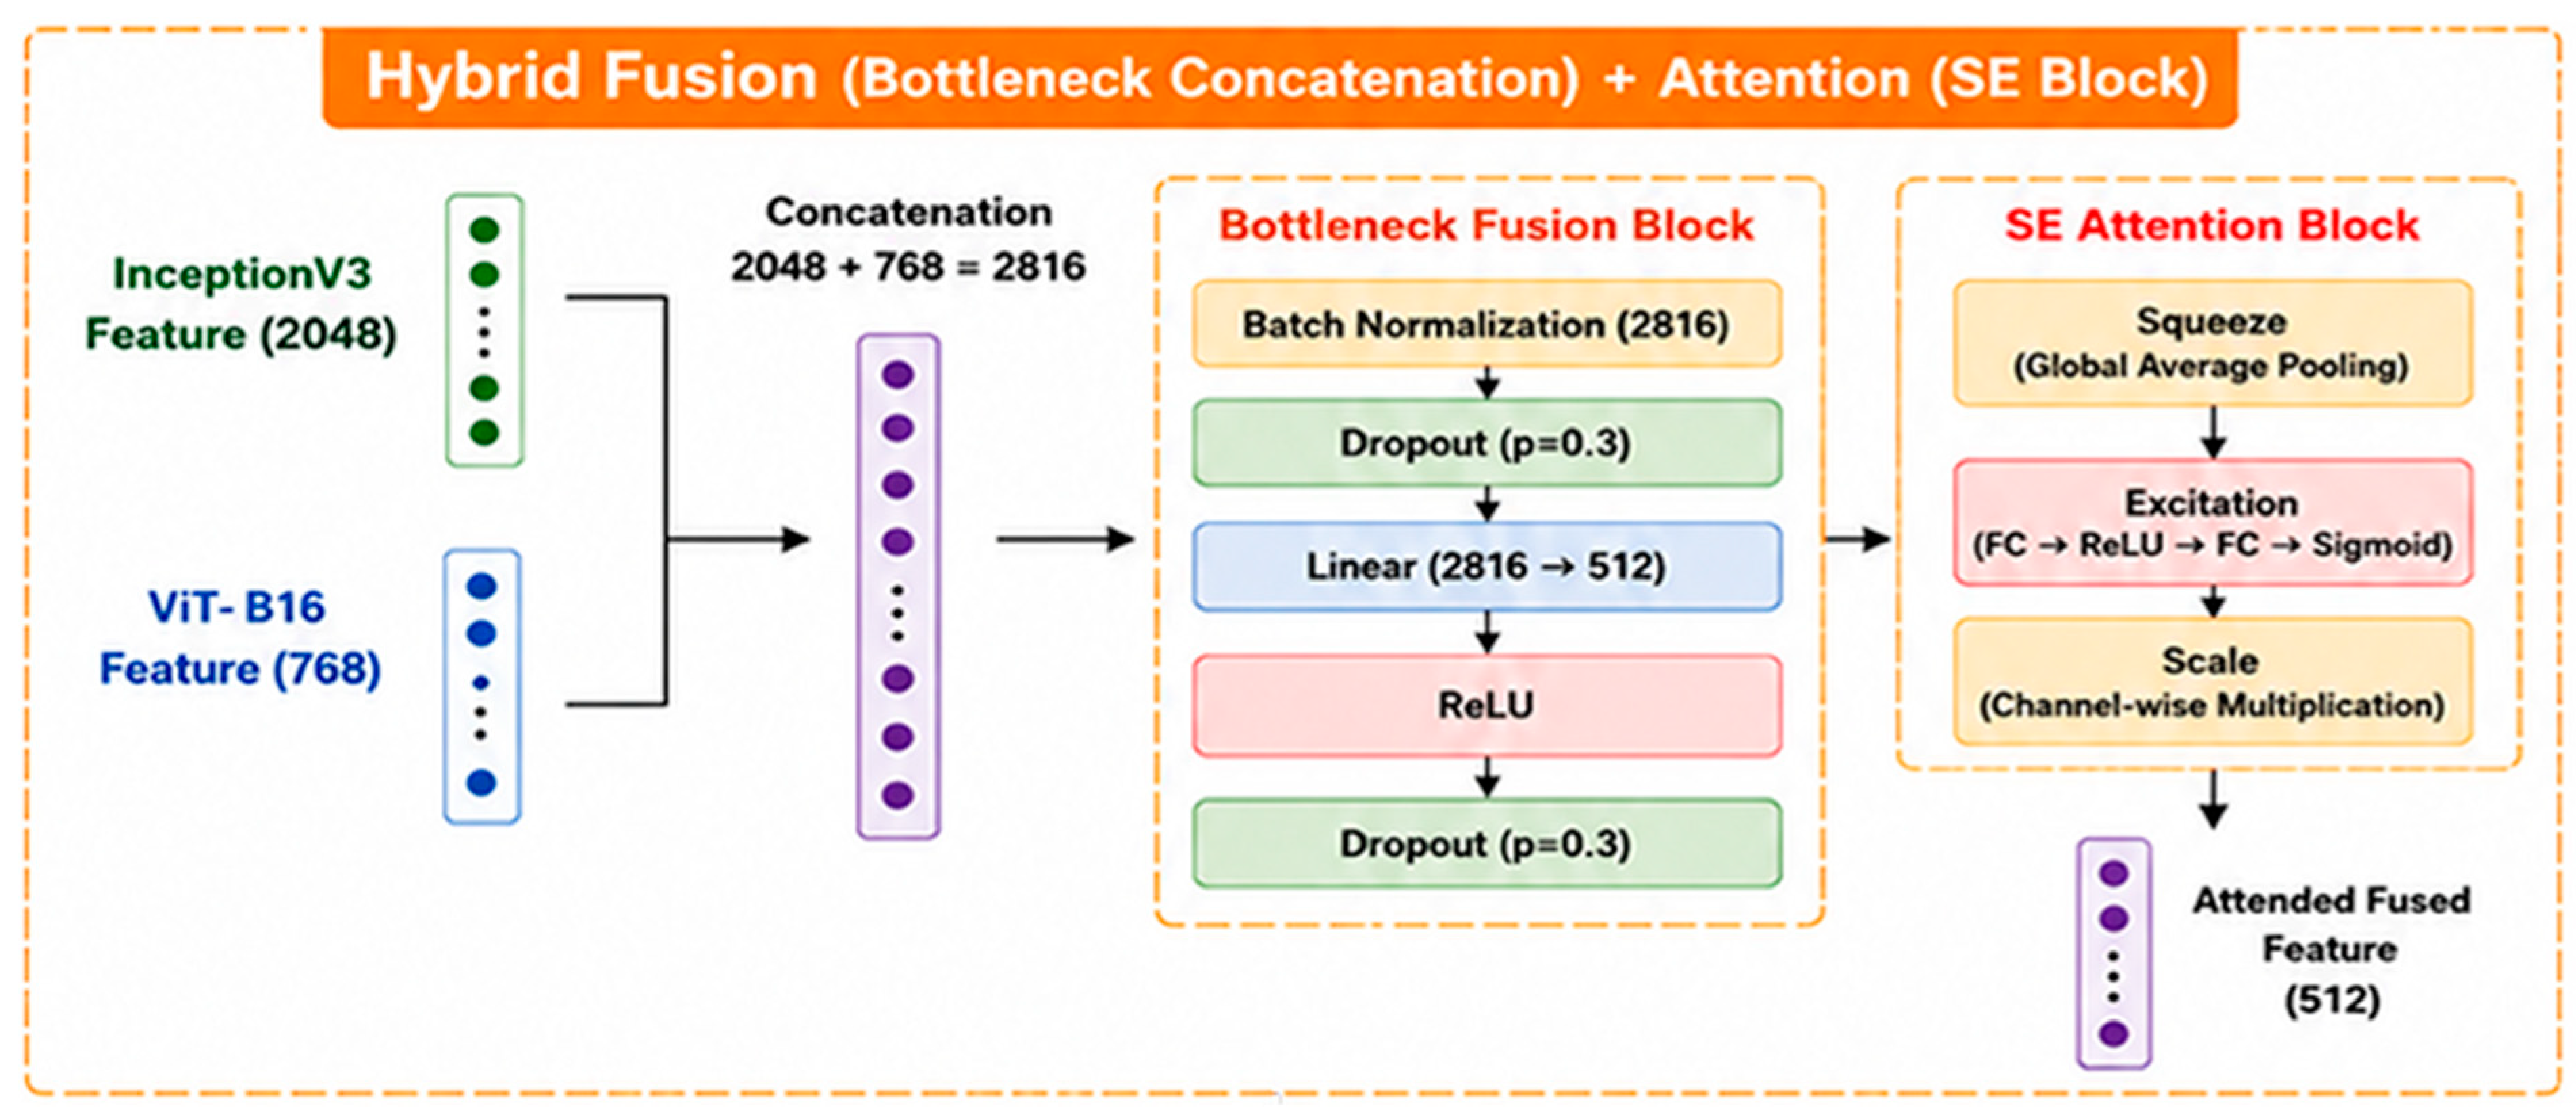
As illustrated in
Figure 3, the proposed bottleneck-based feature fusion and attention mechanism is a sophisticated integration of these methodologies. In this stage, the feature vectors obtained from the InceptionV3 and ViT-B16 networks were represented as 2048- and 768-dimensional vectors, respectively, and combined using a concatenate operation to create a 2816-dimensional combined feature vector.
Rather than transferring the combined features directly to the classification layer, they were passed through a bottleneck fusion block to obtain a more compact and distinctive representation. In this particular block, Batch Normalization was initially implemented to regulate the feature distribution, followed by regularisation with Dropout (p = 0.3). In the subsequent phase, a linear transformation layer was employed to project the 2816-dimensional combined feature vector into a lower-dimensional feature space of 512 dimensions. The application of ReLU activation resulted in the acquisition of nonlinear representational power, while the incorporation of a second Dropout layer served to mitigate the occurrence of overfitting. Therefore, high-dimensional features from disparate networks were transformed into a more compact and more meaningful for classification common representation.
A 512-dimensional feature representation obtained from the bottleneck fusion block was then subjected to a squeeze-and-excitation (SE)-based attention mechanism. Initially, channel-based summary information was obtained using global average pooling, and subsequently, attention coefficients were calculated for each channel using fully connected layers and sigmoid activation. The calculated coefficients were then multiplied by the feature vector in order to perform channel-based reweighting, thereby enhancing features that are more important for classification.
In conclusion, the proposed structure creates a 512-dimensional fusion representation enriched with bottleneck-based dimensionality reduction and an SE-based attention mechanism, instead of directly combining features generated by InceptionV3 and ViT-B16. This representation is then transferred to the classification layer and used in the final prediction process.
4.3. Evaluation of the Best-Performing Hybrid Model Across Three Folds
As illustrated in
Table 7, the holdout test results obtained by the InceptionV3 + ViT-B16 + Fusion model under the 3-fold Stratified Group K-Fold validation are presented. Upon examination of the results obtained on a fold basis, it is evident that the highest performance in terms of accuracy (ACC), F1-Macro, MCC, and Cohen’s Kappa is achieved on Fold 3. In this particular fold, the model demonstrated a noteworthy level of accuracy, with a score of 93.48% in terms of accuracy (ACC), 93.53% in the F1-Macro category, along with notable values of 0.9204 for the Matthews Correlation Coefficient (MCC) and 0.9184 for Cohen’s Kappa. The MCC and Kappa coefficients are found to be close to 0.92, indicating that the model predictions are not random and that a strong distinction is made between the classes. In a similar manner, the values for the Precision Macro (94.38%) and the Recall Macro (93.48%) demonstrate that the model displays a balanced and consistent performance across all categories.
As shown in
Table 7, Fold 1 and Fold 2 also exhibited high performance. Fold 1 achieved 92.86% accuracy and an MCC of 0.9128, while Fold 2 achieved 90.06% accuracy and an MCC of 0.8787. The performance disparities observed between the folds were found to be minimal, thereby suggesting that the model possesses the capacity to generate consistent outcomes across diverse biological sample groups. When the mean results are evaluated, the model exhibits high and consistent performance with 92.13 ± 1.85% accuracy, 92.11 ± 1.81% F1-Macro, and 0.9040 ± 0.0222 MCC values.
A thorough examination of the AUC-Macro and PR-AUC Macro results reveals that remarkably elevated values were obtained across all folds. The AUC-Macro values ranging from 0.9817 to 0.9947, with an average of 0.9895, demonstrate the model’s remarkable capacity for differentiating between classes. In a similar vein, the PR-AUC Macro values ranged from 0.9469 to 0.9840, with an average of 0.9684, thus demonstrating the model’s capacity to produce reliable and balanced predictions, particularly in multi-class decision-making processes. While the highest values for AUC-Macro and PR-AUC Macro were obtained in Fold 1, Fold 3 produced more successful results in threshold-dependent performance metrics such as ACC, F1-Macro, and MCC. This phenomenon can be regarded as a natural consequence of the fact that threshold-dependent and threshold-independent performance metrics can exhibit divergent behaviours in disparate data sets. The findings demonstrate that the proposed model not only exhibits high accuracy but also demonstrates robust and consistent performance in probability-based decision generation.
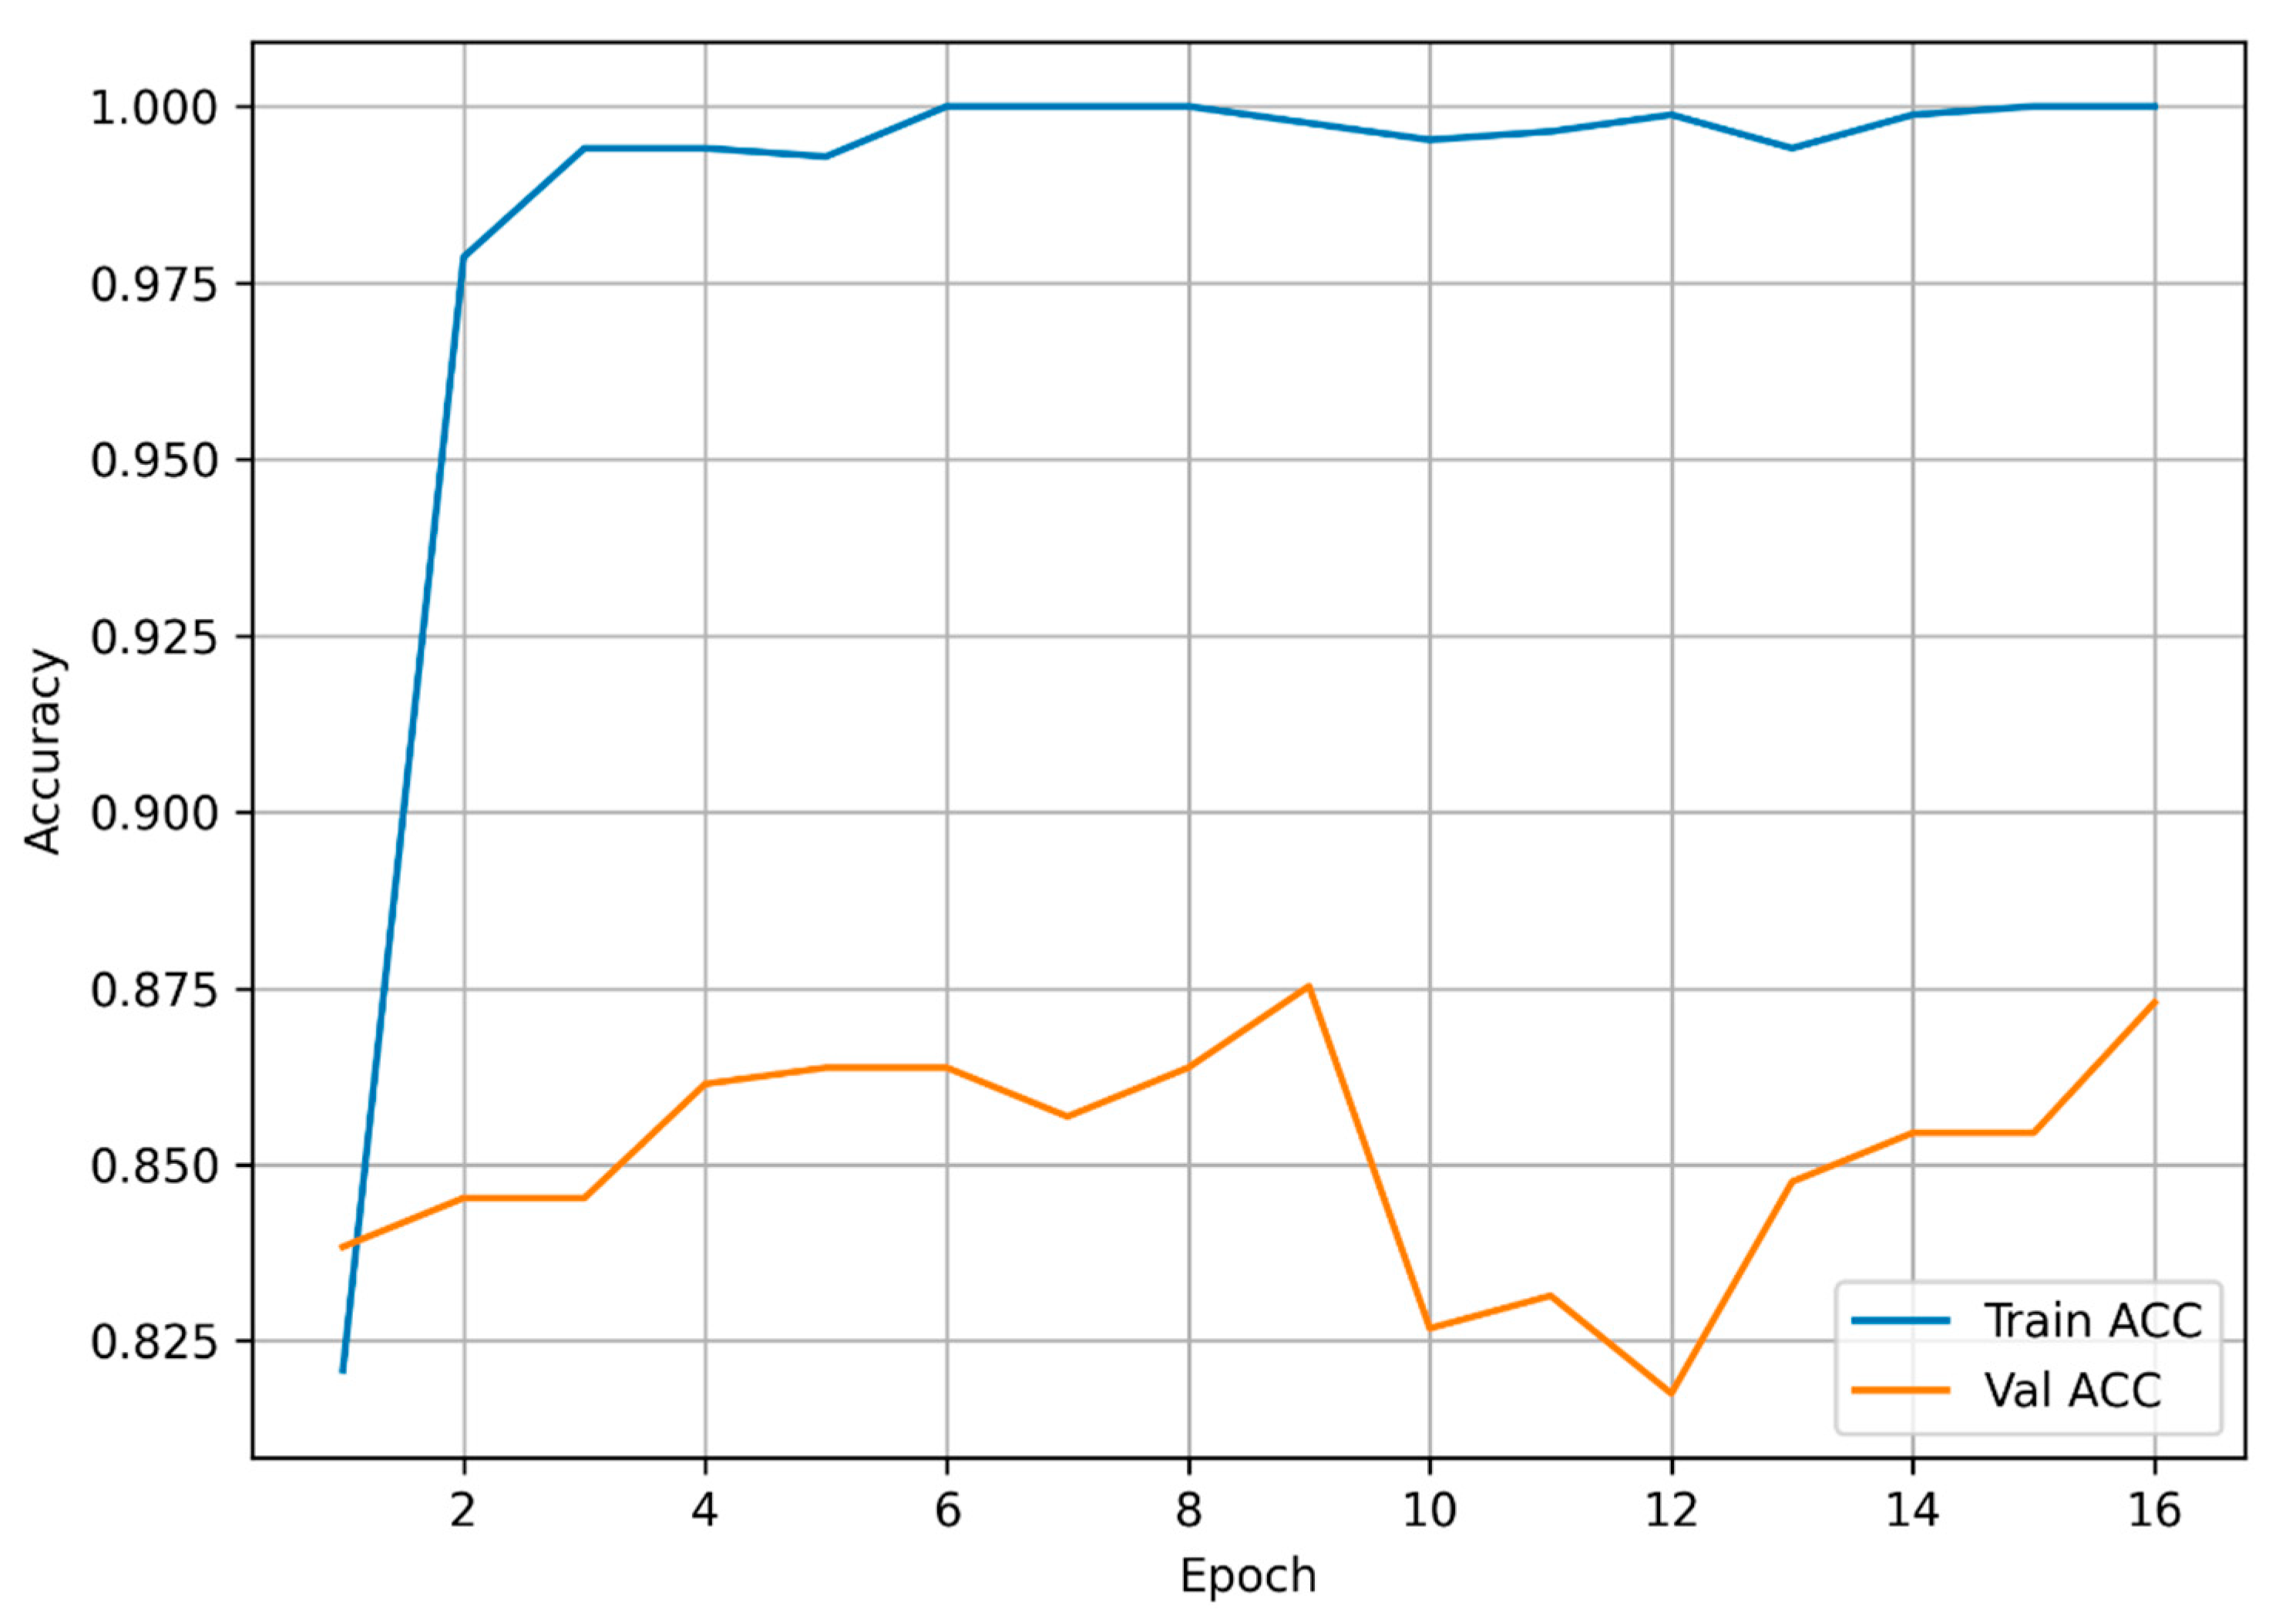
Figure 4 shows the training and validation accuracy curves of the proposed hybrid model. Training accuracy increased rapidly during the first few epochs, reaching approximately 99% by the third epoch and remaining close to 100% thereafter. This pattern indicates that the model fitted the training data very strongly.
Validation accuracy increased during the early epochs and reached its highest value of 87.53% at epoch 9. It then declined temporarily, most notably between epochs 10 and 12, when performance fell to the 81–83% range. In later epochs, validation performance recovered and reached approximately 87% by the end of training.
The widening gap between training and validation accuracy suggests that the model fitted the training data more closely than the validation data. This pattern is consistent with the overfitting tendency commonly observed in deep learning models. Nevertheless, validation accuracy remained above 82% throughout training, indicating that the validation performance did not collapse despite these fluctuations.
In this study, the model weights from the epoch with the highest validation performance were used for final evaluation. This approach limited the influence of later-stage overfitting on the final model. However, the marked gap between training and validation accuracy still indicates an overfitting tendency, which should be regarded as an important limitation of the study.
The higher performance observed on the holdout test set than on the average validation folds does not necessarily indicate data leakage; however, it should be interpreted with caution. Validation results were obtained from different specimen groups across folds, whereas the holdout test set consisted of fixed independent specimens that were not used during training, validation, model selection, or hyperparameter optimisation. Natural biological variation and differences in specimen difficulty may therefore contribute to discrepancies between validation and holdout performance. Accordingly, the overfitting tendency observed in the training curves and the natural variability among biological specimens should both be considered when interpreting the holdout results.
Overall,
Figure 4 indicates that the proposed hybrid architecture has a high capacity to fit the training data, while the divergence between training and validation performance also reveals a degree of overfitting. Therefore, the reported performance should be interpreted in light of the dataset size, the specimen-level partitioning strategy, and natural variation among biological specimens.
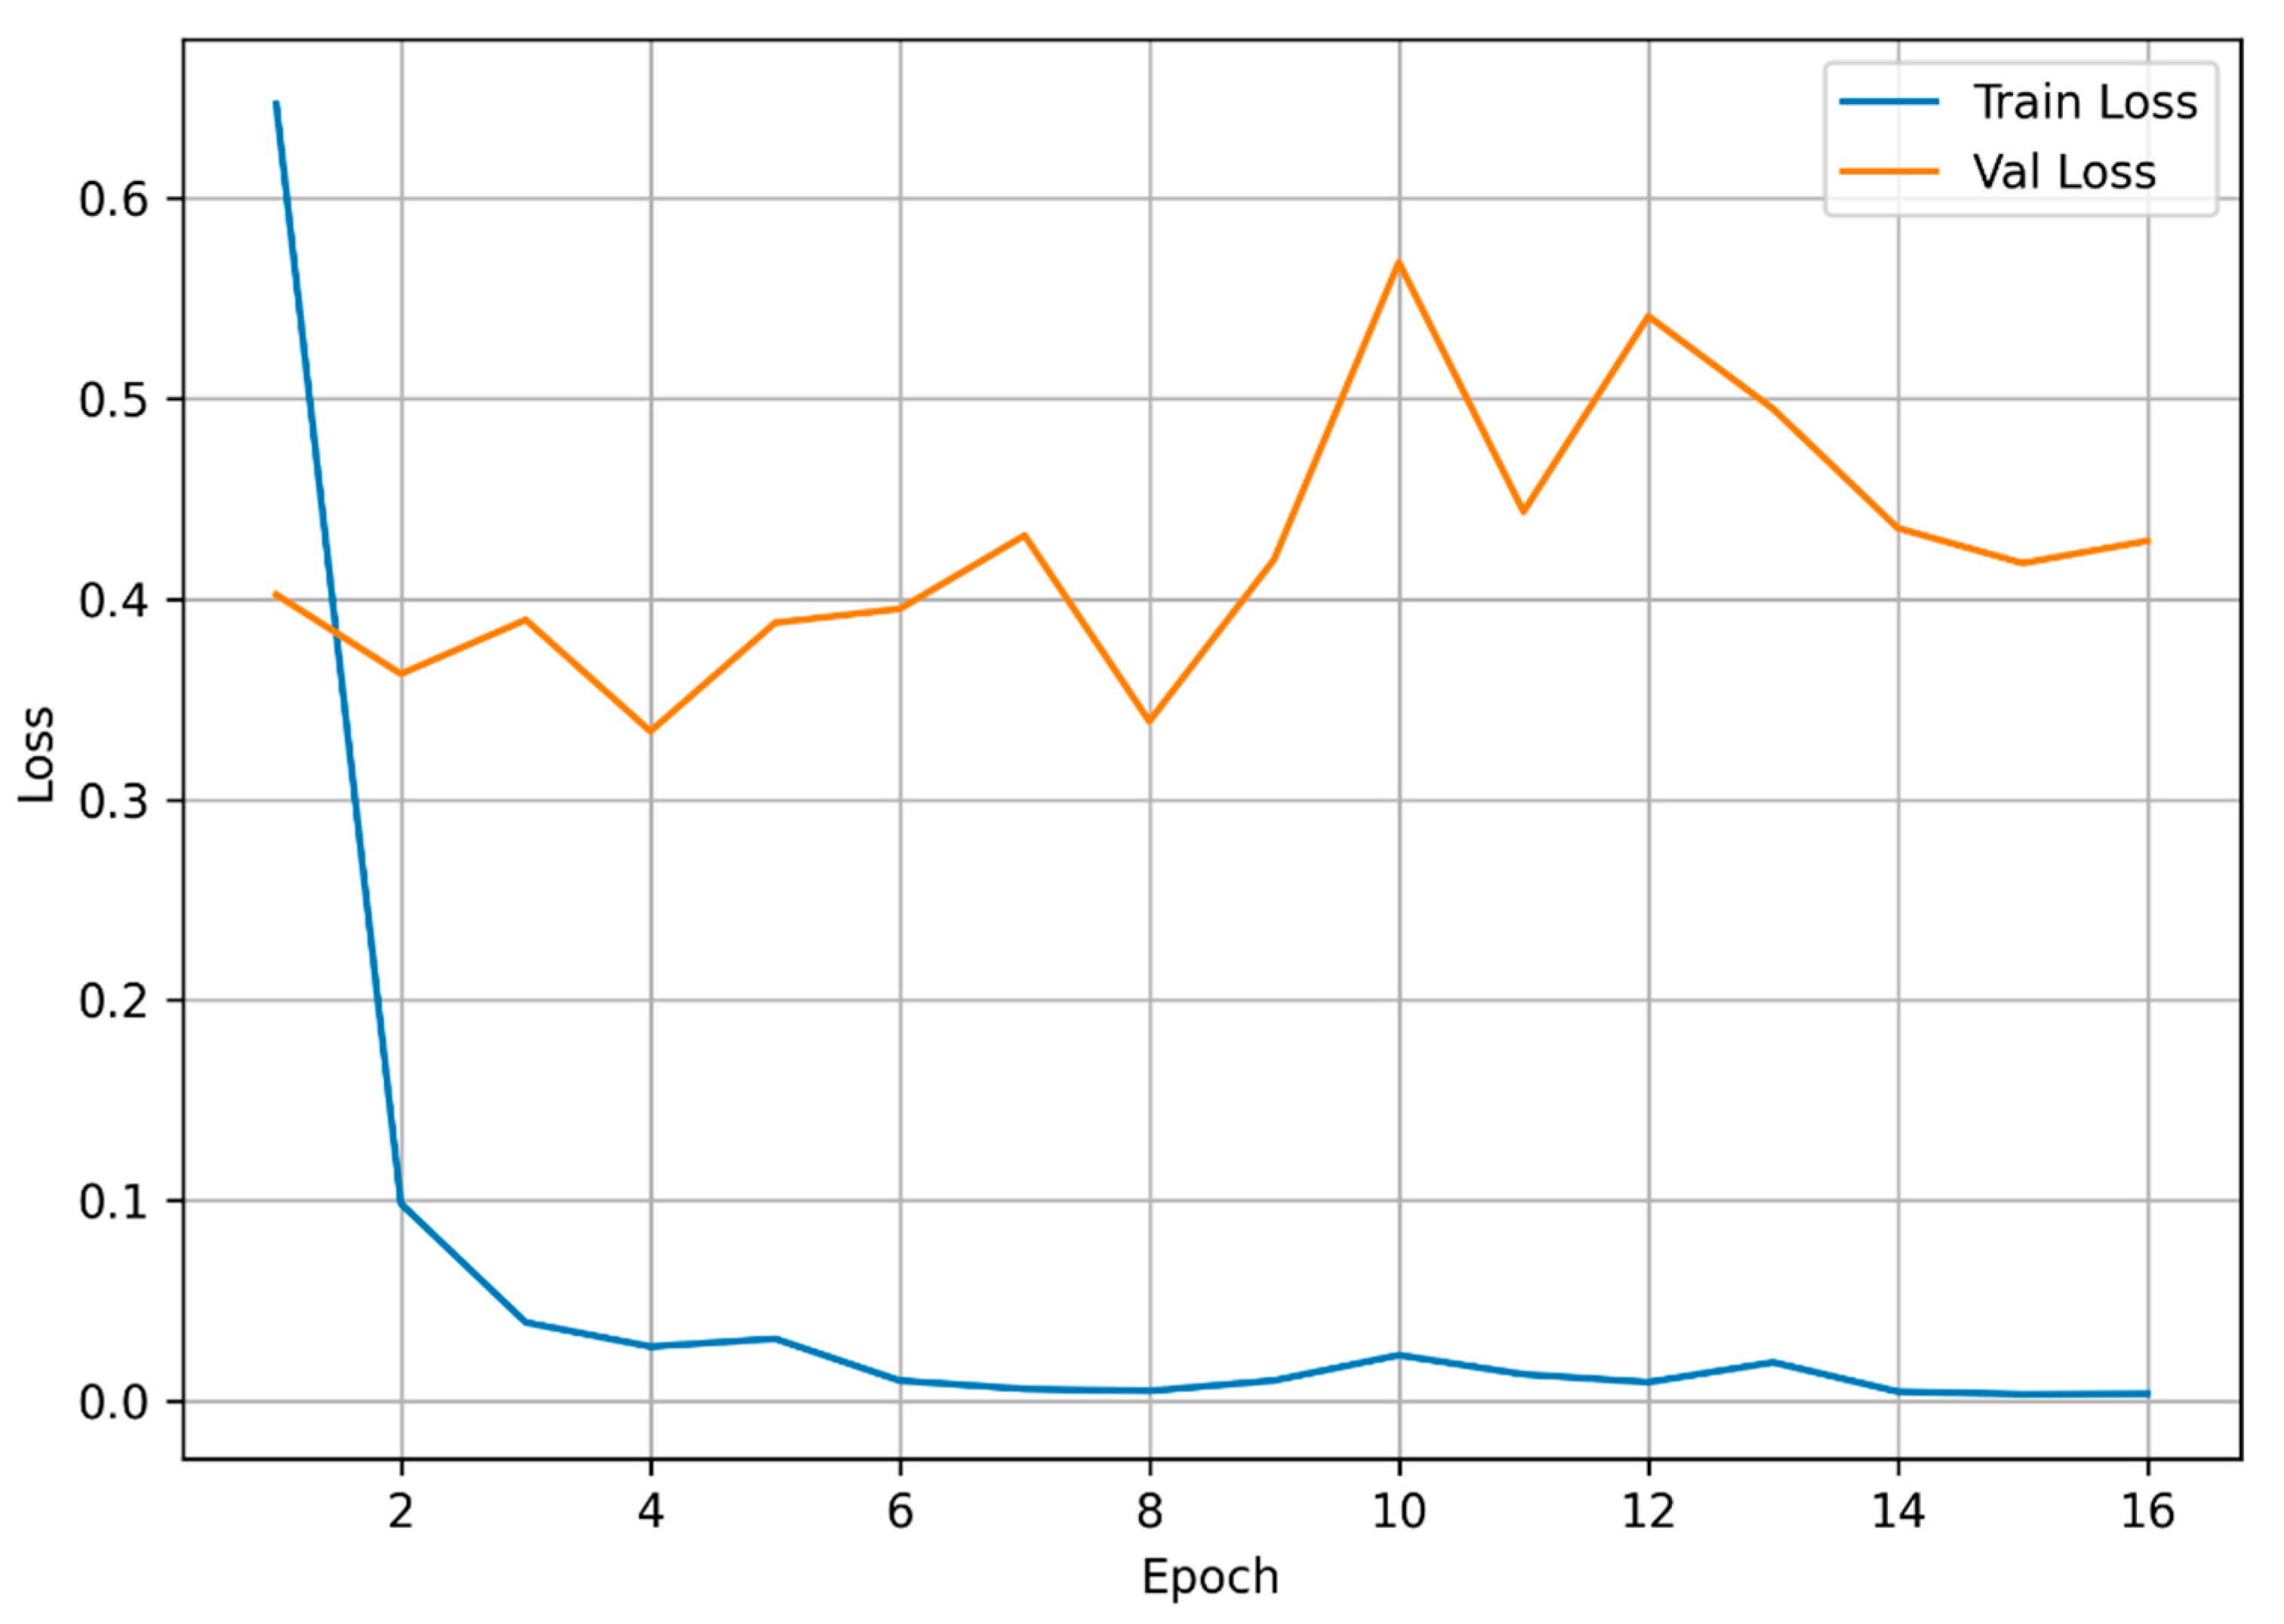
As demonstrated in
Figure 5, the training and validation loss values of the proposed hybrid model vary across epochs. Training loss decreased rapidly in the initial epochs, falling from approximately 0.65 to below 0.05, and remained close to zero after the sixth epoch. This finding suggests that the model successfully learned patterns in the training data, leading to a substantial reduction in the error rate.
When the validation loss is examined, a more fluctuating pattern is observed compared to the training loss. In the initial epochs, validation loss exhibited a range of approximately 0.33 to 0.40, attaining one of its minima in the eighth epoch. Subsequent epochs witnessed sporadic surges in validation loss, a phenomenon that was particularly evident in the 10th and 12th epochs. This behaviour suggests that, while the model is adapting to the training data, it is not achieving the same level of improvement in the validation data.
The phenomenon of validation loss escalating after specific points despite a consistent decline in training loss can be cited as an archetypal illustration of overfitting, a pervasive phenomenon in deep learning models. However, the observation that the increases in validation loss do not escalate uncontrollably and remain within a certain range throughout the training process suggests that the model does not demonstrate completely unstable learning behaviour. This finding indicates that the dropout layers, label smoothing approach, and learning rate scheduler employed may serve to mitigate the impact of overfitting to a certain degree.
When loss curves are evaluated together with accuracy curves, it is observed that the model reaches its most successful validation performance in the ninth epoch. Therefore, in the final evaluations, the model weights recorded in the epoch that provided the highest validation success were used. In this way, the negative impact of overfitting effects that may occur in later epochs on the final performance results was prevented.
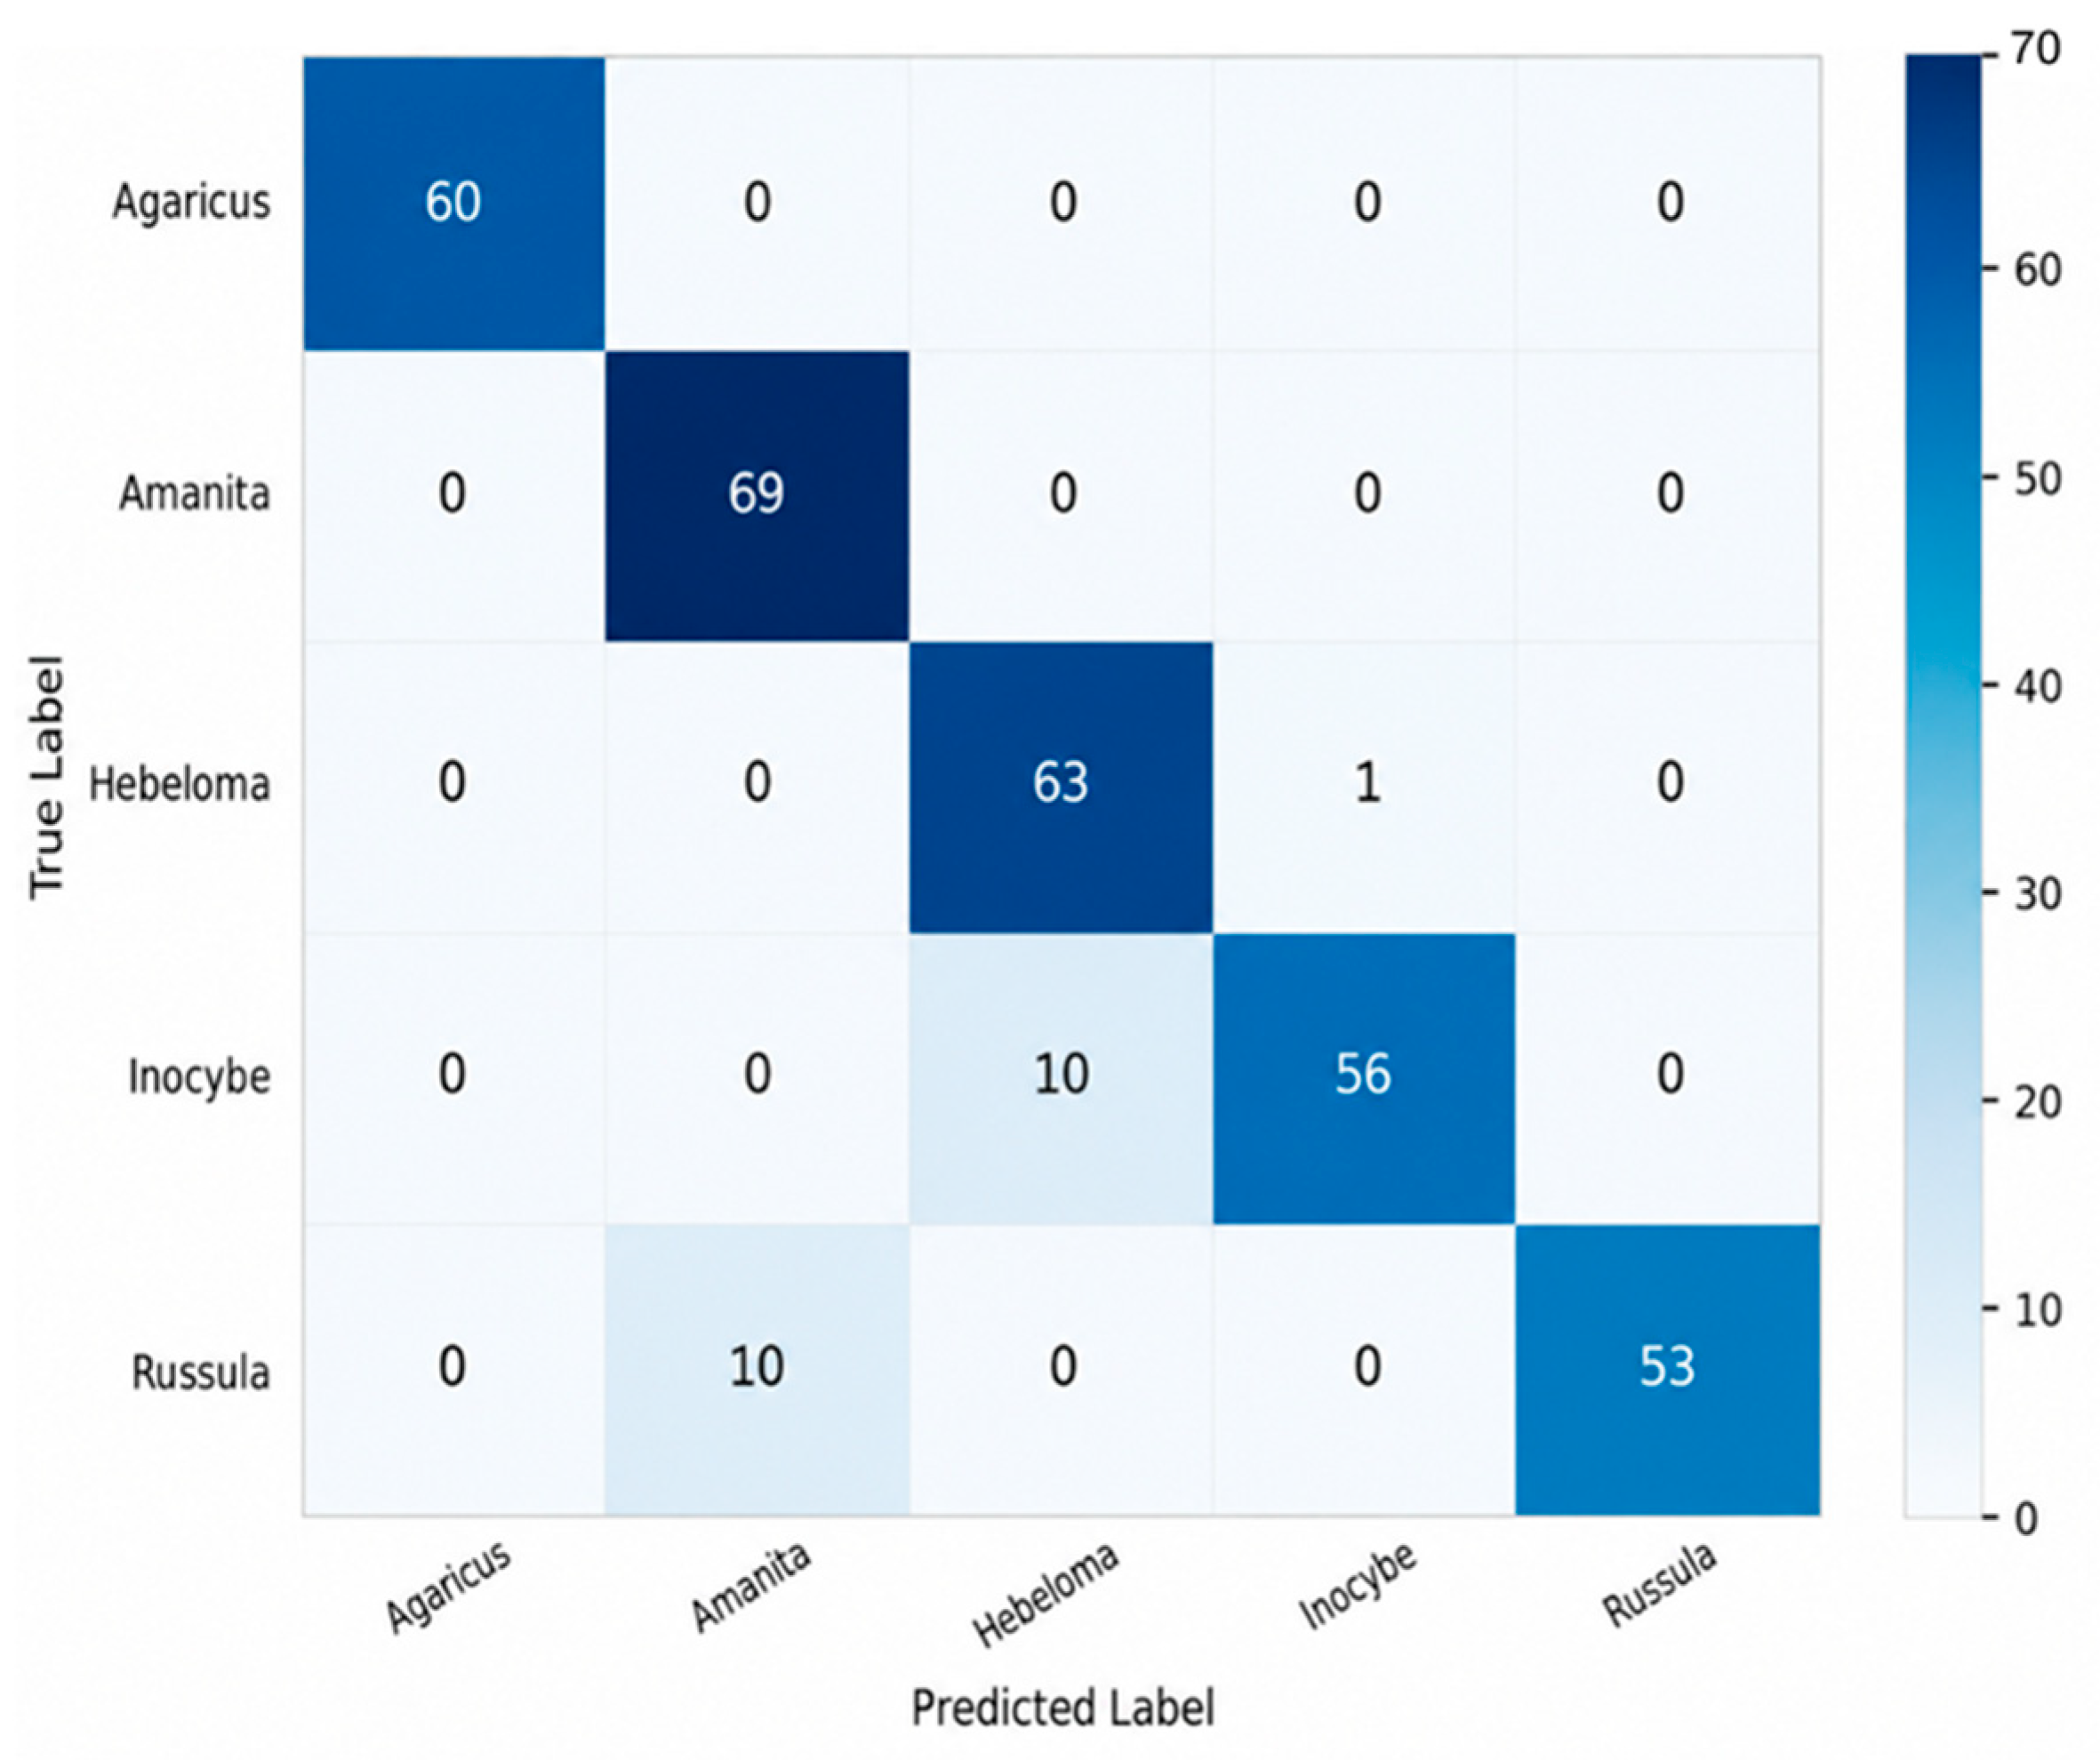
As illustrated in
Figure 6, the proposed Hybrid model is represented by a confusion matrix. A thorough examination of the confusion matrix shows that the model accurately categorises the majority of the five fungal genera, with predictions predominantly concentrated along the diagonal axis. This finding suggests that the model attains a high degree of accuracy in differentiating between the specified classes. All specimens in the
Agaricus and
Amanita classes were classified correctly. The model demonstrated a 100% classification success rate in the
Agaricus class and the
Amanita class, correctly predicting all 60 and 69 specimens, respectively. This finding indicates that the morphological characteristics of these genera are sufficiently distinguishable from those of other classes.
In the Hebeloma class, a single specimen was misclassified as Inocybe. Conversely, a total of 10 specimens in the Inocybe class were misclassified as Hebeloma. The most significant source of error observed in the confusion matrix is the confusion between these two classes. This phenomenon can be elucidated by the observation that the Hebeloma and Inocybe genera show comparable dimensions, morphology, and surface characteristics with regard to basidiospore morphology. The model in question experienced considerable difficulty in distinguishing between the two genera, a difficulty that can be attributed to the presence of notable parallels in spore contours and microscopic structure.
Another noteworthy error is observed between the Russula and Amanita classes. A total of ten specimens belonging to the Russula class were classified as Amanita. Notwithstanding this, 53 specimens in the Russula class were correctly predicted. The absence of misclassification in the Amanita class suggests that the model has acquired Amanita characteristics more dominantly and distinctly. The erroneous prediction of some Russula specimens as Amanita indicates the presence of certain morphological similarities between these two genera.
It is evident that misclassifications are predominantly concentrated within specific class pairs, while optimal discrimination is attained in other classes. The diagonal structure of the confusion matrix is notably dominant, thereby substantiating the model’s capacity for effective generalisation on the holdout test set. This observation is consistent with the 93.48% accuracy, 93.44% F1-Macro, and 0.9204 MCC values obtained for Fold 3. The findings demonstrate that local morphological characteristics acquired by InceptionV3 and global contextual information assimilated by Vision Transformer are efficiently amalgamated within a hybrid fusion framework, thereby engendering a successful representation for the classification of fungal spores.
4.4. ROC and Precision-Recall Curve Analysis
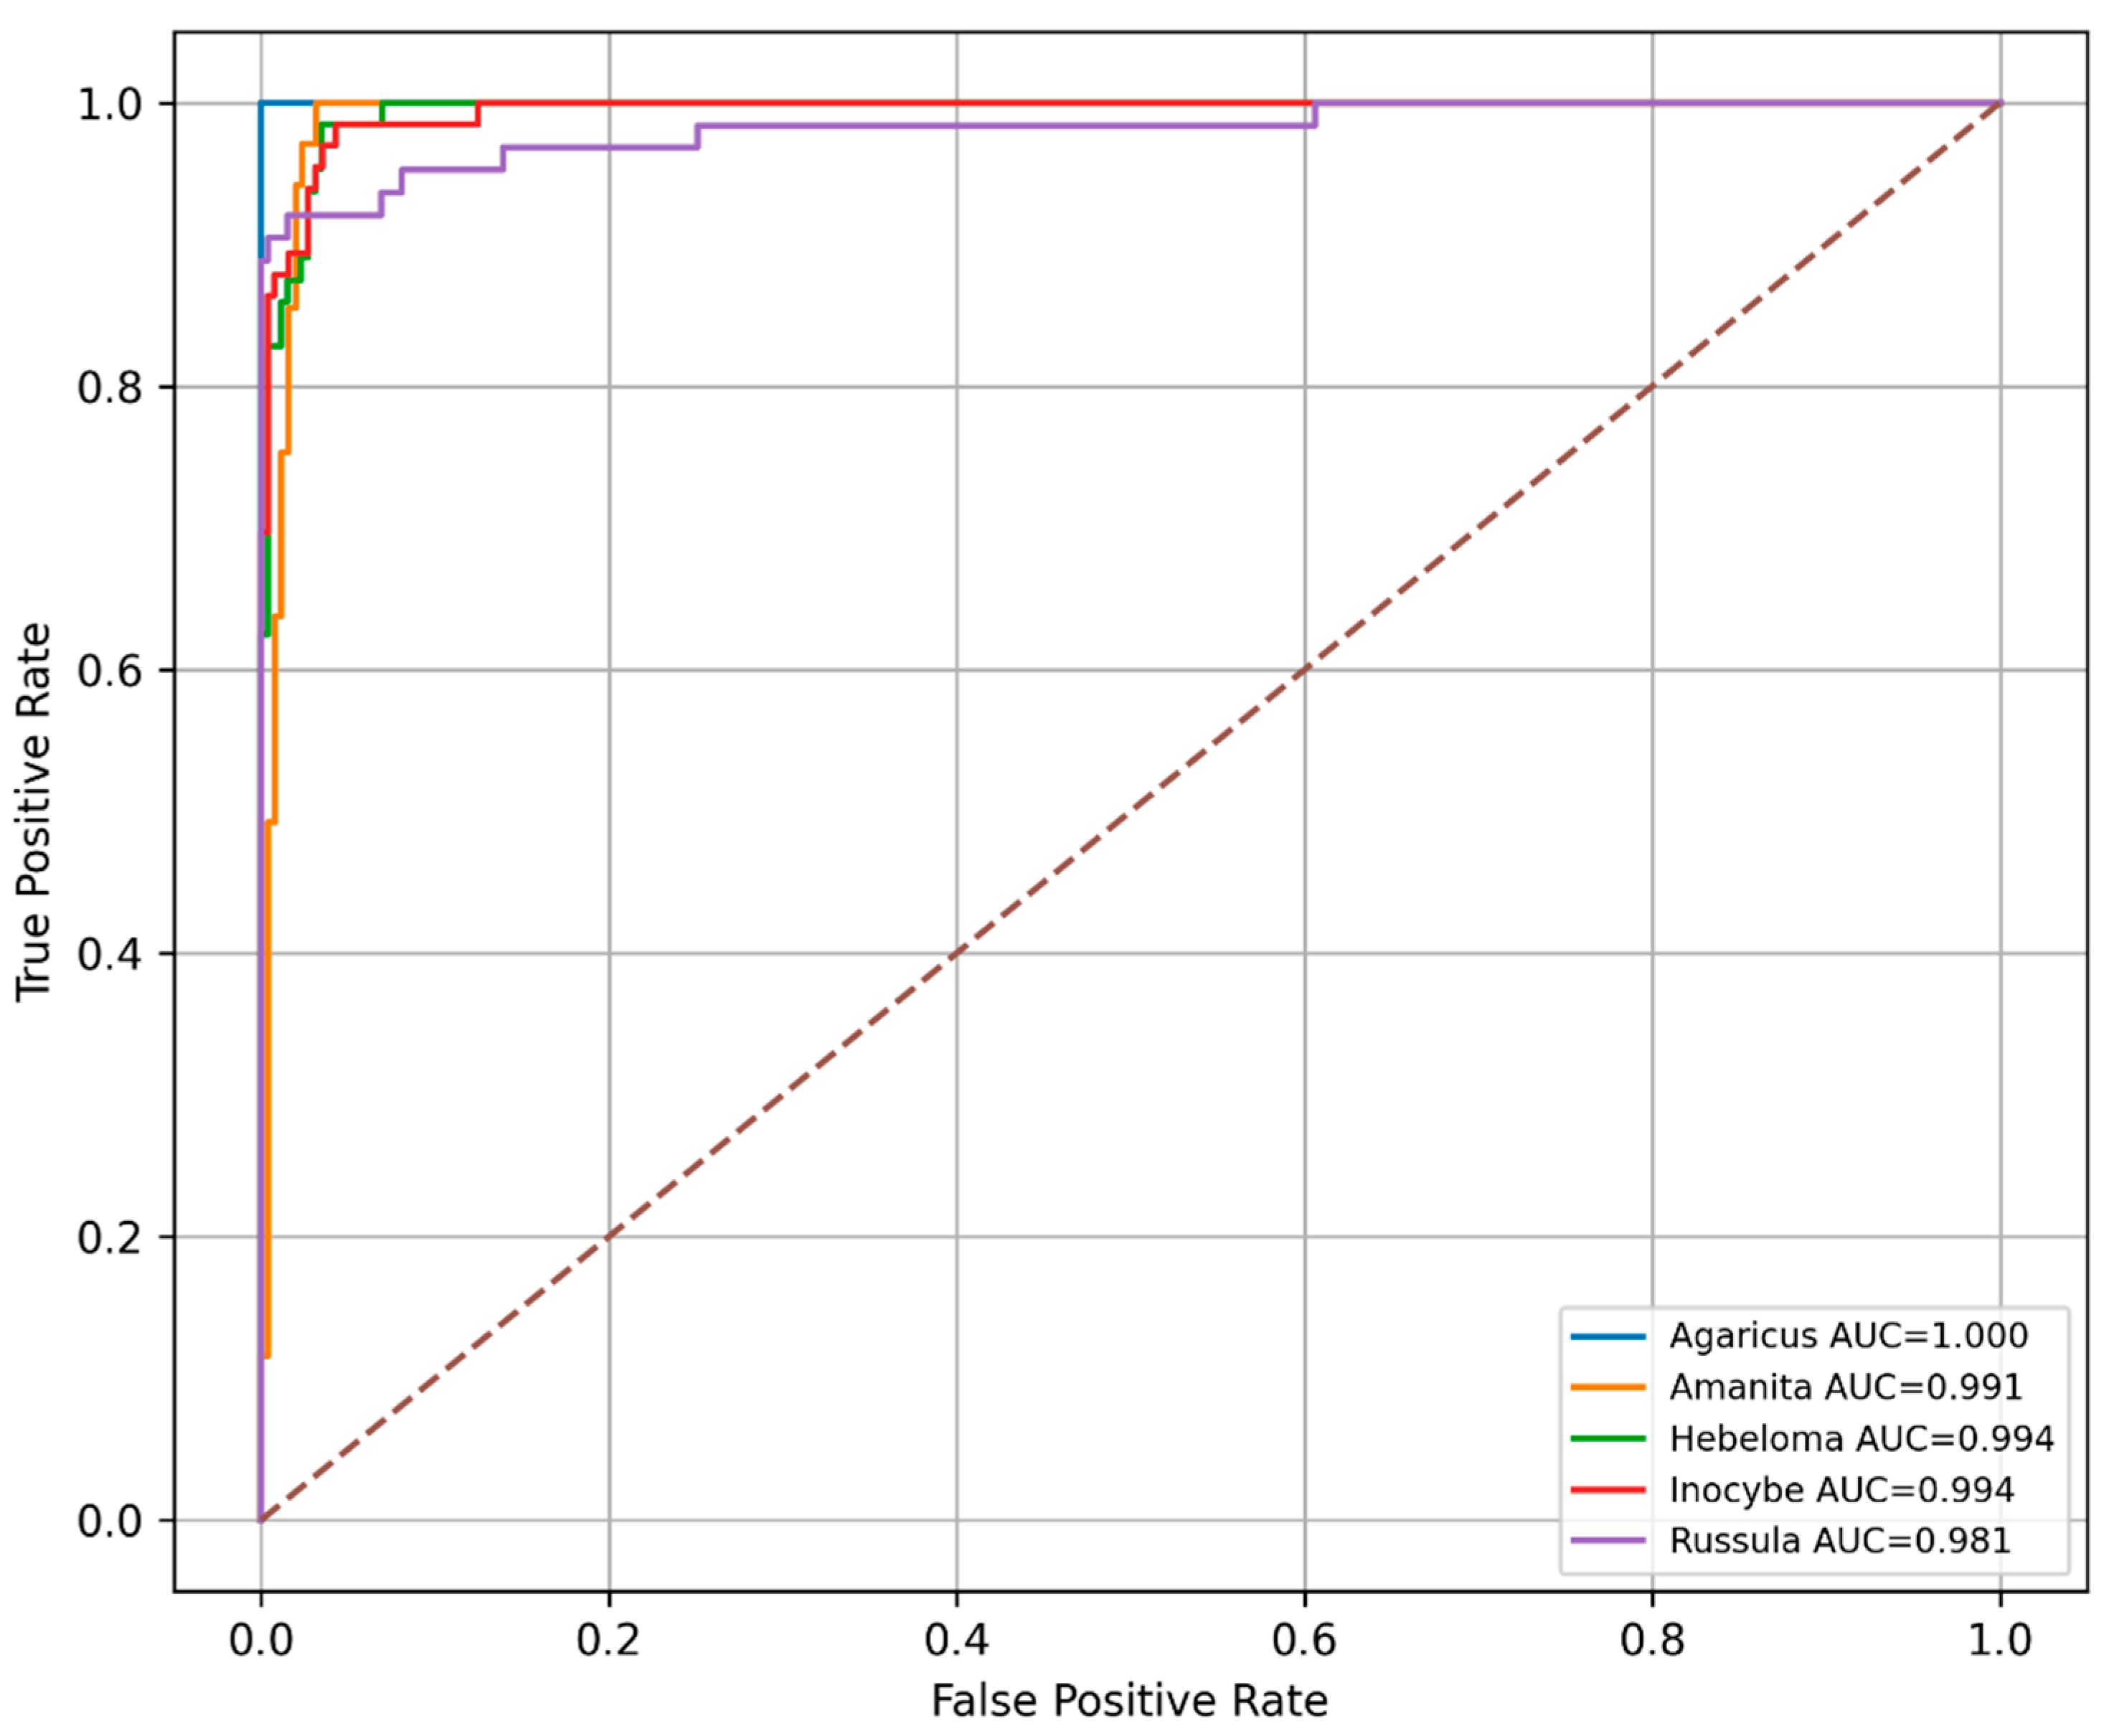
Figure 7 presents the class-based ROC (Receiver Operating Characteristic) curves of the proposed hybrid model. ROC curves demonstrate the relationship between the true positive rate and the false positive rate under varying decision thresholds and are frequently employed to evaluate the model’s capacity to differentiate between classes. The dashed diagonal line in the graph represents the performance of the random classifier, and the curves moving away from this line and closer to the upper left corner indicate more successful classification performance.
A visual examination of the figure reveals that the ROC curves for all classes are situated in close proximity to the upper left corner. This finding indicates that the model possesses the capacity to accurately categorise all macrofungal genera with a high degree of discrimination. The obtained Area Under Curve (AUC) values were calculated as 1.000 for Agaricus, 0.991 for Amanita, 0.994 for Hebeloma, 0.994 for Inocybe, and 0.981 for Russula, respectively.
The Agaricus class exhibited an AUC value of 1.000, indicating that the model possesses the capacity to accurately differentiate specimens belonging to this class from all other classes. In a similar vein, the AUC values of 0.994 obtained for the Hebeloma and Inocybe classes also indicate a very high discrimination success. The AUC value of 0.991 calculated for the Amanita class also demonstrates that the model provides high sensitivity and specificity in this class.
Compared to other classes, the lowest AUC value was obtained in the Russula class (0.981). However, this value is still considered near-perfect classification performance. When evaluated together with the confusion matrix results, it can be said that the performance decrease observed in the Russula class is due to some samples being confused with the Amanita class. However, since these confusions remained at a limited level, there was no significant negative impact on ROC performance.
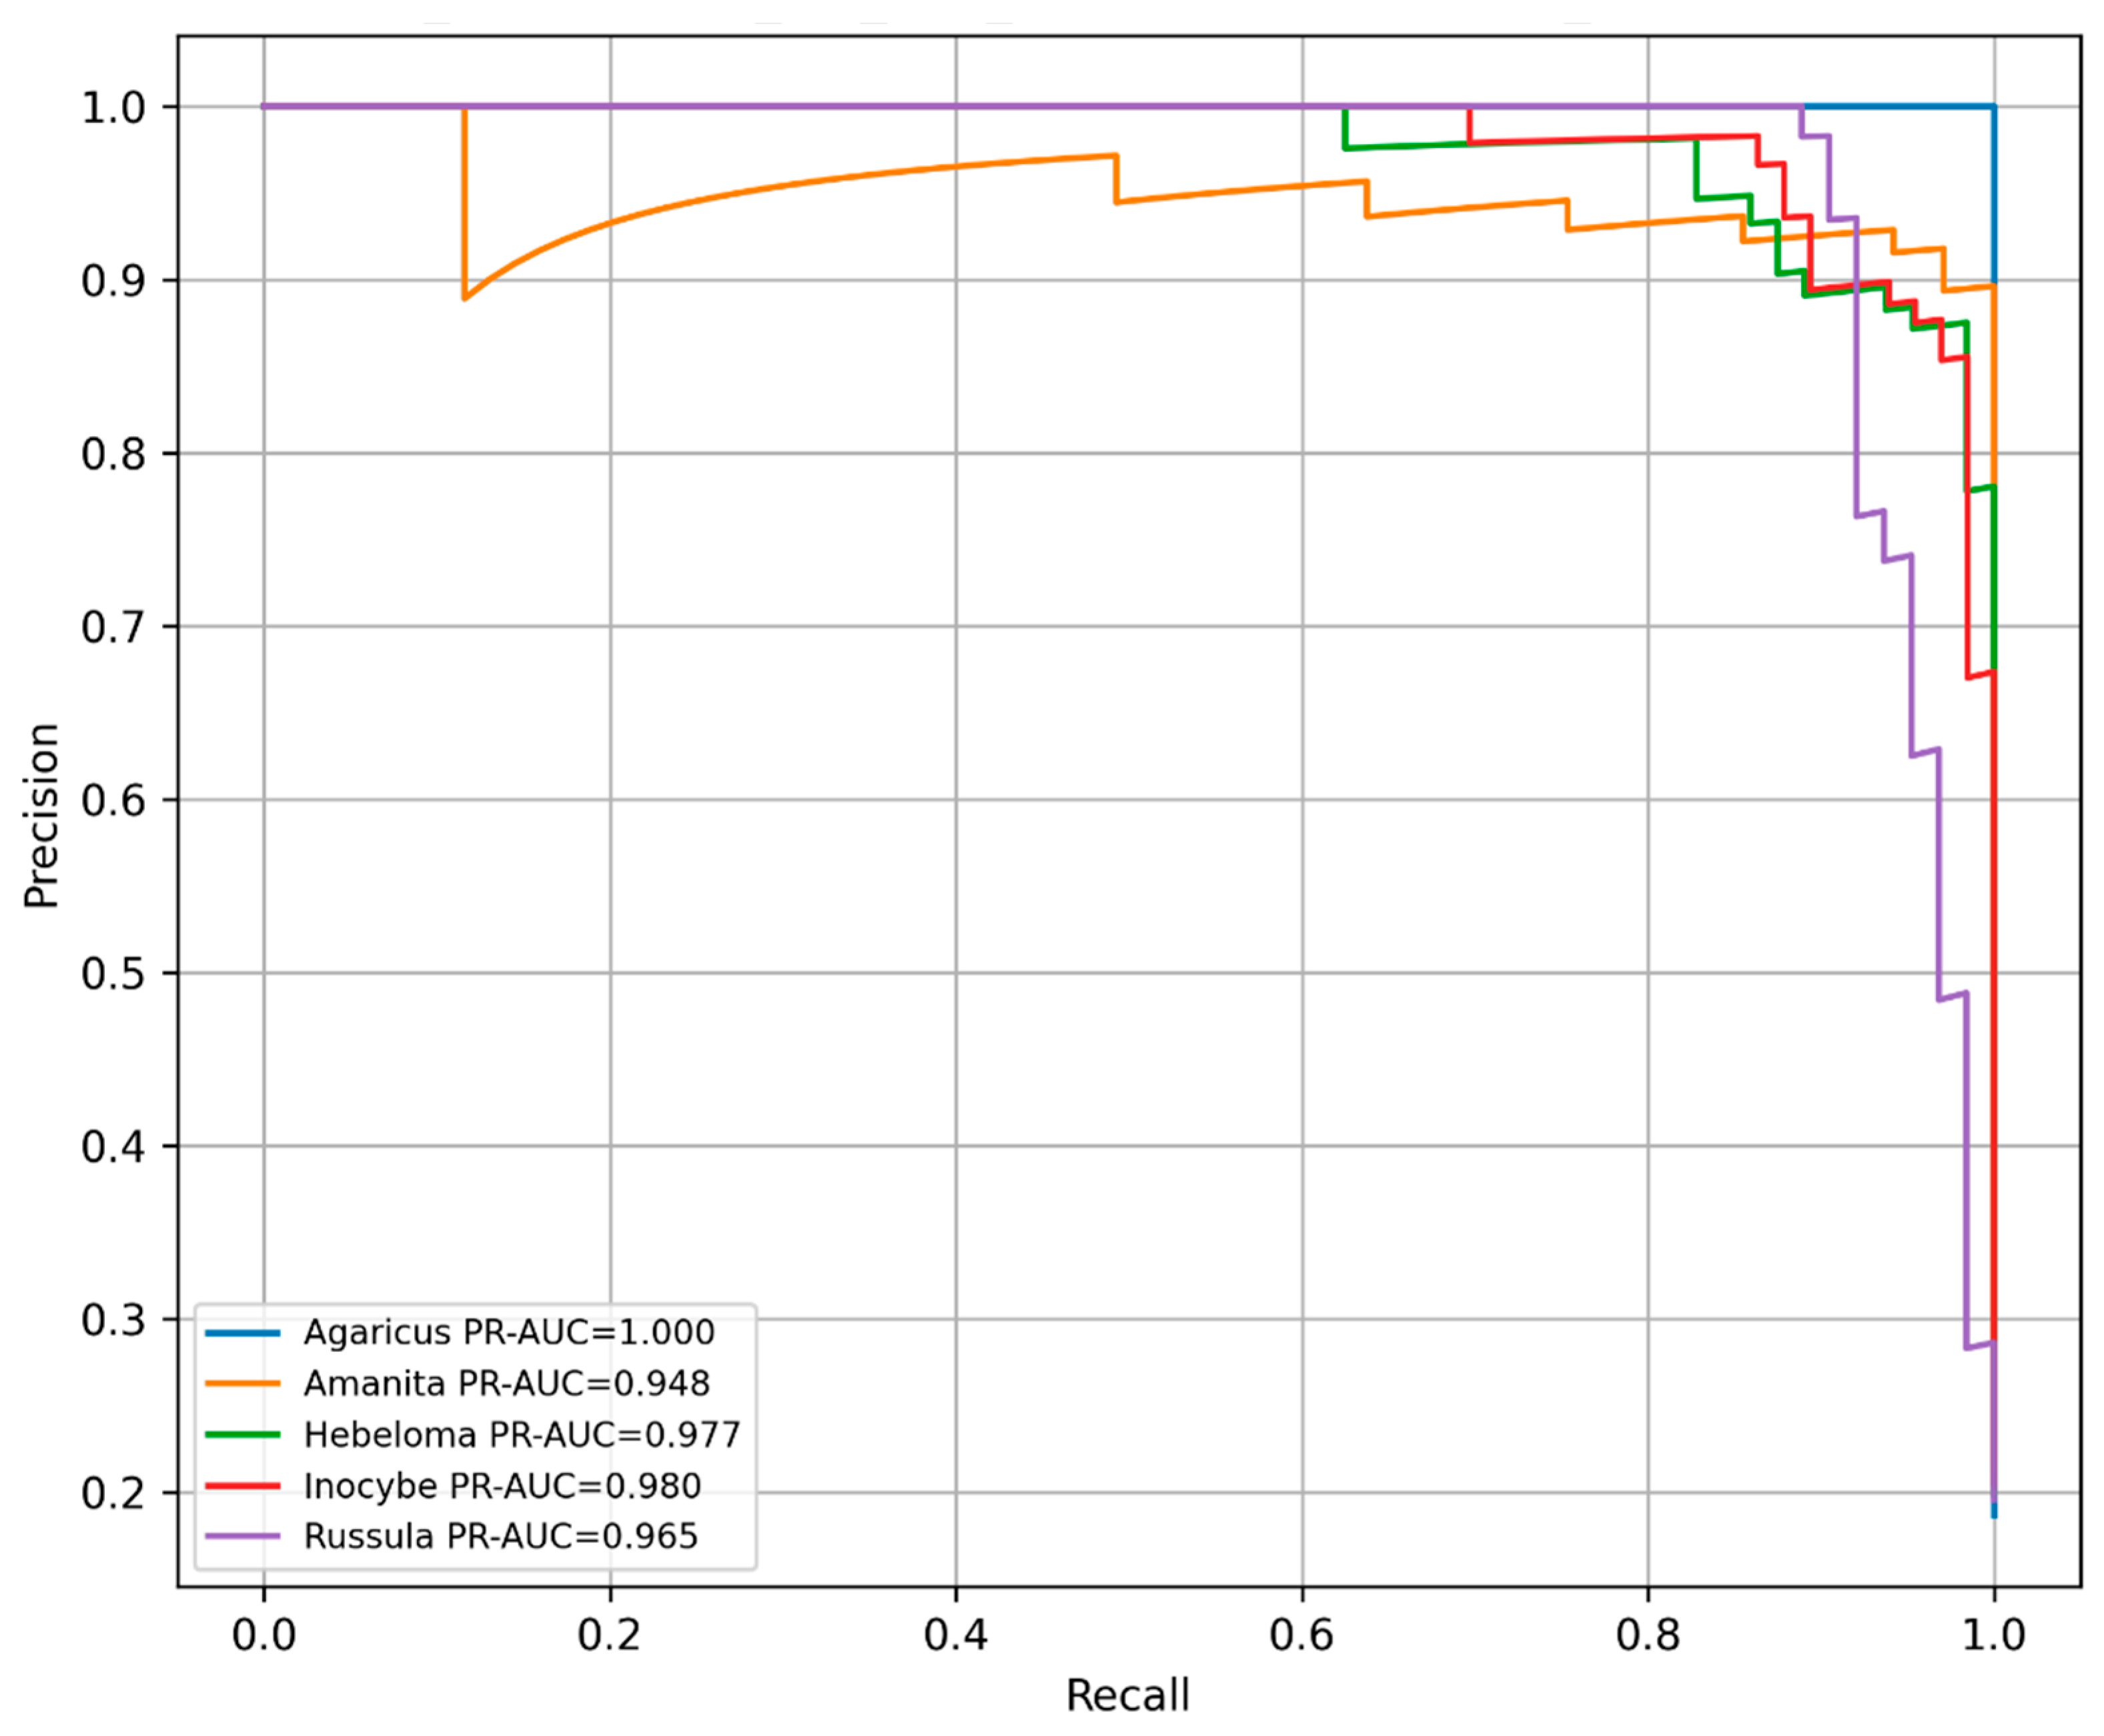
As illustrated in
Figure 8, the class-based Precision-Recall (PR) curves obtained by the proposed InceptionV3 + ViT-B16 + Fusion model on the Fold 3 holdout test set are presented. It has been demonstrated that PR curves provide a superior level of accuracy in the evaluation of model performance when compared with ROC curves, a fact that is especially evident in situations where sample distributions between classes are unequal. The positioning of the curves in close proximity to the upper right corner suggests that high precision values can be maintained even at elevated sensitivity (recall) levels.
Upon examination of the figure, it becomes evident that the PR curves for all classes are concentrated in the upper part of the graph. This finding indicates that the model not only exhibits high precision in its classification but also maintains minimal false positive predictions. The PR-AUC values were calculated as 1.000 for Agaricus, 0.948 for Amanita, 0.977 for Hebeloma, 0.980 for Inocybe, and 0.965 for Russula.
The Agaricus class demonstrated the highest level of performance. The PR-AUC value of 1.000 obtained for Agaricus indicates that the model can distinguish specimens belonging to this class from all other classes without error. This outcome is consistent with the 100% classification success observed in the confusion matrix analysis.
The PR-AUC values of 0.977 and 0.980 were obtained for the Hebeloma and Inocybe classes, respectively. In both classes, the majority of the curves fall within the high precision and recall region, indicating that the model successfully distinguishes between these classes. However, the confusion observed between Hebeloma and Inocybe in the confusion matrix may explain why the PR-AUC values in these two classes are marginally lower than in the Agaricus class.
The PR-AUC value of 0.948 calculated for the Amanita class, while the lowest among all classes, corresponds to a very high performance. In a similar vein, the PR-AUC value of 0.965 obtained for the Russula class demonstrates a high degree of classification success. The more pronounced decrease in the Russula curve in the high recall regions can be attributed to false positive and false negative predictions resulting from the confusion of some Russula samples with the Amanita class.
It is evident that the PR-AUC values exceed 0.94 for all classes, thereby signifying that the model effectively balances between high sensitivity and high accuracy. The mean PR-AUC value of approximately 0.974 indicates that the proposed hybrid architecture reliably distinguishes spore images from different fungal genera. When evaluated in conjunction with ROC curves and confusion matrix results, it can be concluded that the combination of local morphological features learned by InceptionV3 with global contextual representations learned by Vision Transformer via bottleneck fusion and SE-based attention mechanisms significantly contributes to classification performance. These findings lend support to the hypothesis that the proposed model demonstrates strong generalisation capabilities, even when applied to previously unseen biological samples.
4.5. Ablation Study
In order to evaluate the contribution of each component in the proposed architecture, an ablation study was conducted by systematically removing or modifying the core components of the model. In this context, the effects of hybrid structure, feature fusion, and attention mechanisms were examined separately; the individual and combined contributions of these components to classification performance were analysed.
As illustrated in
Table 8, the average performance results obtained by the InceptionV3-based hybrid architectures on the holdout test set are presented. A thorough examination of the results indicates that the employment of diverse hybridisation strategies exerts a substantial influence on the efficacy of the model. While all models generally produced high values for Area Under the Curve (AUC) and Precision-Recall AUC (PR-AUC), significant differences emerged in terms of accuracy, F1-Macro, and Matthews Correlation Coefficient (MCC).
The core CNN model, InceptionV3, demonstrated strong initial performance with 85.61% accuracy, 85.34% F1-Macro, and 0.8258 MCC. In contrast, the InceptionV3 + ViT-B16 model, created by adding only the Vision Transformer component, demonstrated a slight decrease in accuracy (83.85%) and F1-Macro (83.18%). This finding suggests that combining CNN and Transformer features in isolation does not result in a performance enhancement, indicating a need for more effective integration of diverse feature representations.
The most successful results were obtained with the InceptionV3 + ViT-B16 + Fusion model. The model achieved 92.13% accuracy, an F1-Macro value of 92.12%, and an MCC value of 0.9040. These outcomes surpass those achieved by other architectures across all evaluation criteria. Furthermore, the 0.9896 AUC-Macro and 0.9684 PR-AUC Macro values demonstrate the model’s high power of discrimination between classes. The findings demonstrate that local morphological features acquired by CNNs and global contextual representations learned by Vision Transformers can be efficiently integrated through a bottleneck-based fusion mechanism. The InceptionV3 + ViT-B16 + Attention model, developed to evaluate the effect of the attention mechanism alone, provided a significant performance increase compared to the basic hybrid model. The model demonstrated an accuracy of 87.68%, along with an MCC value of 0.8516, thus yielding superior outcomes in comparison to both the fundamental InceptionV3 and the direct InceptionV3 + ViT-B16 architecture. This finding demonstrates that the attention mechanism can positively contribute to classification performance by highlighting distinctive features.
However, the InceptionV3 + ViT-B16 + Fusion + Attention model, which employs both Fusion and Attention mechanisms, did not yield the optimal performance, contradicting prevailing assumptions. Despite attaining the highest AUC-Macro value of 0.9907, the model exhibited inferior accuracy (86.96%), F1-Macro (86.63%), and MCC (0.8457) metrics when compared with the model using only fusion. This finding indicates that, within the existing dataset and architectural framework, the addition of the attention mechanism after fusion does not result in a discernible enhancement in performance. In certain instances, this approach may even introduce unnecessary reweighting in the feature representation.
Overall, the results indicate that the primary source of performance improvement is not the addition of the Vision Transformer component, but rather the integration of CNN and Transformer features through an appropriate fusion strategy. Specifically, the bottleneck-based fusion approach significantly improved classification success by more effectively combining information from different feature spaces. Therefore, the InceptionV3 + ViT-B16 + Fusion architecture was selected as the proposed final model for this study, and subsequent analyses were conducted using this structure.
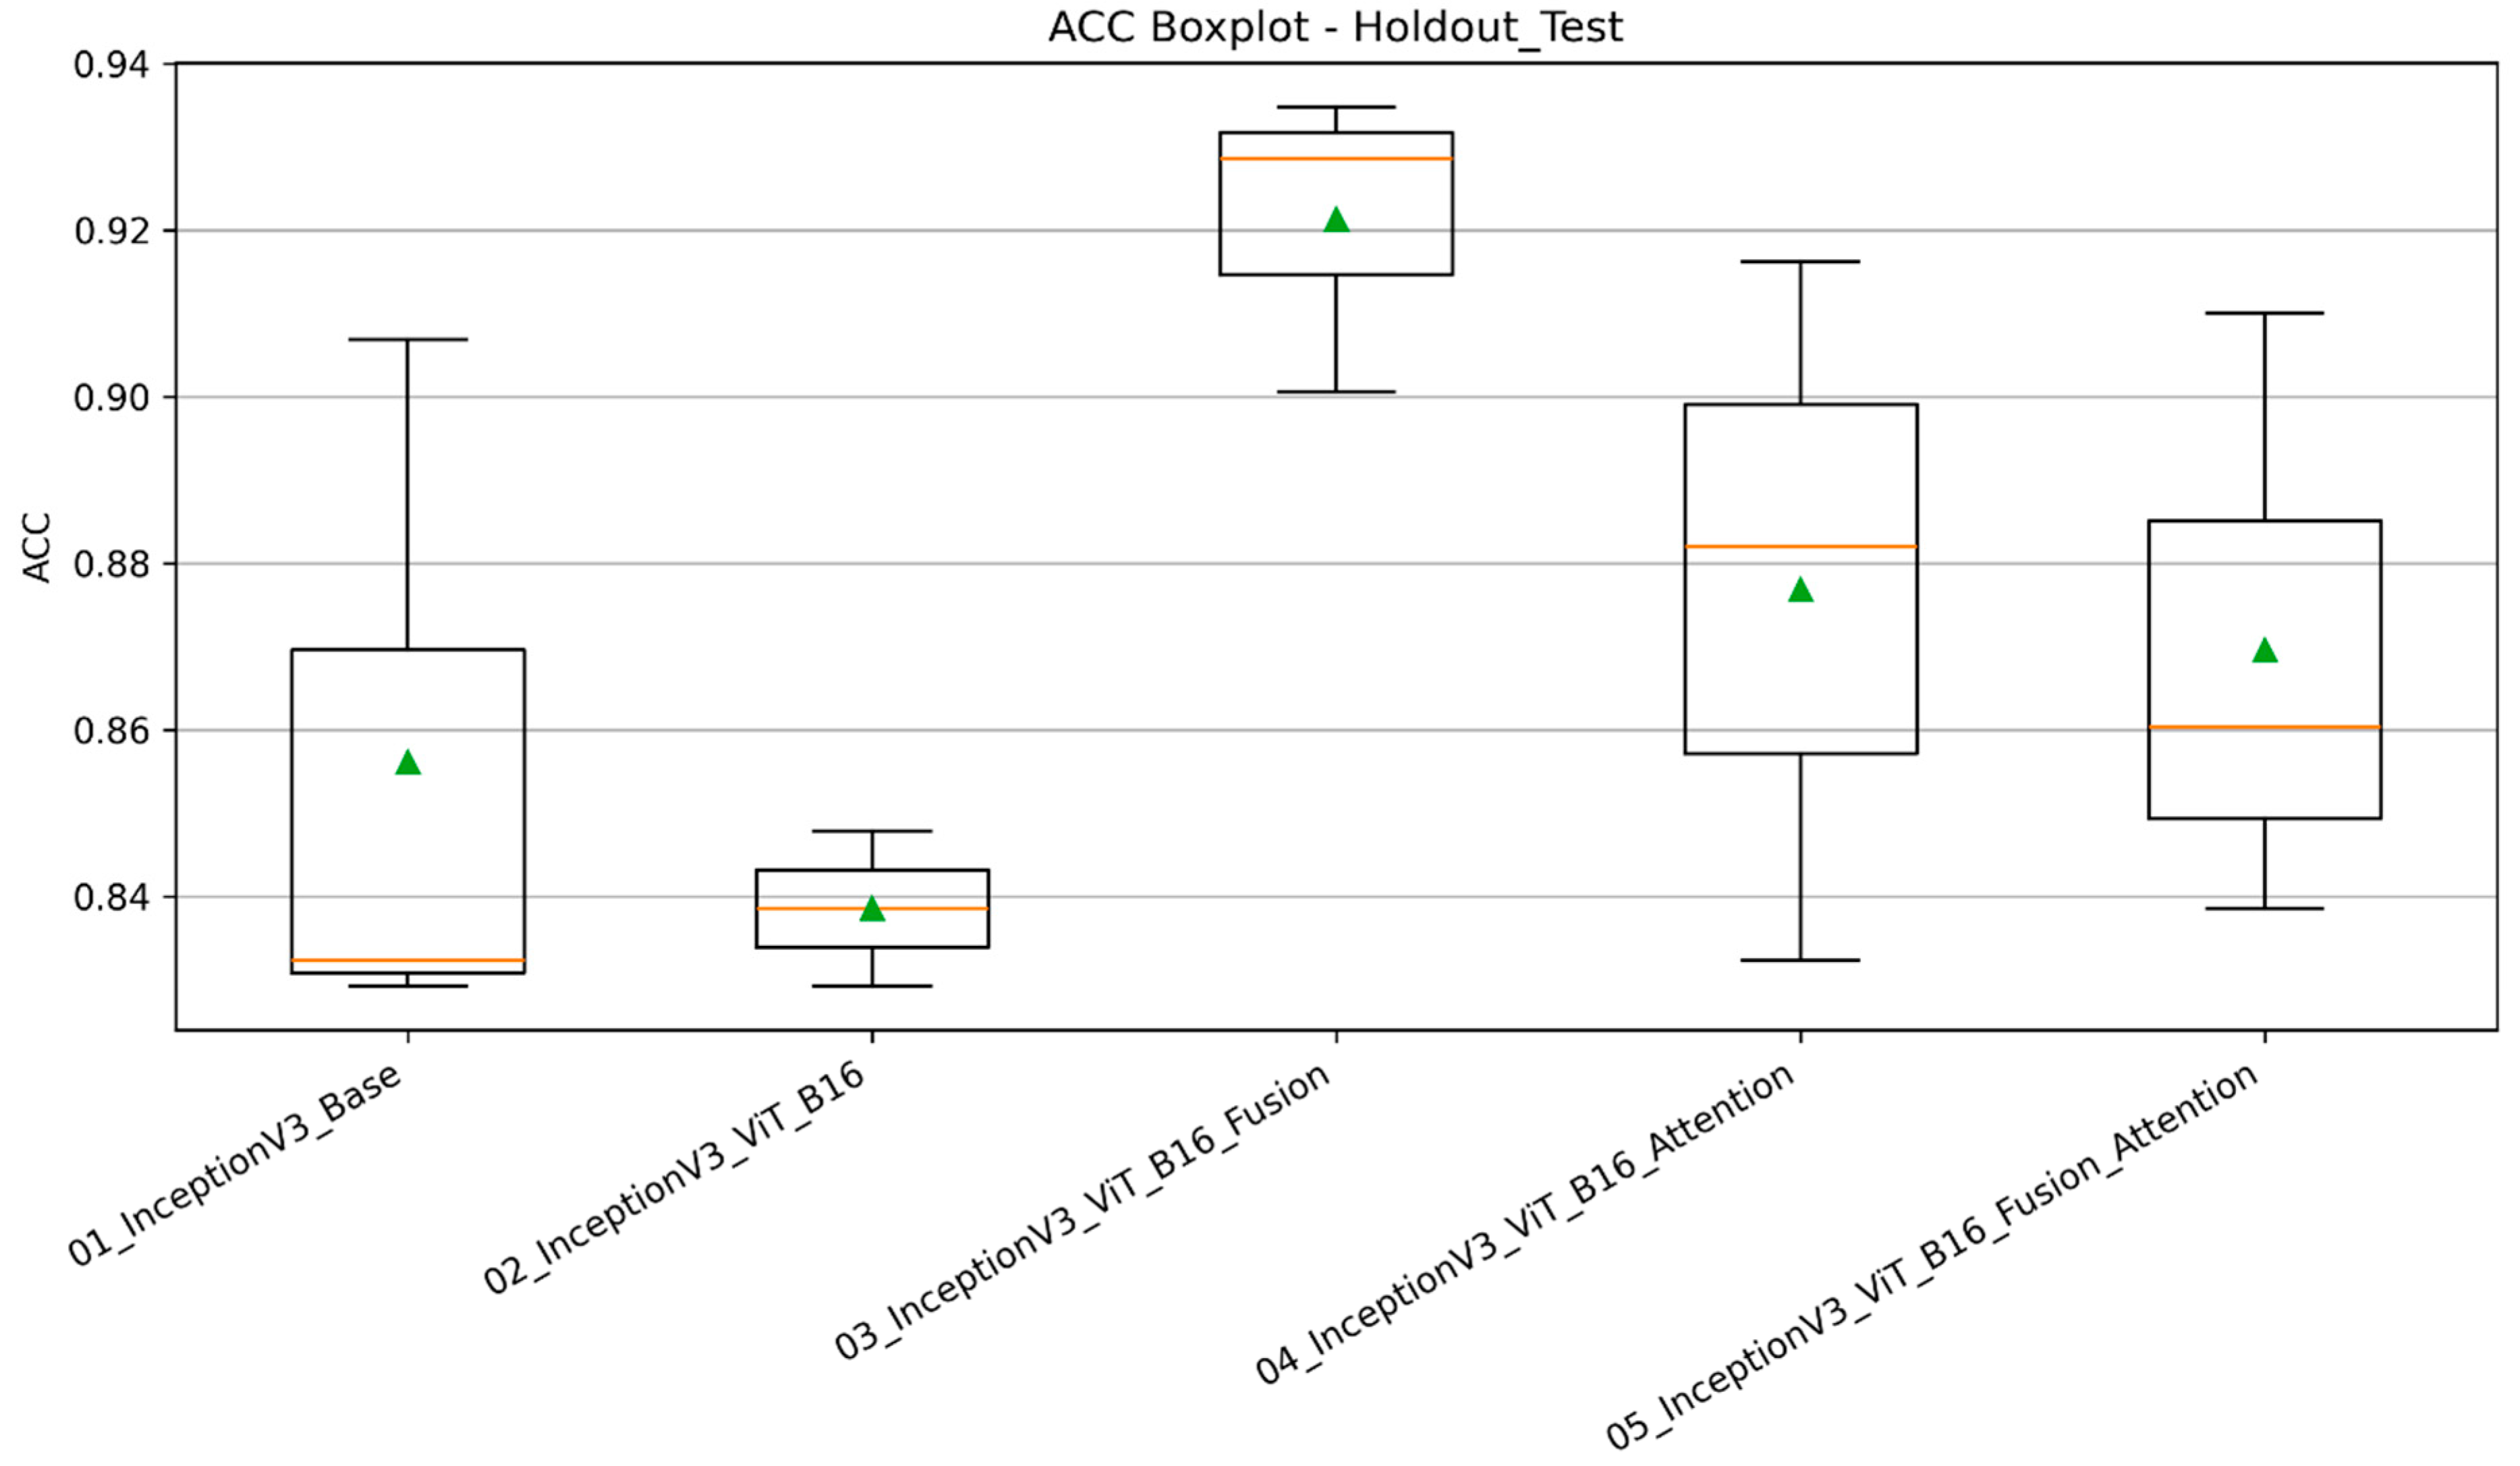
As illustrated in
Figure 9, the 3-fold holdout test accuracy (ACC) results for InceptionV3-based hybrid architectures are presented in the form of box plots. Box plots are a visual representation of the central tendency and variability of performance across different folds. This methodology allows for the evaluation of not only the accuracy levels but also the stability of the models. An analysis of the figure reveals that the InceptionV3 + ViT-B16 + Fusion model demonstrates the highest median accuracy value. The accuracy values of this model are concentrated in the approximately 90–94% range, exhibiting a higher performance level than all other models. In addition, the relatively narrow box and whiskers indicate that the model can produce consistent results across different folds. This observation is consistent with the 92.13% mean accuracy and 0.9040 MCC value reported in
Table 8.
A comparison of the InceptionV3 model with the hybrid model created by adding only ViT-B16 reveals that the accuracy distributions are largely similar. Furthermore, the finding that the median accuracy of the InceptionV3 + ViT-B16 model does not demonstrate a significant advantage over the base model lends support to the hypothesis that the direct incorporation of Vision Transformer features does not result in a performance enhancement. This finding demonstrates that in hybrid architectures, merely combining different feature sources is insufficient; these features must be combined through an appropriate integration mechanism.
The InceptionV3 + ViT-B16 + Attention model, which employs the Attention mechanism, demonstrated higher accuracy levels in comparison to the basic hybrid model. However, it should be noted that the dispersion of the Attention model is wider than that of the Fusion model. This finding suggests that the attention mechanism has the potential to enhance performance, though it may also yield more variable outcomes across folds.
When the model using both Fusion and Attention components was examined, it was observed that the accuracy distribution maintained a moderate level, exhibiting a resemblance to the Attention model. While the median accuracy value is higher than that of the basic model, it is lower than that of the model using only Fusion. This finding indicates that the use of Fusion and Attention components in conjunction does not yield a discernible performance enhancement when evaluated against the present dataset and architectural framework.
The box plots demonstrate that the InceptionV3 + ViT-B16 + Fusion model consistently yields the highest accuracy and most stable performance. The findings indicate that the enhancement in performance is not attributable to the incorporation of the Vision Transformer component, but rather to the efficacious integration of CNN and Transformer representations with the bottleneck-based fusion mechanism. Consequently, the InceptionV3 + ViT-B16 + Fusion architecture can be regarded as the most effective hybrid model for the study with regard to accuracy and stability.
4.6. Exploratory Statistical Analysis
In machine learning and deep learning studies, performance is often reported using mean values obtained across different data partitions. However, statistical comparisons must be interpreted cautiously when the number of independent observations is limited. Therefore, in this study, the Friedman and Wilcoxon signed-rank tests were used not as confirmatory evidence, but as exploratory analyses of performance trends among models. The results were interpreted in light of the limited statistical power of the specimen-level three-fold experimental design.
The analyses were performed using results obtained under the specimen-level three-fold Stratified Group K-Fold validation strategy. The evaluated metrics were ACC, F1-Macro, Matthews Correlation Coefficient (MCC), AUC-Macro, and PR-AUC Macro.
The results of the Friedman test are presented in
Table 9. The results of the study indicate that no statistically significant differences were observed in any of the evaluated metrics at the 95% confidence level (
p > 0.05). The lowest p-value was obtained in the PR-AUC Macro metric (
p = 0.0595), yet this value also remained above the traditional significance threshold.
These results should be interpreted in the context of the study design. To prevent data leakage, specimen-level rather than image-level splitting was applied, ensuring that images from the same biological specimen were not placed in different folds. Although this strategy provides a more realistic performance assessment, it yields only three independent fold results for each model. Because the statistical power of the Friedman test depends directly on the number of observations, analyses based on only three observations have limited ability to detect true performance differences.
Moreover, the dataset contains 50 biological specimens, and natural variation among specimens may contribute to variability across folds. Therefore, the absence of statistically significant results should not be interpreted as evidence that the models perform equivalently. Rather, it indicates that the current sample size is insufficient to establish potential performance differences among models with high confidence.
Subsequent to the Friedman test, the Wilcoxon signed-rank test was employed to analyse the pairwise comparisons between the proposed InceptionV3 + ViT-B16 + Fusion model and alternative architectures. The results of the study are presented in
Table 10.
The Wilcoxon test results indicated that no statistically significant difference was found between any pair of models after multiple comparison corrections (p > 0.05). As with the Friedman test, the Wilcoxon test was performed on only three paired fold results. This has a considerable impact on the test’s capacity for discrimination and statistical strength.
Consequently, the Wilcoxon test results should not be interpreted as confirmatory statistical evidence, but rather as complementary analyses aimed at exploratory evaluation of performance differences between models. While numerical performance disparities were evident, the present experimental design is inadequate to unequivocally ascertain whether these disparities genuinely signify superior performance or are attributable to natural variation resulting from the sampling process.
It is important to note that the statistical analyses presented in this section are exploratory in nature, rather than confirmatory. Subsequent studies utilising datasets comprising larger biological samples, a greater number of independent validation studies, and external validation sets will facilitate the evaluation of performance disparities between models with greater statistical power.
4.7. Grad-CAM-Based Visual Explainability Analysis
Although deep learning models can provide high classification performance, a significant disadvantage is that their decision-making mechanisms often operate in an uninterpretable “black box” manner. Especially in fields relying on expert interpretation, such as biological image analysis, examining which regions of the image the model focuses on when making decisions is crucial. Therefore, to visualize the decision-making mechanism of the InceptionV3 + ViT-B16 + Fusion model proposed in this study, the Gradient-weighted Class Activation Mapping (Grad-CAM) method was used.
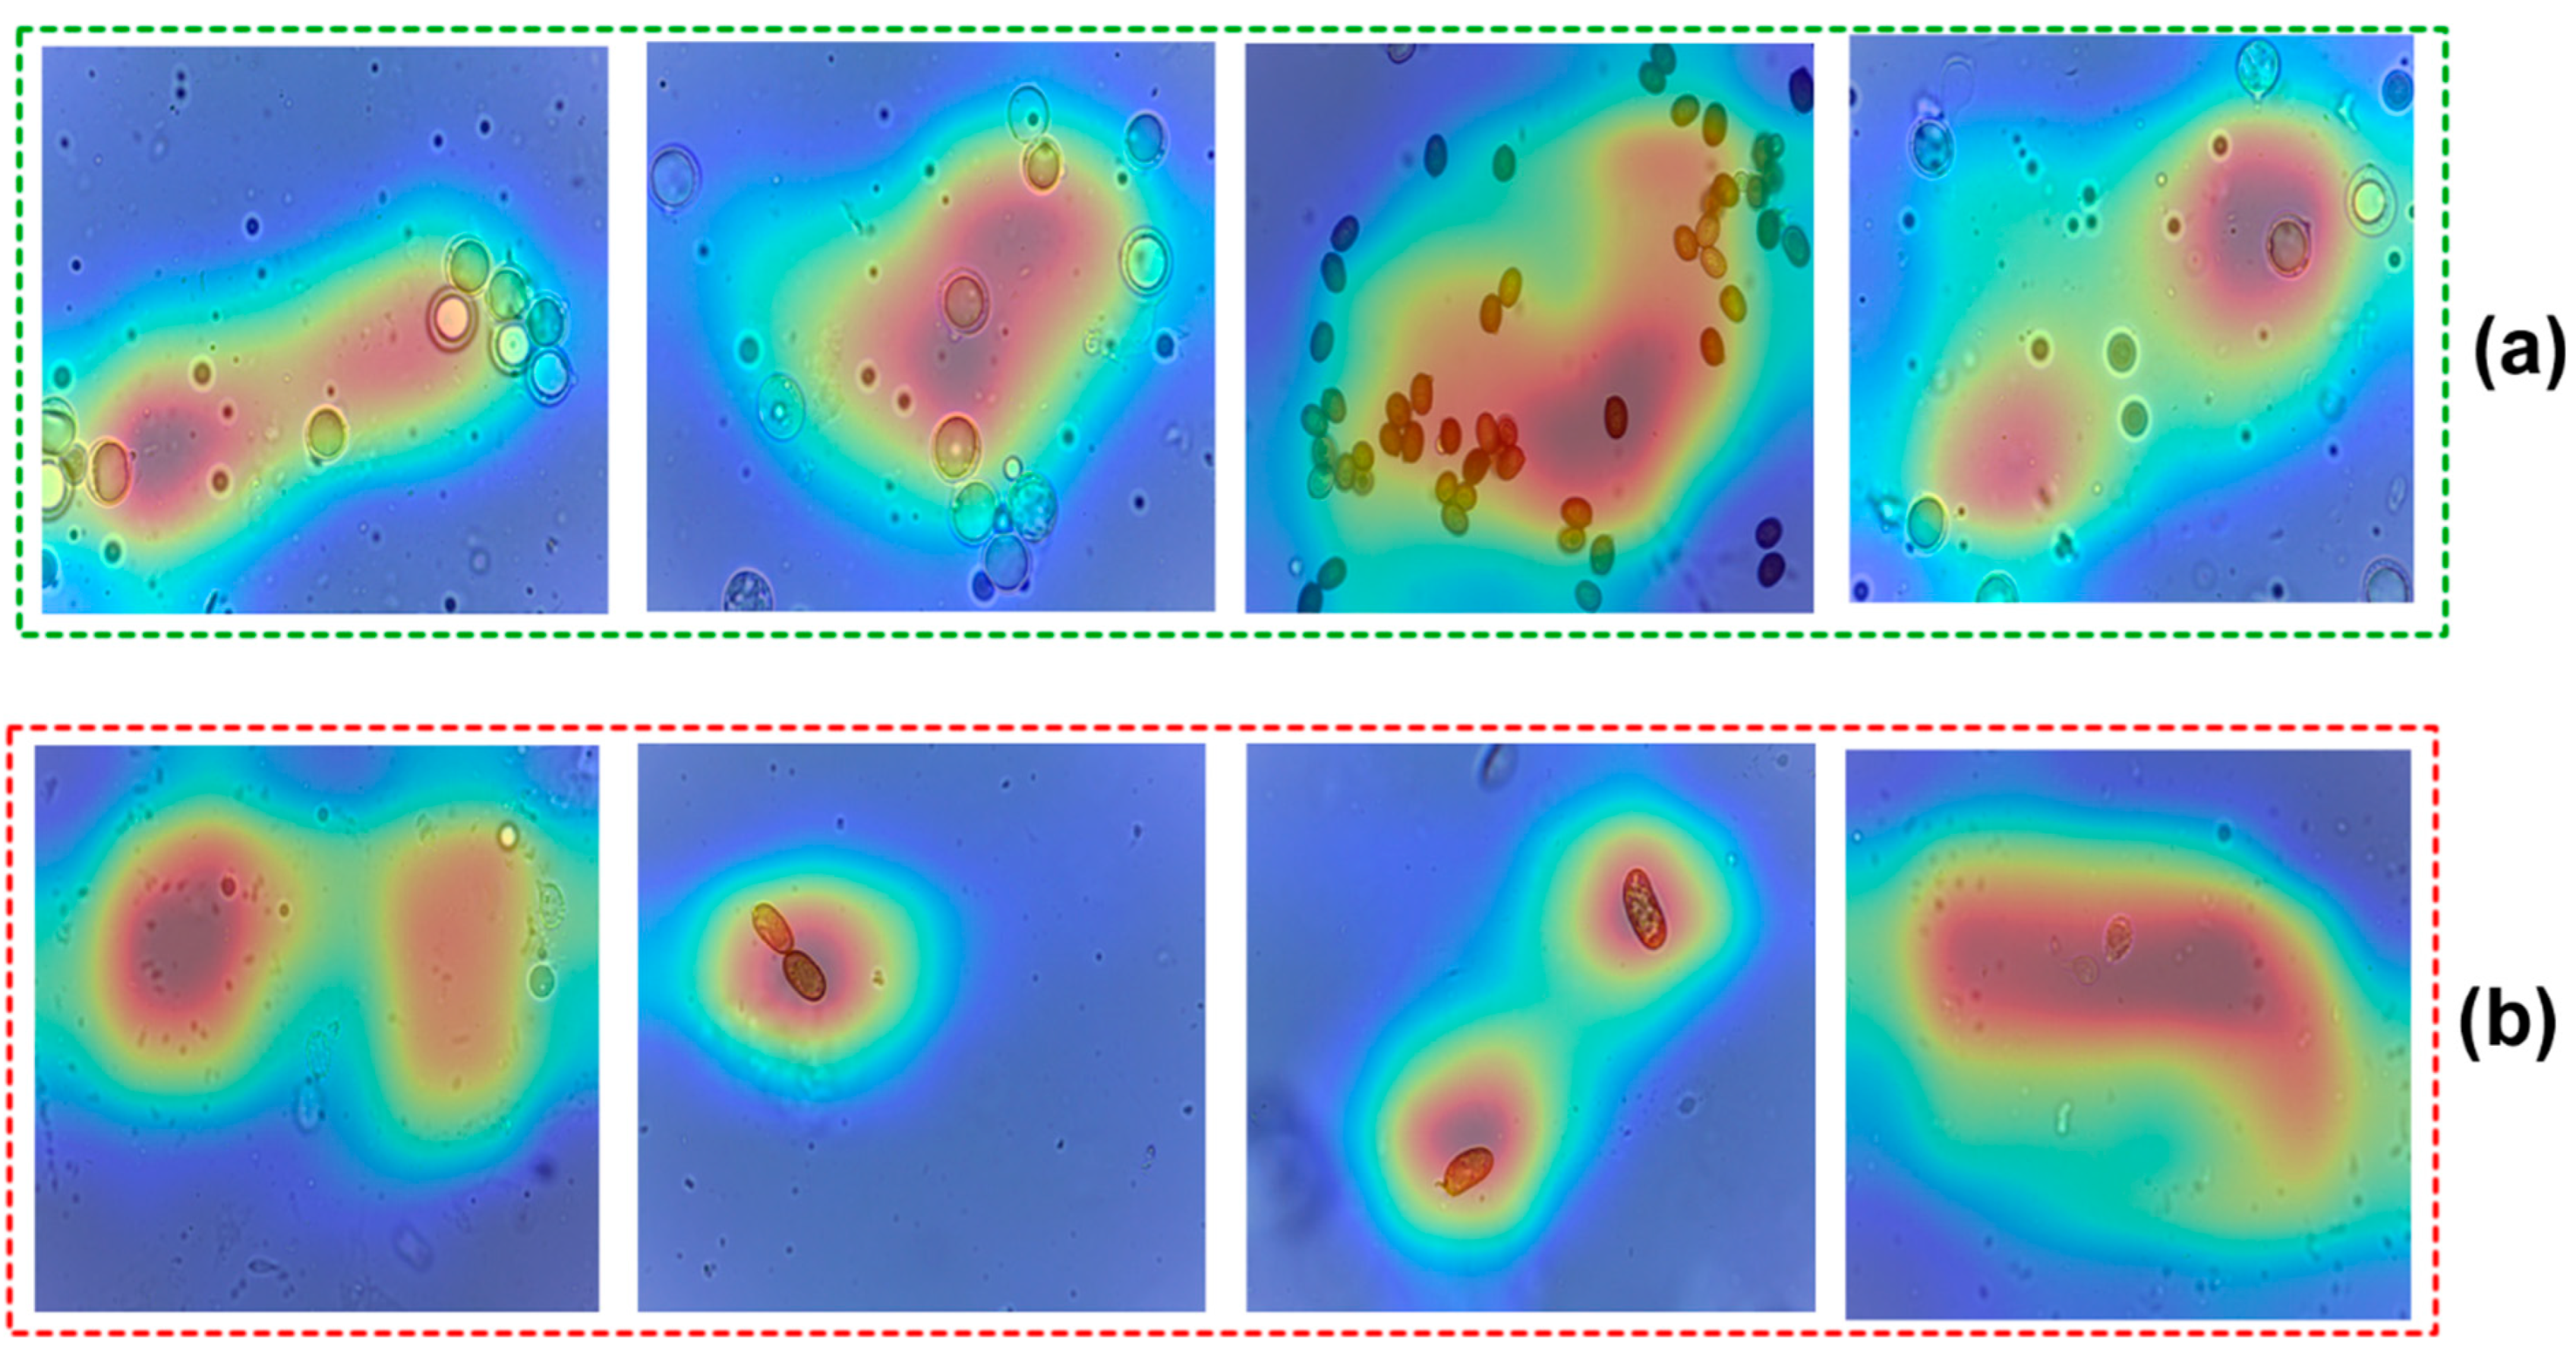
As illustrated in
Figure 10, the Grad-CAM visualisations were used to explain the classification decisions of the proposed InceptionV3 + ViT-B16 + Fusion model. The top row (a) displays the activation maps of correctly classified samples, while the bottom row (b) presents the activation maps of incorrectly classified samples. The use of red and yellow hues indicates the regions that the model prioritises during the decision-making process, while blue tones represent regions that contribute less significantly to this process.
A detailed examination of the correctly classified samples reveals that the model’s attention is predominantly directed towards regions exhibiting spore clusters. The activation regions are found to largely coincide with the shape, contours, and distribution areas of basidiospores. The presence of elevated activation values, notably in regions exhibiting high spore density, indicates that the model’s classification decision is based on biologically relevant micromorphological characteristics. This finding further supports the hypothesis that the model employs distinctive features that are directly related to spore structures, rather than relying on image backgrounds or random patterns.
Conversely, activation maps show a more dispersed pattern in misclassified samples. In certain samples, the model’s focus is only on a single spore or a specific region of the image, while in others, the surrounding background areas are also encompassed within the activation. This finding suggests that the model may be prone to making erroneous decisions by focusing on features that are not sufficiently distinctive for the relevant class. It is particularly noteworthy that activation regions become wider and less specific in images where spore density is low or where spores are morphologically similar to each other.
The Grad-CAM results demonstrate that the decision-making mechanism of the proposed hybrid architecture is predominantly informed by biologically significant regions. The observed concentration of activations on spore structures in correct classifications suggests that the model’s high performance is not solely due to data memorisation. Instead, it demonstrates the model’s ability to effectively learn micromorphological features. The activation deviations observed in misclassifications provide explanatory information about the possible causes of confusion, especially among genera showing morphological similarities. These findings serve to enhance the interpretability of the proposed model and support the reliability of the classification results obtained.
5. Discussion
The present study investigates a hybrid CNN-Transformer-based deep learning approach to evaluate the potential for automated pre-classification at the genus level from basidiospore micrographs of selected macrofungal genera. The study’s primary objective is not the proposal of a system to replace the classical taxonomic identification process. Rather, it should be regarded as a controlled experimental framework designed to test the extent to which machine learning models are capable of producing discriminative representations of standard light microscopy images.
The preliminary evaluation of the baseline models showed that different deep learning architectures captured micromorphological patterns in basidiospore images to varying degrees. Among the models examined, InceptionV3 produced strong and balanced results for key metrics such as accuracy, F1-score, and MCC, and was therefore selected as the CNN backbone for subsequent hybrid architecture experiments. In contrast, although ViT-B/16 achieved high area under the curve (AUC) values, it lagged behind CNN-based models for some performance metrics. These findings suggest that integrating local texture patterns with global structural relationships may be important for basidiospore image classification.
Ablation analyses were conducted comparing the InceptionV3, InceptionV3 + ViT-B16, InceptionV3 + ViT-B16 + Fusion, InceptionV3 + ViT-B16 + Attention, and InceptionV3 + ViT-B16 + Fusion + Attention configurations. The findings indicated that the InceptionV3 + ViT-B16 + Fusion model demonstrated the optimal performance. Specifically, an evaluation of the integration of CNN and Transformer-based features, in conjunction with an appropriate fusion strategy, revealed a potential enhancement in classification performance, as evidenced by the analysis of accuracy, F1-score, MCC, ROC-AUC, and PR-AUC results. Conversely, the incorporation of the attention mechanism did not consistently yield enhanced performance across all scenarios. In certain configurations, performance remained comparable to the baseline.
The statistical analysis results indicated that when interpreting the observed performance differences between the models, it is necessary to consider not only the average performance values, but also the variations and fold-based behaviours. Consequently, the findings suggest that, rather than indicating the absolute superiority of a specific architecture, the feature integration strategy employed may depend on the dataset and problem structure.
When ROC curves, PR curves, confusion matrices, and Grad-CAM analyses were evaluated in conjunction, it was found that the models exhibited higher discriminative power, particularly in the Agaricus, Amanita, and Inocybe classes. However, a certain degree of confusion was observed between the Hebeloma and Inocybe classes, and the Russula and Amanita classes. These error patterns may be attributable to the overlap of some basidiospore morphological features of the relevant genera, or they may have been influenced by biological variation in the dataset and imaging conditions. The Grad-CAM results indicated that the models concentrated on taxonomically significant micromorphological areas, such as spore contours, surface structures, and ornamentation regions, when making decisions. However, these findings require further validation through the use of larger datasets, diverse imaging protocols, and independent external validation sets.
The present study demonstrates that deep learning-based microscopic image analysis can be investigated as an auxiliary pre-classification tool in the field of fungal taxonomy. While a substantial proportion of earlier research has concentrated on macroscopic fungal images or various microscopic fungal structures, the present study evaluates basidiospore micrographs in selected macrofungal genera within a controlled experimental framework.
Nevertheless, the study is not without its limitations. The dataset is limited to five selected macrofungal genera, and the images were obtained with a single microscope-camera system and a single preparation protocol. This restricts direct inferences about the model’s performance across wider natural variations. Furthermore, it is important to note that multiple micrographs obtained from the same sample should not be considered entirely independent biological observations.
Furthermore, an independent external test set was not used in this study; the model selection and evaluation process was conducted on the same curated dataset. Consequently, the results should be interpreted as genus-level image classification findings obtained under controlled conditions, rather than as a directly validated system output for practical application areas such as food safety, ecological monitoring, or toxic species differentiation. This study also has some limitations. First, the dataset consists of a total of 50 biological specimens, and all images were obtained under the same preparation and imaging conditions. Second, data augmentation methods were not applied, which may have contributed to the overlearning tendency observed in the training curves. Third, statistical comparisons were performed only on three specimen-based fold results, thus limiting the statistical power of the tests. Therefore, the results of the statistical analysis should be considered exploratory rather than confirmatory. Finally, although an independent holdout test set was used, validating the model on external datasets from different laboratories, imaging systems, and biological collections is important for future studies.
Future studies should evaluate the biological and real-world generalisability of the model more comprehensively using specimen-level validation strategies and independent external test sets obtained with different microscopes, cameras, preparation protocols, operators, geographical sources, and fungal species. Additional taxonomic data sources, including Melzer’s reagent, Congo Red, and molecular validation, may also provide useful biological context for studies targeting species or species-complex-level discrimination.



 ,
,