Article

Rapid P-Wave Moment Magnitude Estimation from Strong-Motion Records: Evidence from the 2025 Marmara Sea Earthquake


1
Department of Geophysics, Faculty of Engineering, Sakarya University, Sakarya 54187, Türkiye
2
Department of Earth Sciences, Durham University, Durham DH1 3LE, UK
*
Author to whom correspondence should be addressed.
Appl. Sci. 2026, 16(12), 6000; https://doi.org/10.3390/app16126000
Submission received: 12 May 2026 / Revised: 9 June 2026 / Accepted: 11 June 2026 / Published: 13 June 2026
(This article belongs to the Section Earth Sciences)

Abstract

The initial seconds after an earthquake are critical for rapid magnitude estimation to support real-time early warning. This study evaluates the determination of P-wave moment magnitude (Mwp) using strong-motion records from the 23 April 2025 Marmara Sea earthquake. High-quality accelerometric data from the Turkish National Strong Motion Network were analysed to extract early P-wave features within the first 3 s after P-wave onset. Results show significant rupture-directivity effects, whereby stations located approximately along the fault strike and rupture-propagation direction recorded larger ground-motion amplitudes and higher station-based Mwp estimates than stations located near nodal directions. The mean Mwp was 6.5 ± 0.2, consistent with the Global Centroid Moment Tensor (GCMT) moment magnitude estimate. Magnitude estimation was achievable within 8–20 s of P-wave arrival, confirming the method’s real-time applicability. Our findings demonstrate that strong-motion P-wave analysis can provide rapid and reliable magnitude estimates suitable for earthquake early warning, tsunami warning, and rapid-response applications. In the Marmara Sea region, where tsunami arrival times may be on the order of 20–30 min and critical infrastructure is concentrated in densely populated coastal areas, rapid determination of magnitude within seconds of earthquake initiation can provide valuable information for emergency management and hazard mitigation decisions.

1. Introduction

Rapid estimation of earthquake magnitude immediately after P-wave detection is an important component of earthquake early-warning (EEW) systems. Although the earthquake rupture has already begun by the time the first P-waves are recorded, rapid characterisation of event size can provide useful information before the arrival of stronger S waves and surface waves at more distant locations, thereby enabling automated protective actions and supporting tsunami-warning and emergency-response operations [1,2,3]. Conventional approaches, which rely on S-waves or full-waveform inversions, require much longer—often tens of seconds to several minutes—thereby reducing their effectiveness for rapid alerts to near-field events. Recent advances in seismic data processing, real-time waveform analysis, and the expansion of dense seismic and strong-motion networks have enabled the extraction of magnitude-related information from the earliest portion of P-wave recordings, supporting rapid earthquake characterisation and early-warning applications [4,5,6,7,8,9].
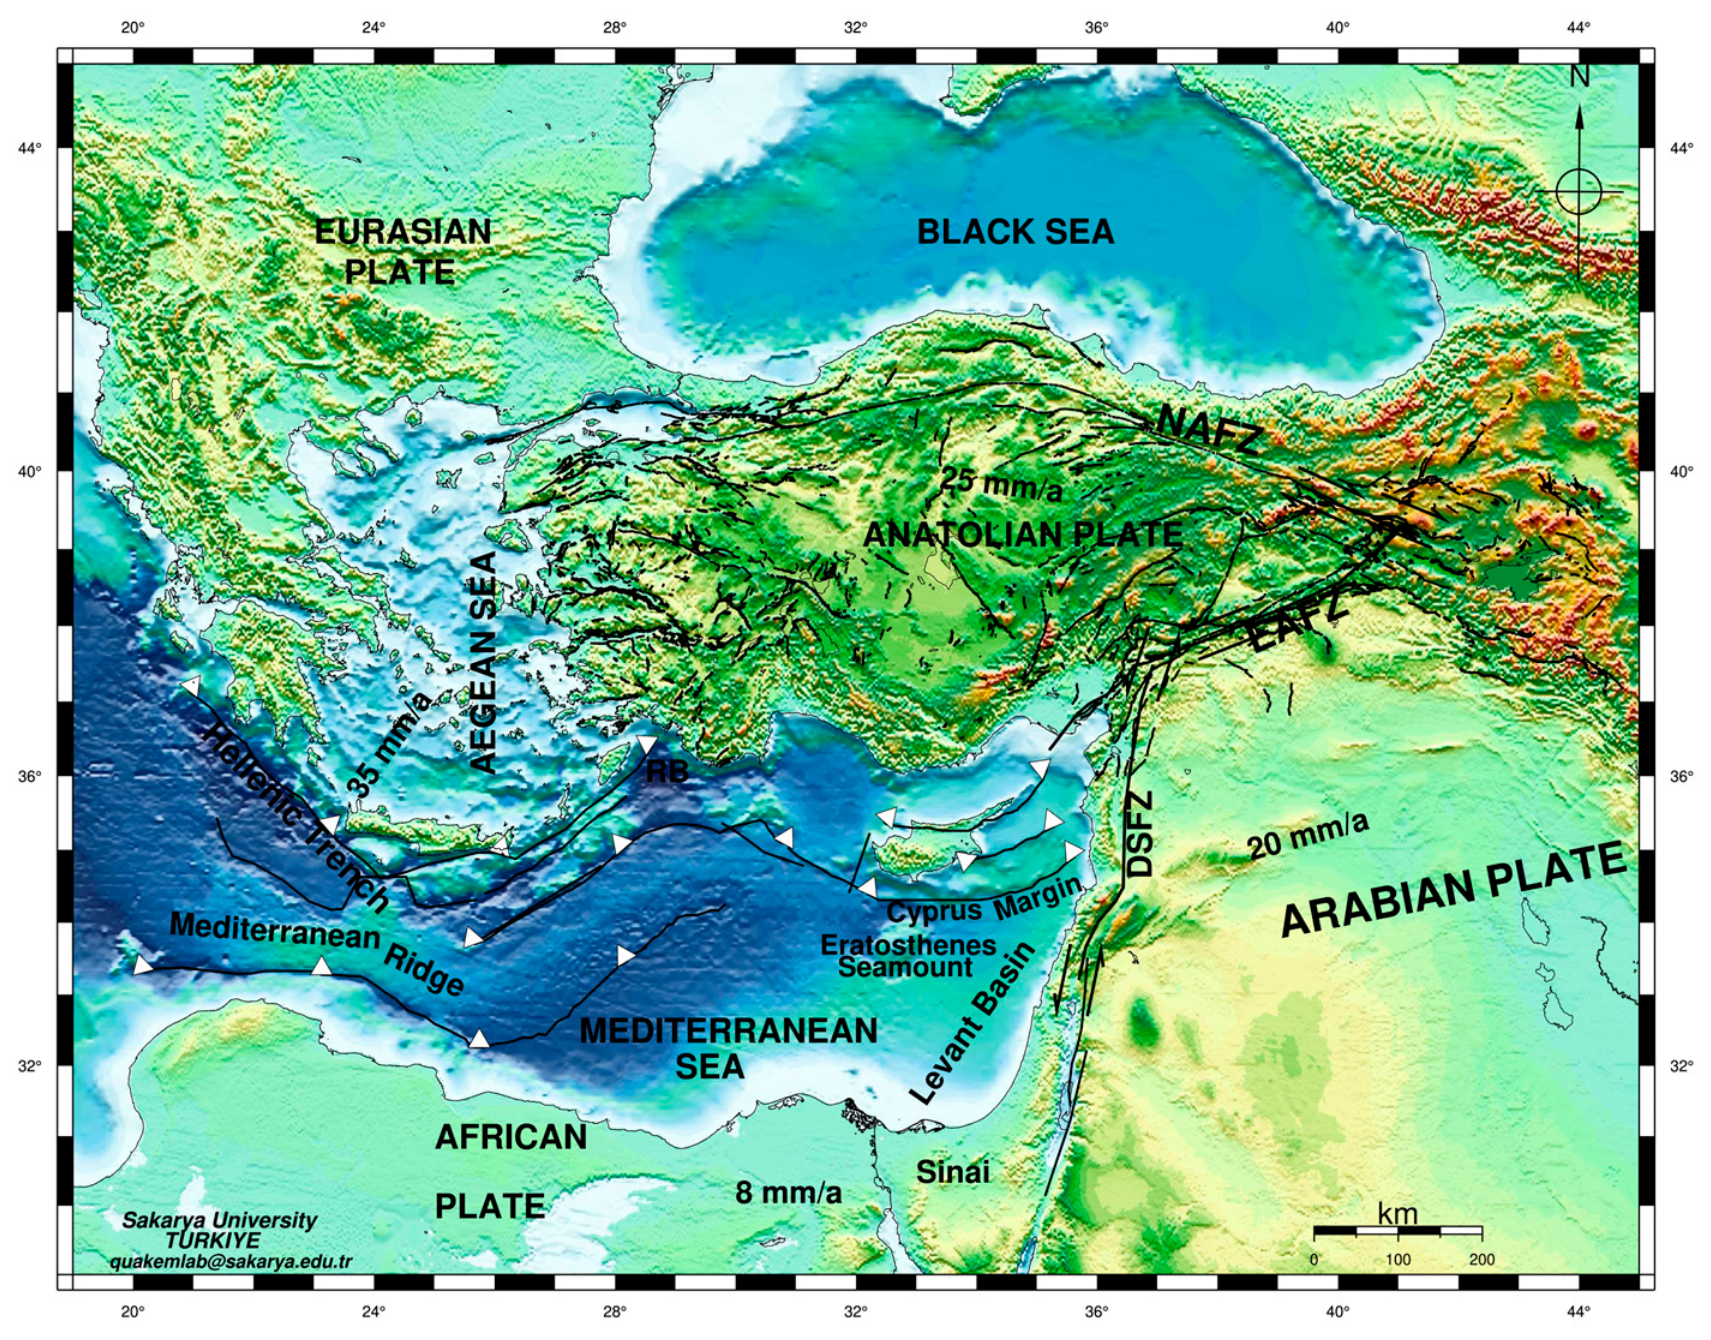
Türkiye, located at the junction of the African, Eurasian, and Arabian plates, is among the world’s most seismically active countries. Two principal fault zones, the North Anatolian and East Anatolian, define its tectonic setting [10,11,12,13,14,15]. The North Anatolian Fault Zone (NAFZ) is a right-lateral strike-slip fault, whereas the East Anatolian Fault Zone (EAFZ) is left-lateral. Graben systems in western Türkiye further contribute to regional tectonics (Figure 1). Consequently, Türkiye frequently experiences significant earthquakes.
The magnitude of a seismic event is one of the parameters that define it and give users and decision-makers an idea of how people and the environment can be affected. In this context, different magnitude types are defined by different researchers, such as local magnitude (ML), duration magnitude (md), body-wave magnitude (mb), and surface-wave magnitude (MS). The 26 December 2004 Sumatra-Andaman earthquake and the 17 July 2006, Java earthquake were milestones in the development of rapid magnitude determination. These earthquakes caused tsunamis, leading to many deaths. Tsunamis are devastating if they occur at regional distances and arrive at the coast in 20–30 min. For this reason, any warning should be disseminated within 15 min [16]. Ref. [4] calculated a moment magnitude using the P-wave portion of broadband seismograms, often called Mwp. However, early implementations of P-wave-based Mwp estimation occasionally underestimated the magnitude of very large earthquakes because the assumed source duration did not adequately represent the exceptionally long rupture process, as observed during the 2004 Sumatra-Andaman earthquake.
Many researchers have developed methods for rapid earthquake magnitude estimation using the early portion of the P-wave [4,5,6,7,8,16,17,18,19,20,21,22]. Early work demonstrated the viability of calculating moment magnitude (Mwp) from broadband seismograms, and subsequent refinements incorporated additional seismic phases and tailored algorithms to enhance accuracy, especially in regions with limited station coverage. Major efforts have focused on improving real-time processing and reducing underestimation in large events, as seen in the 2004 Sumatra earthquake. Further innovations have explored alternative combinations of waveform characteristics, including cumulative amplitudes, high-frequency durations, and empirical scaling relations. In recent years, approaches using strong-motion data have become more prominent, addressing limitations of broadband instruments in epicentral regions and enabling more robust magnitude estimation for both regional and teleseismic events. These evolving techniques have collectively advanced the reliability and speed of early-warning systems, with recent methods also introducing new empirical scales for global applicability.
The Marmara Region, located at the western end of the North Anatolian Fault Zone (NAFZ), is among the most seismically active and densely populated areas in Türkiye. The study area has experienced many destructive earthquakes since the historical era, e.g., 1509, 1766, 1894, 1935. The 1509 earthquake produced tsunami wave heights exceeding 6.0 m along all Marmara Sea coastlines. The 1999 earthquake generated tsunami wave heights exceeding 2 m at many locations around the Marmara Sea. This study focused on rapid magnitude estimation in tectonically active areas to warn people, decision-makers, and scientists, rather than on tsunami modelling. The 23 April 2025 earthquake provided a unique opportunity to investigate P-wave-based magnitude estimation in this tectonically complex region, where source directivity and strong-motion characteristics significantly influence recorded ground motions. The motivation is to improve moment magnitude calculations for small epicentral distances, such as those in the Marmara Sea. For that reason, we aim to estimate the moment magnitude (Mwp) using a set of strong-motion recordings, as broadband seismograms are generally clipped at short epicentral distances. The goal is to assess the feasibility of integrating Mwp estimation into regional early-warning frameworks for the Marmara Seismic Zone.

2. Data and Method

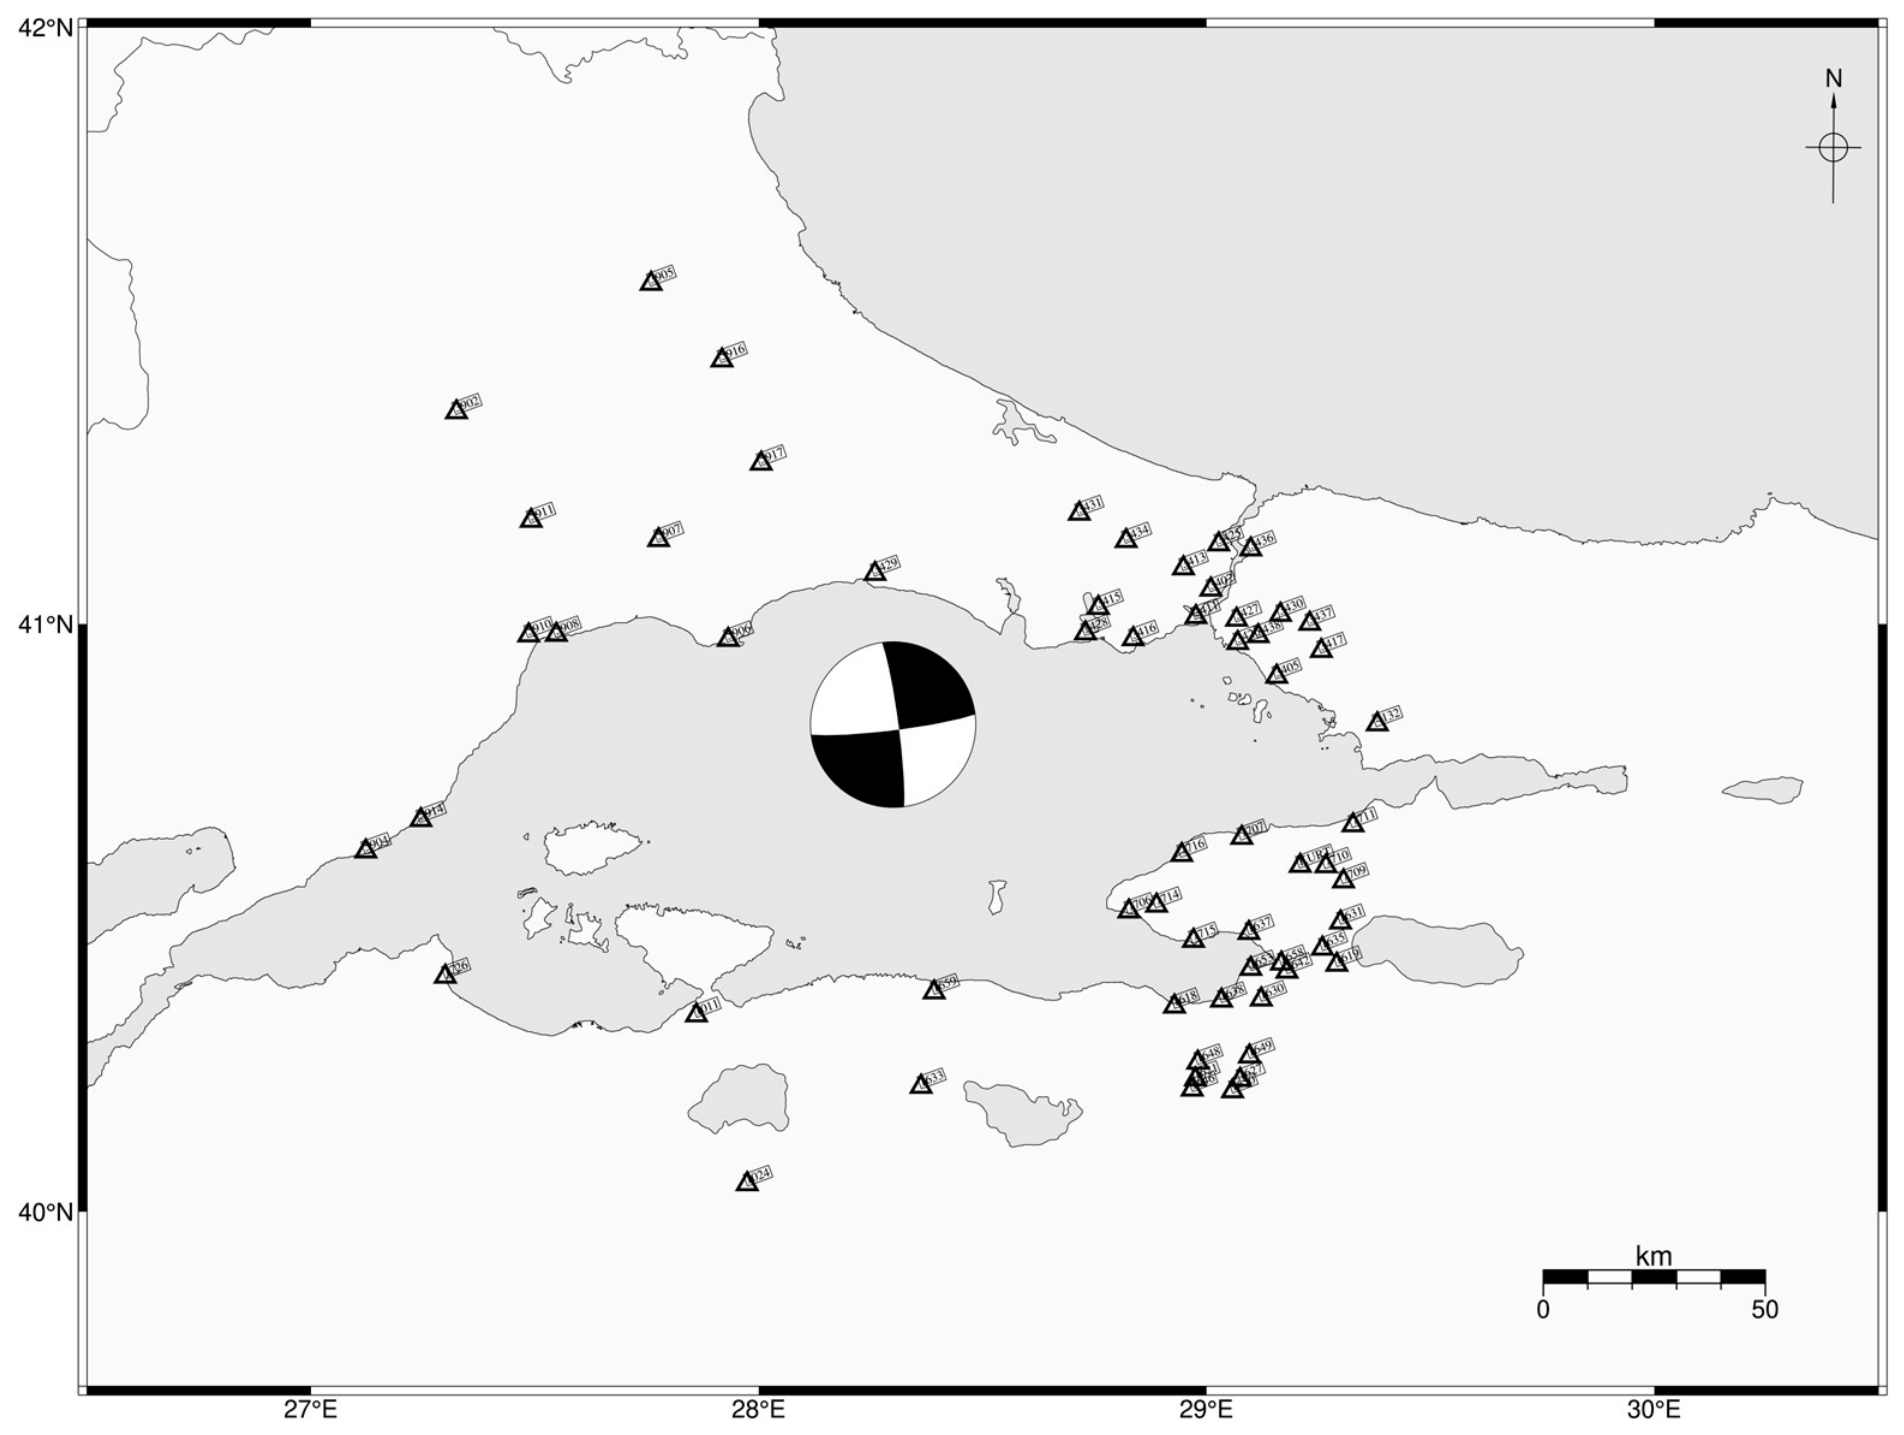
We used the 23 April 2025, earthquake, with a magnitude of 6.3 (GCMT-Mw), recorded by the Türkiye Strong Motion Network. The distance between the epicentre and the seismic recorders ranged from 25 to 100 km. Figure 2 shows the event (with focal nodal) and the seismic stations used in this study, and the hypocentre parameters are listed in Table 1.
The P-wave moment magnitude technique uses the initial part of the P-wave arrivals at regional or teleseismic epicentral distances to calculate the Mwp. A key issue is selecting the time window from the onset of the P-wave to determine the magnitude as accurately as possible. Ref. [4] defined the P-wave moment magnitude based on a vertical far-field P-wave displacement seismogram. The technique is based on the observed seismic moment from the P-wave portion of the vertical displacement seismograms, uz.
M 0 = 4 π ρ α 3 r F p m a x ( u z x r , t d t )
where ρ and α are the average density (3500 kg/m3) and the P-wave velocity along the propagation path, respectively, and r and Fp are the epicentral distance (between the earthquake epicentre and the recording station), calculated from the event and station coordinates, and the radiation pattern coefficients, respectively. The radiation pattern (Fp) is assumed to be unity for all stations in this study. Although this simplification neglects source-radiation and azimuthal effects, it is commonly adopted in rapid Mwp estimation studies, and its influence is mitigated by averaging results from a dense network of stations distributed around the source. Equation (1) requires source-to-station distance information; the method is intended for rapid, network-based magnitude estimation when an initial earthquake location is available. In operational earthquake early-warning systems, equivalent distance estimates would be obtained from real-time source-location algorithms using observations from multiple seismic stations. The seismic moment is calculated from the maximum amplitude within the selected time window. The moment magnitude is calculated from the seismic moment (M0) using the formula proposed by [21] (Equation (2)), which is identical to the IASPEI (2005) standard formula:
M w = l o g M 0 9.1 1.5
where M0 is in Nm [21,22]. In the current study, 60 accelerometer records were used to calculate Mwp for the event, and their arithmetic mean was taken. As discussed above, the primary issue in these calculations is the selection of the P-wave train time window, which directly affects the Mwp value. We selected 3 s after P-wave onset, based on trials of 2, 3, and 5 s, and we varied the time before P-wave arrival (Table 2). However, the 2 s window occasionally produced lower values, suggesting incomplete capture of the initial P-wave energy, whereas the 5 s window increases processing latency and may include additional waveform complexity beyond the earliest P-wave portion. The 3 s window was therefore selected as a pragmatic balance between rapid availability and stable magnitude estimation. Among the tested alternatives, the 3 s post-onset window provided a practical compromise between rapid processing and magnitude stability. Although the differences among the tested windows were generally small, the 3 s window was adopted for subsequent analyses because it captures sufficient P-wave energy while maintaining minimal processing delay for early-warning applications.
Another important parameter in these applications is the P-wave velocity. Generally, a fixed P-wave velocity (e.g., 7.9 km/s) is used in the calculations. Kanjo et al. [7] used a distance-dependent P-wave velocity ( α = 0.16 Δ + 7.9 ). In this retrospective case study, apparent P-wave velocity was calculated from the known epicentral distance and observed P-wave arrival time at each station. This approach was adopted to evaluate the influence of station-specific propagation velocities on Mwp estimation. In a fully operational earthquake early-warning system, source location and travel paths would need to be estimated in real time from incoming phase picks and network-based location solutions. Therefore, the velocity estimation procedure used here should be considered a post-event validation approach rather than a real-time operational implementation.
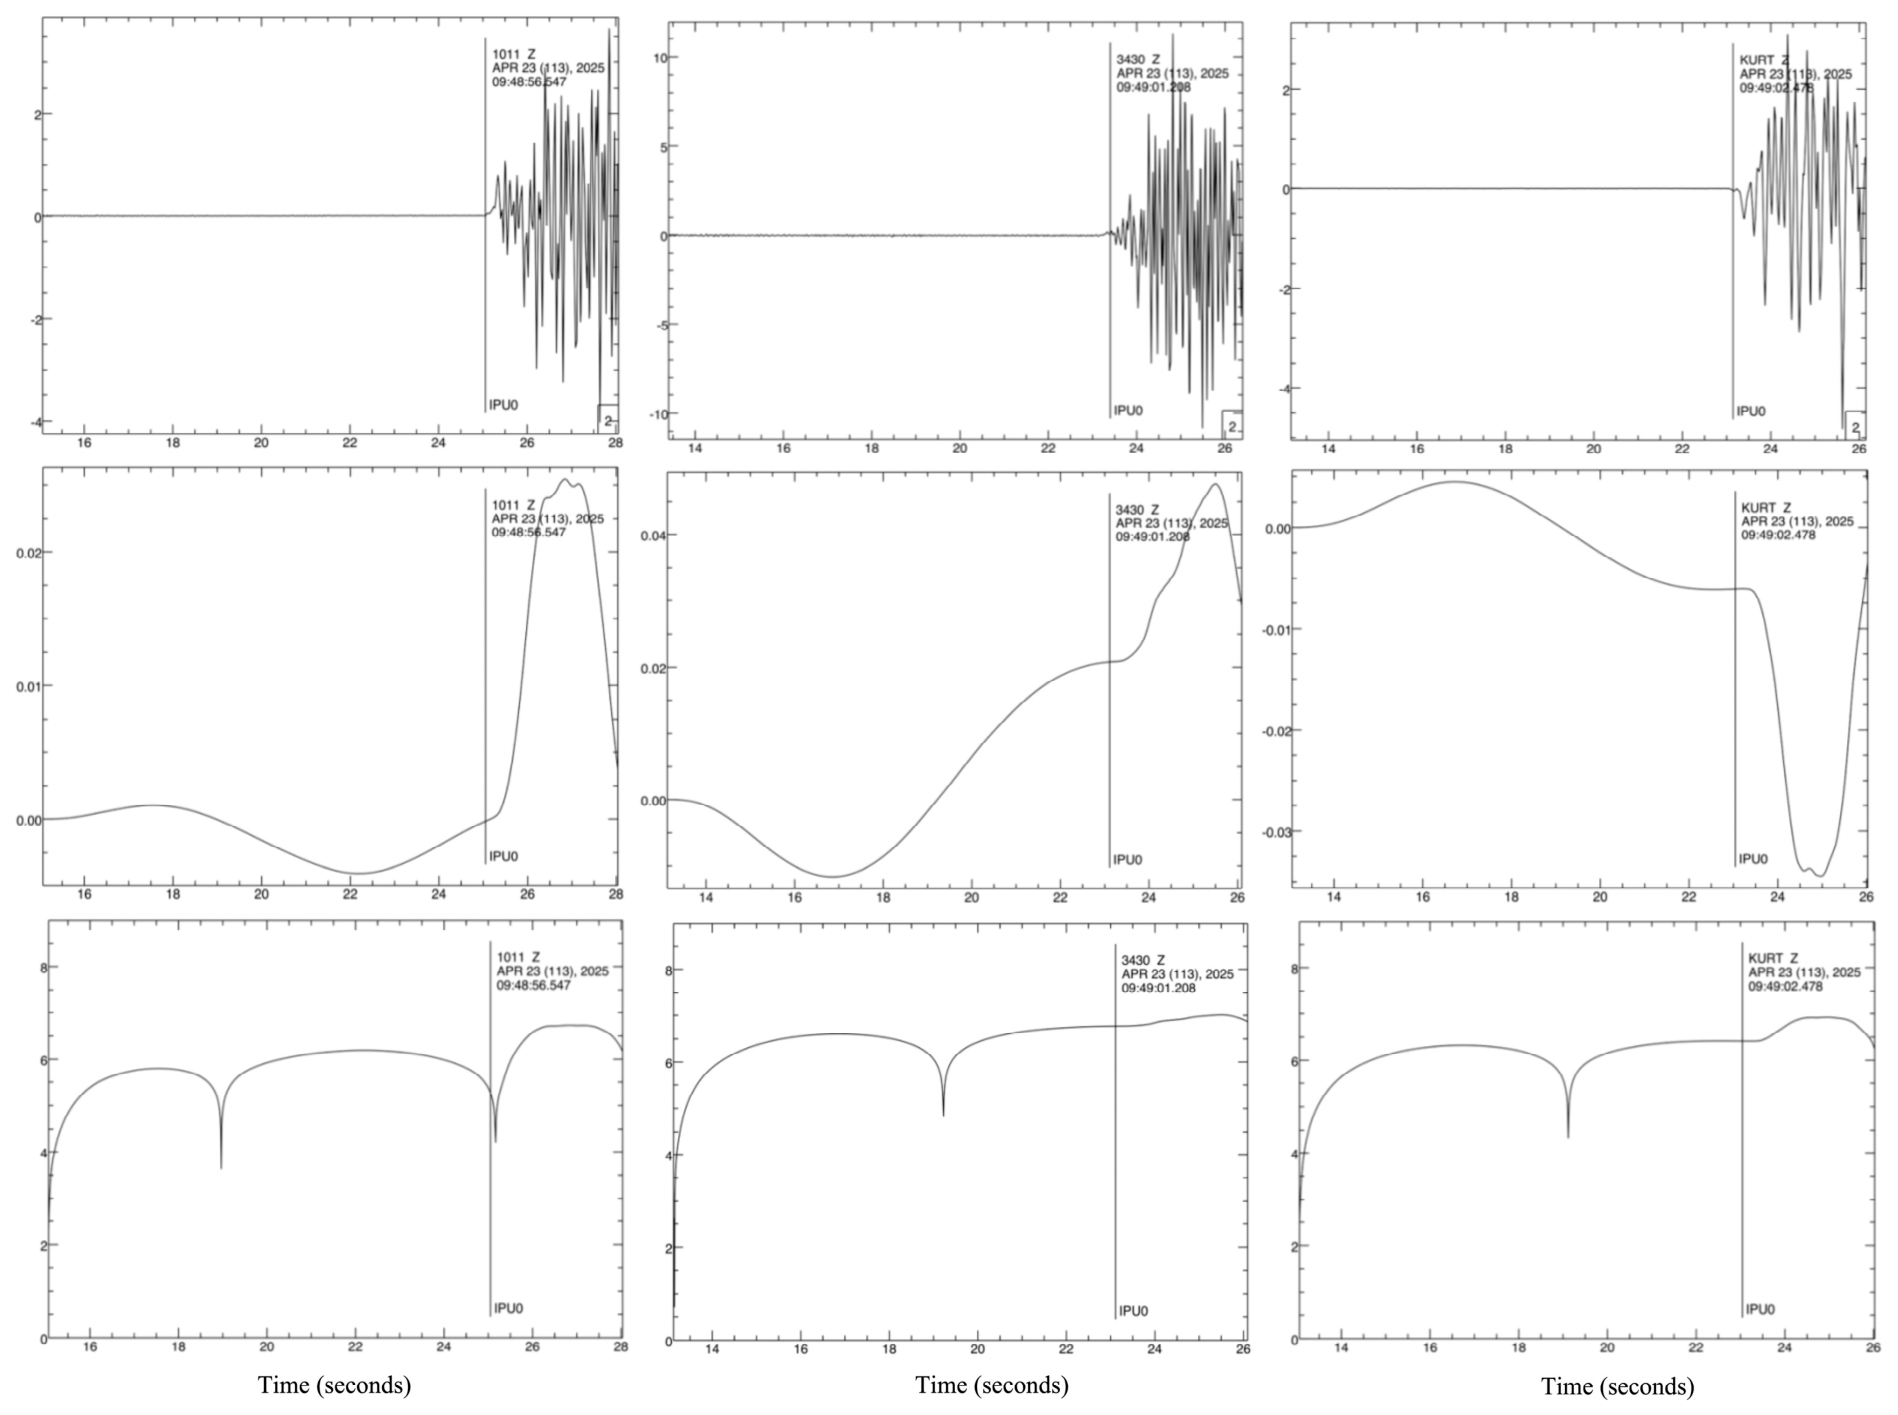
The calculation process is summarised below (Figure 3).
i.
Selection of P-wave onset;
ii.
Estimation of P-wave time window length;
iii.
Cutting of the seismogram from 10 s before the P-wave arrival and along the time window;
iv.
Removal of trend and mean from the seismograms;
v.
Calculation of seismic moment;
vi.
Calculation of moment magnitude.
The above process is applied to each vertical seismogram recorded at each seismic station. Afterwards, the mean Mwp is calculated for the case using all available Mwp values estimated at each seismic station.

3. Results and Discussion

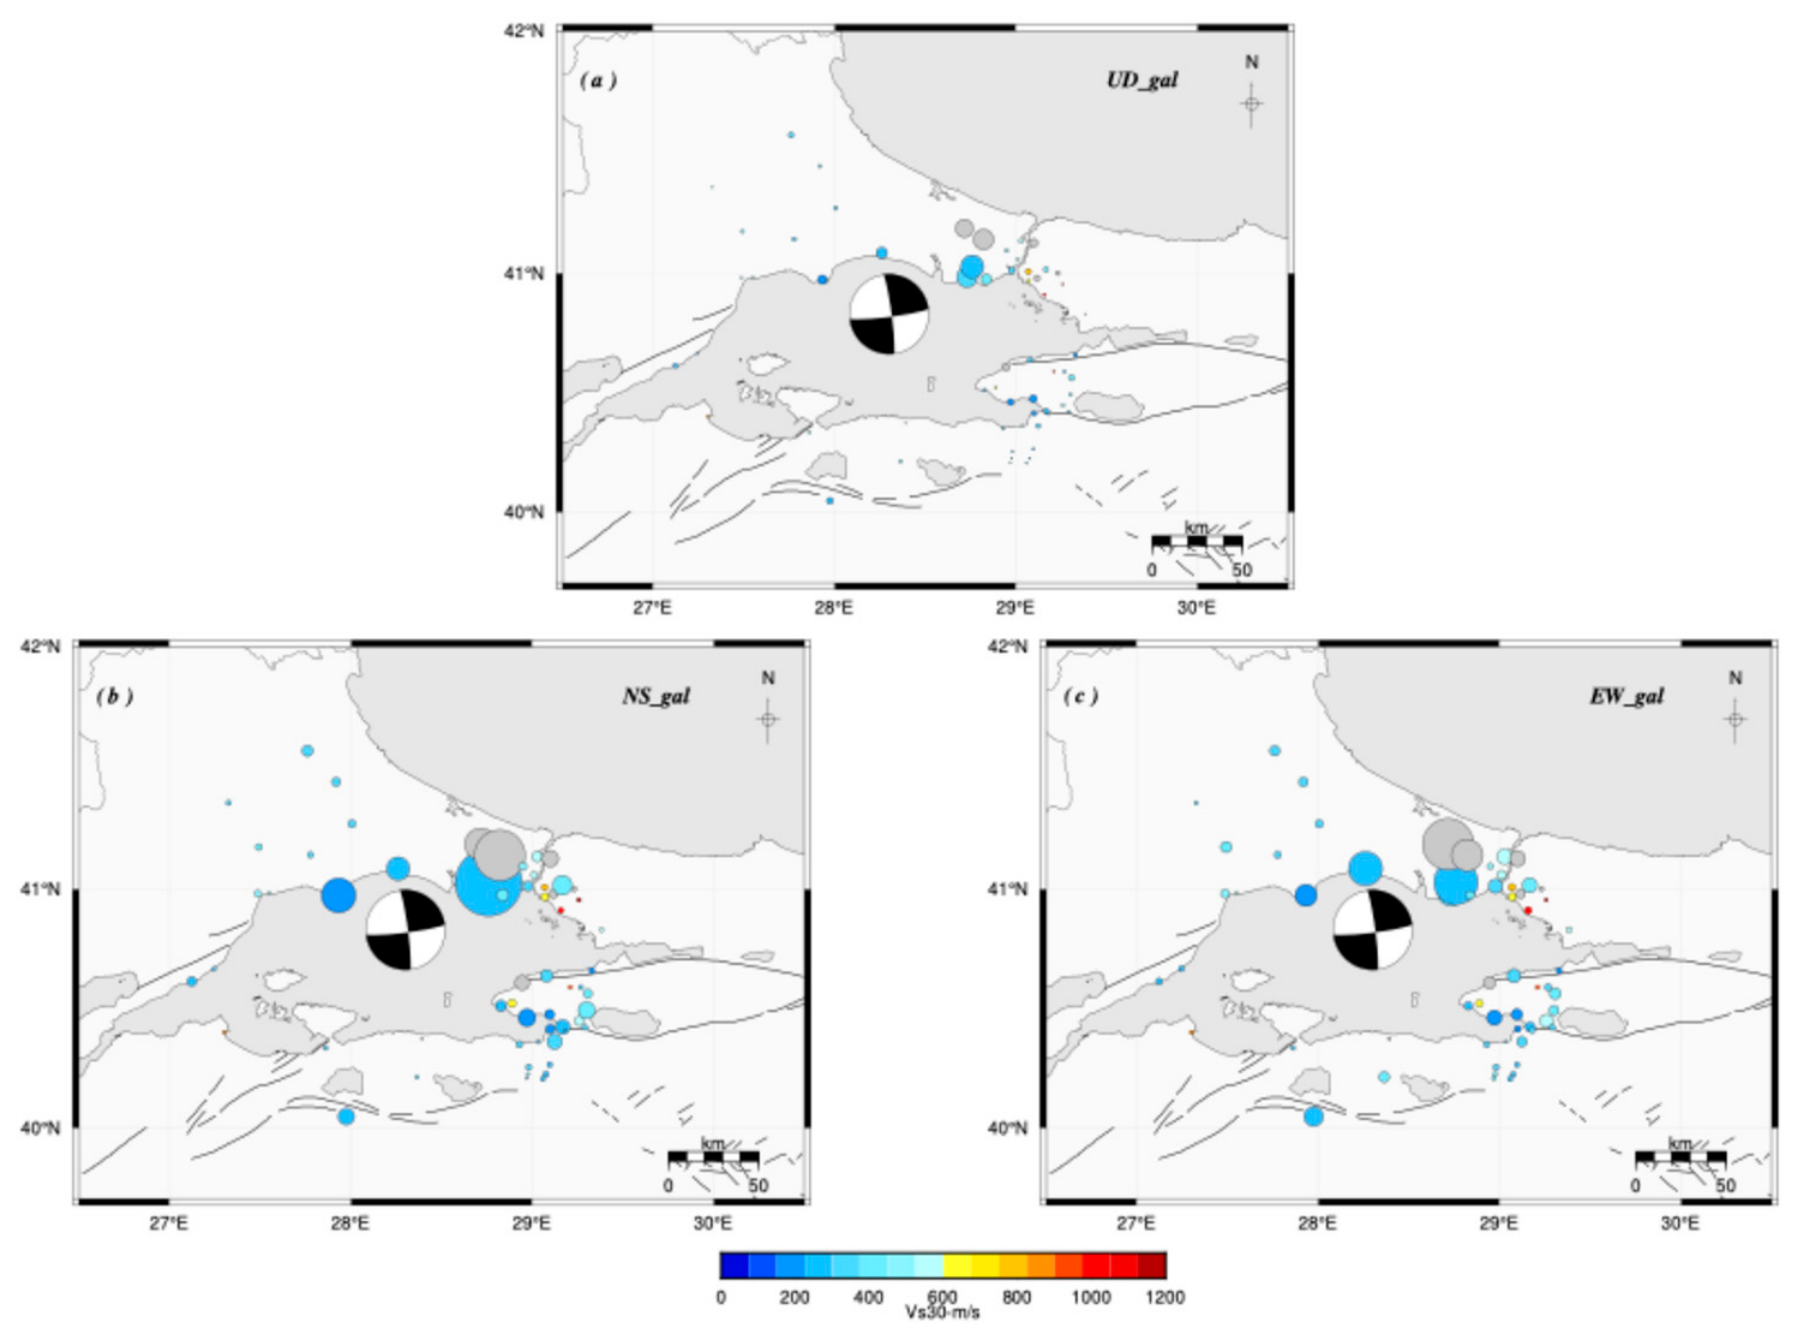
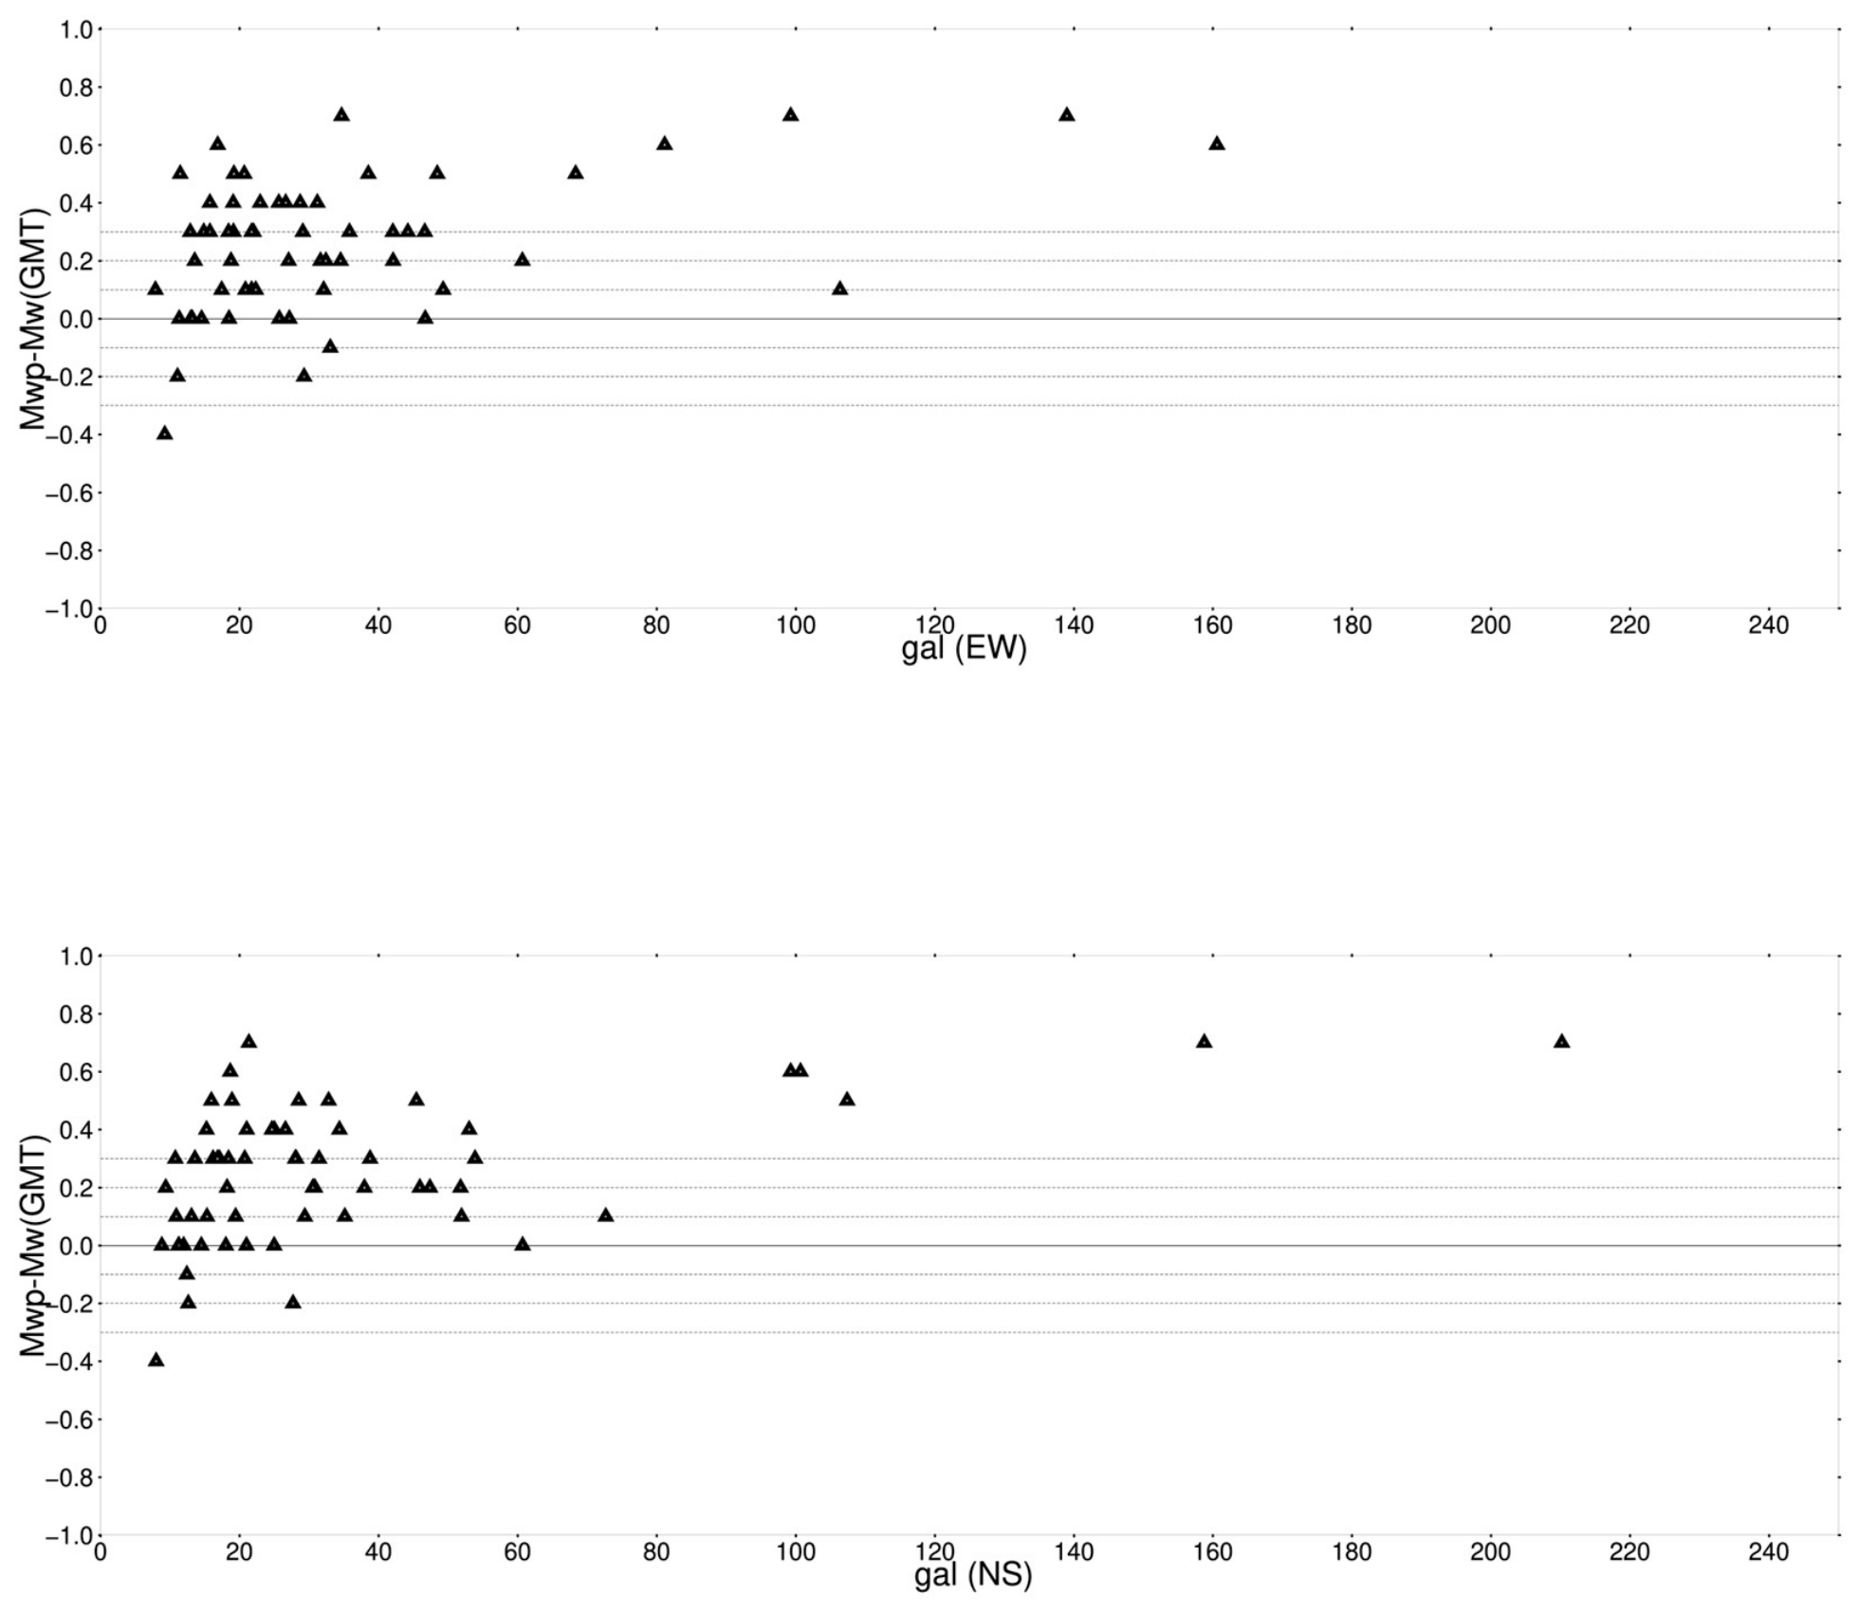
The epicentral distance ranges from 28 to 100 km. The P-wave moment magnitude (Mwp) was calculated from displacement seismograms derived from strong-motion acceleration seismograms. The calculated Mwp ranges from 5.9 to 7.0 and is affected by the earthquake’s directivity and the soil structure beneath the seismic stations (Table 3). Figure 4 and Figure 5 show how recorded acceleration varied with fault strike. The highest accelerations were observed at station 3431 (160.57 gal on the EW component) and at station 3415 (210 gal on the NS component); the stations are 56.87 km apart along the EW component and 49.61 km apart along the NS component, respectively. The maximum vertical acceleration was also observed at the 3415, 3428, 3434, 3434,3431, 3429, and 3416 seismic stations, which are located on the fault strike.
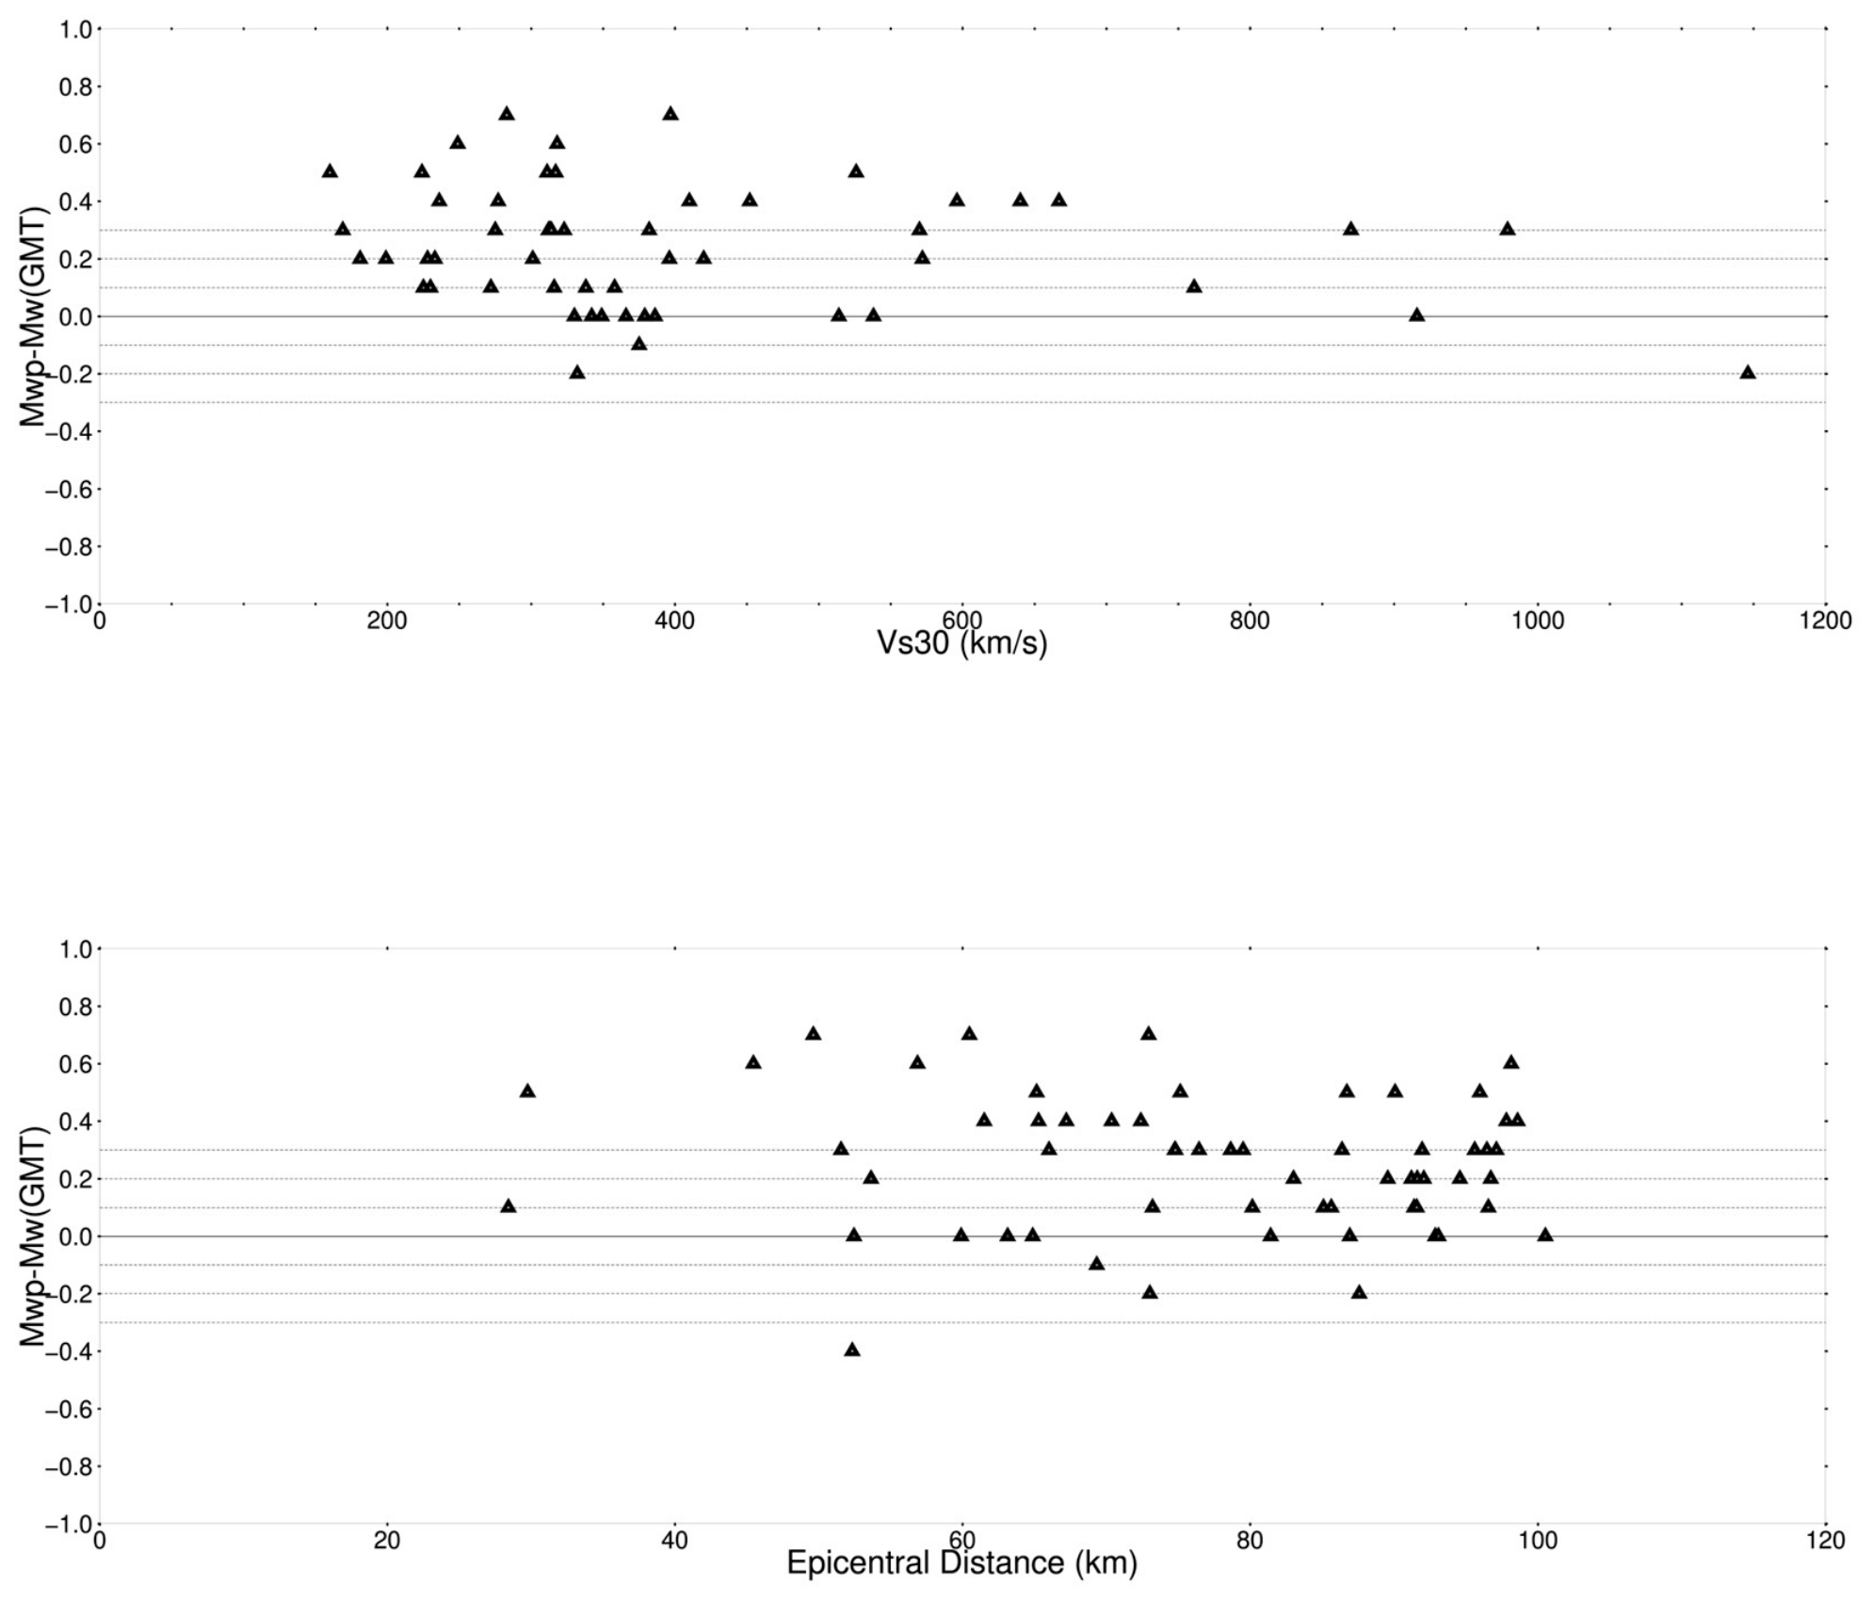
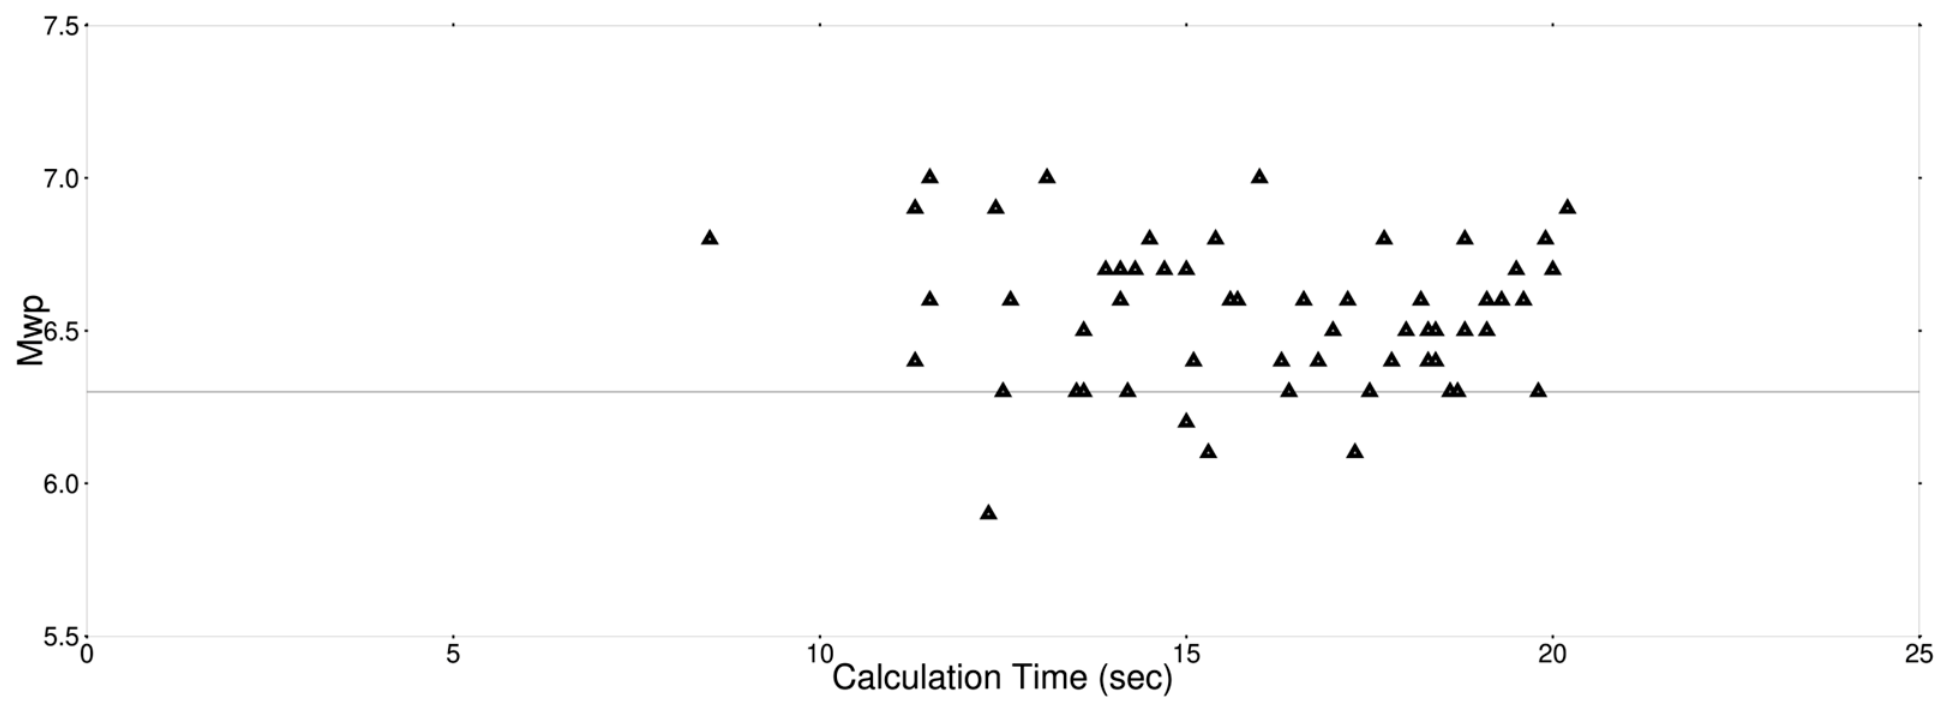
Figure 6 shows the change in magnitude difference between the calculated Mwp and M(GCMT) as a function of Vs30 and epicentral distance. The magnitude deficiency, considering Vs30, generally decreases above 400 m/s. A similar pattern was observed with epicentral distance, that is, between approximately 80 and 100 km. Another important point when focusing on early warning is processing time. The time required to obtain an Mwp estimate after P-wave identification ranges from approximately 8 to 20 s. These values represent the magnitude-estimation stage only and do not include additional delays associated with event detection, phase association, source-location estimation, or warning dissemination. (Figure 7). The scenario studies for a tsunami in the Marmara Sea show that the maximum time for wave arrival at the coast is 30 min.
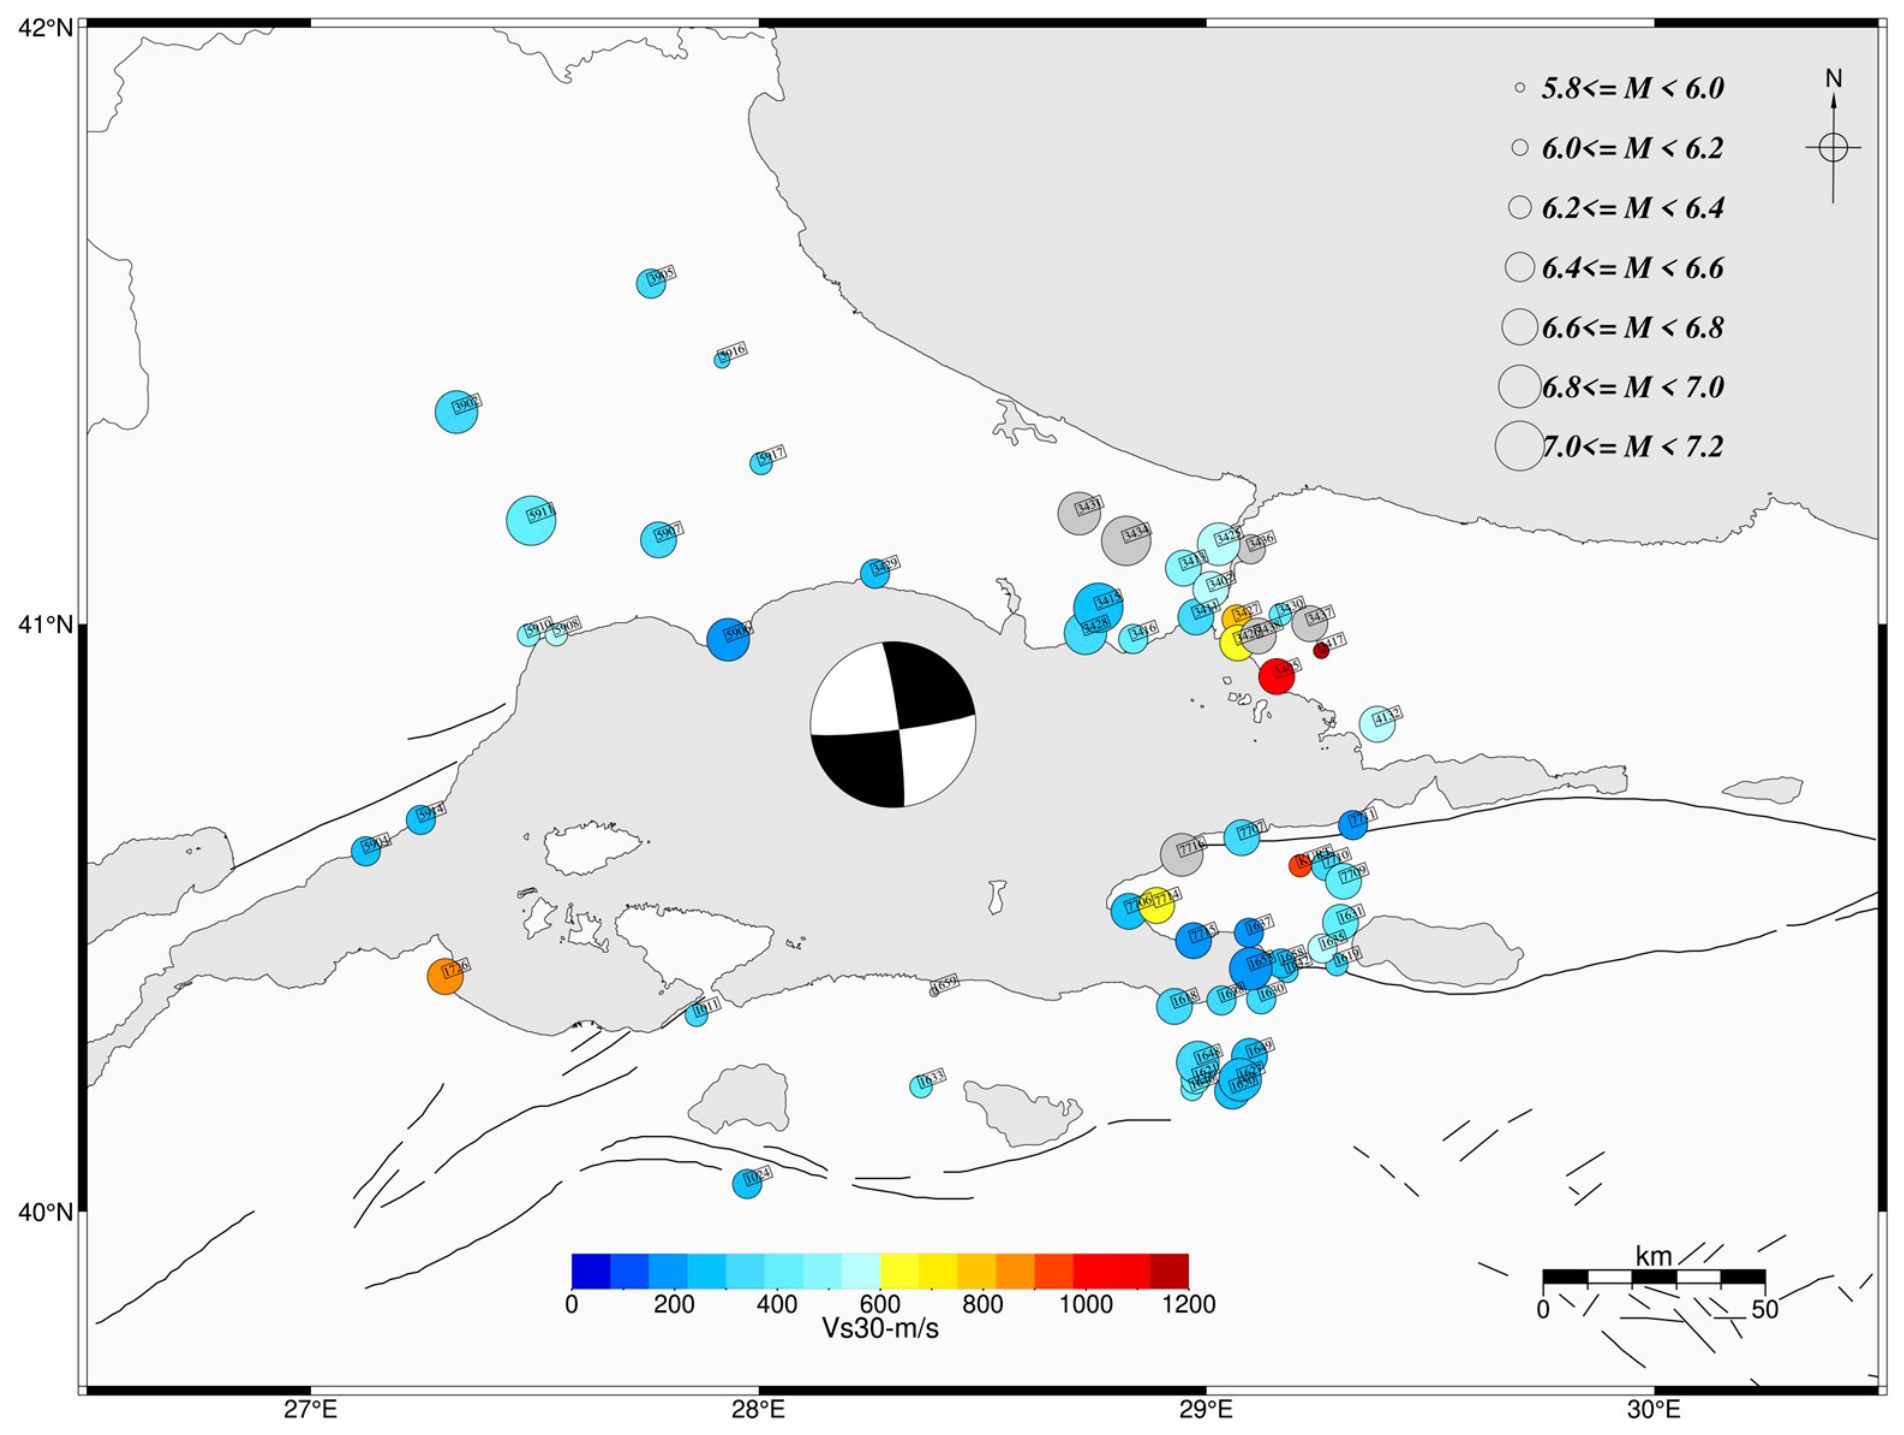
Considering this study, the first 10 min after a major earthquake in the Marmara Sea are vital for early-warning and rapid-response activities. This study demonstrates rapid magnitude estimation using strong-motion recorders rather than broadband seismometers, which can be clipped, providing a reliable magnitude value in a very short time and offering substantial support for early-warning and rapid-response activities. The calculated Mwp is highest at stations 3415, 3428, 3434, and 3431, ranging from 6.9 to 7.1, whereas stations 3429 and 3416 have Mwp magnitudes of 6.3 and 6.4, respectively.
Seismic stations 3429 and 3416 are located near the nodal planes (Figure 8). Although the Mwp varies widely, the mean value is sufficient for decision-makers to determine whether the earthquake is destructive. It would also be useful to estimate and model the expected arrival time of tsunami waves at the coastline. This study focuses on estimating rapid-moment magnitude from P-wave recorded by strong-motion recorders, although broadband velocity records have been the primary focus in the literature. Broadband seismograms generally clip near the epicentre during a large earthquake. In the event of a destructive earthquake, strong-motion records are useful for estimating the rapid magnitude for early-warning and rapid-response activities. This study also uses the variable P-wave velocity, calculated from arrival time and epicentral distance, as the apparent velocity, which influences the calculations and is more accurate than using a fixed velocity. The arithmetic mean must be used in these calculations because some records yield high magnitudes due to local site effects and directivity. The findings underscore the importance of rapid magnitude-estimation frameworks for improving the accuracy and reliability of early warnings.
The findings also demonstrate the advantages of strong-motion sensors for rapid magnitude estimation. Broadband seismometers, although highly sensitive, may clip during large near-field earthquakes, especially in densely instrumented urban regions. Strong-motion accelerometers are less affected by clipping and can therefore provide more stable amplitude measurements immediately after rupture initiation. This characteristic is particularly important for the Marmara region, where future large earthquakes are expected to strongly affect densely populated urban and industrial zones, including Istanbul and surrounding metropolitan areas.
Practical implementation of the proposed Mwp methodology requires an estimate of the source-to-station distance (r). In the present study, this distance was determined retrospectively using the known earthquake location. In an operational environment, however, source location would be obtained from automatic event detection, phase picking, phase association, and rapid location algorithms operating on data from multiple seismic stations. Therefore, the proposed methodology should be considered a component of a network-based rapid earthquake-characterisation framework rather than a stand-alone single-station solution. Similar approaches have been developed for automated earthquake detection and localisation in continuous seismic records (e.g., [23]), where source parameters are estimated in near-real time and subsequently used for rapid event characterisation.
Overall, the results confirm that P-wave analysis of strong-motion records provides a robust framework for rapid earthquake magnitude estimation in tectonically active regions. Although individual stations may exhibit substantial variability due to directivity and local site effects, averaging multiple station solutions yields stable event magnitudes that are consistent with independent global moment tensor solutions. The proposed workflow therefore represents a practical, operationally applicable approach for regional earthquake early-warning systems in Türkiye and similar seismic environments worldwide.

4. Conclusions

This study evaluated the feasibility of rapid P-wave moment magnitude (Mwp) estimation using strong-motion records from the 23 April 2025 Marmara Sea earthquake. The principal findings are summarised as follows:
  • Rapid magnitude estimation was successfully achieved using only the initial portion of the P-wave signal. Reliable Mwp values were obtained within approximately 8–20 s after P-wave arrival, demonstrating the method’s potential for use in earthquake early-warning and rapid-response systems.
  • The average estimated magnitude was consistent with independent reference solutions. The mean Mwp from 61 strong-motion stations was approximately 6.5, consistent with the GCMT moment magnitude (Mw = 6.3).
  • Station-based Mwp estimates exhibited significant variability. Calculated magnitudes ranged from approximately 5.9 to 7.0, reflecting the influence of rupture directivity, source radiation effects, propagation-path characteristics, and local site conditions.
  • Multi-station averaging significantly improved magnitude stability. Although individual stations produced overestimated and underestimated values, the arithmetic mean of a dense network yielded a robust event magnitude suitable for rapid decision-making.
  • The selected 3 s P-wave window provided a practical balance between processing speed and magnitude stability. While differences among tested windows were relatively small, the adopted window length was considered suitable for operational rapid magnitude estimation.
  • Strong-motion sensors represent a valuable resource for rapid earthquake characterisation. Unlike broadband instruments, strong-motion accelerometers are less susceptible to clipping during large earthquakes and can provide reliable amplitude measurements in near-source regions.
Overall, the results demonstrate that strong-motion-based P-wave analysis can provide rapid and reliable earthquake magnitude estimates in the Marmara region and may contribute to the development of future earthquake early-warning systems in Türkiye. Future studies should evaluate additional earthquakes with different magnitudes, focal mechanisms, and source depths to further assess the robustness and operational applicability of the proposed methodology.

Author Contributions

Conceptualisation, T.T. and J.G.G.; methodology, T.T.; writing—original draft preparation, T.T.; writing—review and editing, T.T. and J.G.G. All authors have read and agreed to the published version of the manuscript.

Funding

This research received no external funding.

Institutional Review Board Statement

Not applicable.

Informed Consent Statement

Not applicable.

Data Availability Statement

The seismic data used were downloaded from AFAD and are freely available at https://tadas.afad.gov.tr, accessed on 17 September 2025.

Acknowledgments

The authors thank the AFAD for sharing data freely. The seismic waveforms were processed with SAC2000 [24], and figures were generated with Generic Mapping Tools (GMT) [25].

Conflicts of Interest

The authors declare no conflicts of interest.

References

  1. Allen, M.R.; Gasparini, P.; Kamigaichi, O.; Böse, M. The Status of Earthquake Early Warning around the World: An Introductory Overview. Seismol. Res. Lett. 2009, 80, 682–693. [Google Scholar] [CrossRef]
  2. Minson, S.E.; Baltay, A.S.; Cochran, E.S.; Hanks, T.C.; Page, M.T.; McBride, S.K.; Milner, K.R.; Meier, M.A. The limits of earthquake early warning accuracy and best alerting strategy. Sci. Rep. 2019, 9, 2478. [Google Scholar] [CrossRef]
  3. Hoshiba, M.; Aoki, S. Numerical shake prediction for earthquake early warning: Data assimilation, real-time shake mapping, and simulation of wave propagation. Bull. Seismol. Soc. Am. 2015, 105, 1324–1338. [Google Scholar] [CrossRef]
  4. Tsuboi, S. Rapid determination of Mw from broadband P waveforms. Bull. Seismol. Soc. Am. 1995, 83, 606–613. [Google Scholar]
  5. Hara, T. Magnitude determination using initial P waves. Geophys. Res. Lett. 2007, 34, L23311. [Google Scholar]
  6. Lomax, A.; Michelini, A.; Piatanesi, A. An energy-duration procedure for rapid determination of earthquake magnitude and tsunamigenic potential. Geophys. J. Int. 2007, 170, 1195–1209. [Google Scholar] [CrossRef][Green Version]
  7. Kanjo, K.; Furudate, T.; Tsuboi, S. Application of Mwp to the Great December 26, 2004 Sumatra Earthquake. Earth Plan. Space 2006, 58, 431–436. [Google Scholar] [CrossRef]
  8. Tezel, T. Adaptation of P-wave moment magnitude of Turkey’s Earthquakes for Early Warning Purpose. J. Seismol. 2022, 26, 243–263. [Google Scholar] [CrossRef]
  9. Das, R.; Menesis, C.; Urrutia, D. Regression relationship for conversion of body wave and surface wave magnitudes toward Das magnitude scale. Mwg. Nat. Hazards 2023, 117, 365–380. [Google Scholar] [CrossRef]
  10. Şengör, A.M.C.; Yılmaz, Y. Tethyan evolution of Turkey: A plate tectonic approach. Tectonophysics 1981, 75, 181–241. [Google Scholar] [CrossRef]
  11. Reilinger, R.; McClusky, S.; Oral, M.B.; King, R.; Toksöz, M.N.; Barka, A.; Kınık, I.; Lenk, O.; Şanlı, I. Global Positioning System measurements of present-day crustal movements in the Arabia–Africa–Eurasia plate collision zone. J. Geophys. Res. 1997, 102, 9983–9999. [Google Scholar] [CrossRef]
  12. McClusky, S.; Balassanian, S.; Barka, A.; Demir, C.; Ergintav, S.; Georgiev, I.; Gürkan, O.; Hamburger, M.; Hurst, K.; Kahle, H.; et al. Global Positioning System constraints on plate kinematics and dynamics in the eastern Mediterranean and Caucasus. J. Geophys. Res. 2000, 105, 5695–5719. [Google Scholar] [CrossRef]
  13. Bozkurt, E. Neotectonics of Turkey—A synthesis. Geodin. Acta 2001, 14, 3–30. [Google Scholar] [CrossRef]
  14. Faccenna, C.; Bellier, O.; Martinod, J.; Piromallo, C.; Regard, V. Slab detachment beneath eastern Anatolia: A possible cause for the formation of the North Anatolian Fault. Earth Planet. Sci. Lett. 2006, 242, 85–97. [Google Scholar] [CrossRef]
  15. Biryol, C.B.; Beck, S.L.; Zandt, G.; Özacar, A.A. Segmented African lithosphere beneath the Anatolian region inferred from teleseismic P-wave tomography. Geophys. J. Int. 2011, 184, 1037–1057. [Google Scholar] [CrossRef]
  16. Lomax, A.; Michelini, A. Tsunami early warning within five minutes. Pure Appl. Geophys 2013, 170, 1385–1395. [Google Scholar] [CrossRef]
  17. Lomax, A.; Michelini, A. Mwpd: A duration-amplitude procedure for rapid determination of earthquake magnitude and tsunamigenic potential from P-waveforms. Geophys. J. Int. 2009, 176, 200–214. [Google Scholar] [CrossRef]
  18. Okal, E.A.; Talandier, J. Mm: A variable-period mantle magnitude. J. Geophys. Res. 1989, 94, 4169–4193. [Google Scholar] [CrossRef]
  19. Tsuboi, S.; Whitmore, P.M.; Sokolowski, T.J. Application of Mwp to deep and teleseismic earthquakes. Bull. Seismol. Soc. Am. 1999, 89, 1345–1351. [Google Scholar] [CrossRef]
  20. Bormann, P.; Dewey, J.W. The new IASPEI standards for determining magnitudes from digital data and their relation to classical magnitudes. In New Manual of Seismological Observatory Practice 2 (NMSOP-2); Bormann, P., Ed.; Deutsches GeoForschungsZentrum GFZ: Potsdam, Germany, 2014; pp. 1–44. [Google Scholar] [CrossRef]
  21. Kanamori, H. The energy release in great earthquakes. J. Geophys. Res. 1977, 82, 2981–2987. [Google Scholar] [CrossRef]
  22. Hanks, T.C.; Kanamori, H. A moment magnitude scale. J. Geophys. Res. 1979, 84, 2348–2350. [Google Scholar] [CrossRef]
  23. Krylov, A.A.; Lobkovsky, L.I.; Ivashchencko, A.I. Automated detection of microearthquakes in continuous noisy records produced by local ocean bottom seismographs or coastal networks. Russ. J. Earth Sci. 2019, 19, 1–13. [Google Scholar] [CrossRef]
  24. Goldstein, P.; Dodge, D.; Firpo, M.; Minner, L. SAC2000: Signal processing and analysis tools for seismologists and engineers. In The IASPEI International Handbook of Earthquake and Engineering Seismology; Lee, W.H.K., Kanamori, H., Jennings, P.C., Kisslinger, C., Eds.; Academic Press: San Diego, CA, USA, 2003; pp. 1613–1614. [Google Scholar]
  25. Wessel, P.; Smith, W.H.F. New, improved version of Generic Mapping Tools released. Eos Trans. AGU 1998, 79, 579. [Google Scholar] [CrossRef]
Figure 1. The main fault structure around Turkiye. NAFZ and EAFZ denote the North Anatolian Fault Zone and East Anatolian Fault Zone, respectively. The subject of this study is represented by a yellow balloon, with its capture date set to 23 April 2025. Used stations are shown as white triangles in the panel below.
Applsci 16 06000 g001
Figure 2. Used strong-motion stations (shown with triangles) and their codes written on them.
Applsci 16 06000 g002
Figure 3. Examples of the Mwp determination procedure for stations 1011 (left), 3430 (centre), and KURT (right). Top panels show the original vertical strong-motion records and the identified P-wave arrivals. Middle panels show the corresponding displacement seismograms. Bottom panels illustrate the cumulative displacement integration used for seismic moment and Mwp estimation.
Applsci 16 06000 g003
Figure 4. Change in magnitude difference with measured acceleration for EW and NS components, respectively.
Applsci 16 06000 g004
Figure 5. Measured acceleration at the used stations with Vs30. The sizes of the circles correlated with the measured acceleration. (a) U-D direction, (b) N-S direction and (c) E-W direction recorded acceleration values with coloured considering Vs30.
Applsci 16 06000 g005
Figure 6. Change in magnitude difference with Vs30 (up) and epicentral distance (below).
Applsci 16 06000 g006
Figure 7. Calculated time of P-wave moment magnitude using strong-motion recorders.
Applsci 16 06000 g007
Figure 8. Calculated P-wave moment magnitude from strong-motion recorders. Colour scale shows change in Vs30.
Applsci 16 06000 g008
Table 1. Focal parameters of the earthquake used in this study.
InstituteDateO.T. (UTC)Lat (°)Lon (°)Depth (km)MLMwN.StaMwpAcc
KOERI23 April 202509:49:1040.8328.2312.16.26.2616.5
AFAD09:49:1040.8628.246.92 6.2
EMSC09:49:11.940.8328.2215 6.2
GCMT09:49:14.840.8328.3012 6.3
Table 2. Searching results for the different time frames to calculate the Mwp. a_5 means 5 s before the P-wave onset, and +2 means 2 s after it.
Window Length
Stationa_5 + 2a_5 + 3a_5 + 5a_10 + 2a_10 + 3a_10 + 5
10116.86.917.136.996.317.07
34306.686.976.836.866.346.88
KURT6.936.696.986.886.366.95
Table 3. Used seismic station information and calculated P-wave moment magnitude for each station with measured PGA values.
CodeLongLatPGA_UDPGA_NSPGA_EWDist (km)MwpVs30 (m/s)
28.2596441.0849234.493353372.6685445106.36309628.416.4230
590627.9316440.9733829.0576036107.38191468.336287329.756.8224
342828.72959540.98455364.244064599.267406581.124644945.456.9318
341528.7584841.0272971.5936873210.197863138.98799449.617283
590727.7763341.141812.656956118.401265321.998681551.546.6313
165928.39152840.3750634.666800288.021781249.2361787152.335.9
591728.00535341.270612.330260224.963440725.734546752.446.3342
341628.8363540.9746633.336092837.94964127.063034953.626.5420
343128.7156741.18622556.035542100.67463160.57483556.876.9
590827.5479440.982057.412365911.213162811.325221359.896.3538
343428.820541.14033763.7181514158.75862499.280570460.477
770628.8266240.513059.326103134.362006426.619334461.516.7277
101127.8610440.336017.4238037514.514380514.546443563.126.3330
591027.4860840.981096.4976565120.987995427.172631864.886.3514
771628.94461540.60896824.197926545.424072438.514360765.156.8
771428.8883340.522757.2558145125.027006622.976407565.286.7640
341128.9760541.0118720.349182631.422206944.2021661666.6323
341328.9481841.0943311.631217726.587070719.077225367.26.7452
163328.3626240.213979.9267602712.412408333.069220969.326.2375
340729.0095141.058210.093806621.029405128.708518570.366.7596
342629.06969540.96790511.124972124.663078725.642815672.396.7667
591127.4915641.1741310.446735321.353932234.677090472.947397
591627.91790841.443689.2278373727.677332729.293205473.016.1332
342729.06706841.0075517.051630819.444184121.726101273.216.4761
771528.9707240.4629620.149798753.856762746.636328474.746.6169
770729.078840.638115.838906638.770970642.05434374.86.6312
342529.02727741.13449714.014349832.793239348.430357875.136.8526
343829.11560740.97963218.842998428.134123629.097336276.446.6
340529.1566840.911118.0542723717.111541821.714245878.636.6979
161828.9281540.350958.3401308920.750457219.120807879.516.6314
343629.09854541.12595225.038326151.933553849.276184980.146.4
343029.16516341.01557216.443018860.699561646.700000381.426.3379
163729.09462840.4763223.934793730.822500134.5466186836.5181
591427.2452640.668257.1530193513.080485517.412174785.0826.4272
163829.033340.3611475.1611240810.88688237.9048490285.646.4338
343729.2304741.00065213.603417316.184866914.847491386.386.6
165329.09864540.41536514.834667328.487290720.67710386.726.8160
KURT29.209240.59056.6559838411.945956712.990494186.9146.3916
341729.2562740.954716.1314080312.627733311.075753987.586.11146
102427.97402840.04747521.148864751.786458560.683568189.566.5228
164828.98028540.2552256.9912832218.910553519.187453590.076.8311
165829.1672240.42408516.827682645.927153431.630266191.216.5233
390527.7597741.5723716.875989135.120838432.116170591.396.4316
771029.266840.589979.0747685515.301689222.317014891.576.4358
163029.1220740.3629814.078492447.378019832.412564691.6046.5301
172627.30007340.4018277.8223551310.76790912.904722291.946.6870
162128.9755840.226865.047928259.3765013713.549030192.0696.5396
164229.17943540.4103434.8793020511.2875518.488619192.876.3366
164628.96803740.2090785.18748468.8174733113.199801393.086.3386
771129.3270940.6594212.325353818.213622518.772552594.576.5199
770929.3060340.5641618.77249127.998527635.800439495.616.6382
390227.3248341.357055.3385096715.953837411.465283995.966.8317
164929.09591340.2657837.6694265216.833159415.723790296.466.6275
590427.1225640.6148515.189075729.401982620.856628196.566.4225
163529.25870240.44964810.812379430.556221742.074375996.726.5572
413229.381340.830465.2773461713.594149318.398497797.116.6570
163129.299340.494119.6903831853.015808131.199074197.816.7410
162729.0751840.225666.1764964518.675001516.854164298.146.9249
165029.0578940.2061975.6116952115.23597215.732191498.59326.7236
161929.290740.422368.1671902818.042543718.5012119100.516.3349
Disclaimer/Publisher’s Note: The statements, opinions and data contained in all publications are solely those of the individual author(s) and contributor(s) and not of MDPI and/or the editor(s). MDPI and/or the editor(s) disclaim responsibility for any injury to people or property resulting from any ideas, methods, instructions or products referred to in the content.