Article

Correlation Between Micellar Extraction Parameters and Physicochemical and Functional Properties of Extracts Obtained from Grape Pomace


by
Zofia Hordyjewicz-Baran
1,
Tomasz Wasilewski
1,2,*,
Ewa Dresler
1,
Ewa Sabura
1,
Katarzyna Malorna
1 and
Natalia Stanek-Wandzel
1
1
Łukasiewicz Research Network—Institute of Renewable Resources Chemistry, Energetykow 9, 47-225 Kedzierzyn-Kozle, Poland
2
Department of Cosmetology, Faculty of Medical and Health Sciences, University of Radom, Chrobrego 27, 26-600 Radom, Poland
*
Author to whom correspondence should be addressed.
Appl. Sci. 2026, 16(12), 5932; https://doi.org/10.3390/app16125932
Submission received: 6 May 2026 / Revised: 9 June 2026 / Accepted: 10 June 2026 / Published: 11 June 2026
(This article belongs to the Special Issue Bioorganic Chemistry and Medicinal Chemistry)

Abstract

Grape pomace is one of the most abundant byproducts of the wine industry. This by-product contains many valuable bioactive substances, including polysaccharides, amino acids, and polyphenols. To enable its effective reuse, this study developed and optimized a micelle-assisted extraction process using a 2% (w/w) decyl glucoside solution aqueous as an extraction medium. The influence of key process parameters—the pomace-to-medium ratio, extraction temperature, and extraction time—was systematically evaluated to determine their impact on extraction yield and the physicochemical properties of the recovered compounds. Extraction efficiency was assessed by determining total phenolic content (TPC) and antioxidant capacity (DPPH, ABTS) using UV-VIS spectrophotometry and by determining selected phenolic compounds, amino acids, and sugars using Ultraperformance Liquid Chromatography Coupled with Tandem Mass Spectrometry (UPLC-MS/MS) The results demonstrated that all the parameters investigated significantly influenced the recovery of bioactive substances. The developed decyl glucoside-based micellar extraction proved to be an efficient, low-temperature, and environmentally favorable method for valorizing grape pomace, offering strong potential for cosmetic and related applications.

1. Introduction

In recent years, the growing interest in the recovery of natural bioactive compounds from plant materials has contributed to the development of more efficient and environmentally friendly extraction methods [1]. Traditional techniques, such as solvent extraction, are often associated with the use of toxic reagents and high energy consumption [2].
In contrast, green extraction methods, including supercritical fluid extraction, ultrasound-assisted extraction, and enzymatic extraction, have gained prominence due to their effectiveness, eco-friendliness, and ability to preserve the bioactivity of desired compounds [3].
Among these methods, micellar extraction represents a distinct, complementary approach based on the use of aqueous solutions of non-ionic surfactants to selectively extract valuable components from plant matrices [4,5]. Unlike techniques requiring mechanical or thermal energy, micellar extraction enables the efficient recovery of bioactive compounds at low temperatures, with minimal energy consumption and without the need for organic solvents. Micellar extraction, based on the use of mild surfactants such as alkyl glucosides, offers a promising method for the recovery of phenolic compounds, flavonoids, and other secondary metabolites [6,7,8]. Natural extracts derived from plants are widely regarded as valuable ingredients in the cosmetics industry, primarily due to their richness in bioactive compounds, especially polyphenols. Among these, grape pomace extract stands out for its remarkable concentration of health-promoting phytochemicals. As a by-product of the winemaking process, grape pomace also aligns with the principles of sustainable development, promoting the circular use of natural resources and the incorporation of upcycled materials into cosmetic formulations [6,7,8,9,10,11,12].
Polyphenols are widely used in cosmetology due to their antioxidant, anti-inflammatory, and photoprotective properties. By neutralizing free radicals and modulating key enzymatic pathways, they help protect the skin from oxidative stress, support regeneration, and maintain firmness and elasticity. Catechin and epicatechin—flavanols naturally present in grapes—are particularly noteworthy for their strong antioxidant activity and their ability to support collagen synthesis, epidermal renewal, and skin hydration [12,13,14,15,16,17].
Amino acids also play an important role in skincare, primarily due to their humectant properties and contribution to maintaining the skin’s protective barrier. Compounds such as L-lysine, L-valine, L-leucine, L-aspartate, and tryptophan support hydration, regeneration, and metabolic processes essential for maintaining skin structure and resilience [18,19,20,21,22]. Topical application of cosmetics containing amino acids, such as serums or creams, enhances the absorption of active ingredients directly into the skin. This approach supports both intensive hydration and the stimulation of collagen synthesis, thereby promoting epidermal regeneration, improved elasticity, and overall skin firming [23,24].
In this study, extracts were prepared from white grape pomace. Decyl glucoside at a concentration of 2% (w/w) (DG2p) was used as the extraction medium. Decyl glucoside belongs to the group of non-ionic surfactants known as alkyl polyglucosides, which are considered one of the key categories of sugar-derived surface-active agents. It consists of a hydrophilic glucose head and a hydrophobic alkyl tail. Due to their renewable origin, these surfactants are gaining increasing interest as biodegradable ingredients with documented dermatological mildness. In cosmetic formulations, they function as cleansing agents, foam stabilizers, and rheology modifiers [8].
In our previous studies, we demonstrated that decyl glucoside can serve a dual role—as an extraction agent and as an ingredient in the final cosmetic formulation—representing an innovative strategy for waste reuse [6,25]. However, despite growing interest in micellar extraction, previous studies have not indicated how specific extraction parameters affect the selectivity and efficiency of bioactive compound recovery.
This study advances this concept by developing and optimizing micellar extraction conditions using a decyl glucoside solution as an environmentally friendly, mild, and fully compliant with cosmetic standards medium for the recovery of bioactive compounds from grape pomace. The innovative nature of this work lies in establishing micellar extraction using DG2p as a formulation-integrated and industry-ready method for the valorization of grape pomace. This study represents the first systematic evaluation of DG2p micellar extraction parameters under conditions directly related to cosmetic applications, positioning it as a technological alternative to conventional solid-liquid extraction using organic solvents and demonstrating its real potential for implementation in cosmetic formulations.

2. Materials and Methods

2.1. Materials

Analytical standards for (+)-Catechin, (−)-Epicatechin, (−)-Catechin-3-gallate, (−)-Epicatechin-3-gallate, (−)-Gallocatechin, D-(−)-Guinic acid, Rutin, Syringic acid, L-Valine, L-Methionine, L-Tryptophan, L-Leucine, L-Histidine, L-Threonine, L-Lysine, L-Phenylalanine and L-Aspartic acid were purchased from Merck (Darmstadt, Germany), trans-Resveratrol from LGC (Teddington, England), and Gallic acid from POL-AURA (Zabrze, Poland). All standards used were of analytical purity (≥99%).
Certified plant raw material, approved for the production of natural products in accordance with ECOCERS and COSMOS standards, was used for extraction: decyl glucoside, DG (Plantacare 2000, BASF, Düsseldorf, Germany), distilled water.

2.2. Plant Material

The pomace derived from a mixed batch of Solaris, Muscat and Riesling (1:1:1) white grape cultivars was sourced from the Cwielong–Olszewski vineyard located in the Opole Province (Poland). All grapes were collected at full physiological maturity during the early harvest period in September 2024. The grape pomace samples were packed in polyethylene plastic bags, frozen, and stored at −28 °C for further analysis. The average dry matter content in the grape pomace samples was 53% and was measured using the thermogravimetric method (Mettler Toledo TGA2 Thermogravimetric Analyzer, Greifensee, Switzerland).

2.3. Preparation of Grape Pomace Extract—Extraction Procedure

The extraction experiments were conducted using white grape pomace as the plant material and a 2% (w/w) aqueous solution of decyl glucoside (DG2p) as the extraction medium. To evaluate the influence of process conditions, nine plant-material-to-solvent ratios were tested (1:99, 1:19, 1:9, 1:4, 2:3, 1:1, 3:2, 4:1, and 5:1, w/w). Additionally, the effects of extraction time (10, 20, 30, 60, and 120 min) and extraction temperature (20 °C, 30 °C, 40 °C, 50 °C, and 60 °C) were examined. For clarity and ease of reference, abbreviations were introduced throughout the manuscript to denote specific extraction conditions. To indicate the effect of the pomace-to-medium ratio, the code GPE_EM_ratio was used. The influence of extraction time was labeled as GPE_DG2p_t, while GPE_DG2p_T was used to represent the effect of temperature.
100 g of thawed grape pomace was weighed into 500 mL glass beakers, and the required amount of DG solution was added to obtain the desired extraction medium to material (GPE_EM) ratio. The mixture was homogenized for 1 min using a hand blender set at the lowest speed, paying particular attention to avoiding aeration, which could affect the stability of the active ingredients. The extraction process was carried out using a mechanical stirrer under constant stirring conditions, according to the established extraction parameters, including the pomace-to-extraction medium ratio, temperature, and extraction time. Each experimental point was performed in independent replicates.
After extraction, the mixture was filtered through a filter cloth to separate the solid fraction. Next, 5 mL of filtrate was collected from each extract for analysis and subjected to further purification by filtration using syringe filters. The purified extracts were transferred to Eppendorf tubes and stored under appropriate conditions until chemical analysis was performed.

2.4. Determination of Bioactive Compounds by UPLC-ESI-MS/MS

The separation of compounds present in the extracts was performed using a liquid chromatography system (Sciex ExionLC AD, AB Sciex, Vaughan, ON, Canada) equipped with a reverse-phase guard column and an analytical column (Kinetex XB-C18, 3.5 µm, 100 Å, 100 × 4.6 mm; Phenomenex, Torrance, CA, USA). Prior to analysis, all samples were filtered using sy-ringe filters with a pore size of 0.2 µm. The separation of compounds was performed un-der gradient elution conditions, and the detailed gradient program was given in the previous publication [6].
All analyses were performed in independent replicates to ensure the reliability of the results. Compound identification and quantification were conducted using a triple quadrupole mass spectrometer (4500 QTRAP, AB Sciex, Vaughan, ON, Canada) equipped with an electrospray ionization (ESI) source operating in both positive and negative ion modes. The ion source parameters were optimized as follows: ion spray voltage set to +4500 V (positive mode) and −4500 V (negative mode); source temperature at 600 °C; nebulizer and drying gas pressures at 50 psi; and curtain gas pressure at 35 psi.
Data acquisition and quantitative analysis were performed using ANALYST soft-ware version 1.7.2 (AB Sciex). Quantification of bioactive compounds in all extracts was carried out in multiple reaction monitoring (MRM) mode, providing high specificity and sensitivity. All compound-specific MS/MS parameters are provided in Supplementary Materials in Table S1. Calibration curves for each reference compound were generated based on the signal intensity of the most abundant MRM transition, using seven concentration points ranging from 1 to 100 mg/L and linear regression analysis.
Stock solutions of the standards were prepared by accurately weighing 10 mg of each compound and dissolving it in 10 mL of LC-MS grade methanol, resulting in a concentration of 1000 mg/L. Further dilutions for calibration were also made using LC-MS grade methanol. For chromatographic analysis, appropriate dilution steps were applied, and the diluted extracts were transferred into amber vials to a final volume of 1000 µL. The final results were recalculated accordingly. Additionally, the limits of detection (LOD) and limits of quantification (LOQ) for the analyzed compounds were determined and are detailed in Supplementary Materials in Table S2. The analysis was carried out in triplicate.

2.5. Determination of Total Phenolic Content (TPC)

The total phenolic content (TPC) was determined spectrophotometrically using the Folin–Ciocalteu (FC) method, following the protocol originally described by Singleton et al. [26], with slight modifications as detailed in our previous publication [6].
Absorbance measurements were carried out at 765 nm using a spectrophotometer (HP Hewlett-Packard, model 8452A, Palo Alto, CA, USA), with values recorded against a blank reference. A 2% (w/w) aqueous solution of decyl glucoside was analyzed as a blank sample. No significant interference of DG2p with the Folin–Ciocalteu assay was observed. In this study, grape pomace extracts were diluted tenfold with distilled water prior to analysis to ensure the phenolic concentrations fell within the linear detection range of the assay.
Results are presented as milligrams of gallic acid equivalents (GAE) per liter of ex-tract (mg GAE/L). All samples were analyzed in triplicate to guarantee the reliability and reproducibility of the data.

2.6. Determination of Antioxidant Activity

To evaluate the antioxidant activity of the extracts, two widely recognized and commonly used assays were employed. The first was the DPPH• (2,2-diphenyl-1-picrylhydrazyl) radical scavenging assay, which is based on measuring the extract’s ability to neutralize the stable DPPH• radical by donating an electron or hydrogen atom. The second method used was the ABTS•+ (2,2′-azino-bis(3-ethylbenzothiazoline-6-sulfonic acid)) radical cation assay, which assesses the antioxidant capacity by measuring the reduction of the colored ABTS•+ radical cation, reflecting the extract’s potential to act as a free radical scavenger. Together, these assays provide a comprehensive evaluation of the extracts’ effectiveness in combating different types of free radicals. Additionally, blank measurements using DG2p showed no significant interference with the DPPH and ABTS assays under the applied conditions.

2.6.1. DPPH Test

The antioxidant properties of the extract were evaluated using a modified method based on the procedure proposed by Brand-Williams et al. [27], with details described in our previous work [5]. Before analysis, the grape pomace extract was diluted tenfold with distilled water to adjust the sample concentration to the method’s measurement range. The free radical scavenging ability was expressed as milligrams of Trolox equivalent (TE) per liter of extract (mg TE/L).

2.6.2. ABTS Test

The antioxidant properties of the extract were assessed using a modified method based on the procedure proposed by Re et al. [28], a detailed description of which was presented in our previous publication [6]. In the present study, the grape pomace extract was diluted tenfold with distilled water to adjust the sample concentration to the meas-urement range of the method. The antioxidant activity was expressed as Trolox equivalent per liter of extract (mg TE/L).

2.7. Statistical Analysis

Statistical analysis was performed to evaluate the relationships between extraction parameters (pomace-to-medium ratio, extraction time, and temperature) and the content and antioxidant activity of phenolic compounds. Data obtained from LC-MS profiling, total phenolic content (TPC), and antioxidant capacity assays (DPPH and ABTS) were subjected to multivariate analysis. All variables were normalized using autoscaling to eliminate the effect of differing measurement scales. The values are reported as mean ± standard deviation (SD) based on three independent replicates (n = 3). Mean values were subjected to one-way ANOVA, Statistical analyses were carried out using Statistica software, version 10 (StatSoft, Tulsa, OK, USA). Hierarchical cluster analysis (HCA) was applied to assess the similarity among samples, using Ward’s method with Euclidean distance as the dissimilarity measure. The results were presented as dendrograms showing the grouping patterns of extracts obtained under different process conditions and were used as an exploratory visualization approach to assess similarities and grouping tendencies among samples, supporting the interpretation of the experimental data. Separate analyses were performed for: GPE_EM ratio—to evaluate the influence of the pomace-to-medium proportion, GPE_DG2p_t—to assess the effect of extraction time, GPE_DG2p_T—to determine the impact of temperature.

3. Results and Discussion

3.1. Extraction Process

The aim of this study was to develop the extraction process of bioactive compounds from grape pomace, a by-product of the wine industry and a rich source of polyphenols [10,11,12]. The study presents a comprehensive analysis of the influence of three key process parameters (raw material-to-medium ratio, temperature, and time) on extraction yield in the micellar system, combining high-resolution UPLC–MS/MS analysis with UV–VIS methods (TPC, ABTS, DPPH). This approach allowed for the simultaneous assessment of both quantitative and qualitative trends.
The appropriate selection of extraction conditions is crucial, as it is the process parameters that determine which compounds and in what quantities will be transferred from the grape pomace to the micellar solution. Before initiating the study, we conducted a detailed analysis of these factors and performed preliminary experiments to confirm the suitability of the selected conditions.
The choice of 2% (w/w) decyl glucoside solution was guided by several considerations: (i) the surfactant had to belong to the group of compounds approved by EcoCert and COSMOS for use in natural cosmetic formulations; (ii) the selected surfactant is a key ingredient in many cosmetic products and is widely applied in industrial practice; (iii) its concentration in the extraction medium must substantially exceed the CMC value to ensure the formation of micelles and enable micellar extraction; (iv) the type and concentration of the surfactant should exert only a minimal effect on system viscosity, as excessively viscous media are unsuitable for use as extraction solvents.
The ratio of raw material to medium affects both the concentration of recovered substances and the selectivity of the process, enabling the production of an extract with a specific bioactive profile. Grape pomace contains both compounds that are highly sensitive to temperature and those that require specific conditions to be effectively released; therefore, precise temperature control is essential to prevent lowering the extraction efficienty. Similarly, the process duration must be appropriately selected to allow the diffusion of compounds into the micelles without oxidation or decomposition. Experimental Design and Investigated Extraction Parameters are summerized in Table 1.

3.2. Determination of Selected Compounds by UPLC-ESI-MS/MS

In this study, ultra-high-performance liquid chromatography coupled with electrospray ionization tandem mass spectrometry (UPLC–ESI–MS/MS) was used to qualitatively and quantitatively analyze compounds extracted from grape pomace for each extraction parameter assessed (Pomace to Medium ratio, extraction temperature, and extraction time). The results were expressed in mg/L. The analytes were grouped into two primary categories based on their chemical nature: polyphenolic compounds and amino acids.

3.2.1. Effect of the Grape Pomace-to-Extraction Medium Ratio

Table 2 and Figure 1 present the results of the determined polyphenolic compounds and amino acids in grape extracts depending on the GPE_EM_ratio.
Polyphenolic Compounds
The total concentration of polyphenolic compounds increased significantly with in-creasing proportion of grape pomace in the extraction medium. The highest sum of phenolic compounds was recorded at a 1:1 GPE_EM ratio, reaching 1795 mg/L. (−)-Epicatechin (up to 1180 mg/L) and (+)-Catechin (up to 612 mg/L) predominate, while Rutin, Gallic ac-id, Syringic acid, and trans-Resveratrol remain at levels in the µg–mg/L range. The trend of Catechin/Epicatechin dominance and low levels of rutin and resveratrol are consistent with numerous literature reports [29,30,31,32,33].
Amino Acids
In the case of amino acids, their total concentration increased consistently with a higher proportion of pomace in the extraction system. The highest cumulative content was observed at a GPE_EM ratio of 5:1, reaching 160 mg/L. Among the quantified amino acids, the most abundant were L-Lysine (47.3 mg/L), L-Aspartic acid (35.5 mg/L), L-Leucine (20.6 mg/L), and L-Valine (19.6 mg/L). The amino acid composition of grape pomace is known to vary significantly depending on factors such as cultivar, harvest year, anatomical frac-tion (skin vs. seeds), and processing conditions [34]. Nevertheless, several studies em-ploying conventional extraction techniques have reported comparable amino acid pro-files, supporting the validity of the current findings [33,34,35].
The results indicate that the polyphenol-rich fraction is most effectively extracted at a GPE_EM ratio of 1:1, with only a slight decrease in efficiency observed in more concentrated systems, such as 3:2 and 5:1. The 1:1 ratio yields the highest concentrations of key compounds with strong antioxidant properties, while the 5:1 ratio is most favorable for extracting free amino acids, which also hold significant biological and cosmetic value. Depending on the intended application, a 1:1 ratio is optimal for extracts rich in polyphenols with high antioxidant potential. Conversely, a 5:1 ratio is preferred when aiming to increase amino acid content, supporting moisturizing and nourishing effects. For a balanced recovery of both phenolic compounds and amino acids, intermediate ratios such as 3:2 or 4:1 offer a suitable compromise.

3.2.2. Effect of the Grape Pomace-to-Extraction Temperature

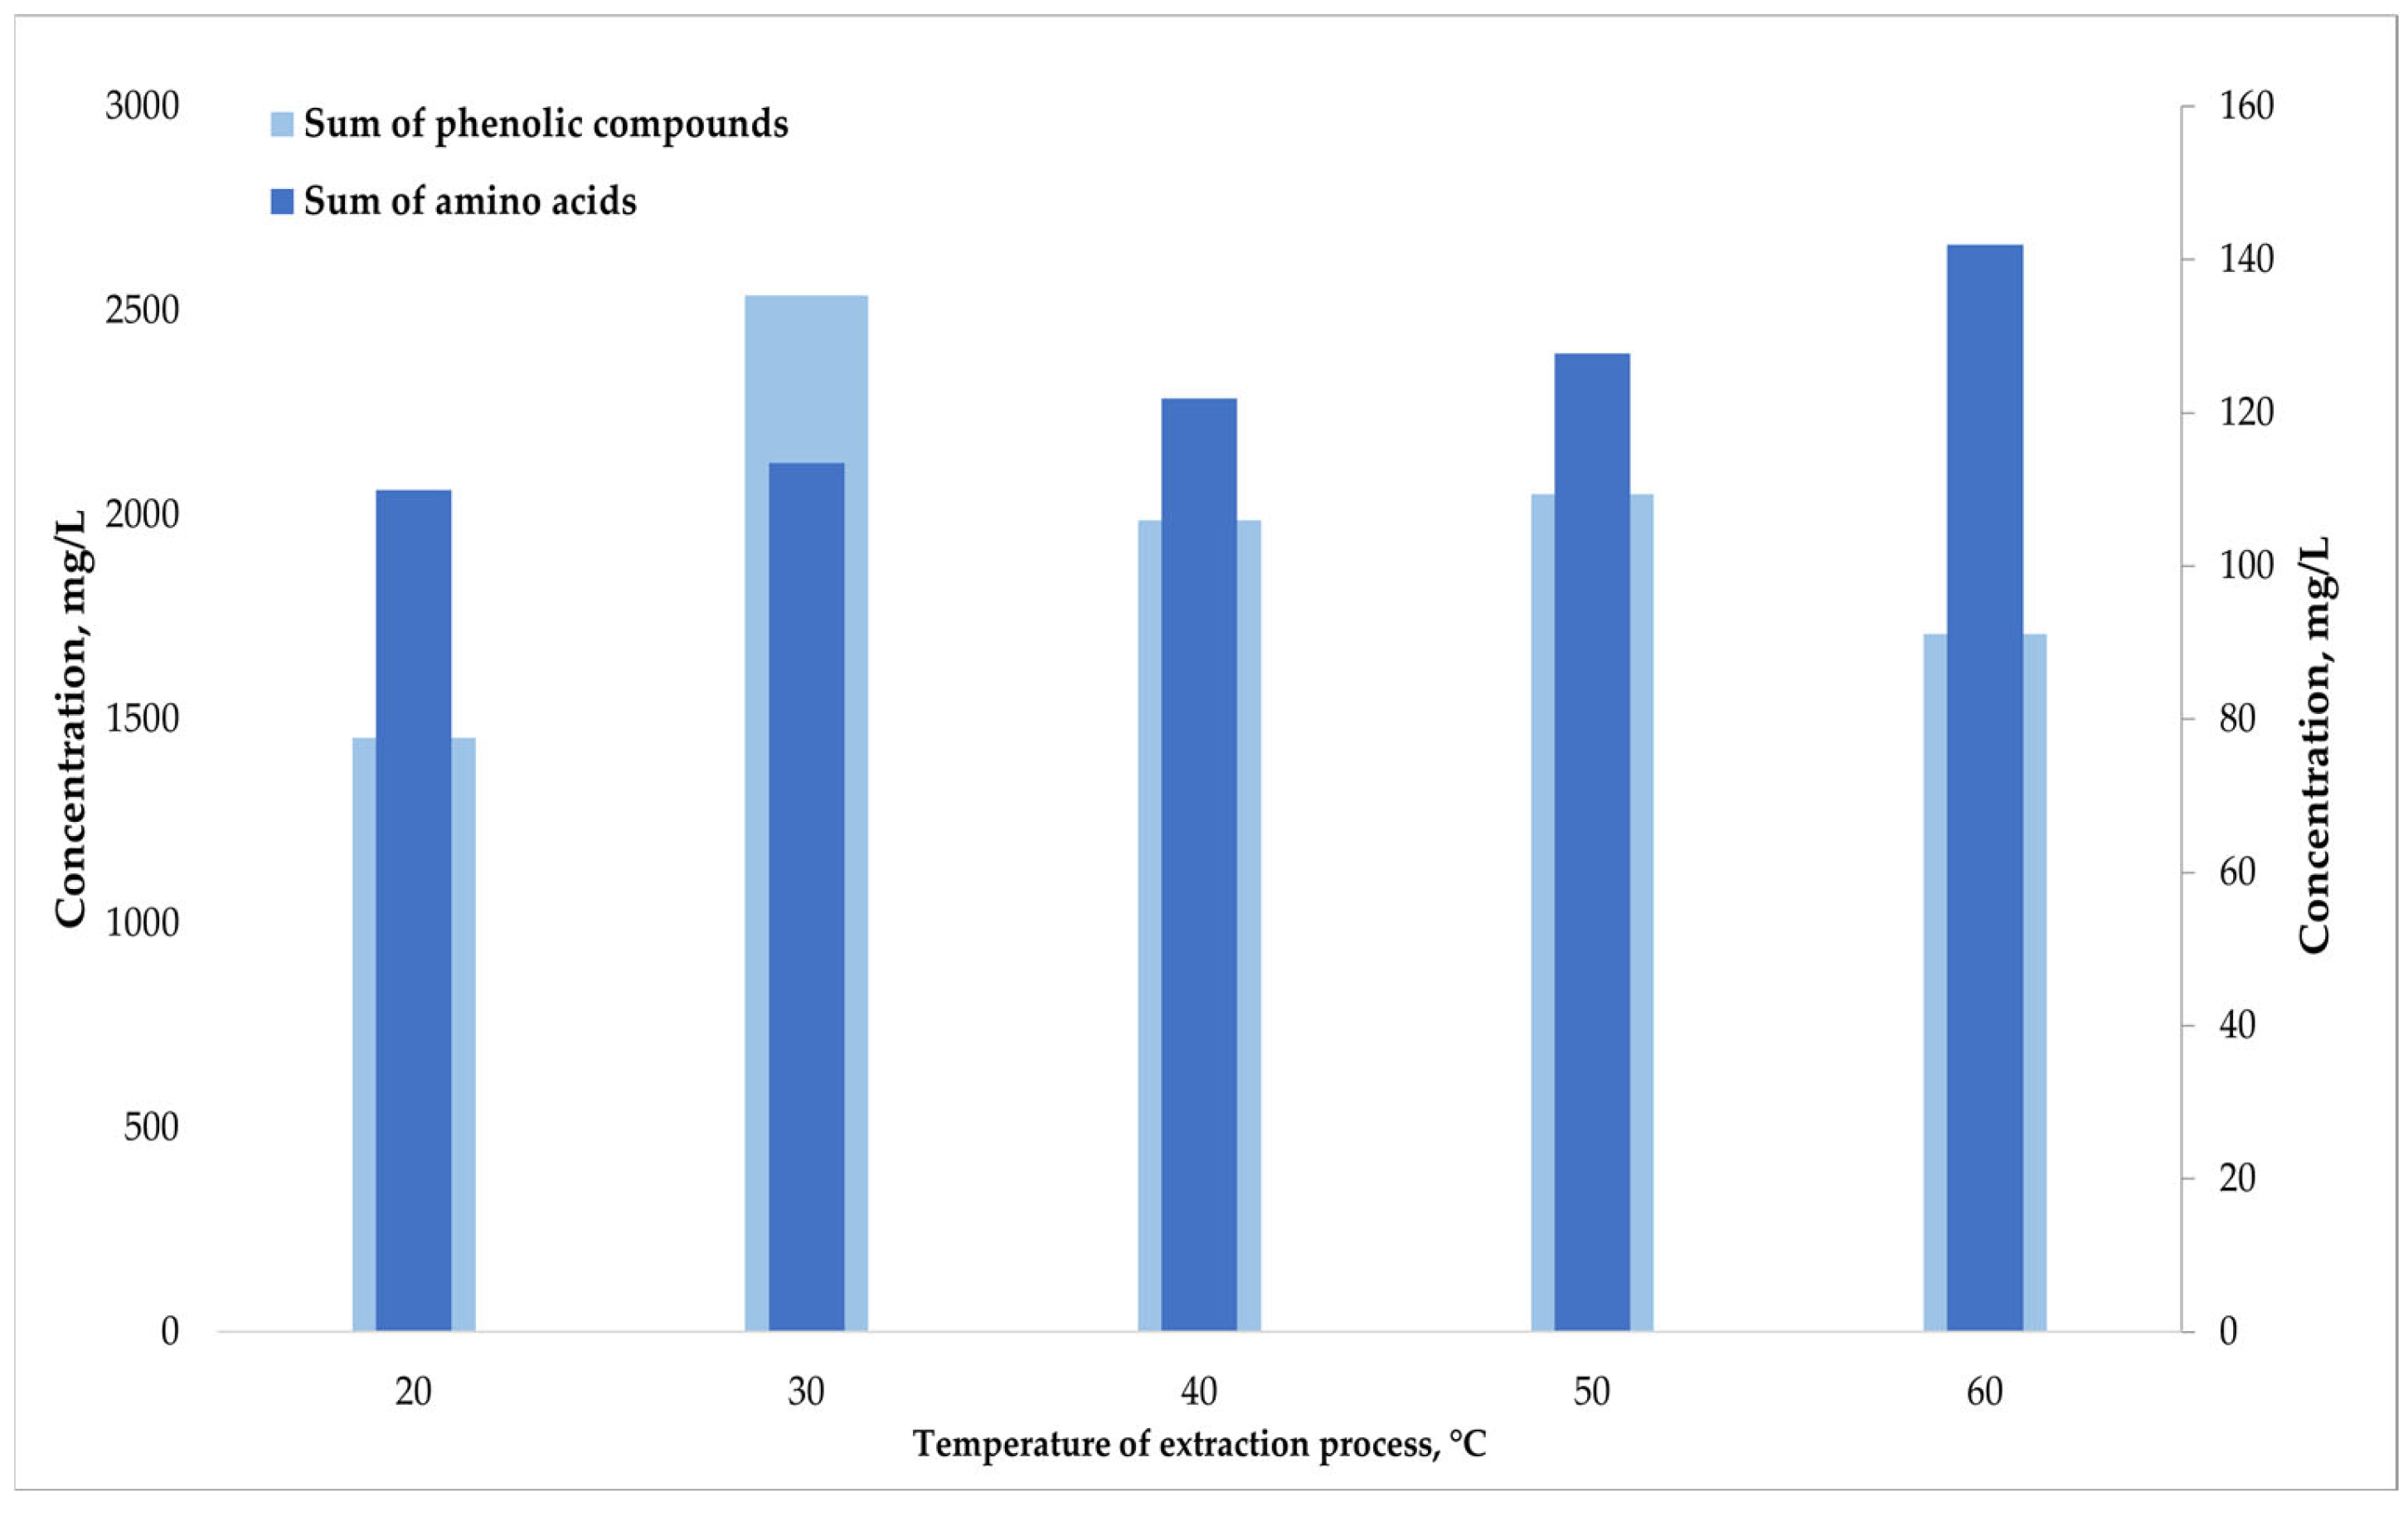
Table 3 and Figure 2 present the results of the determined polyphenolic compounds and amino acids in grape extracts depending on the extraction temperature.
Polyphenolic Compounds
The highest total concentration of polyphenolic compounds was recorded at 30 °C, reaching 2538 mg/L. Among the analyzed polyphenols, the most abundant were (–)-Epicatechin (1710 ± 14 mg/L) and (+)-Catechin (819 ± 3 mg/L). Catechin gallate and Epi-catechin gallate were also detected, although at significantly lower levels (below 1.5 mg/L). The obtained results are highly competitive when compared with traditional extraction methods carried out under similar temperature conditions. Goulas and Manganaris [36] reported total phenolic contents ranging from 9.8 to 14.5 mg GAE/g dry weight in ethanolic extracts conducted at 25 °C, whereas Maier et al. [37] obtained values of 6.5–12.0 mg GAE/g dw for white grape varieties at 30 °C. Although the measurement units are not directly comparable (e.g., mg GAE/g dry weight versus mg/L of extract), both approaches are commonly used depending on the extraction methodology and the intended interpretation of the results. In the present study, all concentrations were consistently expressed as mg/L of extract, which enables direct comparison between all analyzed samples, especially since all experiments were performed using the same batch of grape pomace. Nevertheless, the literature data still provide valuable qualitative confirmation of the high extraction efficiency achieved using the applied micellar extraction method, particularly regarding monomeric flavanols. For comparison, Spigno et al. [38] showed that catechin and epicatechin contents in ethanolic extracts from grape pomace ranged from 3 to 6 mg/g dw. The literature indicates that higher extraction temperatures favor a more efficient recovery of phenolic compounds in solvent extraction. For example Rodrigues et al. investigated the main extraction parameters (temperature—T, time—t, solvent concentration, and liquid–solid ratio—L/S). The optimized temperatures of 60 and 50 °C were found for ethanol and acetone, respectively [39].
Amino Acids
In the case of amino acids, a clear upward trend in their concentrations was observed with increasing extraction temperature. The highest total amount of quantified amino ac-ids was recorded at 60 °C, reaching 142 mg/L, which may indicate enhanced release or improved solubility of these compounds at elevated temperatures. Among the identified amino acids, the highest concentrations were observed for L-Lysine (27.2 ± 0.4 mg/L), L-Leucine (26.6 ± 0.4 mg/L), L-Tryptophan (28.1 ± 0.4 mg/L), and L-Aspartate (24.9 ± 0.4 mg/L). It is noteworthy, however, that the differences compared to room temperature (20 °C), where the total amino acid content reached 110 mg/L, are relatively modest. The obtained total concentrations (113–142 mg/L) are consistent with literature data on grape pomace extracts obtained using conventional solvents. Islam et al. demonstrated that grape pomace contains significant amounts of amino acids, including tryptophan at levels ranging from 118 to 153 mg/kg [40].
Although the literature often suggests higher temperatures as beneficial for polyphenol extraction, our study found 30 °C to be optimal for extracting catechin and epicatechin, which possess strong antioxidant and photoprotective properties. Above this temperature, concentrations of these key compounds decrease. Therefore, 30 °C represents the best compromise between extraction efficiency, compound stability, and energy costs. Thermal degradation is often cited as the main reason for decreasing polyphenol yield [41]. However, the thermal stability of many compounds is influenced by multiple factors and extraction temperature affects not only the extent of degradation, but also which compounds are extracted. Therefore, thermal degradation alone cannot fully explain the reduction in phenolic yield at elevated temperatures, and the overall temperature effect should be interpreted with caution [42].
For amino acids, concentrations increased with temperature, reaching the highest level at 60 °C (142 mg/L). However, the difference compared to extraction at room temper-ature (20 °C, 110 mg/L) is relatively small, and the approximate 29% increase does not justify the significantly higher energy consumption or the potential risk of degrading thermolabile compounds. Individual amino acids (e.g., L-Lysine, L-Leucine, L-Tryptophan) showed slight measurable increases that do not warrant using high temperatures, especially in industrial or cosmetic applications where energy efficiency and extract stability are crucial.
In summary, a temperature range of 20–30 °C is most optimal for both polyphenols and amino acids, balancing extraction efficiency with preservation of bioactive compounds and energy savings. For amino acids, room temperature (20 °C) appears particularly practical, consistent with literature highlighting the limited impact of temperature compared to other extraction parameters such as extraction time, liquid-to-solid ratio, or solvent type.

3.2.3. Effect of the Grape Pomace-to-Extraction Time

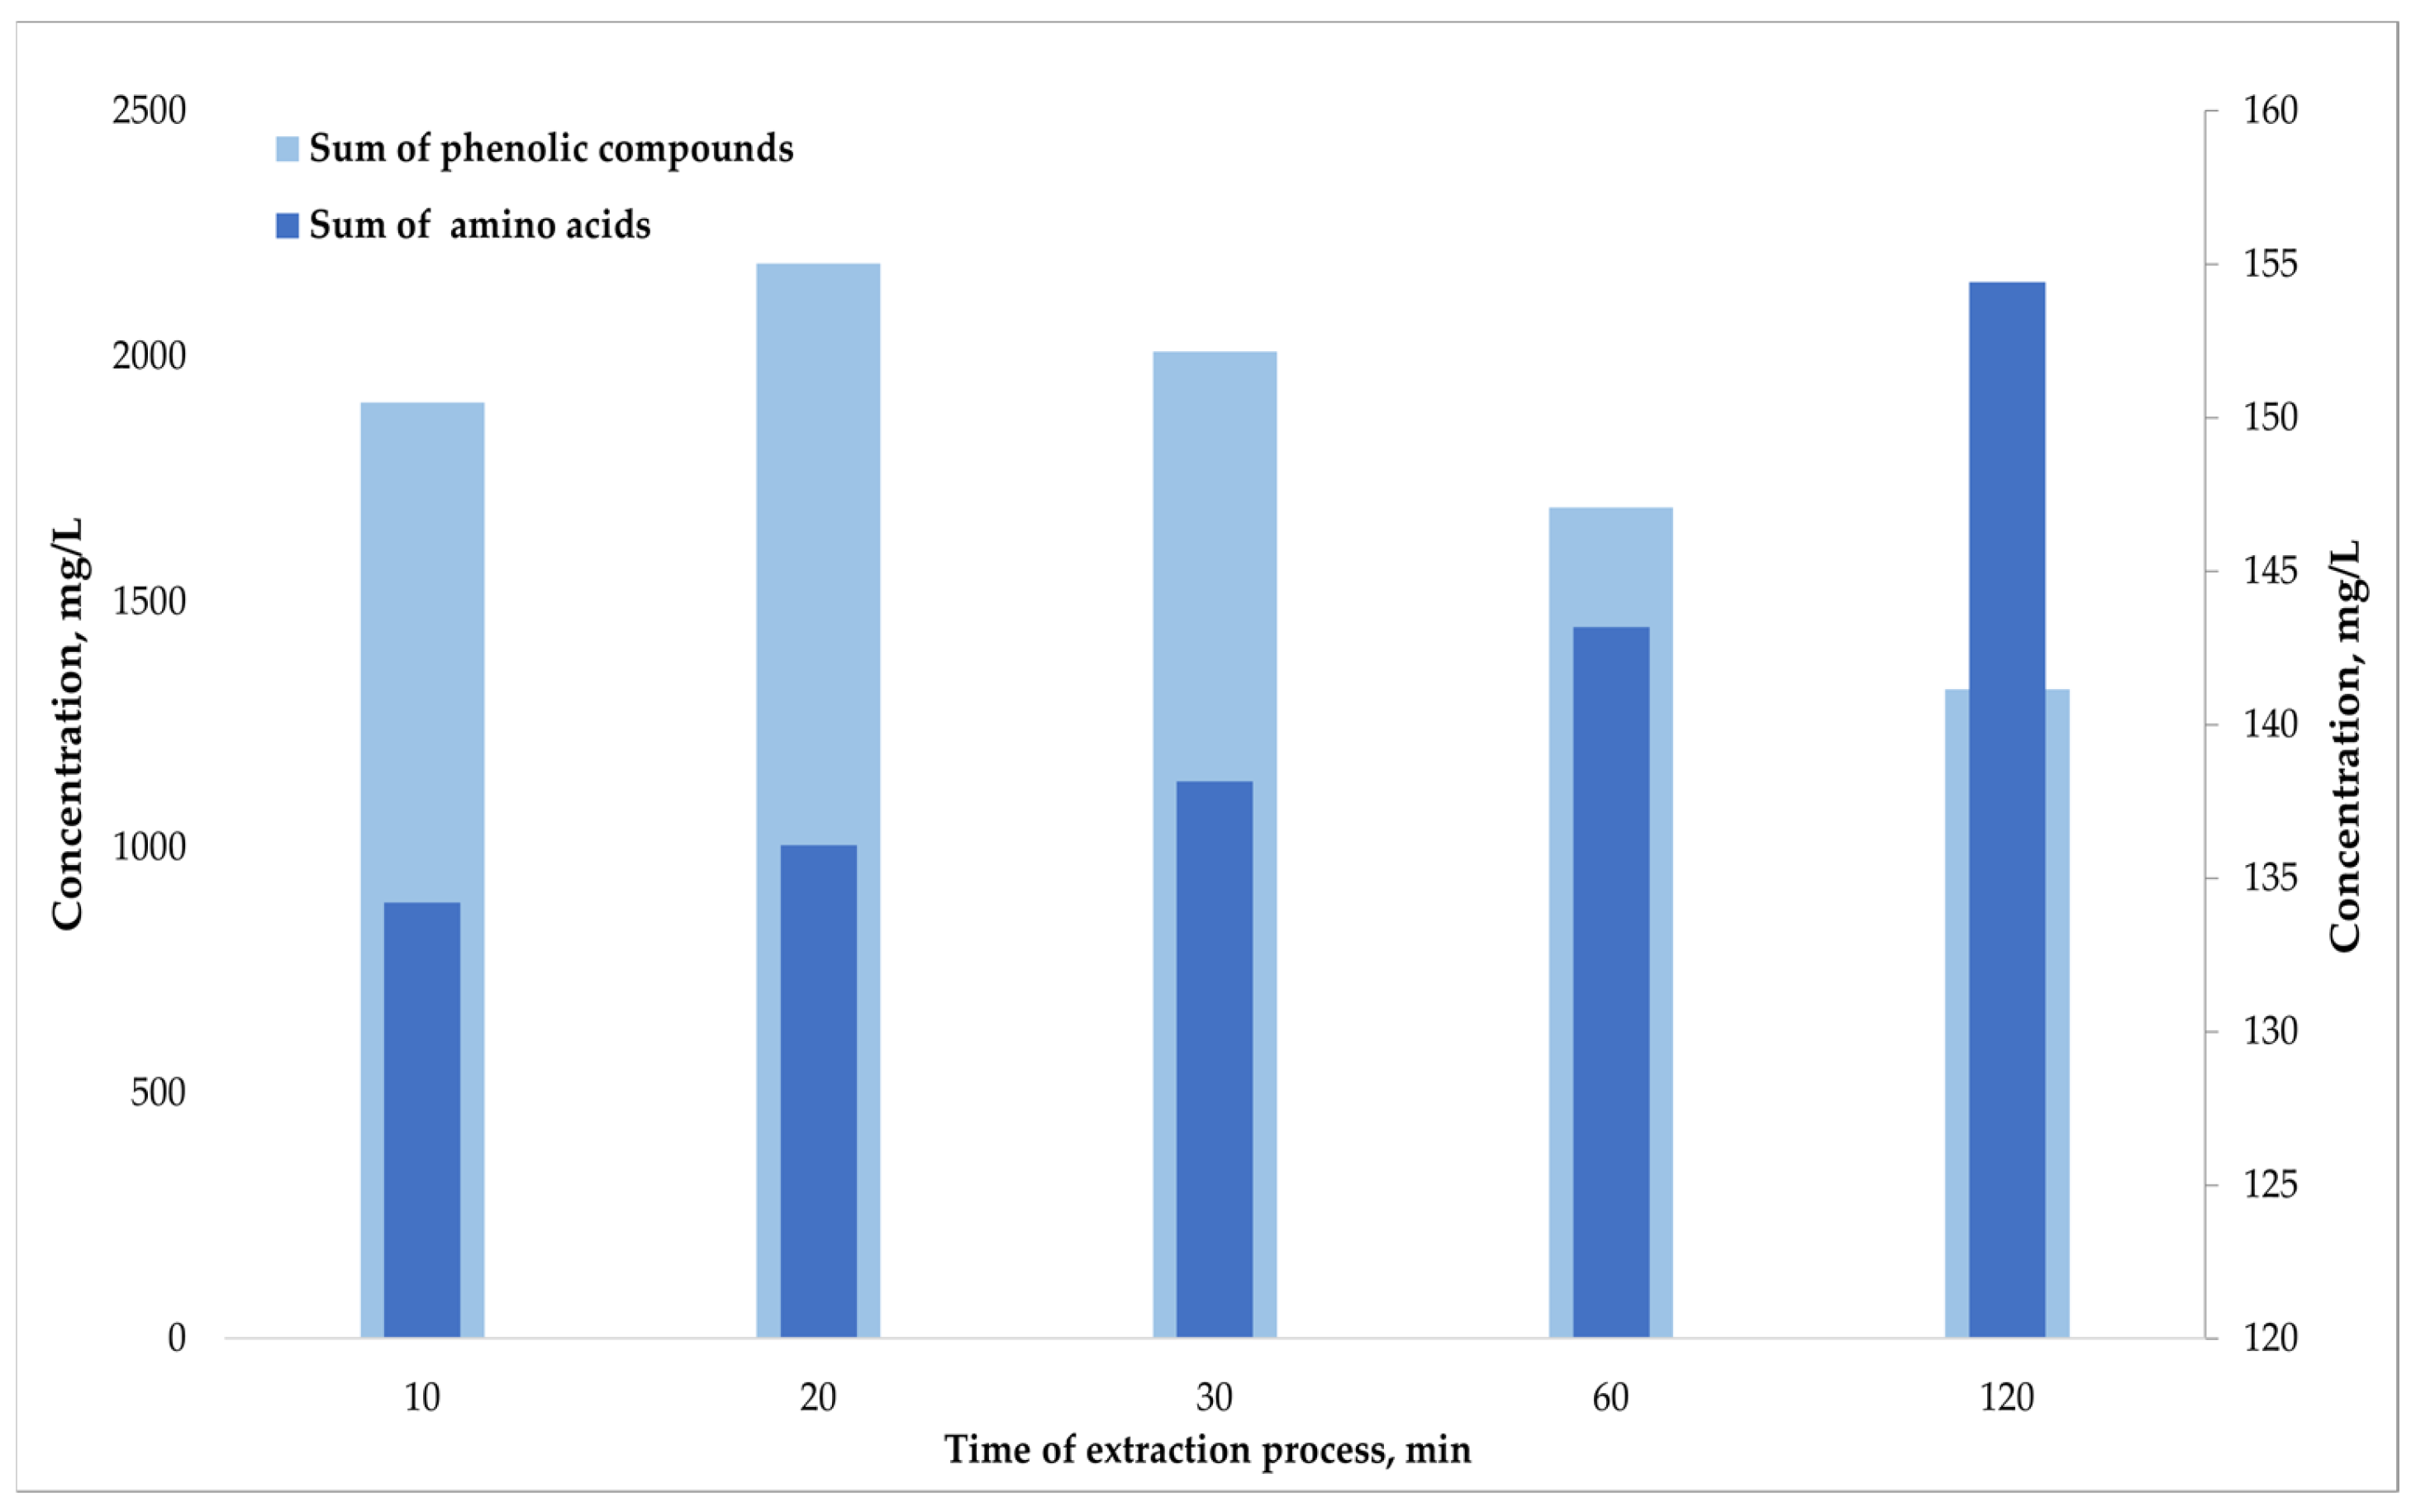
Table 4 and Figure 3 present the results of the determined polyphenolic compounds and amino acids in grape extracts depending on the extraction time.
Polyphenolic Compounds
In the conducted extraction studies, the most favorable results regarding polyphenol content were obtained after 20 min of processing. The total identified phenolic compounds reached 2189 mg/L, with the dominant compounds being (–)Epicatechin (1485 ± 12 mg/L) and (+)-Catechin (694 ± 4 mg/L). Compounds such as Epicatechin gallate (1.74 ± 0.04 mg/L), Catechin gallate (1.46 ± 0.02 mg/L), and the gallate equivalent of Gallo-catechin (1.37 ± 0.11 mg/L) were present in significantly lower amounts, which is consistent with their lower solubility and limited occurrence in plant material [43]. After exceeding 30 min of extraction time, a marked decrease in total polyphenol content was noted—from 2010 mg/L at 30 min down to 1323 mg/L at 120 min, suggesting possible degradation, oxidation, or reprecipitation of these compounds within the extraction matrix.
Literature confirms that effective extraction of phenolic compounds in a short time is possible when the process is intensified. Radulescu et al. described an ultrasonic-assisted extraction (UAE) of white and red grape pomace carried out for 20 min, with an initial temperature of approximately 35 °C and a final temperature of about 45 °C. The extraction medium was a 1:1 (v/v) mixture of absolute ethanol and water. The results demonstrated efficient extraction of polyphenols within this short time frame, in agree-ment with kinetic models supported by process intensification [44].
However, most scientific reports indicate that longer extraction times and higher temperatures are typically required to achieve satisfactory yields. For example, Spigno et al. showed that extraction at 45–60 °C using 60% ethanol (v/v) for over 20 h re-sulted in significantly higher polyphenol content [38]. It was also noted that increasing the temperature from 45 °C to 60 °C improves extraction efficiency, but further temperature increases may cause thermal degradation of phenolic compounds.
Amino Acids
In contrast to polyphenols, the total content of amino acids showed an increasing trend with longer extraction times, reaching the highest concentration of 154 mg/L after 120 min. Among the identified amino acids, the highest concentrations were observed for L-Aspartic acid (30.3 ± 0.6 mg/L), L-Lysine (28.1 ± 1.2 mg/L), L-Leucine (29.1 ± 1.4 mg/L), and L-Tryptophan (27.0 ± 1.0 mg/L). In a study by Onache et al. extraction was performed over 48 h at room temperature (~25 °C) using 50% ethanol as the solvent with continuous stirring [33]. The total quantified amino acid content reached 51.69 g/kg of dry weight, with proline being the most abundant amino acid at 11.15 g/kg dry weight.
The results indicate that the optimal extraction time for maximizing the recovery of phenolic compounds is around 20 min. Extending the extraction process may promote a greater release of free amino acids; however, the benefits are moderate. It is worth noting that after just 10 min of extraction, the total amino acid content reached 134 mg/L, suggesting that the differences between the shortest and longest extraction times were relatively small, though statistically significant. Therefore, an extraction time of approximately 20 min represents a good compromise, allowing for maximum recovery of phenolic compounds while maintaining a high level of amino acids, without the need to significantly prolong the process or risk potential losses of valuable components.

3.3. Determination of Bioactive Compounds: Total Phenolic Content (TPC) and Antioxidant Activity (DPPH, ABTS) by UV-Vis

In this study, the total phenolic content (TPC) and antioxidant activity (DPPH, ABTS) of grape pomace extracts obtained using aqueous micellar systems were evaluated. The aim was to determine the optimal extraction conditions, including the ratio of grape pomace to extraction medium, extraction time, and temperature. UV/Vis spectroscopy was employed for the analyses, and the results were expressed for TPC in mg/L of extract, DPPH and ABTS in mg TE/L. The use of concentration units expressed per liter of extract was adopted consistently throughout the study to enable direct comparison between extraction conditions applied to the same grape pomace batch.

3.3.1. Effect of the Grape Pomace to Extraction Medium Ratio

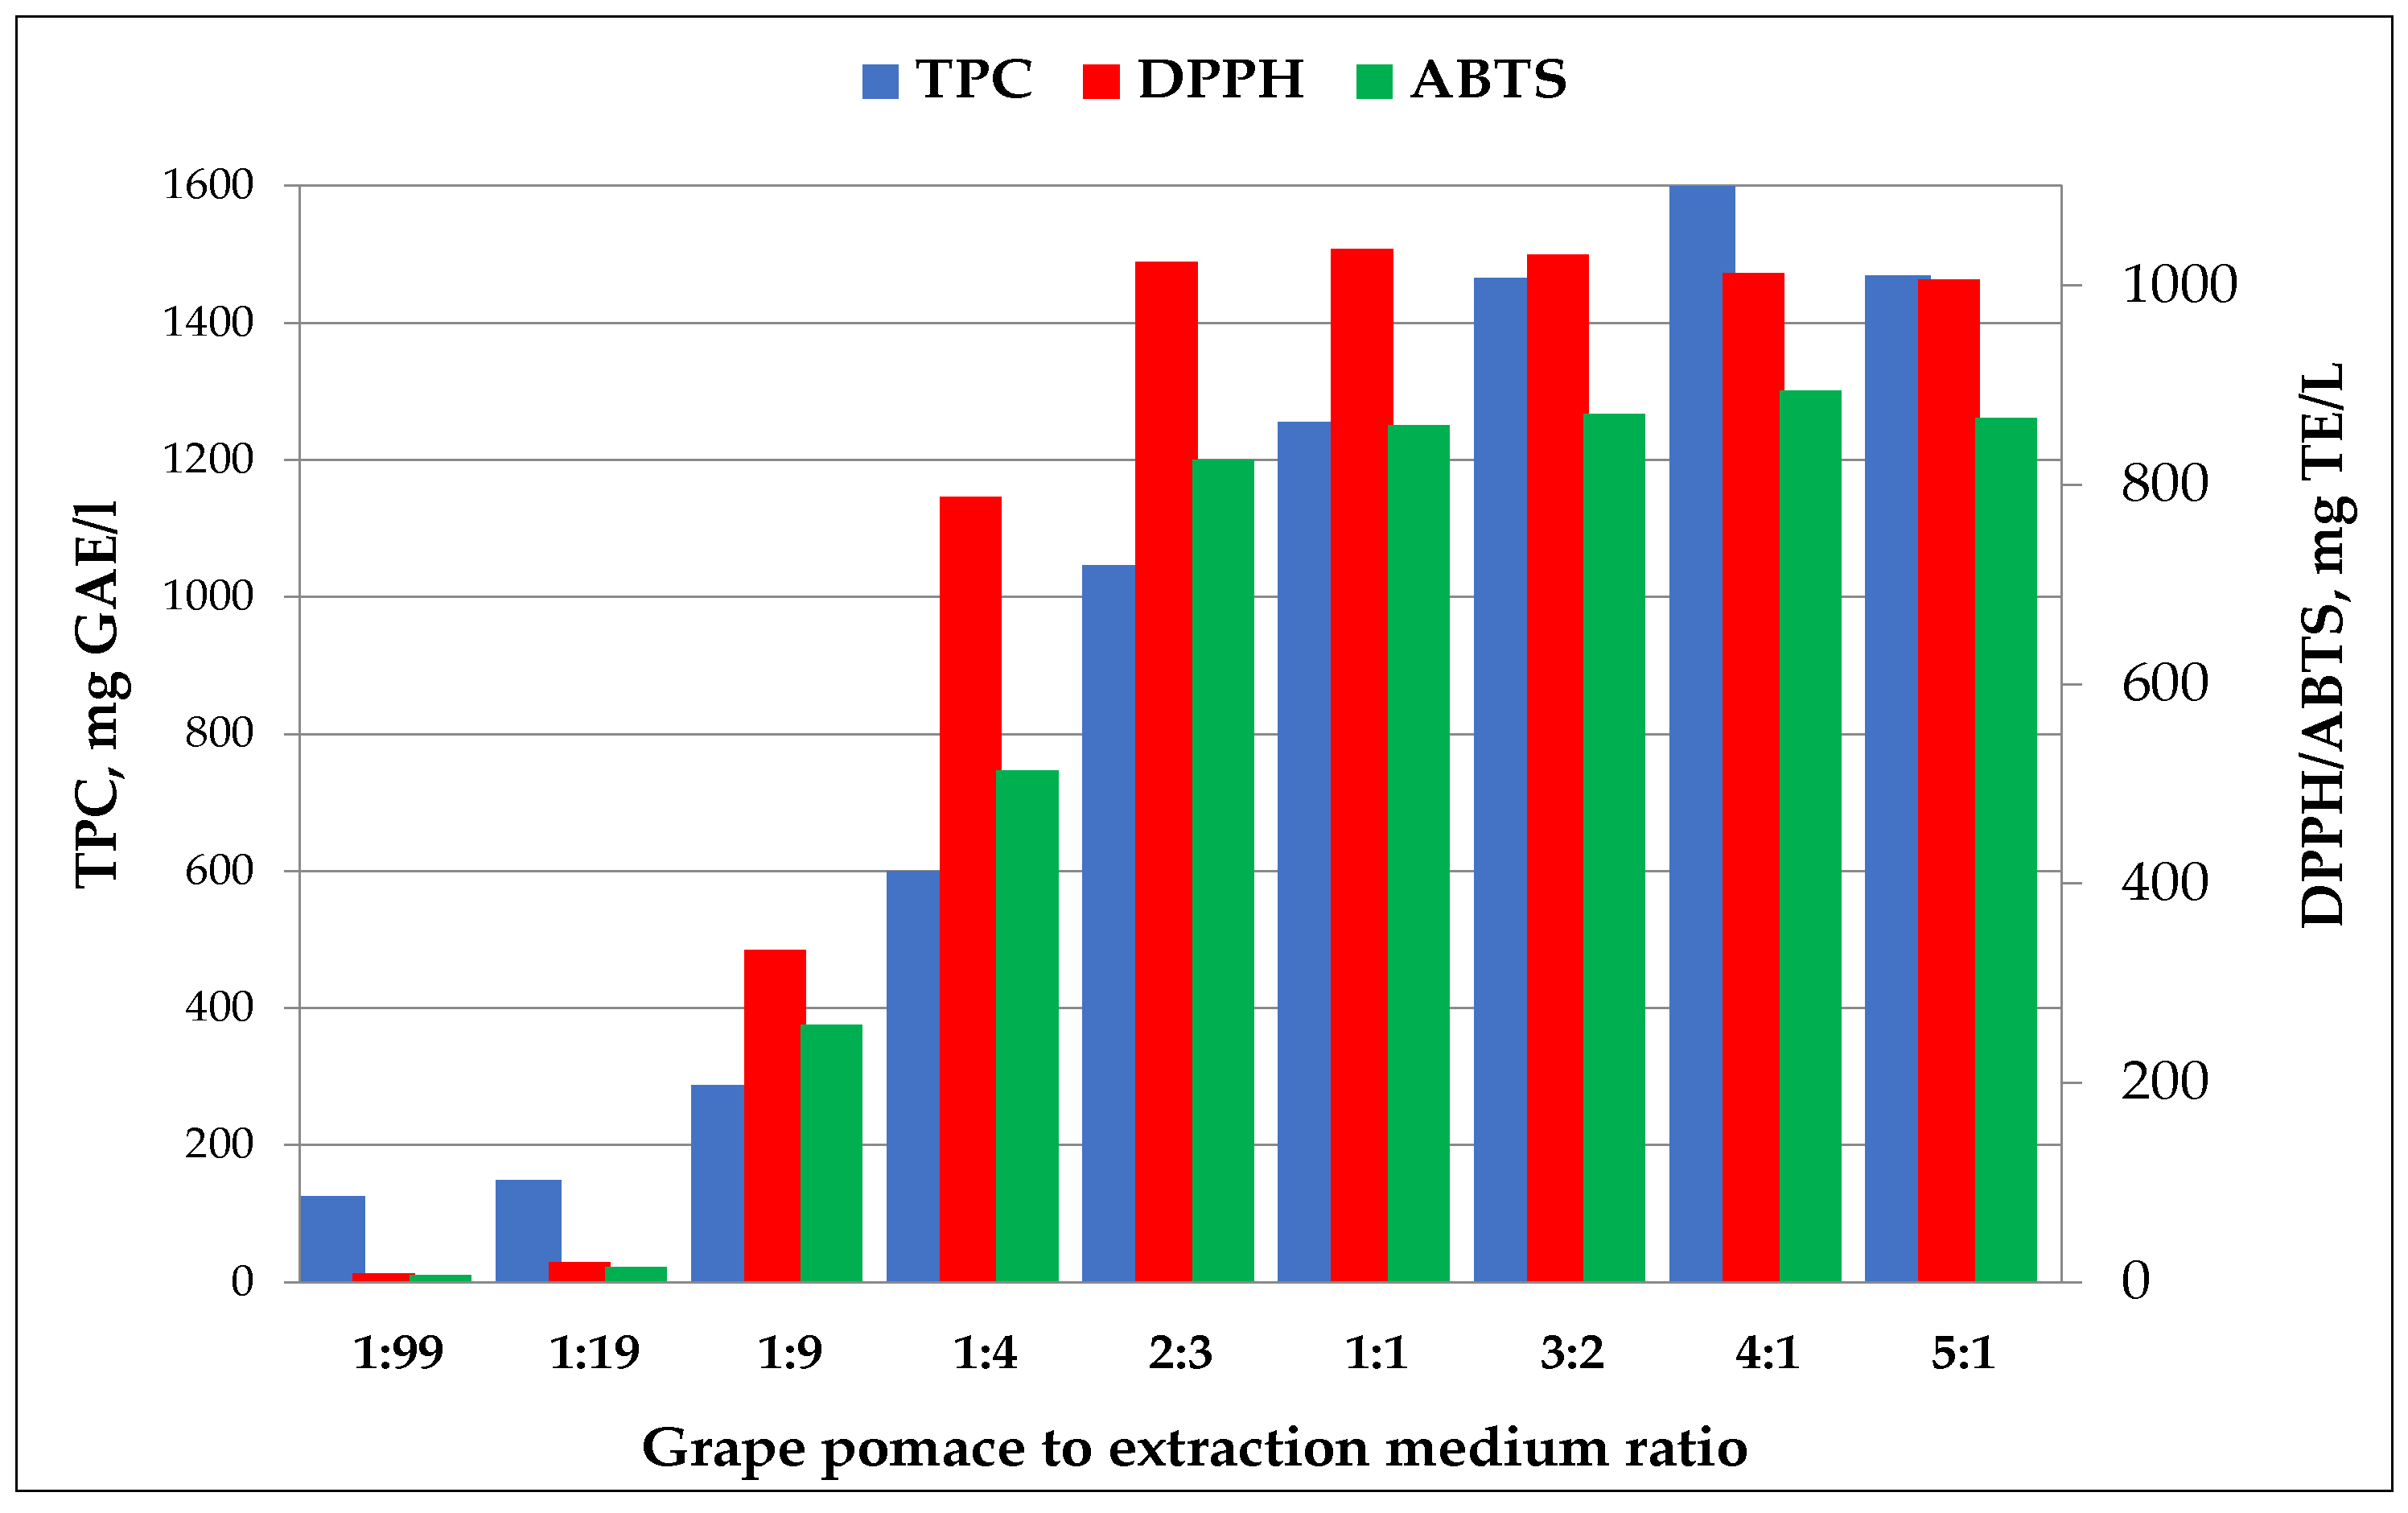
Table 5 and Figure 4 present the results of the effect of the grape pomace to extraction medium ratio on the total phenolic content (TPC) and antioxidant activity (DPPH, ABTS) of white grape pomace extracts. A clear trend was observed across all tested parameters. As the content of grape pomace in the extraction system increased, both the total phenolic content (TPC) and antioxidant activity also increased. The highest values were recorded at a 4:1 ratio, where the TPC reached 1599.0 ± 12.1 mg GAE/L, and the antioxidant activity measured 1012.2 ± 12.8 mg TE/L (DPPH) and 894.3 ± 10.2 mg TE/L (ABTS), respectively.
At lower pomace-to-solvent ratios (1:99 to 1:9), extraction efficiency was significantly reduced—TPC values ranged from 124.8 to 287.7 mg GAE/L, while antioxidant activity in both assays did not exceed 350 mg TE/L. This indicates that an insufficient amount of raw material does not allow the micellar medium to become saturated with bioactive compounds.
From a 1:4 ratio onward, a marked increase in extraction efficiency was observed. However, further increasing the pomace content to a 5:1 ratio resulted in a slight decline in both TPC and antioxidant activity. This may suggest saturation of the micellar phase or a reduction in extraction efficiency due to increased viscosity and hindered mass transfer within the system. Da Porto and Natolino [45] demonstrated that, under room temperature conditions (22 °C), an optimized liquid-to-solid (L/S) ratio of 50 mL/g, extraction time of 22 h, and ethanol concentration between 50–60% yielded a total phenolic content (TPC) of approximately 24 mg GAE/g dry weight. Similarly, Kwiatkowski et al. [46] reported that an L/S ratio of 6.6 mL/g, extraction time of 1 h, and 60% ethanol resulted in a TPC of 10.23 mg GAE/g dry pomace under optimized conditions. In more recent work, Rodrigues et al. [39] identified an optimal L/S ratio of 25:1 (25 mL of solvent per gram of dry pomace) for ethanol-based extraction, achieving a TPC of 38.70 ± 3.64 mg GAE/g.
In light of these reference data, the TPC and antioxidant activity values obtained in our study, measured using DPPH and ABTS methods, can be considered high, especially in the context of aqueous and aqueous-ethanolic extractions conducted at room tempera-ture. Nevertheless, they remain substantially lower than those obtained through the most effective ethanol-based extractions, such as those reported by Rodrigues et al. [39]. This difference is understandable, given the absence of organic solvents (which enhance the solubilization of phenolic compounds), the lower processing temperature, and the distinct extraction mechanism characteristic of micellar systems. In turn, the team led by Krstonošić [47] conducted research on micellar extraction of grape pomace at room temperature. The study highlighted the crucial role of the sol-vent-to-material (SM) ratio in the extraction process. The best results were achieved with an extraction time of 120 min and an SM ratio of 50 mL/g, yielding a total phenolic content (TPC) of 968.50 ± 37.06 mg GAE/L. The study on micellar extraction reported by Sazdanić similarly showed that reducing the solvent-to-material ratio from 100:1 to 10:1 increased polyphenol concentration in red grape pomace micellar extracts obtained with 3% Brij S20, indicating that more concentrated systems improve solute–micelle contact and loading. They also reported that 3% of poloxamer 407 and Brij S20 solutions yielded the highest total phenolic content compared with 1% and 2% concentration [48].

3.3.2. Effect of the Grape Pomace to Extraction Temperature

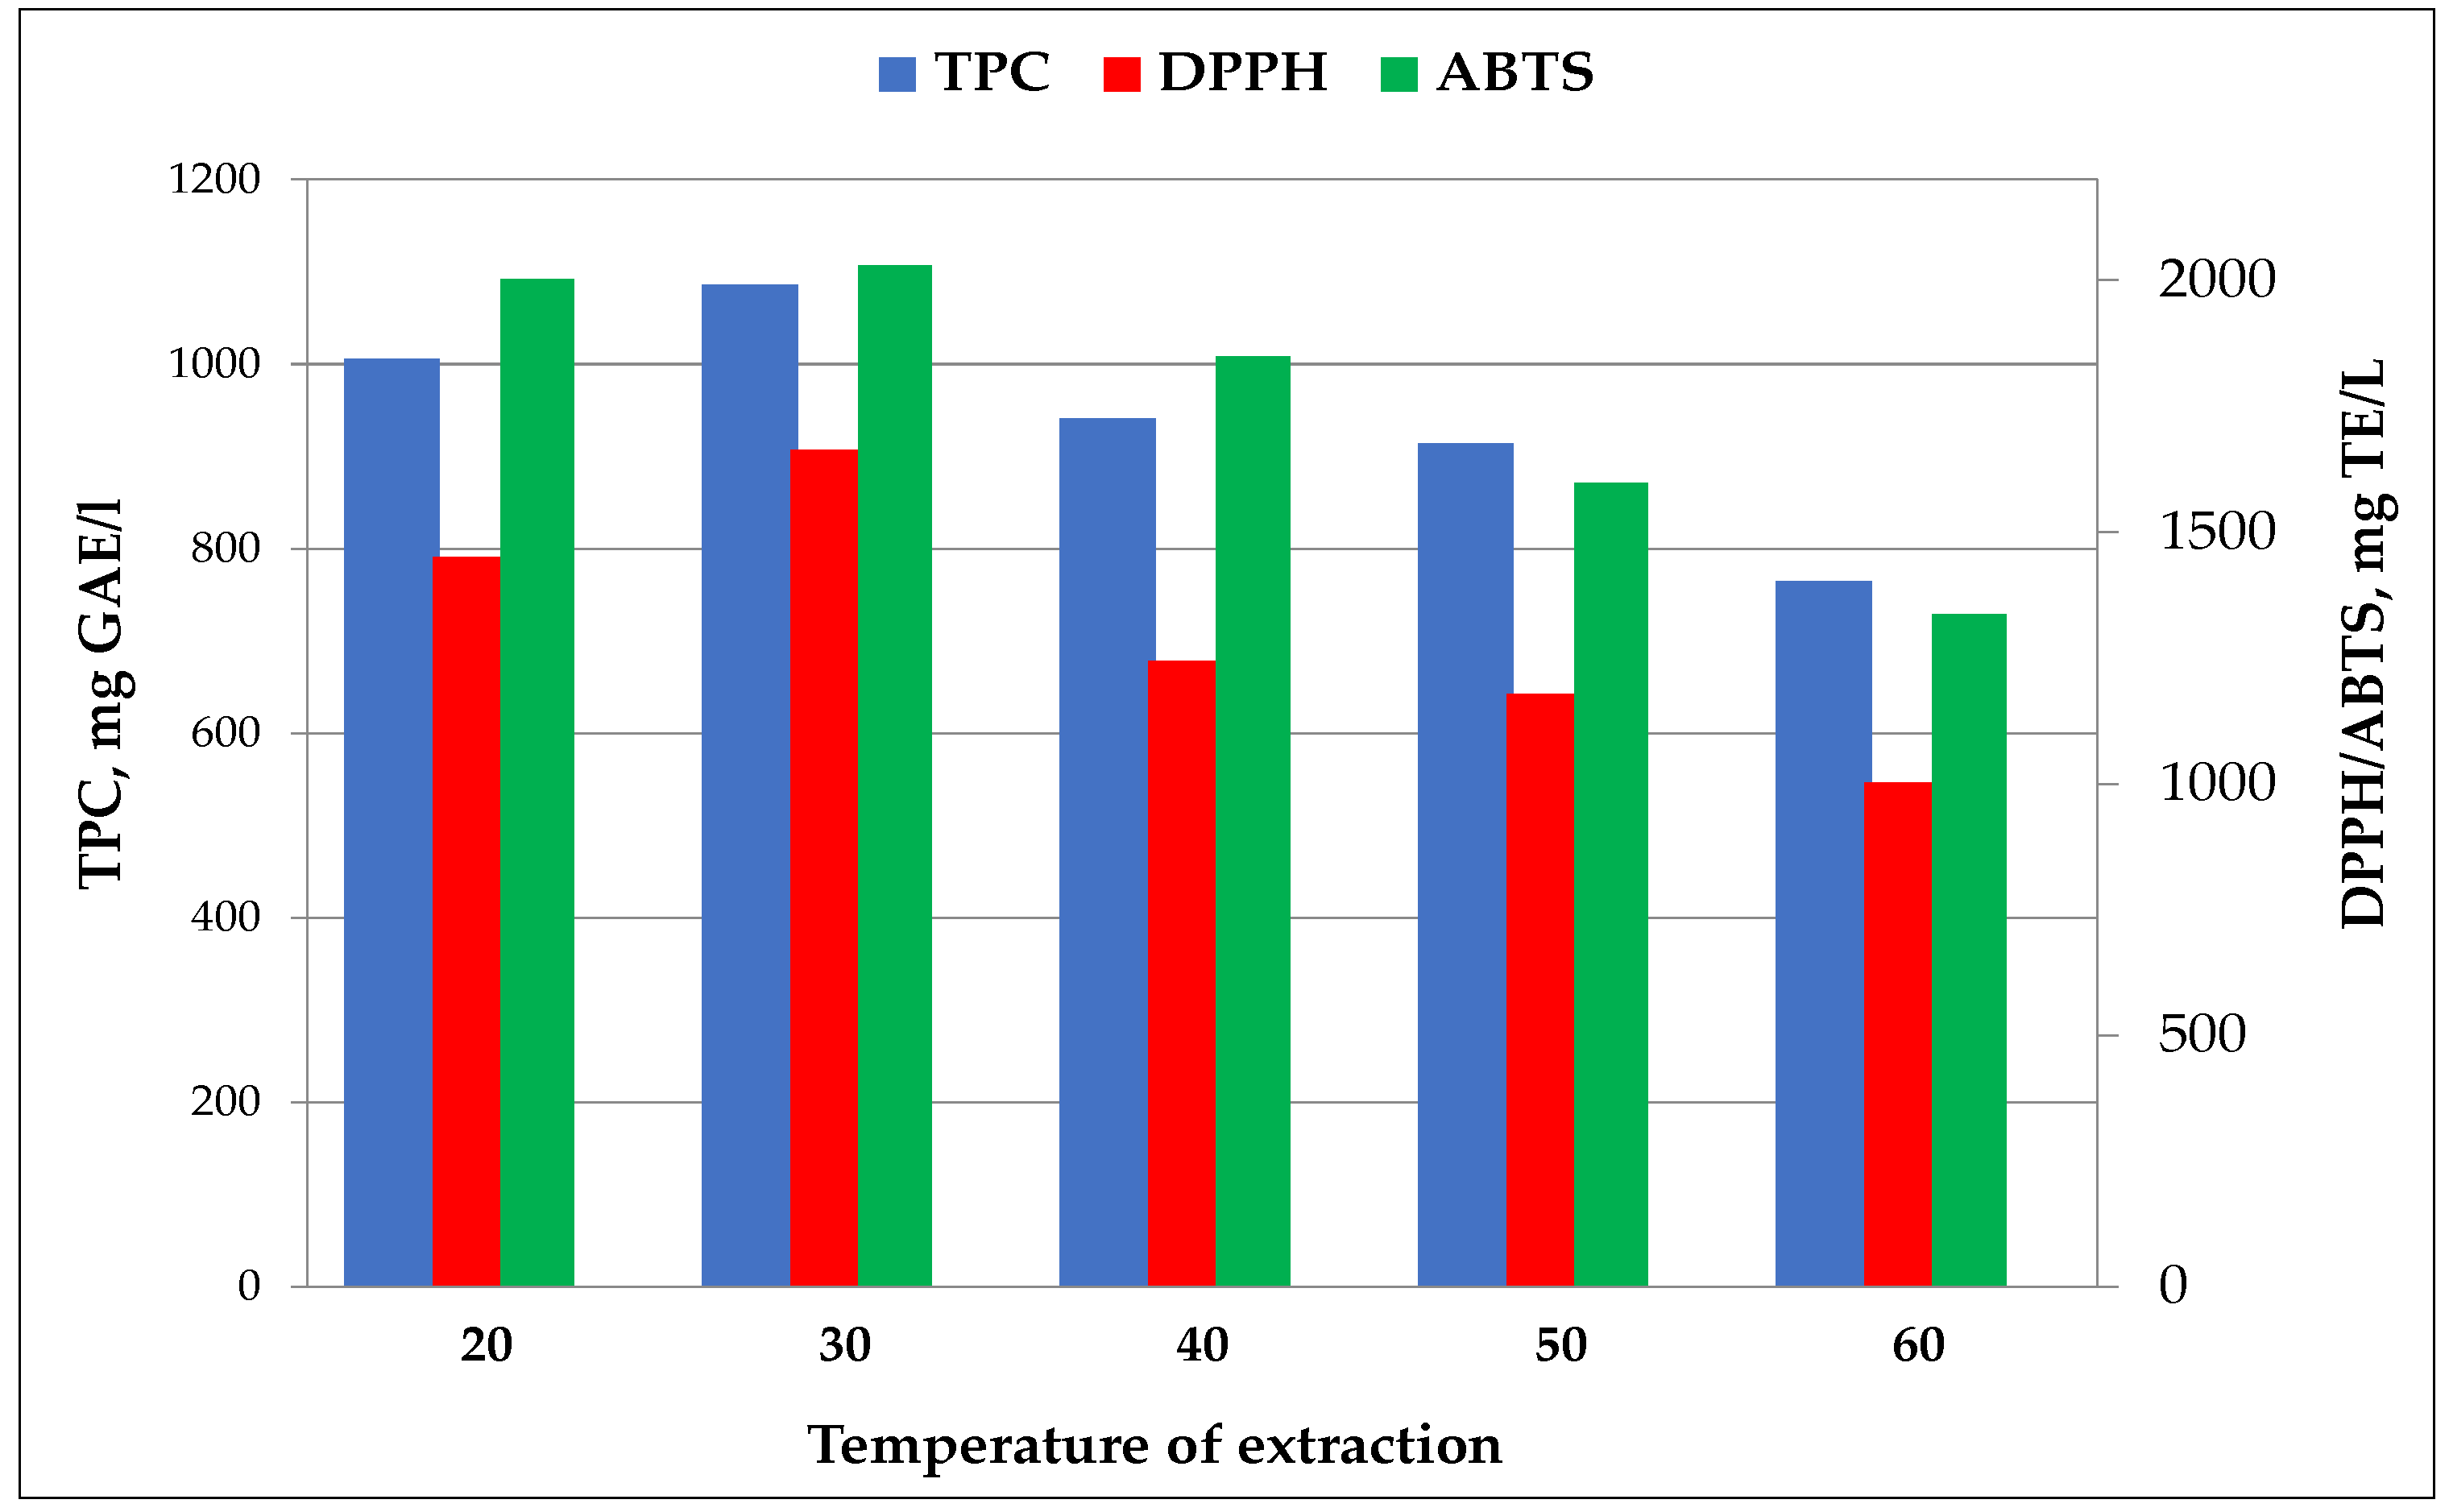
Table 6 and Figure 5 present the results of the effect of the grape pomace to extraction temperature on the total phenolic content (TPC) and antioxidant activity (DPPH, ABTS) of white grape pomace extracts.
In the present study, a clear effect of temperature on the extraction efficiency of phenolic compounds and the antioxidant activity of grape pomace extracts in a micellar system using DG2p was observed. Both total phenolic content (TPC) and radical scavenging activity, measured by DPPH and ABTS assays, reached the highest values at 30 °C, at 1085.9 mg GAE/L (TPC), 1662.6 mg TE/L (DPPH), and 2029.7 mg TE/L (ABTS), respectively. As temperature increased above this point, a systematic decrease in all three parameters was noted. This decrease could be attributed to the degradation of thermolabile phenolic compounds and potential structural changes in the micellar system, which lower the extraction efficiency. Temperatures above 40 °C proved unfavorable, while the range of 20–30 °C seems optimal for the recovery of bioactive compounds in the tested micellar medium. Xu et al. extracted white grape pomace in 80% acetone for 24 h at room temperature, obtaining a high TPC of 99.1 mg GAE/g dry weight, with antioxidant activity of 7.71 µmol TE/g (DPPH) and 751 µmol TE/g (ABTS) [49]. Vergara-Salinas et al. used pressurized hot water extraction (PHWE) at temperatures ranging from 50–200 °C for 5 or 30 min. Maximum TPC and antioxidant activity (DPPH and ABTS) were achieved at 100 °C with shorter extraction times. Exceeding this temperature or extending the extraction time led to a significant decrease in efficiency due to the degradation of phenolic compounds [50]. Similarly, Moutinho et al. investigated the effect of temperature in an ethanol and water extraction system. The highest TPC (44.93 mg GAE/g dry weight) was recorded at 60 °C with 70% ethanol content. These conditions also provided the highest antioxidant activity—an average of 0.30 mmol TEAC/g dry weight in both DPPH and ABTS assays, indicating a strong correlation between phenolic content and antioxidant potential [51].

3.3.3. Effect of the Grape Pomace to Extraction Time

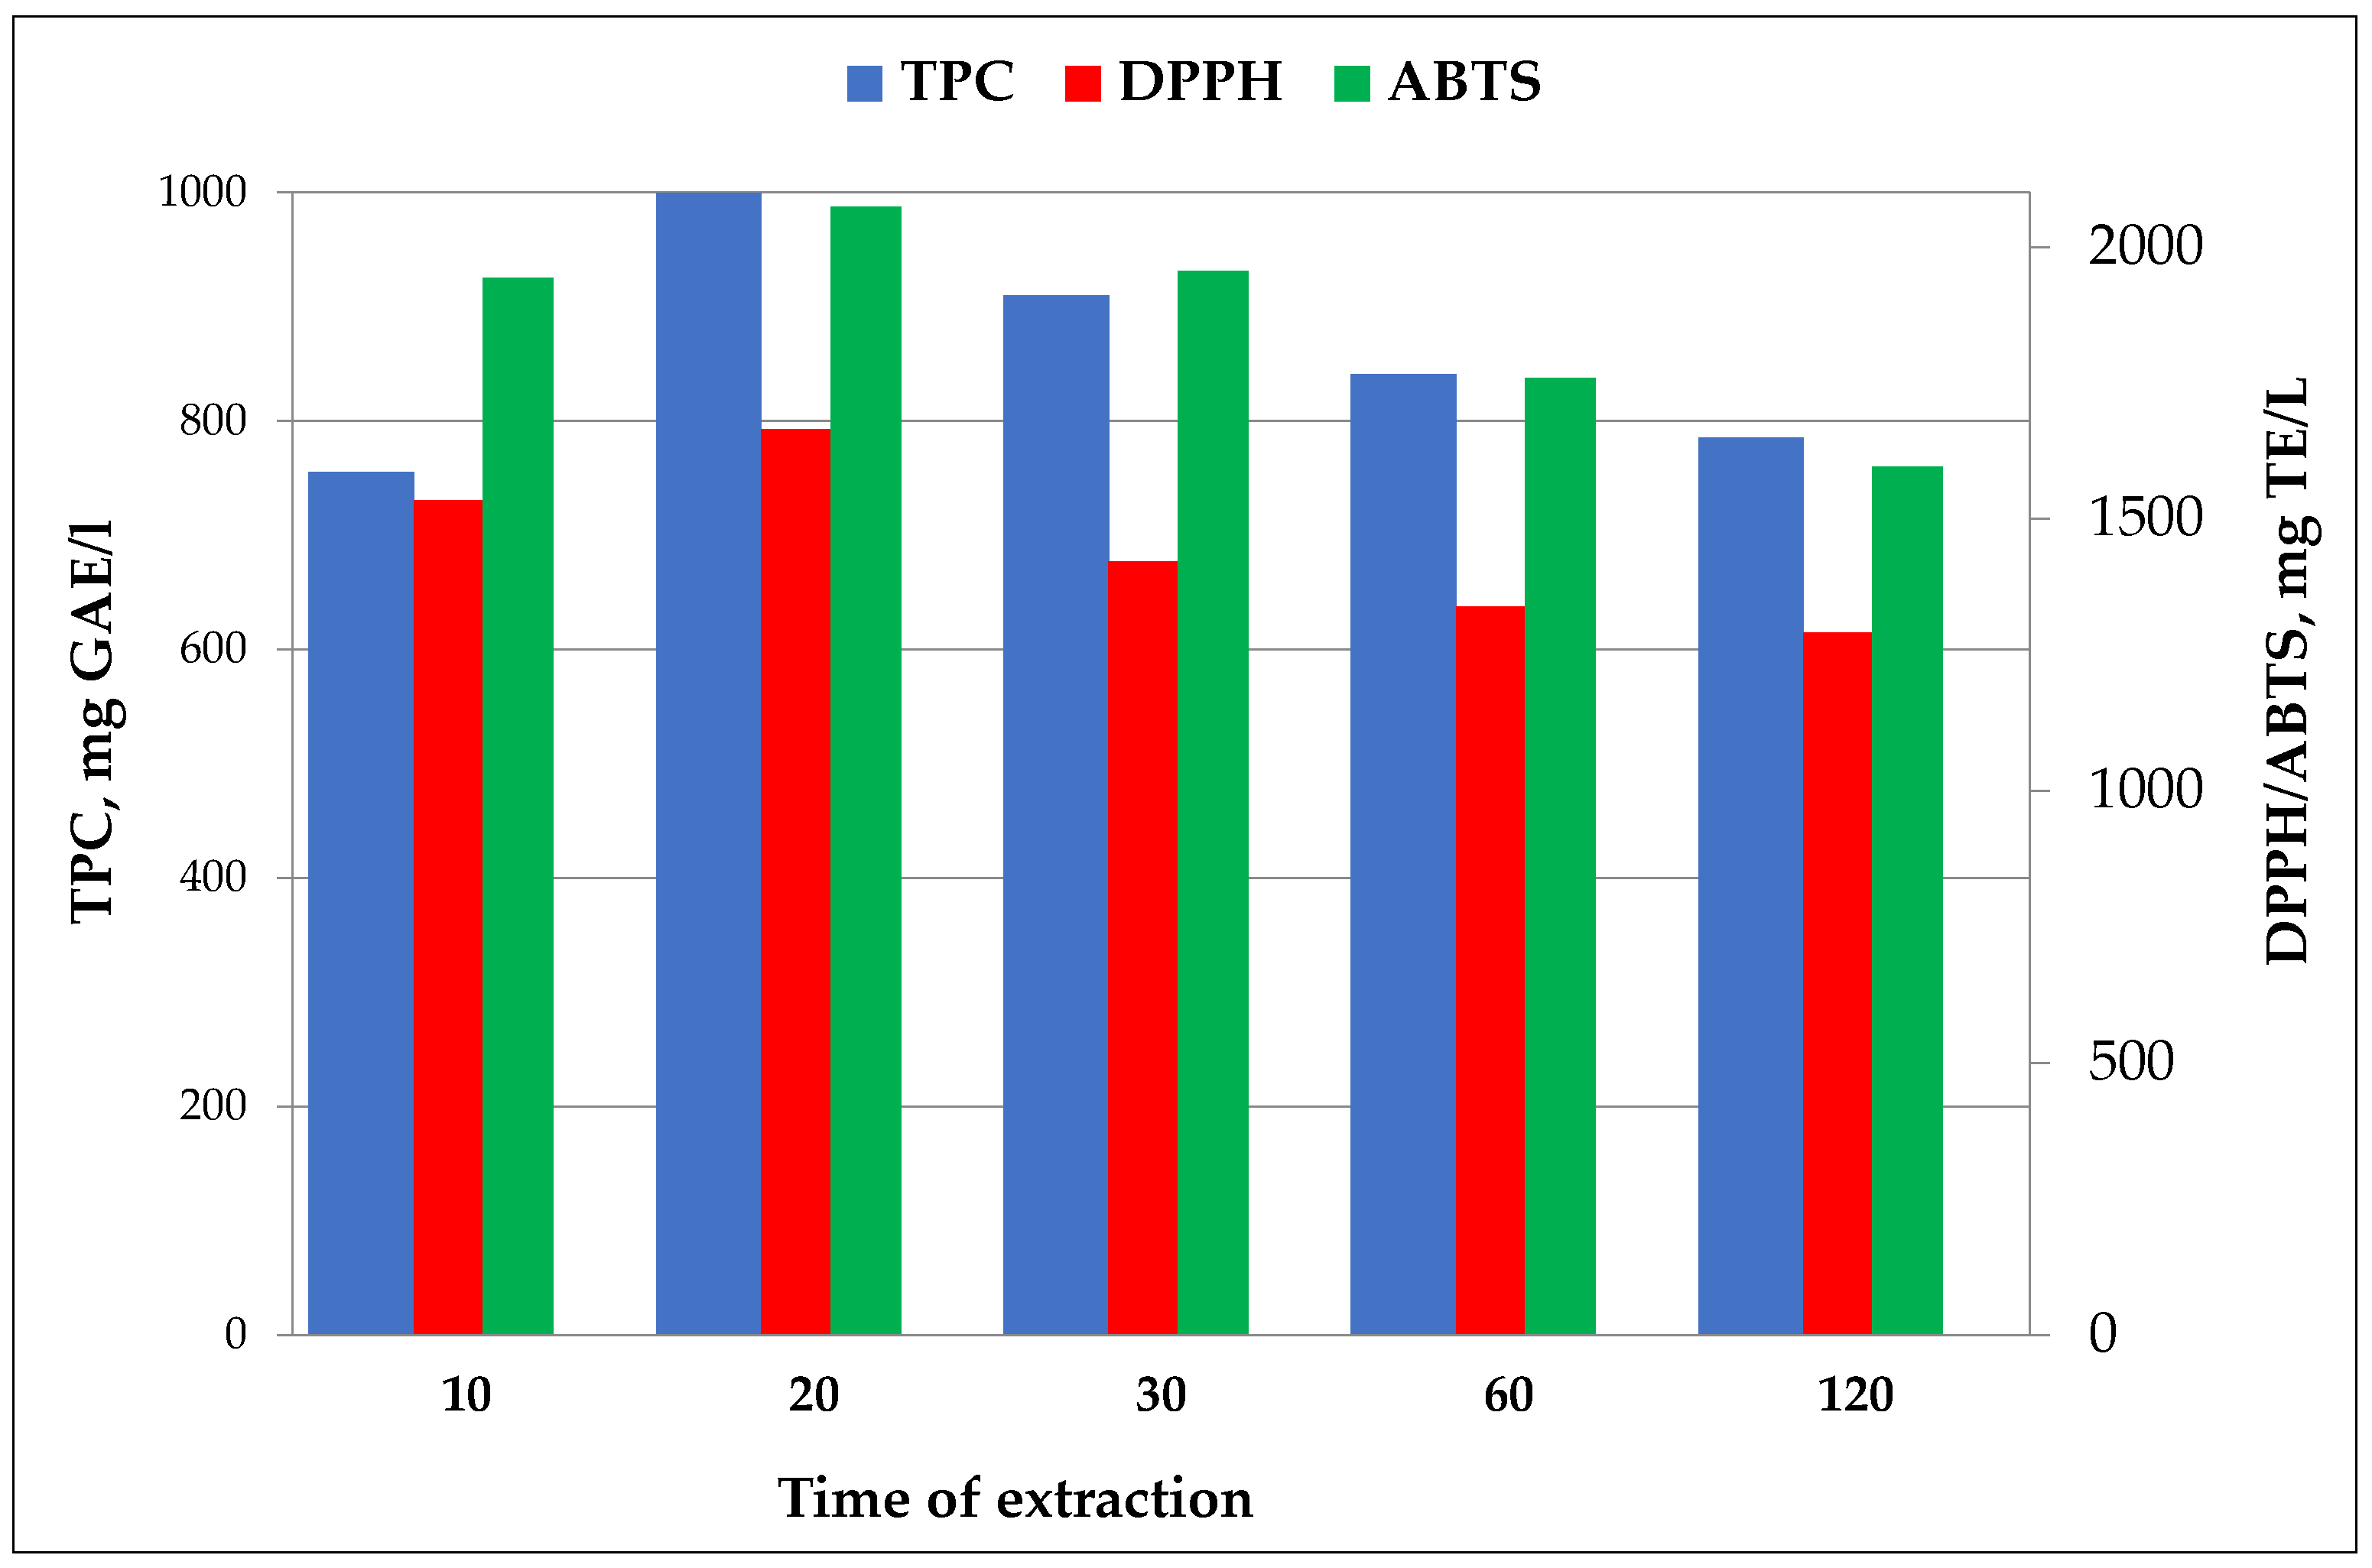
Table 7 and Figure 6 present the results of the effect of the grape pomace to extraction time on the total phenolic content (TPC) and antioxidant activity (DPPH, ABTS) of white grape pomace extracts.
Based on the presented data, a clear influence of extraction time on the total phenolic content (TPC) and antioxidant activity (measured by DPPH and ABTS assays) can be observed in the extract of white grape pomace using a micellar system with DG2p. The highest TPC was obtained after 20 min of extraction—999.7 mg GAE/L. Prolonging the extraction to 30 and 60 min did not result in further improvement; on the contrary, the TPC value gradually decreased, reaching 785.3 mg GAE/L after 120 min. In terms of antioxidant activity, the DPPH assay also showed a maximum at 20 min (1664.3 mg TE/L). Beyond this point, a noticeable decline was observed, with the lowest value at 120 min (1290.2 mg TE/L). A similar pattern was noted for the ABTS method, with the peak value also recorded at 20 min (2073.1 mg TE/L), followed by a marked decrease after 60 and 120 min (1595.4 mg TE/L). These findings indicate that the optimal extraction time is 20 min. Further extension of the process leads to a gradual decline in both phenolic content and antioxidant capacity, likely due to the degradation of bioactive compounds or the exhaustion of their readily extractable forms. These results are consistent with the findings of Spigno et al. [38], who showed that longer extraction times (up to 24 h) at elevated temperature (60 °C) initially increased the total phenolic content (TPC), but after about 20 h a decline occurred, likely due to thermal degradation. Antioxidant activity measured by the ABTS assay was strongly correlated with the phenolic content extracted. Similarly, Sokač Cvetnić et al. [52] optimized the solid–liquid extraction of bioactive compounds from white grape skins using water as the solvent. They evaluated the effects of extraction time (60, 75, and 90 min), temperature (40, 60, and 80 °C), and solid-to-liquid ratio (10, 20, and 30 g/L). The optimal conditions were determined as 75 min, 80 °C, and a ratio of 30 g/L, yielding a phenolic content of 8.38 mg GAE/g dry matter. Under these conditions, the highest antioxidant activity was also observed, with a DPPH radical scavenging activity of 0.0301 mmol Trolox/g dry matter. In the study by Ferri et al. [53], a sequential enzymatic and ethanol-based extraction process allowed for a high phenolic content (253.0 ± 3.6 mg GAE/g extract) and significantly enhanced antioxidant activity (ABTS: 1.95 ± 0.08 mmol Trolox/g; DPPH: 1.72 ± 0.03 mmol Trolox/g) compared to ethanol-only extraction. Compared to these studies, our results confirm that a shorter extraction time in the micellar system with DG2p is sufficient for efficient recovery of phenolic compounds, and that extending the extraction time may lead to their reduced activity.

3.4. HCA and PCA Approaches for Assessing the Impact of Extraction Conditions

Hierarchical Cluster Analysis Results

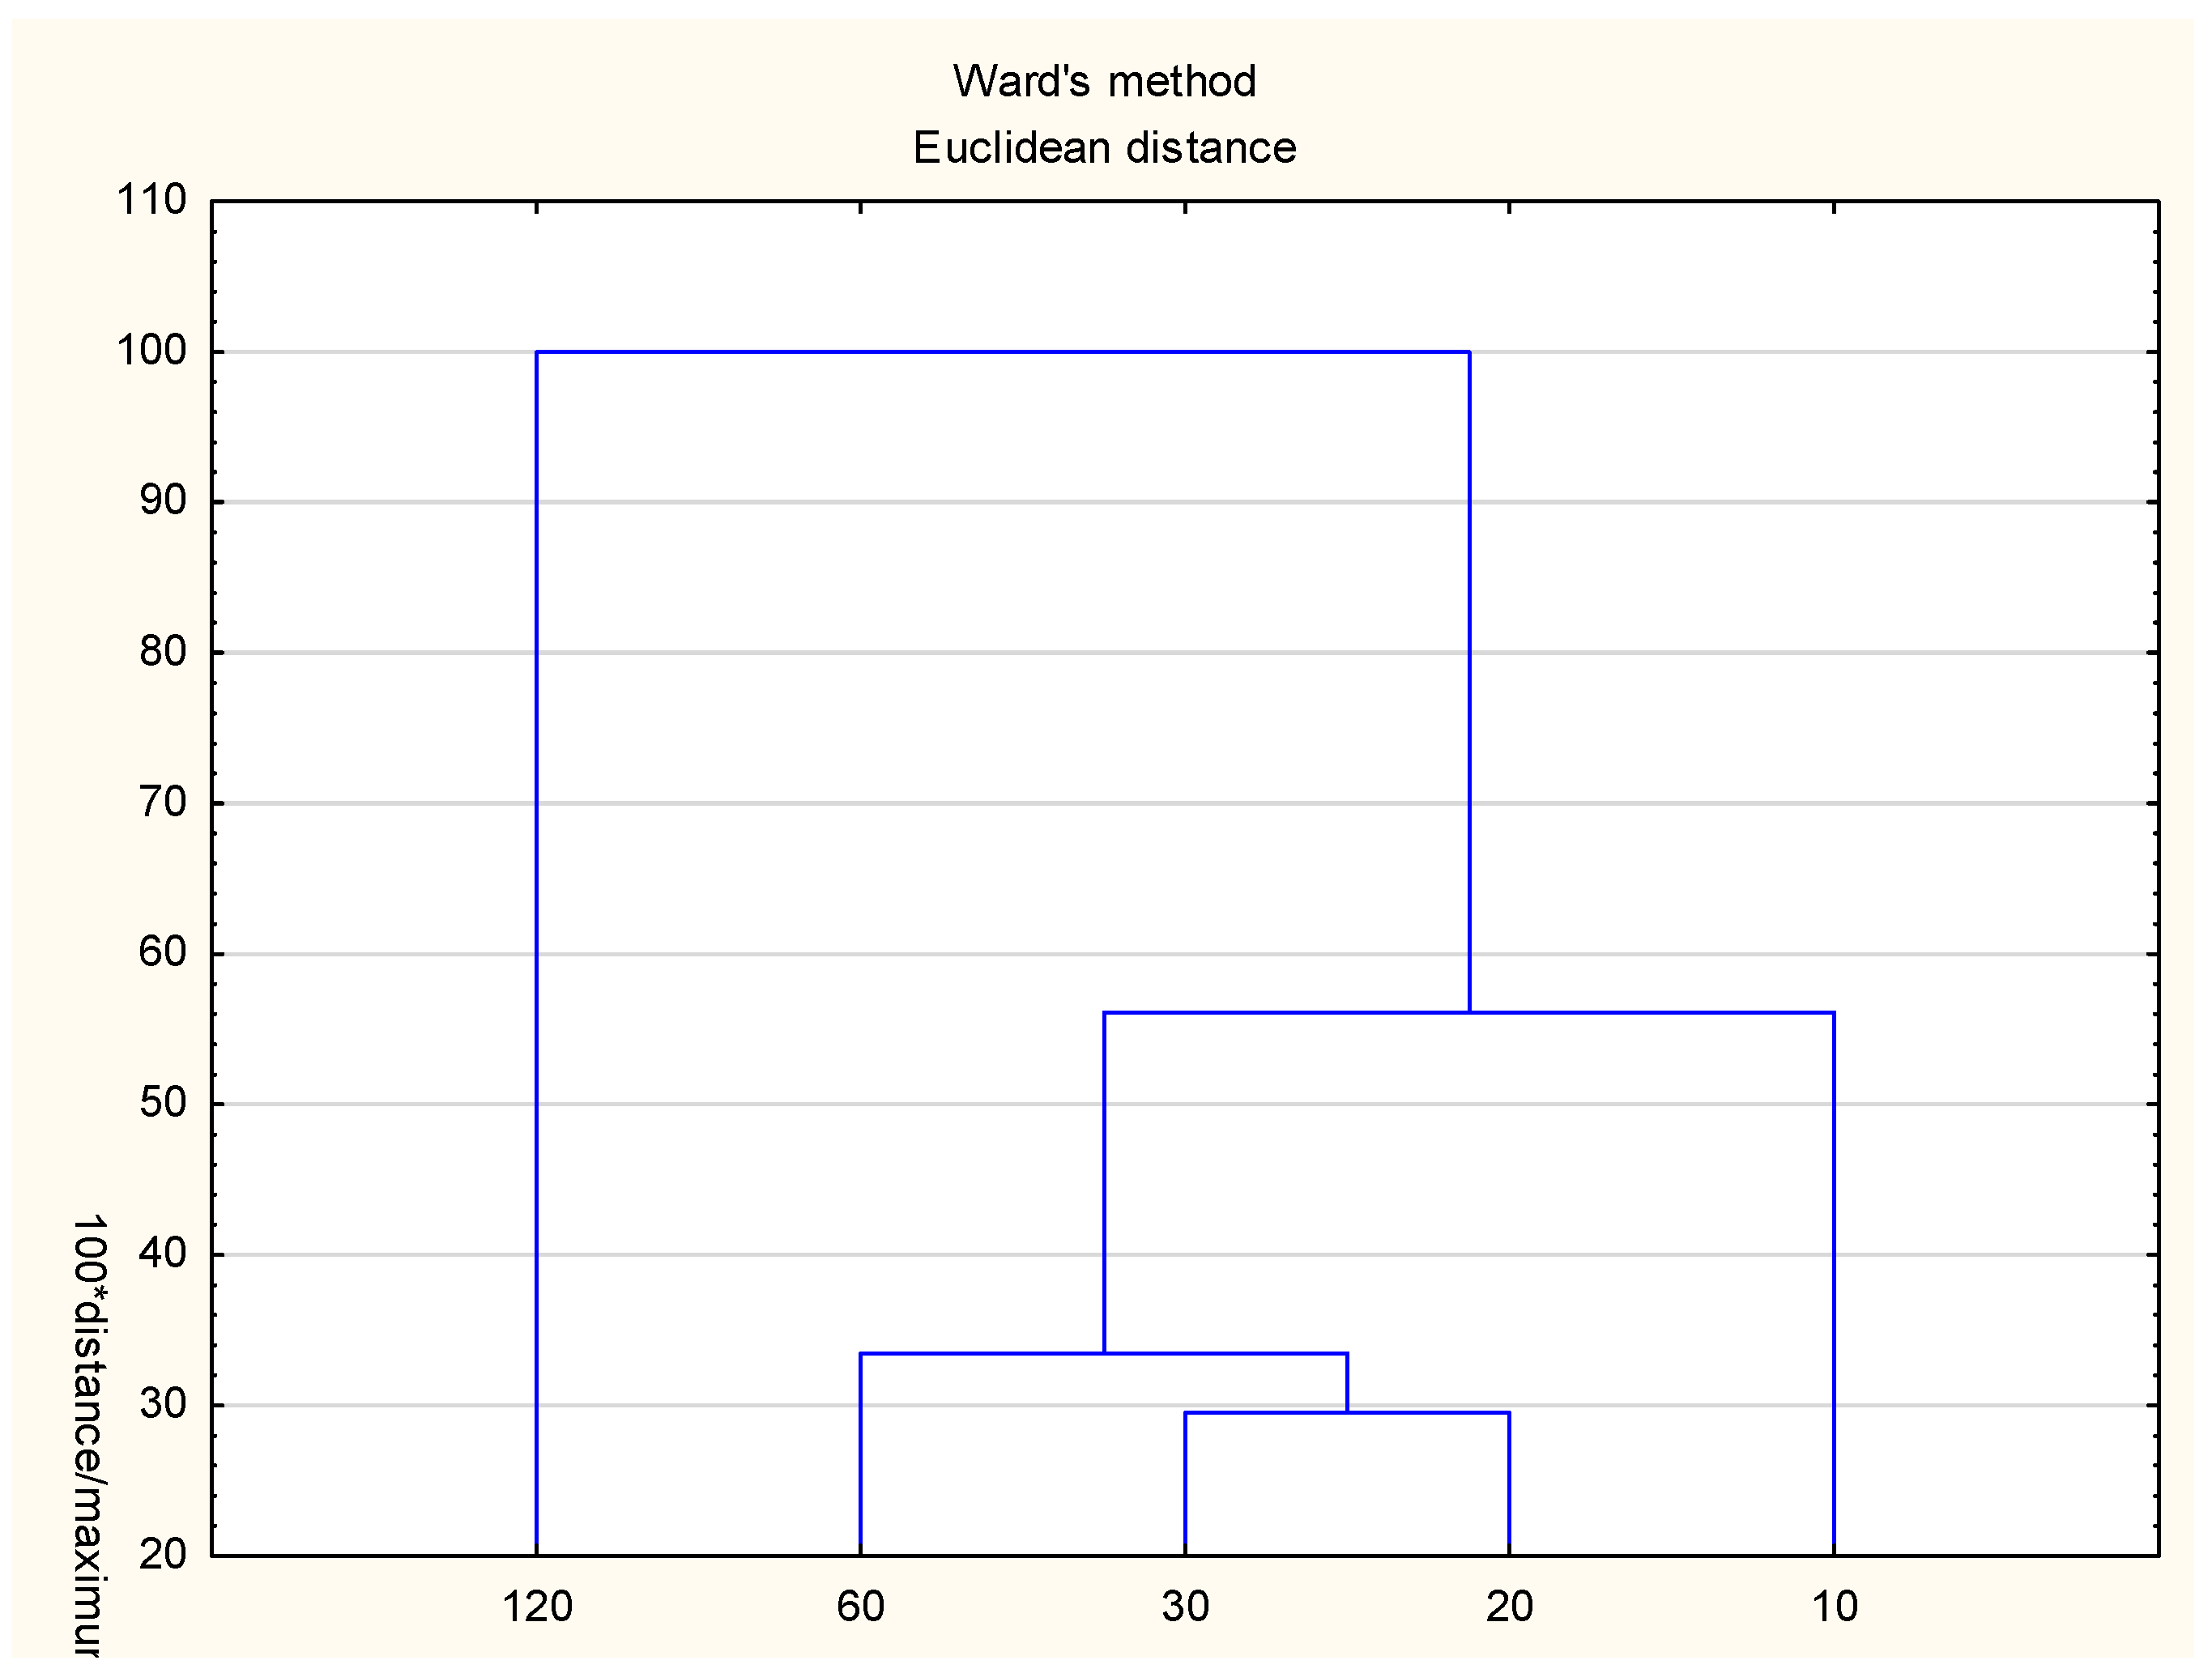
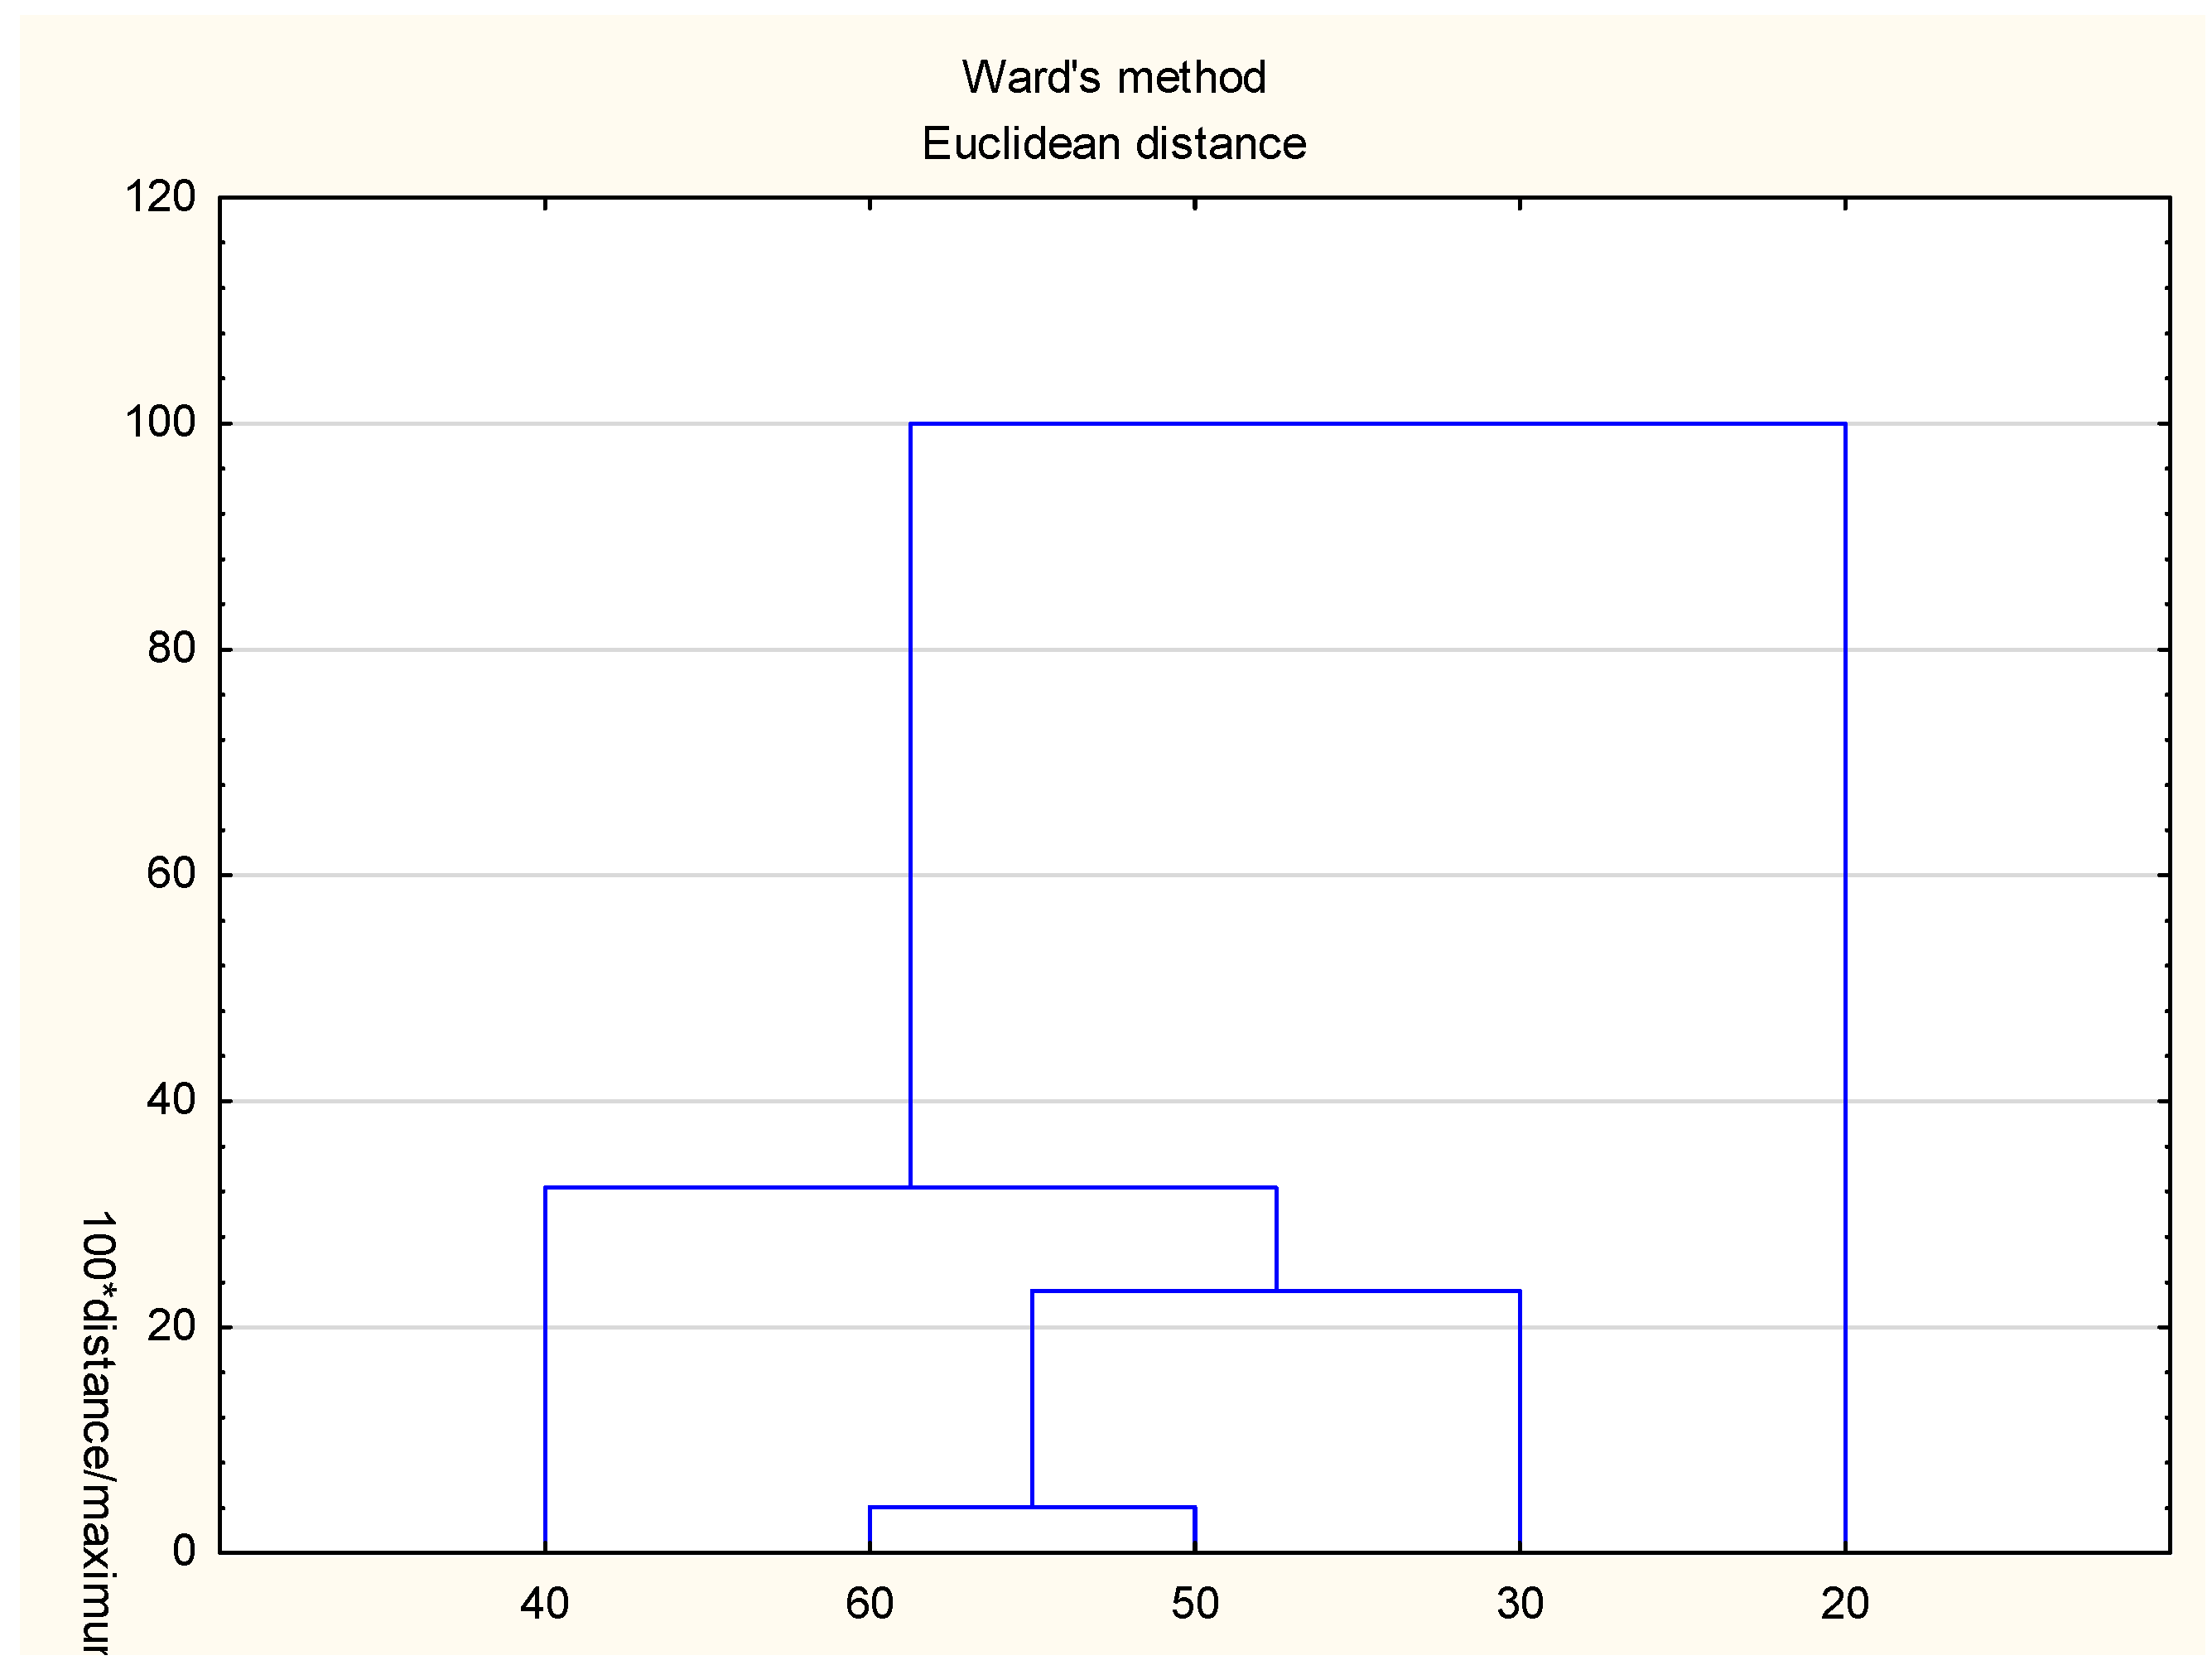
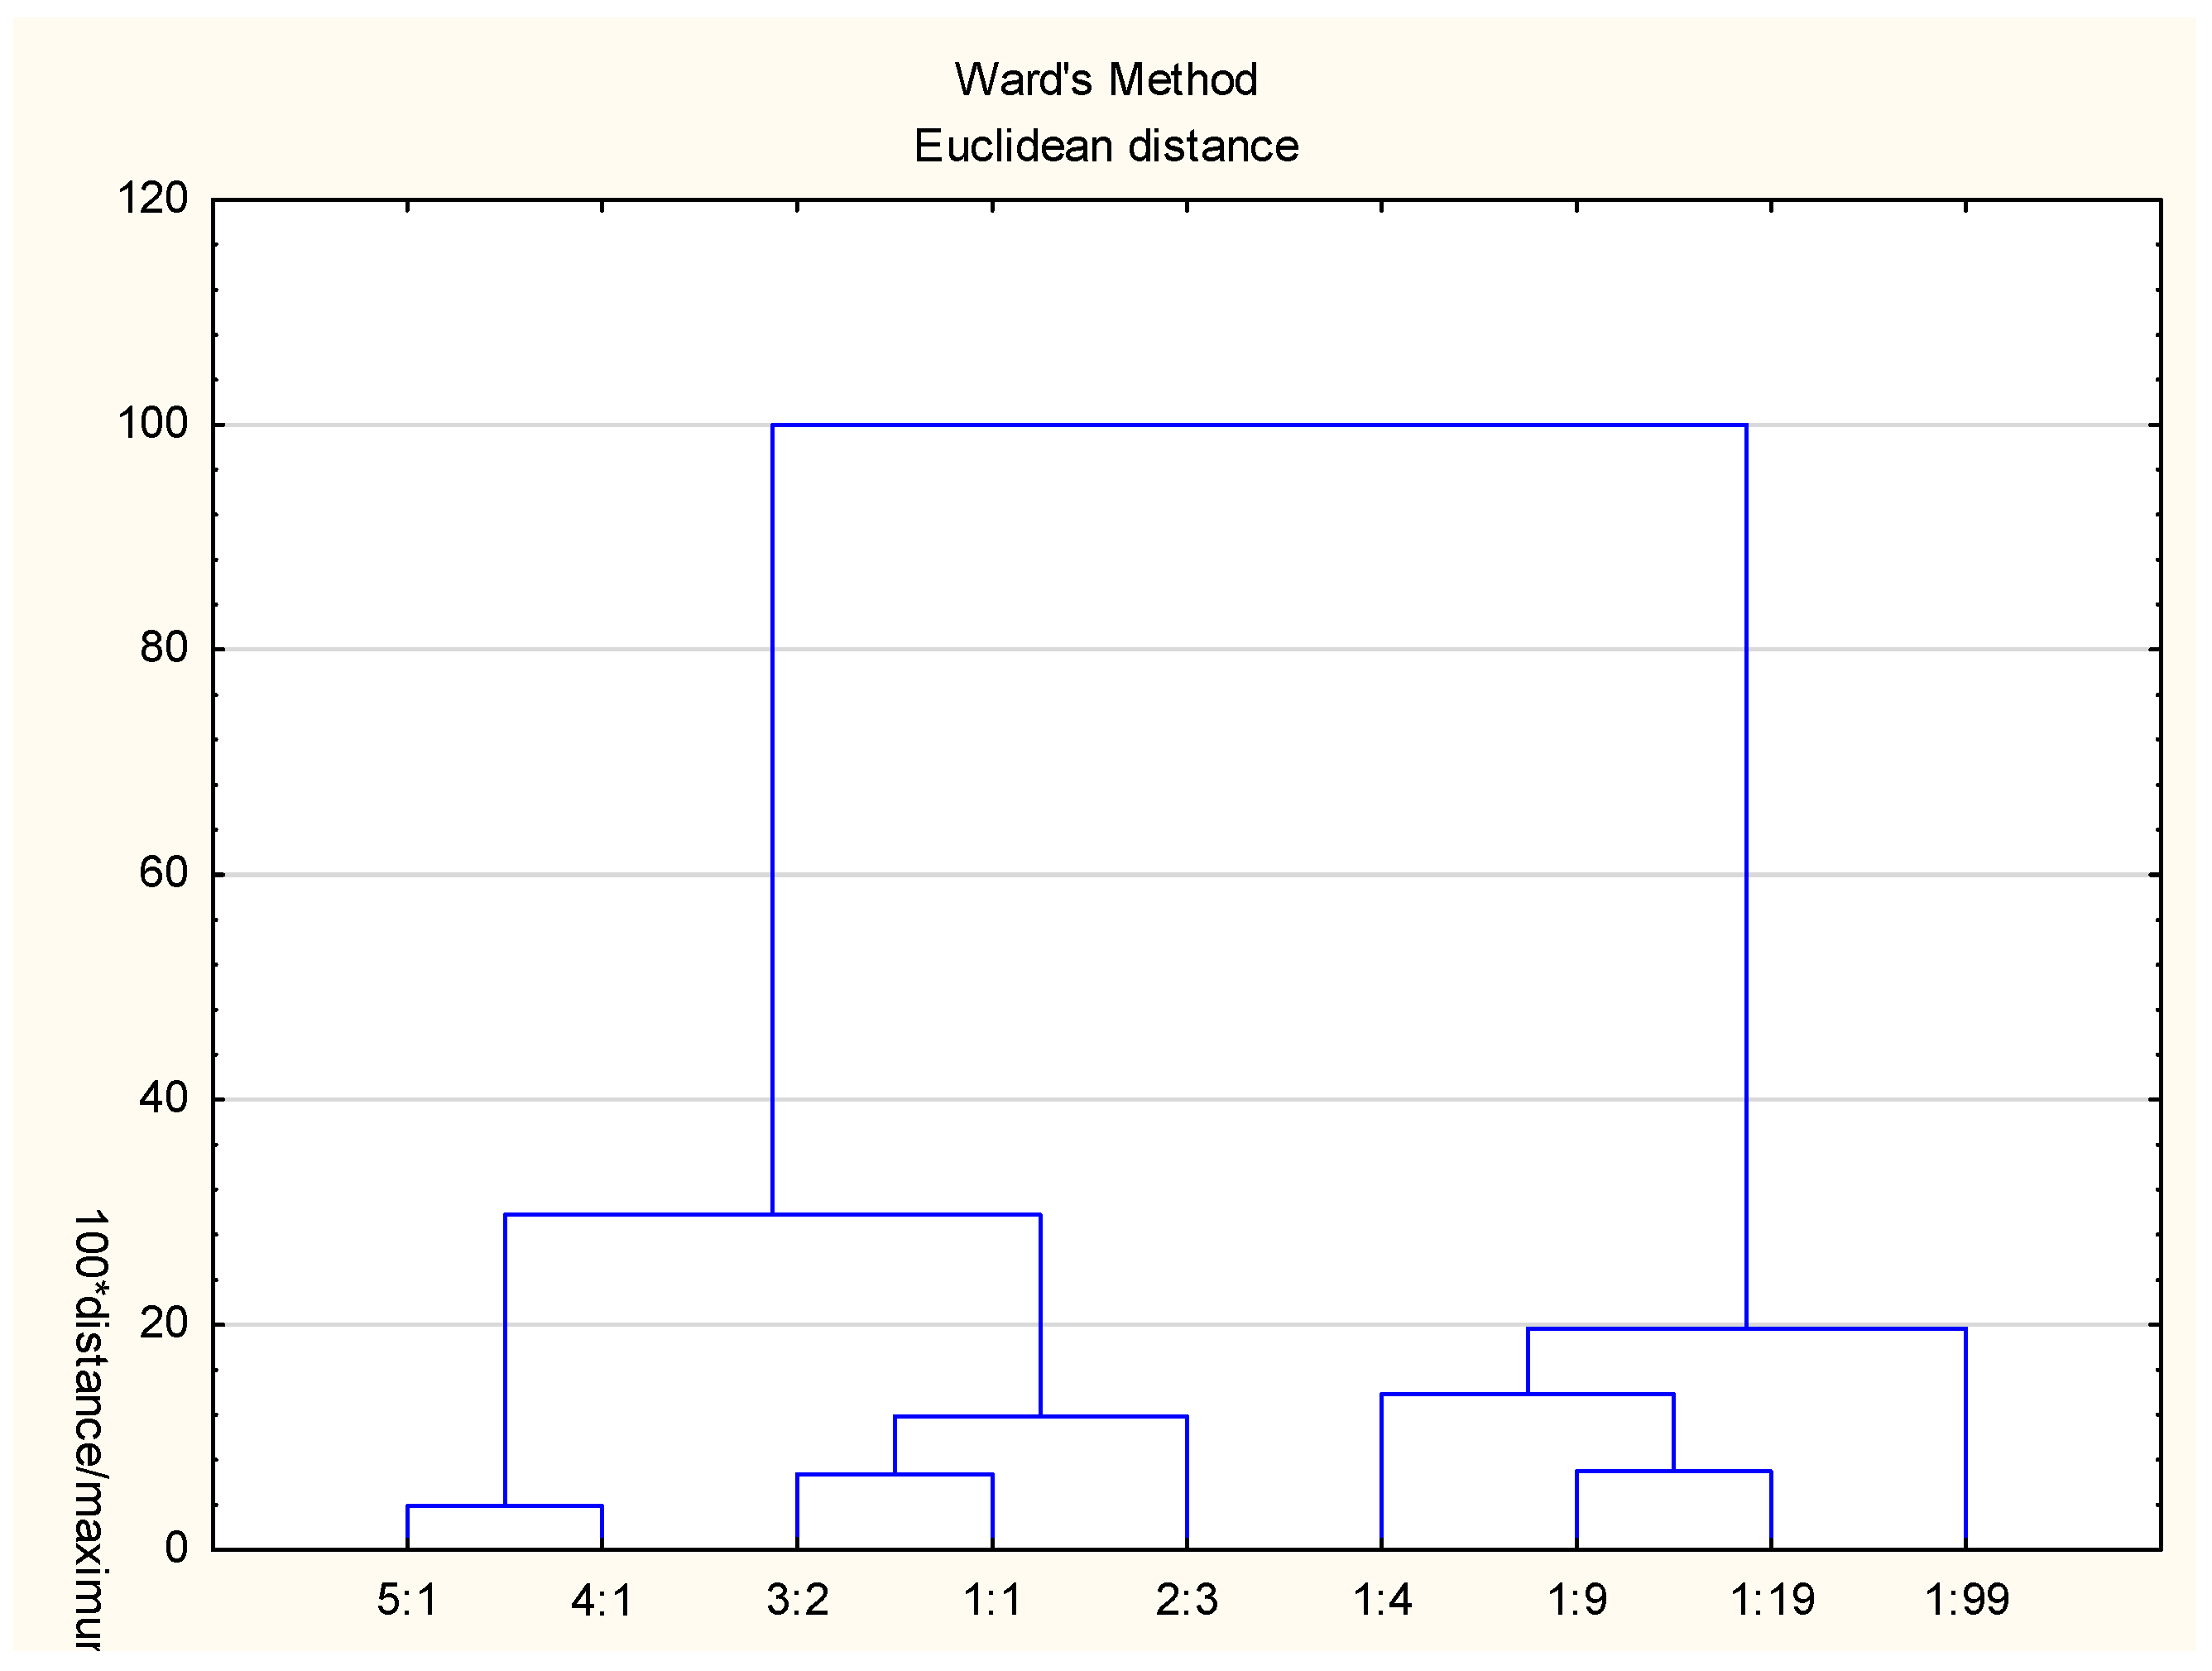
HCA results were presented as dendrograms showing the grouping patterns of extracts obtained under different process conditions and were used as an exploratory visualization approach to assess similarities and clustering tendencies among samples. Hierarchical clustering was performed using Ward’s linkage method and Euclidean distance as a similarity measure. The dendrograms were interpreted descriptively using an arbitrary cut-off level of 30 to facilitate visualization of the major clustering patterns. For the pomace-to-medium ratio, two main clusters were identified: low ratios (1:99–1:4) and high ratios (2:3–5:1). This suggests that extracts obtained with higher pomace proportions exhibit differences in overall phenolic composition compared to more diluted systems (Figure 7). Regarding extraction time, samples obtained at 20 and 30 min showed the gratest similarity, with 60 min clustering nearby, whereas the 120 min extract formed the most distinct branch, suggesting that extraction equilibrium was reached after approximately 20–30 min (Figure 8). For temperature, samples obtained at 50 and 60 °C showed the greatest similarity, while the extract obtained at 20 °C formed the most distinct condition. The sample obtained at 30 °C occupied an intermediate position, clustering with the higher temperature extracts at a greater linkage distance, which may indicate a transitional extraction condition associated with progressive temperature related changes in extract composition (Figure 9).
UPLC-MS/MS, TPC, DPPH, and ABTS analyses revealed consistent patterns with the cluster structures. Higher pomace-to-medium ratios resulted in increased TPC and antioxidant capacity, with the richest extracts obtained at 5:1 and 4:1. UPLC-MS/MS data supported this trend, showing elevated levels of flavonoids, phenolic acids, and amino acids. However, there was a discrepancy between the UPLC-MS/MS results, which showed the highest total polyphenols content at a ratio of 1:1, and the TPC/ABTS values obtained by UV-Vis, which were highest at a ratio of 4:1. It should be noted that UPLC-MS/MS enables the quantitative determination of specific, identified phenolic compounds, whereas UV-Vis provides a general, non-specific measurement of total phenolic content. Moreover, this discrepancy can be explained by matrix effects resulting from co-extracted non-phenolic reducing substances that enhance the non-specific spectrophotometric reaction.
Extraction time significantly affected the dynamics and efficiency of bioactive compound release. The concentrations of phenolic compounds and antioxidant activity increased during the initial extraction period (up to 20–30 min) and then reached equilibrium or slightly declined, indicating that prolonged extraction did not enhance the final yield. Temperature also had a significant effect on the composition of the extract and its antioxidant properties, an increase in temperature above 30–40 °C led to a decrease in the content of phenolic compounds and antioxidant activity.

4. Conclusions

The presented study evaluated the influence of extraction parameters—including the ratio of white grape pomace to extraction medium, temperature, and extraction time—on the efficiency of bioactive compound recovery using micellar extraction—aqueous solution of DG2p as the extraction medium. The results clearly indicate that all investigated factors significantly affect the content of polyphenols, amino acids, and the antioxidant activity of the obtained extracts.
The ratio of pomace to extraction medium and the extraction temperature were identified as the main factors determining extraction yield, while extraction time had a moderate but significant effect.
Overall, the results confirm that low-temperature, short-duration micellar extraction using DG2p is a viable and sustainable alternative to conventional solvent-based methods. This approach enables the selective recovery of phenolic compounds and amino acids and offers clear advantages in terms of environmental impact, formulation compatibility, and potential application in cosmetic products. However, this study also has certain limitations. Future research will focus on the application of the obtained extracts in cosmetic products and their impact on formulation properties. Further work will also include extending micellar extraction to other plant-derived byproducts and waste streams, as well as evaluating the long-term stability and behavior of DG2p-based formulations. These directions will support the development of micellar extraction based on DG and other alkyl polyglucosides as a robust, eco-friendly technology for the valorization of natural raw materials.

Supplementary Materials

The following supporting information can be downloaded at: https://www.mdpi.com/article/10.3390/app16125932/s1, Table S1: LC-MS/MS data for phenolic compounds and amino acids analysis; Table S2: Method limits of detection (LOD, express as 3×S/N) and limits of quantification (LOQ, express as 10×S/N).

Author Contributions

Conceptualization, Z.H.-B. and T.W.; methodology, Z.H.-B., T.W., E.D., K.M. and N.S.-W.; validation, Z.H.-B., T.W., E.D., E.S., K.M. and N.S.-W.; formal analysis, Z.H.-B., T.W., E.D., E.S., K.M. and N.S.-W.; investigation, Z.H.-B., T.W., E.D., E.S., K.M. and N.S.-W.; resources, Z.H.-B., T.W., E.D., E.S., K.M. and N.S.-W.; data curation, Z.H.-B., T.W., E.D., E.S., K.M. and N.S.-W.; writing—original draft preparation, Z.H.-B., T.W., E.D., E.S., K.M. and N.S.-W.; writing—review and editing, Z.H.-B., T.W., E.D., E.S., K.M. and N.S.-W.; visualization, Z.H.-B., T.W., E.D., E.S., K.M. and N.S.-W.; supervision, T.W. and Z.H.-B.; project administration, Z.H.-B. and T.W.; funding acquisition, Z.H.-B. and T.W. All authors have read and agreed to the published version of the manuscript.

Funding

The research was performed as a part of FENG.02.07-IP-05-0439/23 project carried out within the framework of the FENG.02.07 Proof of Concept program of the Foundation for Polish Science co-financed by the European Union within the framework of the 2021–2027 Intelligent Economy Operational Program (FENG).

Institutional Review Board Statement

Not applicable.

Informed Consent Statement

Not applicable.

Data Availability Statement

Data is contained within the article.

Acknowledgments

Sławomir Napiórkowski, Joanna Fleszer, Paulina Wnuk, and Wiktoria Orzechowicz are acknowledged for their help in conducting the experiments. The Family Vineyard Cwielong—Olszewski is acknowledged for providing grape pomace obtained from wine production for this investigation.

Conflicts of Interest

The authors declare no conflicts of interest.

References

  1. Mungwari, C.P.; King’ondu, C.K.; Sigauke, P.; Obadele, B.A. Conventional and Modern Techniques for Bioactive Compounds Recovery from Plants: Review. Sci. Afr. 2025, 27, e02509. [Google Scholar] [CrossRef] [Scilit]
  2. Azmir, J.; Zaidul, I.S.M.; Rahman, M.M.; Sharif, K.M.; Mohamed, A.; Sahena, F.; Jahurul, M.H.A.; Ghafoor, K.; Norulaini, N.A.N.; Omar, A.K.M. Techniques for Extraction of Bioactive Compounds from Plant Materials: A Review. J. Food Eng. 2013, 117, 426–436. [Google Scholar] [CrossRef] [Scilit]
  3. Fomo, G.; Madzimbamuto, T.N.; Ojumu, T.V. Applications of Nonconventional Green Extraction Technologies in Process Industries: Challenges, Limitations and Perspectives. Sustainability 2020, 12, 5244. [Google Scholar] [CrossRef] [Scilit]
  4. Śliwa, P.; Śliwa, K. Nanomicellar Extraction of Polyphenols—Methodology and Applications Review. Int. J. Mol. Sci. 2021, 22, 11392. [Google Scholar] [CrossRef] [Scilit] [PubMed]
  5. Hosseinzadeh, R.; Khorsandi, K.; Hemmaty, S. Study of the Effect of Surfactants on Extraction and Determination of Polyphenolic Compounds and Antioxidant Capacity of Fruits Extracts. PLoS ONE 2013, 8, e57353. [Google Scholar] [CrossRef] [Scilit]
  6. Wasilewski, T.; Hordyjewicz-Baran, Z.; Zarębska, M.; Stanek-Wandzel, N.; Zajszły-Turko, E.; Tomaka, M.; Bujak, T.; Nizioł-Łukaszewska, Z. Sustainable Green Processing of Grape Pomace Using Micellar Extraction for the Production of Value-Added Hygiene Cosmetics. Molecules 2022, 27, 2444. [Google Scholar] [CrossRef] [Scilit] [PubMed]
  7. Hordyjewicz-Baran, Z.; Wasilewski, T.; Zarębska, M.; Stanek-Wandzel, N.; Zajszły-Turko, E.; Tomaka, M.; Zagórska-Dziok, M. Micellar and Solvent Loan Chemical Extraction as a Tool for the Development of Natural Skin Care Cosmetics Containing Substances Isolated from Grapevine Buds. Appl. Sci. 2024, 14, 1420. [Google Scholar] [CrossRef] [Scilit]
  8. Fiume, M.M.; Heldreth, B.; Bergfeld, W.F.; Belsito, D.V.; Hill, R.A.; Klaassen, C.D.; Liebler, D.; Marks, J.G., Jr.; Shank, R.C.; Slaga, T.J.; et al. Safety Assessment of Decyl Glucoside and Other Alkyl Glucosides as Used in Cosmetics. Int. J. Toxicol. 2013, 32, 22S–48S. [Google Scholar] [CrossRef] [Scilit]
  9. Lopes, J.d.C.; Madureira, J.; Margaça, F.M.A.; Cabo Verde, S. Grape Pomace: A Review of Its Bioactive Phenolic Compounds, Health Benefits, and Applications. Molecules 2025, 30, 362. [Google Scholar] [CrossRef] [Scilit]
  10. Karastergiou, A.; Gancel, A.-L.; Jourdes, M.; Teissedre, P.-L. Transforming Winemaking Waste: Grape Pomace as a Sustainable Source of Bioactive Compounds. OENO One 2025, 59, 2. [Google Scholar] [CrossRef] [Scilit]
  11. Chakka, A.K.; Babu, A.S. Bioactive Compounds of Winery by-products: Extraction Techniques and their Potential Health Benefits. Appl. Food Res. 2022, 2, 100058. [Google Scholar] [CrossRef] [Scilit]
  12. Monteiro, G.C.; Minatel, I.O.; Pimentel Junior, A.; Gomez-Gomez, H.A.; Corrêa de Camargo, J.P.; Diamante, M.S.; Basílio, L.S.P.; Tecchio, M.A.; Pereira Lima, G.P. Bioactive Compounds and Antioxidant Capacity of Grape Pomace Flours. LWT 2021, 135, 110053. [Google Scholar] [CrossRef] [Scilit]
  13. Tsao, R. Chemistry and Biochemistry of Dietary Polyphenols. Nutrients 2010, 2, 1231–1246. [Google Scholar] [CrossRef] [Scilit]
  14. Zillich, O.V.; Schweiggert-Weisz, U.; Eisner, P.; Kerscher, M. Polyphenols as Active Ingredients for Cosmetic Products. Int. J. Cosmet. Sci. 2015, 37, 455–464. [Google Scholar] [CrossRef] [Scilit]
  15. Rispo, F.; De Negri Atanasio, G.; Demori, I.; Costa, G.; Marchese, E.; Perera-del-Rosario, S.; Serrano-Candelas, E.; Palomino-Schätzlein, M.; Perata, E.; Robino, F.; et al. An Extensive Review on Phenolic Compounds and Their Potential Estrogenic Properties on Skin Physiology. Front. Cell Dev. Biol. 2024, 11, 1305835. [Google Scholar] [CrossRef] [Scilit] [PubMed]
  16. Mita, S.R.; Husni, P.; Putriana, N.A.; Maharani, R.; Hendrawan, R.P.; Dewi, D.A. A Recent Update on the Potential Use of Catechins in Cosmeceuticals. Cosmetics 2024, 11, 23. [Google Scholar] [CrossRef] [Scilit]
  17. Mita, S.R.; Muhtar, N.I.; Kusuma, S.A.F.; Sriwidodo, S.; Hendrawan, R.P. Catechins as Antimicrobial Agents and Their Contribution to Cosmetics. Cosmetics 2025, 12, 11. [Google Scholar] [CrossRef] [Scilit]
  18. Ma, E.Z.; Khachemoune, A. Flavonoids and Their Therapeutic Applications in Skin Diseases. Arch. Dermatol. Res. 2023, 315, 321–331. [Google Scholar] [CrossRef] [Scilit] [PubMed]
  19. Diaz, I.; Namkoong, J.; Wu, J.Q.; Giancola, G. Amino Acid Complex (AAComplex) Benefits in Cosmetic Products: In Vitro and In Vivo Clinical Studies. J. Cosmet. Dermatol. 2022, 21, 3046–3052. [Google Scholar] [CrossRef] [Scilit]
  20. Takaoka, M.; Okumura, S.; Seki, T.; Ohtani, M. Effect of Amino-Acid Intake on Physical Conditions and Skin State: A Randomized, Double-Blind, Placebo-Controlled, Crossover Trial. J. Clin. Biochem. Nutr. 2019, 65, 52–58. [Google Scholar] [CrossRef] [Scilit] [PubMed]
  21. da Silva, C.S.M.; Costa, G.A.N.; Aguiar, A.F.; Camargo, M.Z.; Fernandes, K.B.P.; Oliveira, M.R.; da Silva, R.A. Effect of the Use of a Cream with Leucine and Lactic Acid Associated with Electrostimulation in Contouring and Facial Tonus: A Randomized Clinical Controlled Trial. Cosmetics 2022, 9, 36. [Google Scholar] [CrossRef] [Scilit]
  22. Pintea, A.; Manea, A.; Pintea, C.; Vlad, R.-A.; Bîrsan, M.; Antonoaea, P.; Rédai, E.M.; Ciurba, A. Peptides: Emerging Candidates for the Prevention and Treatment of Skin Senescence: A Review. Biomolecules 2025, 15, 88. [Google Scholar] [CrossRef] [Scilit]
  23. Campos, P.M.B.G.; Melo, M.O.; Siqueira César, F.C. Topical Application and Oral Supplementation of Peptides in the Improvement of Skin Viscoelasticity and Density. J. Cosmet. Dermatol. 2019, 18, 1693–1699. [Google Scholar] [CrossRef] [Scilit]
  24. Moy, M.; Diaz, I.; Lesniak, E.; Giancola, G. Peptide-Pro Complex Serum: Investigating Effects on Aged Skin. J. Cosmet. Dermatol. 2023, 22, 267–274. [Google Scholar] [CrossRef] [Scilit]
  25. Wasilewski, T.; Hordyjewicz-Baran, Z.; Malorna, K.; Dresler, E.; Sabura, E.; Zegarski, M.; Stanek-Wandzel, N. Studies on the Use of Loan Extraction to Produce Natural Shower Gels (Cosmetic) Based on Grape Pomace Extracts—The Effect of the Type of Surfactant Borrowed. Molecules 2025, 30, 3709. [Google Scholar] [CrossRef] [Scilit]
  26. Singleton, V.L.; Orthofer, R.; Lamuela-Raventós, R.M. Analysis of total phenols and other oxidation substrates and antioxidants by means of Folin–Ciocalteu reagent. Meth. Enzymol. 1999, 299, 152–178. [Google Scholar] [CrossRef] [Scilit]
  27. Brand-Williams, W.; Cuvelier, M.E.; Berset, C. Use of a Free Radical Method to Evaluate Antioxidant Activity. LWT-Food Sci. Technol. 1995, 28, 25–30. [Google Scholar] [CrossRef] [Scilit]
  28. Re, R.; Pellegrini, N.; Proteggente, A.; Pannala, A.; Yang, M.; Rice-Evans, C. Antioxidant Activity Applying an Improved ABTS Radical Cation Decolorization Assay. Free Radic. Biol. Med. 1999, 26, 1231–1237. [Google Scholar] [CrossRef] [Scilit] [PubMed]
  29. Jara-Palacios, M.J.; Hernanz, D.; Cifuentes-Gomez, T.; Escudero-Gilete, M.L.; Heredia, F.J.; Spencer, J.P. Assessment of White Grape Pomace from Winemaking as Source of Bioactive Compounds, and Its Antiproliferative Activity. Food Chem. 2015, 183, 78–82. [Google Scholar] [CrossRef] [Scilit] [PubMed]
  30. Rockenbach, I.I.; Gonzaga, L.V.; Rizelio, V.M.; Gonçalves, A.E.S.S.; Genovese, M.I.; Fett, R. Phenolic Compounds and Antioxidant Activity of Seed and Skin Extracts of Red Grape (Vitis vinifera and Vitis labrusca) Pomace from Brazilian Winemaking. Food Res. Int. 2011, 44, 897–901. [Google Scholar] [CrossRef] [Scilit]
  31. Karastergiou, A.; Gancel, A.-L.; Jourdes, M.; Teissedre, P.-L. Valorization of Grape Pomace: A Review of Phenolic Composition, Bioactivity, and Therapeutic Potential. Antioxidants 2024, 13, 1131. [Google Scholar] [CrossRef] [Scilit]
  32. Castellanos-Gallo, L.; Ballinas-Casarrubias, L.; Espinoza-Hicks, J.C.; Hernández-Ochoa, L.R.; Muñoz-Castellanos, L.N.; Zermeño-Ortega, M.R.; Borrego-Loya, A.; Salas, E. Grape Pomace Valorization by Extraction of Phenolic Polymeric Pigments: A Review. Processes 2022, 10, 469. [Google Scholar] [CrossRef] [Scilit]
  33. Onache, P.A.; Geana, E.-I.; Ciucure, C.T.; Florea, A.; Sumedrea, D.I.; Ionete, R.E.; Tița, O. Bioactive Phytochemical Composition of Grape Pomace Resulted from Different White and Red Grape Cultivars. Separations 2022, 9, 395. [Google Scholar] [CrossRef] [Scilit]
  34. Gutiérrez-Escobar, R.; Aliaño-González, M.J.; Cantos-Villar, E. Variety and Year: Two Key Factors on Amino Acids and Biogenic Amines Content in Grapes. Food Res. Int. 2024, 175, 113721. [Google Scholar] [CrossRef] [Scilit] [PubMed]
  35. Buzzanca, C.; Mauro, M.; Vazzana, M.; Todaro, A.; Arizza, V.; Lucarini, M.; Durazzo, A.; Di Stefano, V. Analysis of the Amino Acid Profile of Red and White Grapes Winery By-Products from Western Sicily. Meas. Food 2024, 14, 100174. [Google Scholar] [CrossRef] [Scilit]
  36. Goulas, V.; Manganaris, G.A. Exploring the Phytochemical Content and the Antioxidant Potential of Citrus Fruits Grown in Cyprus. Food Chem. 2012, 131, 39–47. [Google Scholar] [CrossRef] [Scilit]
  37. Maier, T.; Schieber, A.; Kammerer, D.R.; Carle, R. Residues of Grape (Vitis vinifera L.) Seed Oil Production as a Valuable Source of Phenolic Antioxidants. Food Chem. 2009, 112, 551–559. [Google Scholar] [CrossRef] [Scilit]
  38. Spigno, G.; Tramelli, L.; De Faveri, D.M. Effects of Extraction Time, Temperature and Solvent on Concentration and Antioxidant Activity of Grape Marc Phenolics. J. Food Eng. 2007, 81, 200–208. [Google Scholar] [CrossRef] [Scilit]
  39. Rodrigues, R.P.; Sousa, A.M.; Gando-Ferreira, L.M.; Quina, M.J. Grape Pomace as a Natural Source of Phenolic Compounds: Solvent Screening and Extraction Optimization. Molecules 2023, 28, 2715. [Google Scholar] [CrossRef] [Scilit]
  40. Islam, J.; Shirakawa, H.; Nguyen, T.K.; Aso, H.; Komai, M. Simultaneous Analysis of Serotonin, Tryptophan and Tryptamine Levels in Common Fresh Fruits and Vegetables in Japan Using Fluorescence HPLC. Food Biosci. 2016, 13, 56–59. [Google Scholar] [CrossRef] [Scilit]
  41. Palma, M.; Piñeiro, Z.; Barroso, C.G. Stability of phenolic compounds during extraction with superheated solvents. J. Chromatogr. A 2001, 921, 169–174. [Google Scholar] [CrossRef] [Scilit] [PubMed]
  42. Antony, A.; Farid, M. Effect of Temperatures on Polyphenols during Extraction. Appl. Sci. 2022, 12, 2107. [Google Scholar] [CrossRef] [Scilit]
  43. Mattivi, F.; Guzzon, R.; Vrhovsek, U.; Stefanini, M.; Velasco, R. Metabolite profiling of grape: Flavonols and anthocyanins. J. Agric. Food Chem. 2006, 54, 7692–7702. [Google Scholar] [CrossRef] [Scilit]
  44. Radulescu, C.; Olteanu, R.L.; Buruleanu, C.L.; Tudorache, M.N.; Dulama, I.D.; Stirbescu, R.M.; Bucurica, I.A.; Stanescu, S.G.; Banica, A.L. Polyphenolic Screening and the Antioxidant Activity of Grape Pomace Extracts of Romanian White and Red Grape Varieties. Antioxidants 2024, 13, 1133. [Google Scholar] [CrossRef] [Scilit]
  45. Da Porto, C.; Natolino, A. Supercritical fluid extraction of polyphenols from grape seed (Vitis vinifera): Study on process variables and kinetics. J. Supercrit. Fluids 2017, 130, 239–245. [Google Scholar] [CrossRef] [Scilit]
  46. Kwiatkowski, M.; Kravchuk, O.; Skouroumounis, G.K.; Taylor, D.K. Response Surface Parallel Optimization of Extraction of Total Phenolics from Separate White and Red Grape Skin Mixtures with Microwave-Assisted and Conventional Thermal Methods. J. Clean. Prod. 2020, 251, 119563. [Google Scholar] [CrossRef] [Scilit]
  47. Atanacković Krstonošić, M.; Sazdanić, D.; Mikulić, M.; Ćirin, D.; Milutinov, J.; Krstonošić, V. Optimization of Surfactant-Mediated Green Extraction of Phenolic Compounds from Grape Pomace Using Response Surface Methodology. Int. J. Mol. Sci. 2025, 26, 2072. [Google Scholar] [CrossRef] [Scilit]
  48. Sazdanić, D.; Atanacković Krstonošić, M.; Ćirin, D.; Cvejić, J.; Alamri, A.; Galanakis, C.M.; Krstonošić, V. Non-ionic surfactants-mediated green extraction of polyphenols from red grape pomace. J. Appl. Res. Med. Aromat. Plants 2023, 32, 100439. [Google Scholar] [CrossRef] [Scilit]
  49. Xu, Y.; Burton, S.; Kim, C.; Sismour, E. Phenolic Compounds, Antioxidant, and Antibacterial Properties of Pomace Extracts from Four Virginia-Grown Grape Varieties. Food Sci. Nutr. 2016, 4, 125–133. [Google Scholar] [CrossRef] [Scilit]
  50. Vergara-Salinas, J.R.; Bulnes, P.; Zúñiga, M.C.; Pérez-Jiménez, J.; Torres, J.L.; Mateos-Martín, M.L.; Agosin, E.; Pérez-Correa, J.R. Effect of Pressurized Hot Water Extraction on Antioxidants from Grape Pomace before and after Enological Fermentation. J. Agric. Food Chem. 2013, 61, 6929–6936. [Google Scholar] [CrossRef] [Scilit]
  51. Moutinho, J.; Gouvinhas, I.; Domínguez-Perles, R.; Barros, A. Optimization of the Extraction Methodology of Grape Pomace Polyphenols for Food Applications. Molecules 2023, 28, 3885. [Google Scholar] [CrossRef] [Scilit]
  52. Sokač Cvetnić, T.; Krog, K.; Benković, M.; Jurina, T.; Valinger, D.; Gajdoš Kljusurić, J.; Radojčić Redovniković, I.; Jurinjak Tušek, A. Solid–Liquid Extraction of Bioactive Molecules from White Grape Skin: Optimization and Near-Infrared Spectroscopy. Separations 2023, 10, 452. [Google Scholar] [CrossRef] [Scilit]
  53. Ferri, M.; Rondini, G.; Calabretta, M.M.; Michelini, E.; Vallini, V.; Fava, F.; Roda, A.; Minnucci, G.; Tassoni, A. White Grape Pomace Extracts, Obtained by a Sequential Enzymatic plus Ethanol-Based Extraction, Exert Antioxidant, Anti-Tyrosinase and Anti-Inflammatory Activities. New Biotechnol. 2017, 39, 51–58. [Google Scholar] [CrossRef] [Scilit]
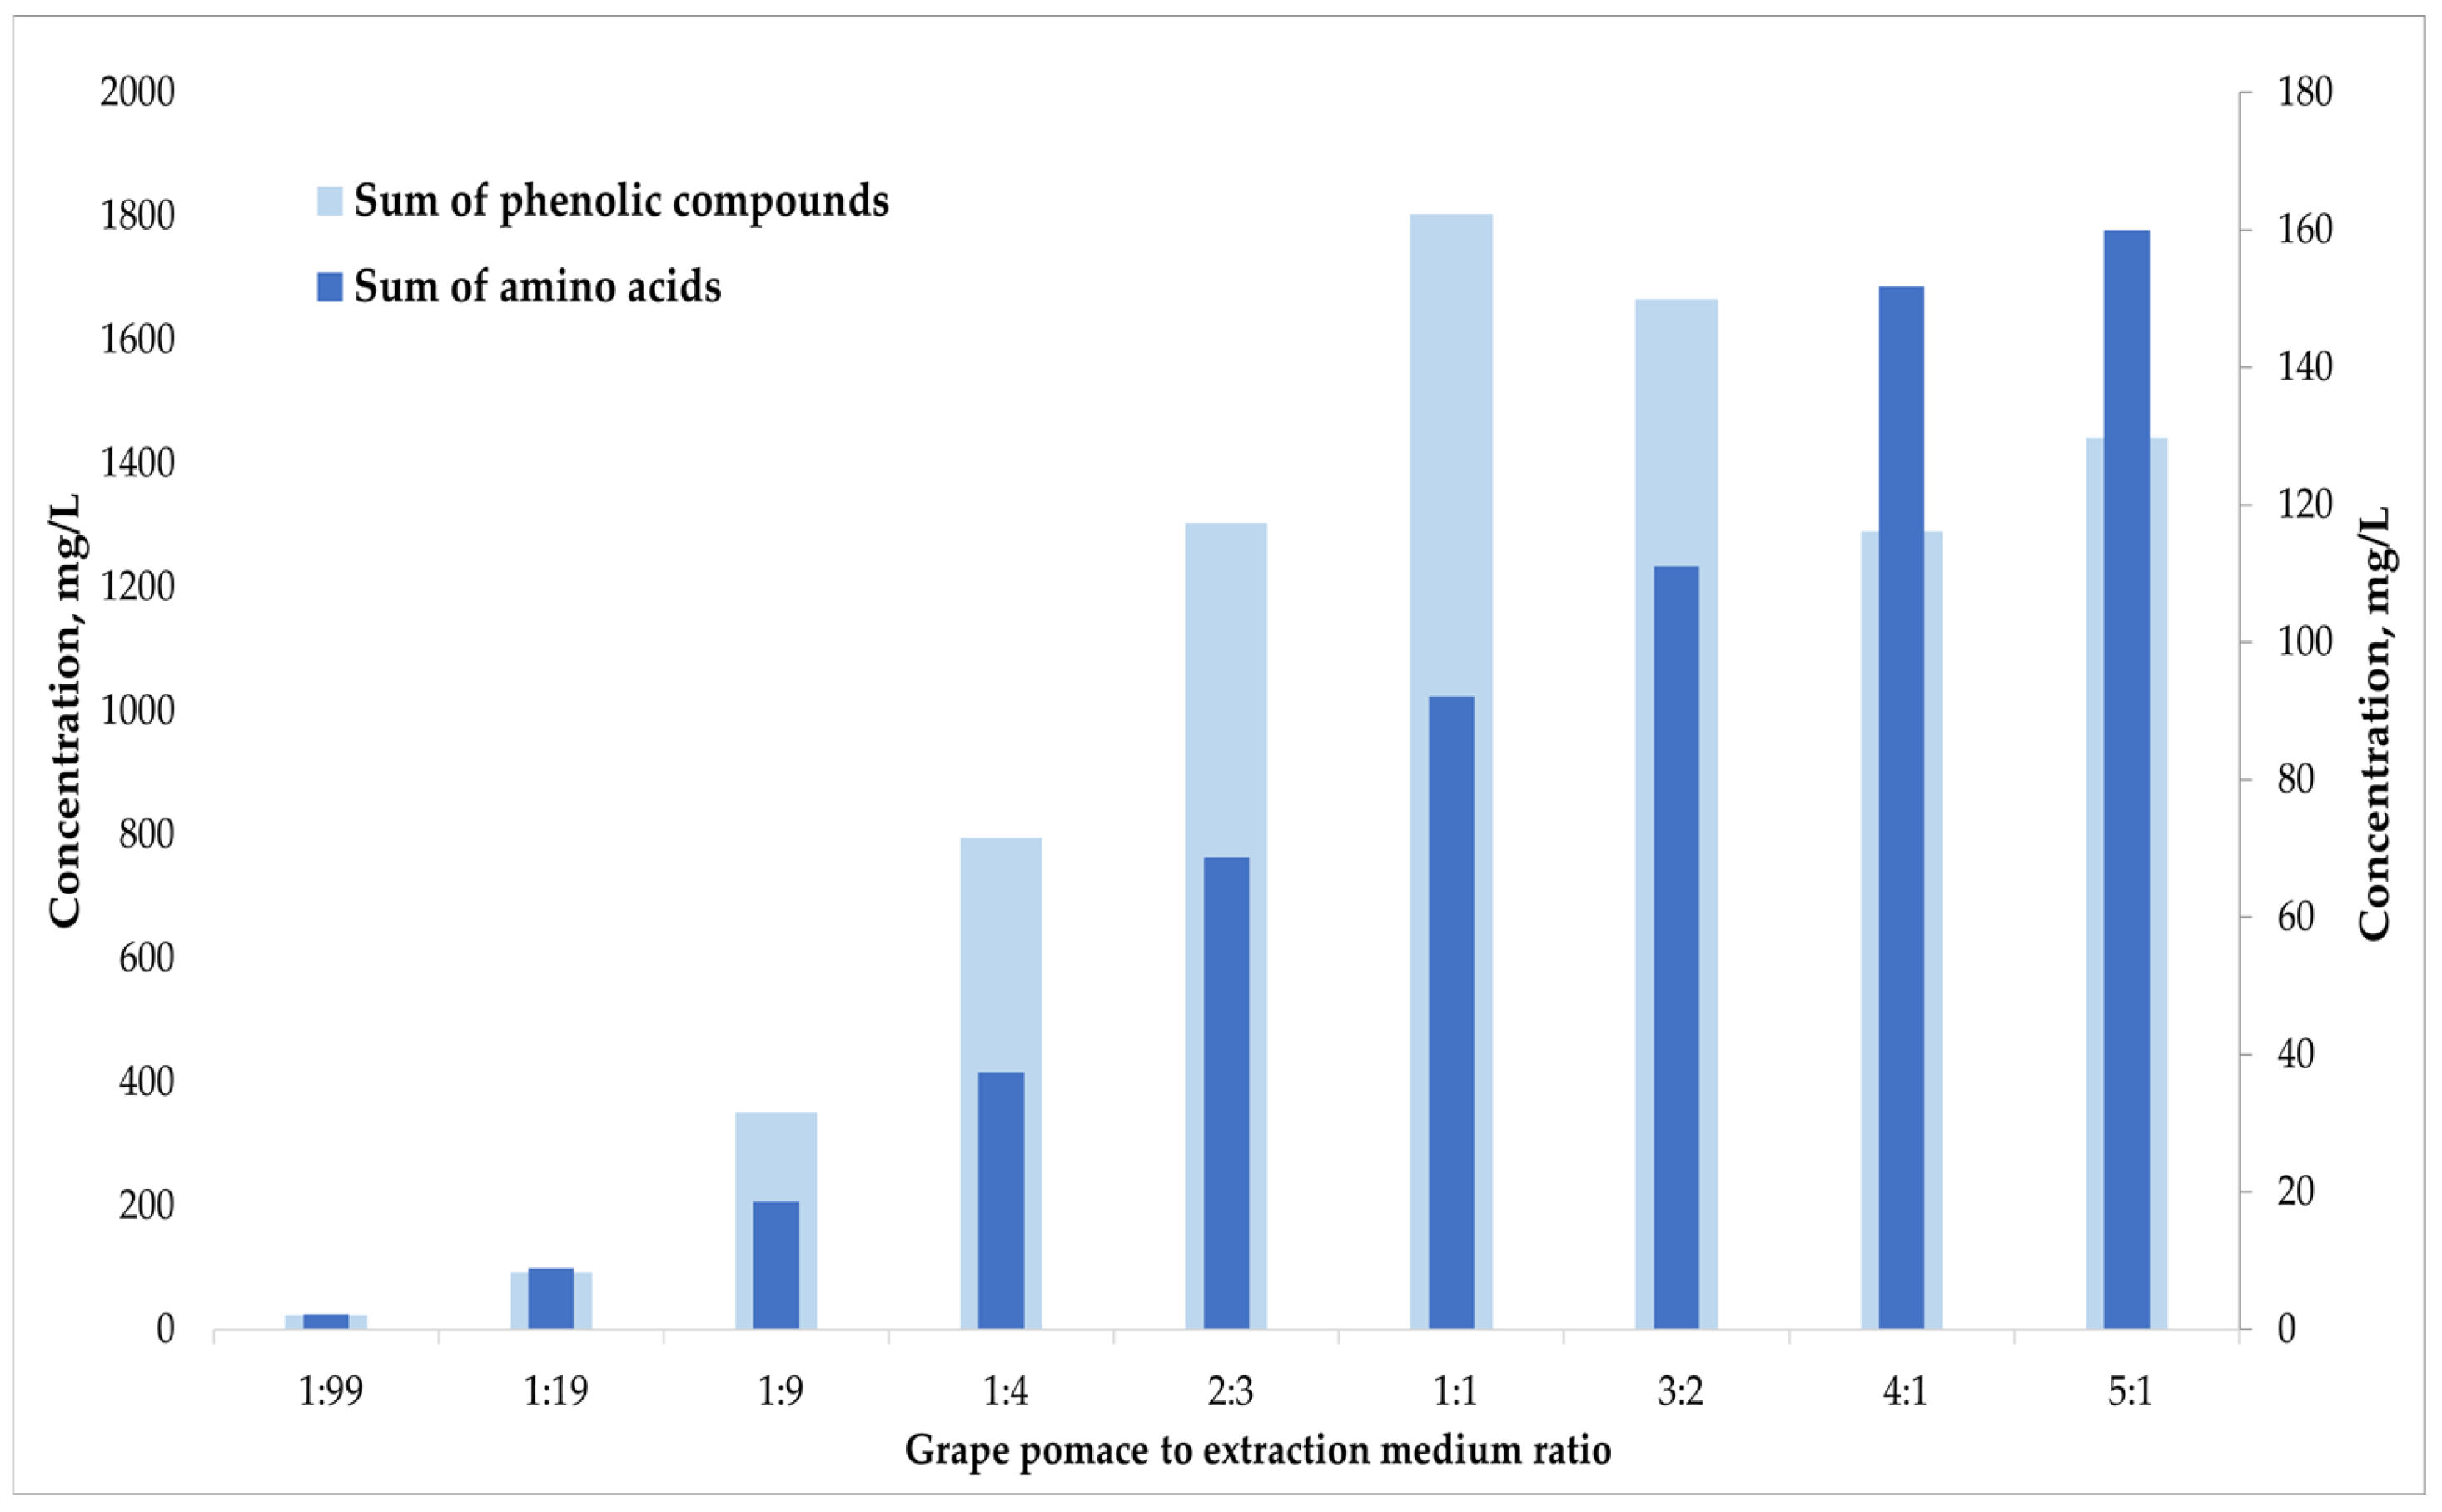
Figure 1. Total concentration of polyphenolic compounds and amino acids (mg/L) in relation to individual extracts of the ratio of grape pomace to extraction medium.
Applsci 16 05932 g001
Figure 2. Total content of polyphenolic compounds and amino acids in correlation with extraction temperature, determined by LC-MS/MS technique.
Applsci 16 05932 g002
Figure 3. Total content of polyphenolic compounds and amino acids in correlation with time of extraction, determined by LC-MS/MS technique.
Applsci 16 05932 g003
Figure 4. Change in the total phenolic content (TPC) and antioxidant potentials (DPPH, ABTS) depending on the ratio of grape pomace to extraction medium.
Applsci 16 05932 g004
Figure 5. Change in the total phenolic content (TPC) and antioxidant potentials (DPPH, ABTS) depending on the extraction temperature.
Applsci 16 05932 g005
Figure 6. Change in the total phenolic content (TPC) and antioxidant potentials (DPPH, ABTS) depending on the extraction time.
Applsci 16 05932 g006
Figure 7. Hierarchical cluster analysis based on GPE_EM ratio.
Applsci 16 05932 g007
Figure 8. Hierarchical cluster analysis based on extraction time (GPE_DG2p_t).
Applsci 16 05932 g008
Figure 9. Hierarchical cluster analysis based on extraction temperature (GPE_DG2p_T).
Applsci 16 05932 g009
Table 1. Experimental Design and Investigated Extraction Parameters.
Investigated ParameterSample DesignationRange/Experimental LevelsObjective of the Study
Grape pomace/extraction medium ratioGPE_EM_ratio1:99, 1:19, 1:9, 1:4, 2:3, 1:1, 3:2, 4:1, 5:1 (w/w)Evaluation of the effect of material to medium ratio on extraction efficiency
Extraction timeGPE_DG2p_t10, 20, 30, 60, 120 min (GPE:EM ratio 4:1)Evaluation of the effect of extraction time on extract composition
Extraction temperatureGPE_DG2p_T20 °C, 30 °C, 40 °C, 50 °C, 60 °C (GPE:EM ratio 4:1)Evaluation of the effect of extraction temperature on extraction efficiency
Table 2. UPLC-ESI-MS/MS quantification of the detected compounds in tested grape pomace extracts for GPE_EM_ratio, (mean ± SD, n = 3).
CompoundQuantification/
Confirmation
Transition
GPE_EM
1:99
[mg/L]
GPE_EM
1:19
[mg/L]
GPE_EM
1:9
[mg/L]
GPE_EM
1:4
[mg/L]
GPE_EM
2:3
[mg/L]
GPE_EM
1:1
[mg/L]
GPE_EM
3:2
[mg/L]
GPE_EM
4:1
[mg/L]
GPE_EM
5:1
[mg/L]
(+)-Catechin290.9 > 139.0
290.9 > 123.0
2.76 ± 0.1319.5± 0.694.5 ± 0.8226 ± 7419 ± 8609 ± 8612 ± 3478 ± 18525 ± 18
(−)-Epicatechin290.9 > 139.0
290.9 > 123.0
11.5 ± 0.163.6 ± 1.2246 ± 4558 ± 7873 ± 121180 ± 131040 ± 14798 ± 11902 ± 9
(−)-Catechin 3-gallate 433.0 > 123.0
433.0 > 273.0
0.163 ± 0.0160.113 ± 0.0300.135 ± 0.0010.213 ± 0.0040.320 ± 0.0330.221 ± 0.0130.302 ± 0.0030.354 ± 0.0810.230 ± 0.008
(−)-Epicatechin 3-gallate433.0 > 123.0
433.0 > 273.0
0.336 ± 0.0100.299 ± 0.0200.316 ± 0.0100.338 ± 0.0020.477 ± 0.0010.397 ± 0.0110.428 ± 0.0260.371 ± 0.0010.385 ± 0.002
(−)-Gallocatechin306.9 > 138.9 309.9 > 288.90.271 ± 0.0020.260 ± 0.0120.264 ± 0.0020.266 ± 0.0050.283 ± 0.0010.310 ± 0.0210.355 ± 0.0200.324 ± 0.0010.346 ± 0.002
Gallic acid168.9 > 124.8
168.9 > 78.9
0.301 ± 0.0460.423 ± 0.0360.941 ± 0.0031.52 ± 0.032.39 ± 0.013.40 ± 0.262.71 ± 0.132.59 ± 0.063.60 ± 0.07
D-(−)-quinic acid190.9 > 84.9
190.9 > 93.0
0.425 ± 0.0120.560 ± 0.0140.643 ± 0.0460.745 ± 0.0330.925 ± 0.1001.21 ± 0.031.44 ± 0.141.59 ± 0.221.42 ± 0.04
Rutin608.9 > 299.9
608.9 > 270.9
n.d. *n.d.0.045 ± 0.0020.171 ± 0.0020.567 ± 0.0050.769 ± 0.0100.819 ± 0.0080.938 ± 0.0210.916 ± 0.024
Syringic acid196.9 > 120.9
196.9 > 181.9
n.d. *0.080 ± 0.0010.090 ± 0.0030.119 ± 0.0030.085 ± 0.0180.099 ± 0.0140.109 ± 0.0060.094 ± 0.0010.106 ± 0.023
trans-Resveratrol226.9 > 185.0
226.9 > 143.0
0.030 ± 0.0070.030 ± 0.0070.034 ± 0.0090.034 ± 0.0080.053 ± 0.0050.053 ± 0.0050.046 ± 0.0060.040 ± 0.0040.037 ± 0.008
Sum of phenolic compounds15.884.934378712971795165812821434
L-Valine118.1 > 72.0
118.1 > 55.0
n.d. *0.893 ± 0.0611.97 ± 0.094.76 ± 0.188.07 ± 0.1810.4 ± 0.114.2 ± 0.417.7 ± 0.219.6 ± 0.2
L-Methionine150.1 > 103.9
150.1 > 132.9
0.048 ± 0.0100.069 ± 0.0200.055 ± 0.0150.069 ± 0.0240.087 ± 0.0370.091 ± 0.0410.091 ± 0.0430.094 ± 0.0380.097 ± 0.033
L-Tryptophan205.0 > 188.0
205.0 > 145.9
n.d. * 0.499 ± 0.0121.76 ± 0.084.28 ± 0.096.86 ± 0.0611.0 ± 0.112.5 ± 0.314.0 ± 0.313.9 ± 0.5
L-Leucine132.1 > 86.0
132.1 > 44.0
0.309 ± 0.0351.07 ± 0.062.27 ± 0.204.83 ± 0.289.34 ± 0.8911.4 ± 0.414.4 ± 0.619.2 ± 0.920.6 ± 0.8
L-Histidine156.1 > 110.0
156.1 > 82.9
0.269 ± 0.0290.588 ± 0.0471.09 ± 0.011.85 ± 0.093.11 ± 0.054.35 ± 0.034.83 ± 0.025.49 ± 0.015.55 ± 0.06
L-Threonine120.1 > 74.0
120.1 > 56.0
0.463 ± 0.0180.899 ± 0.0531.43 ± 0.012.51 ± 0.023.68 ± 0.084.38 ± 0.075.27 ± 0.306.25 ± 0.056.51 ± 0.07
L-Lysine 147.1 > 84.0
147.1 > 130.0
0.213 ± 0.0223.31 ± 0.037.16 ± 0.0513.4 ± 0.324.8 ± 1.230.0 ± 0.933.1 ± 0.846.0 ± 1.447.3 ± 1.8
L-Phenylalanine 163.9 > 147.0
163.9 > 103.0
0.233 ± 0.0350.524 ± 0.0420.977 ± 0.0371.97 ± 0.063.57 ± 0.225.44 ± 0.176.69 ± 0.109.72 ± 0.2710.9 ± 0.1
L-Aspartic acid 131.8 > 88.0
131.8 > 114.9
0.745 ± 0.0811.12 ± 0.091.81 ± 0.133.76 ± 0.149.16 ± 0.4115.1 ± 0.520.0 ± 0.133.3 ± 0.635.5 ± 1.8
Sum of amino acids2.288.9718.537.468.792.2111152160
* not detected.
Table 3. UPLC-ESI-MS/MS quantification of the detected compounds in tested grape pomace extracts for GPE_DG2p_T, (mean ± SD, n = 3).
CompoundQuantification/
Confirmation
Transition
GPE_DG2p 20 °C
[mg/L]
GPE_DG2p 30 °C
[mg/L]
GPE_DG2p 40 °C
[mg/L]
GPE_DG2p 50 °C
[mg/L]
GPE_DG2p 60 °C
[mg/L]
(+)-Catechin290.9 > 139.0
290.9 > 123.0
454 ± 8819 ± 3622 ± 5652 ± 11528 ± 6
(−)-Epicatechin290.9 > 139.0
290.9 > 123.0
994 ± 81710 ± 141355 ± 71390 ± 01170 ± 0
(−)-Catechin 3-gallate (−)-Epichatechin 3-gallate433.0 > 123.0
433.0 > 273.0
1.36 ± 0.270.902 ± 0.1101.23 ± 0.071.11 ± 0.040.819 ± 0.017
(−)-Epichatechin 3-gallate433.0 > 123.0
433.0 > 273.0
0.852 ± 0.1731.11 ± 0.410.884 ± 0.2331.00 ± 0.080.827 ± 0.221
(−)-Gallocatechin306.9 > 138.9
309.9 > 288.9
0.823 ± 0.0360.903 ± 0.0541.00 ± 0.051.12 ± 0.021.16 ± 0.02
Gallic acid168.9 > 124.8
168.9 > 78.9
2.10 ± 0.044.12 ± 0.085.03 ± 0.034.31 ± 0.046.40 ± 0.06
D-(−)-quinic acid190.9 > 84.9
190.9 > 93.0
0.492 ± 0.0400.560 ± 0.0210.606 ± 0.0250.496 ± 0.0270.503 ± 0.035
Rutin608.9 > 299.9
608.9 > 270.9
0.924 ± 0.3200.610 ± 0.0040.757 ± 0.0020.861 ± 0.0120.973 ± 0.008
Syringic acid196.9 > 120.9
196.9 > 181.9
0.108 ± 0.0010.109 ± 0.0010.100 ± 0.0020.100 ± 0.0020.105 ± 0.001
trans-Resveratrol226.9 > 185.0
226.9 > 143.0
0.264 ± 0.0480.214 ± 0.0040.208 ± 0.0020.206 ± 0.0020.204 ± 0.002
Sum of polyphenolic compounds14552538198620511709
L-Valine118.1 > 72.0
118.1 > 55.0
14.6 ± 0.714.9 ± 0.514.9 ± 0.415.9 ± 0.618.3 ± 0.3
L-Methionine150.1 > 103.9
150.1 > 132.9
0.522 ± 0.0010.103 ± 0.0010.280 ± 0.0070.434 ± 0.0060.859 ± 0.011
L-Tryptophan205.0 > 188.0
205.0 > 145.9
20.7 ± 0.122.5 ± 0.126.7 ± 0.128.1 ± 0.426.2 ± 0.4
L-Leucine132.1 > 86.0
132.1 > 44.0
20.9 ± 0.221.3 ± 0.522.1 ± 0.323.0 ± 0.426.6 ± 0.4
L-Histidine156.1 > 110.0
156.1 > 82.9
0.482 ± 0.0121.84 ± 0.024.14 ± 0.013.40 ± 0.122.75 ± 0.10
L-Threonine120.1 > 74.0
120.1 > 56.0
4.00 ± 0.054.02 ± 0.094.27 ± 0.014.03 ± 0.185.10 ± 0.05
L-Lysine 147.1 > 84.0
147.1 > 130.0
25.9 ± 0.125.6 ± 0.125.3 ± 0.225.4 ± 0.427.2 ± 0.4
L-Phenylalanine 163.9 > 147.0
163.9 > 103.0
6.44 ± 0.036.54 ± 0.056.70 ± 0.067.93 ± 0.0510.05 ± 0.07
L-Aspartic acid 131.8 > 88.0
131.8 > 114.9
16.5 ± 0.116.8 ± 0.417.6 ± 0.419.8 ± 0.124.9 ± 0.4
Sum of amino acids110113122128142
Table 4. UPLC-ESI-MS/MS quantification of the detected compounds in tested grape pomace extracts for GPE_DG2p_t, (mean ± SD, n = 3).
CompoundQuantification/
Confirmation
Transition
GPE_DG2p 10 min
[mg/L]
GPE _DG2p 20 min
[mg/L]
GPE_DG2p 30 min
[mg/L]
GPE_DG2p 60 min
[mg/L]
GPE_DG2p 120 min
[mg/L]
(+)-Catechin290.9 > 139.0
290.9 > 123.0
580 ± 9694 ± 4667 ± 5575 ± 4471 ± 8
(−)-Epicatechin290.9 > 139.0
290.9 > 123.0
1315 ± 101485 ± 121335 ± 111110 ± 9845 ± 6
(−)-Catechin 3-gallate 433.0 > 123.0
433.0 > 273.0
1.50 ± 0.021.46 ± 0.021.36 ± 0.071.59 ± 0.051.43 ± 0.03
(−)-Epichatechin 3-gallate433.0 > 123.0
433.0 > 273.0
3.03 ± 0.471.74 ± 0.041.42 ± 0.031.82 ± 0.021.26 ± 0.03
(−)-Gallocatechin306.9 > 138.9
309.9 > 288.9
1.36 ± 0.041.37 ± 0.111.26 ± 0.011.39 ± 0.061.34 ± 0.05
Gallic acid168.9 > 124.8
168.9 > 78.9
3.67 ± 0.153.84 ± 0.012.96 ± 0.011.99 ± 0.031.24 ± 0.01
D-(−)-quinic acid190.9 > 84.9
190.9 > 93.0
0.848 ± 0.1030.866 ± 0.0210.809 ± 0.0480.834 ± 0.0280.895 ± 0.006
Rutin608.9 > 299.9
608.9 > 270.9
1.23 ± 0.090.670 ± 0.0310.691 ± 0.0010.724 ± 0.0140.718 ± 0.042
Syringic acid196.9 > 120.9
196.9 > 181.9
0.150 ± 0.0030.154 ± 0.0020.156 ± 0.0010.149 ± 0.0010.149 ± 0.004
trans-Resveratrol226.9 > 185.0
226.9 > 143.0
0.077 ± 0.0030.030 ± 0.0020.025 ± 0.0010.020 ± 0.0010.014 ± 0.004
Sum of polyphenolic compounds19072189201016931323
L-Valine118.1 > 72.0
118.1 > 55.0
15.3 ± 0.816.1 ± 0.615.9 ± 0.316.7 ± 0.417.9 ± 0.1
L-Methionine150.1 > 103.9
150.1 > 132.9
1.29 ± 0.011.12 ± 0.011.15 ± 0.001.13 ± 0.001.14 ± 0.01
L-Tryptophan205.0 > 188.0
205.0 > 145.9
19.1 ± 0.220.3 ± 0.121.5 ± 0.223.3 ± 0.427.0 ± 1.0
L-Leucine132.1 > 86.0
132.1 > 44.0
25.6 ± 0.126.0 ± 0.326.0 ± 0.127.1 ± 0.229.1 ± 1.4
L-Histidine156.1 > 110.0
156.1 > 82.9
3.42 ± 0.183.61 ± 0.153.76 ± 0.093.97 ± 0.184.40 ± 0.12
L-Threonine120.1 > 74.0
120.1 > 56.0
7.93 ± 0.278.18 ± 0.337.91 ± 0.098.00 ± 0.148.56 ± 0.49
L-Lysine 147.1 > 84.0
147.1 > 130.0
27.5 ± 0.728.0 ± 0.328.0 ± 0.628.3 ± 0.628.1 ± 1.2
L-Phenylalanine 163.9 > 147.0
163.9 > 103.0
6.78 ± 0.066.83 ± 0.066.89 ± 0.047.29 ± 0.288.03 ± 0.06
L-Aspartic acid 131.8 > 88.0
131.8 > 114.9
27.4 ± 1.026.1 ± 0.427.1 ± 0.427.6 ± 0.730.3 ± 0.6
Sum of amino acids134136138143154
Table 5. Effect of grape pomace to extraction medium ratio on total phenolic content (TPC) and antioxidant activity (DPPH, ABTS) of white grape pomace extracts (mean ± SD, n = 3).
GPE_EM
1:99
GPE_EM
1:19
GPE_EM
1:9
GPE_EM
1:4
GPE_EM
2:3
GPE_EM
1:1
GPE_EM
3:2
GPE_EM
4:1
GPE_EM
5:1
TPC
[mg GAE/L]
124.8 ± 0.8148.5 ± 0.9287.7 ± 1.2599.7 ± 3.51046.4 ± 10.81255.0 ± 9.51465.5 ± 13.81599.0 ± 12.11469.1 ± 14.0
DPPH
[mg TE/L]
8.7 ± 0.119.8 ± 0.3333.8 ± 1.4787.7 ± 2.51023.5 ± 12.01036.3 ± 11.81030.6 ± 11.41012.2 ± 12.81005.9 ± 9.8
ABTS
[mg TE/L]
7.1 ± 0.215.4 ± 0.9258.6 ± 1.5512.8 ± 2.8825.0 ± 5.1859.6 ± 8.9871.2 ± 9.1894.3 ± 10.2866.8 ± 9.4
Table 6. Effect of extraction temperature on total phenolic content (TPC) and antioxidant activity (DPPH, ABTS) of white grape pomace extracts (mean ± SD, n = 3).
GPE_DG2p_20 °C GPE_DG2p_30 °CGPE_DG2p_40 °CGPE_DG2p_50 °CGPE_DG2p_60 °C
TPC
[mg GAE/L]
1005.6 ± 25.81085.9 ± 28.6941.9 ± 15.2914.3 ± 11.4764.7 ± 20.4
DPPH
[mg TE/L]
1450.2 ± 1.41662.6 ± 0.91244.6 ± 14.71179.2 ± 21.31002.3 ± 19.4
ABTS
[mg TE/L]
2003.3 ± 16.12029.7 ± 12.31848.7 ± 9.11598.7 ± 10.51337.4 ± 13.0
Table 7. Effect of extraction time on total phenolic content (TPC) and antioxidant activity (DPPH, ABTS) of white grape pomace extracts (mean ± SD, n = 3).
GPE_DG2p_10 minGPE_DG2p_20 minGPE_DG2p_30 minGPE_DG2p_60 minGPE_DG2p_120 min
TPC
[mg GAE/L]
755.1 ± 15.4999.7 ± 26.3910.2 ± 22.2840.8 ± 16.1785.3 ± 5.7
DPPH
[mg TE/L]
1534.0 ± 9.01 664.3 ± 20.01 421.8 ± 18.61338.4 ± 22.31290.2 ± 15.9
ABTS
[mg TE/L]
1 942.9 ± 12.52 073.1 ± 2.41 955.2 ± 13.81758.7 ± 23.11595.4 ± 17.0
Disclaimer/Publisher’s Note: The statements, opinions and data contained in all publications are solely those of the individual author(s) and contributor(s) and not of MDPI and/or the editor(s). MDPI and/or the editor(s) disclaim responsibility for any injury to people or property resulting from any ideas, methods, instructions or products referred to in the content.