Communication

Technical Optimization of a DC-Coupled Photovoltaic System with Battery Energy Storage for Poultry Farm Applications: A Two-Loop Methodology Based on Energy Utilization Indices


Faculty of Production and Power Engineering, University of Agriculture in Krakow, Balicka 116 B, 30-149 Krakow, Poland
*
Authors to whom correspondence should be addressed.
Appl. Sci. 2026, 16(12), 5799; https://doi.org/10.3390/app16125799
Submission received: 20 April 2026 / Revised: 25 May 2026 / Accepted: 1 June 2026 / Published: 9 June 2026

Abstract

This study presents a novel iterative dual-loop methodology for the technical sizing of DC-coupled PV-BESS systems. The method was implemented for a commercial broiler farm characterized by a highly variable electricity demand profile (annual consumption: 7.6 MWh; coefficient of variation: 53%). The methodology introduces two original energy utilization indicators—the photovoltaic-to-converter matching factor (WPV_S) and the photovoltaic-to-BESS matching factor (WPV_B)—enabling purely technical optimization independent of economic conditions. Minimization of the radius of curvature of the WPVB characteristic curve is applied as a rigorous mathematical criterion for determining the optimal BESS capacity. Simulation results indicate that the optimal configuration consists of a 9.7 kWp photovoltaic system, a 7 kW DC converter, and a 15 kWh battery storage system. The integration of an optimally sized energy storage system increased the self-consumption coverage ratio from 38% to 59% and improved the photovoltaic energy utilization factor from 35% to 54%. Additional economic analysis demonstrates that the PV-only subsystem achieves a simple payback period ranging from 8 to 18 years, depending on the selected pricing scenario. Consequently, the technically optimal configuration identified using the proposed methodology represents a practically feasible investment for broiler production facilities operating under Polish net-billing conditions. The proposed methodology provides a reproducible, economically independent framework for the design of DC-coupled PV-BESS systems in agricultural prosumer facilities, addressing a critical gap in the optimization literature and offering practical sizing guidelines applicable to similarly high-variability load profiles.

1. Introduction

The accelerating deployment of distributed photovoltaic (PV) systems across Europe is reshaping both electricity generation profiles and the regulatory frameworks governing prosumer energy management. In Poland, the transition from net metering to net billing—introduced under the Act of 29 October 2021—fundamentally altered the economic rationale for PV installations, shifting the optimization objective toward maximization of on-site self-consumption. This regulatory shift has rendered technically optimized, storage-integrated PV systems particularly critical for energy-intensive enterprises in the agricultural sector. Livestock production facilities collectively account for a significant share of electricity consumption in Polish agriculture [1], and their energy costs are rising in line with both increased production intensity and electricity price volatility.
Global energy consumption has grown approximately eightfold since 1950, driven largely by fossil fuel combustion. In 2024, approximately 37.4 billion tonnes of CO2 was emitted globally [2], intensifying pressure to reduce carbon intensity without compromising energy security [3,4,5,6]. Photovoltaic systems have emerged as one of the most cost-effective renewable technologies, with LCOE declining from approximately €0.37/kWh in 2010 to below €0.05/kWh in recent years [7,8,9]. Despite this advantage, PV systems present inherent technical challenges due to the stochastic nature of solar irradiance, creating temporal mismatch between generation and demand—particularly pronounced in poultry facilities where ventilation power demand is closely coupled to ambient temperature.
Photovoltaic cells are semiconductor devices that directly convert incoming solar radiation into electrical energy through the photovoltaic effect—the generation of an electromotive force in a material following the absorption of photons [10,11,12]. The fundamental operating unit is the p-n junction. When photons with energy exceeding the semiconductor bandgap are absorbed, electron–hole pairs are generated and separated by the built-in electric field at the junction, producing a direct current (DC) output. The most commercially mature technology is crystalline silicon (mono- and polycrystalline), accounting for over 90% of global production capacity, while emerging thin-film (CdTe, CIGS) and perovskite-based architectures offer alternative efficiency–cost trade-offs. Cell efficiency under standard test conditions (STC: G = 1000 W·m−2, AM 1.5, T = 25 °C) typically ranges from 15% to 22% for commercial polycrystalline and monocrystalline modules, respectively. Module output is subject to temperature-dependent degradation: efficiency decreases as cell temperature increases above 25 °C, governed by the temperature coefficient.
Poultry production facilities—and broiler houses in particular—represent a specific and underexplored category of agricultural electricity consumer whose load profile is shaped by three interacting biological and technological drivers: (I) the discrete, cyclic structure of broiler production (cycles of approximately 43 days separated by approximately 15 days of preparation), which causes abrupt shifts in energy demand at cycle boundaries; (II) the age-dependent thermoregulatory requirements of broilers, which determine the ventilation control thresholds throughout each cycle; and (III) the dual-section fan architecture (continuous base-load fans and threshold-activated peak fans), which creates a bimodal power demand distribution with extreme statistical non-normality. Their load profiles are dominated by ventilation systems operating in base-load and peak-load modes, with peak ventilation closely correlated with solar irradiance—creating a potentially favorable temporal alignment between on-site generation and demand. The literature contains no study that optimizes a complete DC architecture PV-BESS system for such a facility using exclusively technical criteria derived from one-minute-resolution real operational data. This constitutes the primary motivation for the present study.
Direct current (DC)-coupled PV-BESS configurations eliminate the DC/AC inversion stage inherent in grid-connected AC systems, reducing conversion losses and simplifying the power electronics chain. This approach also mitigates associated technical issues, such as increased higher-order harmonic distortion and unbalanced DC capacitor voltages [13]. Yet, systematic optimization of DC-coupled PV-BESS systems—accounting for load-dependent converter efficiency and current-rate-dependent battery efficiency—remains substantially underrepresented in the engineering literature [14,15,16,17]. Energy transmission efficiency within power conversion systems is also an important consideration. Recent advances in solid-state transformer technology have demonstrated the critical role of port-level stability analysis in multi-port DC architectures [18].
The remainder of this paper is structured as follows: Section 1 reviews the state of the art; Section 2 presents the research methodology; Section 3 describes the research object; Section 4 reports simulation results; Section 5 presents a supplementary economic analysis; Section 6 provides discussion; Section 7 states limitations; and Section 8 presents conclusions.

1.1. State of the Art in PV System Optimization

Algorithms for selecting PV system components—particularly for AC systems—have been widely studied [14,15,16,17]. The optimization of ILR (inverter loading ratio) has been extensively investigated [15,16,17,19,20,21,22,23,24,25,26,27,28]; however, reported results show substantial variation. Table 1 summarizes selected studies: the recommended ILR ranges from 1.0 to 2.4, reflecting the complexity of the optimization problem and diversity of methodological approaches applied.
Available optimization methods are often computationally complex [29], or focus on single aspects such as self-consumption [30], LCOE [31], cost [32], or NPV/IRR [33]. Meta-heuristic approaches including particle swarm optimization [34] and C-ADMM [35] impose a computational burden disproportionate to the investment scale typical of agricultural installations. Studies of poultry-farm PV systems [36,37] typically apply fixed oversizing ratios rather than site-specific methodologies. A particularly relevant gap concerns DC-coupled PV-BESS systems, where no systematic methodology accounts for load-dependent converter efficiency and current-rate-dependent battery efficiency under real agricultural operational conditions.

1.2. Research Objectives

Based on the identified research gaps, this study pursues the following specific objectives:
  • To develop a reproducible, two-loop iterative methodology for the technical sizing of DC-coupled PV-BESS systems based exclusively on energy-performance indices derived from real operational data.
  • The definition and verification of two complementary energy utilization indicators—the photovoltaic system-to-inverter matching coefficient (WPV_S) and the photovoltaic system-to-BESS matching coefficient (WPV_B)—enable the optimal sizing of each system component independently.
  • To quantify the impact of BESS capacity on self-consumption and PV energy utilization efficiency for a poultry facility with a highly irregular demand profile under Polish climatic conditions.
  • To identify the optimal PV-BESS configuration using inflection-point analysis and radius-of-curvature minimization of the WPV_B characteristic curve.
  • Supplementary economic assessment of the optimal PV installation with an energy storage system, demonstrating the investment’s profitability under current electricity market conditions in Poland.

1.3. Scientific Novelty

The scientific novelty of this study consists of the following original contributions:
  • A novel two-loop iterative optimization algorithm for DC-coupled PV-BESS systems is proposed, integrating load-dependent efficiency profiles of both the DC/DC converter and the battery—an approach not previously reported for agricultural PV applications.
  • Two original energy utilization indices (WPV_S and WPV_B) are introduced and formally defined, enabling purely technical, economics-independent optimization of DC PV system components.
  • This is the first study to apply radius-of-curvature minimization of the (WPV_B) characteristic as a rigorous mathematical criterion for optimal BESS capacity determination in a DC agricultural PV system.
  • One-minute-resolution real operational data are used as the primary optimization input, enabling detailed statistical characterization of the load profile including extreme non-normality (kurtosis exceeding 1100 for peak ventilation in winter).
  • The proposed method enables optimization of a DC photovoltaic PV system with energy storage under conditions of relatively high variability in the energy demand profile.

2. Research Methodology

In accordance with the adopted objectives, the proposed methodology is based on two primary datasets: electricity consumption data (recorded at one-minute intervals, IEC 61724-1 Class A [38]) and climatic data (solar irradiance and ambient temperature from IMGW at 60 min intervals, Class C). Due to the differing temporal resolutions, both datasets were standardized by downsampling to 60 min intervals (Class C) prior to optimization calculations.
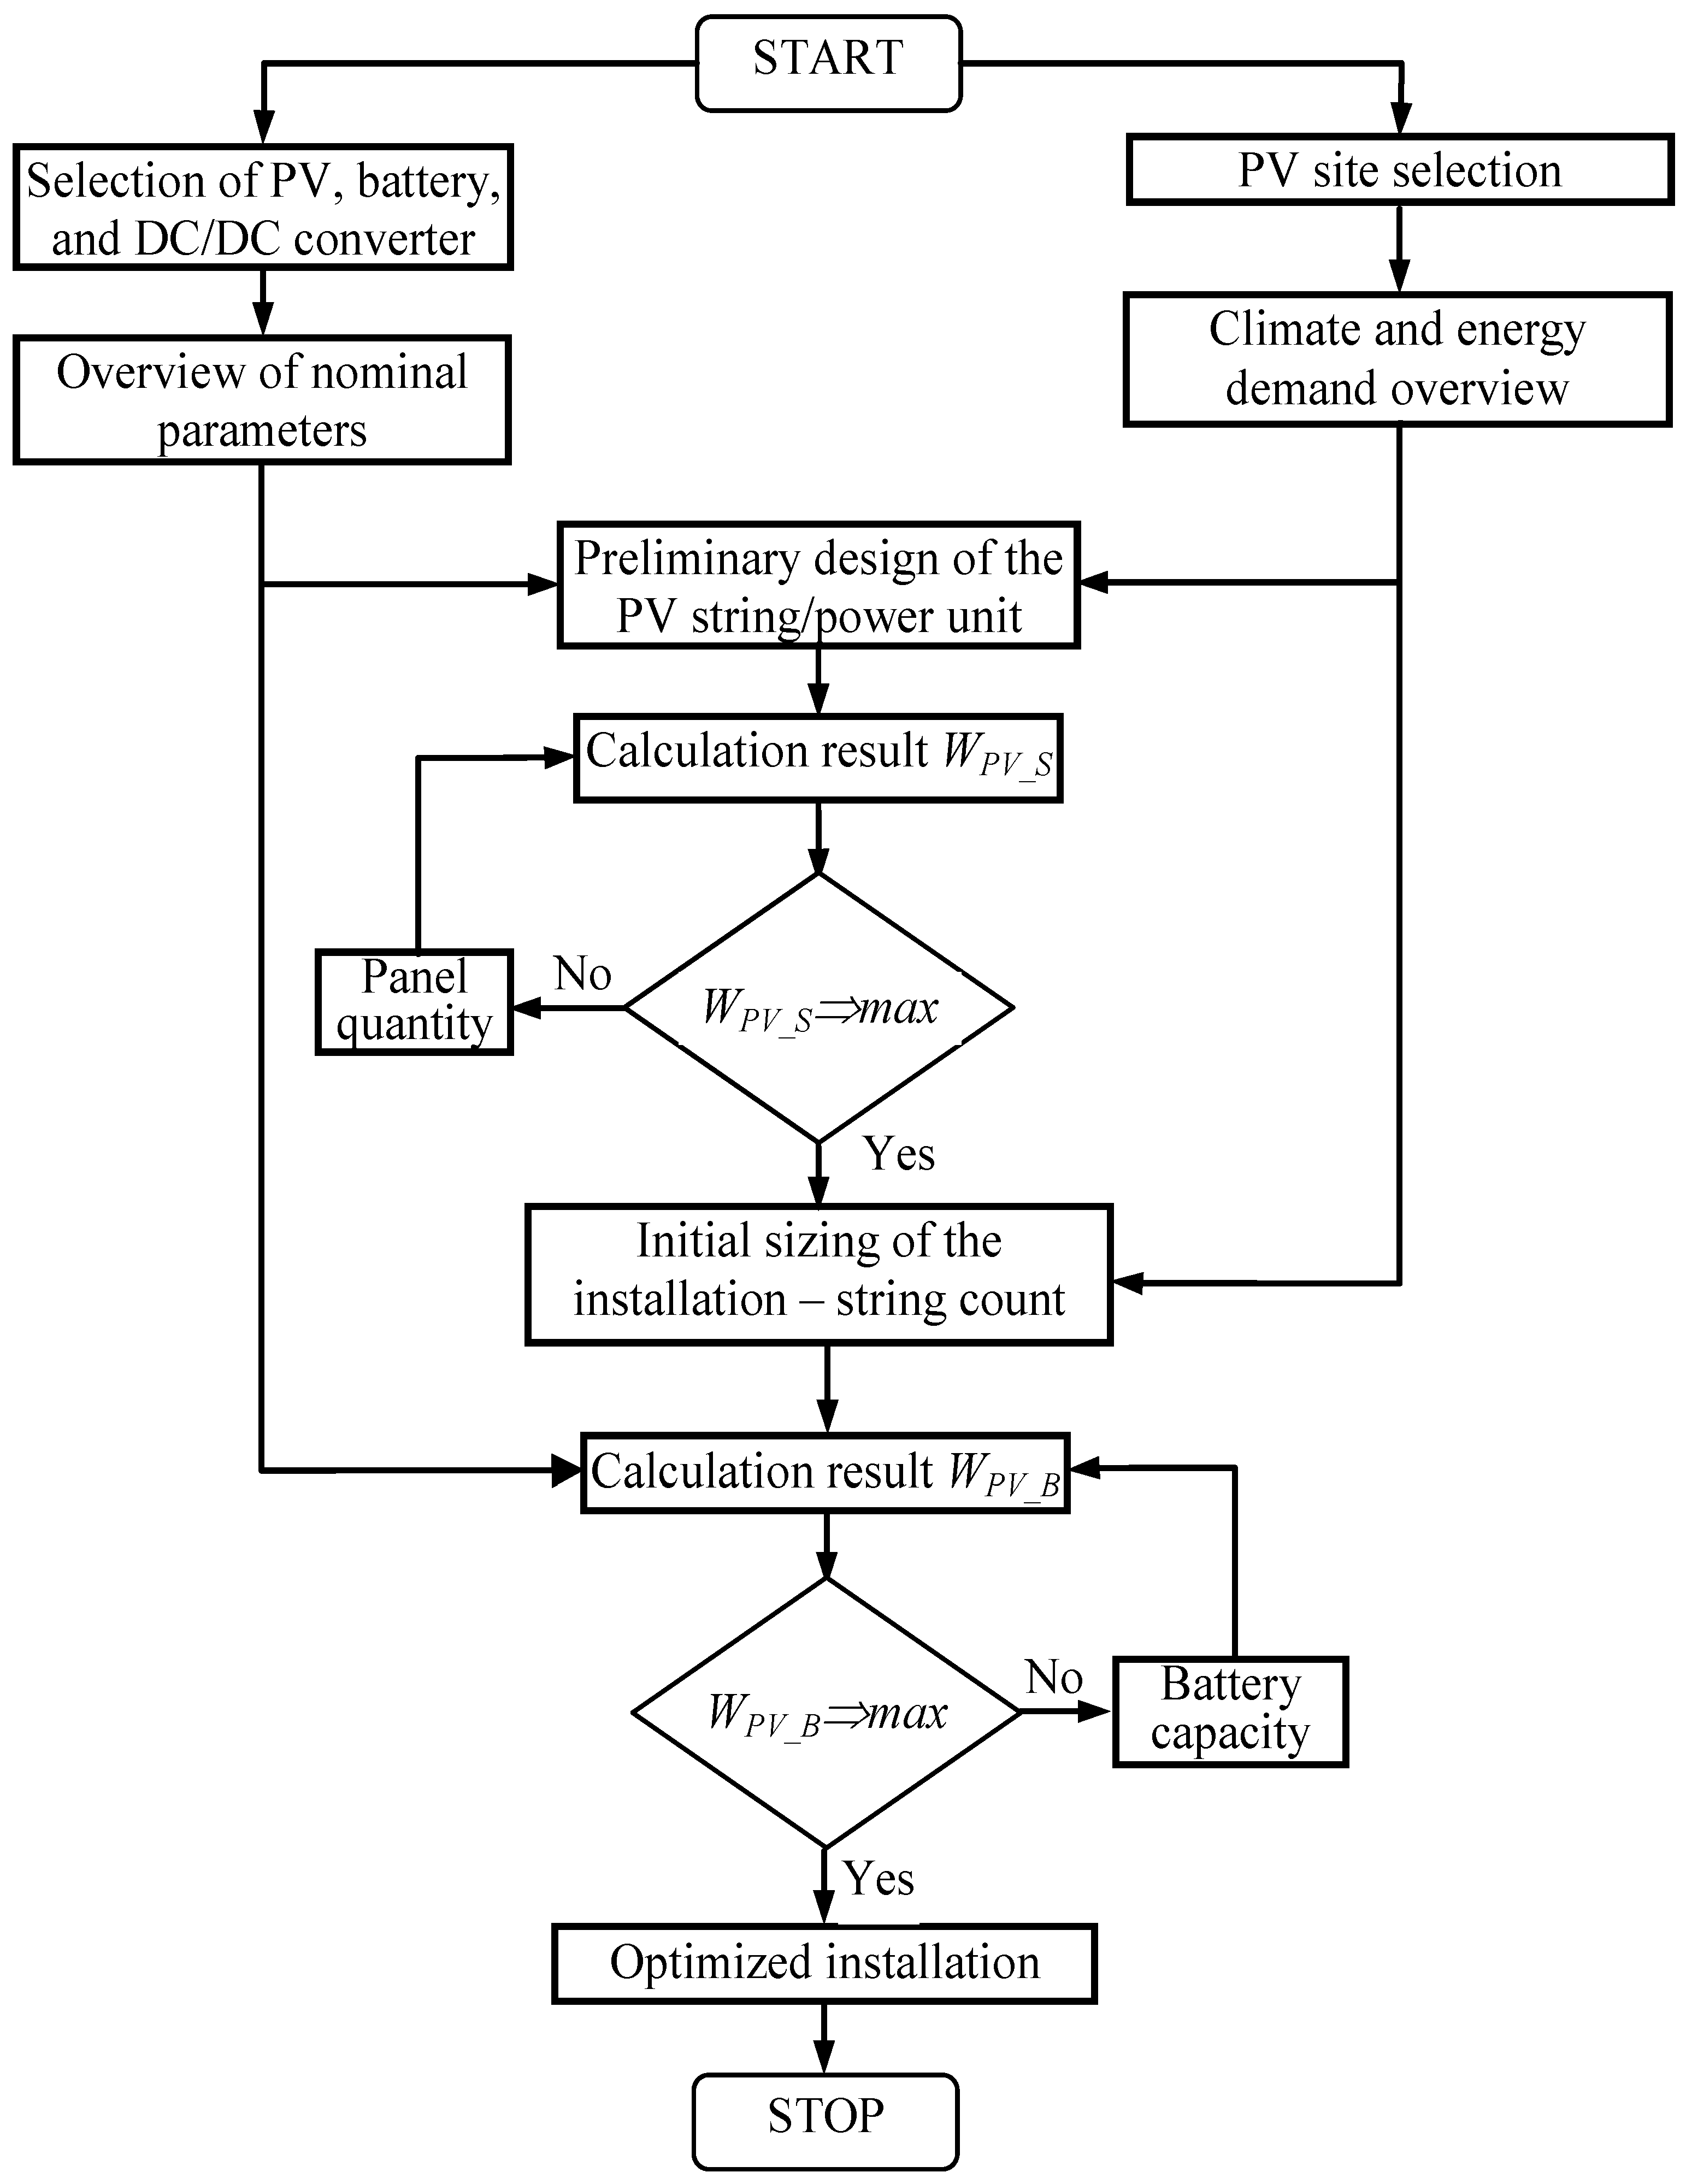
A novel aspect of the proposed approach is the construction of a DC system and the incorporation of the degree of utilization of rated component power when assessing energy conversion efficiency. The methodology accounts for the dynamic load-dependent efficiency characteristics of both the PV panels and the DC converter, as well as the charging and discharging processes of the battery storage system, with particular attention to the multiplicity of current flows under low-load conditions. The optimization algorithm is shown in Figure 1. It features two iterative loops in a series-parallel structure.
The DC power output from the PV installation is described by Equation (1):
P M P P ( D C )   =   n     A     η P V ( T )     G P O A
where n—number of panels; A—panel area (m2); GPOA—plane-of-array irradiance (W·m−2); and ηPV(T)—temperature-corrected PV efficiency.
The corrected panel efficiency, incorporating the temperature coefficient, is given by Equation (2):
η P V ( T )   =   η P V     1   +   β T     T P V     25
where ηPV—module efficiency at 25 (°C); βT—temperature coefficient (°C−1); and TPV—module operating temperature (°C).
The operating temperature of a PV module is estimated from Equation (3), based on the NOCT parameter from the panel datasheet:
T P V   =   T a   +   N O C T     20 800     G P O A
where Ta—ambient temperature (°C); and NOCT—nominal operating cell temperature (defined at GPOA = 800 W·m−2, AM 1.5, Ta = 20 °C).
The efficiency of the DC converter is described by the piecewise relationship given in Equation (4), derived from the structure proposed by Mielcarek et al. [39], and verified against laboratory measurements. The piecewise model is necessary because the efficiency curve shape changes with loading factor: below 0.1 a quadratic polynomial provides the best fit, while a linear relationship applies above 0.1:
η D C / D C   =   61     k D C / D C 2   +   16.7     k D C / D C     0.0637       for       0   <   k D C / D C   <   0.1 0.0096     k D C / D C   +   0.9918       for       k D C / D C     0.1
where kDC/DC—loading factor of the DC/DC converter relative to its rated power, defined by Equation (5):
k D C / D C   =   P M P P ( D C ) P n D C
where PMPP(DC)—power from PV installation (kW); and PnDC—rated power of the DC converter (kW).
The DC converter efficiency model is derived from the structure proposed by Mielcarek et al. [39], and verified against laboratory measurements. The piecewise model is necessary because the efficiency curve shape changes with loading factor: below 0.1 a quadratic polynomial provides the best fit, while a linear relationship applies above 0.1. The following technical specifications were adopted for the simulation: rated input voltage range 80–160 V DC; rated output voltage 100 V DC; maximum input current 60 A; switching frequency 20 kHz; and standby power consumption < 5 W. These parameters are consistent with commercially available bidirectional DC/DC converters in the 6–19 kW class used for DC-bus PV applications.
The power delivered to the DC bus—theoretically available for production—is described by Equation (6):
P D C   =   P M P P ( D C )     η D C / D C       for       P M P P ( D C )     1.02   <   P n D C P n D C       for       P M P P ( D C )     1.02     P n D C
A multiplier of 1.02 accounts for the converter’s input-side power limit under near-rated conditions, whereby the dynamic power supplied on the primary side may exceed rated input power even when the rated value refers to the output.
The surplus and deficit of instantaneous power relative to the facility’s production demand are defined by Equations (7) and (8), respectively:
P s u r   =   P D C     P Z   f o r   P D C   >   P Z
P s h o = P Z P D C   f o r   P D C     P Z
where PZ—current electrical power demand for production (kW).
The PV energy utilization index for the system without storage (WPV_S), defining the ratio of energy usefully delivered at the converter output to the total energy available at the PV maximum power point over the calendar year, is given by Equation (9):
W P V _ S   =   i = 1 n P D C , i     Δ t i = 1 n P M P P ( D C ) , i     Δ t
where Δt—time-averaging interval (h); and i—measurement period index. The optimal PV array and converter size are identified at the maximum of WPV_S (Loop 1).
In the second loop, battery efficiency is described by Equation (10), adapted from Xiaojia Su et al. [40] at a constant temperature of 25 °C:
η l a d / r l a d   =   η r e f     k r a t     C r a t
where ηref = 0.978—reference efficiency; krat = 0.0127—current multiplier factor; and Crat—charge/discharge current ratio.
According to the study by Saez-de-Ibarra et al. [19] and Alipour et al. [41], an increase in operating temperature by 10 °C is associated with a reduction in battery lifetime of nearly 50%, which is consistent with broader evidence that temperature strongly affects electrochemical properties, degradation mechanisms, and performance of lithium-ion cells. Therefore, a constant operating temperature of the batteries was assumed in this study, and its impact will be considered in future work as part of a more detailed economic analysis of such a system.
The charge/discharge current multiplier is determined by Equation (11):
k   =   P s u r U C C
where Psur—surplus power at converter output (W); C—rated battery capacity (Ah); and UC—battery operating voltage (V).
The battery adopted for simulation is a lithium iron phosphate (LiFePO4) module with the following nominal specifications: rated capacity 50 Ah at 50 V (2.4 kWh per module); nominal bus voltage 100 V DC; depth of discharge (DoD) 60% (operating range: 20–80% SoC); maximum charge/discharge C-rate: 1C; cycle life: >6000 cycles at 80% DoD; self-discharge rate: <3%/month. These parameters are consistent with commercially available stationary (LiFePO4) storage systems and were adopted as representative for the simulated capacity range of 0–100 kWh.
The power transferred to and from the battery is given by Equations (12) and (13):
P l a d   =   P s u r     η l a d
P r l a d = P s h o η r l a d
where Psho—power deficit to meet production demand (kW).
The PV-to-BESS system matching coefficient (WPV_B), characterizing the degree of utilization of total PV-generated electricity including energy recovered from the battery, is given by Equation (14):
W P V _ B   =   i = 1 k P D C , i     P s u r , i   +   P r l a d , i     Δ t i = 1 k P M P P ( D C ) , i     Δ t
where k—upper limit of summation. The optimal battery capacity is identified at the inflection point of the (WPV_B) characteristic, determined by fitting an exponential function (Equation (14)) and computing the radius of curvature. The self-consumption coverage ratio and PV energy utilization ratio are defined by Equations (15) and (16):
W m e n   =   E Z     E s h o E Z
W e u r = E Z E s h o E D C
where EZ—annual electricity demand (kWh); EDC—energy at converter output (kWh); and Esho—annual energy deficit (kWh).
The exponential fitting function used in nonlinear estimation for the (WPV_B) characteristic is
W P V _ B = a     e b C + d
where a, b, and d—estimated coefficients; and C—battery capacity (kWh).
The self-consumption coverage ratio (W_men), the fraction of annual electricity demand met by on-site PV generation and battery discharge, and the PV energy utilization ratio (W_eur), the fraction of total DC converter output energy directly consumed for production, are key performance indicators. These metrics quantify the effectiveness of the technical sizing methodology in improving both self-sufficiency and energy utilization efficiency.

3. Characteristics of the Research Object

The measurements presented in this study were conducted in one of six identical livestock buildings used for broiler chicken production, located on a farm in the Mazowieckie Province (Łosice County, central Poland). The total floor area was 2900 m2 and internal volume approximately 11,000 m3. Each building was equipped with four chimney fans (rated power: 0.52 kW each) forming the base ventilation section, and three ridge fans (rated power: 1.1 kW each) forming the peak ventilation section.
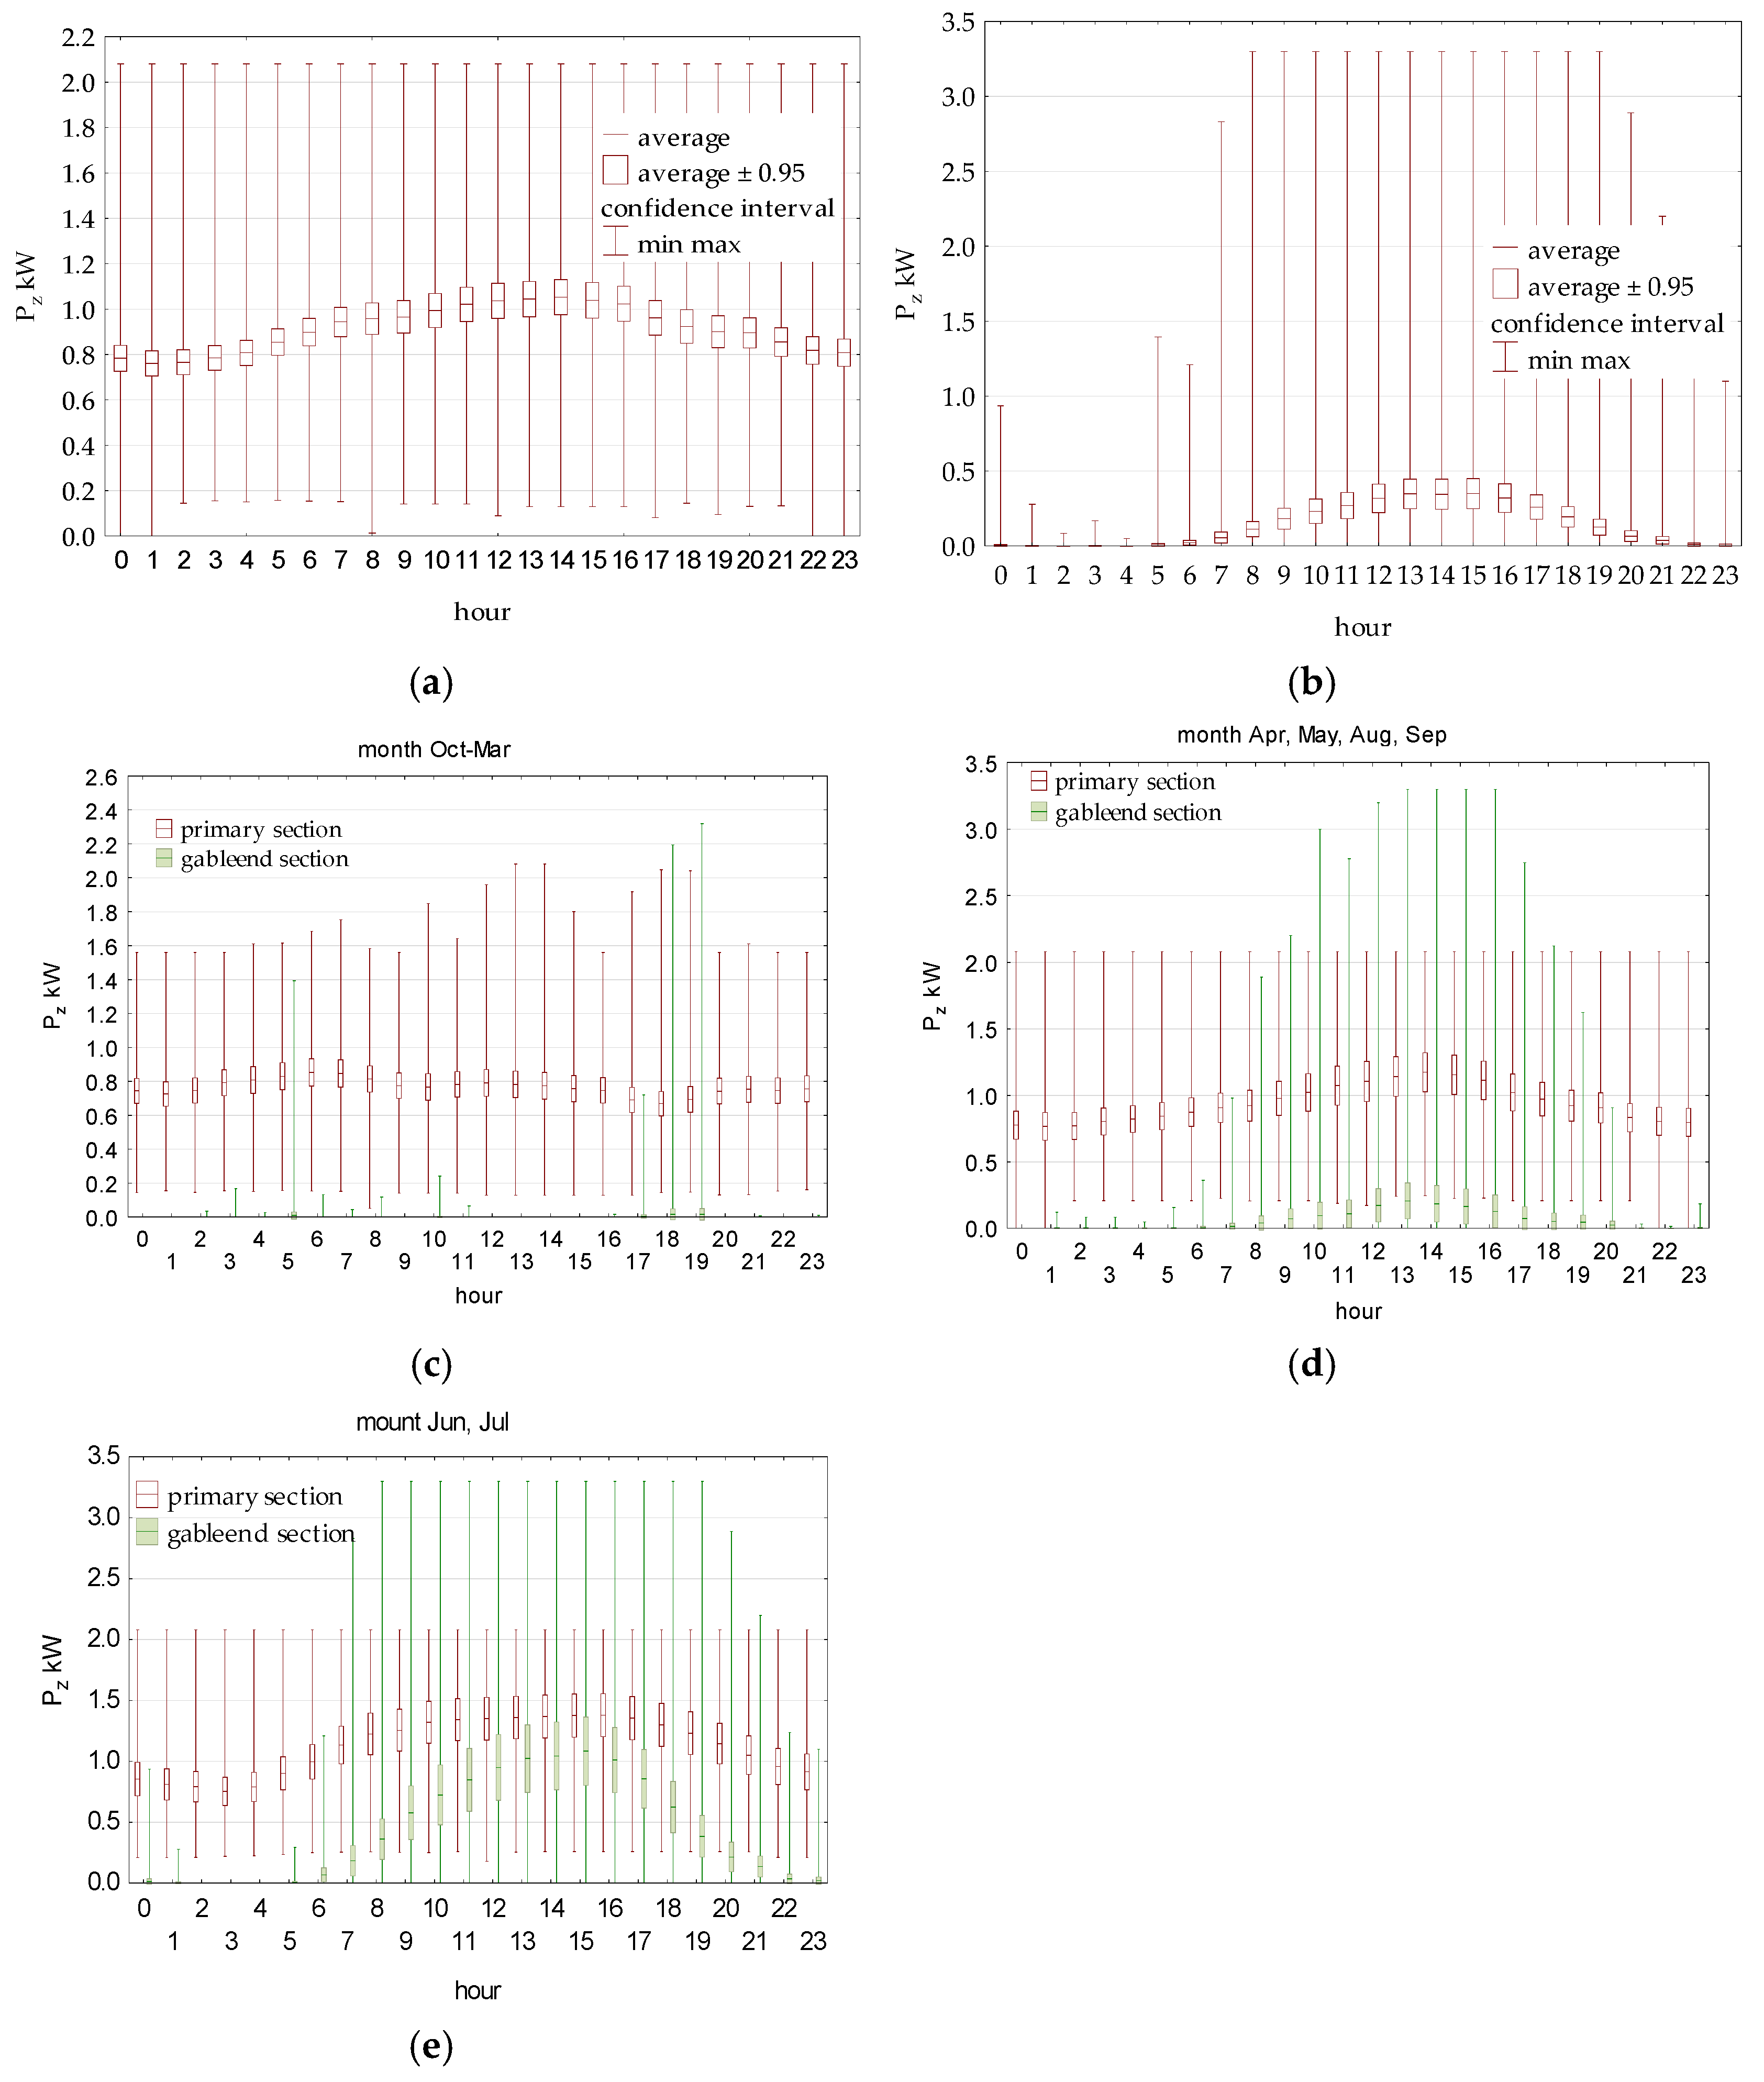
The electricity demand profile of this facility is intrinsically linked to the biological and technological requirements of broiler production. The base ventilation section (four chimney fans, 0.52 kW each, total 2.08 kW) operates continuously throughout each production cycle to maintain minimum air quality, resulting in a platykurtic, relatively stable base load. The peak ventilation section (three ridge fans, 1.1 kW each, total 3.3 kW) is activated by threshold control: fans switch on abruptly when internal temperature exceeds age-dependent limits (22–35 °C) or when CO2 concentration surpasses 4600 ppm. This on/off activation mechanism—with no intermediate speed states in the base configuration—produces a strongly bimodal power demand distribution. In winter months (October–March), peak fans are rarely activated (mean peak-section power: 0.00 kW, CV = 2692%), while in summer months (June–July) they operate frequently (mean: 0.42 kW). The resulting CV = 53% at the annual level directly reflects the seasonal cycle of broiler production combined with the threshold-governed fan control logic, not simply weather variability. This is the fundamental reason why the load profile requires a dedicated optimization approach rather than a standard residential or commercial prosumer methodology.
Electrical measurements were performed using a Twelve AS-3plus power quality analyzer at one-minute intervals (IEC 61724-1 Class A [38]). The analyzer was characterized by the following technical parameters: measurement range 0–1000 V (AC/DC), current measurement range 0–1000 A (via CT clamps), power measurement accuracy class 0.5S (EN 62053-22), data logging interval 1 min (configurable), internal memory capacity 512 MB (equivalent to >365 days continuous logging at 1 min resolution), and communication interface RS-485/Modbus RTU.
Electrical measurements were performed using a Twelve AS-3plus power quality analyzer at one-minute intervals (IEC 61724-1 Class A [38]). Microclimate parameters were monitored using a VIRGO microclimate controller with TEMP-201 temperature sensor and RHT-CO2-10K combined sensor. The fan control algorithm implemented two thresholds: internal temperature limit in the range 22–35 °C (depending on bird age) and CO2 concentration limit of 4600 ppm.
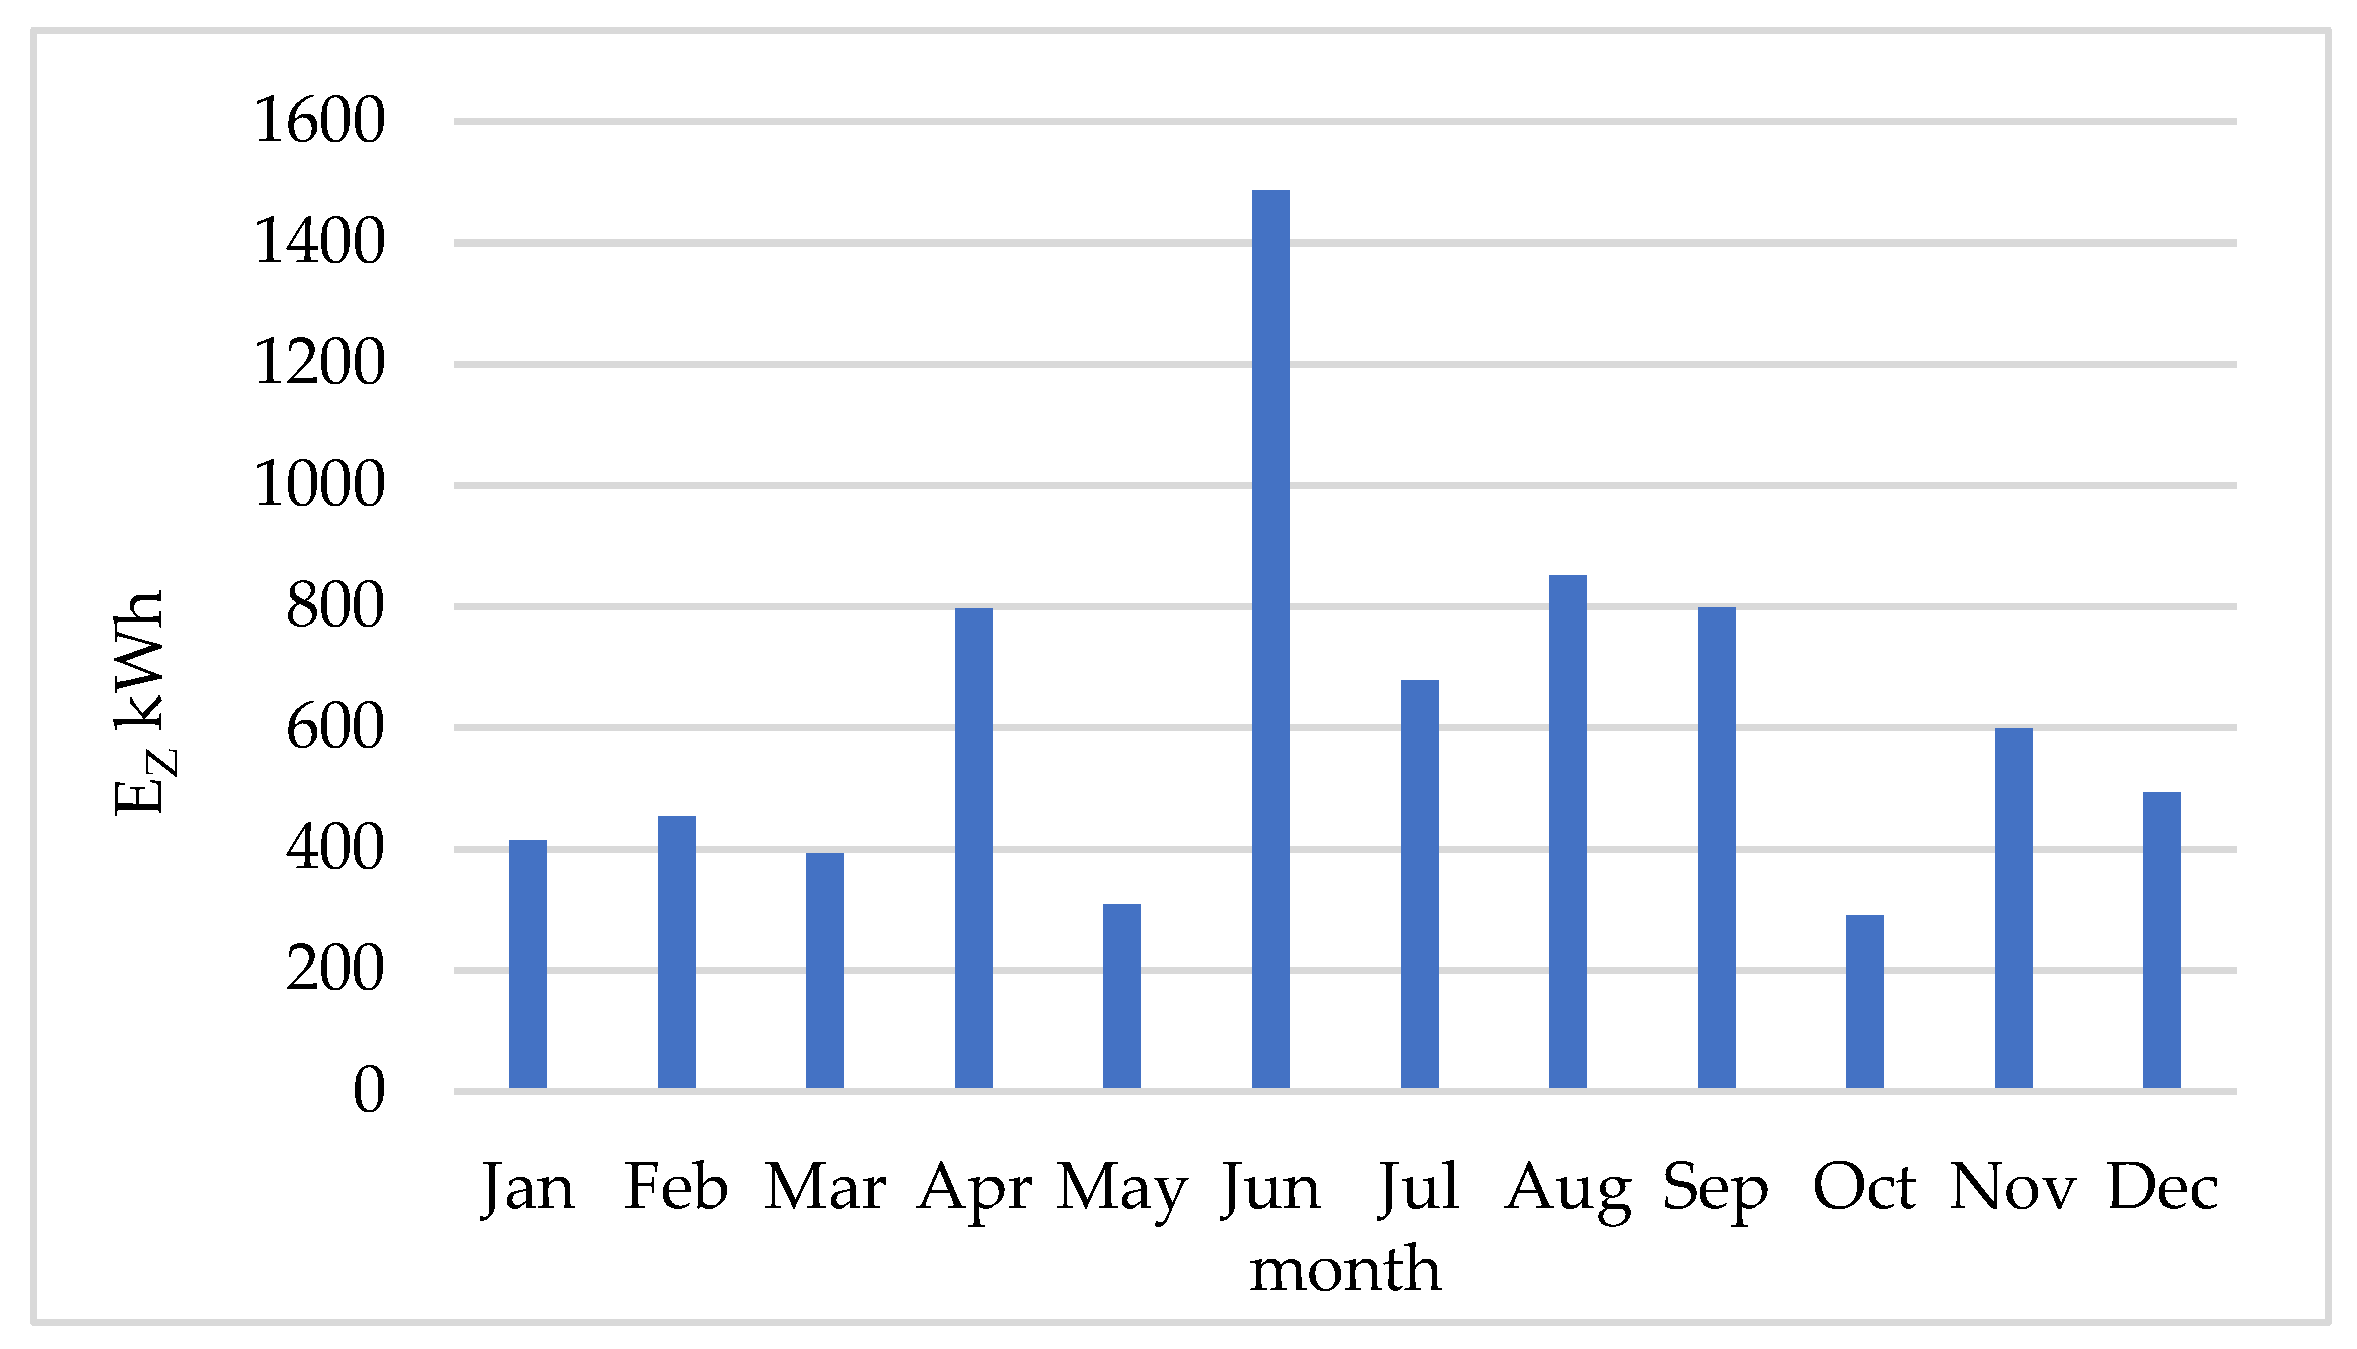
The measurement campaign covered 1 February 2019 to 17 March 2020. Eight complete production cycles were recorded (average 43 days each), followed by approximately 15 days of preparation. Stocking density: 56,000 ROSS 308 broiler chickens per cycle. Annual electricity consumption: 7.6 MWh; monthly mean: 630 kWh; and coefficient of variation: 53%. Monthly consumption ranged from 290 kWh (October) to 1487 kWh (June), driven by the cycle-based schedule (Figure 2).
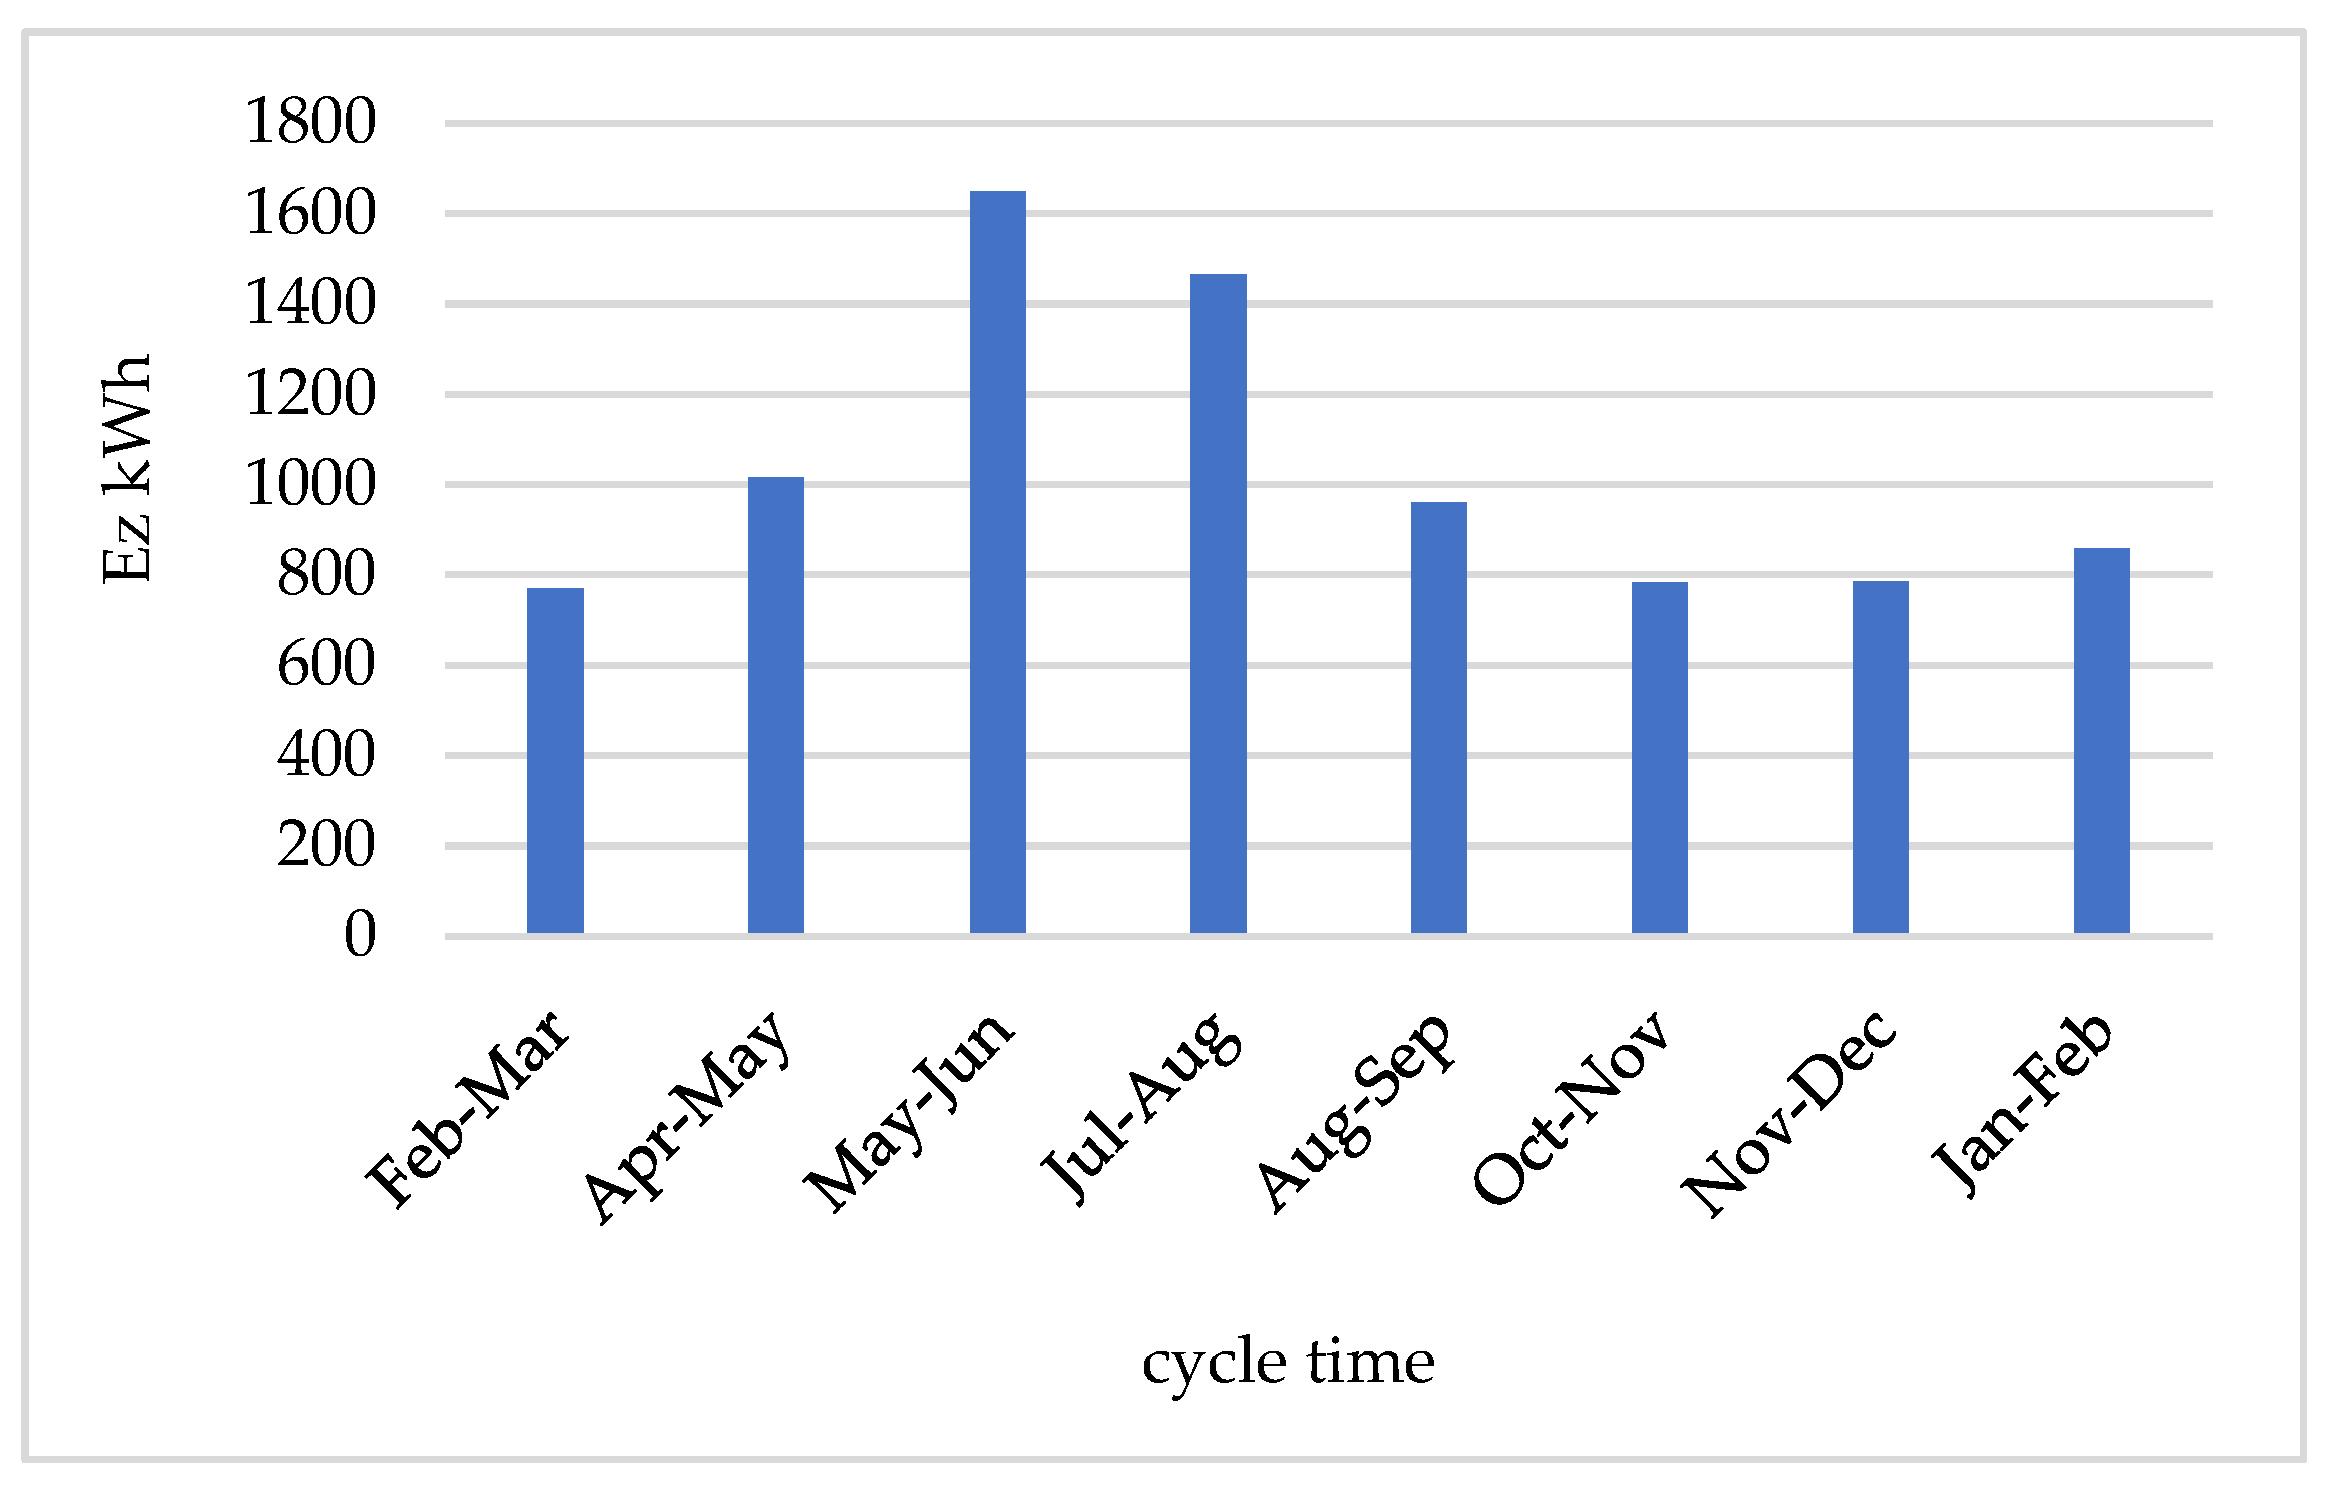
In the autumn–winter period (October–March), monthly consumption stabilized at approximately 800 kWh due to predominant base-section fan operation. During the remainder of the year, consumption increased to 1000–1600 kWh, driven by peak-section fans activated to maintain thermal comfort at elevated outdoor temperatures (Figure 3).
Hourly power demand profiles were derived for five sub-periods (Figure 4a–e). A statistical summary is presented in Table 2.
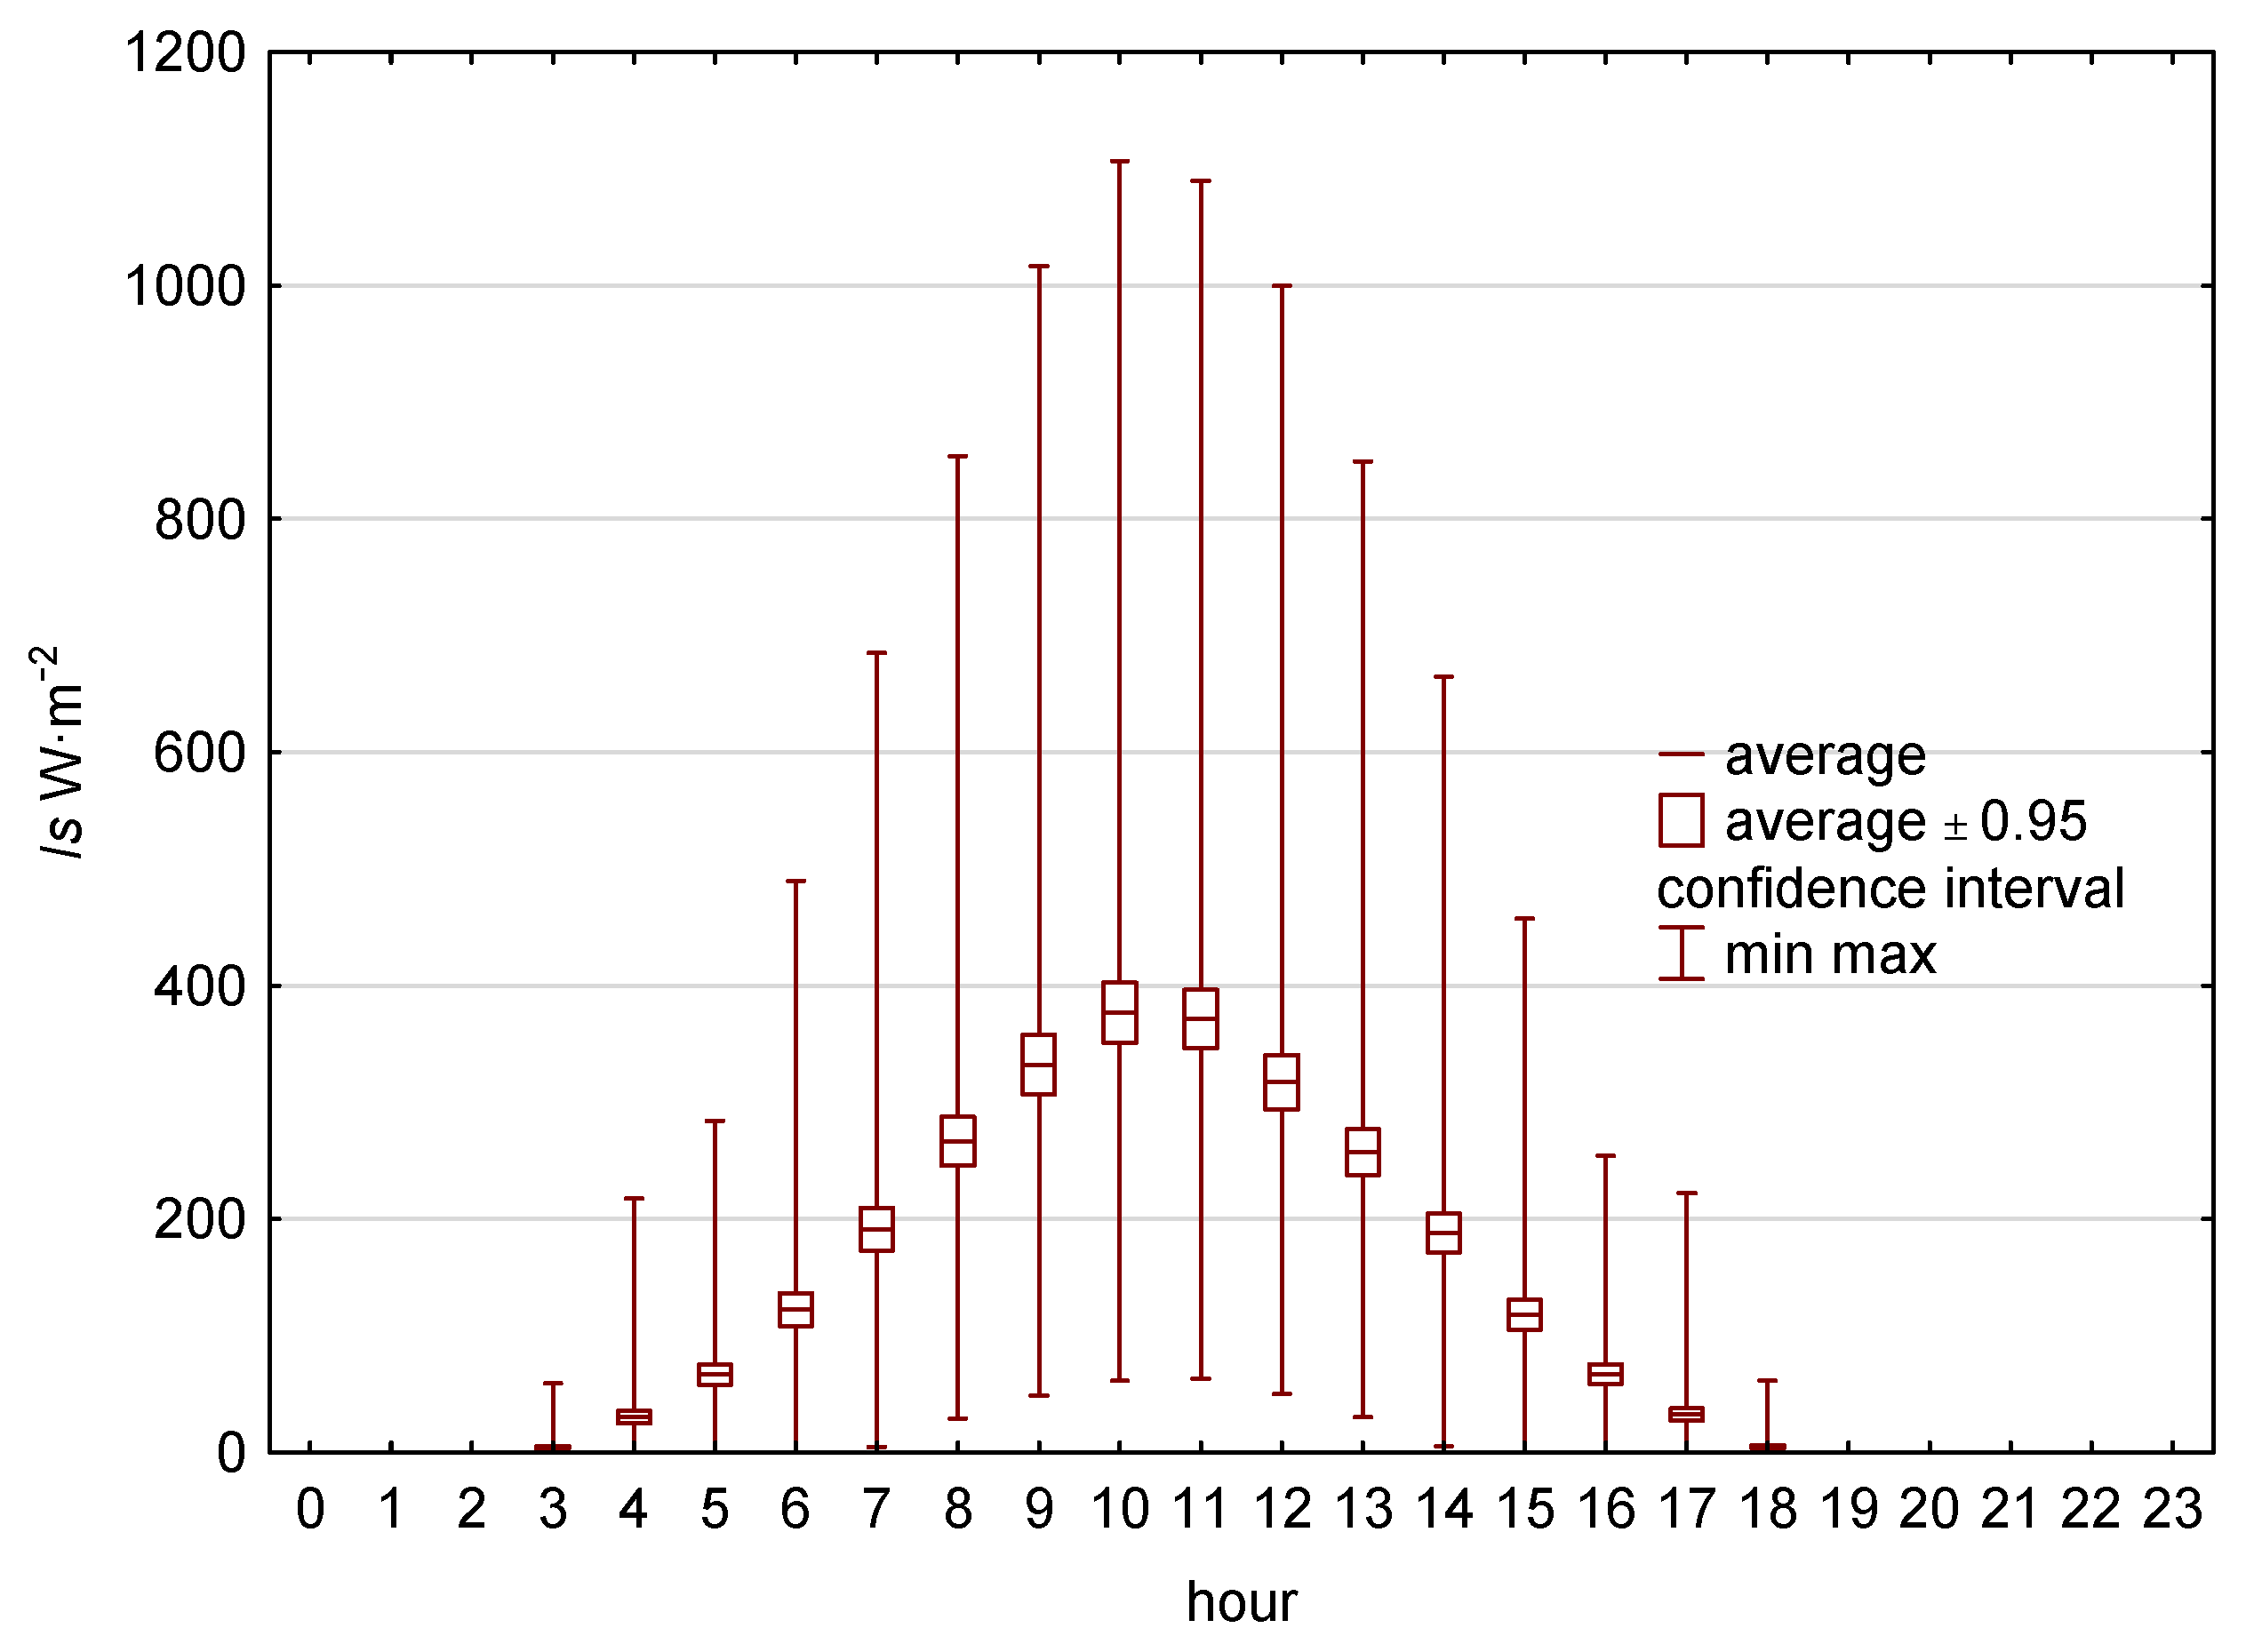
The statistical characterization reveals extreme non-normality in the peak ventilation section’s power demand distribution: in winter months (October–March), the coefficient of variation reaches 2692%, skewness exceeds 32, and kurtosis surpasses 1100—indicating a highly leptokurtic distribution dominated by rare, high-magnitude events (full-load peak fan operation). This extreme non-normality is a direct consequence of the threshold-activated fan control algorithm: when internal temperature exceeds age-dependent limits 22–35 °C or when CO2 concentration surpasses 4600 ppm. When the controller’s temperature or CO2 threshold is not met—as is typically the case for 85–90% of winter hours—peak power demand is zero, producing the observed spike in kurtosis. This mechanism is characteristic of all modern broiler production facilities using fixed-speed fans with discrete microclimate control, and its implications for PV-BESS sizing are analyzed in detail in Section 4.2. In the base section, kurtosis ranges from −0.95 to −1.70 (platykurtic distribution). A south-facing PV installation with 30° tilt was assessed. The resulting irradiance profile is illustrated in Figure 5.

4. Simulation Results

Simulations were performed using polycrystalline PV panels with rated power 405 Wp (STC), active area 1.8 m2, temperature coefficient βT = 6.5 × 10⁻³ °C−1, NOCT = 48 °C. The PV modules used in the simulation are representative of current-generation polycrystalline silicon technology with the following complete set of parameters at STC (G = 1000 W·m−2, AM 1.5, Tcell = 25 °C): open-circuit voltage VOC = 47.5 V; short-circuit current ISC = 10.9 A; voltage at maximum power point VMPP = 39.2 V; current at maximum power point IMPP = 10.3 A; module efficiency η = 22.5%; number of cells: 144 (half-cell configuration); and power tolerance: 0/+5 Wp; NOCT: 48 °C. The PV manufacturer is not disclosed to avoid promotional bias. The installation is south-facing with 30° tilt. For the DC converter, a simulation step of 1 kW was applied over the range 6–19 kW.

4.1. PV System Without Energy Storage

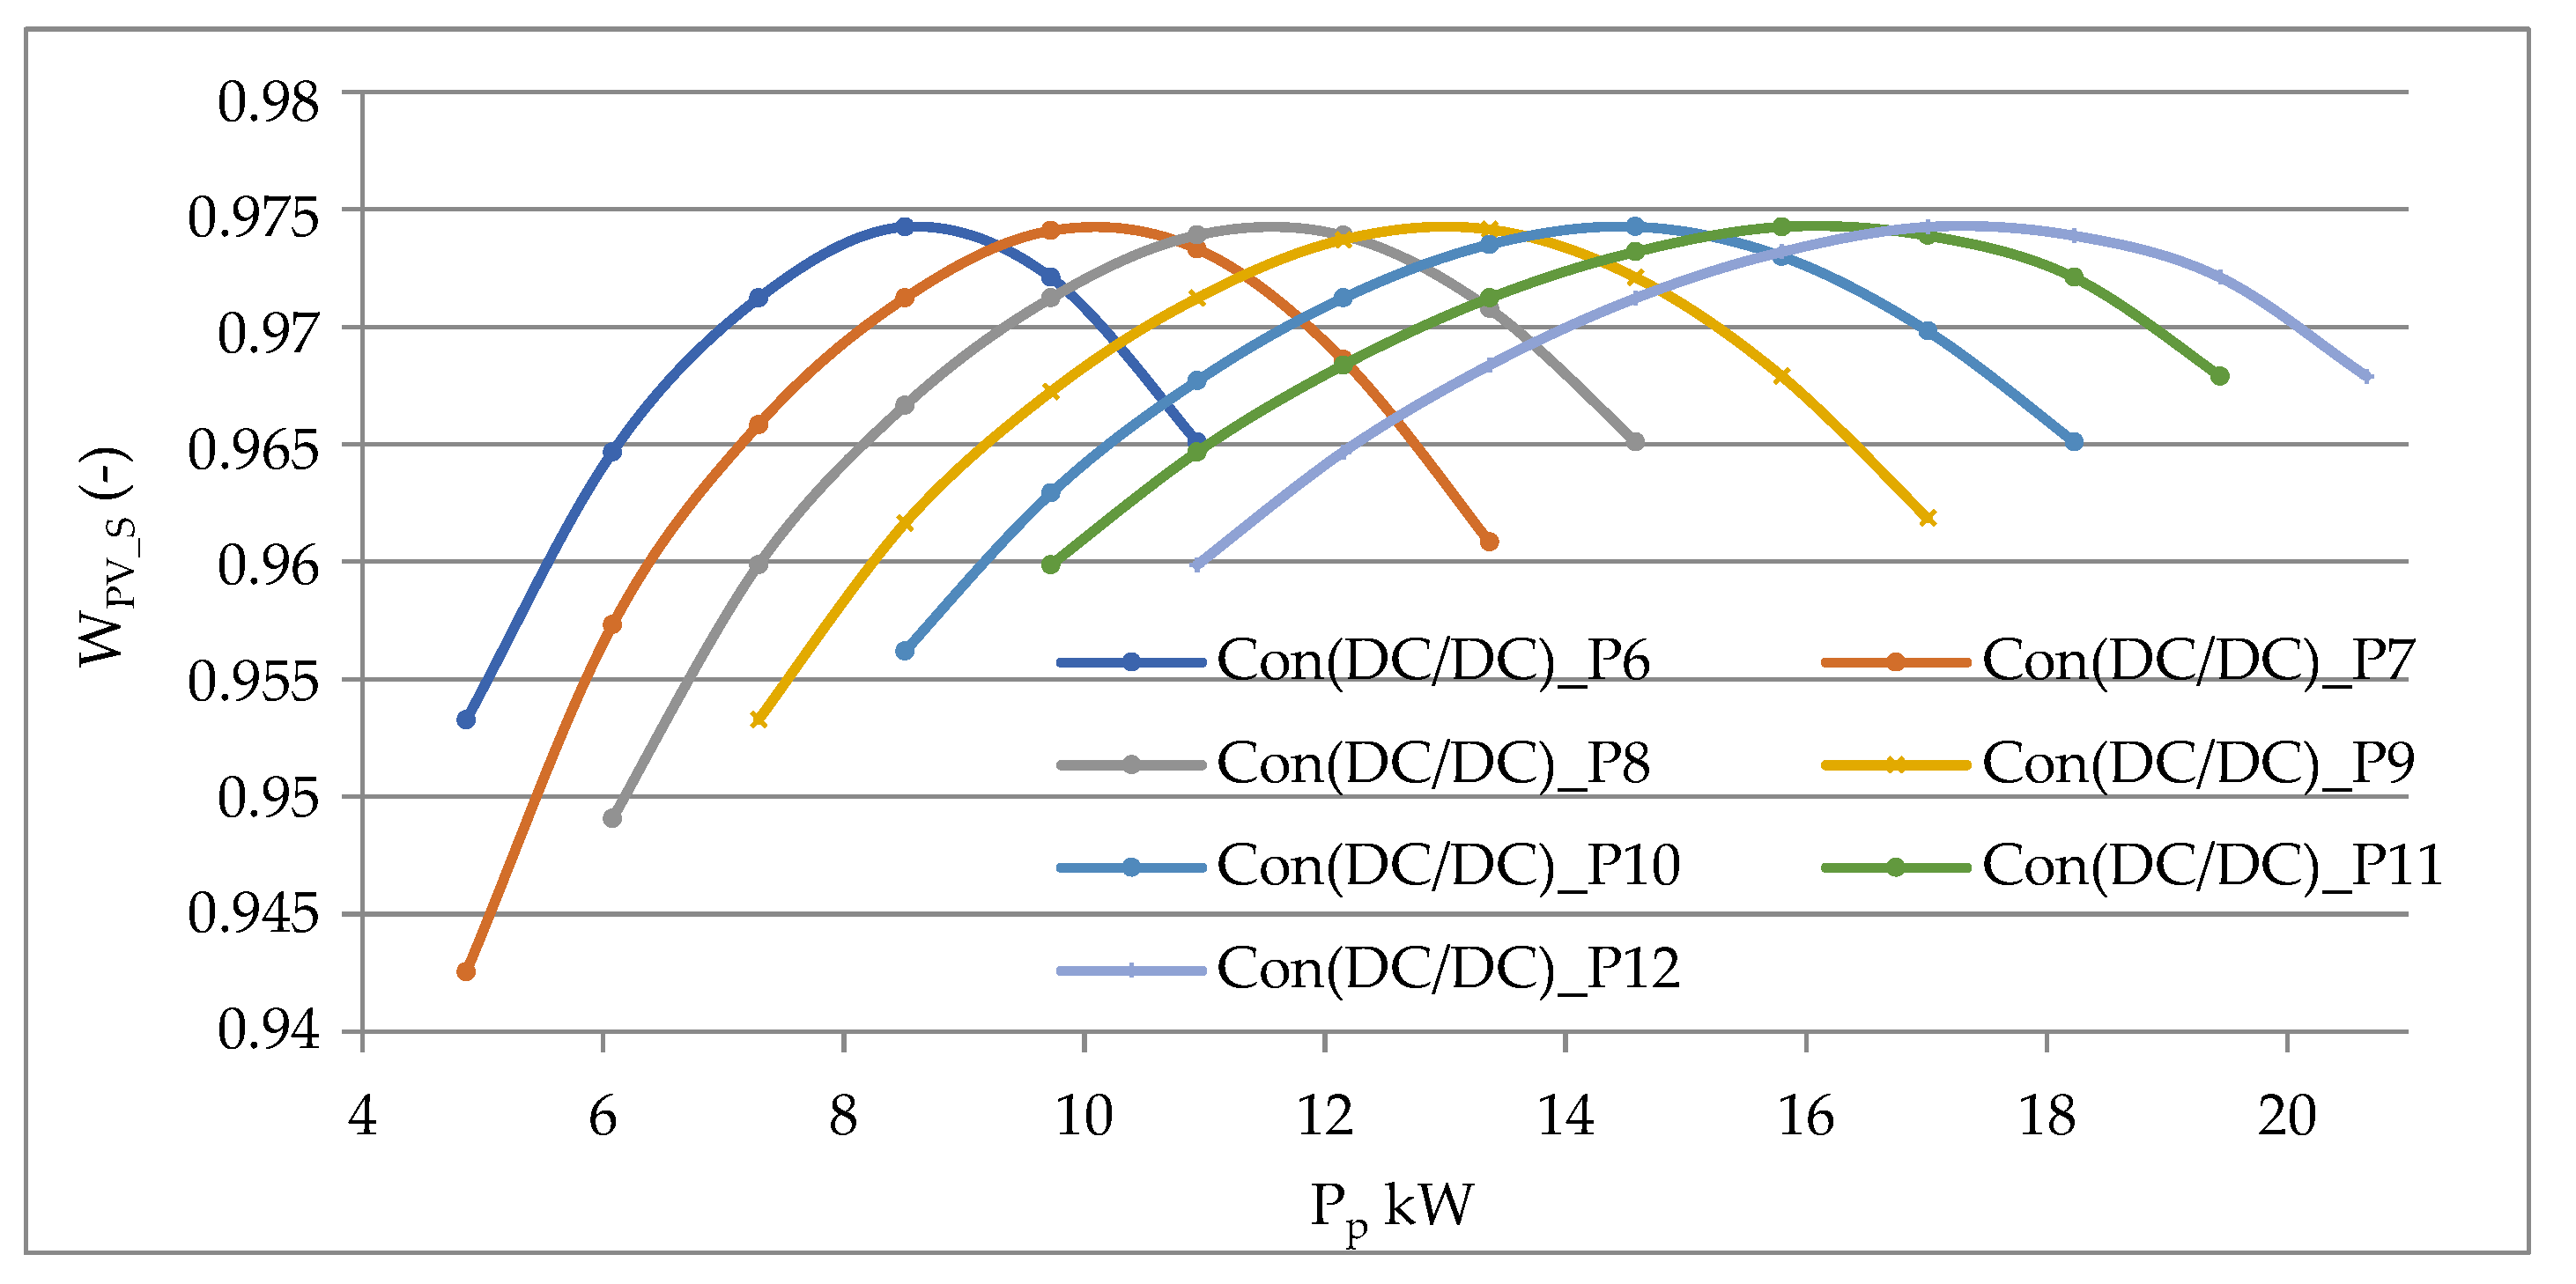
Figure 6 presents the family of (WPV_S) curves as a function of PV peak power for different DC converter ratings. An envelope of maximum (WPV_S = 0.974) is visible, representing maximum annual DC generation efficiency. As converter rated power increases, the characteristic curves become progressively asymmetric: the rate of index increase prior to the optimum is lower than the rate of decrease beyond it—implying that PV oversizing above the optimal point is more detrimental than a comparable degree of undersizing. The simulation grid for Figure 6 was constructed with a PV peak power resolution of 0.5 kWp across the range 2–25 kWp, yielding 47 calculation points per converter rating curve, and 14 converter rating curves from 6 to 19 kW (1 kW step). This resolution is sufficient to characterize the maximum of WPV_S with an uncertainty of less than 0.3 kWp. Additional calculation points were introduced in the vicinity of the optimal configuration (8–12 kWp range) with a finer resolution of 0.1 kWp to improve the precision of optimum identification.
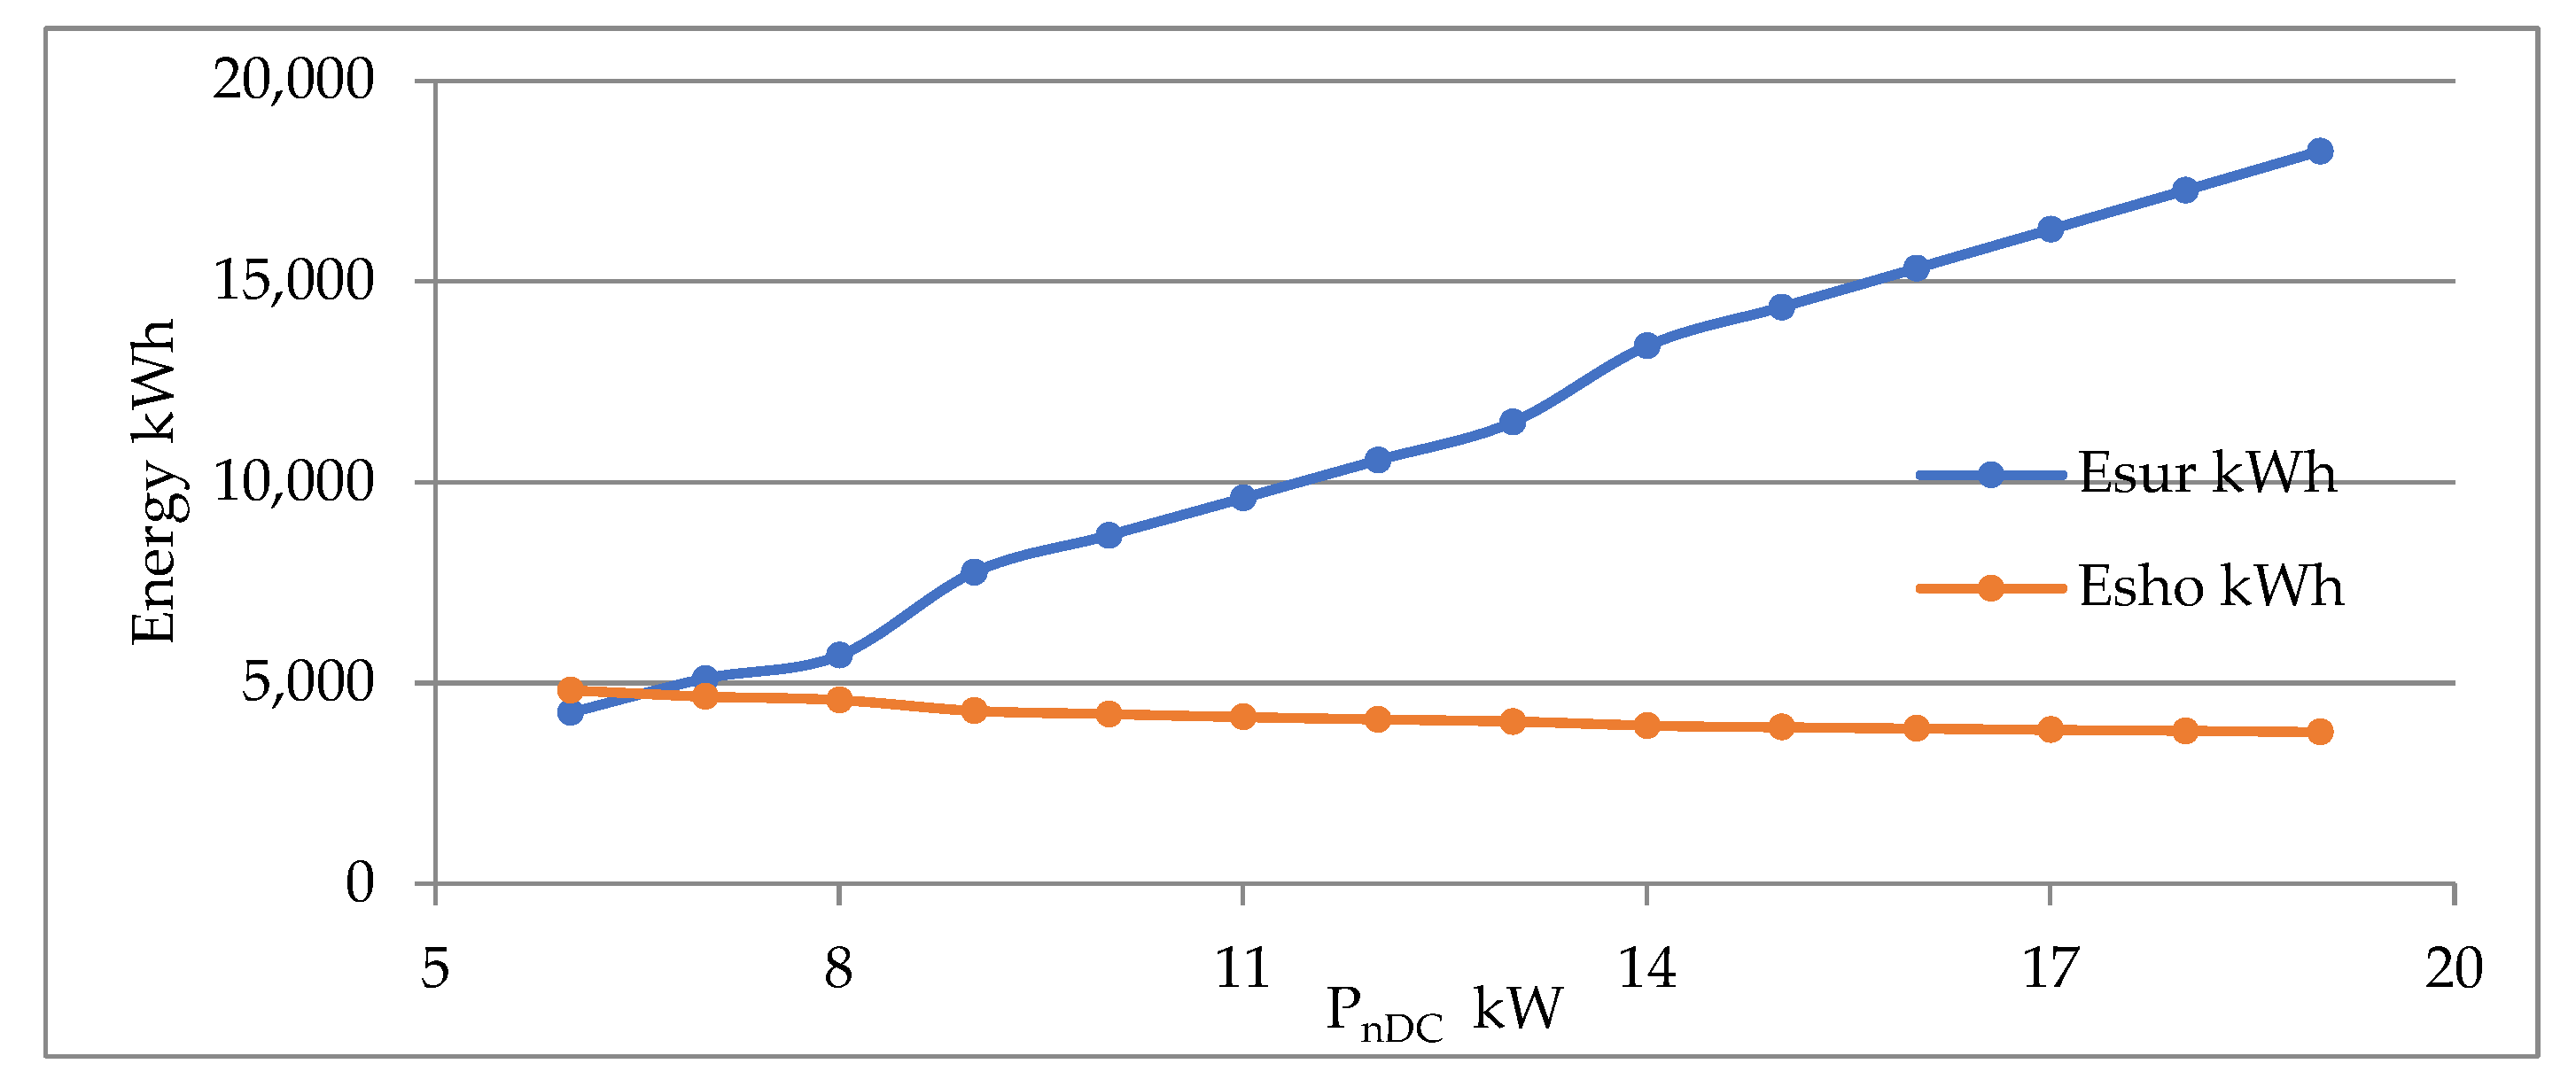
Figure 7 presents annual PV energy overproduction and energy deficit as functions of DC converter power. A threefold increase in installed PV capacity—from 6 kW to 18 kW—results in more than a fourfold increase in overproduction, while reducing the annual energy deficit by only approximately 20%. This confirms that unlimited PV capacity expansion is technically inefficient under Polish net-billing conditions.
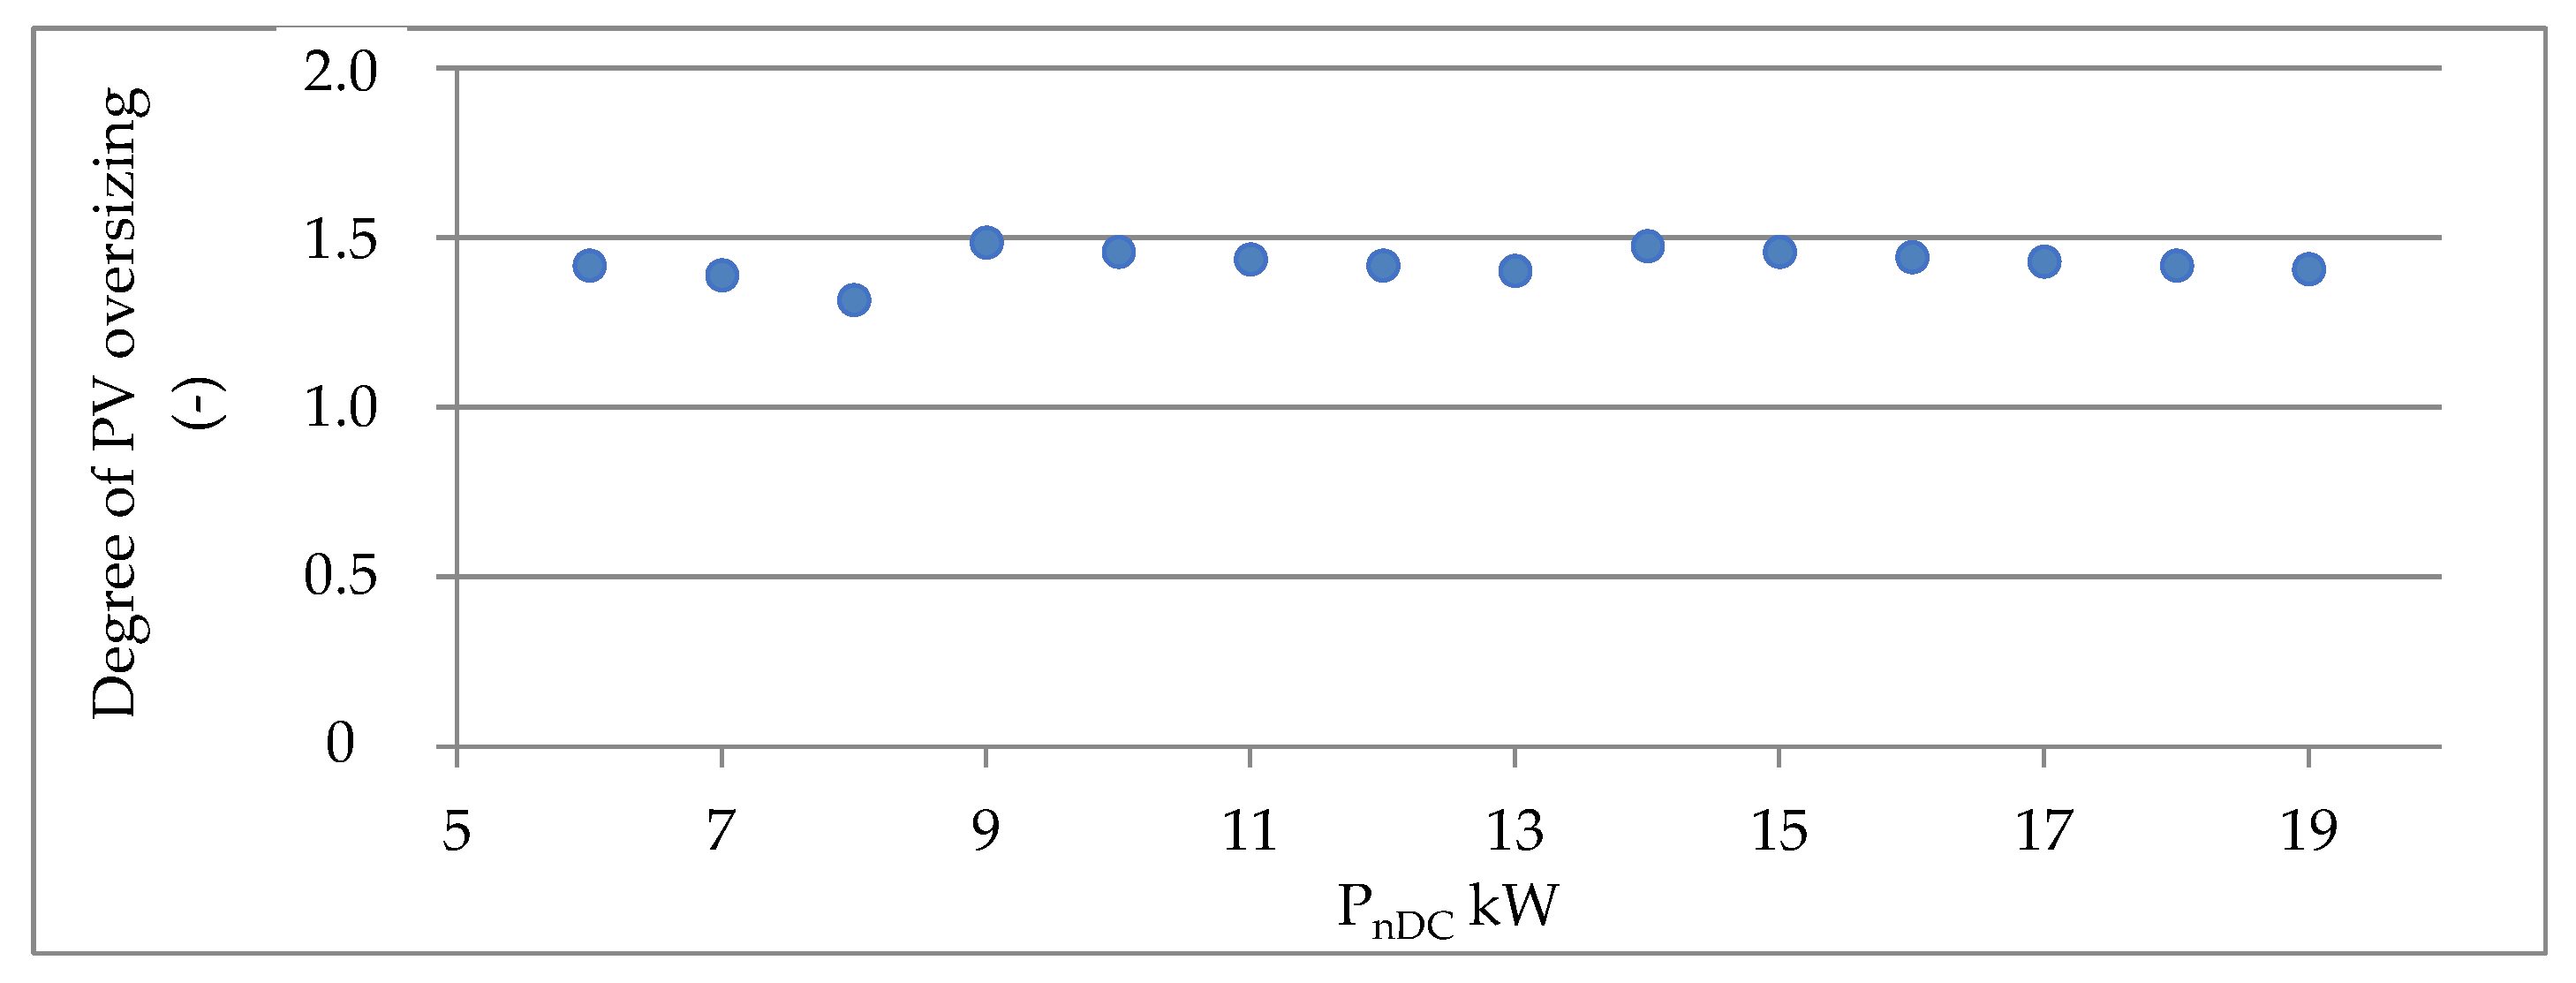
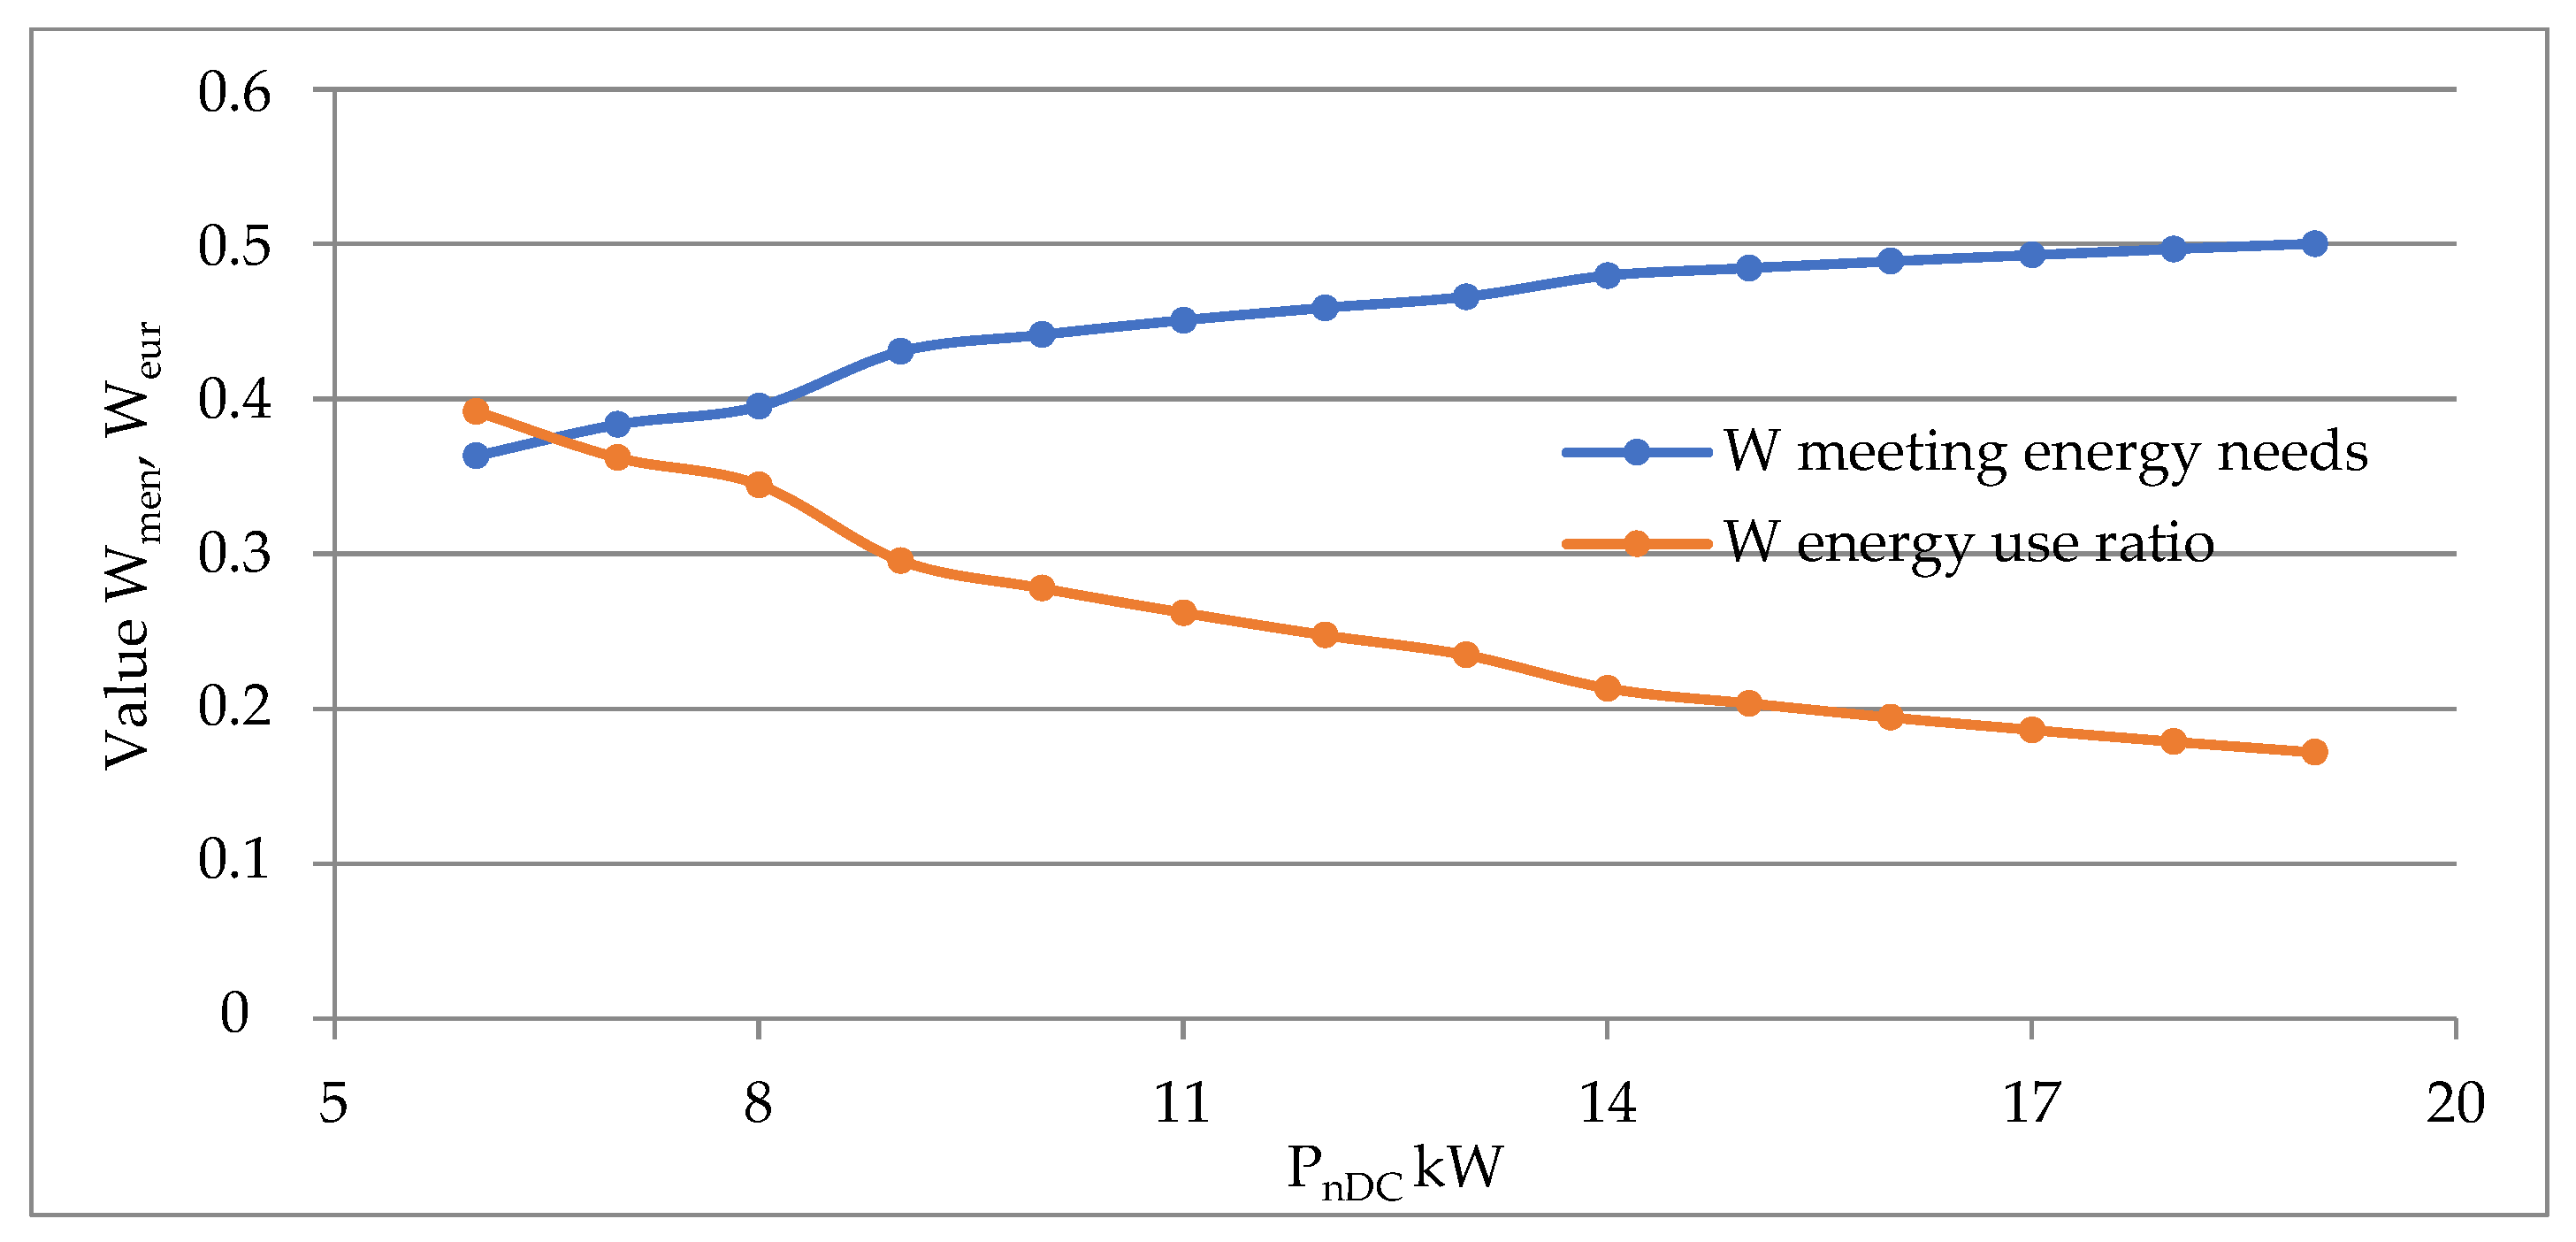
Figure 8 presents the results of the first optimization loop: the optimal PV oversizing factor relative to DC converter rated power. The rated power of the PV array should exceed the DC converter rated power by approximately 40% (ILR ≈ 1.40). Figure 9 presents the self-consumption coverage ratio (Wmen) and PV energy utilization ratio (Weur) as functions of DC converter rated power. The two indicators intersect in the 6–7 kW range. Even the largest PV installation analyzed cannot cover more than approximately 50% of the annual demand, with a PV energy utilization ratio of only 17%.

4.2. PV System with Energy Storage

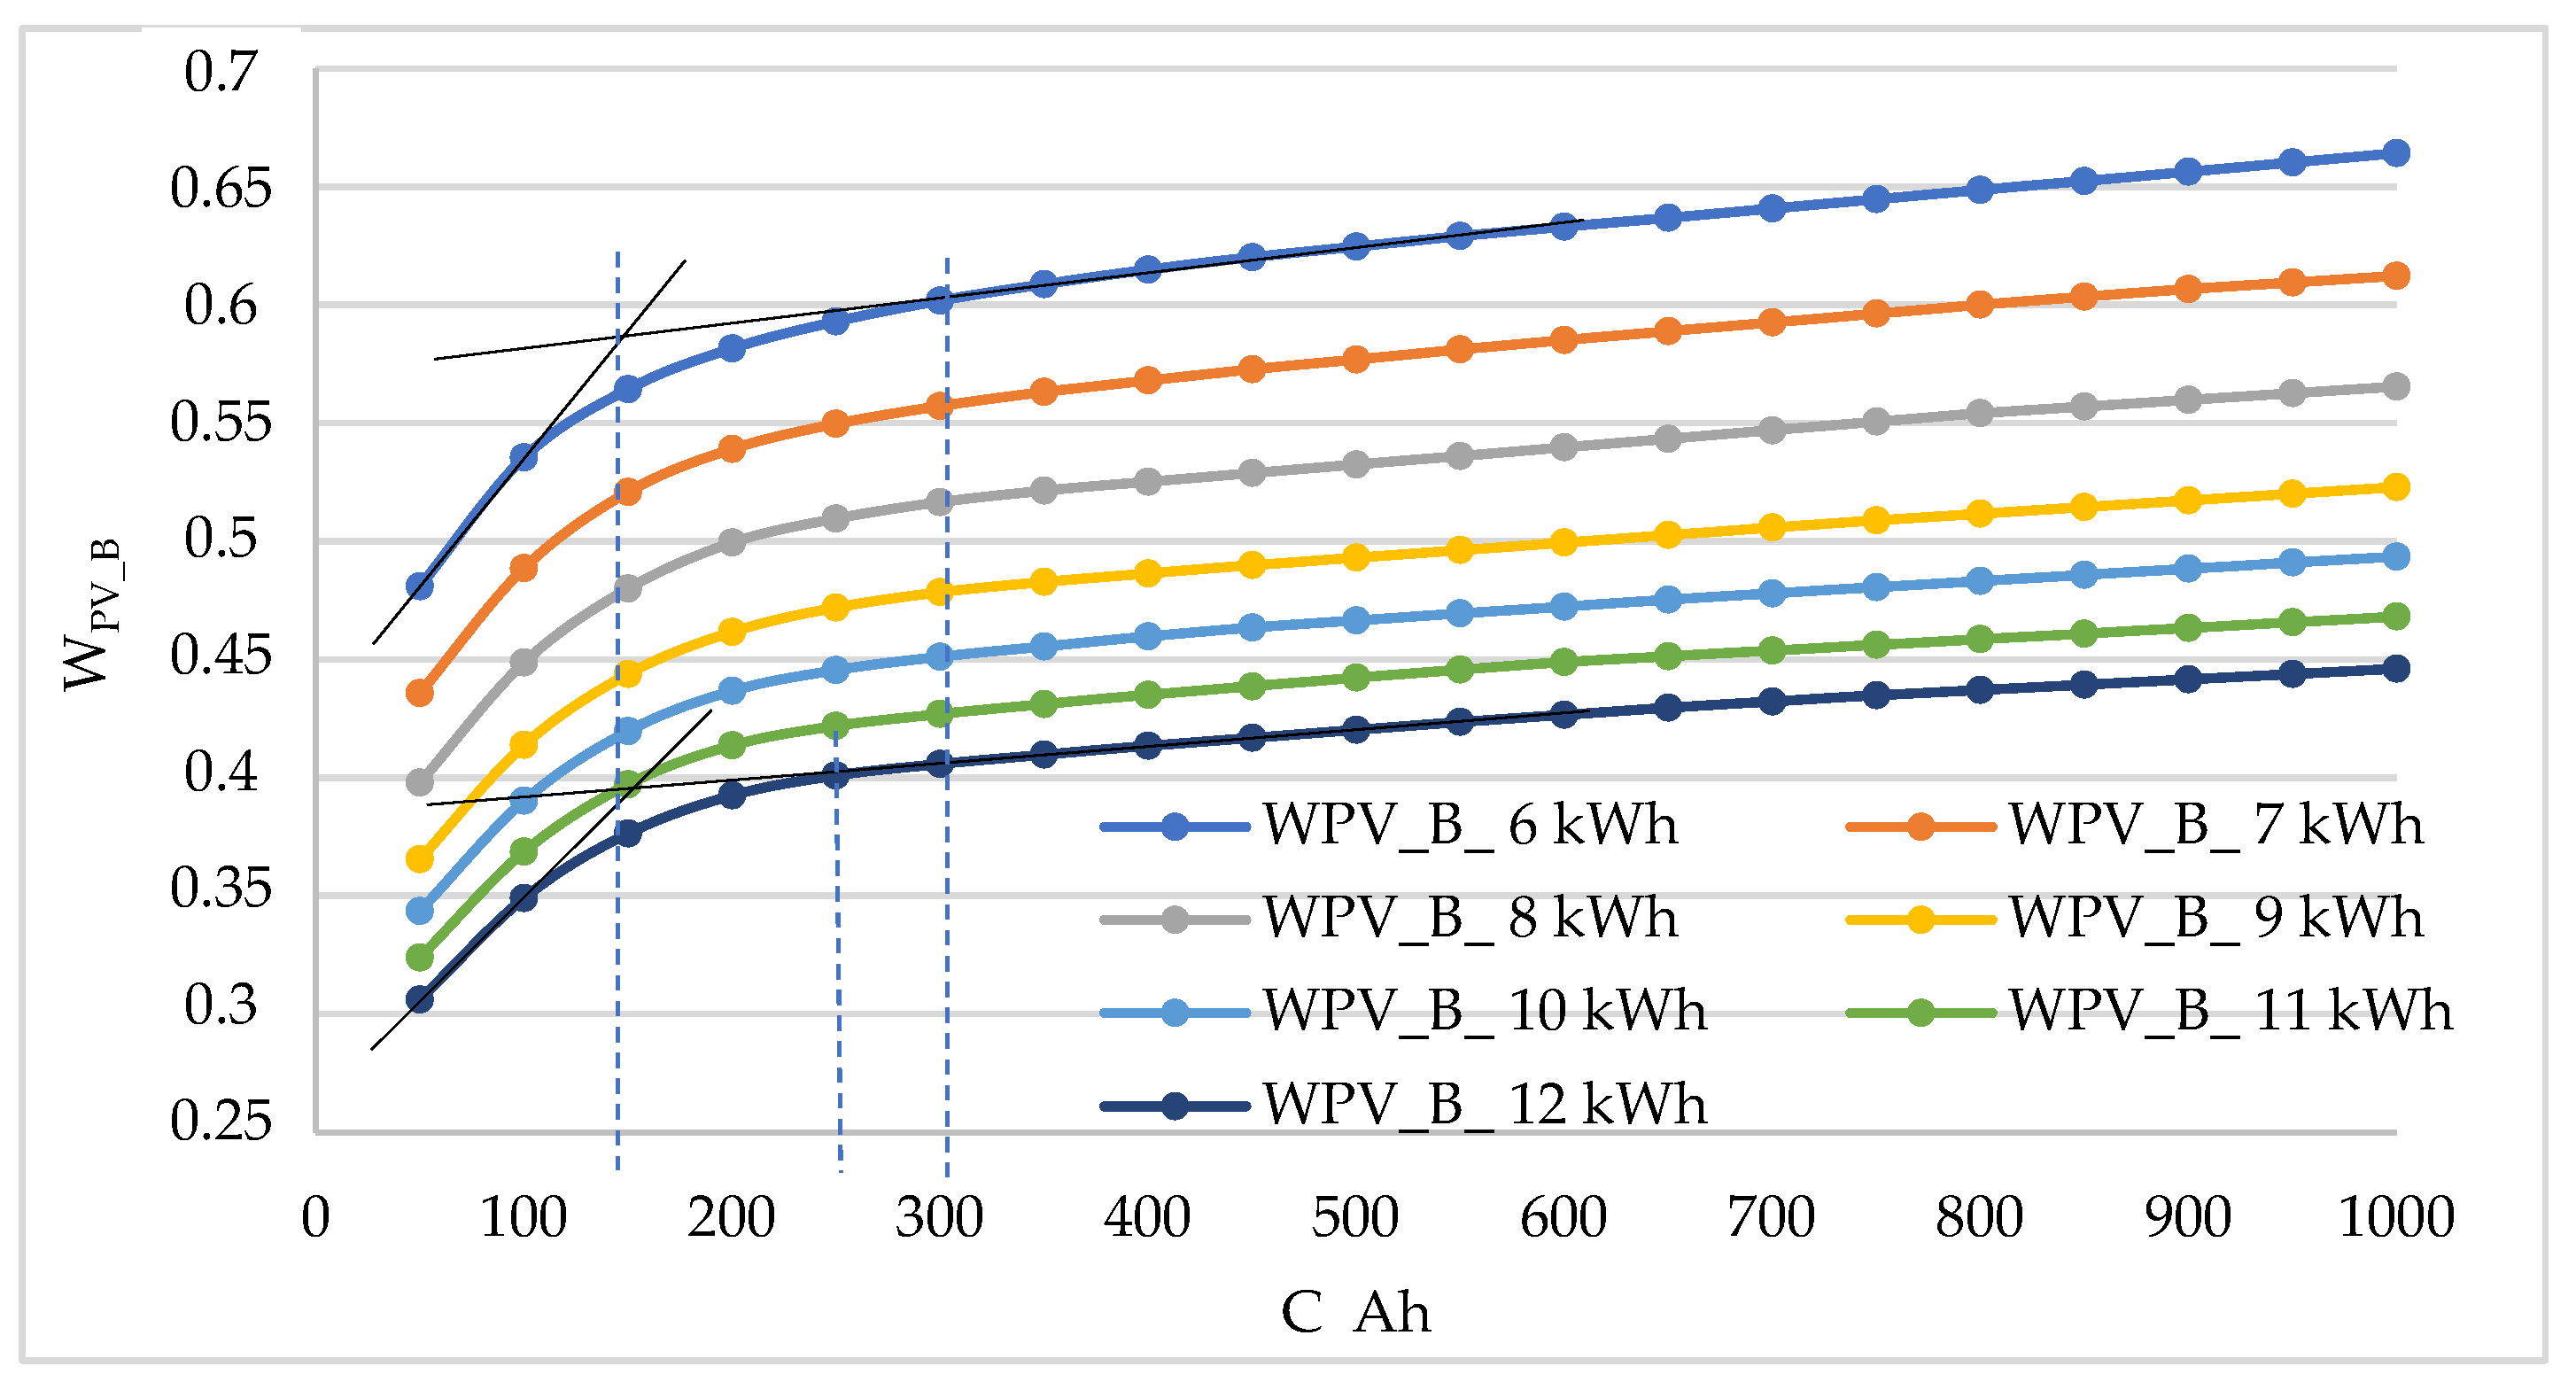
Figure 10 presents the WPV_B coefficient—the ratio of total energy utilized for production (including battery discharge) to total PV energy at maximum power point (Equation (12))—as a function of battery capacity for selected PV installation sizes (listed in Table 3). Battery operation was limited to the 20–80% state-of-charge range and operating voltage was set at 100 V. Unlike WPV_S, the WPV_B curve is monotonically increasing. Optimization relies on identification of characteristic inflection points rather than a maximum. The battery capacity simulation range was extended to 0–200 Ah (0–20 kWh at 100 V bus) with a resolution of 10 Ah (1 kWh), yielding 20 calculation points per PV installation size curve. An additional set of simulation points was computed in the 100–180 Ah range at 5 Ah resolution (1.6 kWh steps) to improve the precision of the inflection-point identification. In total, Figure 10 presents results for seven PV installation sizes (6, 7, 8, 9, 10, 12, and 14 kW DC converter ratings) and at least 20 battery capacity points per curve.
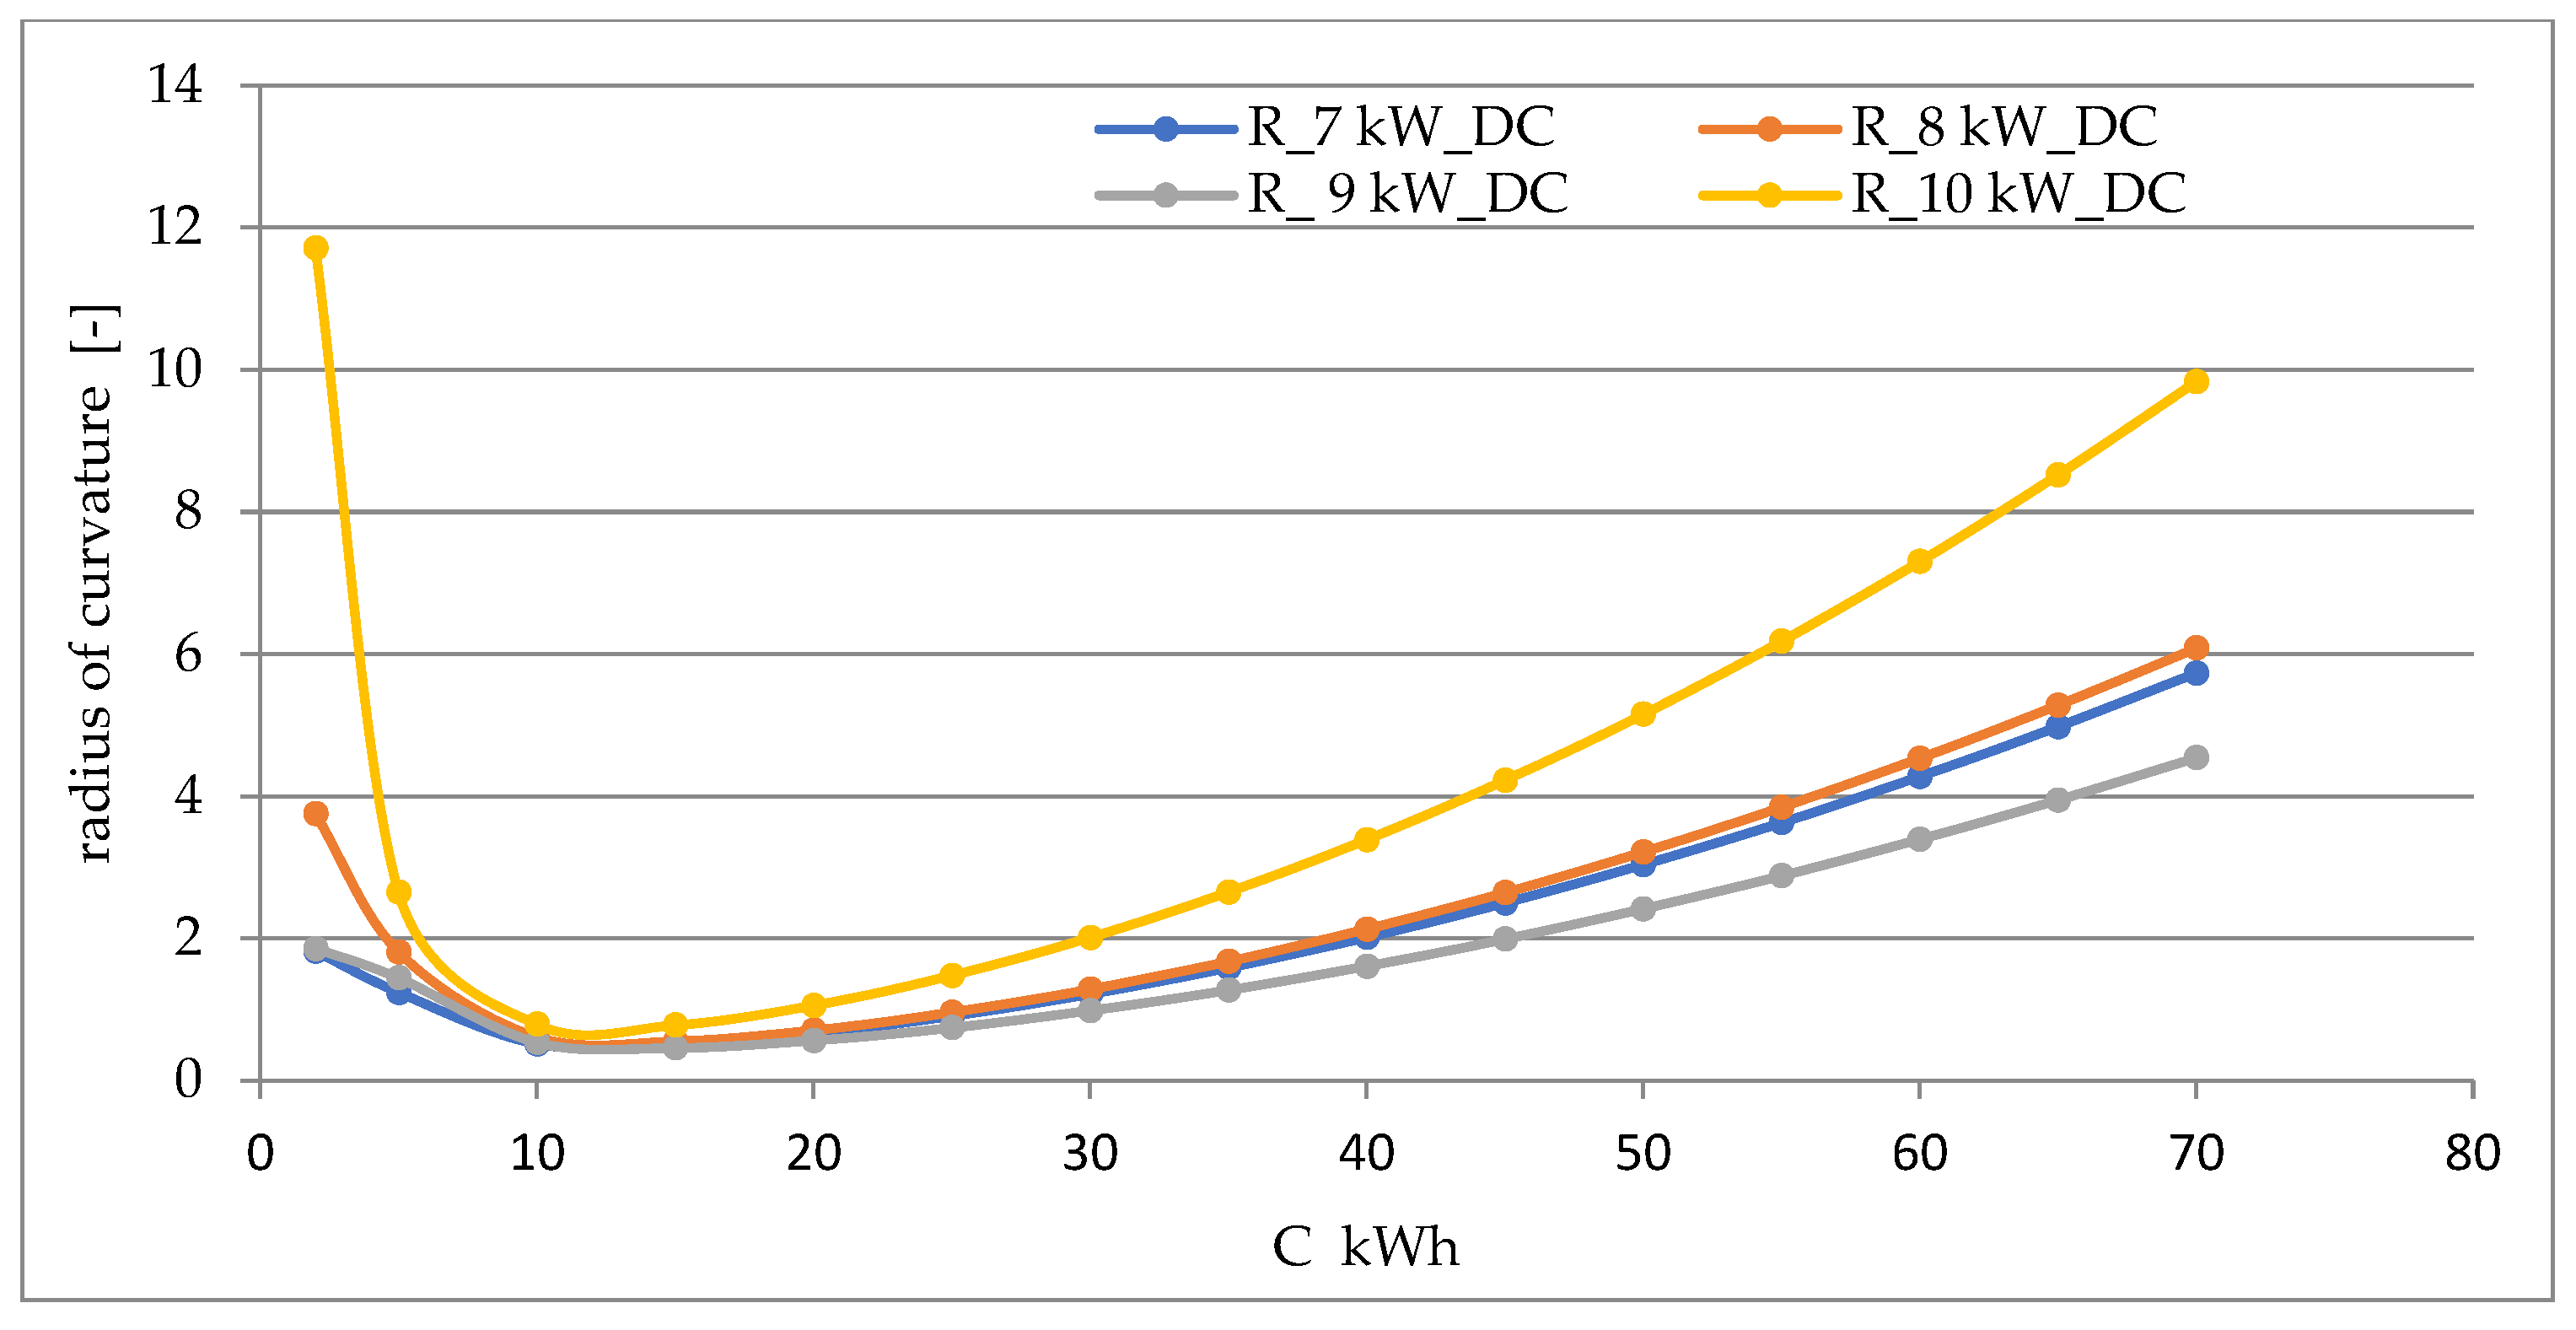
The tangent intersection method identifies an optimal battery capacity of approximately 150 Ah (15 kWh at 100 V bus). The WPV_B characteristics were fitted using nonlinear exponential estimation (Equation (14)). The coefficient of determination R2 was not lower than 0.9996 across all fitted curves. Figure 11 presents the radius of curvature of the fitted curves.
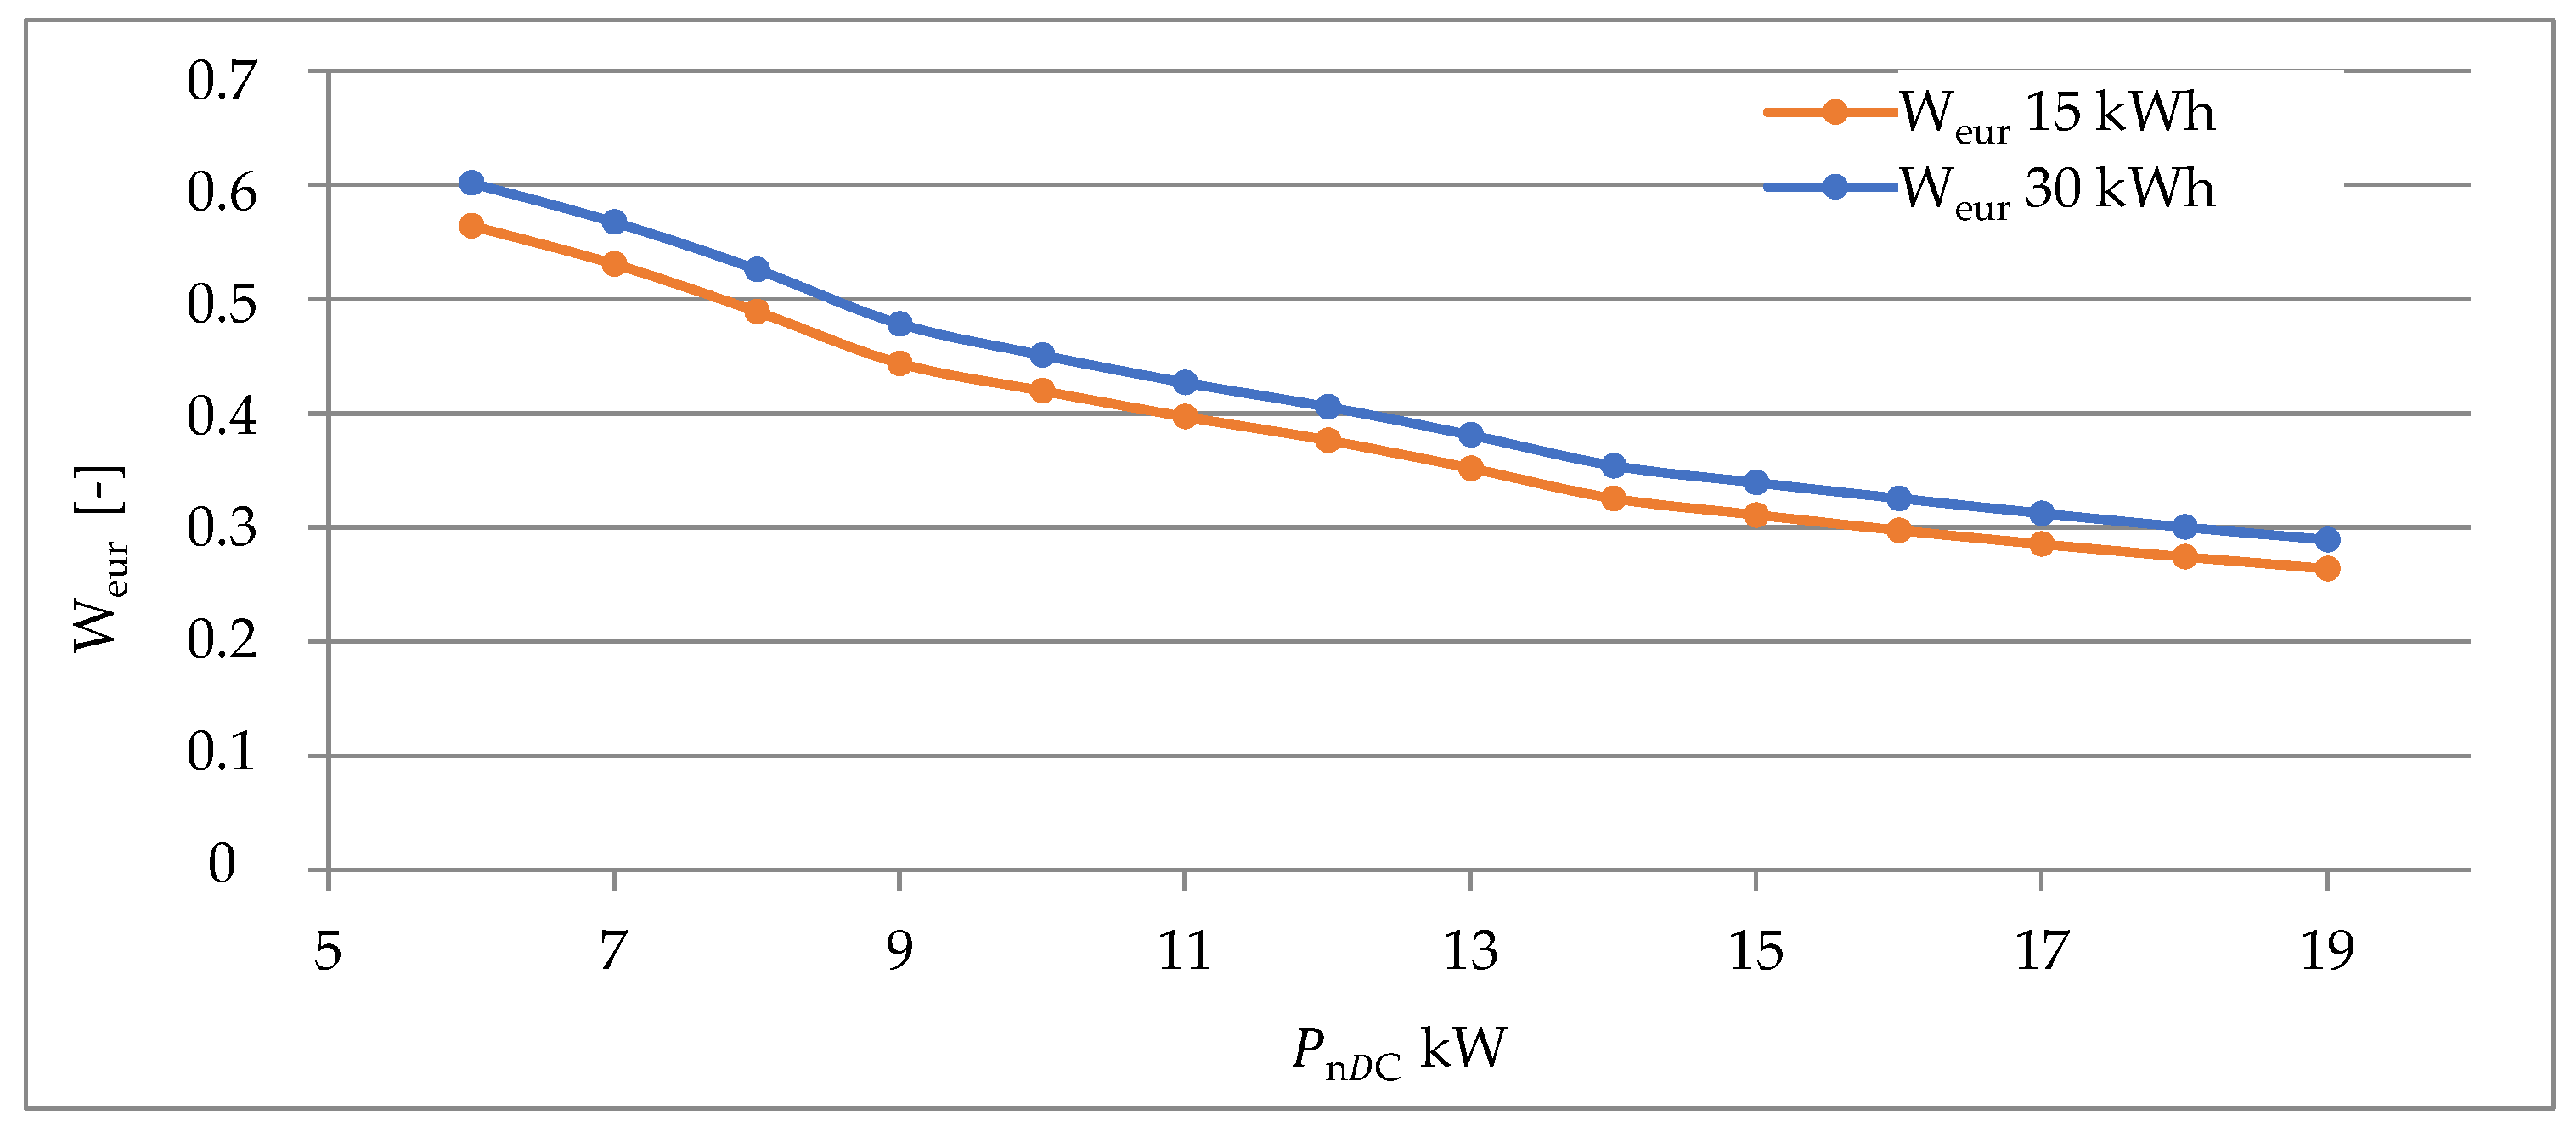
The minimum radius of curvature—corresponding to maximum curvature change—occurs at a battery capacity of 15 kWh across all analyzed installation sizes, confirming the engineering tangent intersection result. Figure 12 shows that a 100% increase in battery capacity—from 15 kWh to 30 kWh—improves the energy utilization ratio by only four percentage points, demonstrating strongly diminishing marginal returns.
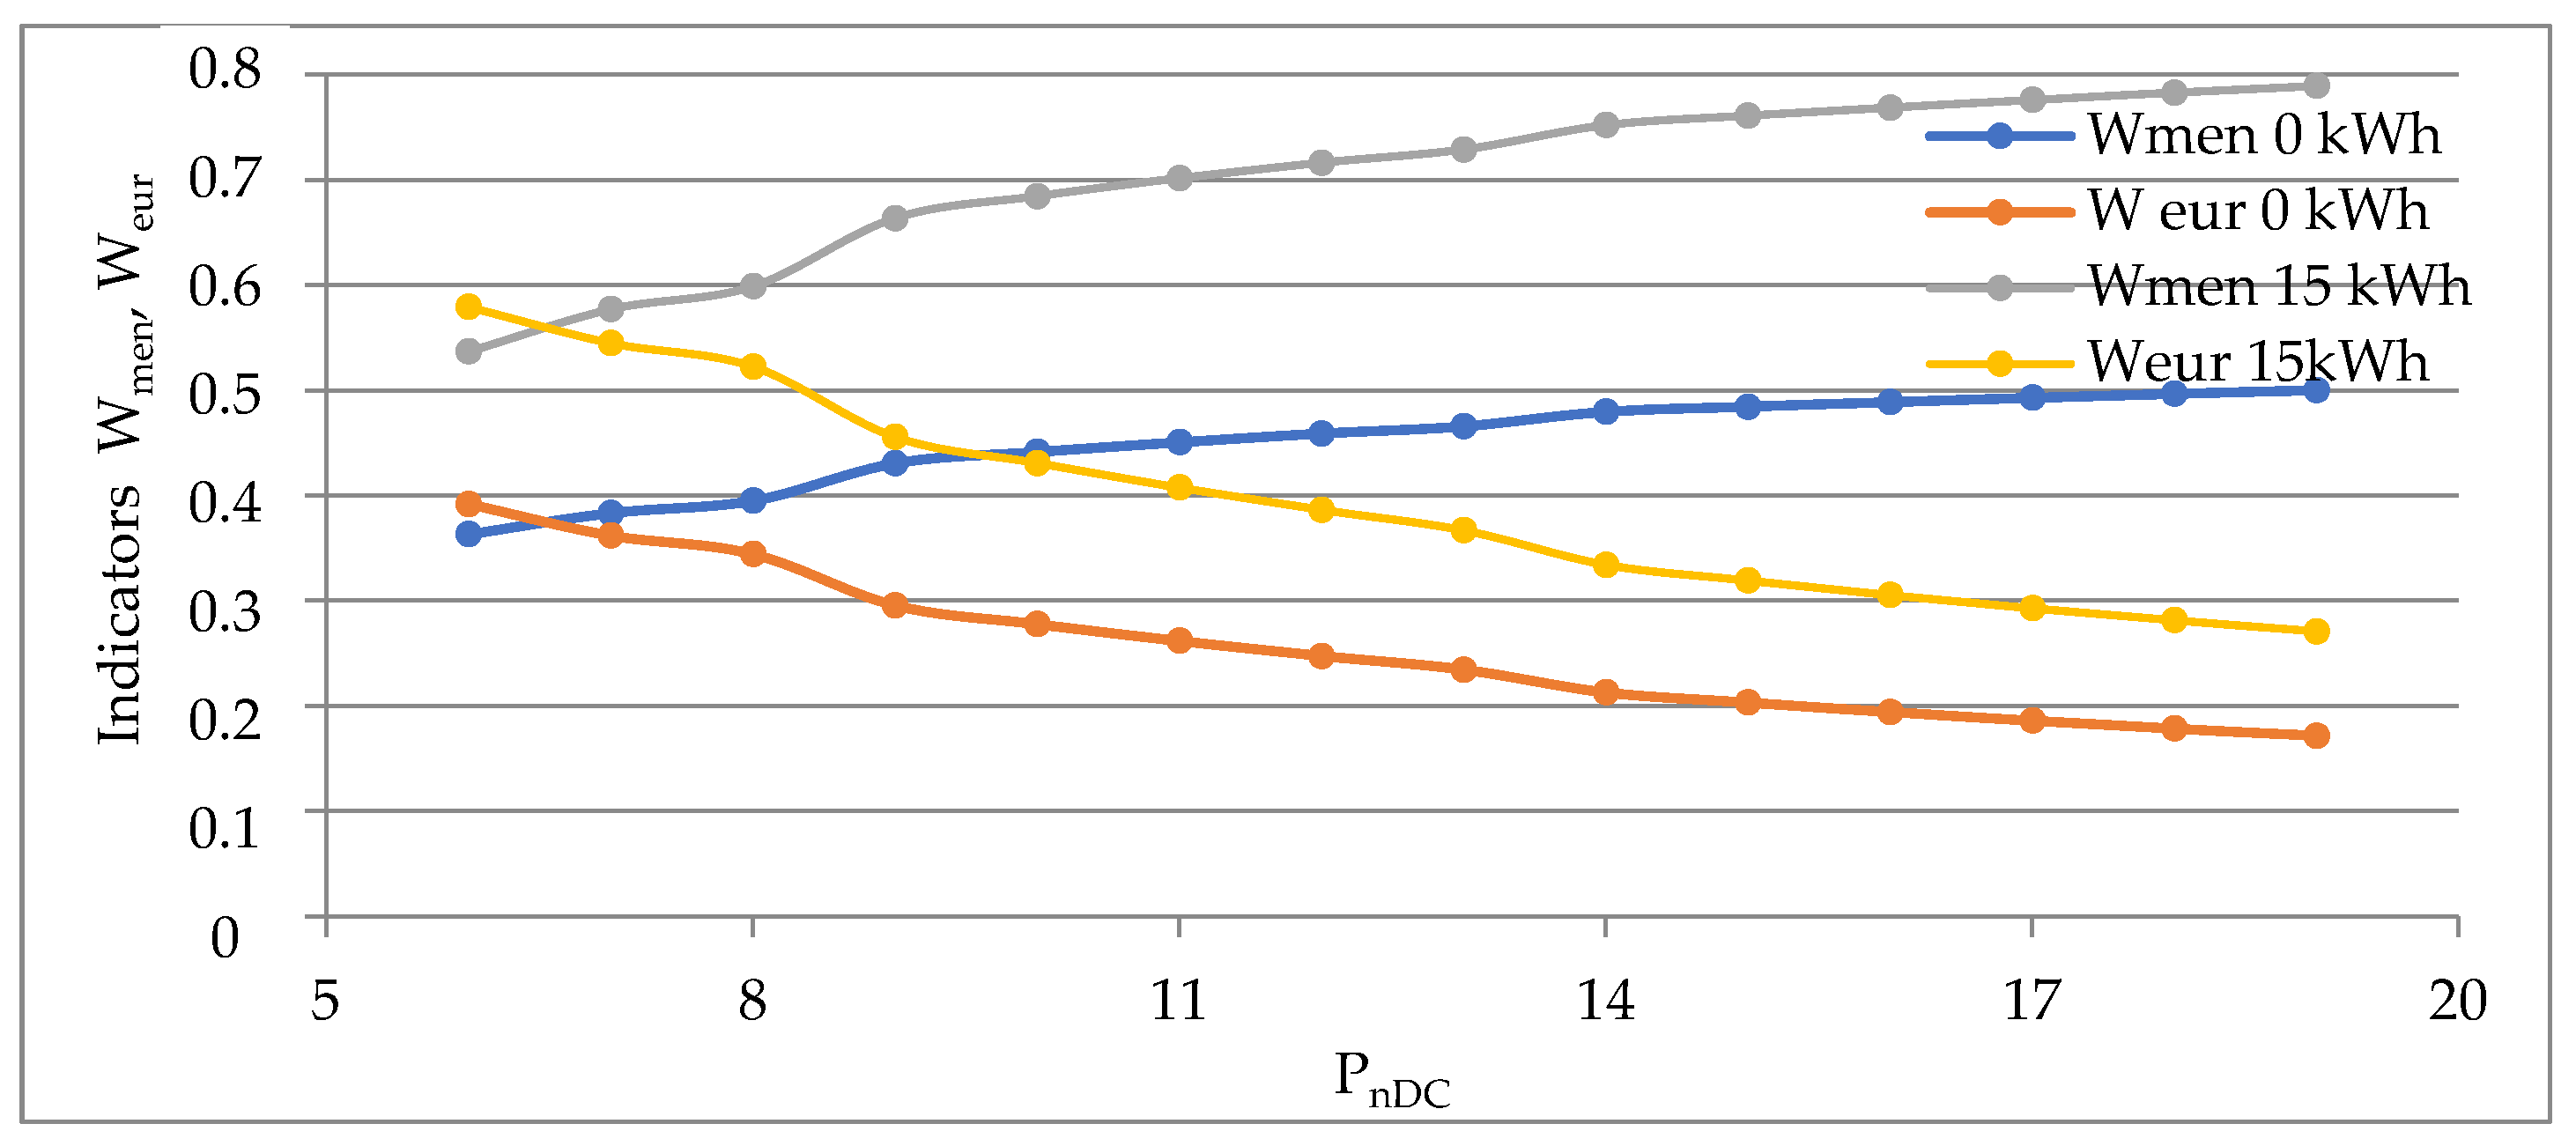
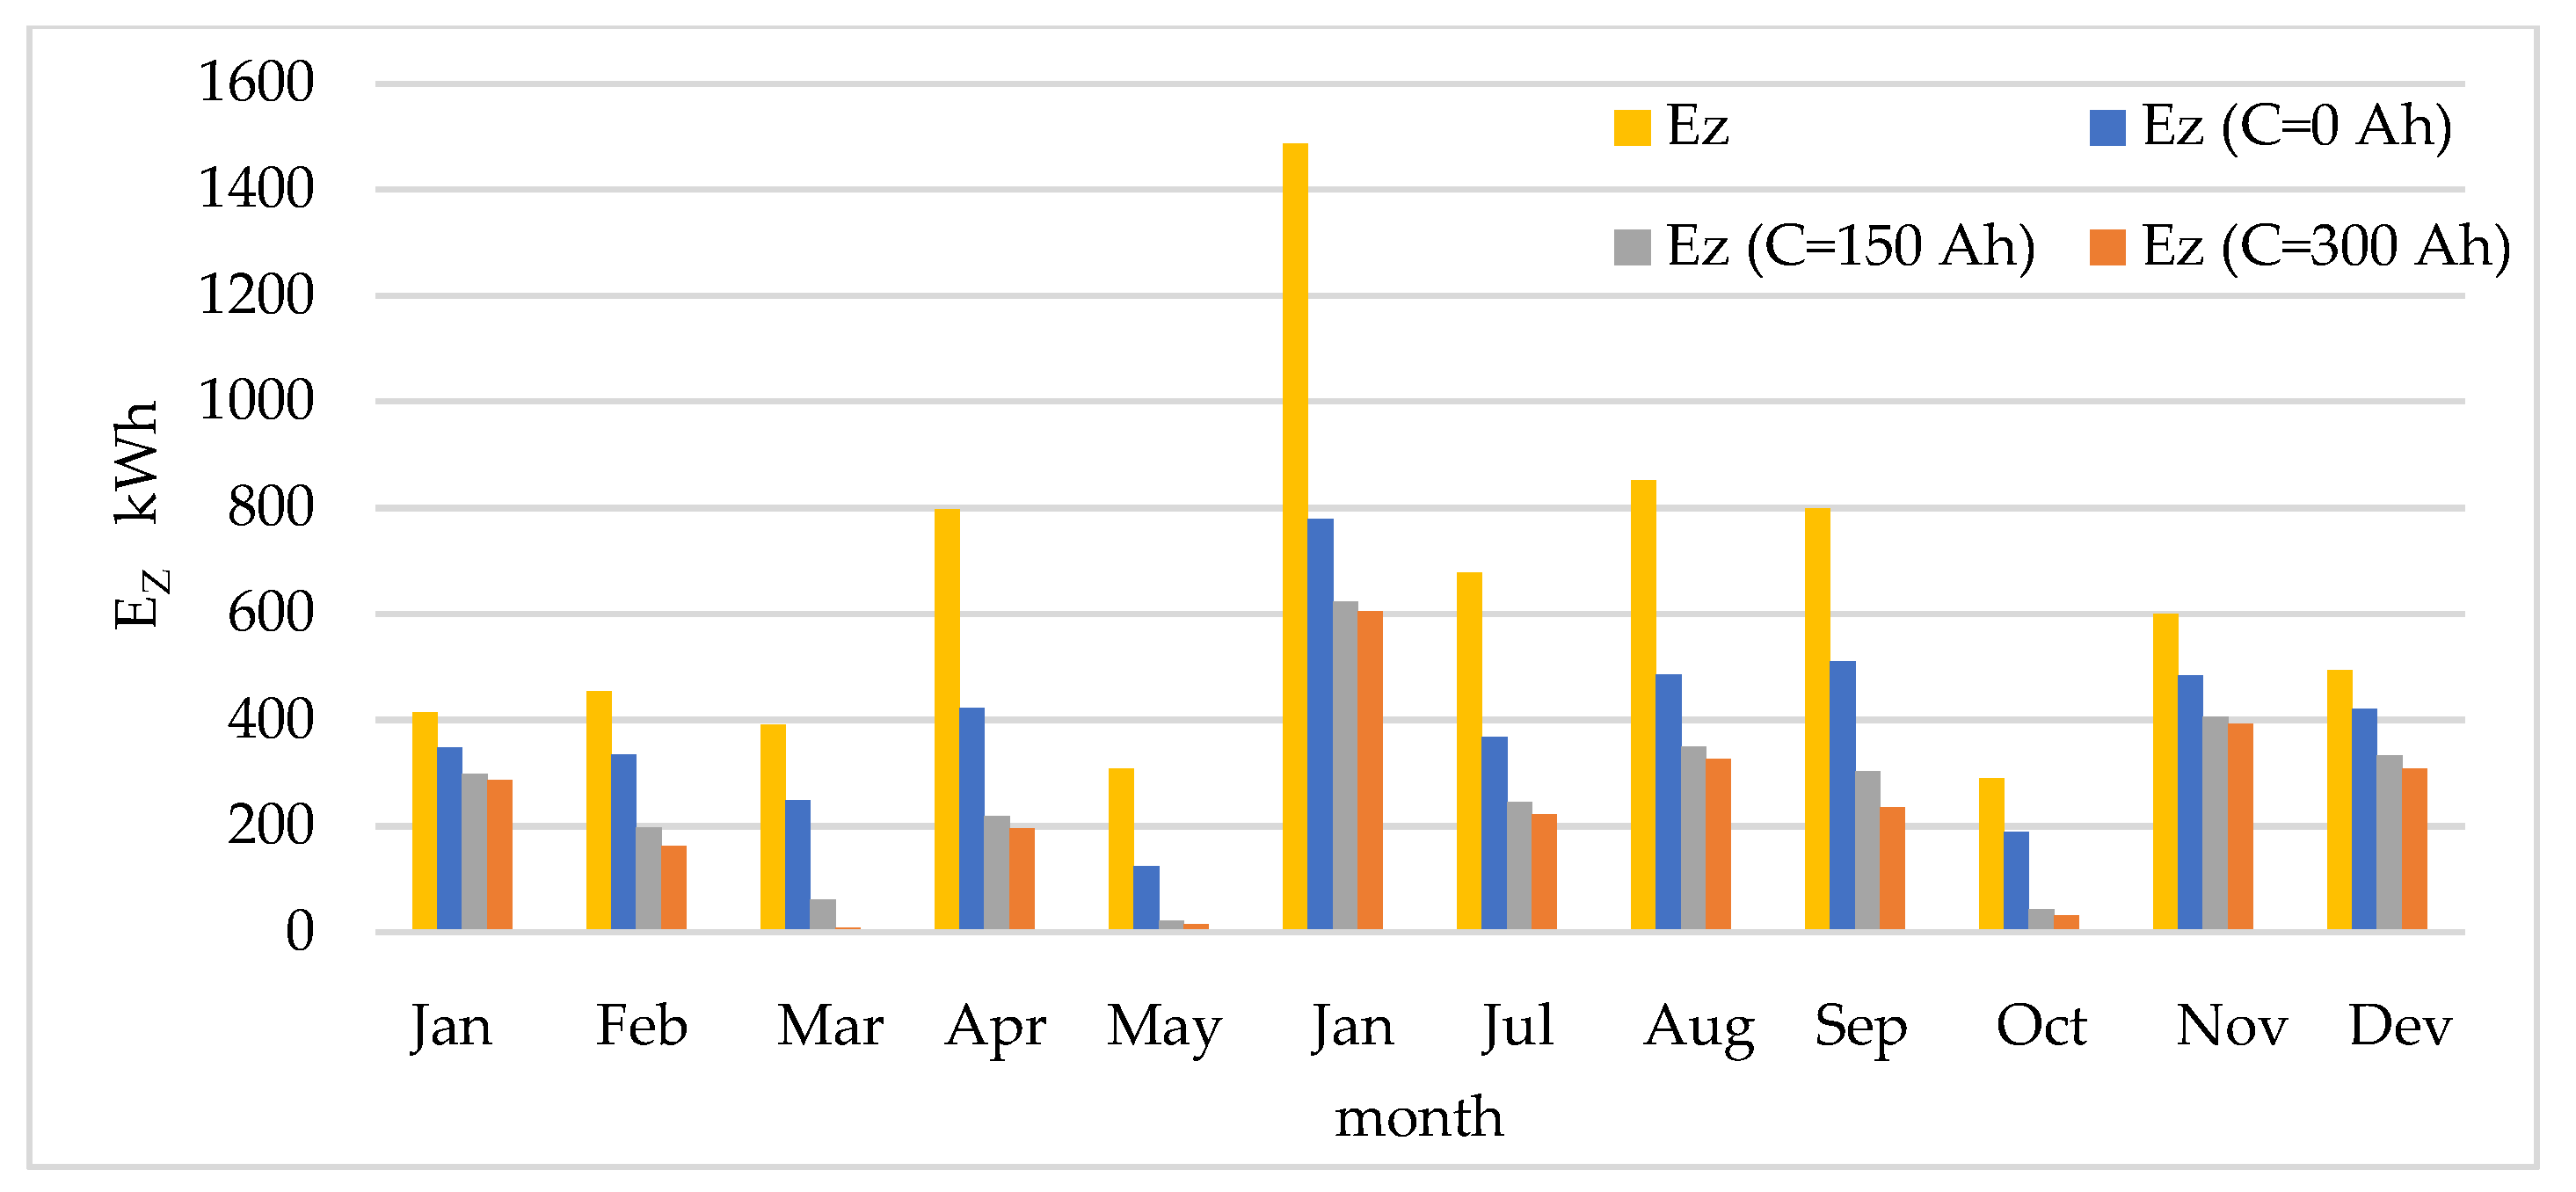
Figure 13 compares performance with and without the 15 kWh optimal storage. For a DC converter power of 7–8 kW, storage increases the self-consumption coverage ratio from approximately 0.40 to 0.60. Figure 14 presents monthly electricity demand with and without the optimized PV-BESS system. From March to October, the system reduces grid energy requirements by approximately 40%, while during November–February, its contribution is minimal.

5. Supplementary Economic Analysis

The primary contribution of this study is the technically optimal PV-BESS configuration identified through the two-loop methodology described in Section 2. By design, the proposed optimization is independent of electricity prices, subsidy levels, and discount rates—a deliberate methodological choice that ensures the results remain valid across different regulatory regimes and remain reproducible without economic parameter assumptions. This approach is novel in the PV-BESS optimization literature, where economic criteria typically dominate the objective function [31,32,33]. Nevertheless, to assist practitioners in assessing investment viability and to respond to the practical needs of poultry farm operators, this section presents a supplementary techno-economic analysis of the identified optimal configuration (PnDC = 7 kW, Pp = 9.7 kWp, C = 15 kWh BESS).
It is explicitly noted that the economic analysis does not alter the technically optimal configuration—it demonstrates the economic implications of implementing that configuration under current Polish market conditions.

5.1. Capital Cost Structure

The capital expenditure (CAPEX) structure for the optimal PV–BESS configuration was estimated under three scenarios: (I) budget, (II) premium, and (III) average. The detailed cost breakdown of individual components is presented in Table 4.
The analysis assumes photovoltaic modules (polycrystalline, 405 Wp), a 7 kW-rated DC/DC converter, and a LiFePO4 battery system with a total capacity of 15 kWh. Installation, wiring, protection equipment, and system commissioning costs were estimated at 18% of equipment costs, in accordance with Polish benchmarks for PV installations in the agricultural sector [42,43].

5.2. Annual Savings and Simple Payback Period

Annual economic savings are calculated as the monetary value of grid electricity displaced by on-site PV-BESS generation. The electricity purchase price for Polish agricultural small and medium enterprises was 0.90 PLN/kWh in 2025, inclusive of distribution tariff components. Under the net-billing regime, surplus PV energy fed to the grid is credited at the day-ahead market price, which is significantly lower than the purchase price. This asymmetry further justifies the self-consumption orientation of the technical optimization.
With the optimal configuration Wmen = 59%, 4484 kWh/year of electricity demand is covered by on-site generation, yielding annual gross savings of 4036 PLN/year. Annual operation and maintenance costs are estimated at 1% of CAPEX. Because the equipment market exhibits high price volatility based on brand tier and component origin, the system economics were evaluated across three CAPEX scenarios: budget class (31,130 PLN), average market (45,285 PLN), and mid-range class (59,440 PLN).
Depending on the chosen hardware tier, the net annual savings range from 3442 PLN to 3725 PLN/year. The simple payback period (SPB) for the full system spans a remarkably wide interval:
  • 8.4 years in the budget-class scenario.
  • 12.6 years under average market conditions.
  • 17.3 years in the mid-range class scenario.
For comparison, the PV-only subsystem (without BESS) achieves an SPB of 8.4, 11.5, and 14.9 years across the three respective scenarios. Consequently, the incremental investment in the 15 kWh battery yields an incremental payback of 8.3 years for budget components, extending to nearly 22 years for mid-range components. This critical finding demonstrates that while the technical optimum is fixed (15 kWh), the economic viability of the battery component currently depends almost entirely on the investor’s hardware selection and risk appetite regarding budget-tier brands.

5.3. Economic Sensitivity Analysis

The economic analysis was limited to the simulation of selected indicators over an electricity price range of 0.7–1.2 PLN/kWh, taking into account three installation cost scenarios. The results of the sensitivity analysis of the simple payback period (SPB) with respect to electricity price for the three hardware scenarios of the complete PV-BESS system are presented in Table 5.
The results of the presented analysis indicate that the investment costs incurred for the technically optimal PV installation will be recovered within a period not exceeding approximately 8 years for the budget-class configuration and 17 years for the premium configuration, assuming the current electricity price level. Considering the global upward trend in electricity prices, this period may be reduced to approximately 6 years and 12 years, respectively, if the electricity price reaches 1.2 PLN/kWh.

6. Discussion

6.1. DC Architecture Efficiency and Optimal ILR

The optimal PV array oversizing relative to the DC converter rated power of approximately 40% (ILR ≈ 1.39–1.42) is consistent with the upper portion of the range reported for AC-connected PV systems (1.0–2.4, Table 1). The physical mechanism is the same in both AC and DC architectures: the trade-off between clipping losses under high irradiance and converter underutilization losses under low irradiance. Similar findings were reported by [42,43], who identified that oversizing PV modules by 30–50% relative to converter power allows better utilization of available solar radiation under variable operating conditions. A key distinction of the present methodology is that the WPV_S index explicitly incorporates the load-dependent efficiency profile of the DC/DC converter (Equation (4)), which exhibits pronounced non-linearity at loading factors below 0.1—a condition occurring frequently under low irradiance.

6.2. Self-Consumption and Energy Utilization Without Storage

For the PV system without storage, even at maximum investigated converter power (19 kW), self-consumption coverage does not exceed approximately 50%, with a PV energy utilization ratio of only 17%. These values are consistent with findings of [44], who demonstrated that in commercial prosumer systems without storage, self-consumed PV energy rarely exceeds 50–60% for profiles with significant intraday and seasonal variability. The rapid divergence between overproduction and deficit curves (Figure 7)—where threefold PV capacity increase causes fourfold increase in overproduction but only 20% deficit reduction—directly reflects the poor temporal alignment between PV generation and facility demand in autumn–winter months.

6.3. BESS Integration: Optimal Sizing and Diminishing Returns

The presented methodology for the technical optimization of the PV system design is complementary to the results of the simplified economic analysis. At the same time, it provides a foundation for more advanced economic evaluation methods, including forecasting approaches. However, the economic optimality of this capacity is strongly dependent on both the equipment price level and electricity prices. In the budget-class cost scenario, the technical optimization aligns perfectly with the financial rationale, delivering an additional battery system payback period of only 8.3 years—well within the expected cycle life of LiFePO4 batteries. In contrast, for mid-range equipment, the incremental storage payback exceeds 21 years, shifting the purely economic optimum toward a PV-only configuration, unless subsidies are applied. This gap between the technical optimum and the financial boundary quantitatively captures the trade-off that farm operators must navigate, balancing system reliability and the longevity of premium hardware against investment profitability.

6.4. Implications of Non-Normal Load Distributions for Optimization Robustness

The extreme departure from normality observed in the peak ventilation section’s power demand distribution (kurtosis > 1100, skewness > 32 in winter months) poses a specific challenge for energy system optimization. The arithmetic mean of hourly power demand systematically underestimates both the frequency and magnitude of short-duration peak demand events. In the context of BESS sizing, this implies that a battery capacity optimized exclusively on the basis of mean hourly profiles may fail to capture the full energetic benefit of storage during periods of high peak-fan activation. This non-normality is not a statistical artifact but a direct consequence of the broiler ventilation control architecture: the microclimate controller activates peak fans in a discrete on/off manner based on age-dependent temperature thresholds. In winter, the threshold is rarely exceeded, resulting in a near-zero mean for the peak section but a non-zero probability of full-load activation during unusually warm winter days or when CO2 accumulates rapidly in younger flocks. The present methodology partially mitigates this by using one-minute-resolution data before downsampling. However, the sensitivity of the optimal battery capacity to data temporal resolution remains a subject for future investigation.

6.5. Seasonal Performance and Practical Implications

The seasonal analysis (Figure 14) reveals that from March to October, the optimized system reduces monthly grid energy demand by approximately 40%, while in November–February, the system’s contribution is minimal. This seasonal asymmetry is consistent with Polish PV performance data reported in [45,46,47]. For farm operators and PV system designers, the results provide three actionable guidelines: (i) a PV array oversizing of 40% relative to DC converter rated power (ILR ≈ 1.39–1.42) represents the technically optimal starting configuration; (ii) 15 kWh of battery storage doubles the practical value of the PV installation; (iii) the PV-BESS system should be considered a seasonal supply supplement rather than a primary energy source—winter requirements will continue to be met predominantly from the grid.

7. Limitations

While the proposed methodology demonstrates strong potential, several limitations should be acknowledged:
  • Single-case validation. The methodology was validated for one broiler production building in Mazowieckie Province. It is explicitly noted that all data presented in this article—including electricity consumption, load statistics, and optimization results—pertain to a single building of 2900 m2 floor area and do not represent aggregated farm-level data. Generalizability to other poultry species (layers, turkeys, ducks), alternative housing systems, multi-building configurations, or other climatic regions of Poland and Europe requires further investigation. Future studies should validate the proposed methodology across at least two to three additional buildings with contrasting load profiles and climatic exposures.
  • The battery efficiency model proposed by Su et al. [40] was parameterized at a reference temperature of 25 °C. In agricultural environments, energy storage systems may be exposed to seasonal ambient temperatures ranging from approximately −15 °C to +40 °C, which can significantly affect round-trip efficiency by approximately ±5% relative change per 10 °C deviation from the reference temperature for LiFePO4 chemistry. Furthermore, considering the findings of Saez-de-Ibarra et et al. [19] and Alipour et al. [41], who demonstrated that an increase in temperature of 10 °C above 25 °C may reduce battery lifetime by up to 50%, the present study assumes that, given the relatively small battery capacity, it is preferable to maintain appropriate operating conditions rather than allow for a significant reduction in service life. It should also be noted that battery costs constitute a significant share of the total investment cost of a PV–BESS installation.
  • Temporal data resolution mismatch. Downsampling Class A (1 min) consumption data to Class C (60 min) may mask sub-hourly peak demand events that influence optimal BESS sizing, particularly for the highly leptokurtic peak-section distribution.
  • Absence of grid interaction modeling. The study assumes that surplus PV energy cannot be economically sold to the grid (post-net-billing Polish context). Under net-metering regulations or feed-in tariff regimes, the optimal configuration may differ.
  • The supplementary economic analysis presented in Section 5 was based on Polish market prices applicable in 2025 and assumed a fixed annual electricity price escalation rate. The analysis showed that the technically optimal configuration is consistent with the economic viability assessment under realistic scenarios. However, it does not constitute a full lifecycle cost analysis or an investment appraisal based on forecasts not only of electricity prices, but also of energy yield from the PV plant and the process energy demand. For site-specific investment decisions, it is recommended to conduct a comprehensive economic optimization incorporating time-of-use tariffs, battery degradation curves, and tax considerations.
  • The technical optimization did not account for the degradation of photovoltaic panels, as this is a method for selecting solar system components. The study did not forecast changes in energy consumption or production over time, as this was not the objective of the research. Therefore, only simple indicators of the investment’s profitability at the time of its implementation were determined.

8. Conclusions

This study presented and validated a novel two-loop iterative methodology for the purely technical optimization of DC-coupled photovoltaic systems with integrated battery energy storage, applied to a commercial broiler production facility (annual demand: 7.6 MWh, CV: 53%). The following conclusions are drawn:
  • The proposed two-loop optimization algorithm—based on iterative maximization of WPV_S (Loop 1) and radius-of-curvature minimization of the WPV_B characteristic (Loop 2)—provides a computationally efficient, technically rigorous method for sizing DC PV-BESS systems without recourse to economic parameters or meta-heuristic algorithms.
  • For the analyzed broiler production facility, the optimal DC PV-BESS configuration consists of a 9.7 kWp PV array, a 7 kW DC/DC converter, and a 15 kWh BESS—corresponding to ILR ≈ 1.39 (40% oversizing), derived through a DC-specific methodology based on real operational data.
  • The integration of the optimally sized 15 kWh BESS increased Wmen from 38% to 59% and Weur from 35% to 54%—a relative improvement of approximately 55% in both indicators—confirming the effectiveness of the proposed sizing methodology under Polish net-billing conditions.
  • Beyond 30 kWh BESS capacity, the incremental improvement in PV energy utilization decreases to less than 4% per doubling of storage capacity, providing a technically grounded upper boundary for BESS sizing that is independent of electricity prices.
  • The extreme non-normality of the peak ventilation load profile (kurtosis > 1100 in winter) raises important methodological questions regarding mean-based energy balance calculations for BESS sizing. Future work should investigate temporal resolution sensitivity, temperature-dependent battery efficiency, PV degradation effects, and full techno-economic analysis.
  • The supplementary economic analysis showed that the PV system selected solely on the basis of technical criteria, with parameters of Pp = 9.7 kWp, PnDC = 7 kW, and storage capacity C = 15 kWh, achieves a simple payback period ranging from 8 to 18 years, depending on the selected pricing variant. Considering that the expected operational lifetime of the installation is 25 years, even the replacement of batteries after 6000 cycles provides satisfactory results and the prospect of generating a financial surplus for the renewal of such an installation.

Author Contributions

Conceptualization, J.K.; data curation, K.N. and J.K.; investigation, K.N., T.S. and J.K.; methodology, K.N. and J.K.; project administration, T.S., K.N. and J.K.; supervision, K.N., T.S. and J.K.; writing—original draft preparation, K.N., T.S. and J.K.; writing—review and editing, K.N., T.S. and J.K. All authors have read and agreed to the published version of the manuscript.

Funding

This research was funded by the Ministry of Science and Higher Education of the Republic of Poland and the University of Agriculture in Kraków.

Data Availability Statement

The data presented in this study are available on request from the corresponding author.

Conflicts of Interest

The authors declare no conflicts of interest.

Abbreviations

The following abbreviations are used in this manuscript:
SymbolDefinition
PMPP(DC)Power output from PV installation at maximum power point (kW)
nNumber of panels
APanel active area (m2)
GPOAPlane-of-array solar irradiance (W·m−2)
ηPV(T)PV module efficiency corrected for temperature and irradiance
ηPVPV module efficiency at reference temperature (25 °C)
βTTemperature coefficient of efficiency (°C−1)
TPVOperating temperature of PV module (°C)
TaAmbient temperature (°C)
NOCTNominal operating cell temperature
kDC/DCLoading factor of DC/DC converter relative to rated power
PnDCRated power of DC converter (kW)
PDCPower at DC converter output (kW)
PZInstantaneous power demand for production (kW)
PsurSurplus power at converter output (W)
PshoPower deficit to meet production demand (kW)
WPV_SPV-to-converter matching coefficient
WPV_BPV-to-BESS system matching coefficient
WmenSelf-consumption coverage ratio
WeurPV energy utilization ratio
ΔtTime-averaging interval (h)
ηrefReference battery efficiency (0.978 at 25 °C)
ηlad/rladBattery charging/discharging efficiency
kratCurrent multiplier factor (0.0127 at 25 °C)
CratCharge/discharge current ratio
CRated battery capacity (Ah or kWh)
UCBattery operating voltage (V)
PladPower transferred to battery (kW)
PrladPower drawn from battery (kW)
EZAnnual electricity demand (kWh)
EDCEnergy at DC converter output (kWh)
EshoAnnual energy deficit (kWh)
EbatEnergy consumed from battery for production (kWh)
ILRInverter loading ratio (P_p/P_nDC)
a, b, dNonlinear estimation coefficients (Equation (14))

References

  1. Ritchie, H.; Rosado, P. Fossil Fuels. Our World in Data 2017. Available online: https://ourworldindata.org/fossil-fuels (accessed on 25 February 2025).
  2. Nauka o Klimacie. 2024: Emisje i Koncentracja CO2 Znów Rekordowe. 2025. Available online: https://naukaoklimacie.pl/aktualnosci/2024-emisje-i-koncentracja-co2-znow-rekordowe (accessed on 25 February 2025).
  3. Kiselev, A.; Magaril, E.; Karaeva, A. Environmental and Economic Efficiency Assessment of Biogas Energy Projects. Energy Ecol. Environ. 2024, 9, 68–83. [Google Scholar] [CrossRef] [Scilit]
  4. Aridi, R.; Faraj, J.; Ali, S.; Lemenand, T.; Khaled, M. Thermoelectric Power Generators: State-of-the-Art. Electricity 2021, 2, 359–386. [Google Scholar] [CrossRef] [Scilit]
  5. Baz, K.; Cheng, J.; Xu, D.; Abbas, K.; Ali, I.; Ali, H.; Fang, C. Asymmetric Impact of Fossil Fuel and Renewable Energy Consumption on Economic Growth. Energy 2021, 226, 120357. [Google Scholar] [CrossRef] [Scilit]
  6. Segovia-Hernández, J.G. Advancing E-fuels Production through Process Intensification. Chem. Eng. Process. 2025, 208, 110107. [Google Scholar] [CrossRef] [Scilit]
  7. Aridi, R.; Aridi, M.; Pannier, M.-L.; Lemenand, T. Eco-Environmental and Social Impacts of Electricity from Renewable Sources. Energy 2025, 320, 135139. [Google Scholar] [CrossRef] [Scilit]
  8. IRENA. Renewable Power Generation Costs in 2021; IRENA: Abu Dhabi, United Arab Emirates, 2021. [Google Scholar]
  9. IRENA. Renewable Power Generation Costs in 2023; IRENA: Abu Dhabi, United Arab Emirates, 2023. [Google Scholar]
  10. Maka, A.O.M.; Alabid, J.M. Solar Energy Technology and Its Roles in Sustainable Development. Clean Energy 2022, 6, 476–483. [Google Scholar] [CrossRef] [Scilit]
  11. Victoria, M.; Haegel, N.; Peters, I.M.; Sinton, R.; Jäger-Waldau, A.; del Cañizo, C.; Breyer, C.; Stocks, M.; Blakers, A.; Kaizuka, I.; et al. Solar Photovoltaics is Ready to Power a Sustainable Future. Joule 2021, 5, 1041–1056. [Google Scholar] [CrossRef] [Scilit]
  12. Dada, M.; Popoola, P. Recent Advances in Solar Photovoltaic Materials and Systems. Beni-Suef Univ. J. Basic Appl. Sci. 2023, 12, 66. [Google Scholar] [CrossRef] [Scilit]
  13. Lin, H.; Chung, H.S.H.; Lin, C.; Xie, D.; Deng, Q.; Lyu, M.; Goetz, S.M.; Chen, J.; Ge, X. Improved Fault Diagnosis Capability in CHBMCs: Counter Design for Multiple OC Switches via an E-SVM Unit. IEEE Trans. Power Electron. 2026, 41, 2358–2376. [Google Scholar] [CrossRef] [Scilit]
  14. Khatib, T.; Mohamed, A.; Sopian, K. A Review of Photovoltaic Systems Size Optimization Techniques. Renew. Sustain. Energy Rev. 2013, 22, 454–465. [Google Scholar] [CrossRef] [Scilit]
  15. Khezri, R.; Mahmoudi, A.; Aki, H. Optimal Planning of Solar PV and Battery Storage Systems. Renew. Sustain. Energy Rev. 2022, 153, 111763. [Google Scholar] [CrossRef] [Scilit]
  16. Schleifer, A.H.; Murphy, C.A.; Cole, W.J.; Denholm, P. Exploring PV-plus-Battery System Configurations. Appl. Energy 2022, 308, 118339. [Google Scholar] [CrossRef] [Scilit]
  17. Hazim, H.I.; Baharin, K.A.; Gan, C.K.; Sabry, A.H. Techno-Economic Optimization of PV-Inverter Power Sizing Ratio. Results Eng. 2024, 23, 102580. [Google Scholar] [CrossRef] [Scilit]
  18. Meng, X.; Xie, D.; Lin, H.; Lin, C.; Ge, X.; Liu, Z. Dissipativity-Based Multiport Stability Root-Cause Identification and Mitigation for Solid-State Transformers. IEEE Trans. Ind. Electron. 2026, 73, 1–13. [Google Scholar] [CrossRef] [Scilit]
  19. Saez-de-Ibarra, A.; Martinez-Laserna, E.; Stroe, D.I.; Swierczynski, M.; Rodriguez, P. Sizing Study of Second Life Li-ion Batteries for Enhancing Renewable Energy Grid Integration. IEEE Trans. Ind. Appl. 2016, 52, 4999–5008. [Google Scholar] [CrossRef] [Scilit]
  20. Nofuentes, G.; Almonacid, G. Selection of the Inverter for Architecturally Integrated PV Grid-Connected Systems. Renew. Energy 1998, 15, 487–490. [Google Scholar] [CrossRef] [Scilit]
  21. Sangwongwanich, A.; Yang, Y.; Sera, D.; Blaabjerg, F.; Zhou, D. Impacts of PV Array Sizing on Inverter Reliability and Lifetime. IEEE Trans. Ind. Appl. 2018, 54, 3656–3667. [Google Scholar] [CrossRef] [Scilit]
  22. Bahloul, M.; Khadem, S. A Refined Method for Optimising Inverter Loading Ratio. Energy Rep. 2024, 12, 5110–5115. [Google Scholar] [CrossRef] [Scilit]
  23. Wang, H.X.; Muñoz-García, M.A.; Moreda, G.P.; Alonso-García, M.C. Optimum Inverter Sizing of Grid-Connected PV Systems. Renew. Energy 2018, 118, 709–717. [Google Scholar] [CrossRef] [Scilit]
  24. Mondol, J.D.; Yohanis, Y.G.; Norton, B. Optimal Sizing of Array and Inverter for Grid-Connected PV Systems. Sol. Energy 2006, 80, 1517–1539. [Google Scholar] [CrossRef] [Scilit]
  25. Camps, X.; Velasco, G.; de la Hoz, J.; Martín, H. Contribution to the PV-to-Inverter Sizing Ratio Determination. Appl. Energy 2015, 149, 35–45. [Google Scholar] [CrossRef] [Scilit]
  26. Burger, B.; Rüther, R. Inverter Sizing of Grid-Connected PV Systems. Sol. Energy 2006, 80, 32–45. [Google Scholar] [CrossRef] [Scilit]
  27. Maleki, A.; Pourfayaz, F.; Hafeznia, H.; Rosen, M.A. A Novel Framework for Optimal PV Size and Location in Remote Areas. Energy Convers. Manag. 2017, 153, 129–143. [Google Scholar] [CrossRef] [Scilit]
  28. Kim, J.H.; Mills, A.D.; Wiser, R.; Bolinger, M.; Gorman, W.; Montañes, C.C.; O’Shaughnessy, E. Project Developer Options to Enhance the Value of Solar Electricity. Appl. Energy 2021, 304, 117742. [Google Scholar] [CrossRef] [Scilit]
  29. Zhang, Y.; Ma, T.; Campana, P.E.; Yamaguchi, Y.; Dai, Y. A Techno-Economic Sizing Method for Grid-Connected Household PV Battery Systems. Appl. Energy 2020, 269, 115106. [Google Scholar] [CrossRef] [Scilit]
  30. Talavera, D.L.; Muñoz-Cerón, E.; Ferrer-Rodríguez, J.P.; Pérez-Higueras, P.J. Assessment of Cost-Competitiveness of Fixed and Tracking PV Systems. Renew. Energy 2019, 134, 902–913. [Google Scholar] [CrossRef] [Scilit]
  31. Olaszi, B.D.; Ladanyi, J. Comparison of Different Discharge Strategies of Grid-Connected PV Systems. Renew. Sustain. Energy Rev. 2017, 75, 710–718. [Google Scholar] [CrossRef] [Scilit]
  32. Koskela, J.; Rautiainen, A.; Järventausta, P. Using Electrical Energy Storage in Residential Buildings. Appl. Energy 2019, 239, 1175–1189. [Google Scholar] [CrossRef] [Scilit]
  33. Mulder, G.; Six, D.; Claessens, B.; Broes, T.; Omar, N.; Van Mierlo, J. The Dimensioning of PV-Battery Systems Depending on the Incentive and Selling Price Conditions. Appl. Energy 2013, 111, 1126–1135. [Google Scholar] [CrossRef] [Scilit]
  34. Ghanbari, K.; Maleki, A.; Ochbelagh, D.R. Investigating the Effect of Various Components in Optimal Designing of a Solar/Wind/Storage Hybrid System. J. Energy Storage 2025, 110, 115273. [Google Scholar] [CrossRef] [Scilit]
  35. Dehning, P.; Blume, S.; Dér, A.; Flick, D.; Herrmann, C.; Thiede, S. Load Profile Analysis for Reducing Energy Demands of Production Systems. Appl. Energy 2019, 237, 117–130. [Google Scholar] [CrossRef] [Scilit]
  36. Wang, W.; Simonson, D. Techno-Economic Assessment of PV-Diesel-Battery Hybrid Systems for Poultry Farms. Energy Nexus 2025, 17, 100372. [Google Scholar] [CrossRef] [Scilit]
  37. Bazen, E.F.; Brown, M.A. Feasibility of Solar Technology Adoption: Tennessee’s Poultry Industry. Renew. Energy 2009, 34, 748–754. [Google Scholar] [CrossRef] [Scilit]
  38. IEC 61724-1:2021; Photovoltaic System Performance—Part 1: Monitoring. IEC: Geneva, Switzerland, 2021.
  39. Mielcarek, A.; Roman, J.; Wróblewski, R.; Ceran, B. Selecting Power and Capacity of Electrochemical Energy Storage for PV Systems. J. Energy Storage 2025, 117, 116118. [Google Scholar] [CrossRef] [Scilit]
  40. Su, X.; Sun, B.; Wang, J.; Ruan, H.; Zhang, W.; Bao, Y. Experimental Study on Charging Energy Efficiency of Lithium-Ion Battery. J. Energy Storage 2023, 68, 107793. [Google Scholar] [CrossRef] [Scilit]
  41. Alipour, M.; Ziebert, C.; Conte, F.V.; Kizilel, R. A Review on Temperature-Dependent Electrochemical Properties, Aging, and Performance of Lithium-Ion Cells. Batteries 2020, 6, 35. [Google Scholar] [CrossRef] [Scilit]
  42. Esram, T.; Chapman, P.L. Comparison of PV Array Maximum Power Point Tracking Techniques. IEEE Trans. Energy Convers. 2007, 22, 439–449. [Google Scholar] [CrossRef] [Scilit]
  43. Koutroulis, E.; Kalaitzakis, K.; Voulgaris, N.C. Development of a Microcontroller-Based PV MPPT Control System. IEEE Trans. Power Electron. 2001, 16, 46–54. [Google Scholar] [CrossRef] [Scilit]
  44. Luthander, R.; Widén, J.; Nilsson, D.; Palm, J. Photovoltaic Self-Consumption in Buildings: A Review. Appl. Energy 2015, 142, 80–94. [Google Scholar] [CrossRef] [Scilit]
  45. Gulkowski, S.; Krawczak, E. Long-Term Energy Yield Analysis of Rooftop PV System in Poland. Sustainability 2024, 16, 3348. [Google Scholar] [CrossRef] [Scilit]
  46. Schardt, J.; Te Heesen, H. Performance of Roof-Top PV Systems in Selected European Countries. Sol. Energy 2021, 217, 235–244. [Google Scholar] [CrossRef] [Scilit]
  47. Ren, H.K.; Ashtine, M.; McCulloch, M.; Wallom, D. Analytical Method for Sizing Energy Storage in Microgrid Systems. J. Energy Storage 2023, 68, 107735. [Google Scholar] [CrossRef] [Scilit]
Figure 1. Algorithm for optimizing the size of a DC PV installation with energy storage.
Applsci 16 05799 g001
Figure 2. Monthly electricity consumption for production purposes.
Applsci 16 05799 g002
Figure 3. Electricity demand in the cycle-based system referenced to calendar time.
Applsci 16 05799 g003
Figure 4. Hourly power demand profile: (a) base section; (b) peak section; combined (c) October–March; (d) April, May, August, September; (e) June–July.
Applsci 16 05799 g004
Figure 5. Average solar radiation profile and its variability at the installation site (south-facing, 30° tilt).
Applsci 16 05799 g005
Figure 6. WPV_S coefficient as a function of PV installation peak power for different DC converter ratings. Each curve represents 47 simulation points (0.5 kWp resolution, 2–25 kWp range); points in the 8–12 kWp region are computed at 0.1 kWp resolution. Legend: Wmen (self-consumption coverage ratio); Weur (PV energy utilization ratio); WPV_B (PV-to-BESS system matching coefficient).
Applsci 16 05799 g006
Figure 7. PV energy overproduction and energy deficit as a function of DC converter power.
Applsci 16 05799 g007
Figure 8. Optimal PV array oversizing factor relative to DC converter rated power.
Applsci 16 05799 g008
Figure 9. Self-consumption coverage ratio and PV energy utilization ratio as a function of DC converter rated power (without storage). Wmen: self-consumption coverage ratio; Weur: PV energy utilization ratio.
Applsci 16 05799 g009
Figure 10. WPV_B coefficient as a function of battery capacity for selected DC PV installation sizes. WPV_B: PV-to-BESS system matching coefficient; each curve represents 20 simulation points.
Applsci 16 05799 g010
Figure 11. Radius of curvature of the WPV_B characteristic as a function of battery capacity.
Applsci 16 05799 g011
Figure 12. PV energy utilization ratio as a function of DC converter rated power for battery capacities of 15 kWh and 30 kWh.
Applsci 16 05799 g012
Figure 13. Self-consumption and energy utilization ratio with and without 15 kWh storage. Wmen: self-consumption coverage ratio (Equation (15)); Weur: PV energy utilization ratio (Equation (16)).
Applsci 16 05799 g013
Figure 14. Monthly electricity demand variation after implementation of the optimized PV-BESS system.
Applsci 16 05799 g014
Table 1. Degree of oversizing PV panel power relative to inverter power in selected studies.
SourceILRBattery StoragePower GridOptimization CriterionApplication
[15]1.0–1.51NoYesEnergy yieldGrid-connected AC
[16]2.4YesYesLCOEGrid-connected AC + BESS
[17]1.19YesYesTechno-economicGrid-connected AC + BESS
[22]1.45NoYesEnergy efficiencyGrid-connected AC
[23]1.12–1.25NoYesNet energy yieldGrid-connected AC
[24]1.1–1.8NoYesInverter reliabilityGrid-connected AC
[25]1.08NoYesEnergy optimizationGrid-connected AC
[26]<1.1NoYesEnergy yieldGrid-connected AC
[27]1.0YesNoSelf-consumptionOff-grid AC + BESS
[28]1.3–1.7YesYesEnergy contributionGrid-connected AC + BESS
Table 2. Statistical indicators for the load profile by season and ventilation section.
Season/SectionMean (kW)SD (kW)CV (%)Range (kW)SkewnessKurtosisSection
October–March0.770.45582.030.51−1.04Base
October–March0.000.0626922.3232.391100.96Peak
April/May/August/September0.940.57612.080.49−0.95Base
April/May/August/September0.060.345813.306.9852.20Peak
June–July1.120.76681.900.14−1.70Base
June–July0.420.912153.302.103.11Peak
Table 3. Summary of selected performance parameters of the analyzed PV installation configurations.
PnDC kWPp kWpEDC kWhWmen C = 0%Weur C = 0%Ebat kWhWmen C = 15%Weur C = 15%ILRΔWmen %
68.570133638142254561.42+18
79.780133835161359541.39+21
810.586804031174860511.31+20
913.411,0204329186066461.49+23
1014.612,0204427193468431.46+24
1115.813,0254526199170411.44+25
1217.014,0254624204072391.42+26
1318.215,0264723201874371.40+27
1420.717,0304821215076331.48+28
Note: Ebat—energy consumed from battery for production (kWh); ILR = Pp/PnDC; ΔWmen—absolute increase in self-consumption coverage ratio with 15 kWh storage. Bold row: identified optimal configuration (PnDC = 7 kW, Pp = 9.7 kWp, C = 15 kWh).
Table 4. Capital expenditure structure for the optimal PV-BESS configuration (PnDC = 7 kW, Pp = 9.7 kWp, C = 15 kWh BESS).
ComponentQuantityCost of a Budget Installation PLN/EURCost of the Premium Version PLN/EURAverage Installation Cost PLN/EUR
PV array (polycrystalline, 405 Wp)9.7 kWp5280/12398640/20286960/1634
DC/DC converter7 kW2500/5874700/11033600/845
LiFePO4 BESS (15 kWh, BMS incl.)15 kWh10,950/257025,800/605618,375/4313
Equipment subtotal-6200/14557800/18317000/1643
Installation & commissioning (18%)-6200/145512,500/29349350/2195
TOTAL CAPEX-31,130/730859,440/13,95345,285/10,630
Note: EUR conversion at exchange rate 4.3 PLN/EUR (2025 average).
Table 5. Sensitivity of simple payback period (SPB) to electricity purchase price—full PV-BESS system.
Electricity Price (PLN/kWh)SPB–Budget (Years)SPB–Average (Years)SPB–Mid-Range (Years)
0.7011.016.923.4
0.809.514.419.9
0.908.412.617.3
1.007.511.215.3
1.106.710.113.7
1.206.19.212.4
Disclaimer/Publisher’s Note: The statements, opinions and data contained in all publications are solely those of the individual author(s) and contributor(s) and not of MDPI and/or the editor(s). MDPI and/or the editor(s) disclaim responsibility for any injury to people or property resulting from any ideas, methods, instructions or products referred to in the content.