Article

Driving Waveform as a Design Variable for PFAS Plasma Degradation: Electron-Density-Driven Versus Reactive-Species-Driven Pathways


1
Advanced Bio and Healthcare Material Division, Korea Institute of Material Science, Changwon 51508, Republic of Korea
2
School of Materials Science and Engineering, Pusan National University, Busan 34057, Republic of Korea
3
Department of Aerospace Engineering, Pusan National University, Busan 46241, Republic of Korea
4
School of Chemical Engineering, Pusan National University, Busan 34057, Republic of Korea
5
Department of Civil, Urban, Earth, and Environmental Engineering, Ulsan National Institute of Science and Technology, Ulsan 44919, Republic of Korea
6
Graduate School of Carbon Neutrality, Ulsan National Institute of Science and Technology, Ulsan 44919, Republic of Korea
7
School of Advanced Materials Engineering, University of Science and Technology (UST), Daejeon 34113, Republic of Korea
*
Authors to whom correspondence should be addressed.
These authors contributed equally to this work.
Appl. Sci. 2026, 16(10), 5164; https://doi.org/10.3390/app16105164
Submission received: 16 April 2026 / Revised: 15 May 2026 / Accepted: 18 May 2026 / Published: 21 May 2026
(This article belongs to the Section Applied Physics General)

Abstract

Per- and polyfluoroalkyl substances (PFASs) are persistent micropollutants whose carbon–fluorine bonds resist conventional advanced oxidation. Nonthermal plasmas have emerged as a promising option for PFAS degradation, but the relative contributions of reactive oxygen species (ROS) and electrons are still being investigated. Herein, we compared sinusoidal alternating-current (AC) and nanosecond-pulsed discharges―in an identical plasma reactor with the same input power (30 W)―through diagnostics including voltage–current characterization, optical emission spectroscopy with vibrational and rotational temperatures and Hα Stark broadening for electron density, and aqueous H2O2 quantification. AC discharges produced more aqueous H2O2, stronger ·OH emission, and higher vibrational and rotational temperatures, yet showed lower perfluorooctanoic acid (PFOA) removal (85% ± 2%) and lower defluorination (61% ± 1%) than the pulsed discharge (96% ± 2% and 80% ± 2%, respectively). Among the diagnostics examined, electron density tracked the removal trend, being higher under pulsed operation (1.2 × 10¹⁶ vs. 8.3 × 10¹⁵ under AC operation). A pseudo-first-order kinetic model based on electron density qualitatively reproduced the observed PFOA decay rate, suggesting that the waveform may serve as a design variable for tuning electron and ROS-mediated pathways in plasma–water reactors.

1. Introduction

Per- and polyfluoroalkyl substances (PFASs) constitute a large family of synthetic organic compounds characterized by carbon–fluorine (C–F) bonds, which are among the strongest single bonds in organic chemistry (485–540 kJ mol−1) [1]. The thermal and chemical stability conferred by C–F bonds have made PFASs indispensable across a range of high-value industries; hundreds of kilotons of polytetrafluoroethylene (PTFE) and related fluoropolymers are produced annually, and their emulsion polymerization has historically relied on other PFASs―most notably perfluorooctanoic acid (PFOA) and its ammonium salt―as surfactants [2,3]. The semiconductor industry consumes large volumes of perfluorinated etching and cleaning agents (e.g., CF4, C4F8, or NF3) whose effluent streams can release shorter-chain PFASs as by-products [4,5]. Furthermore, direct PFAS applications such as aqueous film-forming firefighting foams, food-contact paper coatings, and water-repellent textiles have contributed point-source emissions [4,5]. Because of this heavy use, PFASs—PFOA and perfluorooctane sulfonate (PFOS) among them―are now detected ubiquitously in surface waters, groundwater, sediments, biota, and human serum [6,7,8]. Consequently, regulatory thresholds have been progressively tightened: for example, the U.S. EPA finalized maximum contaminant levels of 4 ng L−1 for PFOA and PFOS in 2024 [9,10].
Conventional treatment technologies, such as ion-exchange resins and reverse osmosis, effectively concentrate PFASs but do not destroy them [11,12]. Among destructive alternatives, hydroxyl-radical-based advanced oxidation processes (AOPs) involve slow reactions with perfluorinated PFAS tails (k·OH+PFAS < 107 M−1 s−1) [13,14,15,16,17,18], and mineralization remains slow and energy-intensive [19]. Therefore, nonthermal plasmas in contact with water have attracted attention because a single discharge simultaneously delivers reactive oxygen and nitrogen species (·OH, H2O2, O3, ··NO, ONOO), energetic electrons, and UV photons without any chemical addition [20,21,22,23]. Recent demonstrations have reported PFOA/PFOS removal efficiencies of 60–100% across a range of reactor geometries [24,25,26]. A particularly relevant precedent is the aeration-assisted cold plasma study of Oh et al. [27], wherein reactive oxygen species (ROS) generation provided the dominant pathway for PFOS mineralization.
Despite this progress, the mechanism by which plasma cleaves the C–F bond is not fully settled; two views exist in the recent literature. The ROS-centric view attributes degradation primarily to ·OH, H2O2, and related reactive species produced at the plasma–water interface, a picture supported by correlations between ·OH formation rate and PFAS removal efficiency [27,28] and reactor designs that maximize ROS yield through aeration or catalyst integration [29,30]. Within this framework, it has also been emphasized that individual ROS species play mechanistically distinct roles, i.e., the overall ROS inventory may not be sufficient to capture the effective oxidative capacity of a given treatment [31]. Contrastingly, the solvated-electron view argues that electrons emitted into the liquid phase initiate dissociative electron attachment (DEA) [32,33]. These views are not intrinsically mutually exclusive from a mechanistic standpoint―ROS and electrons are produced together in essentially every plasma–water configuration. However, two methodological gaps limit discriminating between them. First, mechanistic claims are typically inferred from correlations across studies performed in different reactors, rather than from a controlled perturbation applied to a single system. Second, ROS and electron diagnostic tools are seldom assembled simultaneously on the same reactor, so one cannot test whether the two families of species covary or move in opposite directions.
It is well established that the driving waveform of a power supply affects how input energy is partitioned between gas heating, vibrational excitation, and electron acceleration [34,35,36]. AC discharges, in which the voltage rises gradually toward the breakdown threshold of the gap, develop their conduction event at a comparatively modest reduced electric field sustained over a relatively long interval; this favors partitioning the input energy into vibrational excitation of N2 and translational heating of the bulk gas. Contrastingly, short high-voltage pulses transiently produce much larger reduced electric fields over much shorter intervals; this preferentially energizes the lightweight electron population and limits the energy transferred to ions and neutral species, yielding a strongly non-equilibrium plasma state [35,37]. The same time-averaged input power can therefore produce markedly different plasma states depending on the waveform, such as different electron energy distribution functions (EEDFs), electron densities, and reactive species inventories―these differences are what the present study aims to characterize.
Therefore, we conduct a controlled comparison of nonthermal-plasma-driven PFOA breakdown in which only the waveform is changed and set the two candidate mechanisms against each other: if PFAS removal is rate-limited by ROS, it should track··OH emission, aqueous H2O2, and gas temperature (all expected to favor AC waveforms); if it is rate-limited by electron availability at the interface, it should track the electron density (expected to favor pulse waveforms). The two mechanisms thus make opposite predictions for the same measurable outcome, providing a direct, internally consistent test within a single reactor. Our aim is not to displace the ROS-centric picture established for related configurations [27,28,29,30], but to complement it by identifying the conditions under which the solvated-electron pathway becomes the dominant rate-limiting contribution and to discuss the implications for plasma reactor design.

2. Materials and Methods

2.1. Experimental Setup

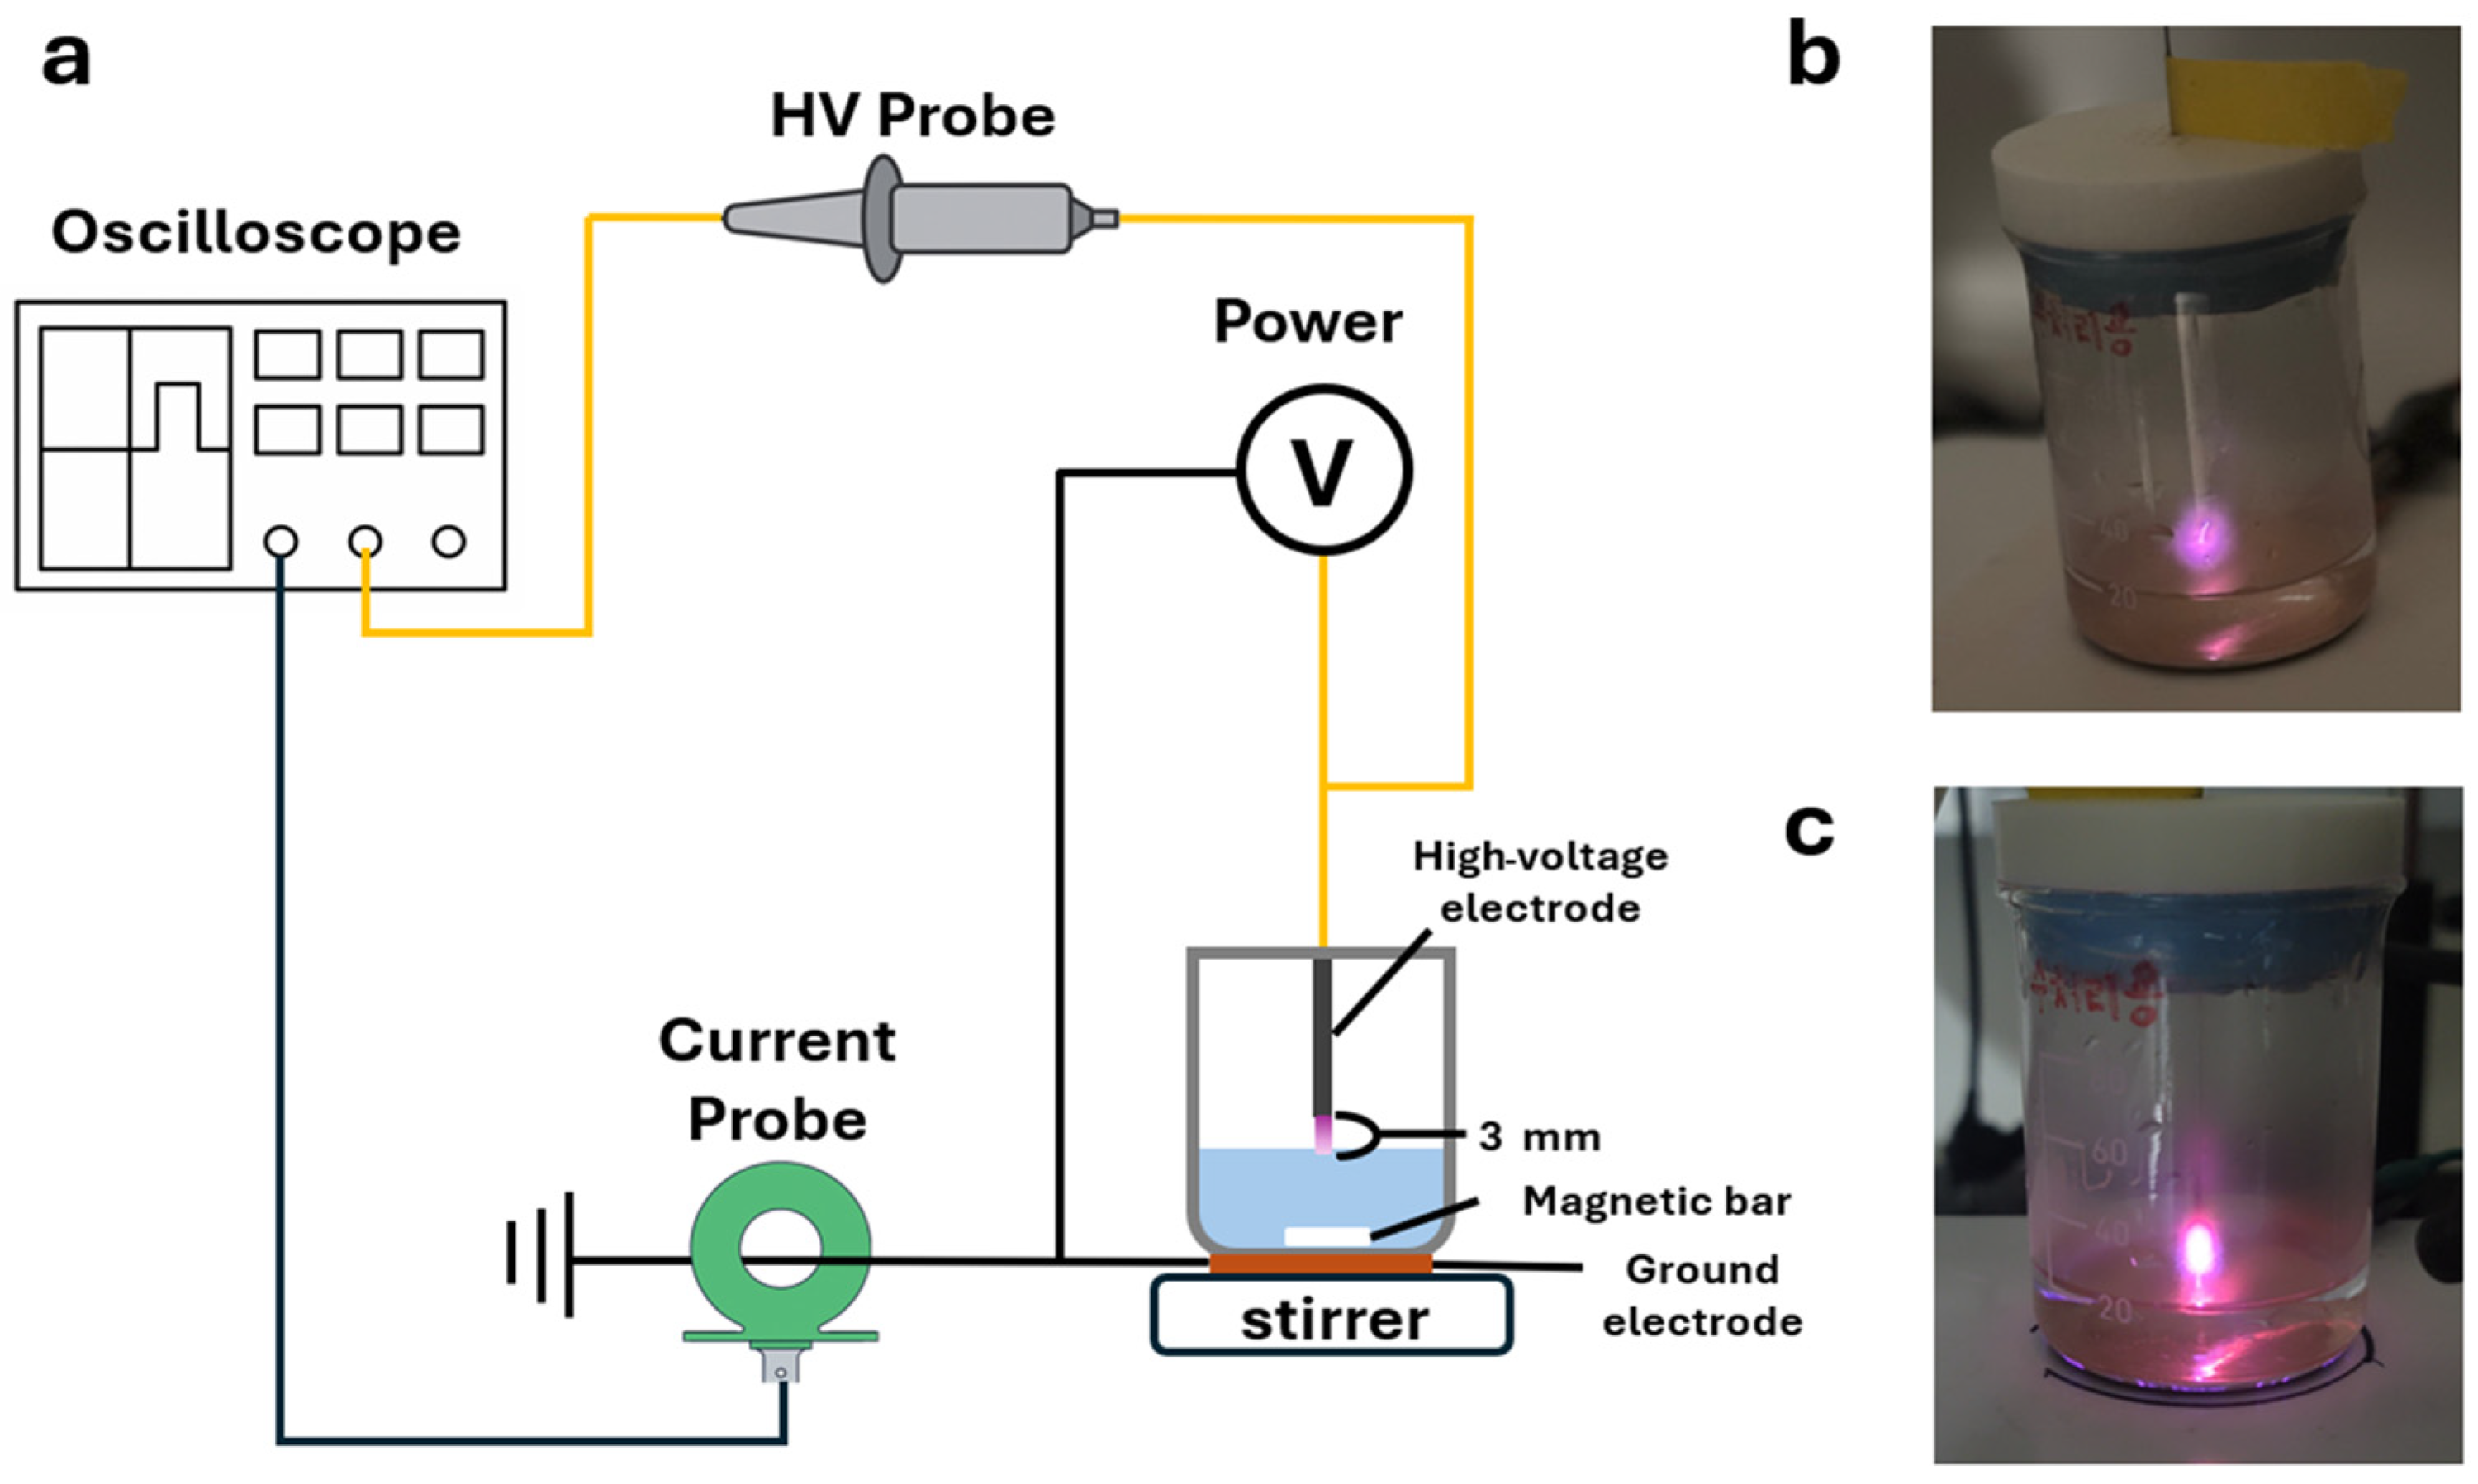
All experiments were conducted in a single pin-to-water reactor whose geometry was kept strictly constant across the two waveform conditions (Figure 1). The reactor consisted of a 200 mL beaker containing 100 mL aqueous PFOA solution (initial concentration of 1000 μgL−1), continuously stirred at 300 rpm with a PTFE-coated magnetic bar to homogenize the bulk liquid and refresh the plasma–water interface. A sharpened stainless-steel pin electrode (diameter 1 mm) was held 3 mm above the liquid surface; the grounded counter-electrode was a stainless-steel plate immersed at the bottom of the beaker. The working gas was laboratory air at ambient humidity, and no external gas flow was applied. A collimating lens (5 mm diameter; Ocean Optics, Orlando, FL, USA, UV-74) was positioned next to the beaker to acquire the plasma emission spectrum.
Two interchangeable high-voltage supplies drove the same reactor. For sinusoidal (AC) voltages, a commercial neon transformer (Transformers Corp, Gwangju, Gyeonggi-do, Republic of Korea, SC220-31030S) controlled by a variable AC autotransformer (Hanil, Namyangju, Republic of Korea, DS-1022) was used, delivering a peak voltage of ~5 kV at 25 kHz. Meanwhile, an in-house high-voltage pulse generator was used for pulsed voltages, producing unipolar pulses with a full width at half maximum (FWHM) of 600 ns, a rise time of a few tens of nanoseconds, a peak voltage of 18 kV, and a repetition rate of 2 kHz. In both configurations, the input power delivered to the discharge was adjusted to a nominal value of 30 W and measured as the product of the instantaneous voltage and current waveforms averaged over at least one full period. Voltage was monitored with a high-voltage probe (Tektronix, Beaverton, OR, USA, P6015A) and current with a wide-band current monitor (Pearson, Palo Alto, CA, USA, 4100C); both signals were acquired simultaneously using a digital oscilloscope (Tektronix, Beaverton, OR, USA, MSO24). Bulk water temperature was recorded before and after each operation to avoid electromagnetic interference.

2.2. PFOA Quantification

PFOA (≥95% purity; Sigma-Aldrich, St. Louis, MO, USA, 171468) stock solutions were prepared in deionized water and diluted to the working concentration of 1000 μgL−1 immediately before each run. PFOA concentrations were quantified by liquid chromatography–mass spectrometry (Thermo Fisher Scientific, Waltham, MA, USA, Orbitrap Exploris 240). Each experimental condition was performed in triplicate (n = 3), and removal efficiencies are reported as the mean ± one SD.
Total fluoride release, used as an independent measure of C–F bond cleavage, was determined by ion chromatography (Thermo Fisher Scientific, Waltham, MA, USA, Dionex Aquion). The defluorination efficiency was calculated as the ratio of the measured fluoride concentration after treatment to the theoretical maximum fluoride concentration corresponding to complete defluorination of the initial PFOA, considering the 15 fluorine atoms per PFOA molecule, as follows:
D e f l u o r i n a t i o n   e f f i c i e n c y   =   c o n c e n t r a t i o n ( F p r o d u c e d ) c o n c e n t r a t i o n ( F i n i t i a l   i n   P F O A )

2.3. Optical Emission Spectroscopy

Optical emission spectra from plasma discharge were obtained across the full spectral range using an HR6 spectrometer (Ocean Optics, Orlando, FL, USA) and at high resolution―for physical parameter analysis―using a monochromator (Andor, Belfast, UK, Shamrock 750) with a charge-coupled device camera (Andor, Belfast, UK, Newton 920). An 1800 grooves mm−1 grating was used.
In this analysis, the vibrational (Tv) and rotational (Tr) temperatures of N2 were extracted from the N2 s-positive system (SPS; C3Πu → B3Πg) in the 360–385 nm range. The synthetic spectrum was constructed from tabulated band positions and Franck–Condon factors for the C→B transition convolved with an instrumental Gaussian profile with FWHM = 0.1 nm. Electron density (ne) was extracted from the Stark-broadened Hα Balmer line (656.28 nm) by Voigt-profile deconvolution with the same instrumental broadening parameter.

2.4. Comparative Aqueous H2O2 Measurement

The H2O2 concentration in the liquid was determined based on the reaction of H2O2 with ammonium metavanadate, following the protocol detailed in our previous work [31].

3. Results

3.1. Electrical Characteristics

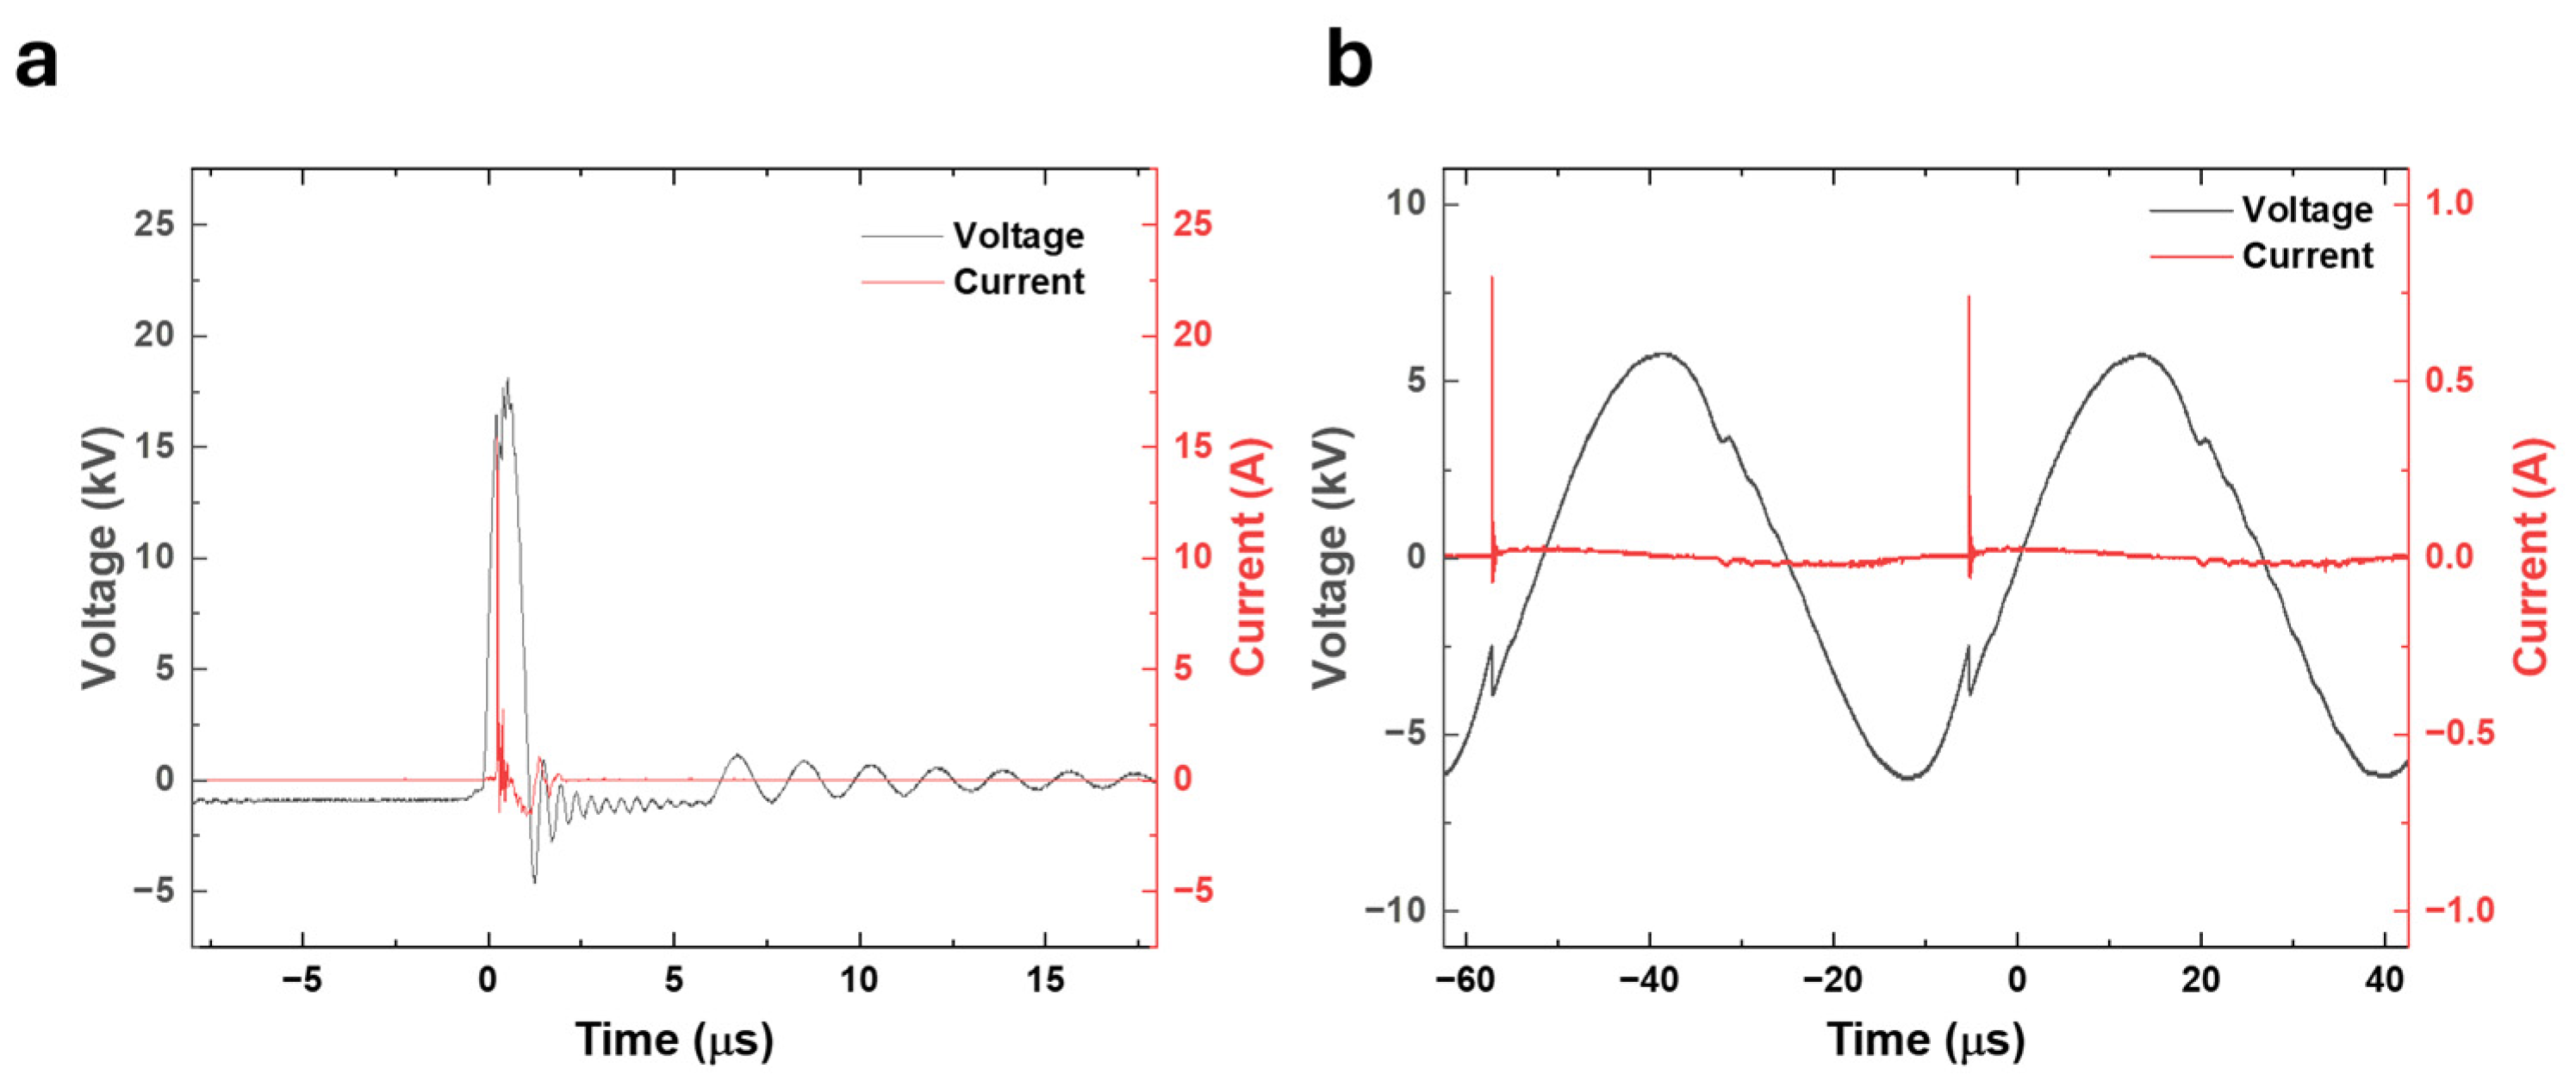
Figure 2 shows the voltage and current waveforms measured at the high-voltage electrode of the pin-to-water reactor under pulsed (Figure 2a) and sinusoidal (Figure 2b) driving. In both cases, the input power was adjusted to a nominal value of 30 W. The pulsed waveform delivered a sharp voltage transient of 18 kV with a FWHM of ~600 ns and a rise time of a few tens of nanoseconds. Contrastingly, the sinusoidal waveform delivered continuous oscillations at 25 kHz with a peak voltage of 5 kV.
Despite the matched time-averaged input power of 30 W, the two waveforms differ markedly in their instantaneous electrical signatures. The pulsed discharge reaches a peak current of 15 A, an order of magnitude above the 0.75 A observed under sinusoidal driving.
A c c u m u l a t e d   C h a r g e = I   d t
E n e r g y   p e r   a   c y c l e =   V   × I   d t
Integrating the current (Equation (2)) and instantaneous power (Equation (3)) over a single cycle yields 600 nC and 15 mJ, respectively, per pulse and 15 nC and 1.2 mJ, respectively, per sinusoidal cycle. The pulsed waveform therefore concentrates around an order of magnitude more charge and energy into each conduction event, consistent with the value obtained from input power divided by repetition frequency.
The most pronounced difference between the two waveforms is the applied voltage duration. Under the pulsed condition, the applied voltage rises from zero to several kV within tens of nanoseconds; thus, the reduced electric field (E/N, electric field over gas number density) is large during the conduction window, and a substantial fraction of the energy delivered in that window is channeled into electron acceleration [35,36,37]. Under the sinusoidal condition, the discharge ignites only when the slowly rising voltage approaches the breakdown threshold of the gap; therefore, the conduction event develops at a comparatively modest E/N, and a larger fraction of the input energy is partitioned into vibrational excitation of N2 and translational heating of the bulk gas [35,36]. The expected mechanistic basis of this partition is the contrast in the characteristic timescales of the two waveforms with respect to the plasma response times. For the pulsed condition (≈600 ns FWHM), the acceleration duration of the charged particle is comparable to, or shorter than, the ion neutral momentum transfer and vibrational–translational (V–T) relaxation timescales typical of atmospheric-pressure air plasmas. The lightweight electrons respond on subnanosecond timescales and are efficiently accelerated by the high transient E/N; the much heavier N2 and O2 ions and neutral species respond on substantially longer timescales and are largely unperturbed within the pulse duration. Therefore, energy is preferentially transferred to the electron population, raising ne and the high-energy tail of the EEDF while leaving the ion and neutral species populations comparatively cold. For the sinusoidal condition, the slowly evolving voltage and the longer conduction window allow V–T relaxation and species-agnostic momentum transfer to proceed, channeling a substantial fraction of the transferred energy into the vibrational excitation of N2 and bulk gas heating. The practical signature of this difference is the bulk water temperature after a fixed treatment time (Table 1): starting from an initial temperature of 25 °C, the AC-treated solution reached 45 °C and the pulse-treated solution reached 32 °C, confirming the larger thermalization loss in the AC case at the same nominal input power. These observations are qualitatively consistent with the theoretical picture outlined in the Introduction and set the stage for the ROS- and electron-side diagnostics presented in the subsequent sections.

3.2. PFOA Removal and Defluorination Compared to H2O2

Table 1 summarizes the principal degradation results and the measured aqueous H2O2 concentration for the two waveforms across different treatment times. Both PFOA removal and defluorination increased monotonically with treatment time under both driving conditions. At 30 min of treatment, pulsed driving removed 96 ± 2% of the initial PFOA and achieved 80 ± 2% defluorination, whereas sinusoidal driving, operated at the same nominal power and with the same reactor geometry, removed 85 ± 2% of the PFOA with 61 ± 1% defluorination. Both the overall removal and, more tellingly, the defluorination ratio―which reports on the extent to which C–F bonds have been cleaved rather than rearranged into shorter-chain intermediates―favored the pulsed waveform by a margin consistent across the triplicate runs and larger than any plausible contribution from sampling variability.
The aqueous H2O2 concentration exhibited the opposite trend: a maximum of 514 ppm was measured after AC treatment versus a maximum of 328 ppm after pulsed treatment. On first consideration, this is surprising in view of the PFOA data because H2O2 is typically treated as a reservoir species for ·OH in plasma–water systems [24,27] and the ROS-centric view would predict that the waveform generating more H2O2 should also degrade more PFOA. A plausible origin of this inversion is the thermal difference: the higher bulk water temperature reached under AC operation enhances evaporation at the plasma–water interface, increasing the fraction of water molecules residing in the gas-phase plasma during each half-cycle and thereby raising the gas-phase partial pressure of H2O available for dissociation into ·OH and subsequent recombination into H2O2 [27,29]. In other words, the larger AC H2O2 yield is at least partly a thermally mediated effect rather than a signature of more efficient electron–water dissociation. The key point for the present discussion is that the waveform producing more H2O2 removes less PFOA―an observation that is difficult to reconcile with a picture in which H2O2 (or its··OH precursor) is the rate-limiting oxidant for C–F bond cleavage under our conditions. However, the temperature observed here is far below the threshold for any thermal contribution to PFOA removal and volatilization previously established by Xiao et al. [38].

3.3. Optical Emission Spectroscopy

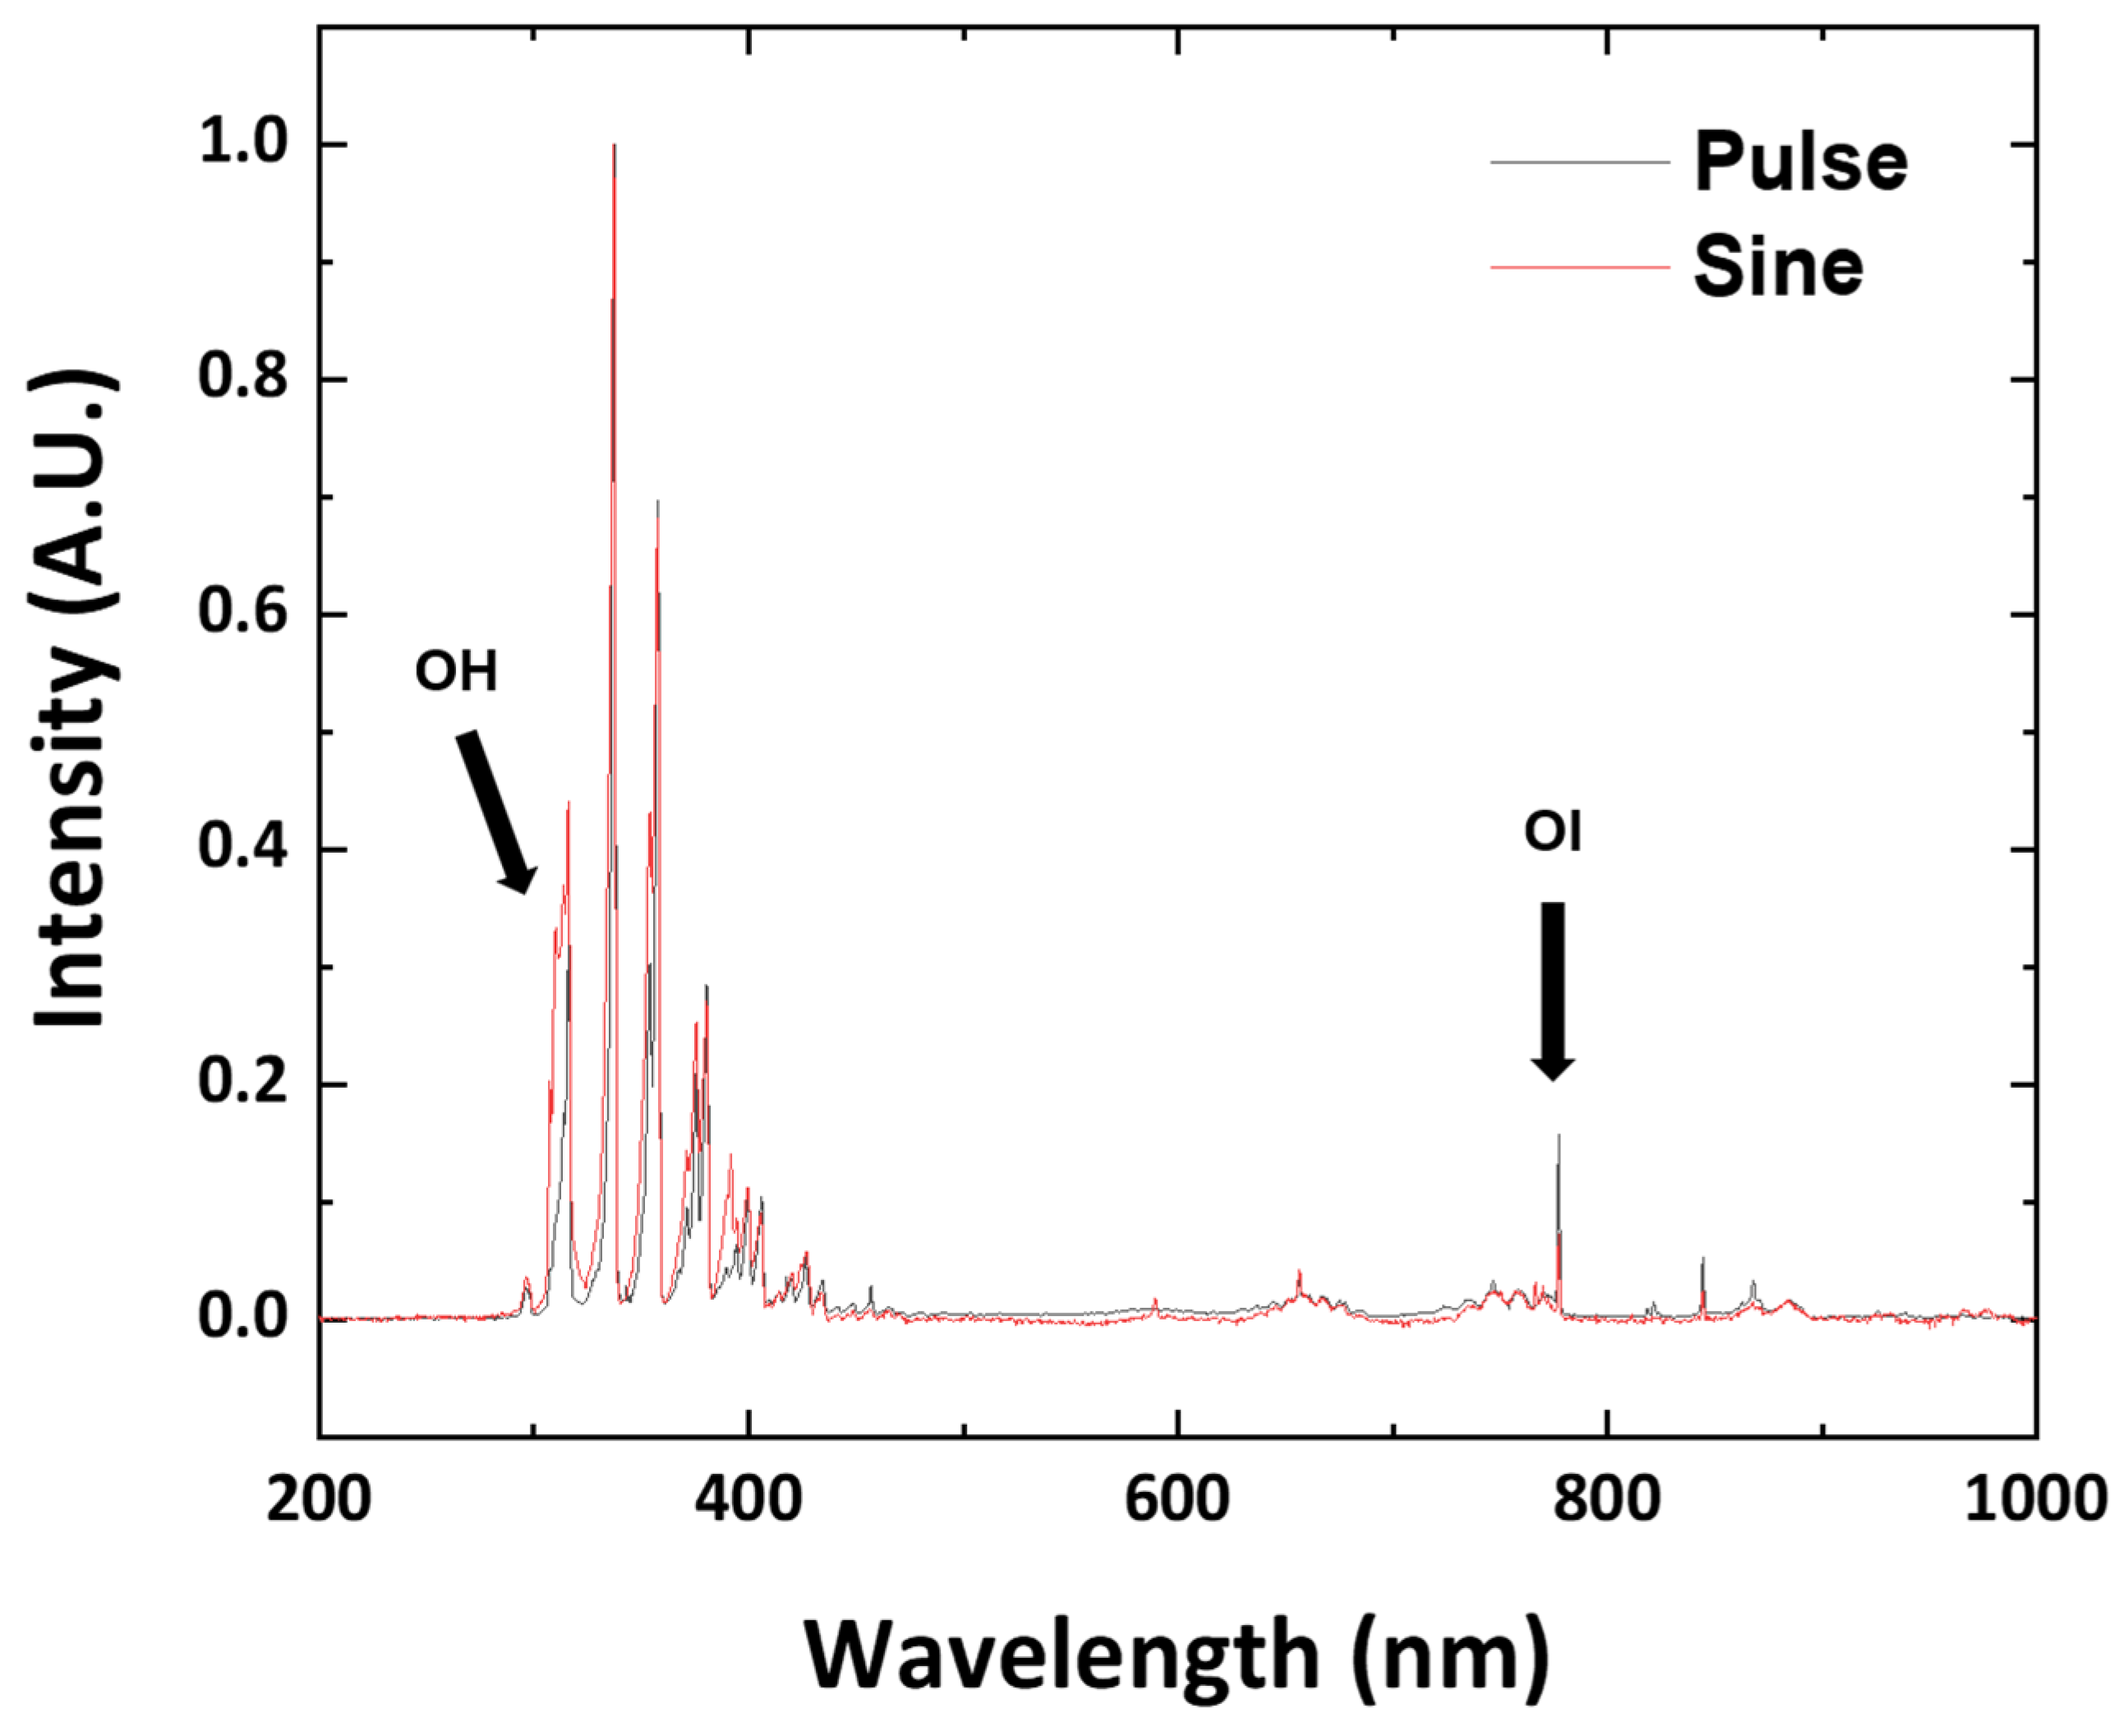
Figure 3 presents the full-range (200–1000 nm) optical emission spectra of the two discharges. Both spectra are dominated by the well-known N2 SPS (C3Πu → B3Πg) in the 300–400 nm range, with weaker contributions from the N2+ first negative system, the ·OH (A2Σ+ → X2Π) band near 309 nm, the Hα Balmer line at 656.28 nm, and atomic oxygen triplet lines at 777 and 844 nm. It is worth noting that the ·OH(A2Σ+) state is populated by electron-impact excitation of ground-state ·OH(X2Π) or dissociative excitation of H2O and is depopulated by radiative decay producing the 309 nm emission or collisional quenching with ambient neutral species. As the quenching rate is set by the bulk gas composition, which is similar under the AC and pulsed conditions at fixed atmospheric pressure, its effect on the relative inter-condition comparison is not considered further herein.
Two features stand out when the pulsed and AC spectra are compared under identical integration settings. First, in qualitative agreement with the aqueous H2O2 measurement in Section 3.2, the ·OH (309 nm) band is visibly more intense under AC driving than under pulsed driving: more ·OH in the gas phase corresponds with more H2O2 recovered in the liquid phase. Second, the atomic oxygen (OI) triplet lines at 777 and 844 nm are more intense under pulsed driving than under AC driving.
The contrasting OI and ·OH behaviors are mechanistically informative. The dominant production channels of OI emission from the O(5P) upper state do not require a water molecule as the parent species; they can be written schematically as follows:
e + O2 → e + O + O* (electron-impact dissociative excitation)
e + O2+ → O + O* (dissociative recombination)
Similarly, the ·OH production channels can be written schematically as follows:
e   +   H 2 O · O H   +   H   +   e   ( electron-impact dissociation )
H + · O H H 2 O 2   ( radical recombination )
Both the OI channels scale directly with the density of sufficiently energetic electrons with no requirement for water-derived intermediates [39,40]. Contrastingly, the ·OH (309 nm) emission channel has an additional gas-phase water fraction dependence on the rate (which, as discussed in Section 3.2, is enhanced by the higher interfacial evaporation rate under AC driving) [41]. The simultaneous observation that OI emission is stronger under pulsed driving while ·OH emission is stronger under AC driving is therefore consistent with the interpretation that the pulsed discharge possesses a more energetic electron population and that the AC-driven advantage in ·OH and H2O2 comes from its larger supply of H2O vapor to dissociate (rather than from superior electron dissociation of H2O).
Notably, reaction (7) implies that H2O2 is generated by ·OH recombination, such that H2O2 concentrations could be an indirect indicator of cumulative aqueous ·OH availability. Herein, AC driving resulted in higher H2O2 concentration (Table 1) and higher ·OH intensity (Figure 3) than pulsed driving, and the AC plasma-treated liquid contained a much higher ·OH concentration than the pulsed plasma-treated liquid.

3.4. Dependence of Physical Parameters of Plasma Discharge on the Waveform

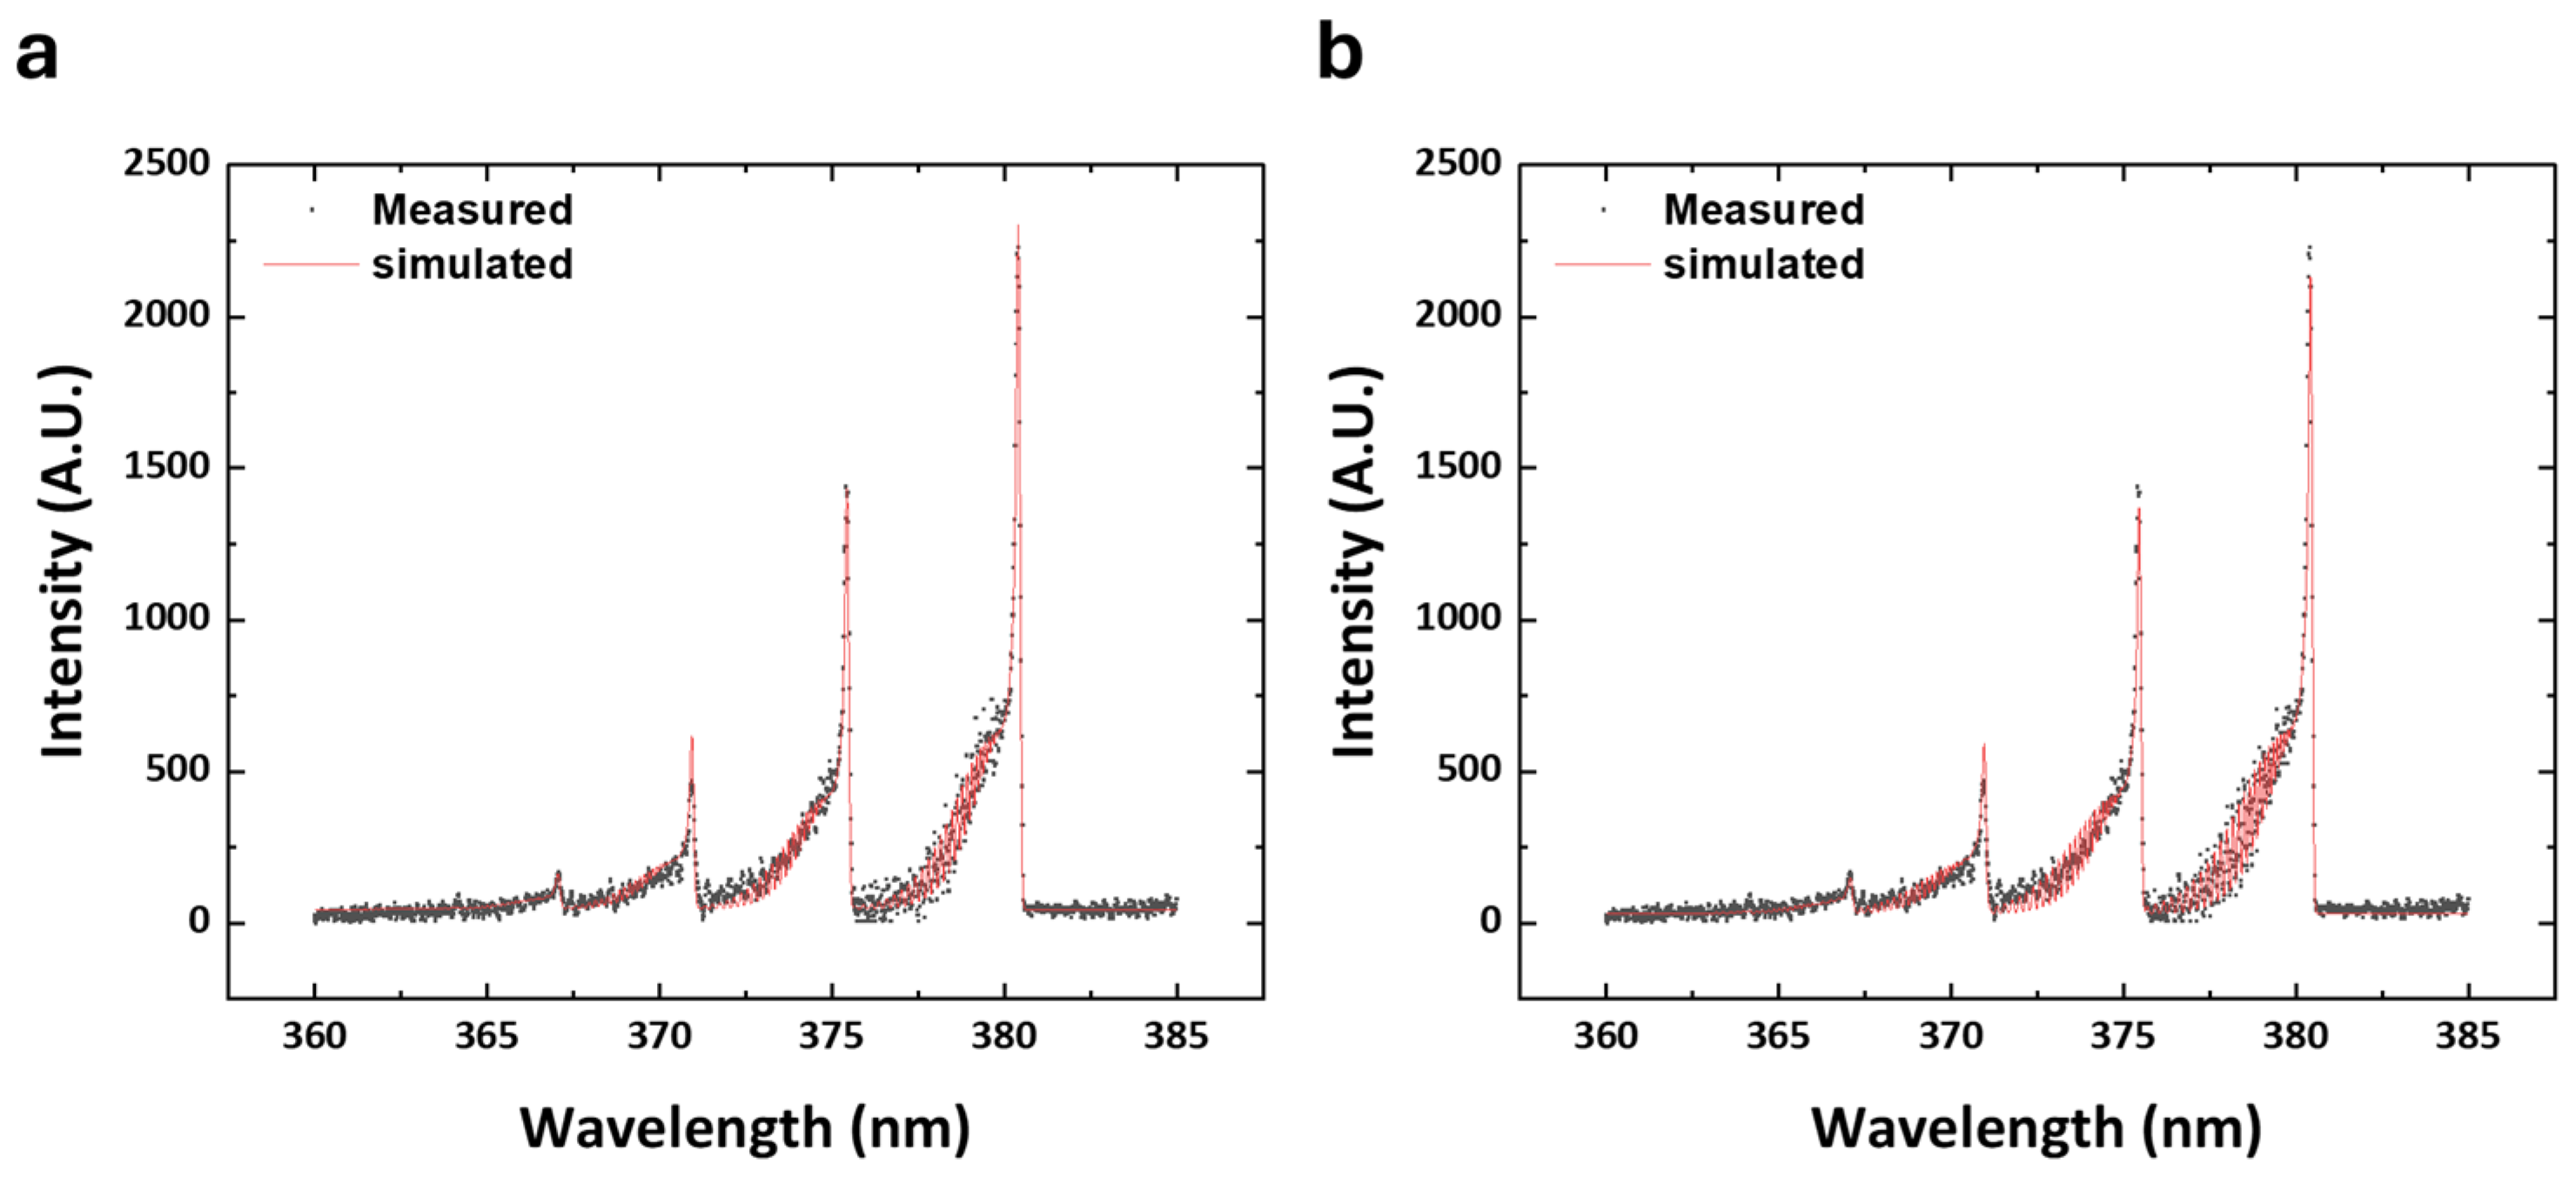
To quantify the energy partition between electron-driven and gas-heating channels, we measured high-resolution spectra of the N2 SPS in the 360–385 nm range (Figure 4). Under pulsed driving (Figure 4a), the best-fit temperatures were Tv = 2716 K and Tr = 436 K. Under AC driving (Figure 4b), the corresponding values were Tv = 3301 K and Tr = 757 K.
The rotational temperature of N2 (at atmospheric pressure) is generally considered to equilibrate rapidly with the translational gas temperature because rotational–translational relaxation is efficient on nanosecond time scales [42,43]. We therefore interpret Tr as a reasonable proxy for the neutral gas temperature at the probed spatial location. Tv reports on the population of the vibrational ladder of the N2(C) state, which is populated via electron-impact excitation from the ground state; a higher Tv indicates that a larger fraction of the input power is channeled into vibrational excitation of N2 per unit time, with the excess energy ultimately degraded to gas heating through V–T relaxation [44]. The AC discharge, given the same 30 W input, channels more power into the translational and vibrational modes of the bulk gas, consistent with the energy partition outlined in the introduction.
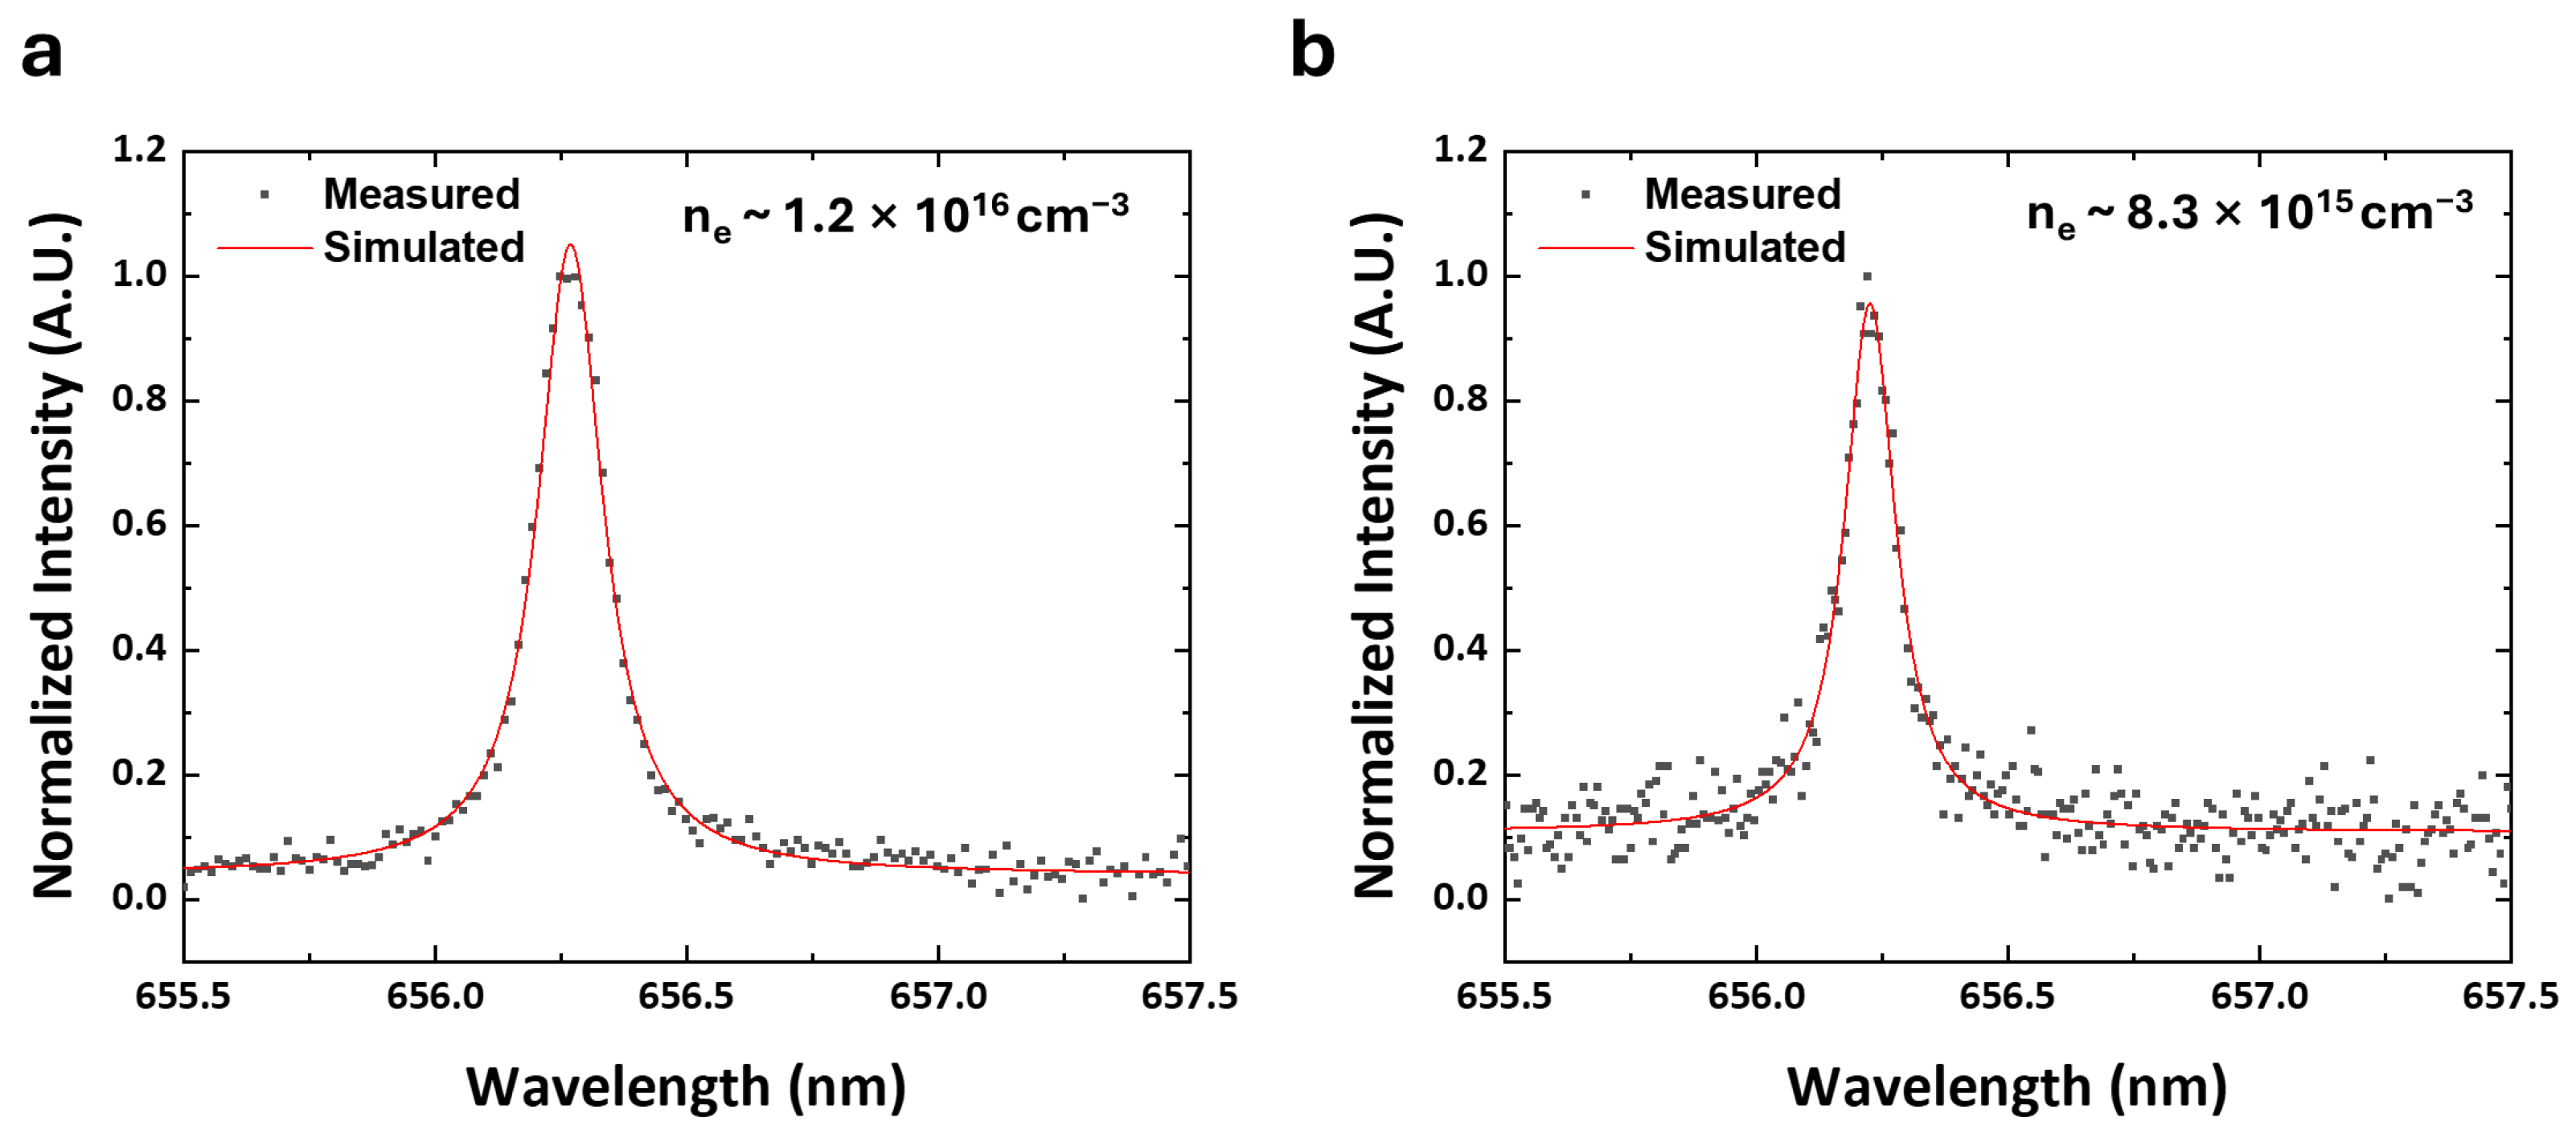
Having quantified the gas-heating and vibrational-excitation channels, we turn to the electron-side diagnostic. Figure 5 shows the Voigt profile fits to the Hα Balmer line (656.28 nm). The Voigt profile is decomposed into a Gaussian component, dominated by Doppler and instrumental broadening, and a Lorentzian component, dominated by Stark and van der Waals broadening [34,44]. The Stark width is converted into an electron density via the widely-used tabulation of Gigosos and Cardeñoso for the Hα line [45]. The fitted Lorentzian widths were wL = 0.153 nm under pulsed driving and wL = 0.116 nm under sinusoidal driving. After subtracting the estimated van der Waals broadening contribution, wS = 0.135 and 0.104 nm were deconvolved, yielding electron densities of ne ≈ 1.2 × 1016 cm−3 and ne ≈ 8.3 × 1015 cm−3 under pulsed and sinusoidal driving, respectively [46]. The self-absorption effect was confirmed to be negligible by a back mirror test [47]. These elevated electron densities are mechanistically relevant for PFAS degradation; at the plasma–liquid interface, electrons are injected into the aqueous phase where they are rapidly solvated to form a hydrated electron, one of the strongest known reductive species [24,32,48].
This result is notable in two respects. First, the pulsed discharge achieves an electron density roughly 1.5 times higher than the AC discharge at the same nominal input power, even though its rotational (gas) and vibrational temperatures are lower. Electron density is, at this stage, the only diagnostic in this work―in contrast to ·OH emission, aqueous H2O2, Tv, and Tr―that is larger under pulsed operation. Second, the direction of this difference is precisely the direction predicted by the energy partitioning: pulsed driving concentrates input energy into the electron population during the short streamer phase, whereas AC driving distributes it into ion drift, vibrational excitation, and gas heating. The next section examines whether this single parameter is sufficient to explain the observed PFOA removal trend. The robustness of this waveform-dependent partitioning across input powers (25, 30, and 35 W) is summarized in Supplementary Table S1: AC driving consistently yields higher Tv, Tr, and aqueous H2O2, while pulsed driving consistently yields higher ne at each operating power.

3.5. Reaction Pathways for Electrons and Reactive Species

Before turning to the kinetic model, we summarize the reaction pathways that connect the diagnostics of the preceding sections to C–F bond cleavage. The purpose of this section is to make explicit which channels scale with the electron density and which scale with the reactive-species inventory, since this distinction underlies the waveform comparison.
The optical emission analyzed in Section 3.3 originates from electron-impact processes whose rates are governed by the overlap between the EEDF and the cross-section of each process. The atomic-oxygen channels, namely electron-impact dissociative excitation of O2 (Equation (4)) and dissociative recombination of O2+ (Equation (5)), populate the O(5P) and O(3P) upper states that radiate at 777 and 844 nm. The hydroxyl channel relevant to the 309 nm band, electron-impact dissociation of H2O (Equation (6)), has a lower threshold (~7–9 eV) but additionally requires a gas-phase H2O molecule as the parent species. Its rate therefore carries a dependence on the interfacial water-vapor supply that the oxygen channels do not [41]. Radical recombination (Equation (7)) subsequently converts gas-phase ·OH into H2O2, linking the 309 nm emission to the aqueous H2O2 reservoir measured in Section 3.2. The contrasting waveform dependence of the OI and ·OH emissions, with OI stronger under pulsed driving and ·OH stronger under AC driving, is thus consistent with a pulsed discharge that sustains a more energetic electron population, while the AC advantage in ·OH and H2O2 reflects its larger thermally driven supply of H2O vapor rather than more efficient electron-impact dissociation.
The channel that acts directly on PFOA is initiated by electrons crossing the plasma–water boundary. Electrons injected into the liquid lose energy through collisions with water molecules and, within picoseconds, become localized in a solvation shell to form the solvated electron, one of the strongest reductive species in aqueous chemistry, with a standard reduction potential of approximately −2.9 V [32,48]. Because electron injection and solvation occur only where the discharge contacts the liquid, solvated electrons are generated within a thin interfacial layer on the order of a few tens of nanometers, rather than throughout the bulk [48,49]. Within this layer, electrons attach to PFOA and initiate defluorination through DEA,
e + C 7 F 15 O O C 7 F 15 O O · C 7 F 14 O O + F   ( +further defluorination )
in which the transient molecular anion undergoes C–F bond rupture and releases fluoride [32,33]. The DEA route is effective precisely because it does not rely on oxidative attack. Whereas ·OH abstraction is hindered by the absence of reactive sites along the perfluorinated chain, electron attachment proceeds through the antibonding σ*(C–F) orbital and can cleave the C–F bond at low electron energies. This mechanistic asymmetry explains why the reductive, electron-driven pathway can outpace the oxidative, ROS-driven one for a fully fluorinated substrate such as PFOA.
These two groups of channels respond differently to the waveform because they draw on different parts of the discharge. The gas-phase emission channels and, more importantly, the interfacial DEA channel both scale with the density of electrons available, whether in the high-energy tail of the EEDF or as electrons at the interface, whereas the ROS-mediated oxidation channel scales with the accumulated ·OH and H2O2 inventory. As established in Section 3.3 and Section 3.4, pulsed driving concentrates input energy into the electron population and yields the higher electron density, while AC driving partitions energy into vibrational excitation and gas heating and yields the larger ROS inventory. The waveform therefore acts as a selector between an electron-density-limited regime and a reactive-species-limited regime. The kinetic model developed in the next section tests this picture quantitatively by asking whether the electron density alone, acting through the DEA channel of Equation (8), is sufficient to reproduce the measured PFOA decay under both waveforms.

3.6. Kinetic Model

To test whether the measured difference in electron density alone can account for the difference in PFOA removal efficiency, we constructed a minimal pseudo-first-order kinetic model. The degradation rate was assumed to be proportional to the product of the electron density and the PFOA concentration:
d[PFOA]/dt = −keff · ne · [PFOA]
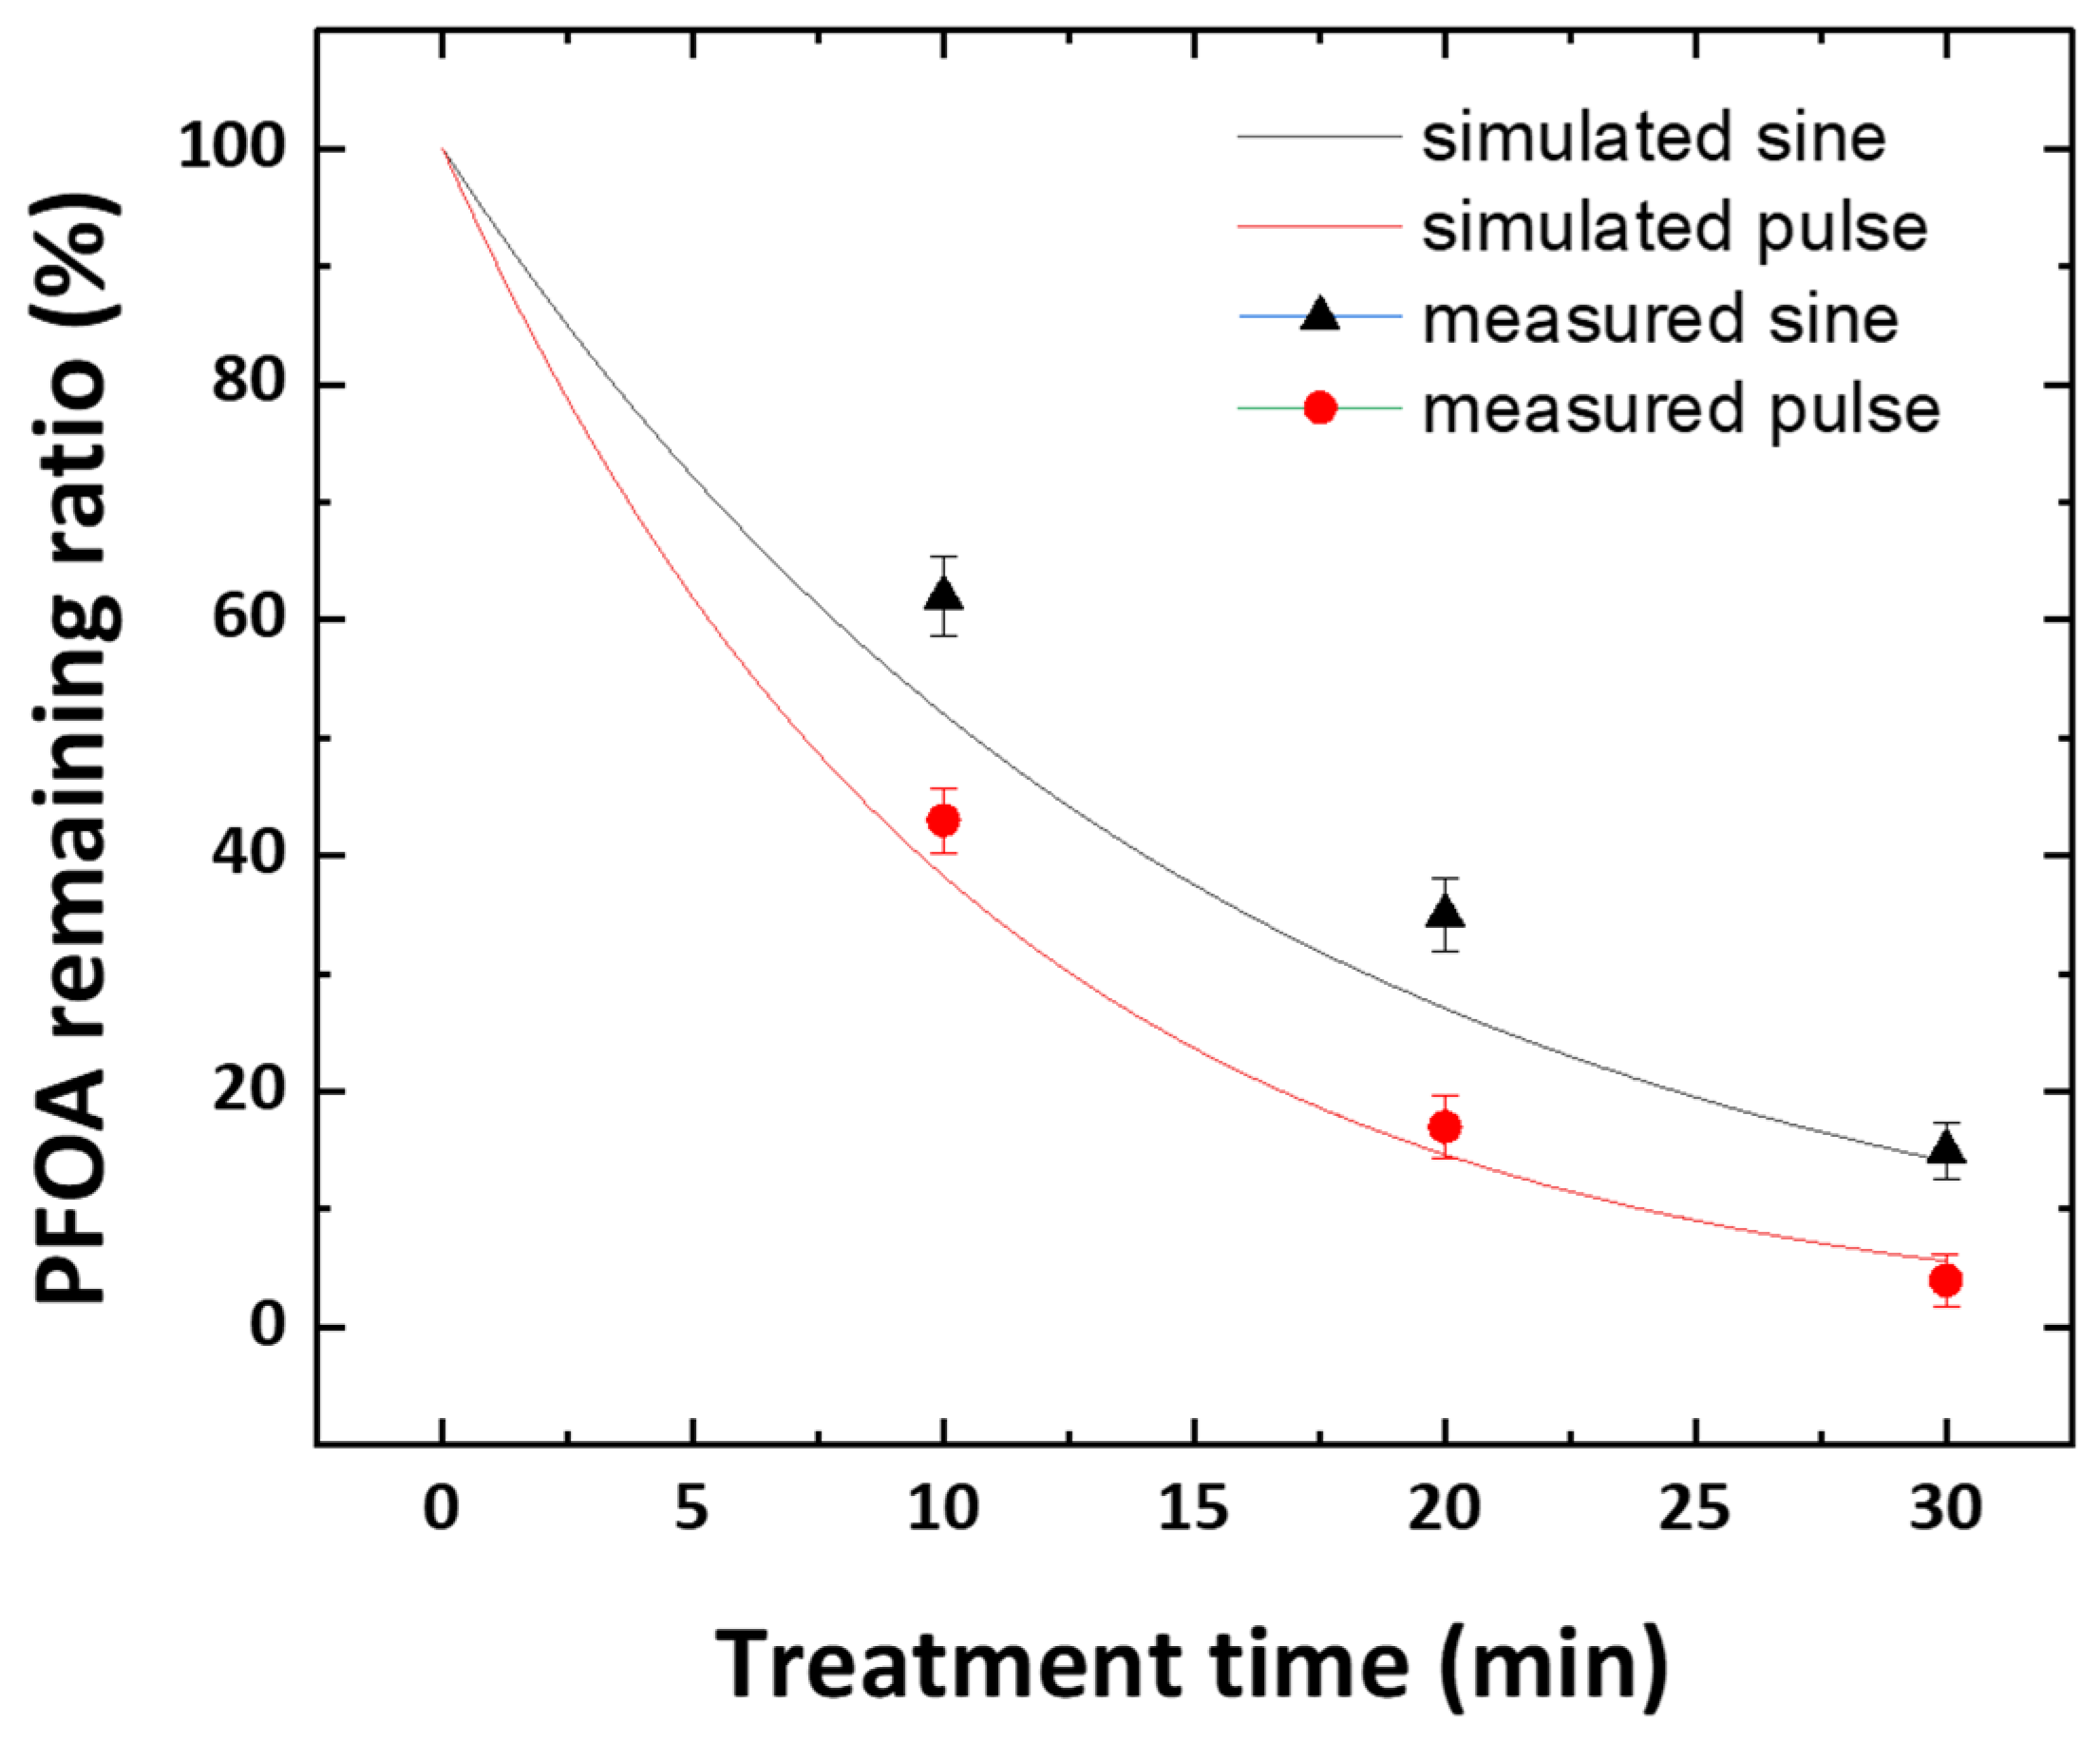
where keff is a system-specific rate constant combining the intrinsic DEA rate coefficient, the geometric factor coupling the bulk plasma to the liquid, and the effective electron penetration depth at the plasma–water interface. Although the two waveforms differ in ROS-related parameters, we treat ne as the sole variable in this minimal model and consider whether it alone is sufficient to reproduce both PFOA decay curves under a common keff. We therefore performed a global fit in which a single keff was simultaneously optimized against the pulsed and sinusoidal datasets, with each waveform contributing its own independently measured ne and no per waveform adjustment of keff permitted. The fit yielded keff = 7.87 × 10⁻¹⁸ cm3 min−1 and reproduced both decay curves with R2 > 0.95 (Figure 6). The two experimental datasets are therefore captured by a single rate-controlling parameter, ne, supporting the interpretation that the difference in PFOA defluorination between the two waveforms is primarily governed by the electron density contrast.
The agreement should be taken as qualitative rather than quantitative because the underlying model is deliberately simplified. In particular, the assumption that electrons are uniformly available throughout the liquid volume is known to be inaccurate: in pin-to-water geometries, aqueous electrons are generated essentially only in a thin interfacial layer on the order of a few tens of nanometers at the water surface [48,49], and the bulk mixing time (here set by the magnetic stirrer) controls how rapidly PFOA is transported to that layer. The fitted keff absorbs, in addition to the intrinsic DEA cross section, a depth-weighted average over this interfacial layer and is not directly comparable to the DEA rate constants extracted from homogeneous radiolysis or pulse-radiolysis experiments [50]. The model does establish, however, that a single scaling with ne―and no scaling with ·OH emission, H2O2, Tv, or Tr―is sufficient to reproduce the observed waveform dependence of PFOA removal at the present level of precision. This internal consistency further corroborates the interpretation that electron density is the diagnostic that tracks the removal rate in our system.

4. Discussion

Taken together, the five diagnostics applied to the two waveforms yield an internally consistent picture. Every parameter that would conventionally be read as an ROS-dominant indicator, such as gas-phase ·OH emission intensity (Figure 3), aqueous H2O2 concentration (Table 1), vibrational temperature Tv (Figure 4), and rotational/gas temperature Tr (Figure 4), was higher under sinusoidal driving than under pulsed driving. Conversely, the two parameters most directly tied to the electron population, OI (Figure 3) and electron density (Figure 5) were higher under pulsed driving. The PFOA removal efficiency (96% vs. 85%) and defluorination ratio (80% vs. 61%) both followed the electron-side diagnostics, rather than the ROS-side ones. The simplest kinetic model compatible with this work, in which the degradation is proportional to ne alone, is sufficient to reproduce the observed waveform dependence within the precision of our experiments.
This pattern does not imply that ROS pathways are inactive in our reactor. H2O2 concentrations of a few hundred ppm are certainly high enough to drive some ·OH-mediated oxidation of PFOA and its intermediates, and the presence of SO4 or NOx-derived species (not quantified here) would contribute to additional oxidative channels. What the waveform comparison implies is that when ROS abundance varies over a roughly 1.7-fold range (514 vs. 328 ppm for aqueous H2O2) while electron density varies over a comparable range in the opposite direction, the removal efficiency tracks ne rather than the ROS inventory. Under these specific conditions, the electron pathway appears to be the rate-limiting contribution.
Notably, the structure of these observations itself argues against an ROS-dominant interpretation, even in the absence of explicit scavenger experiments. The gas phase ·OH emission (Figure 3) and the aqueous H2O2 concentration were both lower, whereas the PFOA removal rate was higher, under pulsed driving. If ROS production was the key player in PFOA degradation, the ROS indicators and degradation rate would move in the same direction across the two waveforms. The fact that they move in opposite directions indicates that ROS availability does not control the observed degradation pattern in this system, regardless of the absolute ROS concentrations involved. This logical structure is independently corroborated by recent scavenger-based work in a different air-plasma reactor configuration [51], in which electron scavenging produced a substantially larger suppression of PFOA defluorination than OH scavenging, leading the authors to conclude that electrons are the dominant initiators of C–F bond cleavage with OH playing a supporting role.
The present results complement previous ROS-centric work in which Oh et al. [27] showed―in an aeration-assisted cold plasma reactor that shares many of the features of our experimental setup―that an ·OH instantaneous formation rate of 5.2 × 10⁻⁵ mol s−1 (measured at 10 min) was sufficient to defluorinate PFOS by 62.5% within 1 h, with a first-order rate constant of 3.1 h−1. Their analysis firmly established that ROS pathways can, by themselves, account for meaningful PFAS degradation in plasma–water systems. Our results should therefore be read not as contradicting theirs but as complementing them: in a configuration that allows ROS and electron populations to vary in opposite directions within a single reactor, we observe that the removal rate covaries with the electron population. This is consistent with the possibility that both pathways operate in any given plasma–water reactor, but that their relative weights are set by reactor design choices (e.g., waveform, geometry, gas composition, and contact mode) that determine how much of the input power is delivered to each. The ROS machinery was present in our AC discharge (where H2O2 is higher) and yet PFOA removal was lower, suggesting that in our geometry, the ROS channel is not rate-limiting; conversely, in systems where aeration, ozone cofeed, or interfacial turbulence maximize ·OH delivery [27], the ROS channel may become rate-limiting, and the waveform dependence observed should weaken.
Finally, the focus of ROS (·OH and H2O2) without O3, NO2, and NO3 reflects a deliberate scope rather than an oversight. The OH radical is a well-known oxidant with the highest oxidation potential in aqueous chemistry [18]. Despite this, ·OH-based AOPs have been repeatedly shown to be inadequate for direct PFAS defluorination, with the C–F bond resisting ·OH attack due to the lack of reactive sites in the perfluorinated chains [52,53]. Species with lower oxidation potentials (O3, NO2/NO3, superoxide) would therefore be expected to be even less effective against the C–F bond. Direct scavenger experiments in comparable air-plasma–water systems have independently confirmed that hydrated electrons, not ·OH, are the primary initiator of PFOA C–F cleavage [51]. The waveform comparison reported here directly tests this mechanistic hierarchy and supports the dominance of the electron-driven pathway.

5. Conclusions

We compared sinusoidal (AC) and pulsed (600 ns) discharges in a single pin-to-water reactor at fixed input power (30 W) with the aim of isolating, within a single experimental system, the relative contributions of reactive oxygen species and low-energy electrons to PFOA degradation. Four ROS-side indicators―aqueous H2O2 concentration, gas-phase ·OH emission, vibrational temperature Tv, and rotational/gas temperature Tr―were larger under AC driving, whereas the only electron-side indicator included, the Hα Stark-derived electron density ne, was larger under pulsed driving. The measured PFOA removal (96% vs. 85%) and defluorination (80% vs. 61%) both favored pulsed driving, and a simple pseudo-first-order kinetic model parameterized by ne alone was sufficient to reproduce the observed waveform dependence within the precision of the experiments.
Under the conditions examined, electron density appeared to be the diagnostic that tracked the PFOA removal trend, which is consistent with a contribution from electron-initiated pathways to C–F bond cleavage. This finding does not displace the ROS-centric picture established for related reactor configurations [27], but complements it: the relative weight of ROS and electron pathways likely depends on reactor design choices (waveform, geometry, gas composition, and contact mode), and waveform engineering is shown here to be one practical means of shifting that balance. From a reactor design standpoint, pulsed waveforms may thus be worth considering when an electron-limited regime is suspected. One further possibility worth exploring is whether, in plasma–electrochemistry hybrid systems where the electrochemical cell already supplies oxidation capability, the plasma component might contribute most usefully as a source of interfacial electrons rather than as an additional oxidant generator; confirming or refuting this conjecture will require dedicated hybrid-system experiments beyond the scope of the present study [54,55].
The quantitative findings reported here apply to PFOA. The qualitative mechanistic conclusion that pulsed waveforms enhance defluorination via electron density enhancement is expected to generalize to other PFAS species, although absolute removal efficiencies will depend on substrate-specific factors such as head-group chemistry and aqueous solubility.
Several limitations of the present study should be acknowledged. The kinetic model in Section 3.6 treats electrons as uniformly available throughout the liquid volume, whereas aqueous electrons are in reality confined to a thin interfacial layer. Therefore, the fitted keff should be regarded as a system-specific, depth-weighted average rather than an intrinsic DEA rate constant. The waveform-dependent partitioning identified here is preserved across the 25–35 W power range (Supplementary Table S1) and across aqueous matrices from deionized water to 20 mM NaCl (Supplementary Table S2); coupling these plasma-side measurements to PFOA degradation outcomes across the full parameter space is a natural next step. The degradation efficiency may further depend on the electron energy distribution, which can be elucidated through future analyses. The study was also limited to PFOA at a single initial concentration and a single reactor geometry, and the direct extension to PFOS or shorter-chain PFAS remains to be tested. Also, the dependence on voltage and frequency remains to be examined. Finally, PFASs rarely occur in isolation in real industrial effluents; future work will extend the present analysis to more realistic effluent compositions, examining how pH, coexisting solutes, and liquid temperature influence the relative contributions of electron and ROS-mediated pathways.

Supplementary Materials

The following supporting information can be downloaded at https://www.mdpi.com/article/10.3390/app16105164/s1: Table S1: Comparative physical and chemical parameters depending on driving condition (power, waveform), Table S2: Comparative physical and chemical parameters depending on water conductivity.

Author Contributions

Y.L. and J.K.: data curation, original draft, H.K. (Hwanho Kim): Software, K.H.B.: Methodology, J.C., S.J., S.L. and S.O.: Formal analysis, Y.J. and K.K.: Investigation, methodology, O.L.L. and H.K. (Holak Kim): writing—review and editing, J.Y.P.: Supervision, Resources, Conceptualization, Funding acquisition, writing—review and editing. All authors have read and agreed to the published version of the manuscript.

Funding

This research was funded by PNKA950 from KIMS.

Data Availability Statement

The data presented in this study are available on request from the corresponding author.

Conflicts of Interest

The authors declare no conflicts of interest.

References

  1. O’Hagan, D. Understanding organofluorine chemistry. An introduction to the C–F bond. Chem. Soc. Rev. 2008, 37, 308–319. [Google Scholar] [CrossRef] [PubMed]
  2. Prevedouros, K.; Cousins, I.T.; Buck, R.C.; Korzeniowski, S.H. Sources, fate and transport of perfluorocarboxylates. Environ. Sci. Technol. 2006, 40, 32–44. [Google Scholar] [CrossRef]
  3. Buck, R.C.; Franklin, J.; Berger, U.; Conder, J.M.; Cousins, I.T.; de Voogt, P.; Jensen, A.A.; Kannan, K.; Mabury, S.A.; van Leeuwen, S.P.J. Perfluoroalkyl and polyfluoroalkyl substances in the environment: Terminology, classification, and origins. Integr. Environ. Assess. Manag. 2011, 7, 513–541. [Google Scholar] [CrossRef]
  4. Hu, X.C.; Andrews, D.Q.; Lindstrom, A.B.; Bruton, T.A.; Schaider, L.A.; Grandjean, P.; Lohmann, R.; Carignan, C.C.; Blum, A.; Balan, S.A.; et al. Detection of poly- and perfluoroalkyl substances (PFASs) in U.S. drinking water linked to industrial sites, military fire training areas, and wastewater treatment plants. Environ. Sci. Technol. Lett. 2016, 3, 344–350. [Google Scholar] [CrossRef]
  5. Glüge, J.; Scheringer, M.; Cousins, I.T.; DeWitt, J.C.; Goldenman, G.; Herzke, D.; Lohmann, R.; Ng, C.A.; Trier, X.; Wang, Z. An overview of the uses of per- and polyfluoroalkyl substances (PFAS). Environ. Sci. Process. Impacts 2020, 22, 2345–2373. [Google Scholar] [CrossRef] [PubMed]
  6. Jian, J.-M.; Chen, D.; Han, F.-J.; Guo, Y.; Zeng, L.; Lu, X.; Wang, F. A short review on human exposure to and tissue distribution of per- and polyfluoroalkyl substances (PFASs). Sci. Total Environ. 2018, 636, 1058–1069. [Google Scholar] [CrossRef]
  7. Abunada, Z.; Alazaiza, M.Y.D.; Bashir, M.J.K. An overview of per- and polyfluoroalkyl substances (PFAS) in the environment: Source, fate, risk and regulations. Water 2020, 12, 3590. [Google Scholar] [CrossRef]
  8. Sunderland, E.M.; Hu, X.C.; Dassuncao, C.; Tokranov, A.K.; Wagner, C.C.; Allen, J.G. A review of the pathways of human exposure to poly- and perfluoroalkyl substances (PFASs) and present understanding of health effects. J. Expo. Sci. Environ. Epidemiol. 2019, 29, 131–147. [Google Scholar] [CrossRef] [PubMed]
  9. U.S. Environmental Protection Agency. PFAS National Primary Drinking Water Regulation; Final Rule. In Federal Register; 26 April 2024. [Google Scholar]
  10. Pan, Y.; Wang, J.; Yeung, L.W.Y.; Wei, S.; Dai, J. Analysis of emerging per- and polyfluoroalkyl substances: Progress and current issues. TrAC Trends Anal. Chem. 2020, 124, 115481. [Google Scholar] [CrossRef]
  11. Woodard, S.; Berry, J.; Newman, B. Ion exchange resin for PFAS removal and pilot test comparison to GAC. Remediat. J. 2017, 27, 19–27. [Google Scholar] [CrossRef]
  12. Rodowa, A.E.; Knappe, D.R.U.; Chiang, S.-Y.D.; Pohlmann, D.; Varley, C.; Bodour, A.; Field, J.A. Pilot-scale removal of per- and polyfluoroalkyl substances from AFFF-impacted groundwater by GAC. Environ. Sci. Water Res. Technol. 2020, 6, 1083–1094. [Google Scholar] [CrossRef]
  13. Ahmed, M.B.; Alam, M.M.; Zhou, J.L.; Xu, B.; Johir, M.A.H.; Karmakar, A.K.; Rahman, M.S.; Hossen, J.; Hasan, A.T.M.K.; Moni, M.A. Advanced treatment technologies for PFAS removal from water. Process Saf. Environ. Prot. 2020, 136, 1–14. [Google Scholar] [CrossRef]
  14. Yamamoto, T.; Noma, Y.; Sakai, S.; Shibata, Y. Photodegradation of PFOS by UV irradiation in water and alkaline 2-propanol. Environ. Sci. Technol. 2007, 41, 5660–5665. [Google Scholar] [CrossRef] [PubMed]
  15. Wang, S.; Yang, Q.; Chen, F.; Sun, J.; Luo, K.; Yao, F.; Wang, X.; Wang, D.; Li, X.; Zeng, G. Photocatalytic degradation of PFOA and PFOS in water: A critical review. Chem. Eng. J. 2017, 328, 927–942. [Google Scholar] [CrossRef]
  16. Zhuo, Q.; Luo, M.; Guo, Q.; Yu, G.; Deng, S.; Xu, Z.; Yang, B.; Liang, X. Electrochemical oxidation of environmentally persistent Perfluorooctane Sulfonate by a novel lead dioxide anode. Electrochim. Acta 2016, 213, 358–367. [Google Scholar] [CrossRef]
  17. Kim, T.-H.; Lee, S.-H.; Kim, H.Y.; Doudrick, K.; Yu, S.; Kim, S.D. Decomposition of PFOS using a hybrid process with electron beam and chemical oxidants. Chem. Eng. J. 2019, 361, 1363–1370. [Google Scholar] [CrossRef]
  18. Buxton, G.V.; Greenstock, C.L.; Helman, W.P.; Ross, A.B. Critical review of rate constants for reactions of hydrated electrons, hydrogen atoms and hydroxyl radicals in aqueous solution. J. Phys. Chem. Ref. Data 1988, 17, 513–886. [Google Scholar] [CrossRef]
  19. Cui, J.; Gao, P.; Deng, Y. Destruction of PFAS with advanced reduction processes (ARPs): A critical review. Environ. Sci. Technol. 2020, 54, 3752–3766. [Google Scholar] [CrossRef]
  20. Locke, B.R.; Thagard, S.M. Analysis and review of chemical reactions and transport processes in pulsed electrical discharge plasma formed directly in liquid water. Plasma Chem. Plasma Process. 2012, 32, 875–917. [Google Scholar] [CrossRef]
  21. Bruggeman, P.J.; Kushner, M.J.; Locke, B.R.; Gardeniers, J.G.; Graham, W.G.; Graves, D.B.; Hofman-Caris, R.C.; Maric, D.; Reid, J.P.; Ceriani, E.; et al. Plasma–liquid interactions: A review and roadmap. Plasma Sources Sci. Technol. 2016, 25, 053002. [Google Scholar] [CrossRef]
  22. Park, S.; Park, J.Y.; Choe, W. Origin of hydroxyl radicals in a weakly ionized plasma-facing liquid. Chem. Eng. J. 2019, 378, 122163. [Google Scholar] [CrossRef]
  23. Palma, D.; Richard, C.; Minella, M. State of the art and perspectives about non-thermal plasma applications for the removal of PFAS in water. Chem. Eng. J. Adv. 2022, 10, 100253. [Google Scholar] [CrossRef]
  24. Singh, R.K.; Fernando, S.; Baygi, S.F.; Multari, N.; Thagard, S.M.; Holsen, T.M. Breakdown products from PFAS degradation in a plasma-based water treatment process. Environ. Sci. Technol. 2019, 53, 2731–2738. [Google Scholar] [CrossRef]
  25. Lewis, A.J.; Joyce, T.; Hadaya, M.; Ebrahimi, F.; Dragiev, I.; Giardetti, N.; Yang, J.; Fridman, G.; Rabinovich, A.; Fridman, A.A.; et al. Rapid degradation of PFAS in aqueous solutions by reverse vortex flow gliding arc plasma. Environ. Sci. Water Res. Technol. 2020, 6, 1044–1057. [Google Scholar] [CrossRef]
  26. Singh, R.K.; Multari, N.; Nau-Hix, C.; Woodard, S.; Nickelsen, M.; Mededovic Thagard, S.; Holsen, T.M. Removal of PFAS from ion exchange regenerant still bottom samples in a plasma reactor. Environ. Sci. Technol. 2020, 54, 13973–13980. [Google Scholar] [CrossRef]
  27. Oh, S.; Nam, J.-Y.; Hong, Y.; Lee, T.-H.; Lee, J.-C.; Kim, H.-W. Degradation and ecotoxicity mitigation of perfluorooctane sulfonate by aeration-assisted cold plasma. Appl. Sci. 2025, 15, 2936. [Google Scholar] [CrossRef]
  28. Sahni, M.; Locke, B.R. Quantification of hydroxyl radicals produced in aqueous phase pulsed electrical discharge reactors. Ind. Eng. Chem. Res. 2006, 45, 5819–5825. [Google Scholar] [CrossRef]
  29. Lee, D.; Lee, J.-C.; Nam, J.-Y.; Kim, H.-W. Degradation of sulfonamide antibiotics and their intermediates toxicity in an aeration-assisted non-thermal plasma while treating strong wastewater. Chemosphere 2018, 209, 901–907. [Google Scholar] [CrossRef] [PubMed]
  30. Park, R.; Kim, J.-G.; Kim, H.-W. Prediction of varying microcystins during non-thermal plasma oxidation of harvested microalgal biomass. J. Hazard. Mater. 2021, 403, 123596. [Google Scholar] [CrossRef] [PubMed]
  31. Park, J.Y.; Park, S.; Choe, W.; Yong, H.I.; Jo, C.; Kim, K. Plasma-functionalized solution: A potent antimicrobial agent for biomedical applications from antibacterial therapeutics to biomaterial surface engineering. ACS Appl. Mater. Interfaces 2017, 9, 43470–43477. [Google Scholar] [CrossRef]
  32. Stratton, G.R.; Dai, F.; Bellona, C.L.; Holsen, T.M.; Dickenson, E.R.V.; Mededovic Thagard, S. Plasma-based water treatment: Efficient transformation of PFAS in prepared solutions and contaminated groundwater. Environ. Sci. Technol. 2017, 51, 1643–1648. [Google Scholar] [CrossRef]
  33. Foster, J.E. Plasma-based water purification: Challenges and prospects for the future. Phys. Plasmas 2017, 24, 055501. [Google Scholar] [CrossRef]
  34. Nikiforov, A.Y.; Leys, C.; Gonzalez, M.A.; Walsh, J.L. Electron density measurement in atmospheric-pressure plasma jets: Stark broadening of hydrogenated and non-hydrogenated lines. Plasma Sources Sci. Technol. 2015, 24, 034001. [Google Scholar] [CrossRef]
  35. Kruger, C.H.; Laux, C.O.; Yu, L.; Packan, D.M.; Pierrot, L. Nonequilibrium discharges in air and nitrogen plasmas at atmospheric pressure. Pure Appl. Chem. 2002, 74, 337–347. [Google Scholar] [CrossRef]
  36. Lieberman, M.A.; Lichtenberg, A.J. Principles of Plasma Discharges and Materials Processing; Wiley-Interscience: Hoboken, NJ, USA, 2005. [Google Scholar]
  37. Pai, D.Z.; Lacoste, D.A.; Laux, C.O. Transitions between corona, glow, and spark regimes of nanosecond repetitively pulsed discharges in air at atmospheric pressure. J. Appl. Phys. 2010, 107, 093303. [Google Scholar] [CrossRef]
  38. Xiao, F.; Sasi, P.C.; Yao, B.; Kubátová, A.; Golovko, S.A.; Golovko, M.Y.; Soli, D. Thermal stability and decomposition of perfluoroalkyl substances on spent granular activated carbon. Environ. Sci. Technol. Lett. 2020, 7, 343–350. [Google Scholar] [CrossRef]
  39. Fantz, U. Basics of plasma spectroscopy. Plasma Sources Sci. Technol. 2006, 15, S137–S147. [Google Scholar] [CrossRef]
  40. Itikawa, Y. Cross sections for electron collisions with oxygen molecules. J. Phys. Chem. Ref. Data 2009, 38, 1–20. [Google Scholar] [CrossRef]
  41. Sakiyama, Y.; Graves, D.B.; Chang, H.-W.; Shimizu, T.; Morfill, G.E. Plasma chemistry model of surface microdischarge in humid air and dynamics of reactive neutral species. J. Phys. D Appl. Phys. 2012, 45, 425201. [Google Scholar] [CrossRef]
  42. Bruggeman, P.J.; Sadeghi, N.; Schram, D.C.; Linss, V. Gas temperature determination from rotational lines in non-equilibrium plasmas: A review. Plasma Sources Sci. Technol. 2014, 23, 023001. [Google Scholar] [CrossRef]
  43. Laux, C.O.; Spence, T.G.; Kruger, C.H.; Zare, R.N. Optical diagnostics of atmospheric-pressure air plasmas. Plasma Sources Sci. Technol. 2003, 12, 125–138. [Google Scholar] [CrossRef]
  44. Capitelli, M.; Ferreira, C.M.; Gordiets, B.F.; Osipov, A.I. Plasma Kinetics in Atmospheric Gases; Springer: Berlin/Heidelberg, Germany, 2000. [Google Scholar]
  45. Gigosos, M.A.; Cardeñoso, V. New plasma diagnosis tables of hydrogen Stark broadening including ion dynamics. J. Phys. B At. Mol. Opt. Phys. 1996, 29, 4795–4838. [Google Scholar] [CrossRef]
  46. Konjević, N. Plasma broadening and shifting of non-hydrogenic spectral lines: Present status and applications. Phys. Rep. 2002, 316, 339–401. [Google Scholar] [CrossRef]
  47. Parigger, C.G.; Swafford, L.D.; Surmick, D.M.; Witte, M.J.; Woods, A.C.; Gautam, G. Hydrogen alpha self-absorption effects in laser-induced air plasma. J. Phys. Conf. Ser. 2014, 548, 012043. [Google Scholar] [CrossRef]
  48. Rumbach, P.; Bartels, D.M.; Sankaran, R.M.; Go, D.B. The solvation of electrons by an atmospheric-pressure plasma. Nat. Commun. 2015, 6, 7248. [Google Scholar] [CrossRef] [PubMed]
  49. Rumbach, P.; Witzke, M.; Sankaran, R.M.; Go, D.B. Decoupling interfacial reactions between plasmas and liquids: Charge Transfer vs Plasma Neutral Reactions. J. Am. Chem. Soc. 2013, 135, 16264–16267. [Google Scholar] [CrossRef] [PubMed]
  50. Buxton, G.V. An overview of the radiation chemistry of liquids. In Radiation Chemistry: From Basics to Applications; EDP Sciences: Les Ulis, France, 2008; pp. 3–16. [Google Scholar]
  51. Tang, Z.; Kang, N.; Ren, D.; Yang, Y. A dual-function air plasma process for enhanced PFOA defluorination and waste-activated sludge solubilization via reactive nitrogen and oxygen species. Environments 2026, 13, 91. [Google Scholar] [CrossRef]
  52. Schröder, H.F.; Meesters, R.J.W. Stability of fluorinated surfactants in advanced oxidation processes—A follow up of degradation products using flow injection-mass spectrometry, liquid chromatography-mass spectrometry and liquid chromatography-multiple stage mass spectrometry. J. Chromatogr. A 2005, 1082, 110–119. [Google Scholar] [CrossRef]
  53. Hori, H.; Hayakawa, E.; Einaga, H.; Tanikawa, S.; Kutsuna, S.; Koike, K.; Ibusuki, T.; Kiatagawa, H.; Arakawa, R. Decomposition of environmentally persistent perfluorooctanoic acid in water by photochemical approaches. Environ. Sci. Technol. 2004, 38, 6118–6124. [Google Scholar] [CrossRef]
  54. Kim, K.; Baldaguez Medina, P.; Elbert, J.; Kayiwa, E.; Cusick, R.D.; Men, Y.; Su, X. Molecular tuning of redox-copolymers for selective electrochemical remediation. Adv. Funct. Mater. 2020, 30, 2004635. [Google Scholar] [CrossRef]
  55. Doh, S.; Eom, S.; Choi, S.S.; Chung, H.; Kim, T.; Zoh, K.-D.; Kim, B.; Kim, K. Polyaniline as an integrated amine-redox platform for reversible electrosorption and energy-efficient PFAS remediation: From molecular mechanisms to system integration. Environ. Sci. Technol. 2026, 60, 1474–1487. [Google Scholar] [CrossRef] [PubMed]
Figure 1. (a) Illustration of the experimental setup of discharge. Real photographic images with (b) a pulsed waveform and (c) a sinusoidal waveform applied.
Applsci 16 05164 g001
Figure 2. Electrical characteristics of the discharge for (a) pulsed and (b) sinusoidal waveforms.
Applsci 16 05164 g002
Figure 3. Full range of optical emission spectrum of discharge for (black) pulsed and (red) sinusoidal waveforms.
Applsci 16 05164 g003
Figure 4. Simulated and measured spectrum of N2 second-positive system line for (a) pulsed and (b) sinusoidal waveforms.
Applsci 16 05164 g004
Figure 5. Voigt fitting results of the Hα Balmer line for obtaining electron density under (a) pulsed and (b) sinusoidal driving.
Applsci 16 05164 g005
Figure 6. Comparison of measured and simulated perfluorooctanoic acid (PFOA) remaining ratio as a function of treatment time for pulsed and sinusoidal discharges. The simulation uses a single, pseudo-first-order rate law parameterized by the electron density derived from Hα Stark broadening (Figure 5).
Applsci 16 05164 g006
Table 1. Comparative perfluorooctanoic acid (PFOA) degradation, defluorination, and aqueous H2O2 concentration after treatment under sinusoidal (AC) and pulsed driving at 30 W (n = 3; mean ± 1 SD).
ParameterPulsedAC
10 min20 min30 min10 min20 min30 min
PFOA removal (%)57 ± 2.783 ± 2.696 ± 2.238 ± 3.465 ± 3.185 ± 2.4
Defluorination (%)27 ± 1.858 ± 1.280 ± 1.521 ± 1.140 ± 1.461 ± 1.2
Defluorination yield (mg F/kWh)3.7 ± 0.33.9 ± 0.13.6 ± 0.12.9 ± 0.22.8 ± 0.12.8 ± 0.1
[H2O2] (ppm)104197328176351514
Water temperature (°C)283032343945
Disclaimer/Publisher’s Note: The statements, opinions and data contained in all publications are solely those of the individual author(s) and contributor(s) and not of MDPI and/or the editor(s). MDPI and/or the editor(s) disclaim responsibility for any injury to people or property resulting from any ideas, methods, instructions or products referred to in the content.